seasonal budgets of reactive nitrogen species and ozone ... · exported as nox from the u.s....
TRANSCRIPT

JOURNAL OF GEOPHYSICAL RESEARCH, VOL. 103, NO. Dll, PAGES 13,435-13,450, JUNE 20, 1998
Seasonal budgets of reactive nitrogen species and ozone over the United States, and export fluxes to the global atmosphere
Jinyou Liang, • Larry W. Horowitz, 2 Daniel J. Jacob, Yuhang Wang, 3 Arlene M. Fiore, Jennifer A. Logan, Geraldine M. Gardner, and J. William Munger Department of Earth and Planetary Sciences and Division of Engineering and Applied Sciences Harvard University
Cambridge, MA
Abstract. A three-dimensional, continental-scale photochemical model is used to investigate seasonal budgets of 03 and NO3. species (including NOx and its oxidation products) in the boundary layer over the United States and to estimate the export of these species from the U.S. boundary layer to the global atmosphere. Model results are evaluated with year-round observations for 03, CO, and NO•, species at nonurban sites. A seasonal transition from NO,• to hydrocarbon-limited conditions for 03 production over the eastern United States is found to take place in the fall, with the reverse transition taking place in the spring. The mean NOx/NOy molar ratio in the U.S. boundary layer in the model ranges from 0.2 in summer to 0.6 in winter, in accord with observations, and reflecting largely the seasonal variation in the chemical lifetime of NOx. Formation of hydroxy organic nitrates during oxidation of isoprene, followed by decomposition of these nitrates to HNO 3, is estimated to account for 30% of the chemical sink of NOx in the U.S. boundary layer in summer. Model results indicate that peroxyacylnitrates (PANs) are most abundant in the U.S. boundary layer in spring (25% of total NO3.), reflecting a combination of active photochemistry and low temperatures. About 20% of the NOx emitted from fossil fuel combustion in the United States in the model is exported out of the U.S. boundary layer as NOx or PANs (15% in summer, 25% in winter). This export responds less than proportionally to changes in NOx emissions in summer, but more than proportionally in winter. The annual mean export of NOx and PANs from the U.S. boundary layer is estimated to be 1.4 Tg N yr -• , representing an important source of NOx on the scale of the northern hemisphere troposphere. The eventual 03 production in the global troposphere due to the exported NOx and PANs is estimated to be twice as large, on an annual basis, as the direct export of 03 pollution from the U.S. boundary layer. Fossil fuel combustion in the United States is estimated to account for about 10% of the total
source of 03 in the northern hemisphere troposphere on an annual basis.
1. Introduction
Fossil fuel combustion accounts for about 50% of the total
emission of nitrogen oxides (NOx = NO + NO2) to the atmo- sphere [Intergovernmental Panel on Climate Change, (IPCC), 1995]. This anthropogenic source could have a major influence on the global budget of tropospheric 03, considering that 03 pro- duction in the troposphere is limited primarily by the supply of NOx [Chameides et al., 1992]. A moderating factor is the non- linear dependence of 03 production on NOx. The number of 03 molecules produced per molecule of NOx oxidized to HNO3 (03 production efficiency) decreases rapidly as the NOx concentration
•Now at Department of Civil and Environmnetal Engineer- ing, Stanford University, Stanford, California.
2Now at National (•enter for Atmospheric Research, Boulder, Colorado.
3Now at School of Earth and Atmospheric Sciences, Georgia Institute of Technology, Atlanta, Georgia.
Copyright 1998 by the American Geophysical Union.
Paper number 97JD03126. 0148-0227/98/97JD-03126509.00
increases [Liu et al., 1987]. Most of the NOx emitted by fossil fuel combustion is oxidized within the boundary layer of indus- trial continents, where NOx concentrations are high and hence the 03 production efficiency is low. An important factor determining the global influence of fossil fuel combustion on 03 is the amount of NOx exported out of the continental boundary layer and hence available to produce 03 with high efficiency in the remote atmo- sphere [Jacob et al., 1993a, b]. The export of NOx may be facili- tated by the formation within the continental boundary layer of peroxyacetylnitrate (PAN) and other peroxyacylnitrates from the oxidation of nonmethane hydrocarbons (NMHCs). These organic nitrates can be exported out of the boundary layer and serve as reservoirs for NOx in the remote troposphere [Crutzen, 1979; Singh, 1987], in contrast to HNO3 which is mainly removed by deposition.
We examine here the seasonal budgets of 0 3 and NO 3 , species (including NO• and its oxidation products) in the boun- dary layer over the United States and assess the implications for the export of NO•, species and 03 to the global atmosphere. The United States is responsible for-30% of global NO• emissions from fossil fuel combustion [Benkovitz et al., 1996]. Our analysis is based on a three-dimensional, continental-scale photo- chemical model for North America. A companion study by Horowitz et al. [this issue] uses a similar model to investigate in detail how summertime NMHC chemistry, involving in particular
13,435
13,436 LIANG ET AL.: SEASONAL BUDGETS OF REACTIVE NITROGEN SPECIES AND OZONE
the biogenic hydrocarbon isoprene, affects the chemical cycling of NOy and the resulting export out of the boundary layer. Tracer
Several previous papers have examined the export of NO,. from North America. Logan [1983] estimated that 40% of NO• emitted from North America is exported as NO.¾, based on a bal- ance between NO,, emission inventories and measured or inferred NOy deposition fluxes. Similar percentages were reported by Galloway et al. [1984] using a climatological analysis of winds across the east coast of the continent, and by Kasibhatla et al. ß PMN [1993] using a global three-dimensional model for NO3.. These PPN(lumped) analyses could not resolve the speciation of the exported NOy nor did they determine seasonal variations. From a tropospheric chemistry perspective it is crucial to distinguish between the export of (NOx + organic nitrates), which contributes to 03 pro- duction in the remote troposphere, and the export of HNO3 which generally does not lead to regeneration of NOx. Jacob et al. [ 1993b] estimated that 6% of NOx emitted in the United States is exported as NOx from the U.S. boundary layer in summer, but they did not account properly for the export of organic nitrates nor did they consider other seasons besides summer.
The model analysis presented in this paper accounts for the speciation of NOy and investigates seasonal variations of the export. We describe the model in section 2 and evaluate it with observations in section 3. Seasonal variations in the chemical
regime of the U.S. boundary layer are discussed in section 4, and budgets for NOy species are constructed in section 5. The contri- bution of fossil fuel combustion in North America to global tro- pospheric 03 is examined in section 6.
Table 1. Chemical Tracers in the Model
Ox (odd oxygen) H202 NOx HNO3 PAN
2. Model Description 2.1. General
We use an improved version of the continental-scale photo- chemical model originally presented by Jacob et al. [1993a]. Our model solves the three-dimensional continuity equations for 21 chemical tracers (Table 1) over a domain including North Amer- ica and large portions of the neighboring oceans (Figure 1). Winds, convective mass fluxes, and other meteorological fields are from a 1-year simulation with a general circulation model (GCM) developed at the Goddard Institute of Space Studies (GISS) [Hansen et al., 1983] and are updated every 4 hours. The grid resolution is 4øx5 ø in the horizontal, with 9 layers in the vertical along a sigma coordinate, replicating the grid of the GISS GCM (Figure 1). A nested subgrid scheme [Sillman et al., 1990a] is used to resolve nonlinear chemistry in pollution plumes from large cities and power plants. Transport of tracers is as described by Prather et al. [1987]. A previous simulation of 222Rn over North America showed that the model represents the
ISN2 (lumped) R4N2 (lumped) CO
C3H8 ALK4 (lumped) ALKE (lumped) C5H8 CH20 CH3CHO RCHO (lumped) CH3COCH3 MEK (lumped) MVK
MACR
Component(s)
03 + NO2 + 2 NO3 + 3 N205 + HNO4 hydrogen peroxide NO + NO2 + NO3 + HNO2 + HNO4 + 2 N2 05 HNO3 + aerosol + NO• peroxyacetyl nitrate peroxymethacryloyl nitrate peroxyacyl nitrates from RCHO isoprene nitrates C4, 5 alkylnitrates carbon monoxide
propane
>C3 alkanes >C2 alkenes, except isoprene isoprene formaldehyde acetaldehyde >C2 aldehydes except MACR acetone
>C3 ketones produced from ALK4 methylvinylketone methacrolein
The lumping of organic compounds is done on a per carbon basis. Uni- form concentrations of 1.7 ppmv CH4 and 1.2 ppbv C2H6 are assumed over the model domain.
ventilation of the continental boundary layer to within the con- straints offered by 222Rn observations, except over the eastern United States in fall where boundary layer mixing is excessive due to insufficient precipitation [Jacob and Prather, 1990; Jacob et al., 1997].
Boundary conditions for 03 concentrations at the edges of the model domain are specified as a function of altitude, latitude, and season from a climatology of ozonesonde data (J. A. Logan, manuscript in preparation, 1997). Longitudinal gradients in the ozonesonde data are small outside of the boundary layer at mid- dle and high latitudes. Boundary conditions for CO are from a global three-dimensional model study (J. A. Logan, personal communication, 1997). Boundary conditions for NO•, HNO3, propane, butane, acetone, and H20 2 are specified as a function of altitude and latitude using aircraft data from the Pacific Explora- tory Mission-West Phase A (PEM-West A) (September-October 1991) and Pacific Exploratory Mission-West Phase B (PEM- West B) (February-March 1994) aircraft missions over the western Pacific [Gregory and Scott, 1995a, b]; the PEM-West A and B data are used as boundary conditions in June-November
48
4O
32
24
16
160 140 120 100 80 60 40
10 31 70 19 150 14
260 11
400 7.6
570 4.9
74O 2.6
880 1.2 950 0.5
1010 0
P (hPa) z (kin)
LONGITUDE W
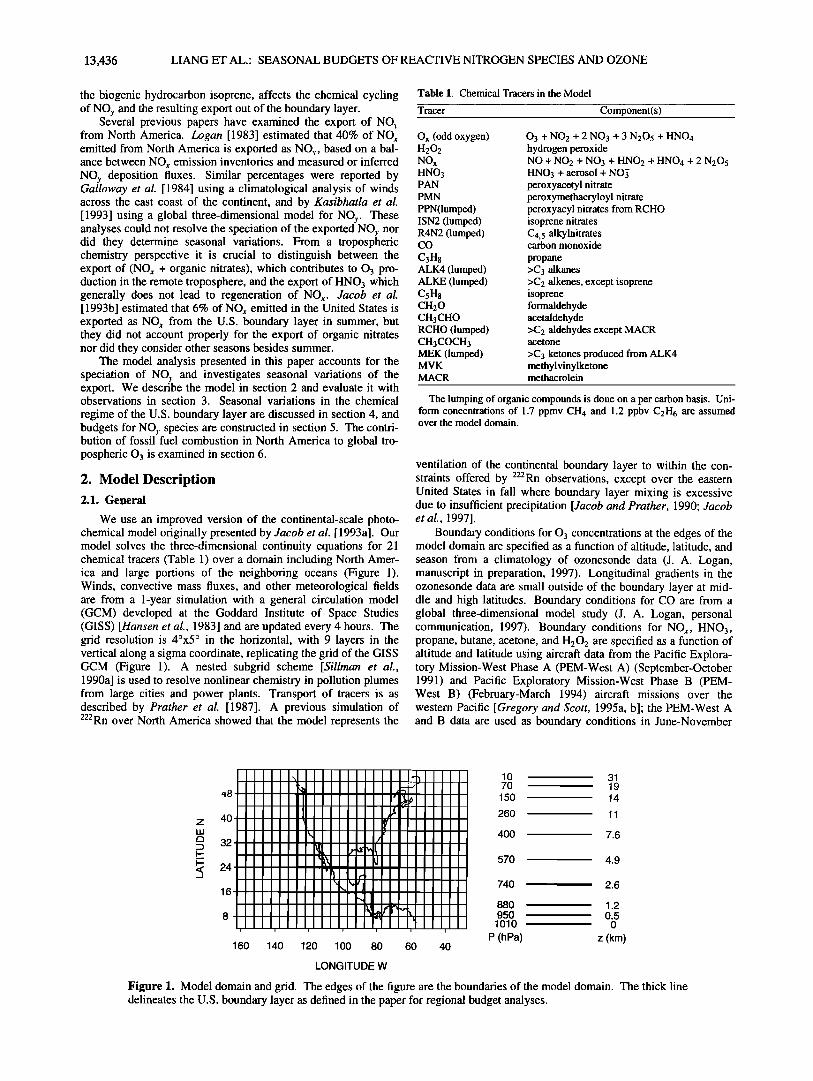
Figure 1. Model domain and grid. The edges of the figure are the boundaries of the model domain. The thick line delineates the U.S. boundary layer as defined in the paper for regional budget analyses.

LIANG ET AL.: SEASONAL BUDGETS OF REACTIVE NITROGEN SPECIES AND OZONE 13,437
and December-May, respectively. Boundary conditions for PAN during June-November are from PEM-West A. The PAN con- centrations measured by Singh et al. [1997] at northern midlati- tudes during PEM-West B range from about 500 parts per trillion by volume (pptv) in the lower troposphere to about 200 pptv at 500 hPa, considerably higher than the wintertime measurements of Perros [1994] over the western North Atlantic during the TROPOZ II aircraft mission which indicate a PAN concentration
range of 50-100 pptv for the same latitudes. Singh et al. [1997] point out that the PEM-West B data for PAN could have been unusually affected by the outflow of continental pollution. As discussed in section 3, we can achieve in the model a good simu- lation of the Perros [1994] data and also of the wintertime data from a Canadian site by scaling down the model boundary condi- tion for PAN during December-May by a factor of 10 from the PEM-West B data, essentially suppressing advection of PAN from outside the model domain; we choose to do so in the stan- dard simulation. For all tracers other than those discussed above, we adopt low concentrations (1 pptv) as boundary conditions.
The simulations are conducted for 13 months, starting from the boundary conditions as initial conditions. The first month (May) is used for decay of the initial conditions (ventilation of the model domain requires less than 1 month). We focus our analysis on the last 12 months of simulation.
2.2. Chemistry
Chemical changes in tracer concentrations are computed with a fast Gear solver [Jacobson and Turco, 1994] applied to a photo- chemical mechanism for O3-NOy-hydrocarbon chemistry includ- ing detailed oxidation schemes for Cl_4 alkanes, propene, and isoprene. The mechanism draws on compilations by DeMore et al. [1994] for inorganic and methane chemistry and by Atkinson et al. [1992] and Atkinson [1994] for NMHC chemistry; thermal decomposition rates for PAN and PPN are from Grosjean et al. [1994], and the chemistry of organic peroxy radicals (RO2) includes new data from Kirchner and Stockwell [1996] and Mar- icq and Szente [1996a, hi. A discussion of the NMHC chemistry and a full listing of the isoprene oxidation mechanism are presented by Horowitz et al. [this issue]. Aqueous phase radical chemistry in clouds is ignored as it appears to have negligible effect on 03 [Liang and Jacob, 1997]. Reactions in aerosols are calculated as a first-order loss defined by a reaction probability on the aerosol surface [Dentener and Crutzen, 1993]. We adopt a reaction probability of 0.1 for the hydrolysis of N2Os to HNO3 [Mozurkewich and Calvert, 1988] and for the conversion to HNO3 of hydroxy organic nitrates produced by oxidation of alk- enes and isoprene [Shepson et al., 1996; P. B. Shepson, personal communication, 1996]. We also adopt a reaction probability of 0.1 for scavenging of HO2 and hydroxy RO2 radicals by aerosols. The spatial and temporal distribution of aerosols is based on a sulfate mass simulation by Chin et al. [1996] using the same GISS GCM meteorological fields. We compute the aerosol sur- face area from the sulfate mass in each gridbox by assuming that the aerosol particles are aqueous solutions of NHnHSO 4 with a dry radius of 0.1 gm and liquid H20 determined from thermo- dynamic equilibrium (Raoult's law) at the local relative humidity.
Actinic fluxes are computed hourly on the basis of the solar zenith angle, the GCM cloud optical depths (updated every 4 hours), and the total 03 columns specified as a function of lati- tude and month [Spivakovsky et al., 1990]. The radiation code uses a 6-stream approximation for the Rayleigh scattering atmo- sphere [Logan et al., 1981]. Clouds are treated as reflective sur- faces with reflectivities specified at four different altitudes to match the GCM vertical distribution of cloud optical depths [Spivakovsky et al., 1990]. A light-absorbing aerosol is included with an optical depth of 0.1 at 310 nm varying inversely with wavelength.
The chemical mechanism used in this study is identical to that of Horowitz et al. [this issue] except for the aerosol uptake of
HO2, hydroxy RO2 radicals, and hydroxy organic nitrates. Horowitz et al. [this issue] assumed reaction probabilities in aero- sols of unity for HO 2 and zero for hydroxy RO 2 radicals and hydroxy organic nitrates; whereas we assume 0.1 for all these species. Because of the added aerosol sink for hydroxy RO 2 rad- icals and hydroxy organic nitrates in our model, concentrations in surface air over the eastern United States in summer are 5-10
parts per billion by volume (ppbv) lower than obtained by Horowitz et al. [this issue].
2.3. Emissions and Deposition
Anthropogenic emissions of NO,,, CO, and NMHCs from North America are based on 1990 national inventories for the
United States [U.S. Environmental Protection Agency (EPA), 1995] and Canada [Environment Canada, 1995], with spatial dis- tributions from the National Acid Precipitation Assessment Pro- gram (NAPAP) [U.S. EPA, 1989]. Alkanes with >4 C atoms are emitted as ALK4 (Table 1) on a per-carbon basis, and alkenes with >3 C atoms are similarly emitted as ALKE on a per-carbon basis. Seasonal variations of NOx and CO emissions are less than 10% [U.S. NAPAP, 1991 ] and are neglected. A 10% seasonal amplitude is applied to emissions of anthropogenic NMHCs, with maximum in summer and minimum in winter [U.S. NAPAP, 1991]. Anthropogenic emissions from Central and South Amer- ica are as given by Jacob et al. [1993a] and do not vary with time of year.
Biogenic emission of isoprene is calculated hourly using the emission algorithm of Guenther et al. [1995] as modified by (Y. Wang et al., Global simulation of tropospheric O3-NOx- hydrocarbon chemistry, 1, Model formulation, submitted to Jour- nal of Geophysical Research, 1997a) (hereinafter referred to as Wang et al., submitted manuscript, 1997a) and applied to the surface-type map of Olson [1992] with 0.5øx0.5 ø resolution. The emission varies with local temperature and light intensity and with the local leaf area index (LAI) which is updated monthly based on satellite observations of the global vegetation index (GVI). Seasonal observations of isoprene emission from forests in Colorado and Massachusetts indicate a time lag between the onset of photosynthesis and isoprene emission, with isoprene emission starting in early June and shutting off in late September [Monson et al., 1995; Goldstein et al., 1996]. In the model we restrict isoprene emission north of 40øN to the June-September time window. Biogenic emissions of other alkenes and acetone are scaled to that of isoprene with emission factors on a carbon basis of 0.051 for alkenes [Goldstein et al., 1996] and 0.025 for acetone (Wang et al., submitted manuscript, 1997a).
Dry deposition fluxes of 03, NOx, peroxyacylnitrates, hydroxy organic nitrates, HNO3, H202, and CH20 are calculated locally using a big-leaf resistance-in-series model (Wang et al., submitted manuscript, 1997a) applied to the Olson [1992] surface-type map. The aerodynamic resistances are computed from archived GCM data for surface wind, solar irradiance at the surface, and nighttime cloud cover [Jacob et al., 1993a]. The surface resistances vary with surface type, species type [Wesely, 1989], temperature, light intensity, monthly updated LAI, and snow cover in winter. Hydroxy organic nitrates are highly solu- ble in water [Shepson et al., 1996] and are assumed to deposit like HNO3. Wet deposition of highly water-soluble tracers (HNO3, hydroxy organic nitrates, H202) is computed as described by Balkanski et al. [1993] from the GCM wet convec- tive mass fluxes and synoptic precipitation fields; 100% scaveng- ing of these tracers in precipitating convective updrafts is assumed.
3. Evaluation with Observations
The model is intended to simulate a typical meteorological year, rather than any given year; evaluation with observations must therefore focus on seasonal statistics. Horowitz et al. [this
13,438 LIANG ET AL.: SEASONAL BUDGETS OF REACTIVE NITROGEN SPECIES AND OZONE
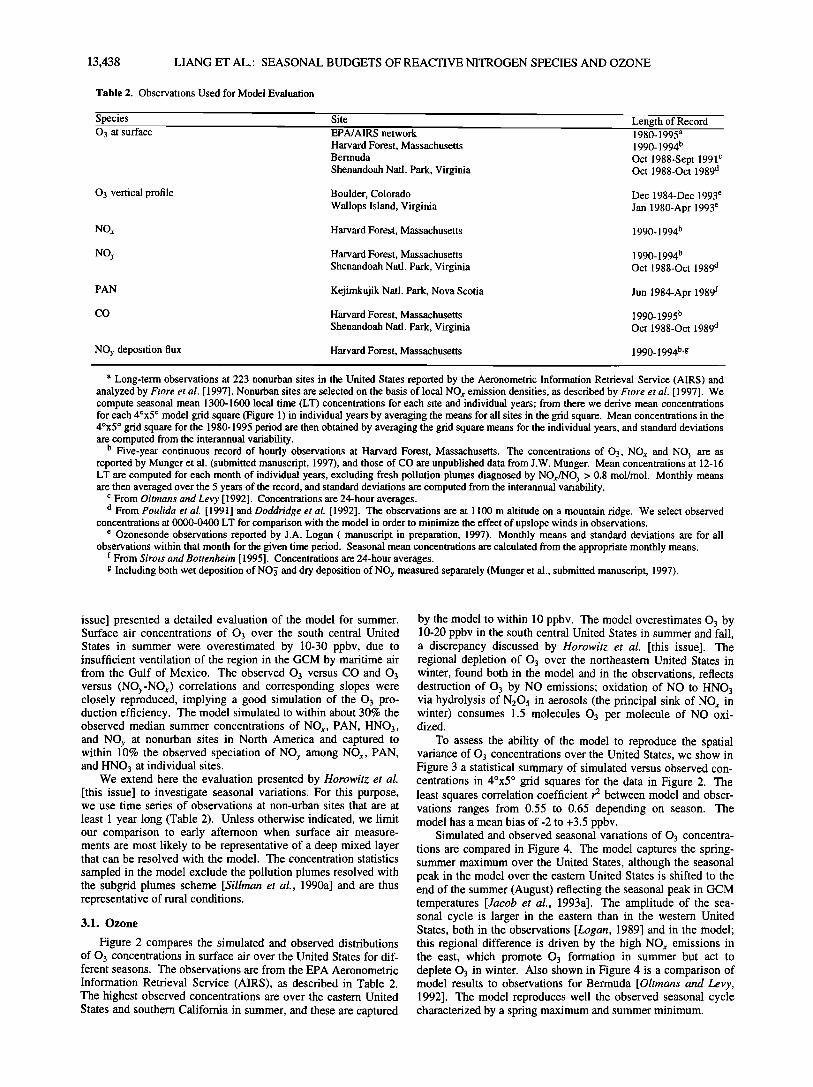
Table 2. Observations Used for Model Evaluation
Species Site Length of Record 03 at surface EPA/AIRS network 1980-1995 a
Harvard Forest, Massachusetts 1990-1994 b Bermuda Oct 1988-Sept 1991 c Shenandoah Natl. Park, Virginia Oct 1988-Oct 1989 d
03 vertical profile Boulder, Colorado Wallops Island, Virginia
Dec 1984-Dec 1993 e
Jan 1980-Apr 1993 e
NOx Harvard Forest, Massachusetts 1990-1994 b
NOy Harvard Forest, Massachusetts 1990-1994 b Shenandoah Natl. Park, Virginia Oct 1988-Oct 1989 d
PAN Kejimkujik Natl. Park, Nova Scotia
Harvard Forest, Massachusetts Shenandoah Natl. Park, Virginia
CO
Jun 1984-Apr 1989 f
1990-1995 b Oct 1988-Oct 1989 d
NOy deposition flux Harvard Forest, Massachusetts 1990-1994 b'g
a Long-term observations at 223 nonurban sites in the United States reported by the Aeronometric Information Retrieval Service (AIRS) and analyzed by Fiore et al. [ 1997]. Nonurban sites are selected on the basis of local NOx emission densities, as described by Fiore et al. [ 1997]. We compute seasonal mean 1300-1600 local time (LT) concentrations for each site and individual years; from there we derive mean concentrations for each 4øx5 ø model grid square (Figure 1) in individual years by averaging the means for all sites in the grid square. Mean concentrations in the 4øx5 ø grid square for the 1980-1995 period are then obtained by averaging the grid square means for the individual years, and standard deviations are computed from the interannual variability.
b Five-year continuous record of hourly observations at Harvard Forest, Massachusetts. The concentrations of 03, NOx and NOy are as reported by Munger et al. (submitted manuscript, 1997), and those of CO are unpublished data from J.W. Munger. Mean concentrations at 12-16 LT are computed for each month of individual years, excluding fresh pollution plumes diagnosed by NOx/NOy > 0.8 mol/mol. Monthly means are then averaged over the 5 years of the record, and standard deviations are computed from the interannual variability.
c From Oltmans and Levy [ 1992]. Concentrations are 24-hour averages. d From Poulida et al. [1991] and Doddridge et al. [1992]. The observations are at 1100 m altitude on a mountain ridge. We select observed
concentrations at 0000-0400 LT for comparison with the model in order to minimize the effect of upslope winds in observations. e Ozonesonde observations reported by J.A. Logan ( manuscript in preparation, 1997). Monthly means and standard deviations are for all
observations within that month for the given time period. Seasonal mean concentrations are calculated from the appropriate monthly means. f From Sirois and Bottenheim [ 1995]. Concentrations are 24-hour averages. g Including both wet deposition of NO5 and dry deposition of NOy measured separately (Munger et al., submitted manuscript, 1997).
issue] presented a detailed evaluation of the model for summer. Surface air concentrations of 03 over the south central United States in summer were overestimated by 10-30 ppbv, due to insufficient ventilation of the region in the GCM by maritime air from the Gulf of Mexico. The observed 03 versus CO and 03 versus (NOy-NOx) correlations and corresponding slopes were closely reproduced, implying a good simulation of the 03 pro- duction efficiency. The model simulated to within about 30% the observed median summer concentrations of NOx, PAN, HNO3, and NOy at nonurban sites in North America and captured to within 10% the observed speciation of NOy among NOx, PAN, and HNO 3 at individual sites.
We extend here the evaluation presented by Horowitz et al. [this issue] to investigate seasonal variations. For this purpose, we use time series of observations at non-urban sites that are at
least 1 year long (Table 2). Unless otherwise indicated, we limit our comparison to early afternoon when surface air measure- ments are most likely to be representative of a deep mixed layer that can be resolved with the model. The concentration statistics
sampled in the model exclude the pollution plumes resolved with the subgrid plumes scheme [Sillman et al., 1990a] and are thus representative of rural conditions.
3.1. Ozone
Figure 2 compares the simulated and observed distributions of 03 concentrations in surface air over the United States for dif- ferent seasons. The observations are from the EPA Aeronometric Information Retrieval Service (AIRS), as described in Table 2. The highest observed concentrations are over the eastern United States and southern California in summer, and these are captured
by the model to within 10 ppbv. The model overestimates 03 by 10-20 ppbv in the south central United States in summer and fall, a discrepancy discussed by Horowitz et al. [this issue]. The regional depletion of 03 over the northeastern United States in winter, found both in the model and in the observations, reflects destruction of 03 by NO emissions; oxidation of NO to HNO3 via hydrolysis of N20 5 in aerosols (the principal sink of NOx in winter) consumes 1.5 molecules 03 per molecule of NO oxi- dized.
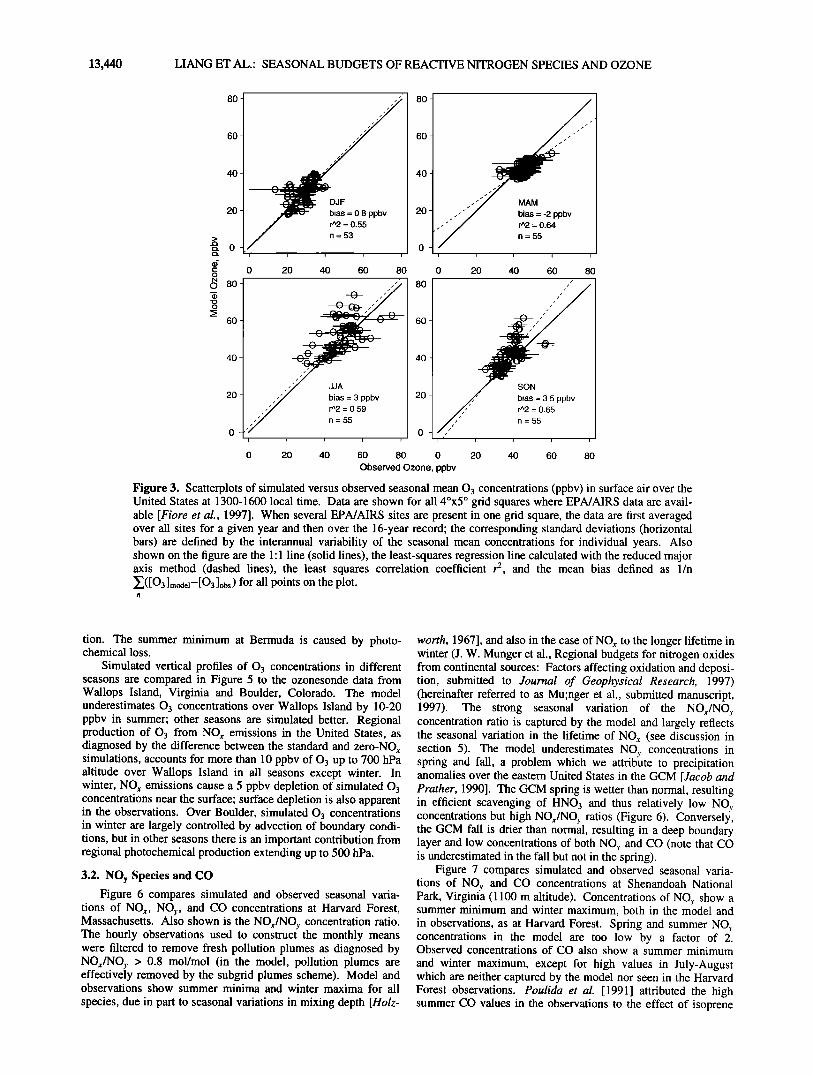
To assess the ability of the model to reproduce the spatial variance of 03 concentrations over the United States, we show in Figure 3 a statistical summary of simulated versus observed con- centrations in 4øx5 ø grid squares for the data in Figure 2. The least squares correlation coefficient r 2 between model and obser- vations ranges from 0.55 to 0.65 depending on season. The model has a mean bias of-2 to +3.5 ppbv.
Simulated and observed seasonal variations of 03 concentra- tions are compared in Figure 4. The model captures the spring- summer maximum over the United States, although the seasonal peak in the model over the eastern United States is shifted to the end of the summer (August) reflecting the seasonal peak in GCM temperatures [Jacob et al., 1993a]. The amplitude of the sea- sonal cycle is larger in the eastern than in the western United States, both in the observations [Logan, 1989] and in the model; this regional difference is driven by the high NOx emissions in the east, which promote 03 formation in summer but act to deplete 03 in winter. Also shown in Figure 4 is a comparison of model results to observations for Bermuda [Oltmans and Levy, 1992]. The model reproduces well the observed seasonal cycle characterized by a spring maximum and summer minimum.

LIANG ET AL.' SEASONAL BUDGETS OF REACTIVE NITROGEN SPECIES AND OZONE 13,439
MODEL
45 ,
• _
.
25
-120 -110 -100 -90 -80 -70 LONGITUDE, degrees
45
35
-• 30
-120 -110 -100 -90 -80 -70 LONGITUI) E, degrees
45
- ! •.• •. i i . .• ......... • ......... 1
-120 -110 -100 -90 -80 -70 LONGITUDE, degrees
45
,• 30
25
-120 -110 -100 -90 -80 -70 LONGITUDE, degrees
DJF
MAM
jJA
OBSERVED
....... • .............. J ........ i ......... i.,,,, .... i..
-120 -110 -100 -90 -80 -70
LONGITUDE, degrees
-120 -110 -100 -90 -80 -70 LONGITUDE, degrees
35
-120 -110 -100 -90 -I• -70 LONGITUDE, degrees
SON ...... 1 ......... ! ......... i ......... i ......... ! ........ -j-
45L1 ."""•/ ' ' \' X
-1• -110 -1• -• -• -70 LONGI•DE, degrees
Figure 2. Mean afternoon (1300-1600 local time) 0 3 concentrations (ppbv) in surface air over the United States in different seasons. Model results (left panels) are compared to 1980-1995 observations from the EPA Aeronometric Information Retrieval Service (AIRS). Contours are at 5 ppbv intervals except for the summer panel where they are at 10 ppbv intervals.
Advection of boundary conditions, chemistry, and deposition all play a role in shaping the distribution of 03 in the model. In order to isolate these influences we conducted two sensitivity simulations: (1) a "no-chemistry" simulation where 03 is solely controlled by transport from the boundaries and deposition; (2) a "zero-NOx" simulation where no NOx is emitted from the model domain. In the latter simulation, advection of NO• and PAN
from the boundaries maintains a background NOx concentration of 2-50 pptv in the boundary layer over the United States. Com- parison of these sensitivity simulations to the standard simulation in Figure 4 shows that regional production makes an important contribution to 03 concentrations in surface air over the United States in all seasons except winter. Ozone concentrations in the zero-NO• simulation are 20-40 ppbv, with little seasonal varia-
13,440 LIANG ET AL.: SEASONAL BUDGETS OF REACTIVE NITROGEN SPECIES AND OZONE
80
60
40
20
o 80
o
60
40
20
DJF
bias: 0.8 ppbv r^2 = 0.55
n = 53
MAM
bias = -2 ppbv r^2: 0.64
n:55
i r i i i i i i i
0 20 40 60 80 0 20 40 60 80
JJA
bias = 3 ppbv rA2 = 0.59
n=55
/
/•,•/' r^2= bias = 3.,• ppbv ,,,•/' n =55
i t i i
0 20 40 60 80 0 20 40 60 80
Observed Ozone, ppbv
Figure 3. Scatterplots of simulated versus observed seasonal mean 0 3 concentrations (ppbv) in surface air over the United States at 1300-1600 local time. Data are shown for all 4øx5 ø grid squares where EPA/AIRS data are avail- able [Fiore et al., 1997]. When several EPA/AIRS sites are present in one grid square, the data are first averaged over all sites for a given year and then over the 16-year record' the corresponding standard deviations (horizontal bars) are defined by the interannual variability of the seasonal mean concentrations for individual years. Also shown on the figure are the 1'1 line (solid lines), the least-squares regression line calculated with the reduced major axis method (dashed lines), the least squares correlation coefficient r 2, and the mean bias defined as 1/n Z([O3]model--[O31obs) for all points on the plot.
tion. The summer minimum at Bermuda is caused by photo- chemical loss.
Simulated vertical profiles of 03 concentrations in different seasons are compared in Figure 5 to the ozonesonde data from Wallops Island, Virginia and Boulder, Colorado. The model underestimates 03 concentrations over Wallops Island by 10-20 ppbv in summer; other seasons are simulated better. Regional production of 03 from NO,, emissions in the United States, as diagnosed by the difference between the standard and zero-NO,, simulations, accounts for more than 10 ppbv of 03 up to 700 hPa altitude over Wallops Island in all seasons except winter. In winter, NO,, emissions cause a 5 ppbv depletion of simulated 03 concentrations near the surface; surface depletion is also apparent in the observations. Over Boulder, simulated 03 concentrations in winter are largely controlled by advection of boundary condi- tions, but in other seasons there is an important contribution from regional photochemical production extending up to 500 hPa.
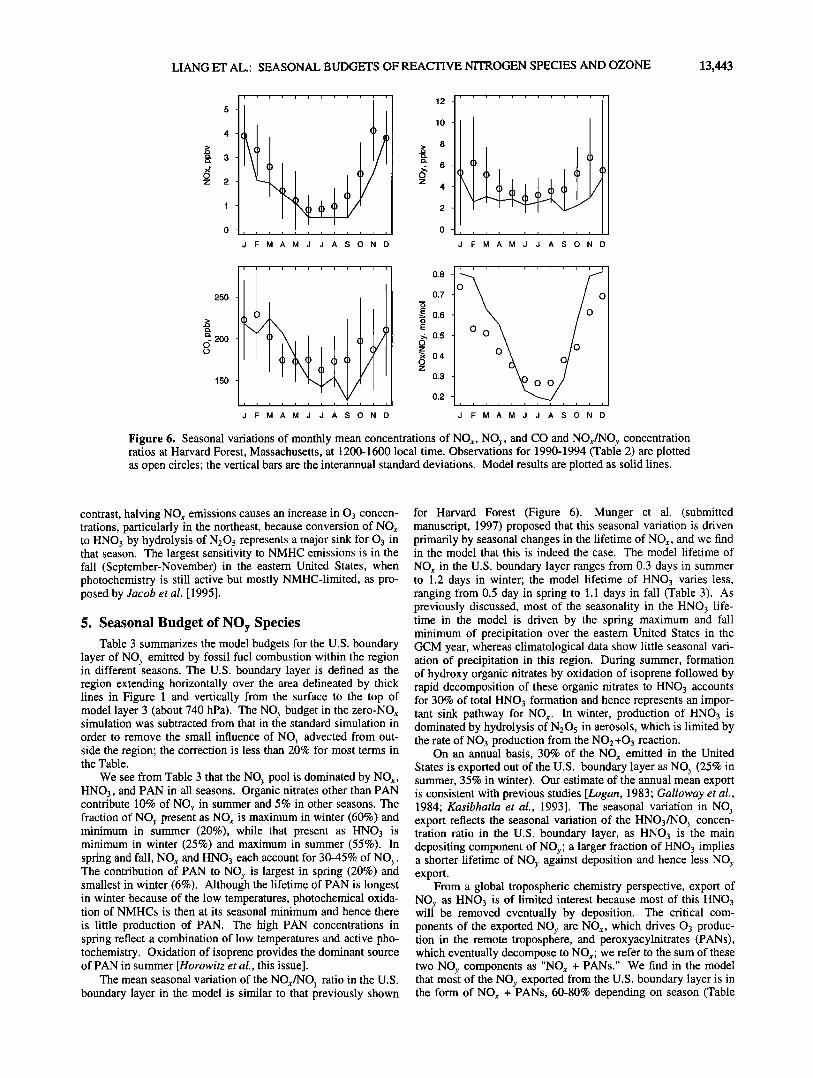
3.2. NOy Species and CO Figure 6 compares simulated and observed seasonal varia-
tions of NO,,, NOy, and CO concentrations at Harvard Forest, Massachusetts. Also shown is the NO,,/NO3. concentration ratio. The hourly observations used to construct the monthly means were filtered to remove fresh pollution plumes as diagnosed by NO,,/NOy > 0.8 mot/mot (in the model, pollution plumes are effectively removed by the subgrid plumes scheme). Model and observations show summer minima and winter maxima for all
species, due in part to seasonal variations in mixing depth [Holz-
worth, 1967], and also in the case of NOx to the longer lifetime in winter (J. W. Munger et at., Regional budgets for nitrogen oxides from continental sources: Factors affecting oxidation and deposi- tion, submitted to Journal of Geophysical Research, 1997) (hereinafter referred to as Mu;nger et at., submitted manuscript, 1997). The strong seasonal variation of the NO,,/NO•. concentration ratio is captured by the model and largely reflects the seasonal variation in the lifetime of NO,, (see discussion in section 5). The model underestimates NOy concentrations in spring and fall, a problem which we attribute to precipitation anomalies over the eastern United States in the GCM [Jacob and Prather, 1990]. The GCM spring is wetter than normal, resulting in efficient scavenging of HNO3 and thus relatively low NO). concentrations but high NO,,/NOy ratios (Figure 6). Conversely, the GCM fall is drier than normal, resulting in a deep boundary layer and low concentrations of both NOr and CO (note that CO is underestimated in the fall but not in the spring).
Figure 7 compares simulated and observed seasonal varia- tions of NO.•. and CO concentrations at Shenandoah National Park, Virginia (1100 m altitude). Concentrations of NO.•. show a summer minimum and winter maximum, both in the model and
in observations, as at Harvard Forest. Spring and summer NO). concentrations in the model are too low by a factor of 2. Observed concentrations of CO also show a summer minimum
and winter maximum, except for high values in July-August which are neither captured by the model nor seen in the Harvard Forest observations. Poulida et al. [1991] attributed the high summer CO values in the observations to the effect of isoprene

LIANG ET AL.: SEASONAL BUDGETS OF REACTIVE NITROGEN SPECIES AND OZONE 13,441
70-
60-
50-
40-
30-
20-
Harvard Forest
42N, 70W
i f i i s i i i i , i i
J F M A M J J A S O N D
..... O!eg,on .....
70 t 42N, 120W 50
30•(• '0-'•(• i i i i i t i • i i
J F M A M J J A S O N D
Arizona
70- 34N, ll0W
60-
50-
40- 30-
J F M A M J J A S O N D Month
70-
60-
50-
40-
30-
20-
70-
60-
50-
40-
30-
20-
70-
60-
50-
40-
30.
20
..... Virgin, ia ..... 38N, 80W
...... J FMAMJ ASO
Indiana , , i , , , , , , , i ,
38N, 85W
J F M A M J J A S O N D
Bermuda i i i i , i , i , i i
30N, 65W
i i i t i i i i i i i
J F M A M J J A S O N D
Figure 4. Seasonal variation of simulated and observed monthly mean 03 concentrations (ppbv) in surface air at 1300-1600 local time. Observed monthly means for 1980-1995 are plotted as open circles; the vertical bars are the interannual standard deviations. Model results are shown for the standard simulation (solid lines), the no-chemistry simulation (dotted lines), and the zero-NO,c simulation (dashed lines). The observations are from the EPA/AIRS network averaged over 4øx5 ø grid squares (the center of the grid square is indicated), except for Harvard Forest (Munger et al., submitted manuscript, 1997) and Bermuda [Oh'mans and Levy, 1992]. Concentrations at Bermuda are 24-hour averages.
oxidation, but the implied isoprene emission would be exceed- ingly high. We find in the model that isoprene oxidation contri- butes less than 30 ppbv CO at the site in summer (results from a simulation without isoprene emission are shown as dashed lines in Figure 7).
To our knowledge, the only year-round record for PAN con- centrations in non-urban air in North America is from Kejimkujik National Park, Nova Scotia [Sirois and Bottenheim, 1995]. Com- parison between model and observations is shown in Figure 8. The seasonal maximum is in February-March in the observations and March-May in the model; the model overestimates PAN con- centrations in all seasons except winter. Day-to-day variability in the model is considerable, as shown by the dashed lines (standard deviations of daily concentrations). This variability reflects the contrast in influence at the site between air masses with elevated
PAN advected from the eastern United States and air masses with
low PAN advected from the north. Horowitz et al. [this issue] showed that the model reproduces to within 30% the observed PAN concentrations over the eastern United States in summer,
with no evident bias. We explain the excessive PAN in the model
at Kejimkujik as caused by too frequent transport of air from the eastern United States to the site in summer, a problem previously noted by Chin et al. [1996] in their simulation of summertime sulfate over eastern Canada using the same meteorological fields.
As discussed in section 2, the model boundary condition for PAN concentrations during December-May was scaled down by a factor of 10 from the PEM-West B observations. This allows
model results to match roughly not only the wintertime PAN con- centrations observed at Kejimkujik but also the TROPOZ-II air- craft observations of PAN by Perros [1994] over the western North Atlantic in January, which ranged from about 100 pptv in the lower troposphere to 50 pptv at 500 hPa. We find that use of the PAN concentrations from PEM-West B flights as a model boundary condition would lead to an overestimate of the winter- time Kejimkujik and TROPOZ-II data by factors of 2 to 4.
3.3 Nitrate Deposition
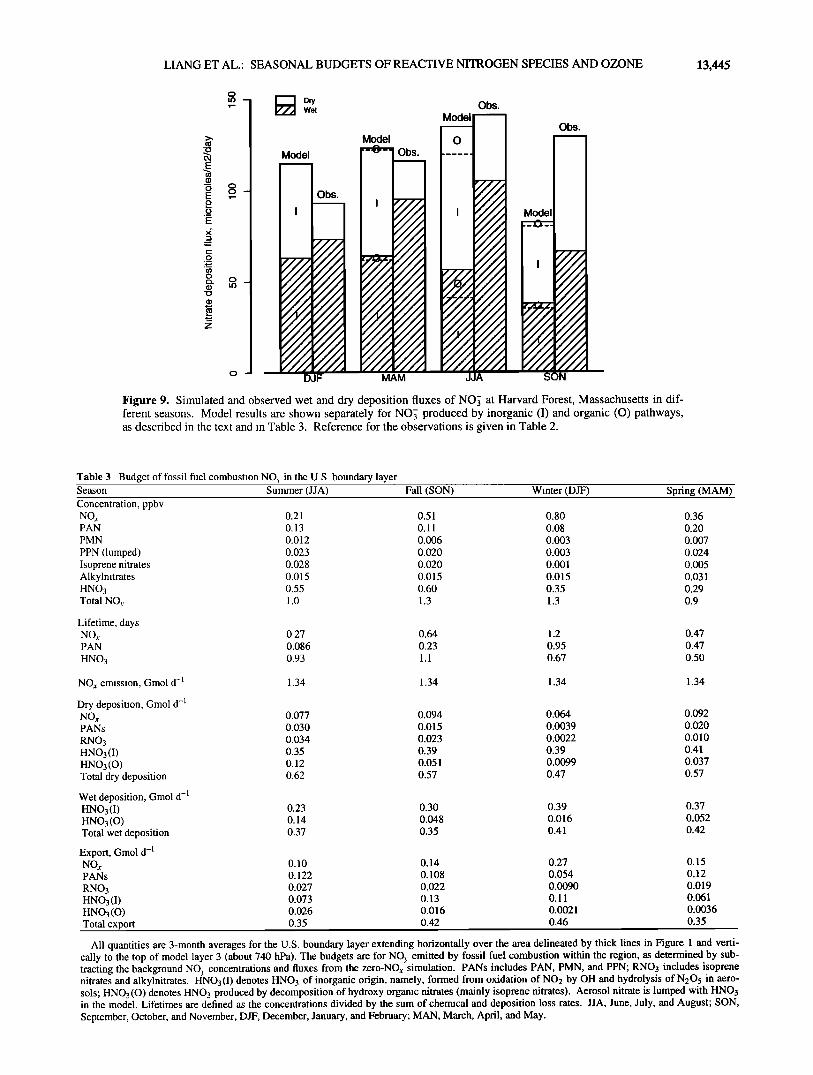
We compare in Figure 9 the simulated and observed seasonal variations of nitrate deposition fluxes (separately for wet and dry)

13,442 LIANG ET AL.: SEASONAL BUDGETS OF REACTIVE NITROGEN SPECIES AND OZONE
5OO
Q. 600
• 700 • 800
• 900 lOOO
Boulder
//_•_
20 30 40 50 60 70 80
5OO
6O0
7O0
8OO
9OO
1000
Wallops Island
/,,,
o
20 30 40 50 60
i
70 80
DJF
5OO
Q. 600
•700 • 800
•_. 900 lOOO
500
600
700
800
900
lOOO
20 30 40 50 60 70 80 20
/ //•,• /// ,,,."' 0 0 /
/ i o 30 40 50 60 70
MAM
5OO
600
•700 800
900
lOOO
/ /
/
5OO
60O
70O
8OO
9O0
1000
20 30 40 50 60 70 80 20 30
/. ,, +
// ,,"' o
/// ,,,,,"
/ o , ,
40 50 60 70 80
JJA
5OO
600
•700 800
900 lOOO
5oo
600
70o
8oo
9o0
lOOO
20 30 40 50 60 70 80 20 60 70 80 Ozone, ppbv
/ ,,'
// ,," / ,,"' o
ß
, , ,
30 40 50
SON
Figure 5. Seasonally averaged vertical profiles of 03 concentrations over Boulder, Colorado (835 hPa surface) and Wallops Island, Virginia. Observations (Table 2) are plotted as open circles; horizontal bars represent the interan- nual standard deviations. Model results are shown for the standard simulation (solid lines), the no-chemistry simu- lation (dotted lines), and the zero-NOx simulation (dashed lines).
at Harvard Forest. The observations show a weak winter
minimum which Munger et al. (submitted manuscript, 1997) attributed to a lesser abundance of HNO3, the main depositing form of NO>,, during that season. The model reproduces to within 20% the mean deposition fluxes of NO•. in individual seasons, except in the fall when the model is too low by almost a factor of 2. The fall anomaly is partly due to low GCM precipita- tion in the region, as discussed previously. The drought not only suppresses removal by wet deposition, but also increases boun- dary layer mixing and hence slows down dry deposition as well. We find that hydroxy organic nitrates formed from the oxidation of isoprene with a 12% yield [Horowitz et al., this issue] contri- bute 23% of the total summertime deposition of nitrate at Har- vard Forest in the model. These organic nitrates decompose rapidly to NOj in aqueous solution (P. B. Shepson, personal communication, 1996) and hence would be measured as NOj in precipitation samples.
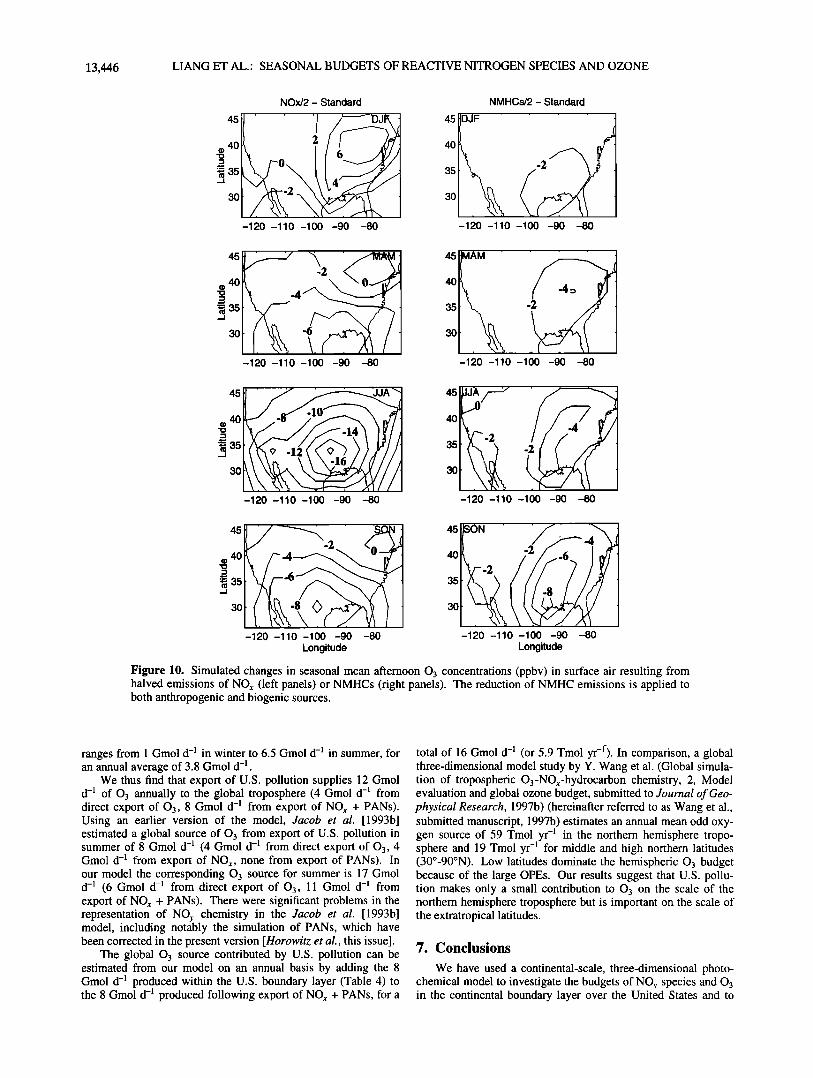
4. Seasonal Variation in Photochemical Regime Theoretical arguments and limited observations suggest that a
seasonal transition from NOx- to NMHC-limited conditions for 03 production should take place over the eastern United States in September because of decreasing UV radiation and the end of isoprene emission [Jacob et al., 1995]. We examined this issue in our three-dimensional model by conducting sensitivity studies with either NO• or NMHC emissions reduced by a factor of 2 over the model domain (the reduction of NMHC emissions was applied to both anthropogenic and biogenic sources). Changes in the simulated seasonal mean 03 concentrations are shown in Fig- ure 10. In summer, 03 production is strongly NOx-limited, as noted in previous model studies [Trainer et al., 1987; Sillman et al., 1990b; McKeen et al., 1991; Jacob et aL, 1993b]; halving NOx emissions decreases 03 concentrations by 10-20 ppbv over most of the United States, while halving NMHC emissions decreases 03 concentrations by less than 5 ppbv. In winter, by
LIANG ET AL.: SEASONAL BUDGETS OF REACTIVE NITROGEN SPECIES AND OZONE 13,443
>
o z 2
i i i i i i i i i i i i
J F M A M J J A S ON D
lO
8
• 6 o z
4
I I I , I ] I I I I I I
J F M A M J J A SON D
25O
200
150
, i , • i i • i i •
J F M A M J J A SON D
o 0.7 o
E _• 0.6
•0.5 ø ø O o o z
•O 0.4 z
0.3
1:).2 • i i t i i i
J F M A M J J A SON D
Figure 6. Seasonal variations of monthly mean concentrations of NOx, NO.•,, and CO and NOx/NO.•, concentration ratios at Harvard Forest, Massachusetts, at 1200-1600 local time. Observations for 1990-1994 (Table 2) are plotted as open circles' the vertical bars are the interannual standard deviations. Model results are plotted as solid lines.
contrast, halving NOx emissions causes an increase in 03 concen- trations, particularly in the northeast, because conversion of NOx to HNO3 by hydrolysis of N 205 represents a major sink for 03 in that season. The largest sensitivity to NMHC emissions is in the fall (September-November) in the eastern United States, when photochemistry is still active but mostly NMHC-limited, as pro- posed by Jacob et al. [1995].
5. Seasonal Budget of NOy Species Table 3 summarizes the model budgets for the U.S. boundary
layer of NO>, emitted by fossil fuel combustion within the region in different seasons. The U.S. boundary layer is defined as the region extending horizontally over the area delineated by thick lines in Figure 1 and vertically from the surface to the top of model layer 3 (about 740 hPa). The NO•. budget in the zero-NOx simulation was subtracted from that in the standard simulation in
order to remove the small influence of NO.•. advected from out- side the region; the correction is less than 20% for most terms in the Table.
We see from Table 3 that the NOy pool is dominated by NOx, HNO3, and PAN in all seasons. Organic nitrates other than PAN contribute 10% of NO.•, in summer and 5% in other seasons. The fraction of NO>. present as NOx is maximum in winter (60%) and minimum in summer (20%), while that present as HNO3 is minimum in winter (25%) and maximum in summer (55%). In spring and fall, NOx and HNO3 each account for 30-45% of NOy. The contribution of PAN to NOy is largest in spring (20%) and smallest in winter (6%). Although the lifetime of PAN is longest in winter because of the low temperatures, photochemical oxida- tion of NMHCs is then at its seasonal minimum and hence there
is little production of PAN. The high PAN concentrations in spring reflect a combination of low temperatures and active pho- tochemistry. Oxidation of isoprene provides the dominant source of PAN in summer [Horowitz et al., this issue].
The mean seasonal variation of the NOx/NO.¾ ratio in the U.S. boundary layer in the model is similar to that previously shown
for Harvard Forest (Figure 6). Munger et al. (submitted manuscript, 1997) proposed that this seasonal variation is driven primarily by seasonal changes in the lifetime of NOx, and we find in the model that this is indeed the case. The model lifetime of
NOx in the U.S. boundary layer ranges from 0.3 days in summer to 1.2 days in winter; the model lifetime of HNO3 varies less, ranging from 0.5 day in spring to 1.1 days in fall (Table 3). As previously discussed, most of the seasonality in the HNO3 life- time in the model is driven by the spring maximum and fall minimum of precipitation over the eastern United States in the GCM year, whereas climatological data show little seasonal vari- ation of precipitation in this region. During summer, formation of hydroxy organic nitrates by oxidation of isoprene followed by rapid decomposition of these organic nitrates to HNO3 accounts for 30% of total HNO3 formation and hence represents an impor- tant sink pathway for NOx. In winter, production of HNO3 is dominated by hydrolysis of N 205 in aerosols, which is limited by the rate of NO 3 production from the NO 2 +03 reaction.
On an annual basis, 30% of the NOx emitted in the United States is exported out of the U.S. boundary layer as NO.•. (25% in summer, 35% in winter). Our estimate of the annual mean export is consistent with previous studies [Logan, 1983; Galloway et al., 1984; Kasibhatla et al., 1993]. The seasonal variation in NOy export reflects the seasonal variation of the HNO3/NO•. concen- tration ratio in the U.S. boundary layer, as HNO3 is the main depositing component of NO.•,; a larger fraction of HNO 3 implies a shorter lifetime of NOy against deposition and hence less NOy export.
From a global tropospheric chemistry perspective, export of NOy as HNO3 is of limited interest because most of this HNO3 will be removed eventually by deposition. The critical com- ponents of the exported NO>, are NOx, which drives 03 produc- tion in the remote troposphere, and peroxyacylnitrates (PANs), which eventually decompose to NOx; we refer to the sum of these two NOy components as "NOx + PANs." We find in the model that most of the NOy exported from the U.S. boundary layer is in the form of NOx + PANs, 60-80% depending on season (Table

13,444 LIANG ET AL.' SEASONAL BUDGETS OF REACTIVE NITROGEN SPECIES AND OZONE
6 -
5 -
3 -
2 -
I I I i i I i i i I i I
o
o o o o
",'x o o /,,-o ?---'x //
I I I I I I I I I • • •
d F M A M d d A S O N D
ß I I 1 i I i I d i i I" I o
o
o
190- .'""'• 0 0 0•,,•/• • i I
160-
130-
I I I I I I I I I I, I
J F M A M J J A S O N D
Figure 7. Seasonal variation of monthly mean concentrations of NOy and CO at Shenandoah National Park, Virginia (mountain ridge site, 1100 m altitude). The observations were sampled at 0000-4000 LT to avoid the effect of daytime upslope flow [Poulida et al., 1991] while model results are 24-hour averages sampled in model layer 2 (Figure 1). Observations (Table 2) are plotted as open circles, and model results are plotted as solid lines. The observations are for 1 year only, hence no interannual standard deviations are shown. The dashed lines show model results for a simulation without emission of isoprene.
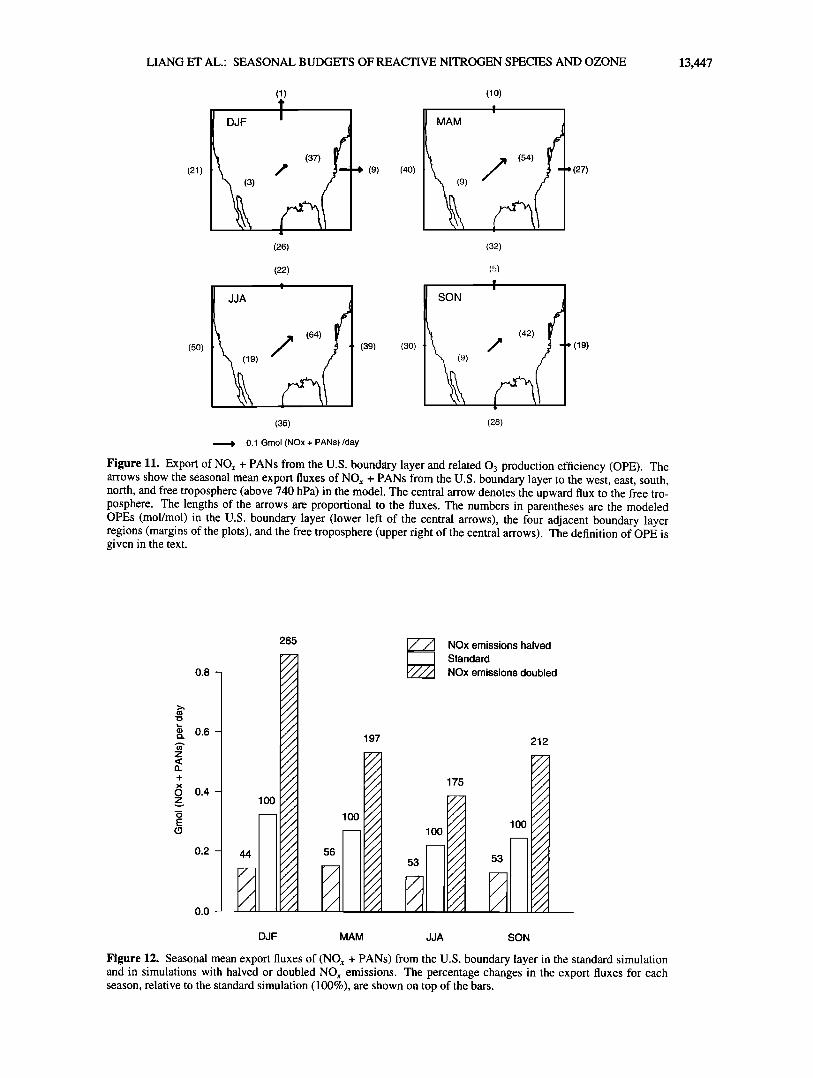
3). Although NO,, + PANs account for only 40% of NOy in the U.S. boundary layer in summer, export of NO,. in that season takes place principally by wet convection (Figure 11 [see also Jacob et al. 1993b; Thompson et al. 1994]) during which HNO3 is efficiently scavenged. By contrast, in winter most of the export is by advection northward and eastward in the lower troposphere (Figure 11), and the speciation of NOy in the exported air reflects more closely the speciation in the U.S. boundary layer. The NO,,/PANs concentration ratio in the exported air ranges from 1 in summer to 5 in winter, reflecting the partitioning in the boun- dary layer air (Table 3).
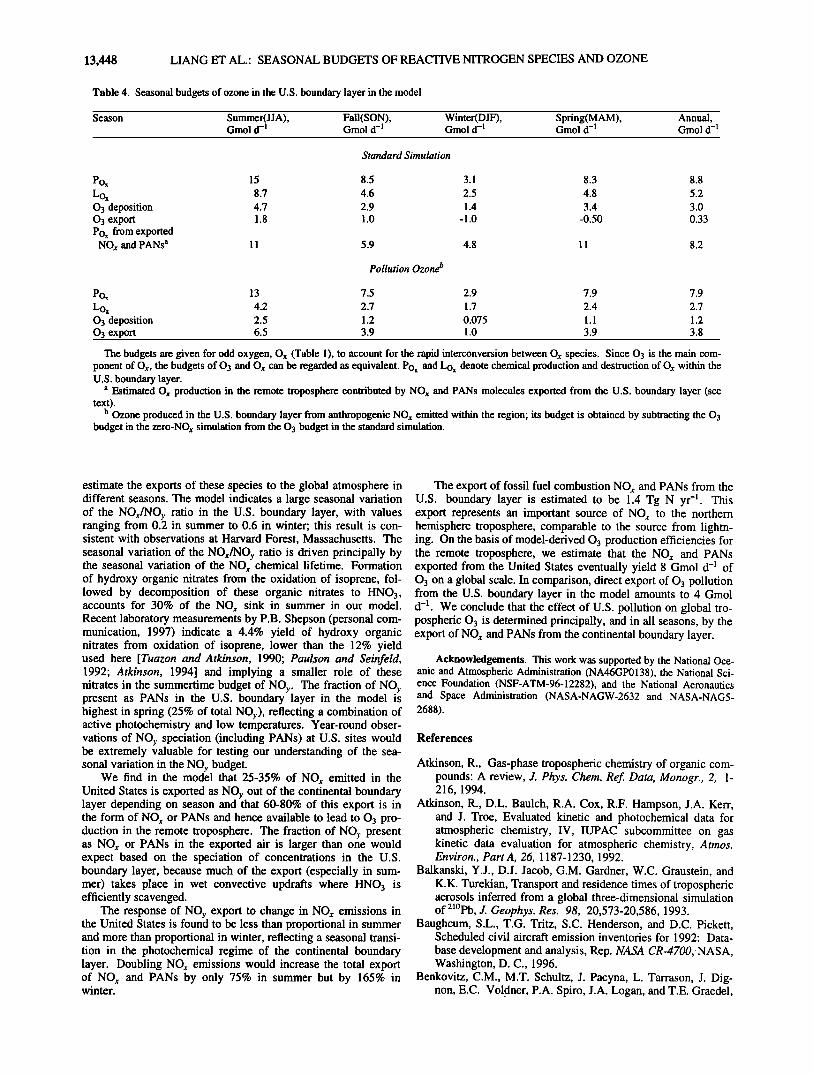
To investigate the response in the export of NO,,+PANs to changes in NO,, emissions, we conducted simulations where NOx emissions in the U.S. boundary layer domain were increased or decreased by a factor of 2. Results are shown in Figure 12. In summer when photochemistry is NO,,-limited, increasing NO,, emission leads to an increase in OH concentrations and hence a
decrease in the NOx lifetime; the export of NO,,+PANs responds less than proportionally to the change in emission. By contrast, in winter when photochemistry is NMHC-limited, doubling NO,,
emissions increases the lifetime of NO,, (because of lower 0 3 concentrations, slowing down the rate of the NO2 + 03 reaction), and the export of NO,, +PANs responds more than proportionally.
6. Global Implications for Ozone
The yearly export of NO•+PANs out of the U.S. boundary layer in the model is 1.4 Tg N yr -• (0.27 Gmol d -•), which can be compared to northern hemisphere estimates of NOx sources from lightning (1.7 Tg N yr -•) ([Wang et al., submitted manuscript, 1997a) and aircraft (0.4 Tg N yr -•) [Baughcum et al., 1996]. Export of pollution from the United States is clearly a major source of NO•, to the northern hemisphere troposphere, in all sea- sons.
To estimate the eventual source of O3 from the exported NO•, + PANs, we calculated from our model the O3 production efficiency (OPE) in the U.S. boundary layer and in the band of adjacent grid boxes (Figure 11). The OPE is defined as the gross number of odd oxygen (O•,) molecules produced from a NO•, molecule before it is oxidized to HNO3, which is then assumed to be removed by deposition [Liu et al., 1987]. We calculate the OPE for a region in the model as the ratio of O•, to HNO• produc- tion averaged over the region. The OPE ranges from 3 in winter to 16 in summer in the U.S. boundary layer and from 35 in winter to 61 in summer in the free troposphere (Figure 11). By applying the OPE for each region to the corresponding export fluxes of NO•, + PANs (Figure 11), we estimate a source of O• to the glo- bal troposphere ranging from 5 Gmol d -• in winter to 11 Gmol d -• in summer, for an annual average of 8.0 Gmol d -•. A more accurate estimate would require a global simulation.
The above source of 03 can be compared to the direct export of 03 pollution from the United States. A model budget for O3 (Table 4) shows that the U.S. boundary layer is a net sink for 03 in winter and spring and a net source in summer and fall. This budget can be viewed as the difference between the import of background 03 from outside the U.S. boundary layer and the export of pollution O3 produced within the region. We obtain a budget for pollution 03 in the model (Table 4) as the difference between results from the standard simulation and from the zero-
NOx simulation (where only the import of background 03 is con- sidered). The export of pollution 03 from the U.S. boundary layer is thus defined analogously to that of fossil fuel NO r dis- cussed in the previous section. Of the 7.9 Gmol d -• of pollution 03 produced within the U.S. boundary layer on an annual mean basis, 35% is chemically consumed within the boundary layer (mostly by the O•D + H20 reaction), 15% is deposited, and 50% is exported. Export of pollution 03 from the U.S. boundary layer
0.0
Figure 8. Seasonal variation of monthly mean concentrations of PAN at Kejimkujik National Park, Nova Scotia. Observations (Table 2) are shown as open circles, with interannual standard deviations as vertical lines. Model results are shown as solid
lines, with standard deviations of daily concentrations shown as dashed lines.
LIANG ET AL.' SEASONAL BUDGETS OF REACTIVE NITROGEN SPECIES AND OZONE 13,445
O
Dry Wet
Model
Obs.
' I
DJF
Model
Obs.
Obs. Mo(•e I
,
JJA MAM
Obs.
Model ._---•-=.
I
SON
Figure 9. Simulated and observed wet and dry deposition fluxes of NO• at Harvard Forest, Massachusetts in dif- ferent seasons. Model results are shown separately for NO• produced by inorganic (I) and organic (O) pathways, as described in the text and in Table 3. Reference for the observations is given in Table 2.
Table 3. Budget of fossil fuel combustion NOv in the U.S. boundary layer Season Summer (JJA) Fall (SON) Winter (DJF) Spring (MAM) Concentration, ppbv NOx 0.21 0.51 0.80 0.36 PAN 0.13 0.11 0.08 0.20
PMN 0.012 0.006 0.003 0.007
PPN (lumped) 0.023 0.020 0.003 0.024 Isoprene nitrates 0.028 0.020 0.001 0.005 Alkylnitrates 0.015 0.015 0.015 0.031 HNO3 0.55 0.60 0.35 0.29 Total NOy 1.0 1.3 1.3 0.9
Lifetime, days NOx 0.27 0.64 1.2 0.47 PAN 0.086 0.23 0.95 0.47
HNO3 0.93 1.1 0.67 0.50
NOx emission, Gmol d -• 1.34 1.34 1.34 1.34
Dry deposition, Gmol d -1 NOx 0.077 0.094 0.064 0.092 PANs 0.030 0.015 0.0039 0.020 RNO3 0.034 0.023 0.0022 0.010 HNO3 (I) 0.35 0.39 0.39 0.41 HNO3 (O) 0.12 0.051 0.0099 0.037 Total dry deposition 0.62 0.57 0.47 0.57
Wet deposition, Gmol d -1 HNO3(I) 0.23 0.30 0.39 0.37 HNO3 (O) 0.14 0.048 0.016 0.052 Total wet deposition 0.37 0.35 0.41 0.42
Export, Gmol d -1 NOx 0.10 0.14 0.27 0.15 PANs 0.122 0.108 0.054 0.12 RNO3 0.027 0.022 0.0090 0.019 HNO3 (I) 0.073 0.13 0.11 0.061 HNO3 (O) 0.026 0.016 0.0021 0.0036 Total export 0.35 0.42 0.46 0.35
All quantities are 3-month averages for the U.S. boundary layer extending horizontally over the area delineated by thick lines in Figure 1 and verti- cally to the top of model layer 3 (about 740 hPa). The budgets are for NOy emitted by fossil fuel combustion within the region, as determined by sub- tracting the background NO r concentrations and fluxes from the zero-NOx simulation. PANs includes PAN, PMN, and PPN; RNO3 includes isoprene nitrates and alkylnitrates. HNO3 (I) denotes HNO3 of inorganic origin, namely, formed from oxidation of NO2 by OH and hydrolysis of N2 O5 in aero- sols; HNO3 (O) denotes HNO3 produced by decomposition of hydroxy organic nitrates (mainly isoprene nitrates). Aerosol nitrate is lumped with HNO3 in the model. Lifetimes are defined as the concentrations divided by the sum of chemical and deposition loss rates. JJA, June, July, and August; SON, September, October, and November; DJF, December, January, and February; MAN, March, April, and May.
13,446 LIANG ET AL.' SEASONAL BUDGETS OF REACTIVE NITROGEN SPECIES AND OZONE
45
40
• 35
30
NOx/2 - Standard
..... 4,5
0 35
3O
-120 -110 -100 -90 -80
NMHCs/2 - Standard
IDJF
-2
-120 -110 -100 -90 -80
45
40
(• 35
30
-120 -110 -100 -90 -80
45 I/MAM '
-120 -110 -100 -90 -80
ß 40 -8
-• 3õ
:30
-120 -110 -100 -90 -80 -120 -110 -100 -90 -80
45 .... 0• 45 ß 40 -4 -2 40 '• 35 -6 35
30 30
-120 -110 -100 -90 -80
Longitude
'SON
-1•0 -110 -100 -90 -80 Longitude
Figure 10. Simulated changes in seasonal mean afternoon 03 concentrations (ppbv) in surface air resulting from halved emissions of NOx (left panels) or NMHCs (right panels). The reduction of NMHC emissions is applied to both anthropogenic and biogenic sources.
ranges from 1 Gmol d -1 in winter to 6.5 Gmol d -1 in summer, for an annual average of 3.8 Gmol d -• .
We thus find that export of U.S. pollution supplies 12 Gmol d -• of 03 annually to the global troposphere (4 Gmol d -1 from direct export of 03, 8 Gmol d -1 from export of NOx + PANs). Using an earlier version of the model, Jacob et al. [1993b] estimated a global source of 03 from export of U.S. pollution in summer of 8 Gmol d -] (4 Gmol d -1 from direct export of 03, 4 Gmol d -1 from export of NOx, none from export of PANs). In our model the corresponding 03 source for summer is 17 Gmol d -1 (6 Gmol d -1 from direct export of 03, 11 Gmol d -] from export of NOx + PANs). There were significant problems in the representation of NOy chemistry in the Jacob et al. [1993b] model, including notably the simulation of PANs, which have been corrected in the present version [Horowitz et al., this issue].
The global 03 source contributed by U.S. pollution can be estimated from our model on an annual basis by adding the 8 Gmol d -] produced within the U.S. boundary layer (Table 4) to the 8 Gmol d -1 produced following export of NO x + PANs, for a
total of 16 Gmol d -1 (or 5.9 Tmol yr-f). In comparison, a global three-dimensional model study by Y. Wang et al. (Global simula- tion of tropospheric O3-NOx-hydrocarbon chemistry, 2, Model evaluation and global ozone budget, submitted to Journal of Geo- physical Research, 1997b) (hereinafter referred to as Wang et al., submitted manuscript, 1997b) estimates an annual mean odd oxy- gen source of 59 Tmol yr -1 in the northern hemisphere tropo- sphere and 19 Tmol yr -] for middle and high northern latitudes (30ø-90øN). Low latitudes dominate the hemispheric 03 budget because of the large OPEs. Our results suggest that U.S. pollu- tion makes only a small contribution to 03 on the scale of the northern hemisphere troposphere but is important on the scale of the extratropical latitudes.
7. Conclusions
We have used a continental-scale, three-dimensional photo- chemical model to investigate the budgets of NO.•, species and 03 in the continental boundary layer over the United States and to
LIANG ET AL.: SEASONAL BUDGETS OF REACTIVE NITROGEN SPECIES AND OZONE 13,447
(21)
(1)
) • (37)
(26)
(9) (40)
(10)
I
AM
) • (54)
(32)
(27)
(50)
(22)
!
JA
) • (64)
(35)
0.1 Gmol (NOx + PANs)/day
(39) (30)
SON
(5)
!
/ (42)
(28)
.(19)
Figure 11. Export of NOx + PANs from the U.S. boundary layer and related 03 production efficiency (OPE). The arrows show the seasonal mean export fluxes of NOx + PANs from the U.S. boundary layer to the west, east, south, north, and free troposphere (above 740 hPa) in the model. The central arrow denotes the upward flux to the free tro- posphere. The lengths of the arrows are proportional to the fluxes. The numbers in parentheses are the modeled OPEs (mol/mol) in the U.S. boundary layer (lower left of the central arrows), the four adjacent boundary layer regions (margins of the plots), and the free troposphere (upper right of the central arrows). The definition of OPE is given in the text.
0.8 --
0.6 --
0.4 --
0.2 --
0.0 --
lOO
44
265
197
100
56
• NOx emissions halved I Standard
• NOx emissions doubled
212
175
100
53 53
DJF MAM JJA SON
Figure 12. Seasonal mean export fluxes of (NOx + PANs) from the U.S. boundary layer in the standard simulation and in simulations with halved or doubled NOx emissions. The percentage changes in the export fluxes for each season, relative to the standard simulation (100%), are shown on top of the bars.
13,448 LIANG ET AL.: SEASONAL BUDGETS OF REACTIVE NITROGEN SPECIES AND OZONE
Table 4. Seasonal budgets of ozone in the U.S. boundary layer in the model
Season Summer(JJA), Fall(SON), Winter(DJF), Spring(MAM), Annual, Gmol d -1 Gmol d -1 Gmol d -• Gmol d -• Gmol d -•
Pox 15 Lox 8.7 0 3 deposition 4.7 0 3 export 1.8 Pox from exported NOx and PANs a 11
Pox 13 Lox 4.2 0 3 deposition 2.5 0 3 export 6.5
Standard Simulation
8.5 3.1 8.3 8.8
4.6 2.5 4.8 5.2
2.9 1.4 3.4 3.0
1.0 -1.0 -0.50 0.33
5.9 4.8 11 8.2
Pollution Ozone l'
7.5 2.9 7.9 7.9
2.7 1.7 2.4 2.7
1.2 0.075 1.1 1.2
3.9 1.0 3.9 3.8
The budgets are given for odd oxygen, Ox (Table 1), to account for the rapid interconversion between Ox species. Since 03 is the main com- ponent of O,,, the budgets of 03 and O,, can be regarded as equivalent. Pox and Lox denote chemical production and destruction of O,, within the U.S. boundary layer.
a Estimated O,, production in the remote troposphere contributed by NO,, and PANs molecules exported from the U.S. boundary layer (see text).
b Ozone produced in the U.S. boundary layer from anthropogenic NO,, emitted within the region; its budget is obtained by subtracting the 03 budget in the zero-NO,, simulation from the 03 budget in the standard simulation.
estimate the exports of these species to the global atmosphere in different seasons. The model indicates a large seasonal variation of the NO,,/NOy ratio in the U.S. boundary layer, with values ranging from 0.2 in summer to 0.6 in winter; this result is con- sistent with observations at Harvard Forest, Massachusetts. The
seasonal variation of the NO,,/NOy ratio is driven principally by the seasonal variation of the NO,, chemical lifetime. Formation of hydroxy organic nitrates from the oxidation of isoprene, fol- lowed by decomposition of these organic nitrates to HNO3,
The export of fossil fuel combustion NO,, and PANs from the U.S. boundary layer is estimated to be 1.4 Tg N yr -•. This export represents an important source of NO,, to the northern hemisphere troposphere, comparable to the source from lightn- ing. On the basis of model-derived 03 production efficiencies for the remote troposphere, we estimate that the NO,, and PANs exported from the United States eventually yield 8 Gmol d -1 of 03 on a global scale. In comparison, direct export of 03 pollution from the U.S. boundary layer in the model amounts to 4 Gmol
accounts for 30% of the NO,, sink in summer in our model. d -•. We conclude that the effect of U.S. pollution on global tro- Recent laboratory measurements by P.B. Shepson (personal com- pospheric 03 is determined principally, and in all seasons, by the munication, 1997) indicate a 4.4% yield of hydroxy organic export of NO,, and PANs from the continental boundary layer. nitrates from oxidation of isoprene, lower than the 12% yield used here [Tuazon and Atkinson, 1990; Paulson and Seinfeld, 1992; Atkinson, 1994] and implying a smaller role of these nitrates in the summertime budget of NOy, The fraction of NOy present as PANs in the U.S. boundary layer in the model is highest in spring (25% of total NOy), reflecting a combination of active photochemistry and low temperatures. Year-round obser- vations of NOy speciation (including PANs) at U.S. sites would be extremely valuable for testing our understanding of the sea- sonal variation in the NO). budget.
We find in the model that 25-35% of NOx emitted in the United States is exported as NO), out of the continental boundary layer depending on season and that 60-80% of this export is in the form of NOx or PANs and hence available to lead to 03 pro- duction in the remote troposphere. The fraction of NOy present as NO• or PANs in the exported air is larger than one would expect based on the speciation of concentrations in the U.S. boundary layer, because much of the export (especially in sum- mer) takes place in wet convective updrafts where HNO 3 is efficiently scavenged.
The response of NO). export to change in NO• emissions in the United States is found to be less than proportional in summer and more than proportional in winter, reflecting a seasonal transi- tion in the photochemical regime of the continental boundary layer. Doubling NO• emissions would increase the total export of NO• and PANs by only 75% in summer but by 165% in winter.
Acknowledgements. This work was supported by the National Oce- anic and Atmospheric Administration (NA46GP0138), the National Sci- ence Foundation (NSF-ATM-96-12282), and the National Aeronautics and Space Administration (NASA-NAGW-2632 and NASA-NAG5- 2688).
References
Atkinson, R., Gas-phase tropospheric chemistry of organic com- pounds: A review, J. Phys. Chem. Ref Data, Monogr., 2, 1- 216, 1994.
Atkinson, R., D.L. Baulch, R.A. Cox, R.F. Hampson, J.A. Kerr, and J. Troe, Evaluated kinetic and photochemical data for atmospheric chemistry, IV, IUPAC subcommittee on gas kinetic data evaluation for atmospheric chemistry, Atmos. Environ., Part A, 26, 1187-1230, 1992.
Balkanski, Y.J., D.J. Jacob, G.M. Gardner, W.C. Graustein, and K.K. Turekian, Transport and residence times of tropospheric aerosols inferred from a global three-dimensional simulation of 2•øpb, J. Geophys. Res. 98, 20,573-20,586, 1993.
Baughcum, S.L., T.G. Tritz, S.C. Henderson, and D.C. Pickett, Scheduled civil aircraft emission inventories for 1992: Data- base development and analysis, Rep. NASA CR-4700, NASA, Washington, D.C., 1996.
Benkovitz, C.M., M.T. Schultz, J. Pacyna, L. Tarrason, J. Dig- non, E.C. Voldrier, P.A. Spiro, J.A. Logan, and T.E. Graedel,
LIANG ET AL.: SEASONAL BUDGETS OF REACTIVE NITROGEN SPECIES AND OZONE 13,449
Global gridded inventories for anthropogenic emissions of sulfur and nitrogen, J. Geophys. Res., 101, 29,239-29,253, 1996.
Chameides, W.L., F. Fehsenfeld, M.O. Rodgers, C. Cardetino, J. Martinez, D. Parrish, W. Lonneman, D.R. Lawson, R.A. Rasmussen, P. Zimmerman, J. Greenberg, P. Middleton, and T. Wang, Ozone precursor relationships in the ambient atmo- sphere, J. Geophys., Res. 97, 6037-6055, 1992.
Chin, M., D.J. Jacob, G.M. Gardner, M.S. Foreman-Fowler, P.A. Spiro, and D.L. Savoie, A global three-dimensional model of tropospheric sulfate, J. Geophys. Res., 101, 18,667-18,690, 1996.
Crutzen, P.J., The role of NO and NO2 in the chemistry of the troposphere and stratosphere, Ann. Rev. Earth Planet. Sci., 7, 443-472, 1979.
DeMore, W.B., S.P. Sander, D.M. Golden, R.F. Hampson, M.J. Kurylo, C.J. Howard, A.R. Ravishankara, C.E. Kolb, and M.J. Molina, Chemical kinetics and photochemical data for use in stratospheric modeling, Evaluation No. 11, JPL Publ., 94-1, Jet Propul. Lab., Pasadena, Calif., 1994.
Dentener, F.J., and P.J. Crutzen, Reaction of N205 on tropos- pheric aerosols: impact on the global distribution of NOx, 03, and OH, J. Geophys. Res., 98, 7149-7163, 1993.
Doddridge, B.G., R.R. Dickerson, R.G. Wardell, K.L. Civerolo. and L.J. Nunnermacker, Trace gas concentrations and meteorology in rural Virginia, 2, Reactive nitrogen com- pounds, J. Geophys. Res., 97, 20,631-20,646, 1992.
Environment Canada, Estimation of the effects of various muni- cipal waste management strategies on greenhouse gas emis- sions, summary report, Ottawa, Ontario, Canada, 1995.
Fiore, A.M., D.J. Jacob, J.A. Logan, and J.H. Yin, Trends in ground level ozone over the contiguous United States from 1980 to 1995, in press, 1997.
Galloway, J.N., D.M. Whelpdale, and G.T. Wolff, The flux of S and N eastward from North America, Atmos. Environ., 12, 2595-2607, 1984.
Goldstein, A.H., S.-M. Fan, M.L. Goulden, J.W. Munger, and S.C. Wofsy, Emissions of ethene, propene, and 1-butene by a midlatitude forest, J. Geophys. Res., 101, 9149-9157, 1996.
Gregory, G.L., and A.D. Scott, Compendium of NASA data base for the Global Tropospheric Experiment' s Pacific Exploratory Mission-West A (PEM-West A), Rep. NASA TM-109177, NASA, Hampton, Va., 1995a.
Gregory, G.L., and A.D. Scott, Compendium of NASA data base for the global tropospheric experiment's Pacific Exploratory Mission-West B (PEM-West B), Rep. NASA TM-110193, NASA, Hampton, Va., 1995b.
Grosjean, D., E. Grosjean, and E.L. Williams, Thermal decom- position of PAN, PPN, and vinyl-PAN, J. Air & Waste Manage. Assoc., 44, 391-396, 1994.
Guenther, A., C.N. Hewitt, D. Erickson, R. Fall, C. Geron, T. Graedel, P. Harley, L. Klinger, M. Lerdau, W.A. Mckay, T. Pierce, B. Scholes, R. Steinbrecher, R. Tallamraju, J. Taylor, and P. Zimmermann, A global model of natural volatile organic compound emissions, J. Geophys. Res., 100, 8873- 8892, 1995.
Hansen, J., G. Russell, D. Rind, P. Stone, A. Lacis, S. Lebedeff, R. Ruedy, and L. Travis, Efficient three-dimensional global models for climate studies: Models I and II, Mon. Weather Rev., 111, 609-662, 1983.
Holzworth, G.C., Mixing depths, wind speeds and air pollution potentials for selected locations in the United States, J. Appl. Meteorol., 6, 1039-1044, 1967.
Horowitz, L.W., J. Liang, G.M. Gardner, and D.J. Jacob, Export of reactive nitrogen from North America during summertime: Sensitivity to hydrocarbon chemistry, J. Geophys. Res., this issue.
Intergovernmental Panel on Climate Change (IPCC), Climate
Change 1994, edited by J.T. Houghton et al., p. 99, Cam- bridge Univ. Press, New York, 1995.
Jacob, D.J., and M.J. Prather, Radon-222 as a test of convective transport in a general circulation model, Tellus, Ser. B, 118- 134, 1990.
Jacob, D.J., et al., Simulation of summertime ozone over North America, J. Geophys. Res., 98, 14,797-14,816, 1993a.
Jacob, D.J., J.A. Logan, G.M. Gardner, R.M. Yevich, C.M. Spivakovsky, S.C. Wofsy, S. Sillman, and M.J. Prather, Fac- tors regulating ozone over the United States and its export to the global atmosphere, J. Geophys. Res., 98, 14,817-14,826, 1993b.
Jacob, D.J., L.W. Horowitz, J.W. Munger, B.G. Heikes, R.R. Dickerson, R.S. Artz, and W.C. Keene, Seasonal transition from NOx- to hydrocarbon-limited ozone production over the eastern United States in September, J. Geophys. Res., 100, 9315-9324, 1995.
Jacob, D.J., and 29 others, Evaluation and intercomparison of global atmospheric transport models using 222Rn and other short-lived tracers, J. Geophys. Res., 102, 5953-5970, 1997.
Jacobson, M.Z., and R.P. Turco, SMVGEAR: a sparse-matrix, vectorized Gear code for atmospheric models, Atmos. Environ., Part A, 28, 273-284, 1994.
Kasibhatla, P.S., H. Levy II, and W.J. Moxim, Global NOx, HNO3, PAN, and NO,. distributions from fossil fuel combus- tion emissions: A model study, J. Geophys. Res., 98, 7165- 7180, 1993.
Kirchner, F., and W.R. Stockwell, Effect of peroxy radical reac- tions on the predicted concentrations of ozone, nitrogenous compounds, and radicals, J. Geophys. Res., 101, 21,007- 21,022, 1996.
Liang, J., and D.J. Jacob, Effect of aqueous-phase cloud chemis- try on tropospheric ozone, J. Geophys. Res., 102, 5993-6001, 1997.
Liu, S.C., M. Trainer, F.C. Fehsenfeld, D.D. Parrish, E.J. Willi- ams, D.W. Fahey, G. Hubler, and P.C. Murphy, Ozone production in the rural troposphere and the implications for regional and global ozone distributions, J. Geophys. Res., 92, 4191-4207, 1987.
Logan, J.A., Nitrogen oxides in the troposphere: Global and regional budgets, J. Geophys. Res., 88, 10,785-10,807, 1983.
Logan, J.A., Ozone in rural areas of the United States, J. Geo- phys. Res., 94, 8511-8532, 1989.
Logan, J.A., M.J. Prather, S.C. Wofsy, and M.B. McElroy, Tro- pospheric chemistry, A global perspective, J. Geophys. Res., 86, 7210-7254, 1981.
Maricq, M. M., and J. J. Szente, Kinetics of the reaction between ethylperoxy radical and nitrogen oxide, J. Phys. Chem., 100, 12,374-12,379, 1996a.
Maricq, M. M., and J. J. Szente, Temperature-dependent study of the reaction between peroxyacetyl radicals and nitrogen oxide, J. Phys. Chem., 100, 12,380-12,385, 1996b.
McKeen, S.A., E.-Y. Hsie, and S.C. Liu, A study of the depen- dence of rural ozone on ozone precursors in the eastern United States, J. Geophys. Res., 96, 15,377-15,394, 1991.
Monson, R.K., P.C. Harley, M.E. Litrak, M. Wildermuth, A.B. Guenther, and P.R. Zimmermann, Environmental and development controls over the seasonal pattern of isoprene emission from aspen leaves, Oecologia, 99, 260-270, 1994.
Mozurkewich, M., and J. G. Calvert, Reaction probability of N20 5 on aqueous aerosols, J. Geophys. Res., 93, 15,889- 15,896, 1988.
Olson, J., World ecosystems (WE1.4): Digital raster data on a 10 minute geographic 1080 x 2160 grid, in Global Ecosystems Database, Version 1.0: Disc A, edited by NOAA Nat. Geo- phys. Data Cent., Boulder, Colo., 1992.
Oltmans, S.J., and H. Levy II, Seasonal cycles of surface ozone over the western North Atlantic, Nature, 358, 392-394, 1992.

13,450 LIANG ET AL.: SEASONAL BUDGETS OF REACTIVE NITROGEN SPECIES AND OZONE
Paulson, S.E., and J.H. Seinfeld, Development and evaluation of a photooxidation mechanism for isoprene, J. Geophys. Res., 97, 20,703-20,715, 1992.
Perros, P.E., Large-scale distribution of peroxyacetylnitrate from aircraft measurements during the TROPOZ II experiment, J. Geophys. Res., 99, 8269-8279, 1994.
Poulida, O., R.R. Dickerson, B.G. Doddridge, J.Z. Holland, R.G. Wardell, and J.G. Watkins, Trace gas concentrations and meteorology in rural Virginia, 1, Ozone and carbon monox- ide, J. Geophys. Res., 96, 22,461-22,475, 1991.
Prather, M.J., M.B. McElroy, S.C. Wofsy, G. Russell, and D. Rind, Chemistry of the the global troposphere: Fluorocarbons as tracers of air motion, J. Geophys. Res., 92, 6579-6613, 1987.
Shepson, P.B., E. Mackay, and K. Muthuramu, Henry's Law con- stants and removal processes for several atmospheric hydroxy alkyl nitrates, Environ. $ci. Technol., 30, 3618-3623, 1996.
Sillman, S., J.A. Logan, and S.C. Wofsy, A regional scale model for ozone in the United States with subgrid representation of urban and power plant plumes, J. Geophys. Res., 95, 5731- 5748, 1990a.
Sillman, S., J.A. Logan, and S.C. Wofsy, The sensitivity of ozone to nitrogen oxides and hydrocarbons in regional ozone episodes, J. Geophys. Res., 95, 1837-1851, 1990b.
Singh, H.B., Reactive nitrogen in the troposphere, Environ. Sci. Technol., 21, 320-327, 1987.
Singh, H.B., et al., Latitudinal distribution of reactive nitrogen in the free troposphere over the Pacific Ocean in late winter/early spring, J. Geophys. Res., in press, 1997.
Sirois, A., and J.W. Bottenheim, Use of backward trajectories to interpret the 5-year record of PAN and 03 ambient air con- centrations at Kejirnkujik National Park, Nova Scotia, J. Geophy. Res., 100, 2867-2881, 1995.
Spivakovsky, C.M., R. Yevich, J.A. Logan, S.C. Wofsy, M.B. McElroy, and M.J. Prather, Tropospheric OH in a three- dimensional chemical tracer model: An assessment based on
observations of CH3CC13, J. Geophys. Res., 95, 18,441- 18,472, 1990.
Thompson, A.M., K.E. Pickering, R.R. Dickerson, W.G. Ellis, D.J. Jacob, J.R. Scala, W.-K. Tao, D.P. McNamara, and J. Simpson, Convective transport over the central United States and its role in the regional CO and ozone budgets, J. Geo- phys. Res., 99, 18,703-18,711, 1994.
Trainer, M., E.J. Williams, D.D. Parrish, M.P. Burr, E.J. Allwine, H.H. Westberg, F.C. Fehsenfeld, and S.C. Liu, Models and observations of the impact of natural hydrocar- bons on rural ozone, Nature, 329, 705-707, 1987.
Tuazon, E.C., and R. Atkinson, A product study of the gas-phase reaction of isoprene with the OH radical in the presence of NOx, lnt. J. Chem. Kinet., 22, 1221-1236, 1990.
U.S. Environmental Protection Agency (U.S. EPA), The 1985 NAPAP emission inventory (version 2): Development of the annual data and modeler's tapes, Rep. EPA-600/7-89-O12a, Research Triangle Park, N. C., 1989.
U.S. EPA, National air pollutant emissions estimates, 1900-1994, Rep. EPA-454/R-95-011, Research Triangle Park, N. C., 1995.
U.S. National Acid Precipitation Assessment Program (NAPAP), 1990 integrated assessment report, Off. of the Dir., Washing- ton, D.C., 1991.
Wesely, M.L., Parameterization of surface resistance to gaseous dry deposition in regional-scale numerical models, Atmos. Environ., 23, 1292-1304, 1989.
A.M. Fiore, G. M. Gardner, L.W. Horowitz, D. J. Jacob (corresponding author), J. A. Logan, J. W. Munger, and Y. Wang, Department of Earth and Planetary Sciences, Harvard University, Cambridge, MA 02138. (e-mail: djj @io.harvard.edu)
J. Liang, Department of Civil and Environmental Engineer- ing, Stanford University, Stanford, CA 94041. (e-mail: j liang @ standord.edu)
(Received March 26, 1997; revised October 21, 1997; accepted October 29, 1997.)