seasonal changes in the mixed and barrier layers in …
TRANSCRIPT
BRAZILIAN JOURNAL OF OCEANOGRAPHY, 53(3/4) :83-98, 2005
SEASONAL CHANGES IN THE MIXED AND BARRIER LAYERS IN THE WESTERN EQUATORIAL ATLANTIC
Alex Silva1, Moacyr Araujo1,2,*, Carmen Medeiros1,2, Marcus Silva1 & Bernard Bourles3
1Universidade Federal de Pernambuco Laboratório de Oceanografia Física Estuarina e Costeira, Departamento de Oceanografia
(Av. Arquitetura S/N, Campus Universitário, 50740-550, Recife, PE, Brasil)
2Conselho Nacional de Desenvolvimento Científico e Tecnológico - CNPq Fellow
3Centre IRD de Bretagne,Technopole Pointe du Diable
(B.P. 70, 29280 Plouzane, France)
A B S T R A C T
Climate is closely related to the dynamics of the surface layer of the tropical Atlantic and the exchange between this latter and the atmosphere, and wearther forecasting will improve with increasing understanding of the processes that govern the relative distribution of thermodynamic properties of the water column. This paper focuses on the isolation of warm surface waters from the cold ones of the deep ocean by a salinity induced barrier layer (BL) in the western equatorial Atlantic (3oS-7oN; 40o-52ºW), based on 487 CTD profiles (REVIZEE- 1995-2001). The main process contributing to the seasonal BL formation is the discharge of low salinity waters from the Amazon river. During boreal late winter/spring (Mar-May; high river discharge), deeper isothermal (ZT) and mixed layers (ZM) prevail and the formation of a 16m-thick BL was clearly determined the formation of a salt-induced marked pycnocline within a deeper isothermal layer. However, during the boreal autumn (Oct-Dec; low river discharge), density stratification was mainly determined by temperature distribution (ZM≅ ZT; BLT = ZM - ZT ≅ 0). There was no clear register of a BL on the Amazon shelf, but a maximum BL (40 m) formed near the shelf break at 45°W.
R E S U M O
O clima está fortemente relacionado com a dinâmica da camada superficial do Atlântico tropical e com as trocas entre esta e a atmosfera, e a previsão do tempo melhorará à medida em que ganhemos um melhor entendimento dos processos que governam a distribuição relativa das propriedades termodinâmicas na coluna d’água. O presente trabalho focaliza o isolamento das águas quentes superficiais das águas frias profundas pela camada de barreira (CB) induzida pela salinidade no Atlântico Equatorial Oeste (3oS-7oN; 40o-52ºW), com base em 487 perfis de CTD (REVIZEE – 1995-2001). O principal processo que contribue para a formação sazonal da CB é a descarga fluvial de águas doces do rio Amazonas. Durante o final do inverno/primavera boreal (Mar-Mai; alta descarga), prevalecem camadas isotérmica (ZT) e de mistura (ZM) mais profundas e a formação de uma CB com 16m de espessura foi governada pelo estabelecimento de uma forte picnoclina induzida pela salinidade, no interior da camada isotérmica. Entretanto, durante o outono boreal (Out-Dez; baixa descarga), estratificações em densidade foram principalmente controladas pela distribuição de temperatura (ZM≅ ZT; ECB = ZM - ZT ≅ 0). Embora não tenha registrado uma CB sobre a plataforma Amazônica, uma CB máxima (40m) foi formada próxima à quebra da plataforma a 45°W.
Descriptors: Halocline, Thermocline, Heat exchange, Coastal waters, Barrier layer, Amazon, Lat 3°S-7°N; Long 40°W-52°W. Descritores: Haloclina, Termoclina, Trocas de Calor, Águas Costeiras, Camada Barreira, Amazonas, Lat 3°S-7°N; Long 40°W-52°W.
__________ (*) Corresponding author 1 - Brazilian Program for Assessing the Sustainable Potential of the Live Resources of the Exclusive Economic Zone

INTRODUCTION
Recent research indicates that overall
climate on weather forecasting predictions will be greatly improved when the dynamics of the tropical Atlantic are taken into account. Enfield (1996) suggests that climate responses in the inter-American region associated with the Tropical Atlantic Variability (TAV) are comparable to those of the El-Niño Southern Oscillation (ENSO) in the Pacific. The effects of tropical Atlantic Sea Surface Temperature Anomalies (SSTA) upon rainfall patterns in Northeastern Brazil (Nobre & Shukla, 1996) and in Northwestern Africa (Folland et al., 1986) have been well documented. Them modeling experiments of Lau & Nath (1994) and of Saravanan & Chang (2000) corroborate the greater importance of the tropical over the extra-tropical Atlantic ocean for the large-scale climatic models. These studies have revealed that, with the exception of the equatorial Pacific and of the west coast of South America, the western tropical Atlantic presents a strong correlation with the Indo-Pacific effects of ENSO. There is a significant correlation at lags of a few months between the Pacific ENSO and the development of SSTA in the tropical Atlantic (Enfield and Mayer, 1997; Penland and Matrasova, 1998) and many studies have examined the role of the ENSO as external/remote stimulus for the equatorial (Zebiak, 1993; Chang et al., 1997) and dipole (Servain, 1991; Huang and Shukla, 1997) modes of low-frequency variabilities observed in this oceanic region. Furthermore, the western tropical Atlantic plays a fundamental role in heat exchange with the North Brazil Current (NBC) carrying southern warm waters toward the Northern Hemisphere (Metcalf, 1968; Stramma et al., 1995).
The occurrence of an isohaline layer that is shallower than the isothermal layer in the tropical oceans has been studied since the Meteor cruises of 1936 (Defant, 1961). The barrier layer (BL), the layer between the halocline and the thermocline (Lukas & Lindström, 1991) may isolate the upper isohaline layer from the cold thermocline waters, affecting the ocean heat budget and the ocean exchanges with the atmosphere (Swenson and Hansen, 1999; Pailler et al., 1999).
An important number of recent studies on BL and related physical mechanisms have focused a the Pacific ocean. Initially it was through that the heavy precipitation in the western portion of that ocean basin was the main mechanism accounting for BL formation (e.g. Sprintall and Tomczak, 1992; Ando & McPhaden, 1997). However, more recent works show that the thick, climatologically important BL in the western Pacific is due to eastward fresh jets
flowing over subducted salty water, as demonstrated by the modelling studies of Vialard & Delecluse (1998a,b), using an OGCM with realistic daily forcing. Lukas & Lindström (1991) and You (1998), have registered 20-40 m thick BL in the equatorial Pacific; Kara et al. (2000) have observed BL up to 50 m thick in the north Pacific; and Cronin & McPhaden (2002) recently analysed BL responses to westerly wind gusts over the Tropical Atmosphere Ocean (TAO) array. In this last paper the authors present interesting drawings illustrating the main mechanisms by which BL may form and spread grow.
More general charts of the seasonal variability of BL thickness in the tropical oceans (30oS-30oN) are given by Sprintall & Tomczak (1992), and were obtained using Levitus´s (1982) climatological dataset to determine the extent of the influence of salinity on the depth of the mixed layer. These charts suggest that the subduction of subtropical salty surface waters toward the equator during winter and their advection by the equatorial current system might be the mechanism by which the BL is formed in the western equatorial Atlantic. This idea is partially supported by the presence of subsurface maximum salinity water along the western Atlantic boundary (Pailler et al., 1999; Stramma et al., 2005). These authors suggest that this water, formed in the Southern Hemisphere subtropical gyre, is entrained into the region within the North Brazil Undercurrent – NBUC that flows northwestward along the Brazilian continental slope (Stramma et al., 1995, 2005).
Pailler et al. (1999) using 350 CTDs profiles, have show the importance of large continental river flows in inducting shallower pycnoclines within the isothermal layers of the tropical Atlantic. They have indicated that fresh water from the Amazon could induce a marked pycnocline in the 3-30 m depth range, creating a thick BL (>40m) that could extend over a large portion of the equatorial Atlantic basin during northern summer-autumn. Numerical experiments by Masson & Delecluse (2001) replicated field observations, and suggested that a large portion of the solar radiation might be trapped in the BL in the tropical Atlantic.
The presence and the formation of salinity induced barrier layers at the western equatorial boundary of the Atlantic ocean (3oS-7oN; 40o-52W), as a result of the near surface input of the low salinity waters of the Amazon and Pará rivers are investigated in this present article. The analysis is based on in situ high vertical resolution conductivity-temperature-depth (CTD) profiles obtained during the Brazilian REVIZEE Program.
84 BRAZILIAN JOURNAL OF OCEANOGRAPHY, 53(3/4), 2005
DATA AND METHODOLOGY
Study Area and Data Collection
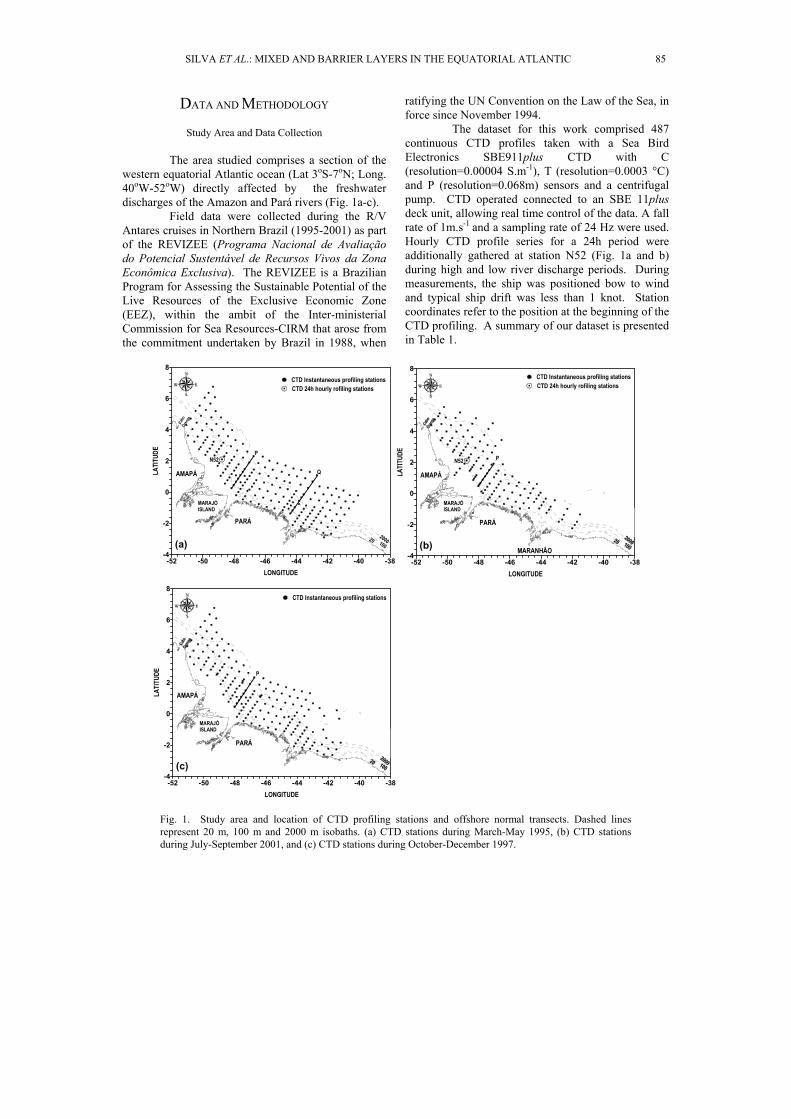
The area studied comprises a section of the western equatorial Atlantic ocean (Lat 3oS-7oN; Long. 40oW-52oW) directly affected by the freshwater discharges of the Amazon and Pará rivers (Fig. 1a-c).
Field data were collected during the R/V Antares cruises in Northern Brazil (1995-2001) as part of the REVIZEE (Programa Nacional de Avaliação do Potencial Sustentável de Recursos Vivos da Zona Econômica Exclusiva). The REVIZEE is a Brazilian Program for Assessing the Sustainable Potential of the Live Resources of the Exclusive Economic Zone (EEZ), within the ambit of the Inter-ministerial Commission for Sea Resources-CIRM that arose from the commitment undertaken by Brazil in 1988, when
ratifying the UN Convention on the Law of the Sea, in force since November 1994.
The dataset for this work comprised 487 continuous CTD profiles taken with a Sea Bird Electronics SBE911plus CTD with C (resolution=0.00004 S.m-1), T (resolution=0.0003 °C) and P (resolution=0.068m) sensors and a centrifugal pump. CTD operated connected to an SBE 11plus deck unit, allowing real time control of the data. A fall rate of 1m.s-1 and a sampling rate of 24 Hz were used. Hourly CTD profile series for a 24h period were additionally gathered at station N52 (Fig. 1a and b) during high and low river discharge periods. During measurements, the ship was positioned bow to wind and typical ship drift was less than 1 knot. Station coordinates refer to the position at the beginning of the CTD profiling. A summary of our dataset is presented in Table 1.
100
200020
PARÁ
AMAPÁ
MARAJÓISLAND
Cabo
Orange
-52 -50 -48 -46 -44 -42 -40 -38LONGITUDE
-4
-2
0
2
4
6
8
LATI
TUDE
CTD Instantaneous profiling stations
(a)
PARÁ
AMAPÁ
-52 -50 -48 -46 -44 -42 -40 -38LONGITUDE
-4
-2
0
2
4
6
8
LATI
TUDE
PARÁ
MARANHÃO
AMAPÁ
-52 -50 -48 -46 -44 -42 -40 -38LONGITUDE
-4
-2
0
2
4
6
8
LATI
TUDE
(c)
(b)
N52P
CTD 24h hourly rofiling stations
CTD Instantaneous profiling stationsCTD 24h hourly rofiling stations
CTD Instantaneous profiling stations
N52
MARAJÓISLAND
MARAJÓISLAND
P
P
Q
Fig. 1. Study area and location of CTD profiling stations and offshore normal transects. Dashed lines represent 20 m, 100 m and 2000 m isobaths. (a) CTD stations during March-May 1995, (b) CTD stations during July-September 2001, and (c) CTD stations during October-December 1997.
SILVA ET AL.: MIXED AND BARRIER LAYERS IN THE EQUATORIAL ATLANTIC 85

Table 1. Summary of CTD measurements taken during the REVIZEE expedition in Northern Brazil (1995-2001).
Amazonian hydrology Record period No. Cruises No. CTD profiles
High discharge Mar–May /1995 4 172
High discharge May/1999 1 1-24 hour
Low discharge Oct–Dec/1997 5 177
Transition discharge Jul–Sep/2001 4 138 + 1-24hour
Hydrographical measurements taken at distinct times during the year were used to build seasonal charts of the spatial distribution of isothermal depth, mixing depth and BL thickness, associated with the seasonal variation of the Amazon/Pará river discharges (Carton 1991; Nittrouer and DeMaster, 1996). The Mar-May period (boreal late winter/spring) corresponds to that of high river discharges while the October-December period (boreal autumn) to that of low river discharges. The periods July-September (boreal summer) and January-March (boreal winter) are transitional, respectively, from high to low and from low to high Amazonian discharges. This hydrological seasonality was corroborated by simultaneous observations of the spreading of the Amazon river plume (Silva and El-Robrini, 2003) and is also in agreement with recent field measurements (Molinier et al, 1997, 1999; Project HiBAm, 2003) as well as previous estimations (Perry et al., 1996).
Criteria for Determining Isothermal (ZT) and Mixed (ZM) Layers
Most criteria used for determining
isothermal and mixed layers in the ocean require that the deviation of the temperature T (or density, tσ ) from its surface value be smaller than a certain fixed value (Sprintall & Tomczak, 1990; Brainerd & Gregg, 1995). Normally assumed deviation from surface values for evaluating ZT varies from 0.5oC (Wyrtki, 1964; Monterrey & Levitus, 1997) to 0.8oC (Kara et al., 2000). ZM is estimated as the depth at which density is equal to the sea surface value plus an increment tσ∆ equivalent to a desired net decrease in temperature. Miller (1976) and Spall (1991), e.g., use ( )0125.0 tt σσ =∆ for determining mixed layer depth, while Sprintall and Tomczak (1992) and
Ohlmann et al. (1996) adopt
( )TC to
t ∂∂=∆ /5.0 σσ , where Tt ∂∂ /σ is the coefficient of thermal expansion.
Following Sprintall and Tomczak (1992), in this paper the authors evaluate isothermal and mixed layer depths (ZT and ZM) in terms of temperature and density steps - T∆ = 0.5oC and
( )TC to
t ∂∂=∆ /5.0 σσ - from the sea surface
temperature and density ( ( )0T and ( )0tσ ) as obtained from CTD profiles :
( )( )TTTzZT ∆−== 0 (1)
( )
∆
∂∂
+== TT
zZ tttM
σσσ 0 (2)
where Tt ∂∂ /σ is calculated as a function of the surface temperature and salinity (Blanck, 1999). The SBE 911plus CTD has two thermometers, whose accuracy is about 0.001oC. Thus, for a
CT o5.0=∆ , the error in computing ZT is around 0.2 % of local ZT.
Barrier layer thickness (BLT) may be easily calculated as:
TM ZZBLT −= (3)
When density stratification is exclusively determined by temperature, the isothermal layer depth becomes equivalent to the mixed layer depth and
86 BRAZILIAN JOURNAL OF OCEANOGRAPHY, 53(3/4), 2005

0=BLT . A particular situation arises when near surface distribution of salinity is anywhere sufficiently strong to induce a pycnocline inside the isothermal
layer, or TM ZZ < . In this case 0>BLT and
the warm surface waters may be maintained isolated from the cool thermocline waters.
MIXED AND BARRIER LAYER VARIABILITY IN
THE WESTERN EQUATORIAL ATLANTIC
General statistics
Given the relative homogeneity in the spatial distribution of hydrographic stations (Fig. 1a-c), low order statistical results may be used as first indicators of the extension of BL occurrence in the study area. The relationship between isothermal ( TZ ) and mixed
( MZ ) depths in distinct seasonal periods are presented in Fig. 2a-c, which shows the observed relationships between isothermal and mixed depths. The continuous diagonal lines represent the limit where ( MT ZZ = ) and the BLT is nil (i.e., no longer exists), while the dashed lines delimitate the region of the graph in which most of the pairs ( MT ZZ , ) are concentrated.
During the period of high river discharge (Mar-May) a BL 2-58 m thick (mean=16m) was present (here considered as BLT≥2 m) at 81% of the stations sampled. ZT and ZM pairs are distributed in the left-side triangle of the scatter diagram, and typical values of isothermal and mixed layers are smaller than 80 m (Fig 2a).
During the period of transition from high to low river discharges (Jul-Sep), although 30% of the CTD profiles indicated the presence of a BL, their distribution (Fig. 2b) differed from that found during the high discharge period. In Jul-Sep, higher values (above 100 m) were observed for isothermal layers, while most of the mixed depths were situated between 10 and 40 m and BL thickness varied from 5 to 25 m (mean=3 m). Isothermal and mixed layer depths showed a similar trend, indicating that density stratification during this period is mainly determined by temperature distribution (ZM≅ ZT, and 0≅BLT ).
The lowest BL frequency was found during Oct-Dec, when river discharges were also low (Fig. 2c). In this season, the BL was never thicker then 48m, and, on average, 9m thinner (Fig. 2c) than that of the high discharge season. During this period, density stratification is also mainly determined by temperature distribution, and the BL was present at 48% of the hydrographic stations.
0 20 40 60 80 100 120Z (m)
0
20
40
60
80
100
120
Z (m
)
0 20 40 60 80 100 120Z (m)
0
20
40
60
80
100
120
Z (m
)
High Discharge (Mar - May)
Low Discharge (Oct - Dec)
0 20 40 60 80 100 120Z (m)
0
20
40
60
80
100
120
Z (m
)
Transition Discharge (Jul - Sept)
M
TT
T
M
M
a
b
c
Fig. 2. Scatter diagrams (ZM vs. ZT) of the western equatorial Atlantic (3oS-7oN, 40oW-52oW) for three selected periods: (a) Mar-May - boreal spring/peak flow of the Amazon River; (b) July-September - boreal summer and transition period from high to low Amazonian discharges; and (c) October-December - boreal autumn and lowest continental flows.
SILVA ET AL.: MIXED AND BARRIER LAYERS IN THE EQUATORIAL ATLANTIC

Spatial Distribution
The circulation pattern in the equatorial Atlantic ocean is quite complex: strong quasi-zonal westward currents and eastward countercurrents coexist within the thermocline and subthermocline layers (Schott et al., 1995, 1998; Boebel et al., 1999; Bourlès et al., 1999, 2002). In addition, seasonal variations in horizontal advection play an important role in the net surface heat flux and ocean heat budget (Hastenrath, 1977; Merle, 1980). In this section the seasonal variation of the spatial distribution of BLT in the western equatorial Atlantic, limited to 3oS-7oN and 40oW-52oW, is discussed
The spatial distribution of isothermal (ZT) and mixed layer (ZM) depths, and BL thickness (BLT) in the western equatorial Atlantic is presented in Figures 3, 4 and 5, respectively, for periods of high
discharge (Mar-May), transition from high to low (Jul-Sep) and of low river discharge (Oct-Dec).
During the high discharge period (Mar-May), the 50 m isoline for ZT approaches the 100 m isobath near the shelf break region. The greatest (around 50 m) values of BLT in Figure 3c are observed on the inner Amazonian shelf, as a result of the spreading of the Amazon freshwater outflow. High BL thickness was also verified along the Pará coast and is mainly induced by increasing trade-wind shear, which transports freshwater lenses southwestward during this boreal spring season (e.g. Geyer et al., 1996). In the same period, high BL thickness (30-50 m) was also verified near the shelf break, concentrated at 42°W, 45°W and 50°W. The development of isothermal and
-52 -50 -48 -46 -44 -42 -40 -38
LONGITUDE
-4
-2
0
2
4
6
8
LATI
TUDE
MarajóIsland
Pará
Amapá
HIGH DISCHARGE Mar - May
0102030405060708090100110125
ZT (m)
100m2000m
P
a
-52 -50 -48 -46 -44 -42 -40 -38
LONGITUDE
-4
-2
0
2
4
6
8
LATIT
UDE
Amapá
MarajóIsland
Pará
HIGH DISCHARGE (Mar - May)
05102030405060708090100110120
ZM(m)
P
b
-52 -50 -48 -46 -44 -42 -40 -38
LONGITUDE
-4
-2
0
2
4
6
8
LATI
TUDE
-5
0
10
20
30
40
50
BL (m)
50
HIGH DISCHARGE (Mar - May) c
P
Amapá
MarajóIsland
Pará
55 105 155 205 255 305 355DISTANCE OFFSHORE (km)
-200
-150
-100
-50
0
DEPT
H (m
)
HIGH DISCHARGE (Mar - May)
ZT
ZMd
Fig. 3. Spatial distribution of isothermal layer depth (ZT), mixed layer depth (ZM), and barrier layer thickness (BLT) during the Amazon river high discharge season (Mar-May) and detail of ZT, ZM and temperature (°C) distribution for a transect in front of the Amazon river mouth.
88 BRAZILIAN JOURNAL OF OCEANOGRAPHY, 53(3/4), 2005
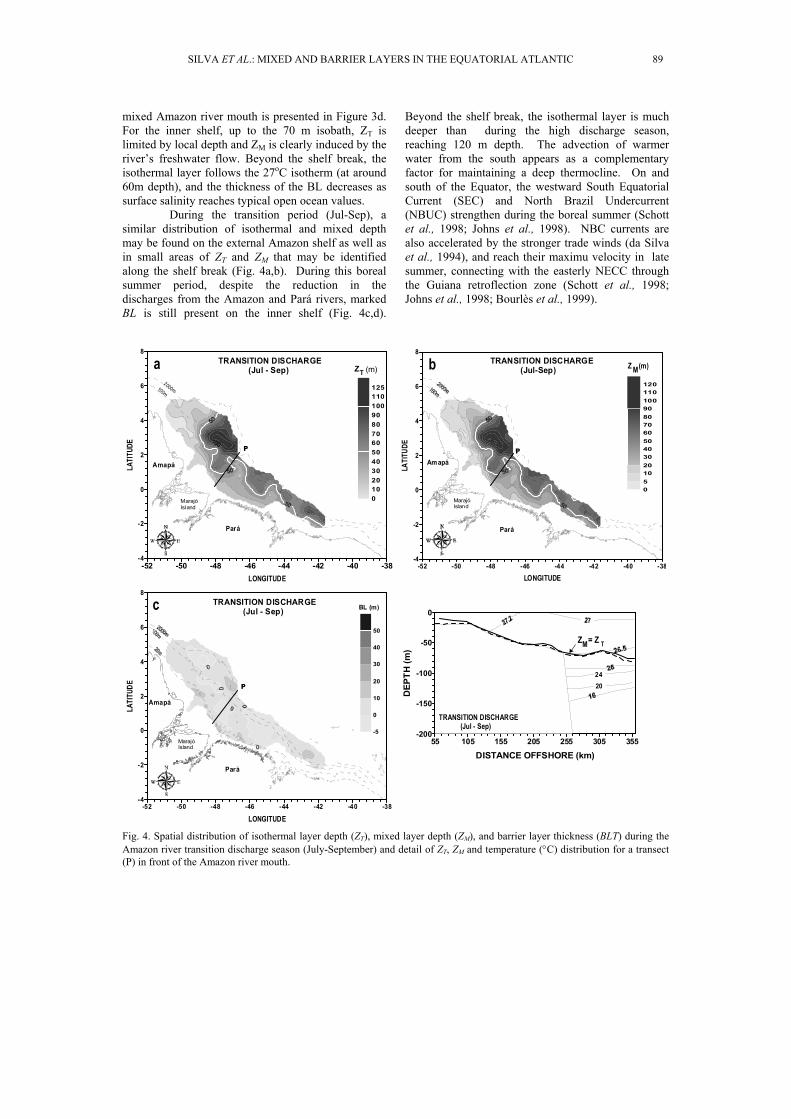
mixed Amazon river mouth is presented in Figure 3d. For the inner shelf, up to the 70 m isobath, ZT is limited by local depth and ZM is clearly induced by the river’s freshwater flow. Beyond the shelf break, the isothermal layer follows the 27oC isotherm (at around 60m depth), and the thickness of the BL decreases as surface salinity reaches typical open ocean values.
During the transition period (Jul-Sep), a similar distribution of isothermal and mixed depth may be found on the external Amazon shelf as well as in small areas of ZT and ZM that may be identified along the shelf break (Fig. 4a,b). During this boreal summer period, despite the reduction in the discharges from the Amazon and Pará rivers, marked BL is still present on the inner shelf (Fig. 4c,d).
Beyond the shelf break, the isothermal layer is much deeper than during the high discharge season, reaching 120 m depth. The advection of warmer water from the south appears as a complementary factor for maintaining a deep thermocline. On and south of the Equator, the westward South Equatorial Current (SEC) and North Brazil Undercurrent (NBUC) strengthen during the boreal summer (Schott et al., 1998; Johns et al., 1998). NBC currents are also accelerated by the stronger trade winds (da Silva et al., 1994), and reach their maximu velocity in late summer, connecting with the easterly NECC through the Guiana retroflection zone (Schott et al., 1998; Johns et al., 1998; Bourlès et al., 1999).
Amapá
Pará
MarajóIsland
TRANSITION DISCHARGE (Jul - Sep)
-52 -50 -48 -46 -44 -42 -40 -38LONGITUDE
-4
-2
0
2
4
6
8
LATI
TUDE
0102030405060708090100110125
ZT (m)
100m
2000m
P
a
-52 -50 -48 -46 -44 -42 -40 -38
LONGITUDE
-4
-2
0
2
4
6
8
LATIT
UDE
Amapá
MarajóIsland
Pará
TRANSITION DISCHARGE (Jul-Sep) Z (m)M
P
05102030405060708090100110120
b
TRANSITION DISCHARGE (Jul - Sep)
-52 -50 -48 -46 -44 -42 -40 -38
LONGITUDE
-4
-2
0
2
4
6
8
LATI
TUDE
-5
0
10
20
30
40
50
BL (m)c
P
Amapá
MarajóIsland
Pará
55 105 155 205 255 305 355
DISTANCE OFFSHORE (km)
-200
-150
-100
-50
0
DEP
TH (m
)
TRANSITION DISCHARGE (Jul - Sep)
Z TZ =M
2420
Fig. 4. Spatial distribution of isothermal layer depth (ZT), mixed layer depth (ZM), and barrier layer thickness (BLT) during the Amazon river transition discharge season (July-September) and detail of ZT, ZM and temperature (°C) distribution for a transect (P) in front of the Amazon river mouth.
SILVA ET AL.: MIXED AND BARRIER LAYERS IN THE EQUATORIAL ATLANTIC 89

The horizontal distributions of isothermal and mixed depths are similar during the boreal autumn-low discharge period (Oct-Dec) (Fig. 5a, b). Thin BL are widely observed over the study area, except for a narrow band from 42°–46°W, where the BL presents significant thickness (Fig. 5c). The computed transect in Fig. 5d shows that isothermal and mixed layer depth coincides along the whole of the profile taken in front of the Amazon mouth, indicating that density stratification is predominantly driven by temperature distribution.
DAILY VARIATION ON THE INNER
AMAZONIAN SHELF
The results presented above confirm the importance of continental freshwater discharges for the BL dynamics in the western Atlantic ocean during the boreal spring and summer seasons. During the boreal summer, the influence of freshwater discharges
at the fixed stations was reduced. This could be due to its displacement northwestward by the NBC and by prevailing southeast winds as demonstrated by Johns et al. (1998). During this period, the pycnocline seems to be determined by temperature stratification. In order to infer the diurnal cycle of heat storage within the isothermal, mixed and barrier layers, two series of 24-hourly CTD profiles were obtained at station N52 (Lat. 2.101oN; Long. 48.741oW, see Fig. 1a,b) on the inner shelf in front of the North Amazon River Channel, at the 25 m isobath. Hourly variation of temperature, salinity and isothermal and mixed layer depth registered on May 20th 1999, during the northern spring/high Amazon flow season is presented in Figs. 6a-c. As similar dataset was again collected on Sep. 13th, 2001, representing the boreal summer, associated with a decreasing Amazon flow (Fig. 7a-c) at the same site.
-52 -50 -48 -46 -44 -42 -40 -38
LONGITUDE
-4
-2
0
2
4
6
8
LATI
TUDE
0102030405060708090100110125
MarajóIsland
Amapá
Pará
ZT (m)
-52 -50 -48 -46 -44 -42 -40 -38
LONGITUDE
-4
-2
0
2
4
6
8LA
TITU
DE
5102030405060708090100110120
Amapá
MarajóIsland
Pará
LOW DISCHARGE (Oct - Dec) ZM(m)
P
b
-52 -50 -48 -46 -44 -42 -40 -38
LONGITUDE
-4
-2
0
2
4
6
8
LATI
TUDE
-5
0
10
20
30
40
50
BL (m)c LOW DISCHARGE (Oct - Dec)
P
Amapá
MarajóIsland
Pará
55 85 115 145 175 205 235 265 295 325 355
DISTANCE OFFSHORE (km)
-200
-150
-100
-50
0
DEP
TH (m
)
LOW DISCHARGE (Out-Dec)
Z M = ZTd
LOW DISCHARGE (Oct - Dec)a
Fig. 5. Spatial distribution of isothermal layer depth (ZT), mixed layer depth (ZM), and barrier layer thickness (BLT) during the Amazon low discharge season (Oct-Dec) and detail of ZT, ZM and temperature (°C) distribution for a transect (P) in front of the Amazon river mouth.
90 BRAZILIAN JOURNAL OF OCEANOGRAPHY, 53(3/4), 2005
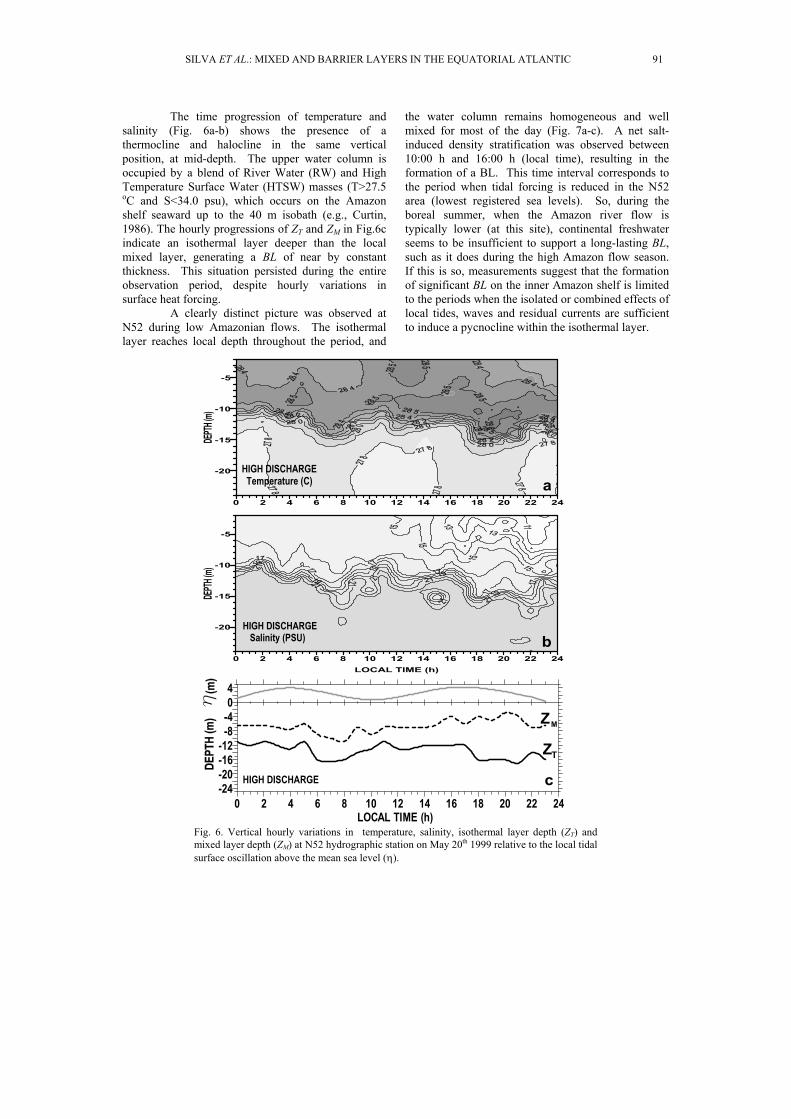
The time progression of temperature and salinity (Fig. 6a-b) shows the presence of a thermocline and halocline in the same vertical position, at mid-depth. The upper water column is occupied by a blend of River Water (RW) and High Temperature Surface Water (HTSW) masses (T>27.5 oC and S<34.0 psu), which occurs on the Amazon shelf seaward up to the 40 m isobath (e.g., Curtin, 1986). The hourly progressions of ZT and ZM in Fig.6c indicate an isothermal layer deeper than the local mixed layer, generating a BL of near by constant thickness. This situation persisted during the entire observation period, despite hourly variations in surface heat forcing.
A clearly distinct picture was observed at N52 during low Amazonian flows. The isothermal layer reaches local depth throughout the period, and
the water column remains homogeneous and well mixed for most of the day (Fig. 7a-c). A net salt-induced density stratification was observed between 10:00 h and 16:00 h (local time), resulting in the formation of a BL. This time interval corresponds to the period when tidal forcing is reduced in the N52 area (lowest registered sea levels). So, during the boreal summer, when the Amazon river flow is typically lower (at this site), continental freshwater seems to be insufficient to support a long-lasting BL, such as it does during the high Amazon flow season. If this is so, measurements suggest that the formation of significant BL on the inner Amazon shelf is limited to the periods when the isolated or combined effects of local tides, waves and residual currents are sufficient to induce a pycnocline within the isothermal layer.
Fig. 6. Vertical hourly variations in temperature, salinity, isothermal layer depth (ZT) and mixed layer depth (ZM) at N52 hydrographic station on May 20th 1999 relative to the local tidal surface oscillation above the mean sea level (η).
0 2 4 6 8 10 12 14 16 18 20 22 24
-20
-15
-10
-5
DEPTH
(m)
0 2 4 6 8 10 12 14 16 18 20 22 24LOCAL TIME (h)
-20
-15
-10
-5
DEPTH
(m)
HIGH DISCHARGE Temperature (C)
HIGH DISCHARGE Salinity (PSU)
0 2 4 6 8 10 12 14 16 18 20 22 24LOCAL TIME (h)
-24-20-16-12
-8-404
HIGH DISCHARGE
ZT
ZM
a
b
c
SILVA ET AL.: MIXED AND BARRIER LAYERS IN THE EQUATORIAL ATLANTIC 91
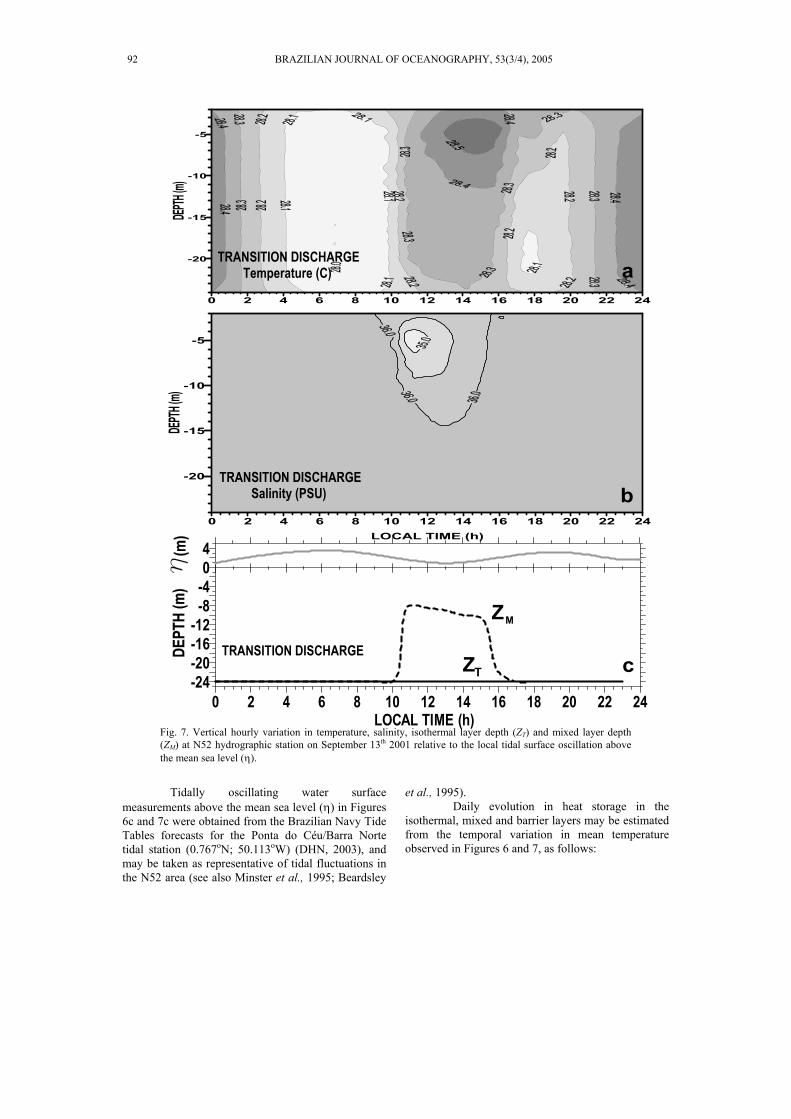
Fig. 7. Vertical hourly variation in temperature, salinity, isothermal layer depth (ZT) and mixed layer depth (ZM) at N52 hydrographic station on September 13th 2001 relative to the local tidal surface oscillation above the mean sea level (η).
Tidally oscillating water surface
measurements above the mean sea level (η) in Figures 6c and 7c were obtained from the Brazilian Navy Tide Tables forecasts for the Ponta do Céu/Barra Norte tidal station (0.767oN; 50.113oW) (DHN, 2003), and may be taken as representative of tidal fluctuations in the N52 area (see also Minster et al., 1995; Beardsley
et al., 1995). Daily evolution in heat storage in the
isothermal, mixed and barrier layers may be estimated from the temporal variation in mean temperature observed in Figures 6 and 7, as follows:
0 2 4 6 8 10 12 14 16 18 20 22 24
-20
-15
-10
-5
DEPTH
(m)
0 2 4 6 8 10 12 14 16 18 20 22 24LOCAL TIME (h)
-20
-15
-10
-5
DEPTH
(m)
TRANSITION DISCHARGE Temperature (C)
TRANSITION DISCHARGE Salinity (PSU)
a
b
cTRANSITION DISCHARGE
0 2 4 6 8 10 12 14 16 18 20 22 24LOCAL TIME (h)
-24-20-16-12-8-404
LOW DISCHARGE ZT
ZM
92 BRAZILIAN JOURNAL OF OCEANOGRAPHY, 53(3/4), 2005

tTZCQ i
iPi ∂∂
= ρ
(4) where iQ (kg.W.m-5) is the heat storage in isothermal ( Ti = ), mixed ( Mi = ), and barrier ( BLi = )
layers; PCρ is the vertically averaged volumetric
heat capacity of the seawater (Blanck, 1999) and T is the vertically averaged temperature of these layers. Vertical average operators applied to the variables in equation (4) are given by:
∫−=0
1
TZTT dz
Zφφ , ∫−=
01
MZMM dz
Zφφ
and ∫−−=
M
T
Z
ZMTBL dz
ZZ1 φφ
(5)
iQ in eq. (4) represents the residual heat stored in each of the layers ( BLorMTi ,= ) as a result of the flux at the ocean-atmosphere interface and of the internal dynamic of the ocean. This later associated whith the penetration of the net interfacial radiation through depth and due to the advective and diffusive transport of thermal energy.
Estimates of major components of the heat balance at the ocean-atmosphere interface ( 0Q ), derived from the COADS dataset (da Silva et al., 1994) for the N52 area during the sampling periods are presented in Table 2. We were able to confirm that the interfacial heat flux is mainly a result of the balance between the incident short wave radiation and
the latent heat lost and of long wave radiation. Furthermore, there are no significant seasonal differences among the components. The occasional differences observed in heat storage in the isothermal, mixed and BL layers between the two periods may be attributed to the distinct levels of radiation penetration in depth and/or the also distinct action of the mechanisms of advection and diffusion of the thermal energy present during these two seasons.
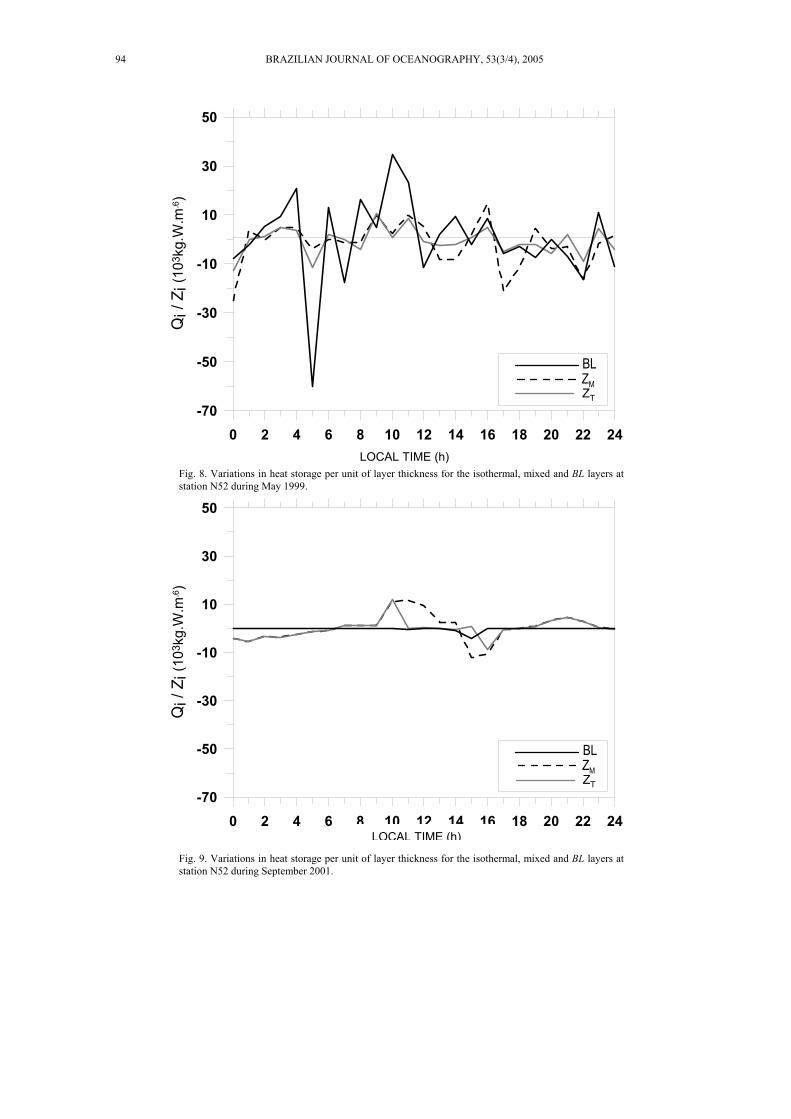
The progression of computed values of heat
storage per unit of layer thickness i
iZ
Q for the
isothermal, mixed and barrier layers during the high and low discharge periods respectively are presented in Figures 8 and 9,
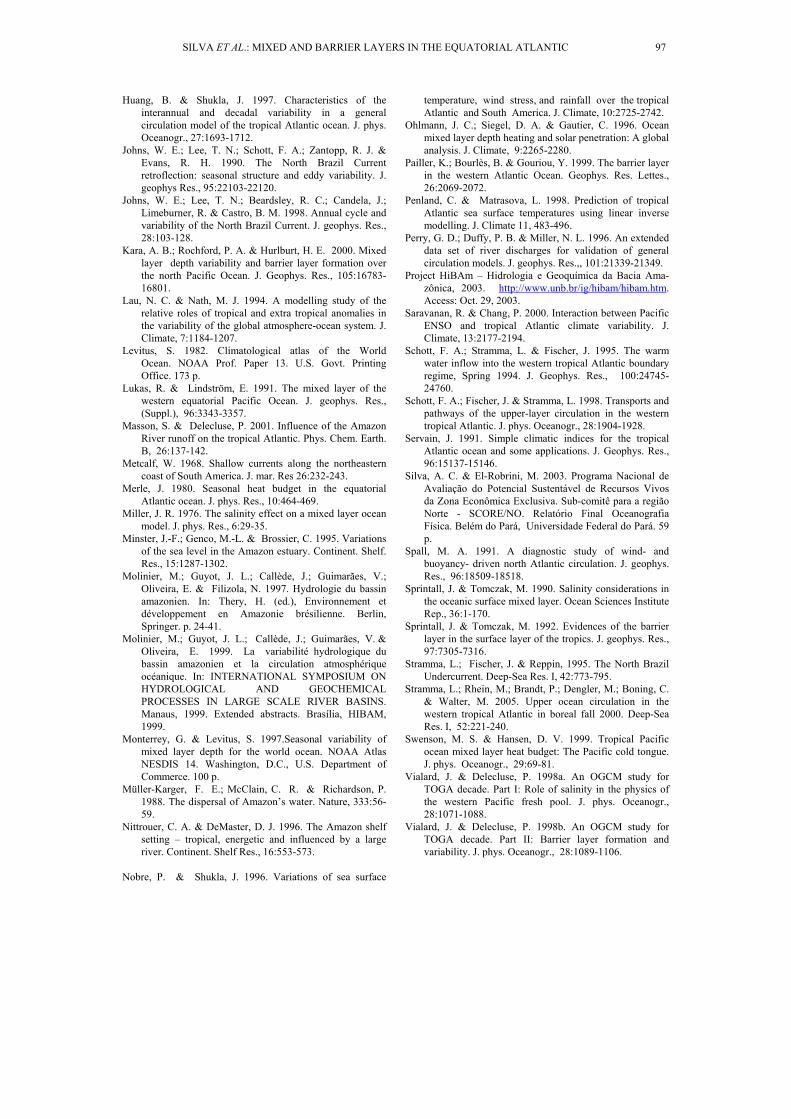
A significant storage of heat energy per meter of BL height during the daytime, was verified at station N52 during May (Fig. 8), mainly from 8:00h to 12:00h, when a large variation in mean temperature occurs. During that period, the residual heat per unit of height in the BL is greater than that verified in the mixed and isothermal layers, thus contributing to isolate the surface waters from the cooler water below the thermocline. From 12:00h to 24:00h, a greater concentration of heat per unit of layer thickness is observe in the mixed layer than in the isothermal and barrier layers. A clearly distinct panorama was found during these periods in Sep. 2001 (Fig. 9). The relative homogeneity of the water column yielded much lower values of stored residual heat per unit of layer thickness in the three layers. Only from 10:00h to 16:00h, when the development of a barrier layer was observed, were we able to register higher values of residual heat concentration, mainly associated with the mixed layer. The barrier layer that formed during September, although thicker presented much smaller values of residual heat per unit of layer thickness, thus demonstrating a lesser ability to isolate the superficial from the cooler, below-thermocline, waters.
Table 2. Major heat balance components at the ocean-atmosphere interface at N52, in a 24-hour period during May 1999 and September 2001 at the same place. Source: COADS (da Silva et al., 1994).
Heat flux component (W.m-2)
High discharge (May/1999)
Transition discharge (Sep/2001)
Short wave radiation ( SWQ ) 220 250
Latent heat flux ( latQ ) -101 -97
Net long wave radiation ( lwQ ) -43 -49
Sensible heat flux ( senQ ) -7 -3
SILVA ET AL.: MIXED AND BARRIER LAYERS IN THE EQUATORIAL ATLANTIC 93
BL
ZT
ZM
0 2 4 6 8 10 12 14 16 18 20 22 24LOCAL TIME (h)
-70
-50
-30
-10
10
30
50
Qi /
Zi (
103 k
g.W
.m-6)
Fig. 8. Variations in heat storage per unit of layer thickness for the isothermal, mixed and BL layers at station N52 during May 1999.
0 2 4 6 8 10 12 14 16 18 20 22 24LOCAL TIME (h)
-70
-50
-30
-10
10
30
50
Qi /
Zi (
103 k
g.W
.m-6)
BL
ZT
ZM
Fig. 9. Variations in heat storage per unit of layer thickness for the isothermal, mixed and BL layers at station N52 during September 2001.
94 BRAZILIAN JOURNAL OF OCEANOGRAPHY, 53(3/4), 2005
LOCAL TIME (h)
LOCAL TIME (h)

SUMMARY AND CONCLUSION
In the western equatorial Atlantic, the
formation and characteristics (depth and thickness) of the barrier and mixed layer vary seasonally and a BL is formed in distinct areas by different processes. During periods of high river discharges (Mar-May), the BL, with a mean thickness of 16m and isothermal and mixed layer depths shallower than 80 m is a common feature, and the formation of a BL on the inner continental shelf is driven by the spread of freshwater from the Amazonian rivers, creating a pycnocline that occupies the entire water column, within the isothermal layer.
Along the shelf break, the formation of the BL seems also to be associated with the advection of the subsurface maximum salinity waters formed in the region of the subtropical gyres and transported to the study area by the NBC/NBUC system (Stramma et al., 1995; Pailler et al., 1999; Stramma et al., 2005). Figure 10a shows a typical transect obtained in May 1995 (Transect Q in Fig. 1a), when very low salinity
values (<35) are observed at the near shore surface at depths of less than 20 m, associated with continental outflows. A high salinity core (>36.8) is verified near 100 m depth in Figure 10a, and this may be associated with the core of the NBUC in this area, as indicated by field measurements and studies of numerical modelling (Stramma et al., 1995; Schott et al., 1998; Bourlès et al., 1999; Stramma et al., 2005). These results suggest that physical mechanisms contributing to the BL formation in the Amazonian shelf break area may be analogous to those observed in the western Pacific ocean, as proposed by Vialard & Delecluse (1998a,b) and Cronin and McPhaden (2002). In the Pacific ocean, the BL formation is due to eastward fresh jets flowing over subducted salty water, while here we would have low salinity continental water lenses flowing over the salty subducted NBC waters (Fig. 10b). In both cases, a pre-existing horizontal salinity gradient within an isothermal layer may be tilted into vertical stratification by the action of a vertically sheared horizontal flow.
Subduction
High Salinity Water
Warm and LowSalinity Water
Salinity Front (Tilting)
Amazon outflow
BarrierLayer
200 m (b)
30 80 130 180 230 280 330 380DISTANCE OFFSHORE (km)
-200
-150
-100
-50
0
DEP
TH(m
)
35.0
(a)
0 m
Fig. 10. (a) Salinity distribution along the transect Q, May 1995; (b) Schematic representation of the BL formation in the Amazonian shelf break area.
SILVA ET AL.: MIXED AND BARRIER LAYERS IN THE EQUATORIAL ATLANTIC 95

During autumn 1997, there was no clear register of a BL over the Amazonian shelf but in that period, a maximum BL (40 m), associated with the presence of subsurface maximum salinity waters, was formed at 45°W. During periods of transition between high and low discharges, BL formation is reduced since at this time the transport by the NBC is greater and surface low salinity water would be displaced and spread northwestward (Müller-Krager et al., 1988; Johns et al., 1990; Geyer et al., 1996; Hu et al., 2004).
In order to infer the dynamics of the isothermal, mixed and barrier layers on the inner Amazonian shelf, the hourly variations of the depth of the isothermal and mixed layers derived from a time series of CTD profiles were measured over a 24-hour period at a fixed station in front of the Amazon river mouth. The results indicated that in September 2001, the formation of the BL over the shallower Amazonian shelf was facilitated when the effect of river discharge exceeds that of the tides (ebb-low-water-flood), inducing a salinity gradient strong enough to permit the formation of a pycnocline within the isothermal layer. The formation of a 15m–thick BL took place in the time interval between the ebb and flood tidal stages when, despite its low flow, the discharge of the Amazon River was stronger than that of the oceanic tides. During the high-water stage, the water column was fully mixed. This situation did not occur during the boreal spring when the river discharge was much greater. During that season the BL was maintained during the full tidal cycle since the continental discharge overcame the tidal forcing, even during the high-water stages.
ACKNOWLEDGEMENTS
We whith to thank Dr Maamar El-Robrini, Coordinator of the Northern Section of the REVIZEE Program, and his team members for the release of the CTD dataset, as well as the scientific staff and crew of the R/V Antares of the Brazilian Navy for their efforts and dedication during the oceanographic expeditions. The authors also wish to record their thanks to the two anonymous referees for their fruitful comments on this paper.
REFERENCES Ando, K. & McPhaden, M. J. 1997. Variability of surface
layer hydrography in the tropical Pacific Ocean. J. geophys. Res., 102:23063-23078.
Beardsley, R. C.; Candela, J.; Limeburner, R.; Geyer, W. R.; Lentz, S. J., Castro, B. M.; Cacchione, D. & Carneiro, N. 1995. The M2 tide on the Amazon shelf. Continent. Shelf Res., 100:2283-2319.
Blanck, H. F. 1999. Using TOPEX Satellite El-Niño altimetry data to introduce thermal expansion and heat capacity concepts in chemistry courses. J. Chem. Educ., 76:1635-1646.
Boebel, O.; Davis, R. E.; Ollitrault, M.; Peterson, R. G.; Richardson, P. L.; Schmid, C. & Zenk, W. 1999. The intermediate depth circulation of the western south Atlantic. Geophys Res. Letts, 26:3329-3332.
Bourlès, B.; D’Orgeville, M.; Eldin, G.; Gouriou, Y.; Chuchla, R.; DuPenhoat, Y. & Aranault, S. 2002. On the evolution of the thermocline and subthermocline eastward currents in the equatorial Atlantic. Geophys Res. Letts, 29, 10.1029/2002GL015098.
Bourlès, B., Molinari, R.L., Johns, E., Wilson, W.D., Leaman, K.D., 1999. Upper layer currents in the western tropical north Atlantic (1989-1991). J. Geophys. Res., 104, 1361-1375.
Brainerd, K. E. & Gregg, M. C. 1995. Surface mixed and mixing layer depths. Deep-Sea Res. I, 42: 1521-1543.
Carton, J. A. 1991. Effect of seasonal surface freshwater flux on sea surface temperature in the Tropical Atlantic Ocean. J. geophys. Res., 96:12593-12598.
Chang, P.; Ji, L. & Li, H. 1997. A decadal climate variation in the tropical Atlantic ocean from thermodynamic air-sea interactions. Nature, 385:516-518.
Cronin, M. F. & McPhaden, M. J. 2002. Barrier layer formation during westerly wind bursts. J. geophys. Res, 107(C12):2101-2112.
Curtin, T. B. 1986. Physical observations in the plume region of the Amazon River during peak discharge – II. Water masses. Continent. Shelf Res., 6:53-71.
da Silva, A.; Young, A. C. & Levitus, S. 1994. Atlas of surface marine data 1994, Vol. I : Algorithms and procedures. NOAA Atlas NESDIS 6, U.S Washington, D.C. Department of Commerce.
Defant, A., 1961. Physical oceanography, vol. I. New York, Pergamon Press. 729 p.
DHN (Diretoria de Hidrografia e Navegação), 2003. Tábuas das Marés. Marinha do Brasil, Divisão de Hidrografia e Navegação. 7 p.
Enfield, D.B., 1996. Relationships of inter-American rainfall to tropical Atlantic and Pacific SST variability. Geophys. Res. Lettes 23:3505-3508.
Enfield, D. B. & Mayer, D. A. 1997. Tropical Atlantic SST variability and its relation to El-Niño Southern Oscillation. J. geophys Res. 102, 929-945.
Folland, C. K.; Palmer, T. N. & Parker, D. E. 1986. Sahel rainfall and worldwide sea temperatures. Nature, 320:602-607.
Geyer, W. R.; Beardsley, R. C.; Lentz, S. J.; Candela, J.; Limeburner, R.; Johns, W. E.; Castro, B. M. & Soares, I. D. 1996. Physical oceanography of the Amazon shelf. Continent. Shelf Res., 16:575-616.
Hastenrath, S. 1977. Hemispheric asymmetry of ocean heat budget in the equatorial Atlantic and eastern Pacific. Tellus, 29:523-529.
Hu, C.; Montgomery, E. T.; Schmitt, R. W. & Müller-Karger, F. E. 2004. The Amazon and Orinoco river plumes in the tropical Atlantic and Caribbean sea: observation from space and S-PALACE floats. Deep-Sea Res. II, 51:1151-1171.
96 BRAZILIAN JOURNAL OF OCEANOGRAPHY, 53(3/4), 2005
Huang, B. & Shukla, J. 1997. Characteristics of the interannual and decadal variability in a general circulation model of the tropical Atlantic ocean. J. phys. Oceanogr., 27:1693-1712.
Johns, W. E.; Lee, T. N.; Schott, F. A.; Zantopp, R. J. & Evans, R. H. 1990. The North Brazil Current retroflection: seasonal structure and eddy variability. J. geophys Res., 95:22103-22120.
Johns, W. E.; Lee, T. N.; Beardsley, R. C.; Candela, J.; Limeburner, R. & Castro, B. M. 1998. Annual cycle and variability of the North Brazil Current. J. geophys. Res., 28:103-128.
Kara, A. B.; Rochford, P. A. & Hurlburt, H. E. 2000. Mixed layer depth variability and barrier layer formation over the north Pacific Ocean. J. Geophys. Res., 105:16783-16801.
Lau, N. C. & Nath, M. J. 1994. A modelling study of the relative roles of tropical and extra tropical anomalies in the variability of the global atmosphere-ocean system. J. Climate, 7:1184-1207.
Levitus, S. 1982. Climatological atlas of the World Ocean. NOAA Prof. Paper 13. U.S. Govt. Printing Office. 173 p.
Lukas, R. & Lindström, E. 1991. The mixed layer of the western equatorial Pacific Ocean. J. geophys. Res., (Suppl.), 96:3343-3357.
Masson, S. & Delecluse, P. 2001. Influence of the Amazon River runoff on the tropical Atlantic. Phys. Chem. Earth. B, 26:137-142.
Metcalf, W. 1968. Shallow currents along the northeastern coast of South America. J. mar. Res 26:232-243.
Merle, J. 1980. Seasonal heat budget in the equatorial Atlantic ocean. J. phys. Res., 10:464-469.
Miller, J. R. 1976. The salinity effect on a mixed layer ocean model. J. phys. Res., 6:29-35.
Minster, J.-F.; Genco, M.-L. & Brossier, C. 1995. Variations of the sea level in the Amazon estuary. Continent. Shelf. Res., 15:1287-1302.
Molinier, M.; Guyot, J. L.; Callède, J.; Guimarães, V.; Oliveira, E. & Filizola, N. 1997. Hydrologie du bassin amazonien. In: Thery, H. (ed.), Environnement et développement en Amazonie brésilienne. Berlin, Springer. p. 24-41.
Molinier, M.; Guyot, J. L.; Callède, J.; Guimarães, V. & Oliveira, E. 1999. La variabilité hydrologique du bassin amazonien et la circulation atmosphérique océanique. In: INTERNATIONAL SYMPOSIUM ON HYDROLOGICAL AND GEOCHEMICAL PROCESSES IN LARGE SCALE RIVER BASINS. Manaus, 1999. Extended abstracts. Brasília, HIBAM, 1999.
Monterrey, G. & Levitus, S. 1997.Seasonal variability of mixed layer depth for the world ocean. NOAA Atlas NESDIS 14. Washington, D.C., U.S. Department of Commerce. 100 p.
Müller-Karger, F. E.; McClain, C. R. & Richardson, P. 1988. The dispersal of Amazon’s water. Nature, 333:56-59.
Nittrouer, C. A. & DeMaster, D. J. 1996. The Amazon shelf setting – tropical, energetic and influenced by a large river. Continent. Shelf Res., 16:553-573.
Nobre, P. & Shukla, J. 1996. Variations of sea surface
temperature, wind stress, and rainfall over the tropical Atlantic and South America. J. Climate, 10:2725-2742.
Ohlmann, J. C.; Siegel, D. A. & Gautier, C. 1996. Ocean mixed layer depth heating and solar penetration: A global analysis. J. Climate, 9:2265-2280.
Pailler, K.; Bourlès, B. & Gouriou, Y. 1999. The barrier layer in the western Atlantic Ocean. Geophys. Res. Lettes., 26:2069-2072.
Penland, C. & Matrasova, L. 1998. Prediction of tropical Atlantic sea surface temperatures using linear inverse modelling. J. Climate 11, 483-496.
Perry, G. D.; Duffy, P. B. & Miller, N. L. 1996. An extended data set of river discharges for validation of general circulation models. J. geophys. Res.,, 101:21339-21349.
Project HiBAm – Hidrologia e Geoquímica da Bacia Ama-zônica, 2003. http://www.unb.br/ig/hibam/hibam.htm. Access: Oct. 29, 2003.
Saravanan, R. & Chang, P. 2000. Interaction between Pacific ENSO and tropical Atlantic climate variability. J. Climate, 13:2177-2194.
Schott, F. A.; Stramma, L. & Fischer, J. 1995. The warm water inflow into the western tropical Atlantic boundary regime, Spring 1994. J. Geophys. Res., 100:24745-24760.
Schott, F. A.; Fischer, J. & Stramma, L. 1998. Transports and pathways of the upper-layer circulation in the western tropical Atlantic. J. phys. Oceanogr., 28:1904-1928.
Servain, J. 1991. Simple climatic indices for the tropical Atlantic ocean and some applications. J. Geophys. Res., 96:15137-15146.
Silva, A. C. & El-Robrini, M. 2003. Programa Nacional de Avaliação do Potencial Sustentável de Recursos Vivos da Zona Econômica Exclusiva. Sub-comitê para a região Norte - SCORE/NO. Relatório Final Oceanografia Física. Belém do Pará, Universidade Federal do Pará. 59 p.
Spall, M. A. 1991. A diagnostic study of wind- and buoyancy- driven north Atlantic circulation. J. geophys. Res., 96:18509-18518.
Sprintall, J. & Tomczak, M. 1990. Salinity considerations in the oceanic surface mixed layer. Ocean Sciences Institute Rep., 36:1-170.
Sprintall, J. & Tomczak, M. 1992. Evidences of the barrier layer in the surface layer of the tropics. J. geophys. Res., 97:7305-7316.
Stramma, L.; Fischer, J. & Reppin, 1995. The North Brazil Undercurrent. Deep-Sea Res. I, 42:773-795.
Stramma, L.; Rhein, M.; Brandt, P.; Dengler, M.; Boning, C. & Walter, M. 2005. Upper ocean circulation in the western tropical Atlantic in boreal fall 2000. Deep-Sea Res. I, 52:221-240.
Swenson, M. S. & Hansen, D. V. 1999. Tropical Pacific ocean mixed layer heat budget: The Pacific cold tongue. J. phys. Oceanogr., 29:69-81.
Vialard, J. & Delecluse, P. 1998a. An OGCM study for TOGA decade. Part I: Role of salinity in the physics of the western Pacific fresh pool. J. phys. Oceanogr., 28:1071-1088.
Vialard, J. & Delecluse, P. 1998b. An OGCM study for TOGA decade. Part II: Barrier layer formation and variability. J. phys. Oceanogr., 28:1089-1106.
SILVA ET AL.: MIXED AND BARRIER LAYERS IN THE EQUATORIAL ATLANTIC 97

Wyrtki, K. 1964. The thermal structure of the eastern Pacific Ocean. Deutsche Hydrographische Zeitung, Ergänzungsheft A 6, 84 pp.
You, Y. 1998. Rain-formed barrier layer of the western equatorial Pacific warm pool: A case study. J. Geophys. Res., 103:5361-5378.
Zebiak, S.E., 1993. Air-sea interaction in the equatorial
Atlantic region. J. Climate, 6:1567-1586.
(Manuscript received 22 February 2005; revised 03 June 2005; accepted 16 September 2005)
98 BRAZILIAN JOURNAL OF OCEANOGRAPHY, 53(3/4), 2005