seasonal disparity in biotic indices of aquatic ... · to evaluate the ecological integrity of...
TRANSCRIPT
European Journal of Advanced Research in Biological and Life Sciences Vol. 4 No. 1, 2016 ISSN 2056-5984
Progressive Academic Publishing, UK Page 8 www.idpublications.org
SEASONAL DISPARITY IN BIOTIC INDICES OF AQUATIC INVERTEBRATE’S
POPULATION OF RIVER BENUE AT MAKURDI AS A MEASURE OF
ECOLOGICAL INTEGRITY
Akaahan, T. J. A1. Azua, E. T
1. & Akogwu, S. A.
2
1. Environmental Science and Zoology Unit Department of Biological Sciences University of Agriculture
P.M.B. 2373 Makuedi Benue State, NIGERIA
2. Department of Biological Sciences Federal University P.M. B. 1005, Gashua, Yobe State, NIGERIA
ABSTRACT
The dumping of wastes into rivers without recourse to the damage of the waste on the
biodiversity is very common in the developing nations of the World as it is noticed in River
Benue at Makurdi. To evaluate the ecological integrity of River Benue at Makurdi, sediments
samples collected for two years (from July 2011-June 2013) monthly from five different
stations on the shoreline of River Benue at Makurdi. A perusal at result of the biodiversity of
benthic fauna in River Benue indicate that a total of 4,451 macro benthic fauna individuals
comprising of 4 phyla and 21 taxa were obtained. More individuals were recorded during the
dry seasons as compared to the rainy seasons. Benue brewery (570indiviuals/m2) and Mikap
Nigeria Ltd (649 indiviuals/m2)) recorded low population as compared to the other locations:
Coca cola (1,177), Wadata market (1,043 indiviuals/m2)) and Wurukum abattoir (1,012
individuals/m2)). Athropoda had the highest population of individuals as compared to the
other phyla. The population of the benthic fauna were subject to six biotic indices to ascertain
the ecological status of River Benue at Makurdi. Across the seasons the result of the
ecological model showed that Shannon diversity varied from 2.06-3.25, Margelef diversity
2.98-4.36, Simpson diversity varied from 0.87-0.96 and Menhinick diversity ranged from
0.95-2.80. Similarly there mean values were 2.65, 3.61, 0.92and 1.68 respectively during the
24 months across the seasons. All the same the Pielou evenness index varied from 0.81-1.00
and the Simpson dominance varied from 0.00-0.31 with the mean values of 0.91 and 0.41
respectively. At the studied location Shannon diversity varied from 1.81-3.00, Margelef
diversity 2.10-4.44, Simpson diversity varied from 0.80-0.95 and Menhinick diversity ranged
from 2.20-2.61. Similarly there mean values were 2.45, 3.44, 0.89and 2.47 respectively
during the 24 months across the seasons. The Pielou evenness and Simpson dominance
ranged from 0.62-0.94 and Simpson dominance ranged from 0.28-0.47 in the course of the
study. The biotic indices of river Benue at Benue brewery and Mikap Nigeria ltd showed
clearly that theses location were impact by the anthropogenic activities and compromised the
ecological integrity which indicate the perturbed nature of the study area. It is recommended
that indiscriminate dumping of effluents and waste in the river should be discouraged.
Keywords: Biotic indices, River Benue, Aquatic Invertebrates.
INTRODUCTION
Biotic index is a scale for showing the quality of environment by indicating the type of
organisms present in it. It is often used to assess the quality of water in rivers (Barbour et al.,
1999) They are applied to assess biological properties of mainly running waters, in most
cases they are based on macro invertebrate communities (Dziock, et al; 2006). Biotic indices
have been used to measure various types of environmental stress, organic pollution, acid
water, habitat degradation and the level of pollution load (Knobe et al., 1995). Similarly
biotic index account for the sensitivity or tolerance of the individual species or groups to
pollution and assigned a value to them (Quareshi and Gargi, 2013). The sum of the value

European Journal of Advanced Research in Biological and Life Sciences Vol. 4 No. 1, 2016 ISSN 2056-5984
Progressive Academic Publishing, UK Page 9 www.idpublications.org
gives an index of pollution for a site. This data may be quantitative (presence-absence) or
qualitative (relative abundance and density). All the same the indices have been designed
mainly to assess organic pollution (Quareshi and Gargi, 2013). Biotic metrics are very
important in analysis biological data because they allow the Investigator to use meaningful
attributes in assessing the status of assemblages and communities in response to
environmental perturbation. The definition of a metric is characteristics of biota that changes
in some predictable way with increased human impact (Barbour et al., 1999). For most of the
studies involving biological assessment, raw data are the list of taxa found at a sampling site
(in a sample) and the number of individuals recorded for each taxon. Preparing those data for
analysis involves converting them into metrics or other terms. Metrics calculation is a form of
data reduction (Barbour et al., 1995). Metrics used in indexes evaluate aspects of both
element and process within a macro invertebrate assemblage. Although, these indices have
been regionally developed, they are typically appropriate over wide geographic areas with
minor modifications (Barbour et al., 1995). The biotic index provides a simple means for
communicating complex information to ecological risk managers and for correlating benthic
responses with stressor data (Bilkovic et al., 2006).
Macro invertebrates are the most commonly used element for biological classification of
rivers in Europe (European Commission, 2006). In Nigeria, such classification is still scarce
and there is need for the rivers to be classified. In the same vain macro invertebrate
organisms form an integral part of aquatic environment. They maintain various levels of
interactions between the community and the environment (Basu et al., 2013). Studies have
shown that they also contribute immensely to the functioning of the ecosystem in the
breaking particular organic material (Vyas and Bhawsar, 2013). This study therefore is
imperative and indispensable as it measures the ecological integrity of river Benue at
Makurdi with respect to the biotic index of the macro benthic fauna.
MATERIALS AND METHODS
Study Area
The River Benue with its source from the Cameroonian mountains flows westwards into
Nigeria. It is the second largest river in Nigeria and measures approximately 310,000 Ha. It is
about 1.488Km in length with alluvia fertile flood plains on either banks (Welcomme, 1986).
The Benue River flows through Makurdi and confluence with River Niger at Lokoja the
capital of Kogi state, Nigeria. Makurdi the capital city of Benue state is located on Latitude
7041’ N and Longitude 8
0 28’ E. The size of the River Benue within Makurdi and major
settlement runs through is approximately 671 meters (Udo, 1981). The rainfall seasons at
Makurdi produces a river regime of peak flows from August to early October and low flow
from December to April. The rainy season which last for seven months (April to October) has
a mean annual rainfall ranging from 1200-2000mm. High temperature values averaging 28-
330C are recorded in Makurdi throughout the year, most notable from March to April.
Harmantan winds are accompanied with cooling effects mostly during the nights of
December and January (Nyagba, 1995). All the same the periodic dust plumes associated
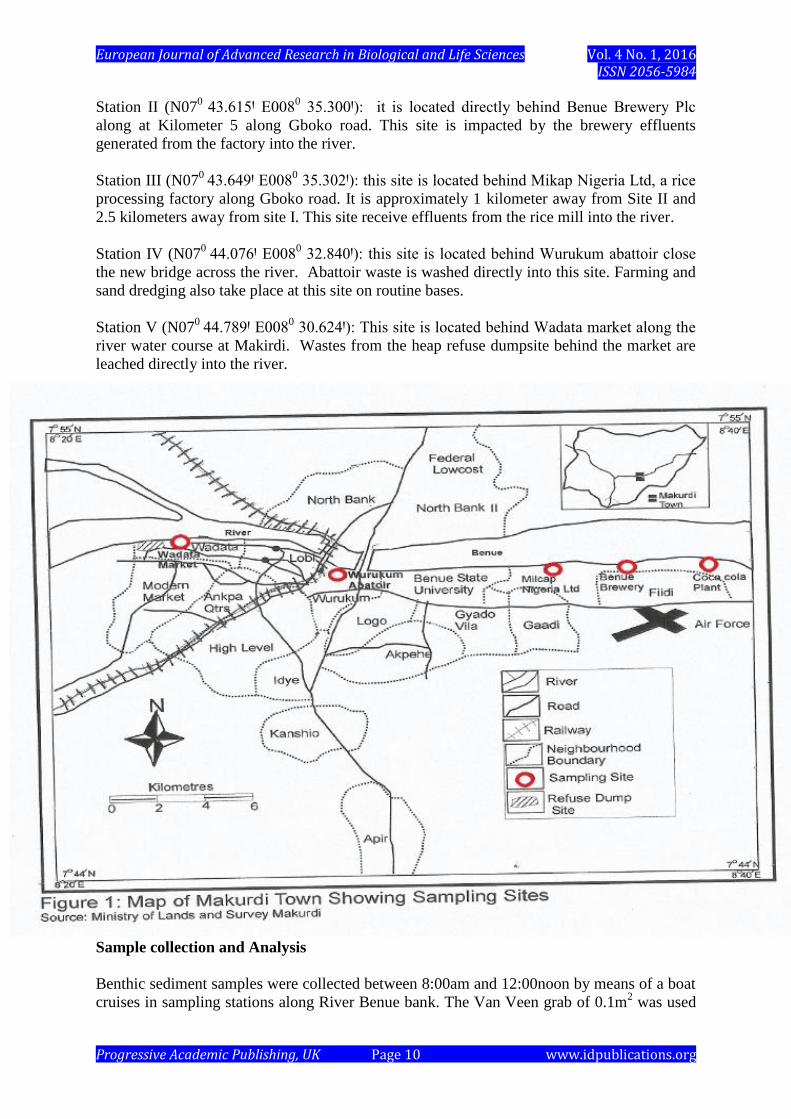
with this time of the year may encourage surface water pollution (Nyagba, 1995). Five
stations were selected along the river course at Makurdi , Benue state for this study shown in
Fig 1 as follows:
Station I(N070
43.663Ꞌ E0080 35.427Ꞌ): it is located behind Coca cola plc plant along Gboko
road and it is approximate 1.5 kilometers away from Site II
European Journal of Advanced Research in Biological and Life Sciences Vol. 4 No. 1, 2016 ISSN 2056-5984
Progressive Academic Publishing, UK Page 10 www.idpublications.org
Station II (N070
43.615Ꞌ E0080 35.300Ꞌ): it is located directly behind Benue Brewery Plc
along at Kilometer 5 along Gboko road. This site is impacted by the brewery effluents
generated from the factory into the river.
Station III (N070
43.649Ꞌ E0080 35.302Ꞌ): this site is located behind Mikap Nigeria Ltd, a rice
processing factory along Gboko road. It is approximately 1 kilometer away from Site II and
2.5 kilometers away from site I. This site receive effluents from the rice mill into the river.
Station IV (N070
44.076Ꞌ E0080 32.840Ꞌ): this site is located behind Wurukum abattoir close
the new bridge across the river. Abattoir waste is washed directly into this site. Farming and
sand dredging also take place at this site on routine bases.
Station V (N070
44.789Ꞌ E0080 30.624Ꞌ): This site is located behind Wadata market along the
river water course at Makirdi. Wastes from the heap refuse dumpsite behind the market are
leached directly into the river.
Sample collection and Analysis
Benthic sediment samples were collected between 8:00am and 12:00noon by means of a boat
cruises in sampling stations along River Benue bank. The Van Veen grab of 0.1m2 was used
European Journal of Advanced Research in Biological and Life Sciences Vol. 4 No. 1, 2016 ISSN 2056-5984
Progressive Academic Publishing, UK Page 11 www.idpublications.org
for the collection of sediments and benthos at the bottom of designed sampling sites at the
River Benue shoreline within Makurdi metropolis throughout the study period. The two
shovels of the grab were held open by a small bar. The grab was then lowered into the river
bed at the sampling sites. When the grab reaches the bottom of the river, the bar was
automatically released. The graduated rope attached to the grab was then pulled from above.
The two shovels of the grab sampler were closed tightly with sand and mud captured in it.
The content of the grab were emptied into a polythene bags, labeled properly and taken to the
laboratory for sorting and analysis. Three successful hauls of benthic samples were taken
from each station using a van Veen grab( 0.1m2) from an anchored boat with an out-board
engine of 25 HP. The samples were then, taken to the laboratory for analysis. In the
laboratory the samples were sieved in order to remove fine sediments and any other
extraneous material. This process of sieving is very delicate and care was taken to avoid any
damage to the fragile organisms and to secure all animals present in the samples collected.
Each of the sediment sample collected was washed three times in the Laboratory through
three sets of sieves, 1st 2mm, then 1mm and finally 0.5mm mesh size sieves to collect the
macro benthos in them( Esenowo and Ugwumba,2010). The retained macro benthos were
poured into bottles and labeled properly. Prior to fixation, the retained benthos from the sieve
were placed in 15% ethanol to relax the organisms and avoid unnecessary suffering. The
benthic fauna samples were then fixed with 4% formaldehyde. The washed and preserved
sediments with benthic invertebrates were poured into a white enamel tray and sorted out.
The sorting was made effective by adding moderate volume of water into container to
improve visibility (George et al., 2009). Large benthic fauna were picked out using forceps
while the smaller ones were pipette out. The preserved animals were identified under light
and stero dissecting microscope and counted. The identification was carried out using keys by
Day (1967), Pennak (1978), Water and Rivers Commission, (2001) and Merit and Cummins
(1996). The study lasted for 24 months and was moving from one season to another as
presented below:
Season1 (July 2011-October 2011) – Rainy Season 2 (November.2011-March2012)-Dry
Season 3( April 2012- October 2012)- Rainy Season 4( November 2012- March 2013)-Dry
Season 5( April 2013- June 2013) - Rainy.
Data Analysis
Biological indices such as Shannon and Weiner index (H1); Margalef’s index (d); Simpson
diversity index (1-∆); Menhinicks diversity index (D); Pielou Evenness (J’) and Simpson
dominance index ( C) were used in analysis the data. Relative abundance of the benthic fauna
was determined at each site.
Shannon- Weiner diversity index (H1)= -∑[(ni/N)×ln(ni/N)] ( Shannon-Weiner, 1963).
Where:
H1= Diversity index , ni= total number of individuals belonging to ith species
N= total number of individuals for the site,
ln= the natural log of the number
Margalef-value is the measure of specie richness. It is expressed as d= S-1/lnN ( Margalef,
1967) Where: d= Margalef value, S= number species collected in a sample, N= total number
of individuals in the sample
European Journal of Advanced Research in Biological and Life Sciences Vol. 4 No. 1, 2016 ISSN 2056-5984
Progressive Academic Publishing, UK Page 12 www.idpublications.org
Simpson’s diversity (1-∆)= 1- ∑ n(n-1)/N(N-1)where: N= the total number of organisms of
all species, n= the total number of organisms of a particular species
Menhinick’s Index (D)= S/√N Where:
S= Number of species in a population N= Total number of individuals in S species
Pielou’s index measures how evenly the species are distributed in a sample community. It is
expressed as: J= H1/ Hmax (Pielou, 1969). Where: J= diversity evenness or Equitability
index, H1= calculated Shannon –Weiner diversity index (Shannon- Weiner) Hmax = lnS
S= total number of species in a population ln= natural log of number
Simpson dominance index (C) = ∑(n/N)2 (Ogbeibu, 2005). Where: n= the number of
species in the ith
species N= Total number of individuals
RESULTS
The data presented in fig 2 is the variation of benthic fauna population at the studied locations
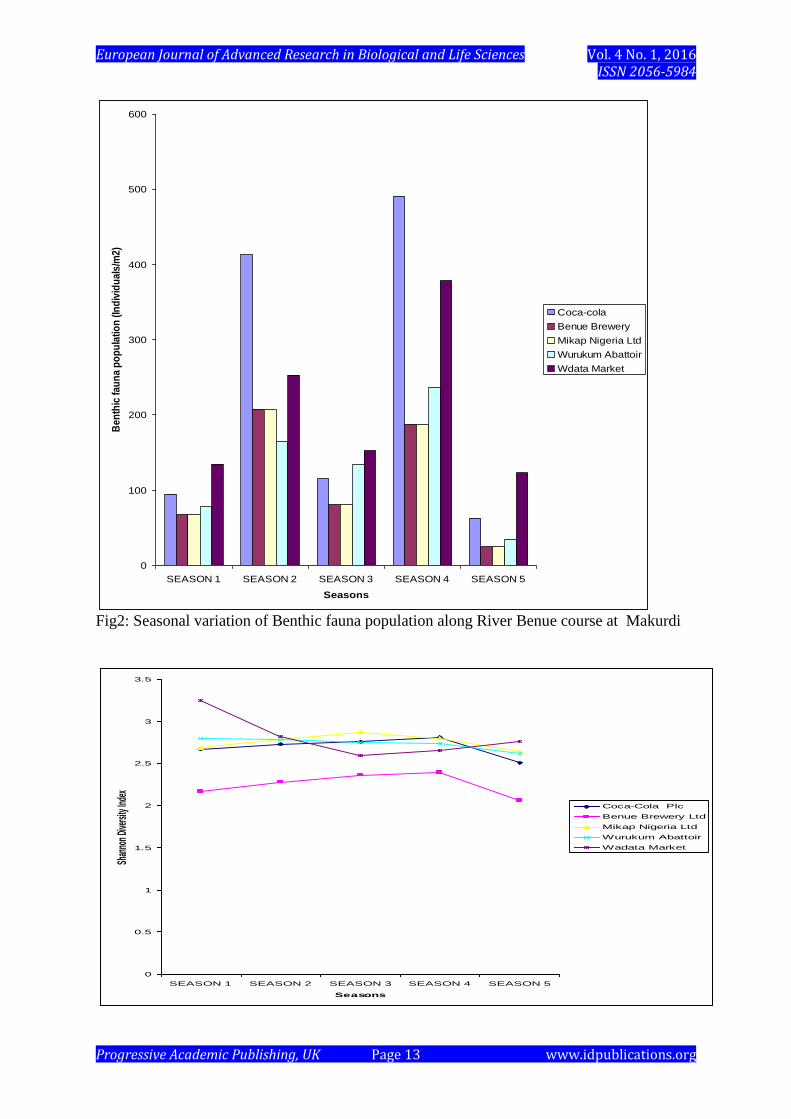
across the seasons during the 24 months period of the study. The result showed that season 4
was recorded the highest population of benthic fauna at coca cola while lowest was during
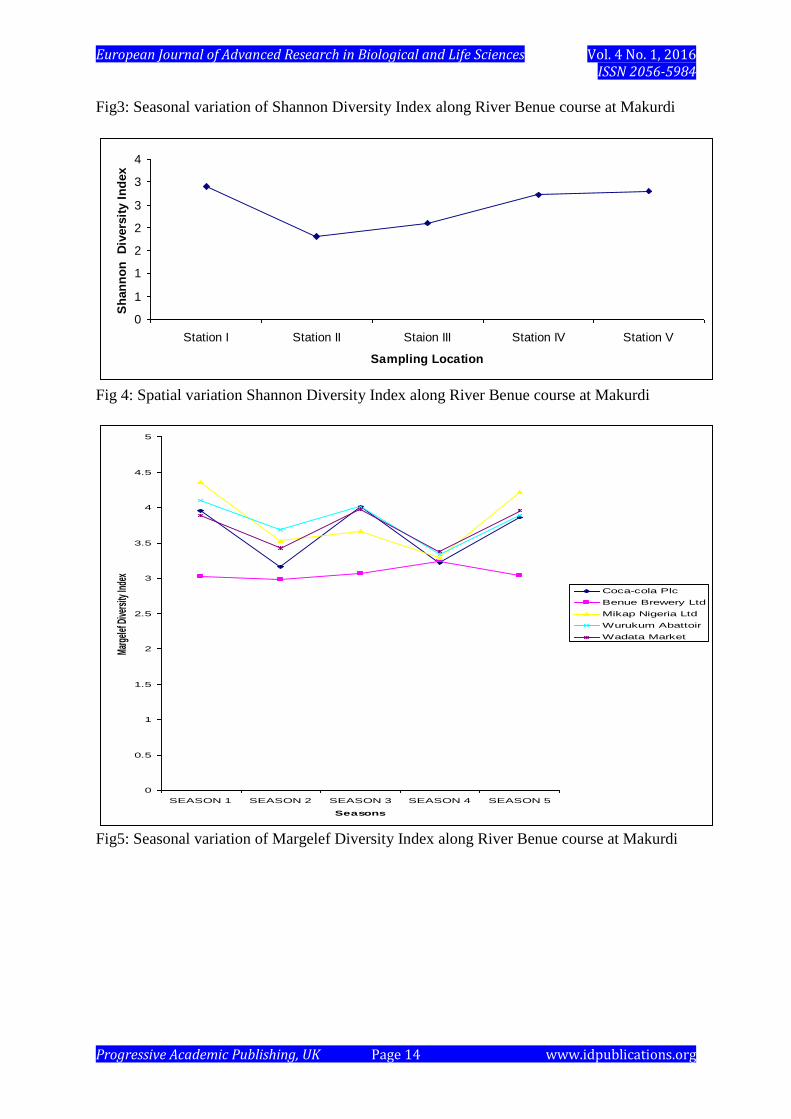
season5 at Benue Brewery. Fig 3 is the seasonal variation of the Shannon diversity index
across studies seasons was lowest at Benue brewery and highest at Coca cola. At the station
Shannon diversity index increased from station I-V during the period of the study period
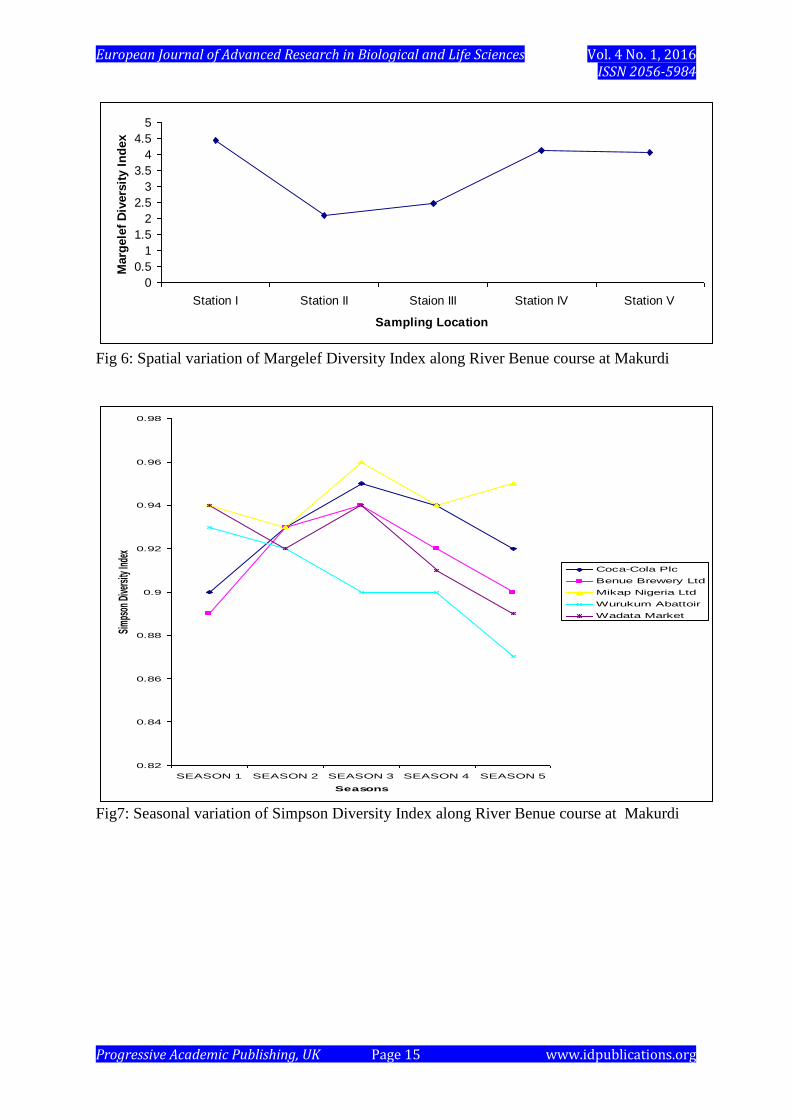
(Fig4). During the course of this study Margelef diversity was lowest at Benue brewery in
season 3(Fig 5). Similarly at the stations, Margelef diversity index decreased from station I-
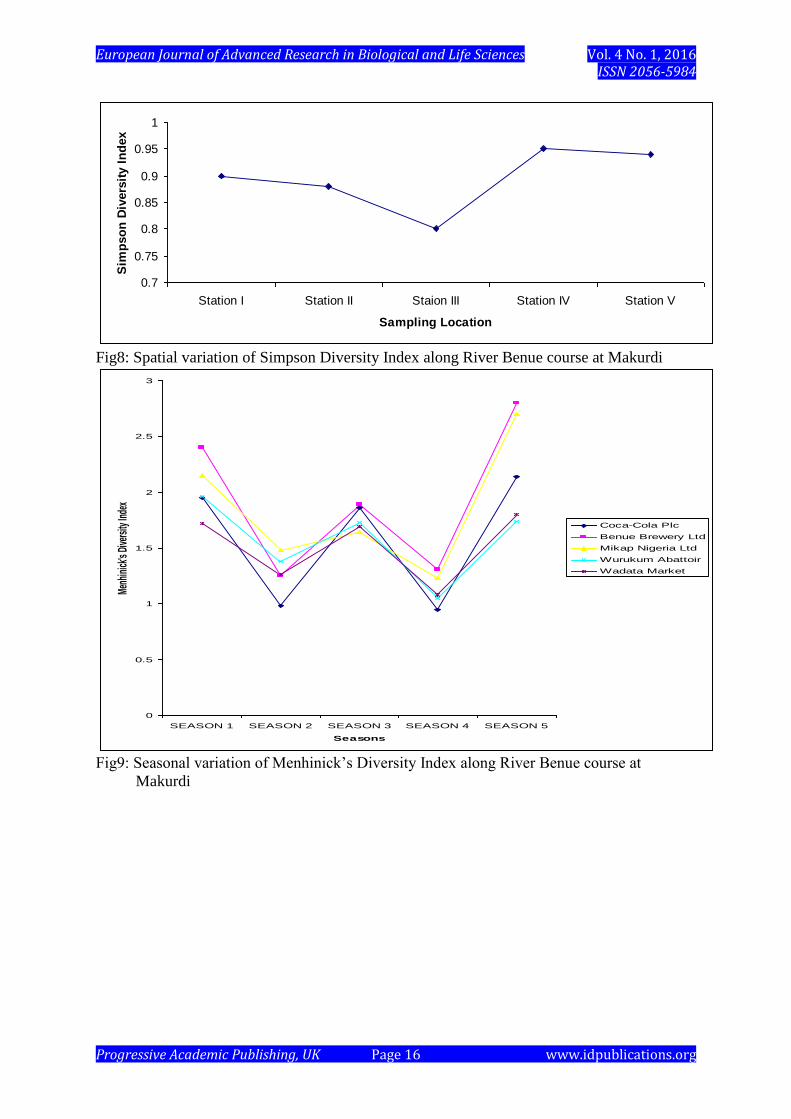
V Fig 6). The Simpson diversity index was highest during season 3 at Mikap Nigeria Ltd
location and lowest at Wurukum abattoir at the same season 3(Fig 7). The result presented in
Fig 8 showed that the lowest value of Simpson diversity index was obtained at station III and
the highest at Station V. Menhick’s diversity index was highest at Benue brewery during
season 5 and lowest at Wadata market during season 4 in the course of the study( Fig 9).
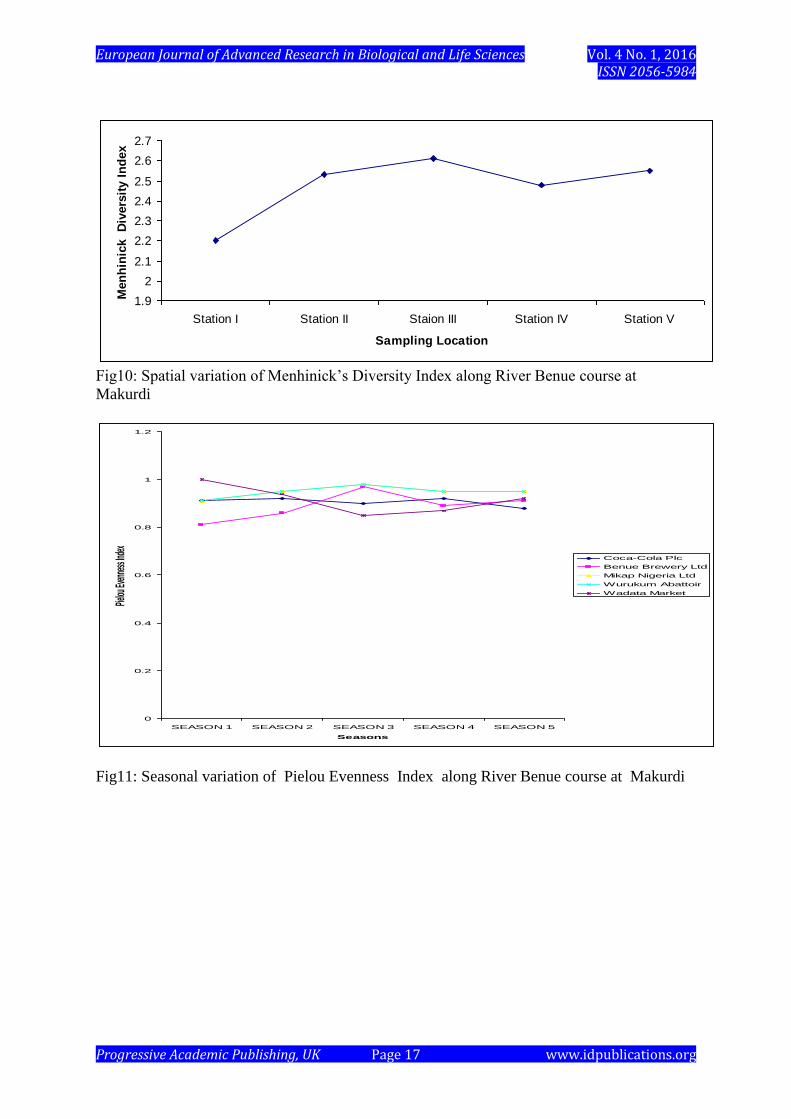
Across the studied stations the Menhinick’s index increased from stations: I-V ( Fig 10).
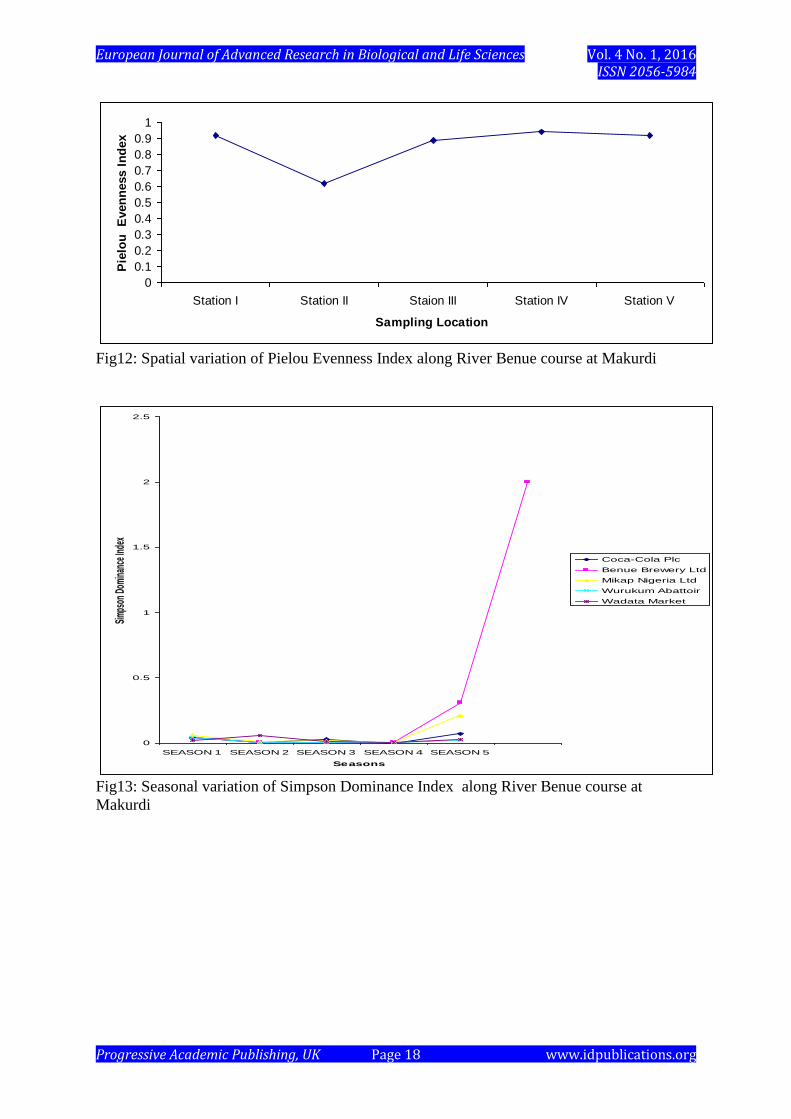
Figure 11 depicts the variation of Pielou evenness during the 24 months study period in River
Benue at Makurdi. Pielou evenness was lowest at Wadata market during season 3and highest
at Coca cola during season 1. During the study period the highest value of Pieolou evenness
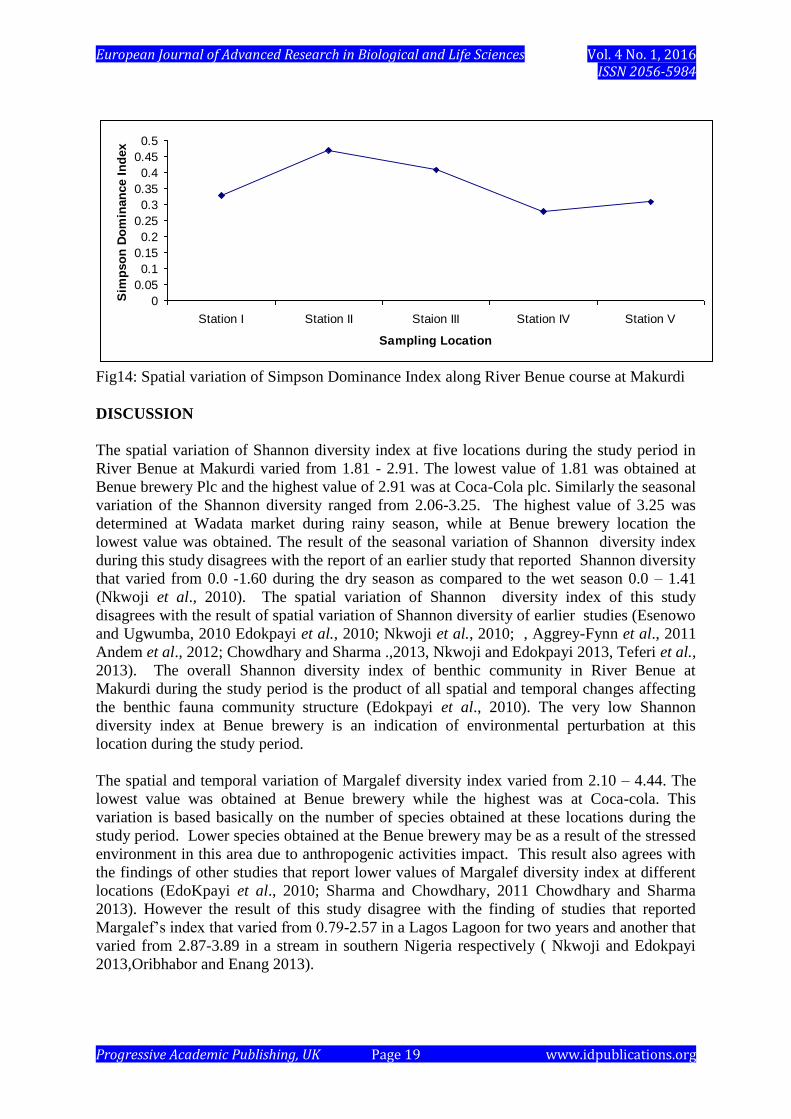
was at station I and lowest at station II (Fig 12). The highest value of Simpson dominance
was obtained at Benue brewery during season 5(Fig 13). Similarly across the stations the
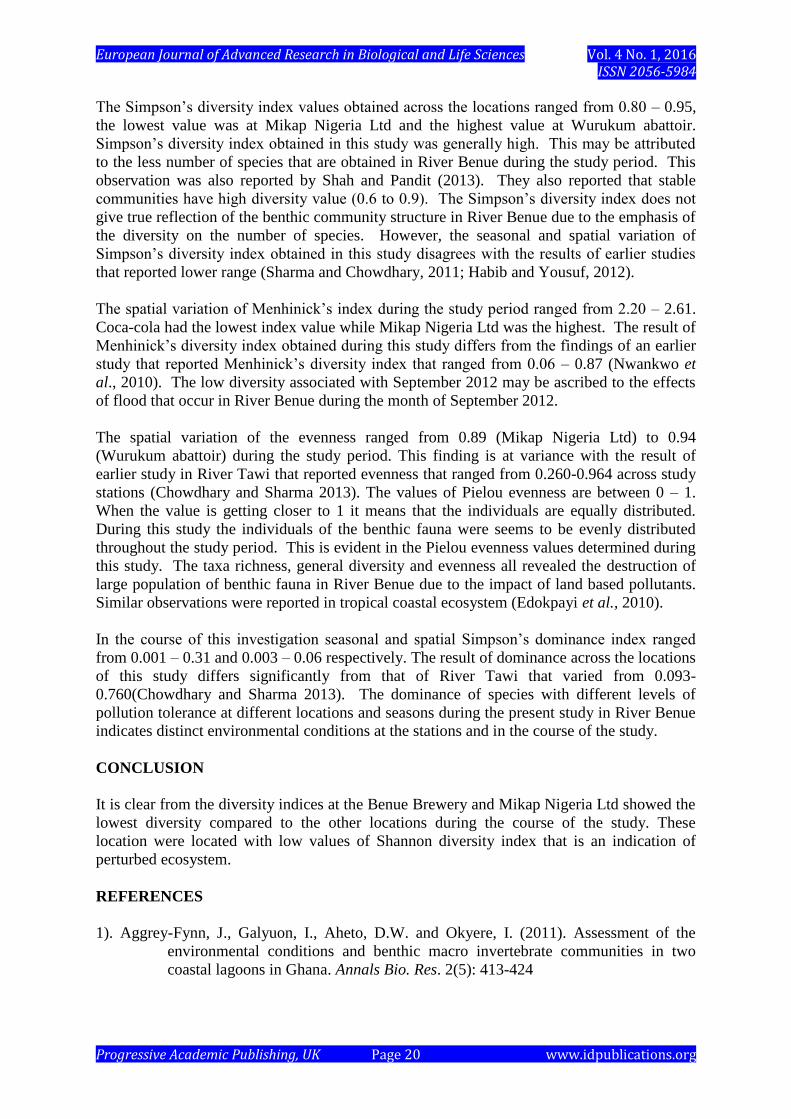
lowest value of Simpson dominance was at station IV (Fig 14).
European Journal of Advanced Research in Biological and Life Sciences Vol. 4 No. 1, 2016 ISSN 2056-5984
Progressive Academic Publishing, UK Page 13 www.idpublications.org
Fig2: Seasonal variation of Benthic fauna population along River Benue course at Makurdi
0
100
200
300
400
500
600
SEASON 1 SEASON 2 SEASON 3 SEASON 4 SEASON 5
Seasons
Be
nth
ic f
au
na
po
pu
lati
on
(In
div
idu
als
/m2
)
Coca-cola
Benue Brewery
Mikap Nigeria Ltd
Wurukum Abattoir
Wdata Market
0
0.5
1
1.5
2
2.5
3
3.5
SEASON 1 SEASON 2 SEASON 3 SEASON 4 SEASON 5
Seasons
Shan
non
Dive
rsity
Inde
x
Coca-Cola Plc
Benue Brewery Ltd
Mikap Nigeria Ltd
Wurukum Abattoir
Wadata Market
European Journal of Advanced Research in Biological and Life Sciences Vol. 4 No. 1, 2016 ISSN 2056-5984
Progressive Academic Publishing, UK Page 14 www.idpublications.org
Fig3: Seasonal variation of Shannon Diversity Index along River Benue course at Makurdi
Fig 4: Spatial variation Shannon Diversity Index along River Benue course at Makurdi
Fig5: Seasonal variation of Margelef Diversity Index along River Benue course at Makurdi
0
1
1
2
2
3
3
4
Station I Station II Staion III Station IV Station V
Sampling Location
Sh
an
no
n
Div
ers
ity I
nd
ex
0
0.5
1
1.5
2
2.5
3
3.5
4
4.5
5
SEASON 1 SEASON 2 SEASON 3 SEASON 4 SEASON 5
Seasons
Mar
gele
f Div
ersi
ty In
dex
Coca-cola Plc
Benue Brewery Ltd
Mikap Nigeria Ltd
Wurukum Abattoir
Wadata Market
European Journal of Advanced Research in Biological and Life Sciences Vol. 4 No. 1, 2016 ISSN 2056-5984
Progressive Academic Publishing, UK Page 15 www.idpublications.org
Fig 6: Spatial variation of Margelef Diversity Index along River Benue course at Makurdi
Fig7: Seasonal variation of Simpson Diversity Index along River Benue course at Makurdi
0
0.5
1
1.5
2
2.5
3
3.5
4
4.5
5
Station I Station II Staion III Station IV Station V
Sampling Location
Marg
ele
f D
ivers
ity I
nd
ex
0.82
0.84
0.86
0.88
0.9
0.92
0.94
0.96
0.98
SEASON 1 SEASON 2 SEASON 3 SEASON 4 SEASON 5
Seasons
Sim
pson
Dive
rsity
Inde
x
Coca-Cola Plc
Benue Brewery Ltd
Mikap Nigeria Ltd
Wurukum Abattoir
Wadata Market
European Journal of Advanced Research in Biological and Life Sciences Vol. 4 No. 1, 2016 ISSN 2056-5984
Progressive Academic Publishing, UK Page 16 www.idpublications.org
Fig8: Spatial variation of Simpson Diversity Index along River Benue course at Makurdi
Fig9: Seasonal variation of Menhinick’s Diversity Index along River Benue course at
Makurdi
0.7
0.75
0.8
0.85
0.9
0.95
1
Station I Station II Staion III Station IV Station V
Sampling Location
Sim
pso
n D
ivers
ity I
nd
ex
0
0.5
1
1.5
2
2.5
3
SEASON 1 SEASON 2 SEASON 3 SEASON 4 SEASON 5
Seasons
Men
hini
ck's
Dive
rsity
Inde
x
Coca-Cola Plc
Benue Brewery Ltd
Mikap Nigeria Ltd
Wurukum Abattoir
Wadata Market
European Journal of Advanced Research in Biological and Life Sciences Vol. 4 No. 1, 2016 ISSN 2056-5984
Progressive Academic Publishing, UK Page 17 www.idpublications.org
Fig10: Spatial variation of Menhinick’s Diversity Index along River Benue course at
Makurdi
Fig11: Seasonal variation of Pielou Evenness Index along River Benue course at Makurdi
1.9
2
2.1
2.2
2.3
2.4
2.5
2.6
2.7
Station I Station II Staion III Station IV Station V
Sampling Location
Men
hin
ick
Div
ers
ity I
nd
ex
0
0.2
0.4
0.6
0.8
1
1.2
SEASON 1 SEASON 2 SEASON 3 SEASON 4 SEASON 5
Seasons
Pielou
Even
ness
Inde
x
Coca-Cola Plc
Benue Brewery Ltd
Mikap Nigeria Ltd
Wurukum Abattoir
Wadata Market
European Journal of Advanced Research in Biological and Life Sciences Vol. 4 No. 1, 2016 ISSN 2056-5984
Progressive Academic Publishing, UK Page 18 www.idpublications.org
Fig12: Spatial variation of Pielou Evenness Index along River Benue course at Makurdi
Fig13: Seasonal variation of Simpson Dominance Index along River Benue course at
Makurdi
0
0.1
0.2
0.3
0.4
0.5
0.6
0.7
0.8
0.9
1
Station I Station II Staion III Station IV Station V
Sampling Location
Pie
lou
E
ven
ness I
nd
ex
0
0.5
1
1.5
2
2.5
SEASON 1 SEASON 2 SEASON 3 SEASON 4 SEASON 5
Seasons
Simp
son
Domi
nanc
e Ind
ex
Coca-Cola Plc
Benue Brewery Ltd
Mikap Nigeria Ltd
Wurukum Abattoir
Wadata Market
European Journal of Advanced Research in Biological and Life Sciences Vol. 4 No. 1, 2016 ISSN 2056-5984
Progressive Academic Publishing, UK Page 19 www.idpublications.org
Fig14: Spatial variation of Simpson Dominance Index along River Benue course at Makurdi
DISCUSSION
The spatial variation of Shannon diversity index at five locations during the study period in
River Benue at Makurdi varied from 1.81 - 2.91. The lowest value of 1.81 was obtained at
Benue brewery Plc and the highest value of 2.91 was at Coca-Cola plc. Similarly the seasonal
variation of the Shannon diversity ranged from 2.06-3.25. The highest value of 3.25 was
determined at Wadata market during rainy season, while at Benue brewery location the
lowest value was obtained. The result of the seasonal variation of Shannon diversity index
during this study disagrees with the report of an earlier study that reported Shannon diversity
that varied from 0.0 -1.60 during the dry season as compared to the wet season 0.0 – 1.41
(Nkwoji et al., 2010). The spatial variation of Shannon diversity index of this study
disagrees with the result of spatial variation of Shannon diversity of earlier studies (Esenowo
and Ugwumba, 2010 Edokpayi et al., 2010; Nkwoji et al., 2010; , Aggrey-Fynn et al., 2011
Andem et al., 2012; Chowdhary and Sharma .,2013, Nkwoji and Edokpayi 2013, Teferi et al.,
2013). The overall Shannon diversity index of benthic community in River Benue at
Makurdi during the study period is the product of all spatial and temporal changes affecting
the benthic fauna community structure (Edokpayi et al., 2010). The very low Shannon
diversity index at Benue brewery is an indication of environmental perturbation at this
location during the study period.
The spatial and temporal variation of Margalef diversity index varied from 2.10 – 4.44. The
lowest value was obtained at Benue brewery while the highest was at Coca-cola. This
variation is based basically on the number of species obtained at these locations during the
study period. Lower species obtained at the Benue brewery may be as a result of the stressed
environment in this area due to anthropogenic activities impact. This result also agrees with
the findings of other studies that report lower values of Margalef diversity index at different
locations (EdoKpayi et al., 2010; Sharma and Chowdhary, 2011 Chowdhary and Sharma
2013). However the result of this study disagree with the finding of studies that reported
Margalef’s index that varied from 0.79-2.57 in a Lagos Lagoon for two years and another that
varied from 2.87-3.89 in a stream in southern Nigeria respectively ( Nkwoji and Edokpayi
2013,Oribhabor and Enang 2013).
0
0.05
0.1
0.15
0.2
0.25
0.3
0.35
0.4
0.45
0.5
Station I Station II Staion III Station IV Station V
Sampling Location
Sim
pso
n D
om
inan
ce I
nd
ex
European Journal of Advanced Research in Biological and Life Sciences Vol. 4 No. 1, 2016 ISSN 2056-5984
Progressive Academic Publishing, UK Page 20 www.idpublications.org
The Simpson’s diversity index values obtained across the locations ranged from 0.80 – 0.95,
the lowest value was at Mikap Nigeria Ltd and the highest value at Wurukum abattoir.
Simpson’s diversity index obtained in this study was generally high. This may be attributed
to the less number of species that are obtained in River Benue during the study period. This
observation was also reported by Shah and Pandit (2013). They also reported that stable
communities have high diversity value (0.6 to 0.9). The Simpson’s diversity index does not
give true reflection of the benthic community structure in River Benue due to the emphasis of
the diversity on the number of species. However, the seasonal and spatial variation of
Simpson’s diversity index obtained in this study disagrees with the results of earlier studies
that reported lower range (Sharma and Chowdhary, 2011; Habib and Yousuf, 2012).
The spatial variation of Menhinick’s index during the study period ranged from 2.20 – 2.61.
Coca-cola had the lowest index value while Mikap Nigeria Ltd was the highest. The result of
Menhinick’s diversity index obtained during this study differs from the findings of an earlier
study that reported Menhinick’s diversity index that ranged from 0.06 – 0.87 (Nwankwo et
al., 2010). The low diversity associated with September 2012 may be ascribed to the effects
of flood that occur in River Benue during the month of September 2012.
The spatial variation of the evenness ranged from 0.89 (Mikap Nigeria Ltd) to 0.94
(Wurukum abattoir) during the study period. This finding is at variance with the result of
earlier study in River Tawi that reported evenness that ranged from 0.260-0.964 across study
stations (Chowdhary and Sharma 2013). The values of Pielou evenness are between 0 – 1.
When the value is getting closer to 1 it means that the individuals are equally distributed.
During this study the individuals of the benthic fauna were seems to be evenly distributed
throughout the study period. This is evident in the Pielou evenness values determined during
this study. The taxa richness, general diversity and evenness all revealed the destruction of
large population of benthic fauna in River Benue due to the impact of land based pollutants.
Similar observations were reported in tropical coastal ecosystem (Edokpayi et al., 2010).
In the course of this investigation seasonal and spatial Simpson’s dominance index ranged
from 0.001 – 0.31 and 0.003 – 0.06 respectively. The result of dominance across the locations
of this study differs significantly from that of River Tawi that varied from 0.093-
0.760(Chowdhary and Sharma 2013). The dominance of species with different levels of
pollution tolerance at different locations and seasons during the present study in River Benue
indicates distinct environmental conditions at the stations and in the course of the study.
CONCLUSION
It is clear from the diversity indices at the Benue Brewery and Mikap Nigeria Ltd showed the
lowest diversity compared to the other locations during the course of the study. These
location were located with low values of Shannon diversity index that is an indication of
perturbed ecosystem.
REFERENCES
1). Aggrey-Fynn, J., Galyuon, I., Aheto, D.W. and Okyere, I. (2011). Assessment of the
environmental conditions and benthic macro invertebrate communities in two
coastal lagoons in Ghana. Annals Bio. Res. 2(5): 413-424

European Journal of Advanced Research in Biological and Life Sciences Vol. 4 No. 1, 2016 ISSN 2056-5984
Progressive Academic Publishing, UK Page 21 www.idpublications.org
2). Andem, A.B., Okorafor, K.A., Udofia, U., Okete, J.A. and Ugwumba, A.A.A.(2012).
Composition, distribution and diversity of the benthic macro invertebrates of Ona
river South- west Nigeria. European J. of Zoo. Res. 1(2):47-58.
3). Barbour, M.T., Stribling, J.B. and Kar, J.R.( 1995). Multimetric Approach for the
Establishment Bio criteria and Measuring Biological Condition in Davies, W.S.
and Simon, T.P.( Editors) Biological Assessment and Criteria. Tools for Water
Resources Planning and Decision Making. Lewis Publishers, Boca Raton,
Florida. PP: 63-67.
4). Barbour, M. T. Gerrison J., Synder, B. D. and Sribling, J. B.(1999). Rapid Assessment
Protocols for use in Streams and Wadeable Rivers: Periphyton, Benthic
Macroinvertebrates and Fish. 2nd
Ed. United States Environmental protection
Agency, Washington D.C. 339 pp.
5). Basu, A., Sengupta, S., Dutta, S., Saha, A., Ghosh, P. and Roy, S.(2013). Studies on
macro benthic organisms in relation to water parameters at East Calculata
wetlands. J. of Env. Bio.34: 733-737.
6). Bilkovic, D. M., Roggero, M., Hershiner, C. H. and Havens, K. H. (2006). Influence of
Land use on macrobenthic communities near shore estuarine habitants. Estuaries
and Coast ,29:1185-1195.
7). Chowdhary, S and Sharma, K.K.(2013). Evaluation of macrobenthic invertebrates in the
longitudinal profile of a river(Tawi), originating from Shivalik hills. J. of Glo.
Biosci. 2(1):31-39.
8). Day, J.A. (1967). A Monograph on the Polychaetae of Southern African part I Errantia.
British Museum of Natural History, London. 458pp.
9). Dziock, F., Henle, K., Foeckler, F., Folluer, K. and Scholz, M. (2006). Biological
indicator systems in flood plains – a review. Int. Rev. Hydrobiol. 91(4): 271-291.
10). Edokpayi, C. A., Olowoporoku, A. O. and Uwadiae, R. E. (2010). The hydrochemistry
and macro benthic fauna characterics of an urban draining Greek Int. Journal of
Biodi. and Cons. 2(8): 196-203.
11). Esenowo, I.K. and Ugwumba, A.A.A.(2010). Composition and abundance of
macrobenthos in Majidun river Ikorordu Lagos state Nigeria. Res. J. Bio. Sci.
5(8): 556-560.
12). European Commission (2006). Indicators and methods for Ecological Status assessment
under the water frame work directive. European Union Joint Research Centre
Report, 113pp.
13). George, A.D.I., Abowei, J.F.N. and Daka, E.R. (2009). Benthic macroinvertebrate fauna
and physico-chemical parameters in Okpoka creek sediments Niger Delta,
Nigeria. Int. J. of Ani. And Vet. Adv. 1(2):59-65.
14). Habib, S. and Yousuf, A.R.(2012). Benthic macroinvertebrate community of Yousmarg
streams ( Doodganga stream and Khanshah Manshah canal) in Kashmir Himalaya,
India. J. of Ecol. and the Natur. Environ. 4(11):280-289.
15).Knobe, R. A. E., Roos, C. and Oirschot, M. C. M, (1995). Biological assessment methods
for water courses. UN/ECE Task Force on monitoring and assessment, Riza
repent nr. 95.066-1-86. Retrieved at http://www. Iwac – riza.org/IWAC/IWAC
site.nsf.on the Jan 18th
, 2011.
16).Margalef, R.(1967). Diversity and stability: A practical proposal and a model of
interdependence. Brookhaven Symposium on Biology,22: 25-37.
17). Merrit, R.W. and Cummins, K.W.( 1996). An Introduction to Aquatic Insects of North
America, 3rd
ed. Kendall/ Hunt Publishing Co.,Dubuque Iowa. 456pp.
European Journal of Advanced Research in Biological and Life Sciences Vol. 4 No. 1, 2016 ISSN 2056-5984
Progressive Academic Publishing, UK Page 22 www.idpublications.org
18). Nkwoji, J.A. and Edokpayi, C.A.(2013). Hydrochemistry and community structure of
benthic macroinvertebrates of Lagos Lagoon, Nigeria. Res. J. of Phar. Bio. and
Chem. Sci. 4(1):1119-1131.
19). Nkwoji, J. A. Yakub, A, Ajani, G. F. Balogun, K. J., Renuer, K. O., Igbo; J. K., Ariyo A.
A. and Bello, B. O. (2010). Seasonal variations in the water chemistry and benthic
macroinvertebrates of a south Western Lagoon, Lagos, Nigeria. J. Ameri. Sci.
6(3): 85-92.
20). Nwankwo, D.I., Chukwu, L.O. and Onyema, I.C.(2010). The hydrochemistry and biota
of thermal coolant water stressed tropical lagoon. Nature and Science 8(1):18-32.
21). Nyagba, J.L.(1995). The Geography of Benue State. In: A Benue Compedium, Denga,
D.I. (ed). Rapid Educational Publishers Ltd Calabar, pp . 85-87.
22). Ogbeibu, A.E.(2005). Biostatistics : A Practical Approach to Research and Data
Handling. Mindex Publishing Company Limited, Benin city, Nigeria 264pp.
23). Oribhabor, B.J. and Enang, N.A.(2013). An evaluation of the influence of physico-
chemical parameters on abundance of benthic macro-invertebrates of a perennial
tributary stream in Southern, Nigeria. Aqu. Bio. Res.1(2):17-25.
24). Pennak, R.W.( 1978). Freshwater Invertebrates of United States 2nd
ed. John Wiley and
Sons, New York. 810pp.
25). Pielou, E.C.( 1969). An Introduction to Mathematical Ecology. John Wiley New York,
286pp.
26). Quareshi, S.and Garg, J.K. (2013). Application of various biodiversity indices to benthic
macro invertebrate assemblages in the upper stretch of river Yamuna. Continental
J. Bio. Sci. 6(1):17-28.
27). Shah, J.A. and Pandit, A.K. (2013). Application of diversity indicesto Crustacean
community of Wular Lake, Kashmir Himalaya. Int. J. Biodivers. and Consererv.
5(6): 311-316
28). Shannon, C.E. and Weaver, W. (1963). The Mathematical Theory of Communication.
University of IIIinonois, Urban Press IIIinois, 177pp.
29). Sharma, K.K. and Chowdhary, S.( 2011). Macro invertebrate assemblages as biological
indicators of pollution in central Himalayan, river Jawi ( J and K). Int. J. Biodi.
and Conserv., 3(5): 167-174.
30). Teferi, M., Haileselasie, T.H., Asmelash, T., Selasie, H.G., Alem, G., Amare, S.,
Weldegenimra, K., Tesfan, S., Kros, S., Equar, C. and Bitew, H.L.(2013).
Influence of water quality on the diversity and distribution of macro-invertebrates
in high land streams Northern Ethiopia. J. of Agric. Sci (2):11-25.
31). Udo, K.R. (1981). Geographical Regions of Nigeria. Morrison and Gibbs Ltd
London.pp.138-149.
32). Vyas, V.and Bhawsar, A. (2013). Benthic community structure in Barna stream
network of Naramada river basin. Int. J. of Environ. Bio. 3(2): 57-63.
33). Waters and Rivers Commission (2001). Water Facts. 2nd
Edition. Retrieved at
http://www.wrc.wa.gov.au/ribbon on the 30th July, 2010. 11pp.
34). Welcomme, R.L.( 1986). Fish of the Nigerian System. The Ecology of River Systems.
In: Havies, B.R. and Walker, K.F.(Eds). Dr. Junk Publishers, Dordierch
Netherlands., pp: 25-48.