seasons & biomes - globe · globe® 2010 1 globe seasons & biomes seasons & biomes. how...
TRANSCRIPT
GLOBE® 2010 1 GLOBE Seasons & Biomes
Seasons & Biomes
How to Make a Climograph from Your Local Weather Data

GLOBE® 2010 2 GLOBE Seasons & Biomes
Season and Biomes is being developed by professional scientists and educators, with funding from the National Science Foundation under award number GEO-0627941.
Any opinions, findings, conclusions or recommendations expressed in this material are those of the developers and do not necessarily reflect the views of the National Science Foundation.
Principal and Co-Investigators:
Elena Bautista Sparrow 1 Rebecca Boger 2
Kim Morris 1
Elissa Levine 3
David Verbyla 1
Evaluator:
Leslie S. Gordon 4
1. University of Alaska Fairbanks2. Brooklyn College 3. Greenbelt, MD 4. Gordon Consulting, Inc.5. The GLOBE Program Office6. Arlington, VA7. Walailak University
Project Coordinator:
Martha Robus Kopplin 1
GLOBE Program Lead:
Sheila Yule 5
The GLOBE Seasons and Biomes Project would like to extend a special appreciation to pilot teachers involved in the development and review of these activities.
Project Contributors:
For more information contact the GLOBE Help Desk: [email protected]
Contact the Seasons and Biomes Project directly at: [email protected]
Additional Contributors:
Jessica Robin 6 Kenji Yoshikawa 1
Martin Jeffries 1
Krisanadej Jaroensutasinee 7
Mullica Jaroensutasinee 1
GLOBE® 2010 3 GLOBE Seasons & Biomes
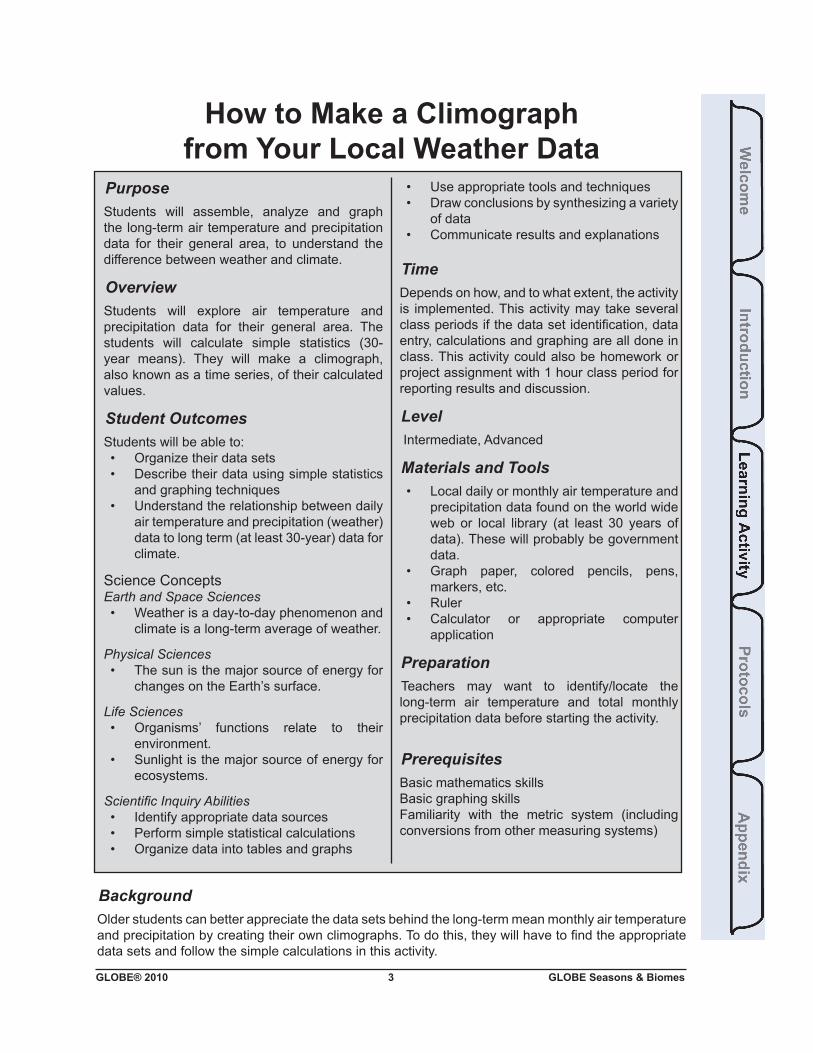
Purpose Students will assemble, analyze and graph the long-term air temperature and precipitation data for their general area, to understand the difference between weather and climate.
OverviewStudents will explore air temperature and precipitation data for their general area. The students will calculate simple statistics (30-year means). They will make a climograph, also known as a time series, of their calculated values.
Student OutcomesStudents will be able to:• Organize their data sets• Describe their data using simple statistics
and graphing techniques• Understand the relationship between daily
air temperature and precipitation (weather) data to long term (at least 30-year) data for climate.
Science ConceptsEarth and Space Sciences• Weather is a day-to-day phenomenon and
climate is a long-term average of weather.
Physical Sciences• The sun is the major source of energy for
changes on the Earth’s surface.
Life Sciences • Organisms’ functions relate to their
environment.• Sunlight is the major source of energy for
ecosystems.
Scientific Inquiry Abilities• Identify appropriate data sources• Perform simple statistical calculations• Organize data into tables and graphs
How to Make a Climograph from Your Local Weather Data
• Use appropriate tools and techniques• Draw conclusions by synthesizing a variety
of data• Communicate results and explanations
TimeDepends on how, and to what extent, the activity is implemented. This activity may take several class periods if the data set identification, data entry, calculations and graphing are all done in class. This activity could also be homework or project assignment with 1 hour class period for reporting results and discussion.
Level Intermediate, Advanced
Materials and Tools • Local daily or monthly air temperature and
precipitation data found on the world wide web or local library (at least 30 years of data). These will probably be government data.
• Graph paper, colored pencils, pens, markers, etc.
• Ruler• Calculator or appropriate computer
application
PreparationTeachers may want to identify/locate the long-term air temperature and total monthly precipitation data before starting the activity.
PrerequisitesBasic mathematics skillsBasic graphing skillsFamiliarity with the metric system (including conversions from other measuring systems)
BackgroundOlder students can better appreciate the data sets behind the long-term mean monthly air temperature and precipitation by creating their own climographs. To do this, they will have to find the appropriate data sets and follow the simple calculations in this activity.
GLOBE® 2010 4 GLOBE Seasons & Biomes
Once data have been acquired, it is necessary to organize them so that they can be examined in a systematic way. The first step is to create a table of the data with clearly labeled columns. Next, it is useful to make a simple graph of the data.
After the completion of the data organization and basic graphing, the data can be explored using a combination of statistics and specialized graphing techniques. Statistics are the mathematics of collecting and analyzing data to draw conclusions and make predictions and are used to answer real-world questions.
What to Do and How to Do It
• A climograph depicts two different kinds of weather data:
1. Monthly mean air temperature (°C); and2. Monthly total precipitation (mm).
• Ask students to calculate daily mean temperatures, monthly air temperatures and total monthly precipitation using the Barrow data given below.
• Discuss what data are used to create the mean values found in the climograph and how they are calculated.
• Ask the students how these data can be organized or displayed for easy analysis and comparison with other data sets (tables and graphs). What are the advantages and disadvantages of each method?
• Find data sets to use for the long-term monthly mean air temperature and monthly mean total precipitation values (preferably 30 years long with the first year ending in “1”, i.e., 1941, and ending with a year that ends in “0”, i.e., 1970). These may be found in local, regional or national weather offices (government), in reference books or online.
• Organize the data into a table or tables so that it is easy to read and understand (see data table below).
• Perform the appropriate calculations and create a climograph (either individually or in small groups) with your data using the example below (Barrow, Alaska, USA) as a model of what to do.
• Complete the worksheet and discuss the results.
How to Calculate Your Own Values for a Climograph
The following is an example of how to create a climograph from local weather data. Meteorological data from Barrow, AK, USA is used throughout.
Air TemperatureDaily mean air temperature is calculated by averaging the daily minimum and maximum air temperatures. Monthly mean air temperature is calculated by averaging the mean daily air temperature for a given month.
In some countries, it will be necessary to convert temperature values from degrees Fahrenheit to degrees Celcius:
(°F – 32) x 5/9 = °C

GLOBE® 2010 5 GLOBE Seasons & Biomes
The air temperature data from Barrow, AK (Table 1) show the daily mean air temperatures ([daily max + daily min]/2 = daily mean) and (Table 2) monthly mean air temperatures (sum of daily mean values / number of days) in both degrees °F and degrees °C for February 2000. Students can do the calculations on daily mean and monthly mean temperatures.
BARROW, AK (71.30ºN, 156.78ºW, Elevation 0 m)Air Temperature (°F) Air Temperature (°C)
DAY MAX MINMEAN DAILY DAY MAX MIN
MEAN DAILY
1 -19 -39 -29.0 1 -28.3 -39.4 -33.92 -19 -47 -33.0 2 -28.3 -43.9 -36.13 -18 -34 -26.0 3 -27.8 -36.7 -32.24 17 -18 -0.5 4 -8.3 -27.8 -18.15 2 -21 -9.5 5 -16.7 -29.4 -23.16 -2 -18 -10.0 6 -18.9 -27.8 -23.37 -2 -22 -12.0 7 -18.9 -30.0 -24.48 -14 -25 -19.5 8 -25.6 -31.7 -28.69 -15 -20 -17.5 9 -26.1 -28.9 -27.510 -1 -17 -9.0 10 -18.3 -27.2 -22.811 16 -1 -7.5 11 -8.9 -18.3 -13.612 10 3 -6.5 12 -12.2 -16.1 -14.213 3 -1 1.0 13 -16.1 -18.3 -17.214 -1 -17 -9.0 14 -18.3 -27.2 -22.815 -11 -22 -16.5 15 -23.9 -30.0 -26.916 -2 -11 -6.5 16 -18.9 -23.9 -21.417 -7 -26 -16.5 17 -21.2 -32.2 -26.918 -22 -27 -24.5 18 -30.0 -32.8 -31.419 -17 -24 -20.5 19 -27.2 -31.1 -29.220 -18 -23 -20.5 20 -27.8 -30.6 -29.221 -17 -26 -21.5 21 -27.2 -32.2 -29.722 -11 -24 -17.5 22 -23.9 -31.1 -27.523 -14 -28 -21.0 23 -25.6 -33.3 -29.424 -12 -23 -17.5 24 24.4 -35.0 -27.525 -14 -24 -19.0 25 -25.6 -34.4 -28.326 -23 -28 -25.5 26 -30.6 -33.3 -31.927 -14 -31 -22.5 27 -25.6 -35.0 -30.328 -14 -30 -22.0 28 -25.6 -34.4 -30.029 -18 -31 -24.5 29 -27.8 -35.0 -31.4
MonthlyAverage -8.9 -22.6 -15.7
MonthlyAverage -22.7 -30.3 -26.5
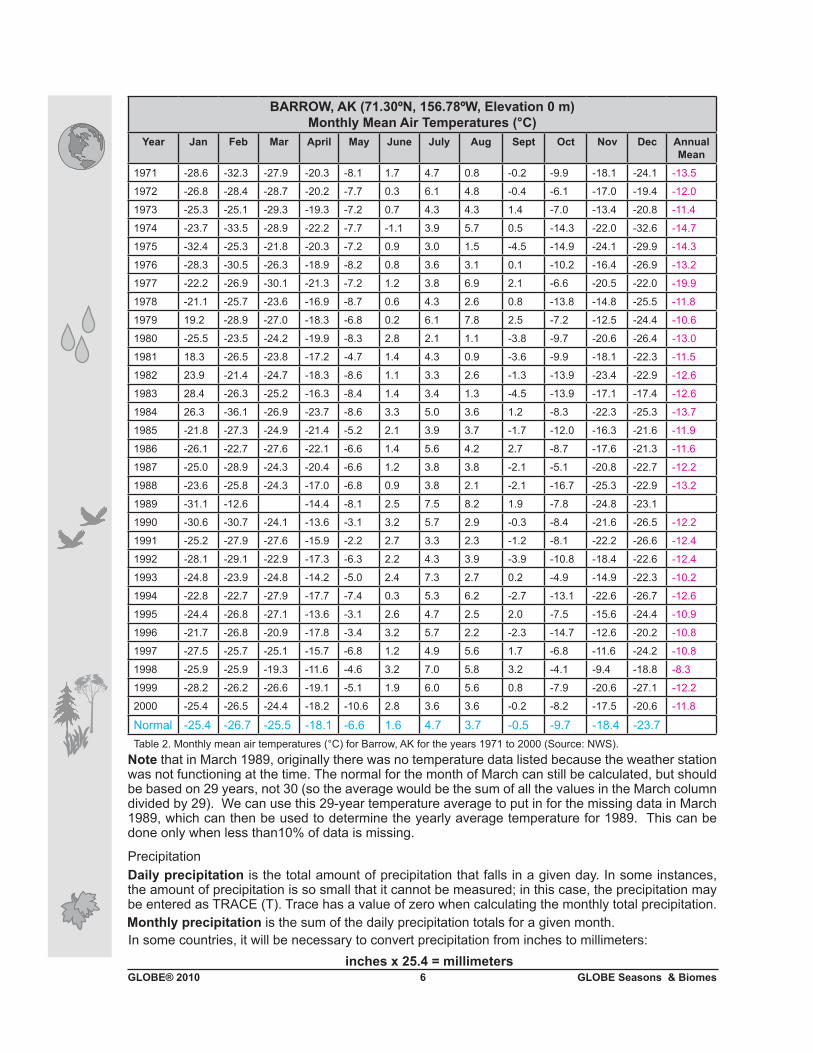
A long-term monthly mean air temperature is calculated by averaging the mean monthly air temperature (for a given month) over several years. For example, the National Weather Service of the United States of America calculated 30 year Normals (1971-2000 is the current period preceded by 1961-1990). Table 2 lists the monthly mean air temperatures (°C) for Barrow, AK for the years 1971 to 2000 (Source: NWS) and shows the calculated normals. Have students do the calculations using an excel file of the data.
Table 1. Barrow, AK air temperature data from February, 2000. (Source: NWS)
GLOBE® 2010 6 GLOBE Seasons & Biomes
BARROW, AK (71.30ºN, 156.78ºW, Elevation 0 m) Monthly Mean Air Temperatures (°C)
Year Jan Feb Mar April May June July Aug Sept Oct Nov Dec Annual Mean
1971 -28.6 -32.3 -27.9 -20.3 -8.1 1.7 4.7 0.8 -0.2 -9.9 -18.1 -24.1 -13.5
1972 -26.8 -28.4 -28.7 -20.2 -7.7 0.3 6.1 4.8 -0.4 -6.1 -17.0 -19.4 -12.0
1973 -25.3 -25.1 -29.3 -19.3 -7.2 0.7 4.3 4.3 1.4 -7.0 -13.4 -20.8 -11.4
1974 -23.7 -33.5 -28.9 -22.2 -7.7 -1.1 3.9 5.7 0.5 -14.3 -22.0 -32.6 -14.7
1975 -32.4 -25.3 -21.8 -20.3 -7.2 0.9 3.0 1.5 -4.5 -14.9 -24.1 -29.9 -14.3
1976 -28.3 -30.5 -26.3 -18.9 -8.2 0.8 3.6 3.1 0.1 -10.2 -16.4 -26.9 -13.2
1977 -22.2 -26.9 -30.1 -21.3 -7.2 1.2 3.8 6.9 2.1 -6.6 -20.5 -22.0 -19.9
1978 -21.1 -25.7 -23.6 -16.9 -8.7 0.6 4.3 2.6 0.8 -13.8 -14.8 -25.5 -11.8
1979 19.2 -28.9 -27.0 -18.3 -6.8 0.2 6.1 7.8 2.5 -7.2 -12.5 -24.4 -10.6
1980 -25.5 -23.5 -24.2 -19.9 -8.3 2.8 2.1 1.1 -3.8 -9.7 -20.6 -26.4 -13.0
1981 18.3 -26.5 -23.8 -17.2 -4.7 1.4 4.3 0.9 -3.6 -9.9 -18.1 -22.3 -11.5
1982 23.9 -21.4 -24.7 -18.3 -8.6 1.1 3.3 2.6 -1.3 -13.9 -23.4 -22.9 -12.6
1983 28.4 -26.3 -25.2 -16.3 -8.4 1.4 3.4 1.3 -4.5 -13.9 -17.1 -17.4 -12.6
1984 26.3 -36.1 -26.9 -23.7 -8.6 3.3 5.0 3.6 1.2 -8.3 -22.3 -25.3 -13.7
1985 -21.8 -27.3 -24.9 -21.4 -5.2 2.1 3.9 3.7 -1.7 -12.0 -16.3 -21.6 -11.9
1986 -26.1 -22.7 -27.6 -22.1 -6.6 1.4 5.6 4.2 2.7 -8.7 -17.6 -21.3 -11.6
1987 -25.0 -28.9 -24.3 -20.4 -6.6 1.2 3.8 3.8 -2.1 -5.1 -20.8 -22.7 -12.2
1988 -23.6 -25.8 -24.3 -17.0 -6.8 0.9 3.8 2.1 -2.1 -16.7 -25.3 -22.9 -13.2
1989 -31.1 -12.6 -14.4 -8.1 2.5 7.5 8.2 1.9 -7.8 -24.8 -23.1
1990 -30.6 -30.7 -24.1 -13.6 -3.1 3.2 5.7 2.9 -0.3 -8.4 -21.6 -26.5 -12.2
1991 -25.2 -27.9 -27.6 -15.9 -2.2 2.7 3.3 2.3 -1.2 -8.1 -22.2 -26.6 -12.4
1992 -28.1 -29.1 -22.9 -17.3 -6.3 2.2 4.3 3.9 -3.9 -10.8 -18.4 -22.6 -12.4
1993 -24.8 -23.9 -24.8 -14.2 -5.0 2.4 7.3 2.7 0.2 -4.9 -14.9 -22.3 -10.2
1994 -22.8 -22.7 -27.9 -17.7 -7.4 0.3 5.3 6.2 -2.7 -13.1 -22.6 -26.7 -12.6
1995 -24.4 -26.8 -27.1 -13.6 -3.1 2.6 4.7 2.5 2.0 -7.5 -15.6 -24.4 -10.9
1996 -21.7 -26.8 -20.9 -17.8 -3.4 3.2 5.7 2.2 -2.3 -14.7 -12.6 -20.2 -10.8
1997 -27.5 -25.7 -25.1 -15.7 -6.8 1.2 4.9 5.6 1.7 -6.8 -11.6 -24.2 -10.8
1998 -25.9 -25.9 -19.3 -11.6 -4.6 3.2 7.0 5.8 3.2 -4.1 -9.4 -18.8 -8.3
1999 -28.2 -26.2 -26.6 -19.1 -5.1 1.9 6.0 5.6 0.8 -7.9 -20.6 -27.1 -12.2
2000 -25.4 -26.5 -24.4 -18.2 -10.6 2.8 3.6 3.6 -0.2 -8.2 -17.5 -20.6 -11.8
Normal -25.4 -26.7 -25.5 -18.1 -6.6 1.6 4.7 3.7 -0.5 -9.7 -18.4 -23.7
Note that in March 1989, originally there was no temperature data listed because the weather station was not functioning at the time. The normal for the month of March can still be calculated, but should be based on 29 years, not 30 (so the average would be the sum of all the values in the March column divided by 29). We can use this 29-year temperature average to put in for the missing data in March 1989, which can then be used to determine the yearly average temperature for 1989. This can be done only when less than10% of data is missing.
PrecipitationDaily precipitation is the total amount of precipitation that falls in a given day. In some instances, the amount of precipitation is so small that it cannot be measured; in this case, the precipitation may be entered as TRACE (T). Trace has a value of zero when calculating the monthly total precipitation.
Table 2. Monthly mean air temperatures (°C) for Barrow, AK for the years 1971 to 2000 (Source: NWS).
Monthly precipitation is the sum of the daily precipitation totals for a given month.In some countries, it will be necessary to convert precipitation from inches to millimeters:
inches x 25.4 = millimeters
GLOBE® 2010 7 GLOBE Seasons & Biomes
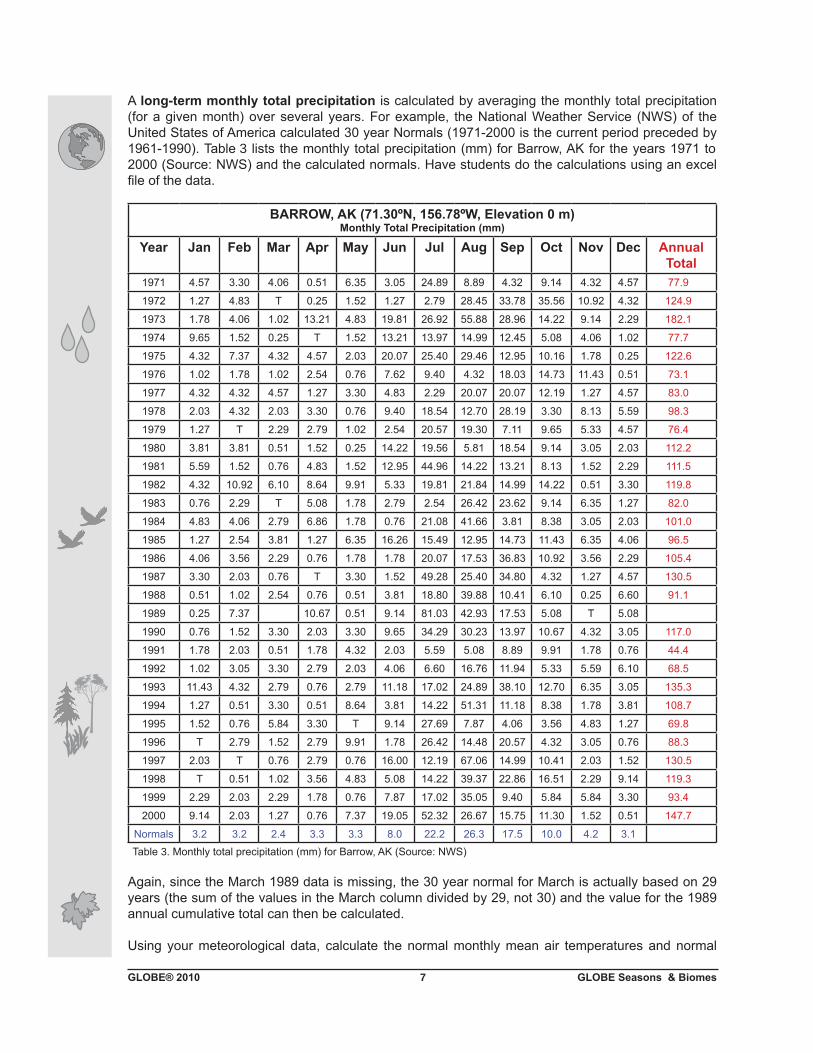
A long-term monthly total precipitation is calculated by averaging the monthly total precipitation (for a given month) over several years. For example, the National Weather Service (NWS) of the United States of America calculated 30 year Normals (1971-2000 is the current period preceded by 1961-1990). Table 3 lists the monthly total precipitation (mm) for Barrow, AK for the years 1971 to 2000 (Source: NWS) and the calculated normals. Have students do the calculations using an excel file of the data.
BARROW, AK (71.30ºN, 156.78ºW, Elevation 0 m)Monthly Total Precipitation (mm)
Year Jan Feb Mar Apr May Jun Jul Aug Sep Oct Nov Dec Annual Total
1971 4.57 3.30 4.06 0.51 6.35 3.05 24.89 8.89 4.32 9.14 4.32 4.57 77.9
1972 1.27 4.83 T 0.25 1.52 1.27 2.79 28.45 33.78 35.56 10.92 4.32 124.9
1973 1.78 4.06 1.02 13.21 4.83 19.81 26.92 55.88 28.96 14.22 9.14 2.29 182.1
1974 9.65 1.52 0.25 T 1.52 13.21 13.97 14.99 12.45 5.08 4.06 1.02 77.7
1975 4.32 7.37 4.32 4.57 2.03 20.07 25.40 29.46 12.95 10.16 1.78 0.25 122.6
1976 1.02 1.78 1.02 2.54 0.76 7.62 9.40 4.32 18.03 14.73 11.43 0.51 73.1
1977 4.32 4.32 4.57 1.27 3.30 4.83 2.29 20.07 20.07 12.19 1.27 4.57 83.0
1978 2.03 4.32 2.03 3.30 0.76 9.40 18.54 12.70 28.19 3.30 8.13 5.59 98.3
1979 1.27 T 2.29 2.79 1.02 2.54 20.57 19.30 7.11 9.65 5.33 4.57 76.4
1980 3.81 3.81 0.51 1.52 0.25 14.22 19.56 5.81 18.54 9.14 3.05 2.03 112.2
1981 5.59 1.52 0.76 4.83 1.52 12.95 44.96 14.22 13.21 8.13 1.52 2.29 111.5
1982 4.32 10.92 6.10 8.64 9.91 5.33 19.81 21.84 14.99 14.22 0.51 3.30 119.8
1983 0.76 2.29 T 5.08 1.78 2.79 2.54 26.42 23.62 9.14 6.35 1.27 82.0
1984 4.83 4.06 2.79 6.86 1.78 0.76 21.08 41.66 3.81 8.38 3.05 2.03 101.0
1985 1.27 2.54 3.81 1.27 6.35 16.26 15.49 12.95 14.73 11.43 6.35 4.06 96.5
1986 4.06 3.56 2.29 0.76 1.78 1.78 20.07 17.53 36.83 10.92 3.56 2.29 105.4
1987 3.30 2.03 0.76 T 3.30 1.52 49.28 25.40 34.80 4.32 1.27 4.57 130.5
1988 0.51 1.02 2.54 0.76 0.51 3.81 18.80 39.88 10.41 6.10 0.25 6.60 91.1
1989 0.25 7.37 10.67 0.51 9.14 81.03 42.93 17.53 5.08 T 5.08
1990 0.76 1.52 3.30 2.03 3.30 9.65 34.29 30.23 13.97 10.67 4.32 3.05 117.0
1991 1.78 2.03 0.51 1.78 4.32 2.03 5.59 5.08 8.89 9.91 1.78 0.76 44.4
1992 1.02 3.05 3.30 2.79 2.03 4.06 6.60 16.76 11.94 5.33 5.59 6.10 68.5
1993 11.43 4.32 2.79 0.76 2.79 11.18 17.02 24.89 38.10 12.70 6.35 3.05 135.3
1994 1.27 0.51 3.30 0.51 8.64 3.81 14.22 51.31 11.18 8.38 1.78 3.81 108.7
1995 1.52 0.76 5.84 3.30 T 9.14 27.69 7.87 4.06 3.56 4.83 1.27 69.8
1996 T 2.79 1.52 2.79 9.91 1.78 26.42 14.48 20.57 4.32 3.05 0.76 88.3
1997 2.03 T 0.76 2.79 0.76 16.00 12.19 67.06 14.99 10.41 2.03 1.52 130.5
1998 T 0.51 1.02 3.56 4.83 5.08 14.22 39.37 22.86 16.51 2.29 9.14 119.3
1999 2.29 2.03 2.29 1.78 0.76 7.87 17.02 35.05 9.40 5.84 5.84 3.30 93.4
2000 9.14 2.03 1.27 0.76 7.37 19.05 52.32 26.67 15.75 11.30 1.52 0.51 147.7
Normals 3.2 3.2 2.4 3.3 3.3 8.0 22.2 26.3 17.5 10.0 4.2 3.1
Again, since the March 1989 data is missing, the 30 year normal for March is actually based on 29 years (the sum of the values in the March column divided by 29, not 30) and the value for the 1989 annual cumulative total can then be calculated.
Using your meteorological data, calculate the normal monthly mean air temperatures and normal
Table 3. Monthly total precipitation (mm) for Barrow, AK (Source: NWS)

GLOBE® 2010 8 GLOBE Seasons & Biomes
monthly precipitaition totals for your area and complete the table and then graph the data.
In the case of the Barrow, AK example (1971-2000), the table would be completed as follows:
Jan Feb Mar Apr May Jun Jul Aug Sep Oct Nov DecMean Air Temp (oC)
-25.4 -26.7 -25.5 -18.1 -6.6 1.6 4.7 3.7 -0.5 -9.7 -18.4 -23.7
Mean Total Precip (mm)
3.2 3.2 2.4 3.3 3.3 8.0 22.2 26.3 17.5 10.0 4.2 3.1
Repeat with data from another site. This could be a location within your local biome, in an adjacent biome, or within the same biome as your location but at a different location on Earth, i.e., Barrow, USA is in the tundra biome, so is Tiksi in the Russian Federation.
Further Investigation• Ask students to work in small groups to find data from other biomes and create climographs
for those areas. Then they can compare and contrast them with their local climate data. Ask questions to support and extend learning. Suggest that they pay special attention to the scales on the Y axes.
• Ask the students to look at the biome definitions. Based on the annual air temperature and precipitation patterns described, ask them into which biome does each site belong. What are the main features of these biomes? What are the main plant groups that live here? What “human impact” can you see in the accompanying images of the sites?
Once students have mastered biomes and climographs they can visit:1. NASA Earth Observatory Mission: Biomes http://earthobservatory.nasa.gov/Experiments/Biome/
index.php where they can test their knowledge of biomes and climographs;2. “Great Graph Match” http://earthobservatory.nasa.gov/Experiments/Biome/graphindex.php
where they can match temperature and precipitation data to the correct biome; and3. “To Plant or Not to Plant” http://earthobservatory.nasa.gov/Experiments/Biome/plantindex.php
where they can match plants with the correct biome.

GLOBE® 2010 9 GLOBE Seasons & Biomes
Extensions of Basic Learning ActivitySee the GLOBE Earth as a System Learning Activity (Seasons and Phenology) P7: Limiting Factors in Ecosystems (www.globe.gov/tctg/tgtoc.jsp). This learning activity compares Vegetation Vigor with Monthly Temperature and Precipitation for Tundra, South African Wooded Grassland, Boreal Evergreen Forest and Boreal Deciduous Forest. This makes an explicit connection between air temperature and precipitation and the vegetation within a biome.

GLOBE® 2010 10 GLOBE Seasons & Biomes
Name:
Create a Climograph Using Your Local Data - Worksheet
1. Identify the nearest city or town to your study area where long-term air temperature and precipitation data are acquired:
Name: Latitude: °N or °S, Longitude: ° E or °W
2. Organize your data and calculate the needed values to create a climograph. Attach your work.
3. Complete the table:
Jan Feb Mar Apr May Jun Jul Aug Sep Oct Nov DecMean Air Temp (oC)Mean Total
Precip (mm)
4. Graph the data and paste the graph(s) here.
5. Questions:f. Are the monthly air temperature averages and precipitation totals the same from year-to- year? Why or why not?g. Are the long-term averages/totals the same? Why or why not?h. Which year was the warmest? Which year was the coldest?i. Which year was the wettest? Which year was the driest?j. Is there a trend in the data? Are temperatures becoming warmer or colder through time? Is your site becoming wetter or drier through time?k. What else might you be able to say about the climate of your site from these data?