seattle public utilities adaptive management plan cedar ... · application of adaptive management...
TRANSCRIPT
Tetra Tech/KCM, Inc. 1420 5th Avenue, Suite 600, Seattle, WA 98101
Seattle Public Utilities
Adaptive Management Plan Cedar River Sockeye Hatchery
February 2006

ADAPTIVE MANAGEMENT PLAN CEDAR RIVER SOCKEYE HATCHERY
February 2006
Prepared for: Seattle Public Utilities
710 Second Avenue Seattle, WA 98104
Prepared by:
Tetra Tech/KCM, Inc.
1420 5th Avenue, Suite 600 Seattle, Washington 98101(206) 883-9300
Project #2190030

i
Adaptive Management Plan Cedar River Sockeye Hatchery
TABLE OF CONTENTS Title Page No.
Table of Contents ............................................................................................. i List of Tables .................................................................................................. iii List of Figures ................................................................................................. iv
1. Introduction 1.1 Executive Summary ....................................................................................... 1-1
1.1.1 AMP Purpose and Objectives ............................................................ 1-1 1.1.2 Challenges of Adaptive Management ............................................... 1-2 1.1.3 Development of This AMP ................................................................. 1-3 1.1.4 Key Features of this AMP ................................................................. 1-4 1.1.5 AMP Implementation ........................................................................ 1-6
1.2 Background .................................................................................................... 1-7 1.3 Summary ........................................................................................................ 1-9
2. Key Uncertainties 2.1 Uncertainty No. 1—Are Hatchery and Naturally Produced Fry
Similar in Size, Growth and Migration Timing, and at a Stable Population Composition? ........................................................................... 2-1 2.1.1 Definition and Importance ................................................................ 2-1 2.1.2 Existing Data and Knowledge ........................................................... 2-2 2.1.3 Remaining Unknowns ....................................................................... 2-5 2.1.4 Hypotheses ......................................................................................... 2-6 2.1.5 Monitoring and Research Plan .......................................................... 2-6 2.1.6 Adaptive Management Actions ......................................................... 2-8
2.2 Uncertainty No. 2—Does the Hatchery Reduce the Reproductive Success of Cedar River Sockeye Salmon? ................................................ 2-12 2.2.1 Definition and Importance .............................................................. 2-12 2.2.2 Existing Data and Knowledge ......................................................... 2-13 2.2.3 Remaining Unknowns ..................................................................... 2-14 2.2.4 Hypotheses ....................................................................................... 2-15 2.2.5 Monitoring and Research Plan ........................................................ 2-15 2.2.6 Adaptive Management Actions ....................................................... 2-18
2.3 Uncertainty No. 3—Will the Hatchery Adversely Affect Sockeye Populations Outside the Cedar River? .................................................... 2-24 2.3.1 Definition and Importance .............................................................. 2-24 2.3.2 Existing Data and Knowledge ......................................................... 2-25 2.3.3 Remaining Unknowns ..................................................................... 2-25 2.3.4 Hypotheses ....................................................................................... 2-26 2.3.5 Monitoring and Research Plan ........................................................ 2-26 2.3.6 Adaptive Management Actions ....................................................... 2-28

...TABLE OF CONTENTS
ii
2.4 Uncertainty No. 4—Will the Hatchery Produce Adverse Changes in Chinook Salmon Populations? ............................................................. 2-30 2.4.1 Definition and Importance .............................................................. 2-30 2.4.2 Existing Data and Knowledge ......................................................... 2-30 2.4.3 Remaining Unknowns ..................................................................... 2-33 2.4.4 Hypotheses ....................................................................................... 2-34 2.4.5 Monitoring and Research Plan ........................................................ 2-34 2.4.6 Adaptive Management Actions ....................................................... 2-35
2.5 Uncertainty No 5—Will Increased Hatchery Production Alter Aquatic Community Structure within the Lake Washington System ....................................................................................................... 2-37 2.5.1 Definition and Importance .............................................................. 2-37 2.5.2 Existing Data and Knowledge ......................................................... 2-38 2.5.3 Remaining Unknowns ..................................................................... 2-38 2.5.4 Hypotheses ....................................................................................... 2-41 2.5.5 Monitoring and Research Plan ........................................................ 2-41 2.5.6 Adaptive Management Actions ....................................................... 2-42
3. Adaptive Management Summary
4. AMP Management 4.1 Strategy for Success .................................................................................... 4-1 4.2 Relevant Organizations, Committees and Panels ..................................... 4-3
4.2.1 City of Seattle..................................................................................... 4-3 4.2.2 Washington Department of Fish & Wildlife ..................................... 4-3 4.2.3 Muckleshoot Tribe ............................................................................. 4-3 4.2.4 National Marine Fisheries Service ................................................... 4-4 4.2.5 U.S. Fish and Wildlife Service .......................................................... 4-4 4.2.6 King County ....................................................................................... 4-4 4.2.7 City of Renton .................................................................................... 4-4 4.2.8 U.S. Army Corps of Engineers .......................................................... 4-4 4.2.9 The Cedar River Anadromous Fish Committee ............................... 4-4 4.2.10 The Science Panel ............................................................................ 4-5
4.3 Management Principles .............................................................................. 4-5 4.4 AMP Participant Relationships ................................................................. 4-6
4.4.1 Parties to the Landsburg Mitigation Agreement ............................. 4-6 4.4.2 Adaptive Management Work Group ................................................. 4-6 4.4.3 Technical Work Group ....................................................................... 4-8 4.4.4 Independent Scientific Advisors ....................................................... 4-9 4.4.5 Hatchery Management .................................................................... 4-10 4.4.6 Public Involvement .......................................................................... 4-10
4.5 AMP Implementation ............................................................................... 4-10 4.6 Data Acquisition and Management System ............................................ 4-11 4.7 Dispute Resolution Process ...................................................................... 4-11 4.8 Process for Responding When Thresholds Are Exceeded ...................... 4-12 4.9 Summary ................................................................................................... 4-12
5. Literature Cited

...TABLE OF CONTENTS
iii
LIST OF TABLES
No. Title Page No.
2-1 Cedar River Fry Estimates Generated from the Fry Trapping Studies Conducted Near the Mouth of the River ............................................................ 2-3 2-2 Median Migration Dates of Hatchery, Naturally Produced, and Combined
Sockeye Fry in the Cedar River from 1992-2002 ............................................... 2-3 2-3 Annual Budget Allocation for Hypotheses Related to Similarity in Fry Size,
Growth, and Migration Timing between Hatchery and Naturally Produced Fry, as well as the Cedar River Juvenile Population Composition ................... 2-9
2-4 Factors (Other Than Water Temperature) that Could Cause Earlier Migration Timing of Hatchery Fish as Compared to Naturally Produced Fish and Possible Methods of Correction ......................................................... 2-10
2-5 Factors that Could Cause a Difference in Size of Hatchery and Naturally Produced Fry and Possible Methods of Correction .......................................... 2-11
2-6 Factors that Could Cause Differential Growth Between Hatchery and Naturally Produced Pre-Smolts and Possible Methods of Correction ............ 2-11
2-7 Factors that Could Allow a Change in the Representation of Hatchery Fish in the Pre-Smolt Population and Possible Methods of Correction.......... 2-12 2-8 Budget Allocation for Hypotheses Related to Reproductive Fitness and
Genetic Composition of Cedar River Sockeye .................................................. 2-18 2-9 Factors that Could Contribute to Differential Size and Age at Maturity
for Cedar River Sockeye and Possible Methods of Correction ......................... 2-19 2-10 Factors that Could Contribute to Reduced Egg Size and Fecundity in
Cedar River Sockeye Females and Possible Methods of Correction ............... 2-20 2-11 Factors that Could Contribute to Differential Spawning Timing and
Locations for Cedar River Sockeye and Possible Methods of Correction ........ 2-21 2-12 Factors that Could Contribute to Differential Reproductive Success for
Cedar River Sockeye and Possible Methods of Correction .............................. 2-23 2-13 Factors that Could Contribute to a Change in Genetic Composition for
Cedar River Sockeye and Possible Methods of Correction .............................. 2-24 2-14 Budget Allocation for Hypotheses Related to Effects to Other Lake
Washington Basin Sockeye Populations .......................................................... 2-28 2-15 Factors that Could Contribute to Harvest of Non-Cedar River Sockeye and
Possible Methods of Correction ......................................................................... 2-29 2-16 Factors that Could Contribute to Straying of Cedar River Sockeye and
Possible Methods of Correction ......................................................................... 2-30 2-17 Budget Allocation for Hypotheses Related to Effects of the Broodstock
Collection Facility and Increased Numbers of Sockeye on Chinook Redds in the Cedar River .................................................................................. 2-35
2-18 Factors that Could Contribute to Delay of Migrating Chinook and a Change in Spawning Distribution and Possible Methods of Correction ........ 2-36
2-19 Factors that Could Contribute to Sockeye Redd Superimposition on Chinook Redds and Declining Chinook Reproductive Success and Possible Methods of Correction ......................................................................... 2-37
2-20 Budget Allocation for Hypotheses Related to Lake Washington Ecosystem Effects from Increased Sockeye Numbers ..................................... 2-43
...TABLE OF CONTENTS
iv
2-21 Factors that Could Contribute to Decreased Sockeye Growth and Size in Lake Washington and Possible Methods of Correction ....................... 2-44
2-22 Factors that Could Contribute to Rate of Predation in Lake Washington and Possible Methods of Correction ............................... 2-45
2-23 Factors that Could Contribute to Decreased Abundance of Lake Washington Planktivores (Other than Sockeye) and Possible Methods of Correction ........................................................................................................... 2-46
3-1 Summary of AMP Uncertainties, Hypotheses, Potential Research Outcomes and Management Actions .................................................................. 3-2
4-1 Adaptive Management Plan Implementation .................................................. 4-11
LIST OF FIGURES
No. Title Page No.
1-1 General Overview of the Adaptive Management Process ................................. 1-8
2-1 2000 Egg Take Timing at the Hatchery and Counts of Live Sockeye in the Cedar River (WDFW data) .................................................................................. 2-4 2-2 Chinook Redd Distribution by River Mile, Cedar River 1999 and 2000
(Burton Et Al. 2001). ......................................................................................... 2-31 2-3 Average Historical Spawning Curves for Chinook and Sockeye Salmon in the Cedar River (Cascade Environmental Services 1995) .......................... 2-32 2-4 Frequency of Lake Spawning Densities for Lakes in the Pacific Northwest,
British Columbia, Alaska, and Russia (from Burgner 1991). ......................... 2-40 2-5 Frequency of Average Sockeye Smolt Sizes for Nursery Lakes ...................... 2-40
4-1 Proposed AMP Participant Relationships .......................................................... 4-7
1-1
SECTION 1. INTRODUCTION
1.1 EXECUTIVE SUMMARY
1.1.1 AMP Purpose and Objectives
This Adaptive Management Plan (AMP) defines an operating and management framework for the Cedar River Replacement Sockeye Hatchery Program. This program was developed to address dual objectives of realizing the full potential of the Cedar River to support sockeye while protecting drinking water quality. This AMP includes an initial technical basis for monitoring and evaluation of the Cedar River Replacement Sockeye Hatchery. The application of adaptive management to hatchery operations and evaluation is rare; consequently, this AMP relies primarily on the experience of other efforts adapted to the unique challenges of this program. Application of adaptive management to this hatchery program has the potential for achieving unusually high standards for monitoring, evaluation and decision-making.
The primary purpose of the AMP is to help the hatchery program meet its mitigation goals by minimizing risks of long-term adverse impacts through effective monitoring and management. There are two important biological goals for this hatchery program.
Implement the Cedar HCP and Landsburg Mitigation Agreement commitments
related to a biologically and environmentally sound long-term sockeye hatchery program that will help to provide for the recovery and persistence of a well-adapted, genetically diverse, healthy, harvestable population of Cedar River sockeye.
Avoid or reduce detrimental effects on the reproductive fitness and genetic diversity of naturally reproducing salmon populations in the Cedar River and the Lake Washington basin.
The success of this hatchery program will rely on the ability to integrate artificial and natural production systems to realize the full biological potential of the physical environment. Consequently this AMP focuses on potential risks to naturally spawning salmon, prescribes monitoring activities to detect effects, and establishes a process for analyzing and addressing adverse impacts if they occur. This hatchery program will be deemed a failure if it results in a substantial loss of the ability for naturally reproducing sockeye or chinook to sustain themselves or if it fails to significantly increase sockeye returns to the Cedar River. The proposed hatchery is expected to augment natural spawning on the Cedar River and, if successful, will produce a greater and more consistent number of returning adult sockeye than would result without it. This is expected to increase sport and tribal harvest opportunities of the Lake Washington sockeye salmon fishery.

Adaptive Management Plan; Cedar River Sockeye Hatchery…
1-2
Within this context for the goals of the sockeye hatchery program, the objectives of this AMP are:
1. Address the primary technical uncertainties with respect to performance and effects of the replacement hatchery program
2. Promote a high standard for scientific work so that results are credible
3. Effectively communicate scientific results to managers
4. Provide public access to scientific data
5. Provide opportunity for public input to decision-making process
6. Promote public understanding of decisions
7. Utilize limited monitoring resources effectively and efficiently
Success of the AMP will be determined by the achievement of these objectives over time.
Scientists, hatchery operators and fishery managers, with expertise in hatchery operations and the effects of those operations on other resources, have guided the development of this hatchery program. Their work has resulted in guidelines, operating protocols, capacity analysis and this adaptive management plan that is designed to contribute to the success of the program by producing additional adult returns and by minimizing adverse effects. The adaptive management plan will not direct harvest management actions, for which the fishery co-managers have regulatory authority; however, the AMP will generate valuable information for harvest management.
1.1.2 Challenges of Adaptive Management
Adaptive management is a term whose definition in practice is imprecise. However, many adaptive management efforts include similar elements that include defining experiments to test responses of predetermined variables and applying the results to future management decisions. Adaptive management has been applied to projects and programs of various sizes. Generally, the more complex the program or range of potential variables that are affected by a specified action, the more difficult it is to determine causal relationships and to use monitoring results to make appropriate management responses. Thus, too much complexity makes it difficult to apply adaptive management. Nevertheless, establishing a monitoring program that provides relevant information, even if that information is not fully conclusive, still provides a better basis for professional judgment than no information at all. Therefore, the adaptive management decision-making process must respond to various inputs, ranging from recommendations based on statistically certain results to those based on expert judgment informed by the available information. Adaptive management is used to learn about ecosystems as well as to control risk of adverse effects of specific projects. By defining key uncertainties associated with impacts or results of the project, adaptive management encourages collection of appropriate data that are needed to evaluate the project. These results are reviewed by scientists, who provide technical advice to a decision-making body that ultimately determines if program changes should be made to reach its objectives.
…1. INTRODUCTION
1-3
Experience with adaptive management has resulted in mixed results. The concept has proved useful for providing a structure that allows people with differing perspectives to agree to allow controversial natural resource actions to proceed, while working together to develop a greater understanding of the results and effects. At the same time, and in many cases, adaptive management has been challenged to fully integrate scientific input into management decisions. Also, some believe that adaptive management has failed to force hard decisions by managers, in spite of scientific results that support these decisions.
A key goal of adaptive management is to encourage accountability and transparency in decision-making. Scientific data, analyses and recommendations are intended to form key input to management decisions through adaptive management. Consequently, the quality of scientific work needs to be sufficient to be generally accepted and not in itself a source of significant uncertainty. Peer review of proposals and reports, involvement by independent scientists, statistical evaluation of research proposals and timely access to data are important ways of improving the credibility of scientific results.
1.1.3 Development of This AMP
This AMP is a requirement of the Cedar River Habitat Conservation Plan and the Landsburg Mitigation Agreement (LMA) and is to be in place prior to beginning operations of the replacement hatchery. In early 2000 the City of Seattle assembled a special scientific advisory panel as called for in the LMA. This panel was established to advise the City of Seattle and the other Parties to the LMA in developing plans for an effective, comprehensive, and biologically sound artificial propagation program consistent with the Habitat Conservation Plan. The panel included experts in sockeye biology, Lake Washington ecology, fish diseases, genetics and recent hatchery reform initiatives. They came from University of Idaho, University of Washington, U.S. Fish and Wildlife Service, National Marine Fisheries Service and U.S. Geological Survey. The science panel developed guiding principles for the hatchery embodied in The Cedar River Sockeye Salmon Hatchery Plan (Brannon et al., 2001). Recommendations from this document have been used to develop further program documents, including the AMP. The science panel reviewed the status and factors affecting sockeye in the Cedar/Lake Washington basin and recommended monitoring and research needs. The AMP is responsive to these recommendations. The hatchery plan provides guidelines for improving survival of hatchery releases and minimizing adverse interactions between hatchery and wild fish.
The development of the proposed AMP for the sockeye hatchery involved research into past and current efforts to implement adaptive management by others. No examples of the detailed application of adaptive management to hatchery operations were found in the literature; however, there were examples of the use of adaptive management in other natural resource applications. In addition to information gathered from this literature review, the Cedar River Sockeye Hatchery AMP relies on information gathered from three adaptive management workshops, sponsored by Seattle Public Utilities (SPU) and Washington Trout in 2001, 2002 and 2004. Regional and national experts were brought together to discuss the challenges and lessons learned from previous efforts to develop and implement adaptive management programs. This exchange of ideas and experiences provided guidance concerning how the AMP decision-making process should be structured to achieve AMP objectives.
Adaptive Management Plan; Cedar River Sockeye Hatchery…
1-4
Tetra Tech/KCM Inc. was contracted to develop the proposed Adaptive Management Plan. This effort involved various technical experts in salmon biology, hatchery issues, genetics, and sockeye salmon culture. The AMP for the Cedar River Hatchery was further developed by a group of select scientists, led by Dr. Tom Quinn, U. of Washington. An earlier version was reviewed by the Cedar River Anadromous Fish Committee (AFC), the advisory committee comprised of scientists and stakeholders established in the LMA to provide advice and consultation to the City concerning the implementation of the LMA. AFC membership currently includes City of Seattle, WDFW, NOAA Fisheries, U.S. Fish and Wildlife Service, Muckleshoot Indian Tribe, Trout Unlimited, Puget Sound Anglers, Washington Trout, King County, Long Live the Kings and the public at-large. Comments from committee members were reviewed by the authors. These comments included questions regarding the level of certainty associated with the effects of domestication selection; assumptions about fry survival rates; how future production levels would be established; whether measurements of fry to adult survival were meaningful assessments of fitness; and the need to establish clear thresholds and responses.
More recently, SPU has sought comment from Dr. Barry Gold, a recognized national expert in adaptive management (Dr. Gold led the adaptive management program for the Glenn Canyon Dam project). The Hatchery Science Reform Group (HSRG) reviewed the Cedar River sockeye hatchery, including the earlier version of the proposed AMP. The HSRG was established by Congress in FY 2000 to ensure that hatchery reform programs in Puget Sound and Coastal Washington are scientifically founded and evaluated; that independent scientists interact with agency and tribal scientists to provide direction and operational guidelines; and that the system as a whole be evaluated for compliance with scientific recommendations (further information on members of the HSRG can be obtained at www.longlivethekings.org/HRP_HSRG.html).
The hatchery AMP will be used to help to respond to uncertainties identified in the HCP adaptive management plan, including potential edffects of the hatchery on naturally spawning Chinook and sockeye.
The AMP will be presented to the parties of the LMA for their acceptance after the State Environmental Policy Act (SEPA) process is concluded.
1.1.4 Key Features of this AMP
The Cedar River Hatchery Adaptive Management Plan includes a discussion of five key areas of uncertainty and describes the structural framework that guides scientific work as well as decision-making. The key uncertainties are as follows:
• Comparability between fry produced by the hatchery and in the river
• Effects on reproductive fitness in naturally spawning sockeye
• Effects on sockeye populations outside the Cedar River
• Effects on Cedar River chinook
• Effects on the aquatic community in Lake Washington.
…1. INTRODUCTION
1-5
The discussion of each of these uncertainties includes potential hypotheses, criteria, results and responses. The Plan is intended to be flexible and to be adjusted over time as necessary to reflect current knowledge or experience.
This plan includes an organizational framework (see Section 4) that is intended to promote credible scientific input and informed decision-making. The ultimate decision-making body is made up of representatives from the four Parties to the LMA: the City of Seattle, the U.S. Fish and Wildlife Service, National Oceanic and Atmospheric Administration (NOAA) Fisheries and the Washington Department of Fish and Wildlife. Under the LMA, the parties are committed to using adaptive management to address critical questions as they arise and make changes in management based on the results of monitoring to meet the specific objectives of the hatchery program. The parties receive advice directly from the Adaptive Management Work Group (AMWG) and will have access to recommendations from the scientist panels as well. The AMWG will include agency scientists and stakeholders. This group will be advised by the Independent Science Advisors (ISA), the Technical Work Group (TWG) and the Monitoring and Research Parties. Each group has a specific role as will be described below.
This structure is intended to allow the development of sound scientific direction that will help the decision-makers to manage the hatchery program. Considerable emphasis will be placed on measures needed to ensure that the appropriate monitoring data are collected in a scientifically and statistically sound manner so that results address key outstanding uncertainties. For example, the productivity of Cedar River sockeye and chinook will continue to be monitored to evaluate whether changes are occurring.
The fry production level for this hatchery is capped at 34 million fry, roughly double the hatchery capacity provided by the interim hatchery facility. The interim hatchery has operated since 1991 and the production levels have generally trended higher over its operations. The operation of the interim hatchery could have resulted in changes that are the subject of monitoring and evaluation under this adaptive management program. Thus, it will be important to consider baseline conditions as both pre-hatchery and interim hatchery, as appropriate, when considering reference conditions for the evaluation of impacts. In some cases, the availability of baseline information may limit comparisons with pre-hatchery or interim hatchery conditions.
The actual operating target level will be established annually by the parties to the LMA, based on factors including, but not limited to: 1) an assessment of the risk of irreversible harm; and 2) the goal, established in the Capacity Analysis, that over the long term and on average, hatchery returns will contribute no more than 50 percent of the overall sockeye return to the Cedar River. The assessment of risk will be a synthesis of monitoring results and analyses of the effects of the hatchery program in the key areas of uncertainty. Predefined thresholds will be established where possible, to aid in identifying levels where results would suggest that effects should be critically reviewed and action considered or implemented. Thus, setting the annual production goal for the hatchery is one of the primary outcomes of the adaptive management process. Results from adaptive management will also be used to improve returns as results from various culture strategies are learned and applied.

Adaptive Management Plan; Cedar River Sockeye Hatchery…
1-6
Key uncertainties reflect those issues that have special importance in terms of potential effects. One example is the special emphasis the hatchery program places on maintaining the reproductive fitness of naturally spawning sockeye in the Cedar River. Maintaining the productivity of natural spawning sockeye is critical to producing the larger salmon returns that are needed to hold more frequent fisheries, one measure of success. To do so means protecting the productivity of the sockeye population that spawns in the river over the long term. There are no studies that have examined the effects of a sockeye fry hatchery on reproductive fitness of a composite stock comprised of returns that have varying levels of hatchery and natural spawning influence. Consequently, the adaptive management program identifies the maintenance of reproductive fitness in Cedar River sockeye as a key uncertainty and directs monitoring to measure productivity of natural spawners over time. This program represents significant opportunity to study hatchery effects and contribute to a broader understanding of this issue.
To further reduce risk and to reinforce the fact that this program is intended to supplement, not detract from natural production of sockeye in the Cedar River, a unique goal of this hatchery is to adjust egg collection goals so that overtime and after an initial start up period, the return of naturally produced sockeye will be at least 50 percent of the total return. Thus, if natural productivity declines, hatchery production would decline as well. This quantitative goal is discussed in the Capacity Analysis section of the Program Documents and is intended to place heightened awareness on the need to maintain or improve the health of both naturally spawning sockeye and their habitat. This pioneering connection between hatchery and natural production is intended to help to avoid the replacement of naturally- produced sockeye with hatchery returns. Maintaining an upper limit of 50 percent hatchery origin in the return means that a significant portion of returns will have been subjected to the full range of selection pressures by spawning naturally. It also means that substantial numbers of sockeye used for broodstock in the hatchery will be of natural origin, which some believe will likely improve the fitness of the hatchery-origin sockeye as they return and spawn in the river. The proposed long-term maximum for hatchery-produced returns will be evaluated through monitoring and adaptive management and could be adjusted in the future.
1.1.5 AMP Implementation
Monitoring activity associated with the interim sockeye hatchery program, while not directed by the adaptive management plan, has been ongoing since the early 1990’s. Results from this work are being used to guide the project through the oversight of the Cedar River Anadromous Fish Committee and the Parties to the Landsburg Mitigation Agreement. These data provide baseline information about the existing level of sockeye production and about the other salmonid populations and Lake Washington ecosystem. The AMP process will need to evaluate information that has been collected to date regarding effects of the interim hatchery as well as to establish future direction for the monitoring and evaluation elements as the replacement hatchery begins operation. There are known limitations associated with the interim hatchery that are being addressed in the design of the replacement hatchery. This adds complexity to the evaluation of the replacement hatchery, but also provides opportunity for insight into cause and effect relationships ( e.g. size of returning females). The adaptive management process will need to consider whether changes have already occurred during the operation of the interim hatchery using all data that are available. Some of these analyses may be limited by the availability of data.

…1. INTRODUCTION
1-7
While the Cedar River Hatchery is not scheduled to be completed and operating until 2008, the AMP implementation schedule (see Section 4) calls for AMP activity to begin in 2006. The parties, with the advice of the Adaptive Management Work Group, will oversee the recruitment of the Technical Work Group as well as the development of a list of independent scientific advisors. Once the key groups are formed and operating parameters defined, a review of the AMP will occur in 2006. The primary purpose is to ensure that the people who will be involved with the implementation of the AMP have the opportunity for input. In particular, the TWG and the AMWG will be asked to evaluate the list of uncertainties, identify specific hypotheses for testing, review the monitoring program, and review and further develop criteria, thresholds and responses prior to implementation. Changes to this plan are expected at this point as those who will be working on this program apply their knowledge and expertise. Specificity in setting thresholds for specific criteria provides greater assurance of response when these are exceeded. Pre-determined responses will be identified and may be either changes to the hatchery program or initiation of a conscientious evaluation of the situation that may lead to an action as defined by the adaptive management process.
Much emphasis is being placed on the importance of reforming hatchery practices so that effects on natural populations are minimized. The adaptive management plan serves to address a common concern that many hatchery programs lack sufficient evaluation. Proper evaluation needs to document natural and hatchery contributions to adult returns as well as examine key areas where the hatchery program may be having adverse effects. The long-term commitment to monitoring associated with this hatchery is unusual and provides a basis of support for the AMP. Its implementation and success will rely on the cooperation of scientists, agencies and stakeholders to participate with objectivity and commitment to the goals of the program.
1.2 BACKGROUND
Adaptive management is an approach that incorporates monitoring and research to allow projects and activities, including projects designed to produce environmental benefits, to go forward in the face of some uncertainty regarding their consequences (Holling 1978; Walters 1986). In the adaptive management process, high priority is placed on learning about the subject ecosystem; in order to learn, management policies are designed as experiments to probe ecosystem responses (Lee 1999). Two essential characteristics of effective adaptive management are a direct feedback loop between science and management, and the view of management as an experiment (Halbert 1993).
The ecology of sockeye in the Lake Washington system is not completely understood and the effects of a Cedar River Sockeye Hatchery program on the Cedar River sockeye population, other Lake Washington basin sockeye populations, other basin salmonid populations, and the Lake Washington ecosystem as a whole are not fully predictable. The adaptive management approach was chosen as a hatchery management tool to allow better understanding of the performance and effects of the hatchery and promote effective management responses to new information. Adaptive management of the hatchery is intended to increase knowledge about the Lake Washington system and provide the flexibility to incorporate that knowledge into hatchery operations to avoid or minimize adverse impacts on the ecosystem.
Adaptive Management Plan; Cedar River Sockeye Hatchery…
1-8
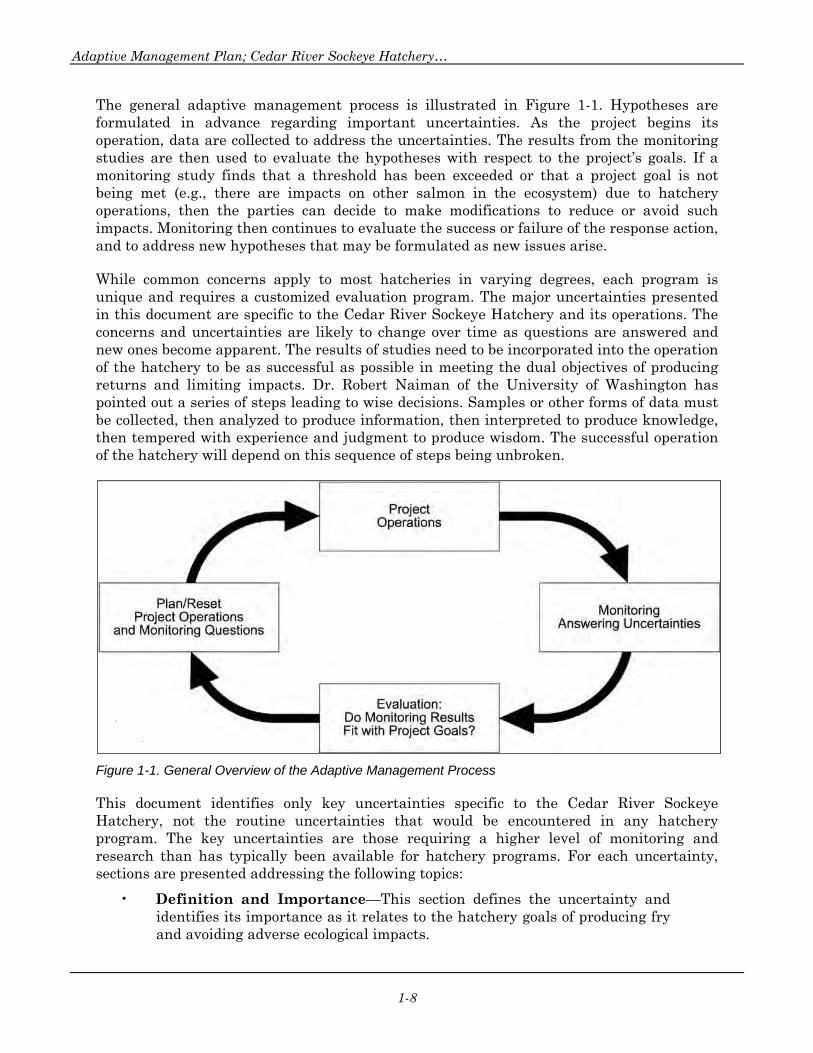
The general adaptive management process is illustrated in Figure 1-1. Hypotheses are formulated in advance regarding important uncertainties. As the project begins its operation, data are collected to address the uncertainties. The results from the monitoring studies are then used to evaluate the hypotheses with respect to the project’s goals. If a monitoring study finds that a threshold has been exceeded or that a project goal is not being met (e.g., there are impacts on other salmon in the ecosystem) due to hatchery operations, then the parties can decide to make modifications to reduce or avoid such impacts. Monitoring then continues to evaluate the success or failure of the response action, and to address new hypotheses that may be formulated as new issues arise.
While common concerns apply to most hatcheries in varying degrees, each program is unique and requires a customized evaluation program. The major uncertainties presented in this document are specific to the Cedar River Sockeye Hatchery and its operations. The concerns and uncertainties are likely to change over time as questions are answered and new ones become apparent. The results of studies need to be incorporated into the operation of the hatchery to be as successful as possible in meeting the dual objectives of producing returns and limiting impacts. Dr. Robert Naiman of the University of Washington has pointed out a series of steps leading to wise decisions. Samples or other forms of data must be collected, then analyzed to produce information, then interpreted to produce knowledge, then tempered with experience and judgment to produce wisdom. The successful operation of the hatchery will depend on this sequence of steps being unbroken.
Figure 1-1. General Overview of the Adaptive Management Process
This document identifies only key uncertainties specific to the Cedar River Sockeye Hatchery, not the routine uncertainties that would be encountered in any hatchery program. The key uncertainties are those requiring a higher level of monitoring and research than has typically been available for hatchery programs. For each uncertainty, sections are presented addressing the following topics:
• Definition and Importance—This section defines the uncertainty and identifies its importance as it relates to the hatchery goals of producing fry and avoiding adverse ecological impacts.
…1. INTRODUCTION
1-9
• Existing Data and Knowledge—This section describes past and current research in the Lake Washington basin related to the uncertainty. Efforts were made to adequately represent all research and knowledge that was accessible and available.
• Remaining Unknowns—This section describes the ecological issues about which little is known. The unknowns covered are primarily those that have relevance for hatchery operations and meeting project goals.
• Hypotheses—This section presents priority hypotheses to be studied during initial project operation.
• Monitoring and Research Plan—This Adaptive Management Plan (AMP) has been prepared based on information available at a particular point in time. The results of studies underway may allay some of the concerns or heighten others. A proposed research and monitoring program has been outlined; final determination of the elements of the program will be made as part of the formal adaptive management process. This section provides an overview of how each hypothesis identified in the previous section should be studied. Contracted researchers will develop detailed study plans at a later date. Detailed study plans will include a power analysis when appropriate, which specifies necessary sample sizes, minimum detection levels, and appropriate significance levels so that there is confidence in study results and the ability to make management decisions based on them. This section identifies recommended study durations; however, studies could be continued or discontinued depending on initial study results and guidance of the technical work group. This section also includes a budget for investigation of these hypotheses (in 2001 dollars). The budget allocations in this document focus on the first 10 years of operation and could shift over time as knowledge is gathered.
• Adaptive Management Actions—This section describes potential outcomes for each monitoring and research hypothesis. For each outcome, potential management responses are listed. These responses are recommended strategies that could reconcile project operations with the project goals. However, the recommended strategies are subject to change as more information or different technologies become available. Ultimate management responses will be decided through the management process, as described in Section 4.
1.3 SUMMARY
This Adaptive Management Plan presents a technical discussion of the five major uncertainties in Section 2. The information for each uncertainty is then summarized in Section 3 of this document. The last section presents a strategy, principles, organization and decision process for the AMP.
This document is offered as a basis for discussions between appropriate parties to reach agreement on management roles and relationships and the responsibilities and authorities of participants. It has been prepared with the following goals:

Adaptive Management Plan; Cedar River Sockeye Hatchery…
1-10
• To provide a starting point for initiating the required research and monitoring of the ecosystem
• To establish an evaluation and management process to respond effectively with the full range of issues that may arise within the context of the hatchery program.

2-1
SECTION 2. KEY UNCERTAINTIES
The proposed Cedar River Sockeye Hatchery is designed to increase the average number of Cedar River sockeye salmon and to minimize or avoid adverse effects on the following:
• The existing sockeye population in the river
• Other sockeye salmon populations in the Lake Washington system
• Salmonid species in the basin
• The overall health of the Lake Washington ecosystem.
There is sufficient experience with hatcheries elsewhere to justify concern about these effects, though it is far from certain that they will occur. In this AMP, key areas of uncertainty are defined so that hypotheses can be constructed and tested through monitoring and evaluation. Information generated from this process will provide a basis for scientific evaluation and ultimately serve as the basis for changing the program to better meet project goals. Uncertainties and hypotheses are expected to change over time as questions are answered and new ones emerge. Five major uncertainties are presented below.
2.1 UNCERTAINTY NO. 1—ARE HATCHERY AND NATURALLY PRODUCED FRY SIMILAR IN SIZE, GROWTH, AND MIGRATION TIMING, AND AT A STABLE POPULATION COMPOSITION?
2.1.1 Definition and Importance
Until recently, the Cedar River population was composed of wild sockeye salmon. Since operation of the interim hatchery began, it has been composed of both hatchery and naturally produced sockeye. The intent is to maintain the natural attributes of this composite population so that fish of both origins can spawn successfully in the river. In keeping with this intent, there is a stated objective to keep naturally and hatchery produced fry “comparable.” Here, the term “fry” refers to individuals who have absorbed their yolk and either emerged from the gravel volitionally or have been released from the hatchery. Due to the difference between hatchery conditions and those in the river incubation environment, there is concern that the hatchery fry might differ from their naturally produced counterparts. The differences would be important if hatchery fry exhibited a handicap or an advantage compared with natural fry that could lead to shifts in the composite nature of the sockeye population and ultimately, affect the fitness of the sockeye population that spawns in the river.
The definition of “comparable” can be applied in many ways. For this AMP, it is important to use qualities that can be quantitatively compared, and can provide a basis for conclusions about similarities between hatchery and naturally produced fry. Comparisons of size, growth, and migration timing of the two groups of fry are instructive because they influence survival rates and can be examined in a way to produce statistically strong
Adaptive Management Plan; Cedar River Sockeye Hatchery…
2-2
results. In addition, it is possible to track the composition of the fry population to ensure that a balance of natural and hatchery fish is maintained.
The interpretation of the results of comparisons between hatchery and naturally produced fry needs to recognize the potential factors that may influence differences. For example, fry to adult survival rates can be influenced by emergence and release location, flow, feeding, time of day of release or emergence, time of year and other factors as well as by genetic influences. Comparisons that are influenced by as few variables as possible are more likely to lead to more accurate interpretations of cause and effect than those where many potential variables may influence results. Due to the number of variables potentially affecting results, comparisons of fry to adult survival are not a useful method for evaluating relative fitness between hatchery and natural fry. Fry to adult survival rates will be calculated and compared, however, in the effort to better understand factors affecting survival in general.
2.1.2 Existing Data and Knowledge
Research on hatchery and naturally produced sockeye salmon has been conducted at several juvenile stages. These stages include the fry stage when the fish are migrating out of the Cedar River into Lake Washington, the “pre-smolt” stage when they are in Lake Washington in March or April (about one to two months before they leave for salt water), and the “smolt” stage when the fish are leaving the Lake Washington system and entering Puget Sound through the Hiram Chittenden Locks (locks).
The Washington Department of Fish and Wildlife (WDFW) started sampling fry near the mouth of the Cedar River in 1992, the same year of initial releases from the interim hatchery. The fry-trapping program allows estimation of the number of fry entering the lake from the Cedar River and the natural-hatchery composition of the fry population. Table 2-1 presents the Cedar River fry production estimates and population composition for the 1991-2000 brood years. The hatchery component of the sockeye fry population has varied between 6 and 87 percent since 1991, with an average of 29 percent.
In addition to estimating the fry population, fry trapping can provide information on migration timing and fry size. Migration timing studies have shown that hatchery fry typically reach the lake before naturally produced fry, with the median migration date ranging from 8 to 46 days earlier for hatchery fish. Table 2-2 summarizes the median migration dates for hatchery and naturally produced fry in calendar years 1992 to 2002. The difference in migration timing could be due to factors such as the timing of egg take, the temperature of incubation water, and selective mortality of embryos in the river. Comparison of 2000 egg take timing and the spawning curve indicates that egg take did not occur before spawning in the river in that year (Figure 2-1). Data from 1999 indicated a similar pattern. However, the spawning curve given is based on counts of fish both spawning and migrating within the river and the true spawning time in the river could be later. However, most of the difference in migration timing is thought to be a result of the temperature of the spring water used to incubate eggs in the hatchery, which is slightly warmer than the water in the river.

…2. KEY UNCERTAINTIES
2-3
TABLE 2-1. CEDAR RIVER FRY ESTIMATES GENERATED FROM THE FRY TRAPPING STUDIES CONDUCTED
NEAR THE MOUTH OF THE RIVER
Brood Year Sampling Year Total Fry Production Hatchery Fry
(Percent of Total) Naturally Produced Fry (Percent of
Total)
1991 1992 10,400,000 600,000 (6%) 9,800,000 (94%)
1992 1993 28,800,000 1,700,000 (6%) 27,100,000 (94%)
1993 1994 24,700,000 6,600,000 (27%) 18,100,000 (73%)
1994 1995 14,300,000 5,600,000 (39%) 8,700,000 (61%)
1995 1996 5,800,000 5,100,000 (87%) 730,000 (13%)
1996 1997 38,300,000 13,900,000 (36%) 24,400,000 (64%)
1997 1998 32,700,000 7,600,000 (23%) 25,400,000 (77%)
1998 1999 18,500,000 9,000,000 (49%) 9,500,000 (51%)
1999 2000 12,000,000 3,000,000 (25%) 9,000,000 (75%)
2000 2001 52,400,000 14,500,000 (28%) 37,900,000 (72%)
2001 2002 43,600,000 12,000,000 (27%) 31,600,000 (73%)
2002 2003 42,300,000 14,400,000 (34%) 27,900,000 (66%)
2003 2004 47,900,000 9,200,000 (19%) 38,700,000 (81%)
Average 28,600,000 7,900,000 (28%) 20,700,000 (72%)
Sources: Seiler 1994; 1995, Seiler & Kishimoto 1996; 1997A; 1997B;Seiler et al 2004A, 2004B, 2005A, 2005B
TABLE 2-2. MEDIAN MIGRATION DATES OF HATCHERY, NATURALLY PRODUCED, AND COMBINED SOCKEYE
FRY IN THE CEDAR RIVER FROM 1992-2004
Brood Sampling Median Date Difference Year Year Natural Hatchery Combined N-H (days)
1991 1992 3/18 2/28 3/12 18
1992 1993 3/27 3/07 3/25 20
1993 1994 3/29 3/21 3/26 8
1994 1995 4/05 3/17 3/29 19
1995 1996 4/07 2/26 2/28 40
1996 1997 4/07 2/20 3/16 46
1997 1998 3/11 2/23 3/06 16
1998 1999 3/30 3/03 3/15 27
1999 2000 3/27 2/23 3/20 32
2000 2001 3/10 2/26 3/06 12
2001 2002 3/25 3/04 3/18 19
2002 2003 3/08 2/24 3/03 12
2003 2004 3/21 2/23 3/15 26
Average 3/24 3/01 3/14 23
Source: Seiler et al 2005B

Adaptive Management Plan; Cedar River Sockeye Hatchery…
2-4
Figure 2-1. 2000 Egg Take Timing at the Hatchery and Counts of Live Sockeye in the Cedar River (WDFW data).
In the past, a portion of the outmigrating fry were measured at the fry trap. The average fry size is 29 mm ( 1 mm). The size of hatchery and natural fry at this time is assumed to be similar, as hatchery fry are not reared (David Seiler, WDFW, pers. comm.).
The fry trapping data allows estimates of in-river survival of some hatchery fry and the relationship between their survival, their release site along the river, and conditions during migration. Survival of naturally produced fish from the time of egg deposition to the time they reach the migration trap and the relationship between those survival rates and river discharge are estimated based on estimates of escapement and fecundity. In general, in-river survival of hatchery fry increased with river discharge during migration (Seiler and Kishimoto 1997b). For naturally produced fry, survival rates were negatively correlated with river discharge during the incubation period (Seiler and Kishimoto 1997b). Higher river discharges during egg incubation apparently decrease survival by mobilizing riverbed sediments, resulting in bed scour (Ames and Beecher 2001).
Pre-smolt surveys have been conducted each year in March or April. Scientists use these data to estimate the number of sockeye juveniles that are about to leave the system that year, as well as determine their average size. The results of these studies are forthcoming and will be regularly integrated into the AMP process.
Since 1995, studies on salmon smolts have been occurring at the locks. These studies mostly focus on chinook smolts, but also address the travel time, travel speed and residence time of coho and sockeye salmon and steelhead trout. These studies have not examined
0
200000
400000
600000
800000
1000000
1200000
1400000
0
5000
10000
15000
20000
25000
30000
8/11
8/25 9/8
9/22
10/6
10/2
0
11/3
11/1
7
12/1
12/1
5
12/2
9
1/12
1/26 2/9
2/23
Eg
g T
akeN
um
ber
of
So
ckey
e
Date
Sockeye Number
Egg take
…2. KEY UNCERTAINTIES
2-5
sockeye size or other hatchery-related topics (Fred Goetz, U.S. Army Corps of Engineers, pers. comm.).
2.1.3 Remaining Unknowns
What mixture of natural and hatchery production is adequate to maintain ecological integrity of the Cedar River population?
The intent of the hatchery program is to boost production in the system without significantly lowering the ability of the sockeye population to successfully reproduce in the river. Therefore, there is a desire to keep a stable and healthy balance between the number of hatchery and naturally produced sockeye salmon at all life history stages. Based upon hatchery objectives, a population of 100 percent hatchery fry would represent a failure. However, it is not known at what point the population composition is balanced.
Based upon fisheries management policy and early analysis by the science panel (Brannon et al. 2001), the population composition should be about 50 percent hatchery and 50 percent natural returning adults (see the Capacity Analysis for a further discussion). If we assume that survival is roughly equal between the two groups after the incubation stages, then 50 percent would be the target composition at the fry stage. However, there are several unknowns about this composition from an ecological standpoint:
• It is not known how a 50 percent hatchery population would affect the ability of the population as a whole to spawn in the river.
• Given the effects of river scour on the natural population, there will be variability in the system depending on river conditions.
Overall, this important question cannot be easily answered. From the policy standards established, it will be assumed that 50 percent hatchery is the acceptable average for hatchery presence in the population. Adaptive management of other uncertainties (e.g., reproductive success, Lake Washington ecosystem health) will help assess this standard over time.
What are the growth, survival, and population composition of Cedar River sockeye fry once they enter Lake Washington?
There are limited data on the size and growth of hatchery and naturally produced sockeye fry in Lake Washington (Schroder memo, WDFW, 2005). The WDFW has been conducting pre-smolt estimates within the lake since the late 1960s or early 1970s. It is hoped that the results from these studies can be examined to identify trends in the size and growth of sockeye fry at the pre-smolt stage over the last 20+ years to provide a baseline for average size and growth, their variability, and relationship to density. Through establishing a baseline, it will be possible to detect any difference that might be seen in the Cedar River population as hatchery production increases. The otoliths of sockeye salmon produced at the interim hatchery have been marked by exposure to distinct thermal regimes, so those caught in the pre-smolt surveys are identifiable as hatchery or naturally produced. These samples will provide a basis for examining size differences between hatchery and natural fry at this stage and estimating the population’s composition (hatchery and natural).
Adaptive Management Plan; Cedar River Sockeye Hatchery…
2-6
What are the growth, survival, and population composition of Cedar River sockeye smolts migrating through the locks?
Research on smolt passage at the locks has been conducted since 1995; however, there are no available data on sockeye size, growth, or hatchery-natural composition at this life stage. It is difficult to justify quantification of smolts as hatchery or natural as it would require lethal sampling that would affect other sockeye populations in the basin. In addition, pre-smolt sampling that occurs one to two months prior to smolt migration provides a comparable time point because much of the in-lake growth and mortality has likely taken place by this time. Due to these facts, the AMP focuses on pre-smolt sampling. However, smaller sample sizes will be used to establish ratios of hatchery smolts to wild smolts and their relative sizes.
2.1.4 Hypotheses
The following hypotheses will guide research and monitoring studies for this uncertainty:
• There is no difference in migration timing between hatchery and naturally produced fry.
• At the time of emergence, there is no difference in size of hatchery and naturally produced fry.
• The average proportion of hatchery fry in the Cedar River sockeye population does not significantly exceed 50 percent.
• At the time of pre-smolt surveys, there is no difference in size of hatchery and naturally produced fry.
• At the time of pre-smolt surveys, the proportions of hatchery and naturally produced sockeye do not differ from those that entered the lake as fry.
2.1.5 Monitoring and Research Plan
Migration Timing
Migration timing of sockeye population in the Cedar River should continue to be examined through fry trapping at the mouth of the river. The hatchery is designed to contain equipment to alter the water temperature in the hatchery to more closely follow the temperature of the river. Studies of migration timing should start when the new hatchery begins operation and continue for up to eight years to determine the effectiveness of this activity in matching the migration timing of hatchery and naturally produced fry. The developmental rate of salmon embryos is closely controlled by temperature, and after a few years it may be clear that only careful monitoring of temperature regimes is necessary to project emergence timing.
Fry Size at Emergence
Examination of naturally produced fry trapped at the mouth of the Cedar River can readily determine the size of these fry. Samples will need to be collected throughout emergence at the hatchery to provide comparable data. Fry retained for otolith analysis should have their length and weight recorded so that an average, range and variance for hatchery and

…2. KEY UNCERTAINTIES
2-7
naturally produced fry can be calculated. These studies will coincide with those on migration timing, and will depend on the results of all fry trapping studies.
Fry Population Composition
The population composition of Cedar River fry should continue to be monitored. The composition estimates should cover years of varying escapement and river conditions to provide an accurate idea of the average and variability. These studies will occur over the first eight years of hatchery operations, coinciding with migration timing and fry size studies, and further data collection will be dictated by the results of all fry trapping studies.
Pre-Smolt Size and Growth
Annual pre-smolt surveys should be supported to allow comparisons of size and survival between hatchery and naturally produced fry, identified by otoliths. Comparison between sizes of fry entering the lake the previous spring and size of pre-smolts should allow growth estimation for the two groups.
Comparison of the relative survival and growth of sockeye fry will be complicated by the presence of naturally produced fry from other tributaries in the system (notably but not exclusively Bear Creek). These fish, if not accounted for, would influence the size and growth estimates of naturally produced Cedar River fry. It might be necessary to quantify the size of fry from northern lake tributaries and determine if any differences exist between the Cedar River and other sockeye fry populations. If there are no differences, then it could be assumed that there is not a high amount of bias in the growth and size estimates of naturally produced Cedar River fry due to presence of other wild sockeye populations. Study plans will account for this complication in their design.
In addition, it should be possible to collect scales from adult salmon (e.g., from fishery sampling) and back calculate their size as smolts. By also examining the otoliths, one could compare sizes of hatchery and naturally spawned fish. Scales removed from fully mature salmon can be difficult to read so recoveries at the hatchery and spawning grounds might not be suitable for such analysis.
This study should be conducted annually for up to 10 years and could be combined with studies of lake carrying capacity (see Uncertainty #5).
Pre-Smolt Population Composition
During pre-smolt surveys, fish should be collected to recover otoliths and identify the proportion of hatchery and naturally spawned fish for comparison with the proportions of hatchery and naturally produced fry entering the lake to determine if there is a difference in survival. As with the assessment of growth, the presence of wild fry from populations besides the Cedar River will complicate this analysis. Some idea of the contribution of sockeye from other tributaries to the lake population should be obtained. Ideally, fry would be trapped from the major tributaries (Issaquah Creek and Bear Creek) but in the absence of such data the abundance of these groups of fry might be estimated from counts of adults in the creeks and estimates of fry production from assumed survival rates or short-term field studies. In years when the basin’s population is dominated by the Cedar River, this may not cause much error, but large escapements to sites other than the Cedar River will

Adaptive Management Plan; Cedar River Sockeye Hatchery…
2-8
weaken the analysis of fry to pre-smolt survival rates. Study plans will address this complication when developed. This monitoring will occur in the same years as fry population composition to allow for comparison data (initially, years 1 through 8).
Budget
The Habitat Conservation Plan (HCP) budget allocated a total of $662,480 (1996 dollars) for fry trapping and counting and $378,560 for fry marking and evaluation for 50 years. For each year, between 1 and 8, $41,405 was allocated for fry trapping and counting. Fry marking and evaluation is allocated $23,660 per year for years 1 through 8.
Table 2-3 provides a breakdown of the HCP allocation for the category each hypothesis falls into and the estimated amount that each study would cost. It should be noted that the pre-smolt survey cost is estimated at $19,000 and is not a specific HCP commitment. Nevertheless, HCP funding and other sources have been identified to continue this monitoring activity due to its importance and efforts will be made to continue to support pre-smolt surveys.
2.1.6 Adaptive Management Actions
Migration Timing
Potential Study Outcomes
For migration timing, the potential study outcomes are as follows:
1. There is no significant difference in the migration timing of hatchery and naturally produced fry.
2. There is a significant difference in the migration timing of hatchery and naturally produced fry.
Threshold
If the timing of wild and hatchery runs differed, the process described in Section 4.8 will be followed to determine the cause and identify steps needed to rectify it. The timing of the migrations would be deemed “different” if statistical analysis of the distributions (e.g., test of means or medians, depending on the normality of the data) indicated a less than 5 percent chance that they were similar in two years out of five.
The unfavorable outcome would be a significant difference in migration timing between the two groups, which could lead to reduced survival of hatchery fish.
Currently there is a difference in migration timing between hatchery and naturally produced fish. To adjust the hatchery timing to more closely resemble the timing of naturally produced fish, the hatchery is to alter water temperatures to mimic the temperatures in the river. Initial study results will determine whether that is an effective method to fix the differential in migration timing. After implementation of water chilling, if a difference in migration timing is still found, other corrective measures would need to be developed.

…2. KEY UNCERTAINTIES
2-9
TABLE 2-3. ANNUAL BUDGET ALLOCATION FOR HYPOTHESES RELATED TO SIMILARITY IN FRY
SIZE, GROWTH, AND MIGRATION TIMING BETWEEN HATCHERY AND NATURALLY PRODUCED FRY, AS WELL AS THE CEDAR RIVER JUVENILE POPULATION COMPOSITION
HCP Allocation AMP
Hypothesis HCP Budget
Category Years Amounta (per year) Yearsb
Estimated Cost (per year) Comments
Migration Timing
Fry migration timing and size
1-8 24-27 42-45
$41,405 1-8 $40,000c Conduct with size and composition studies
Fry Size Fry migration timing and size
1-8 24-27 42-45
$41,405 1-8 $40,000c Conduct with timing and composition studies
Fry Population Composition
Fry marking and evaluation
1-8 24-27 42-45
$23,660d 1-8 $83,000e Conduct with size and timing studies
Pre-Smolt Size and Growth
None — — Each year
$19,000 Funding from other sources
Pre-Smolt Population Composition
Fry marking and evaluation
1-8 24-27 42-45
$23,660 1-8 $15,000f Funding from other sources
a. Total amount allocated to all activities within that budget category (1996 dollars). b. Study years within the first ten years of the hatchery only. Further studies will be decided
through analysis of study results. c. The total fry trapping cost is $80,000, which includes both WDFW overhead and trapping for all
species of salmon in the Cedar River. The City contributes about $40,000 annually. d. This covers $23,000 for fry marking in the hatchery. e. This estimate includes $23,000 for fry marking in the hatchery, plus subsequent otolith analysis
assuming 150 otolith samples per night for 30 nights at $13 per otolith. f. Estimate is for otolith analysis only. Boat time and sample collection are included under the pre-
smolt size and growth estimate.
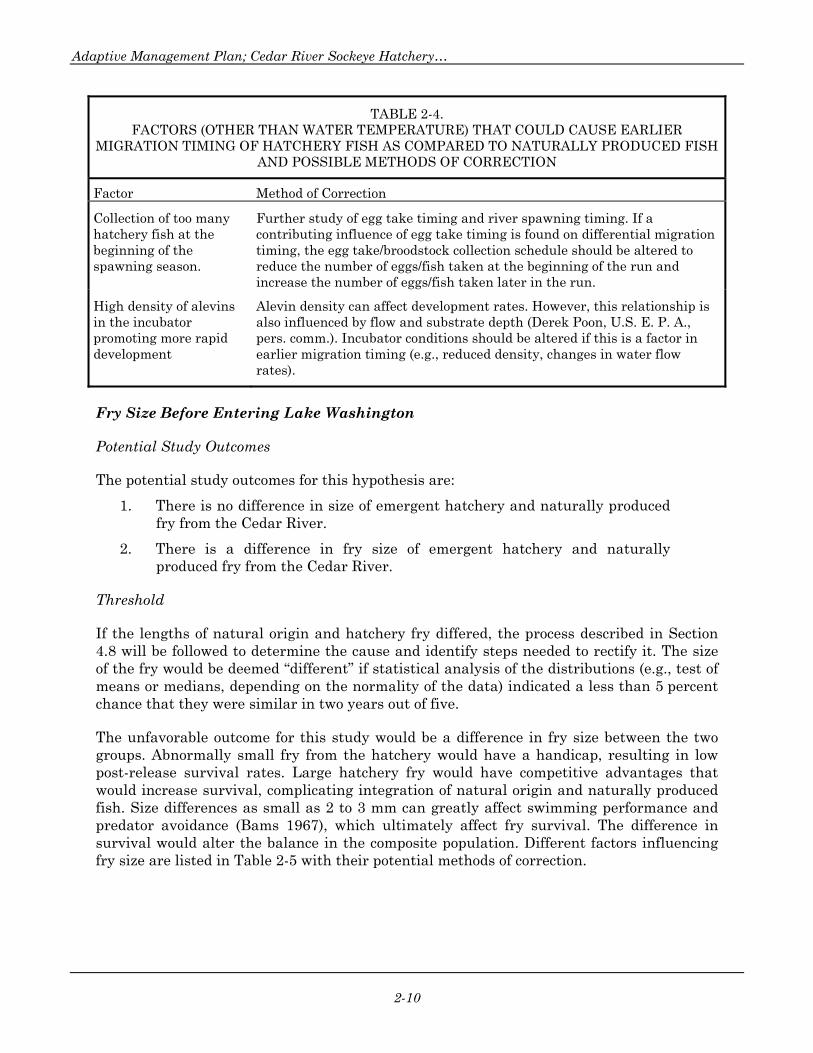
Table 2-4 includes additional factors that could cause earlier migration timing of hatchery fish and ways to change operations to reduce the influence of that factor. At this time, it appears that the egg take timing does not begin before spawning in the river; however, this condition should be further analyzed if water temperature corrections are not effective.
Adaptive Management Plan; Cedar River Sockeye Hatchery…
2-10
TABLE 2-4. FACTORS (OTHER THAN WATER TEMPERATURE) THAT COULD CAUSE EARLIER
MIGRATION TIMING OF HATCHERY FISH AS COMPARED TO NATURALLY PRODUCED FISH AND POSSIBLE METHODS OF CORRECTION
Factor Method of Correction
Collection of too many hatchery fish at the beginning of the spawning season.
Further study of egg take timing and river spawning timing. If a contributing influence of egg take timing is found on differential migration timing, the egg take/broodstock collection schedule should be altered to reduce the number of eggs/fish taken at the beginning of the run and increase the number of eggs/fish taken later in the run.
High density of alevins in the incubator promoting more rapid development
Alevin density can affect development rates. However, this relationship is also influenced by flow and substrate depth (Derek Poon, U.S. E. P. A., pers. comm.). Incubator conditions should be altered if this is a factor in earlier migration timing (e.g., reduced density, changes in water flow rates).
Fry Size Before Entering Lake Washington
Potential Study Outcomes
The potential study outcomes for this hypothesis are:
1. There is no difference in size of emergent hatchery and naturally produced fry from the Cedar River.
2. There is a difference in fry size of emergent hatchery and naturally produced fry from the Cedar River.
Threshold
If the lengths of natural origin and hatchery fry differed, the process described in Section 4.8 will be followed to determine the cause and identify steps needed to rectify it. The size of the fry would be deemed “different” if statistical analysis of the distributions (e.g., test of means or medians, depending on the normality of the data) indicated a less than 5 percent chance that they were similar in two years out of five.
The unfavorable outcome for this study would be a difference in fry size between the two groups. Abnormally small fry from the hatchery would have a handicap, resulting in low post-release survival rates. Large hatchery fry would have competitive advantages that would increase survival, complicating integration of natural origin and naturally produced fish. Size differences as small as 2 to 3 mm can greatly affect swimming performance and predator avoidance (Bams 1967), which ultimately affect fry survival. The difference in survival would alter the balance in the composite population. Different factors influencing fry size are listed in Table 2-5 with their potential methods of correction.

…2. KEY UNCERTAINTIES
2-11
TABLE 2-5. FACTORS THAT COULD CAUSE A DIFFERENCE IN THE SIZE OF HATCHERY AND
NATURALLY PRODUCED FRY AND POSSIBLE METHODS OF CORRECTION
Factor Method of Correction
Direct or indirect selection of females for the hatchery with respect to body size, causing selection for egg size.
Ensure that broodstock collection methods result in random selection of females.
Hatchery rearing Do not rear fry. Release them as soon as possible after volitional emergence.
Incubation substrate Provide sufficient incubation substrates to avoid excessive alevin activity.
Pre-Smolt Size and Growth
Potential Study Outcomes
Potential outcomes for this research hypothesis are:
1. The size and growth of hatchery and naturally produced pre-smolts in Lake Washington are similar to each other.
2. The size and growth of hatchery and naturally produced pre-smolts in Lake Washington are significantly different from each other.
Threshold
If the lengths, weights, or condition factors (weight-length relationships) of natural origin and hatchery pre-smolts differed, the process described in Section 4.8 will be followed to determine the cause and identify steps needed to rectify it. The size of the pre-smolts, based on spring sampling, would be deemed “different” if statistical analysis of the distributions (e.g., test of means or medians, depending on the normality of the data) indicated a less than 5 percent chance that they were similar in two years out of five.
The undesirable outcome would be a difference in size and growth between the two groups. The potential causes of growth differential are listed in Table 2-6 along with potential methods of correction.
TABLE 2-6. FACTORS THAT COULD CAUSE DIFFERENTIAL GROWTH BETWEEN HATCHERY AND
NATURALLY PRODUCED PRE-SMOLTS AND POSSIBLE METHODS OF CORRECTION
Factor Method of Correction
Physiological condition causing an advantage or disadvantage in foraging and avoiding predators
Examine and alter size or attributes of fry leaving the hatchery/adjust release strategy.
Timing of release from the hatchery Adjust the timing of hatchery fry to better match that of the naturally produced fish (see Table 2-4).
Adaptive Management Plan; Cedar River Sockeye Hatchery…
2-12
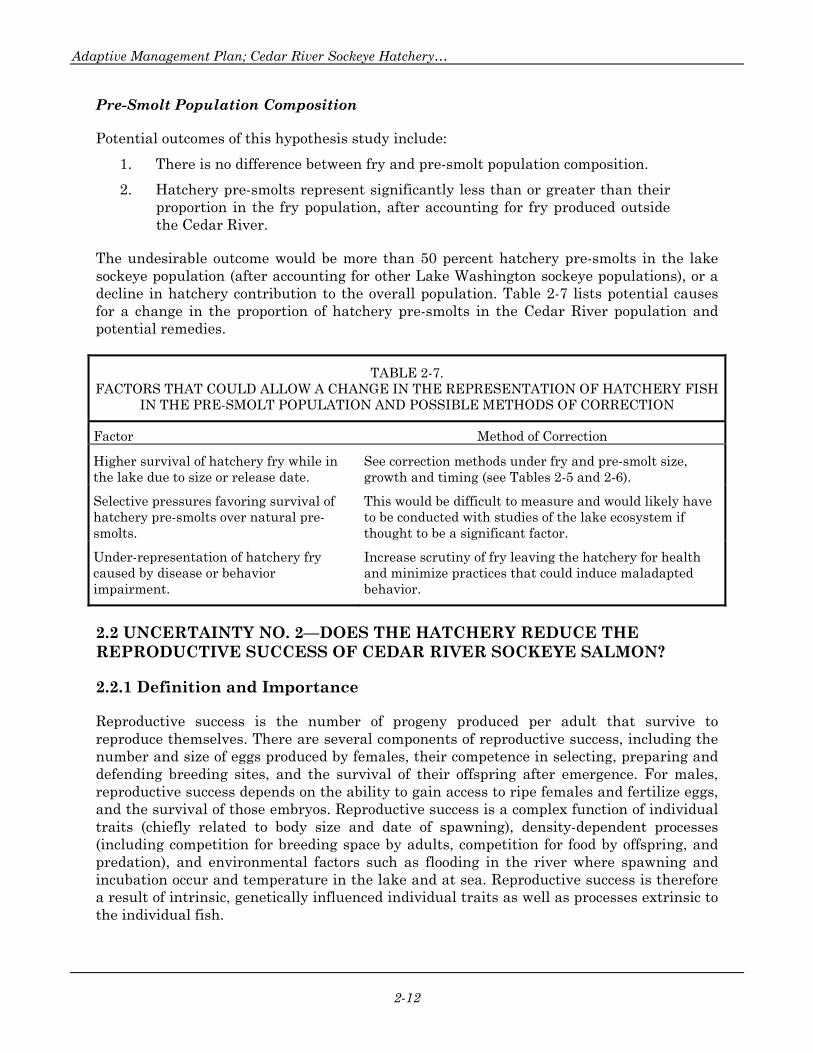
Pre-Smolt Population Composition
Potential outcomes of this hypothesis study include:
1. There is no difference between fry and pre-smolt population composition.
2. Hatchery pre-smolts represent significantly less than or greater than their proportion in the fry population, after accounting for fry produced outside the Cedar River.
The undesirable outcome would be more than 50 percent hatchery pre-smolts in the lake sockeye population (after accounting for other Lake Washington sockeye populations), or a decline in hatchery contribution to the overall population. Table 2-7 lists potential causes for a change in the proportion of hatchery pre-smolts in the Cedar River population and potential remedies.
TABLE 2-7. FACTORS THAT COULD ALLOW A CHANGE IN THE REPRESENTATION OF HATCHERY FISH
IN THE PRE-SMOLT POPULATION AND POSSIBLE METHODS OF CORRECTION
Factor Method of Correction
Higher survival of hatchery fry while in the lake due to size or release date.
See correction methods under fry and pre-smolt size, growth and timing (see Tables 2-5 and 2-6).
Selective pressures favoring survival of hatchery pre-smolts over natural pre-smolts.
This would be difficult to measure and would likely have to be conducted with studies of the lake ecosystem if thought to be a significant factor.
Under-representation of hatchery fry caused by disease or behavior impairment.
Increase scrutiny of fry leaving the hatchery for health and minimize practices that could induce maladapted behavior.
2.2 UNCERTAINTY NO. 2—DOES THE HATCHERY REDUCE THE REPRODUCTIVE SUCCESS OF CEDAR RIVER SOCKEYE SALMON?
2.2.1 Definition and Importance
Reproductive success is the number of progeny produced per adult that survive to reproduce themselves. There are several components of reproductive success, including the number and size of eggs produced by females, their competence in selecting, preparing and defending breeding sites, and the survival of their offspring after emergence. For males, reproductive success depends on the ability to gain access to ripe females and fertilize eggs, and the survival of those embryos. Reproductive success is a complex function of individual traits (chiefly related to body size and date of spawning), density-dependent processes (including competition for breeding space by adults, competition for food by offspring, and predation), and environmental factors such as flooding in the river where spawning and incubation occur and temperature in the lake and at sea. Reproductive success is therefore a result of intrinsic, genetically influenced individual traits as well as processes extrinsic to the individual fish.
…2. KEY UNCERTAINTIES
2-13
The life history patterns (e.g., size and age at maturity, egg size, spawning date, etc.) of populations are evolutionary adaptations to maximize reproductive success. The Cedar River population is not native, and the low reproductive success of the population (that is, few returning adults per spawner) may in part reflect the mismatch between genotype and environment. Reduction in reproductive success of the naturally spawning population would reduce the overall productivity of the system and might accelerate the decline of the naturally spawning population. Operation of the hatchery could affect reproductive success through various processes.
First, the hatchery might reduce the reproductive success of the naturally spawning population by removing some selective pressures on reproductive traits such as courtship and redd site choice. By spawning fish at random in the hatchery, smaller or weaker fish that would be at a disadvantage in the river might produce as many offspring as stronger individuals. Through time this can alter the reproductive success of the population.
Second, there might be some alteration in the genetic composition of the hatchery population (“domestication selection”) rendering them more fit for the hatchery and less fit for natural conditions. Such inadvertent selection has been documented, and at least some of the poor performance of hatchery-origin steelhead spawning in rivers compared to sympatric wild steelhead may result from this process (Chilcote et al. 1986; Leider et al. 1990), although steelhead hatcheries rear their fry for a year or more while the sockeye hatchery would be releasing the fry soon after they leave the incubators.
Third, the hatchery may tend to select for phenotypes that are natural but that do not represent the full spectrum of the naturally spawning population. The adults have an unusually protracted period of spawning (from September until December or even later) compared to other sockeye salmon populations. It is not clear whether this reflects recent evolutionary adaptation to the Cedar River and Lake Washington basin or ancestral patterns. Baker Lake sockeye, from which the Cedar River population is thought to be largely derived, do spawn over a similar time period (late September to December; Washington Department of Fisheries et al. 1992). There is a strong genetic basis for spawning timing in salmon, and other life history traits tend to co-vary with spawning date such as body size, energy and reproductive allocation (Hendry et al. 1999), and the location of spawning. Assuming the present condition reflects natural selection in the Lake Washington basin, a change in the temporal and spatial distribution of spawning might reduce the reproductive success of naturally spawning salmon in the future.
2.2.2 Existing Data and Knowledge
Some data on the age, size, egg size, fecundity, and morphology of Lake Washington (including Cedar River) sockeye were reported by Quinn et al. (1995) and Hendry and Quinn (1997). WDFW has been conducting research on sockeye returning to the Cedar River. Their data includes an examination of size, fecundity, egg size, and age at maturity of hatchery and naturally produced fish. These data are currently being analyzed and will be considered in the adaptive management process as they are available.
In addition to research on phenotypic traits, there have been several studies of the genetic structure and ancestry of Lake Washington basin sockeye (e.g., Hendry et al. 1996, 2000; Bentzen and Spies 2000; Spies et al. 2001; Young et al. 2001). Despite this work, there is
Adaptive Management Plan; Cedar River Sockeye Hatchery…
2-14
considerable uncertainty about the origins and present structure of the populations. It seems most likely that the present Cedar River population was derived from transplants from the Baker Lake system in the 1930s and 1940s, though it is difficult to rule out contributions from other transplants. Moreover, the existence of small native sockeye and kokanee populations in the Lake Washington system (though probably not the Cedar River) seems likely but it is difficult to be certain which (if any) present populations represent pure “native” sockeye.
Results of adult carcass collection for 1997-2000 are presented in Fresh et al (2003). They conclude that in some comparisons that hatchery origin female sockeye were significantly smaller than those of natural origin females of the same age. They also conclude that there are differences in adult distribution during spawning and that the broodstock collected to date are timed earlier than the overall run. They found no significant differences in age at maturity or return timing between hatchery and natural origin returns.
2.2.3 Remaining Unknowns
Is there a trend in body size, fecundity and egg size through time?
Many Pacific salmon populations, including ones in the Puget Sound area, have experienced declines in body size over the past decades; in others there is evidence of significant annual variation. There are many possible reasons for this, including but not limited to, changes in smolt size (including hatchery effects), changes in age composition of spawners, temperature regimes and competition for food at sea, and selective fishing. Declines in size may manifest themselves in reduced fecundity (Washington and Koziol 1993). It is possible that changes in growing conditions in the lake (i.e., smolt size) could affect age composition and fecundity, however, this relationship has not been examined in Lake Washington. It is possible that data from ongoing studies or retrospective analysis of existing data could shed light on this question.
What is the relationship between spawning date and location of spawning?
Sockeye salmon that return early to the Cedar River tend to spawn in the upper reaches of the river to a greater extent than those returning later (Ames and Beecher 2001). Recoveries of otoliths from experimental groups released from the hatchery into the upper, middle and lower reaches of the river indicated that adults tend to return to the site where they were released more often than would occur by chance (Fresh et al 2003.). During the period of evaluation, samples taken during the broodstock collection period, suggesting that hatchery returns tended to favor upstream spawning areas more so than naturally produced sockeye. It is likely that naturally spawned fry emerging from specific reaches of the river will return to those reaches, resulting in partial segregation of the run in space and time. There is abundant evidence that early and late spawning salmon differ in longevity and other life history traits (Perrin and Irvine 1990; Hendry et al. 1999), and so timing is not merely a random variable but is associated with other important adaptations. Therefore, it is important to understand how adults returning over the course of the spawning season distribute themselves in the river.
…2. KEY UNCERTAINTIES
2-15
2.2.4 Hypotheses
Abundance, life history patterns, and genetic structure of salmon populations are not fixed. Some variation is both inevitable and beneficial. Nevertheless, some changes would foreshadow declines in fitness and are cause for concern. The following null hypotheses will guide initial monitoring and research studies for this uncertainty:
• The size and age composition of the population at maturity of Cedar River sockeye will not show a trend over time.
• The relationships between body size, fecundity and egg size of female sockeye in the Cedar River will remain constant.
• The spatial and temporal distribution of spawning will remain constant over time.
• There will be no difference in reproductive success between hatchery and naturally produced sockeye spawning naturally.
• There will be no trend toward lower overall reproductive success of naturally spawning sockeye over time.
• The genetic composition of the Cedar River sockeye population will not change over time.
2.2.5 Monitoring and Research Plan
Size and Age at Maturity
To investigate size at age, adult sockeye should be sampled for otoliths or scales to determine age and their length should be measured. This will allow a long-term comparison of size at maturity to determine if sockeye are becoming smaller or if the age composition is changing. As part of routine operations, a sample of the adult salmon spawned at the hatchery and carcasses retrieved from the river need to be measured and their otoliths removed to assess the proportion of hatchery and naturally produced fish. Body size measurements should use the same methods each year (e.g., mid-eye to hypural plate) and ages of naturally spawned fish should be validated using otoliths of known-age hatchery fish. Size data should be collected at the hatchery annually from fish spawned on each egg-take date. Otolith collection, at both the hatchery and in the river, should occur in years 1-10. Lengths of fish spawning in the river should also be collected during years 1-10. Further data collection will depend on initial study results and analysis.
A broodstock collection site located as close as possible to the mouth of the Cedar River would allow collection of a random sample of sockeye as they migrate. The location of the broodstock collection facility used for the interim hatchery limits access to later returns and to downriver spawners. A sampling approach could then be developed to gather samples that accurately characterize the sockeye run.
Fecundity and Egg Size
Female body size, egg size, and fecundity should be examined over time to determine if any decrease is occurring in the population. Study methods should include taking female
Adaptive Management Plan; Cedar River Sockeye Hatchery…
2-16
lengths, weighing the total mass of fresh (i.e., not water-hardened) eggs she produces, and collecting a small number (about 50) for separate weighing and counting. This should provide an accurate estimate of egg size, fecundity, and gonadosomatic index. These females should also be sampled for otoliths to determine age and origin (hatchery or river). This should allow detection of any differences in reproductive output between natural and hatchery fish, and among hatchery treatment groups. Relationships between size, age, egg size, and fecundity can also be examined.
Spawning Date and Location
To examine how spawners returning at different times over the spawning run distribute themselves in the river, tagging studies should be conducted. Adult sockeye should be trapped at the mouth of the river or the broodstock collection facility at various times during the spawning run and tagged. Recovery surveys should then be conducted to trace where those fish go in the system and ultimately spawn. These studies could be conducted in connection with tagging and movement studies of sockeye in the lake as well (see Uncertainty No. 3), and should be connected with length, age, and otolith examination.
Reproductive Success
The null hypothesis is that after one or more generations of breeding in the hatchery, the reproductive success of naturally spawning sockeye salmon will not differ between individuals whose parents were bred in the hatchery and those whose parents were not. Under this hypothesis, hatchery-bred fish spawning in the river (from the first years of the hatchery) would produce progeny that could not be distinguished from naturally spawning fish, so only the effects of a single generation of hatchery production could be assessed.
This hypothesis could be tested by allowing adults (of unknown parentage) to enter and spawn in a discrete area such as a spawning channel. Otolith examination (post-mortem) would determine their origin and DNA parentage analysis (from fin-clips of adults and fry) could determine whether the per capita fry production differed between naturally spawning and hatchery parents. This assessment would depend on having a mix of naturally spawning and hatchery parents; if all the parents were hatchery produced then no light would be shed on the question. This would not be known until after the spawning had taken place, and so the study should be conducted in a season when an approximately equal ratio is expected. This study should be conducted in years 1-2 and repeated in years 9-10.
In addition to this direct (albeit somewhat controlled) comparison, the reproductive success of the two groups could be compared in an indirect, less controlled manner. Knowing the number of females that spawn in the river each year and estimating (from otolith examination) the proportion of hatchery females, will allow comparison of the number of fry produced per female among years with varying proportions of hatchery females. The drawbacks to this method are that many years of data would be required and that other factors affecting fry production (notably density, flow, and variation in spawner distribution) would have to be considered in the analysis.
The possibility of the population becoming progressively less fit for natural reproduction will have to be evaluated. This is complicated by non-genetic factors (notably flooding during incubation and flow-related survival during migration by fry to the lake). However,
…2. KEY UNCERTAINTIES
2-17
a decrease in the flow-adjusted survival rate over time would be cause for concern because even under present conditions the naturally spawning population is barely replacing itself. To evaluate this possibility, adult to adult survival for hatchery and natural origin groups within year and over time will be evaluated along with fry production per capita for naturally spawning sockeye.
Genetic Composition
Life history traits such as spawning date and body size reflect both genetic and environmental influences. In addition to these phenotypic traits that are subject to natural selection and affect fitness, there are biochemical and molecular traits that appear neutral to selection and are not influenced by environmental conditions. Such traits have been used to test hypotheses regarding ancestral origins and present population structure in the basin (Hendry et al. 1996, 2000; Bentzen and Spies 2000; Young et al. 2001). Because the different variants of the alleles apparently confer no fitness benefits, there is no “ideal” genetic composition that needs to be maintained. Rather, it is generally believed that levels of genetic diversity, as indicated by these traits, are associated with the overall health of the population (Ryman 1991; Waples 1991). In addition, shifts in gene frequency might be associated with changes in adaptive traits not being measured.
Over the past few decades there have been many very rapid changes in the tools used for studying the genetic composition of populations, and we might anticipate further advances in this scientific discipline (Carvalho et al. 1994). Progress has been made, not by rejecting early techniques (e.g., polymorphic proteins) but by adding other techniques and markers (e.g., mitochondrial and nuclear DNA). It therefore would be unwise to recommend any particular technique for genetic analysis. Rather, it will be most important to collect and archive samples from a fraction of the naturally and hatchery produced salmon, and from other spawning populations in the basin, such as Bear Creek. Annual processing of these samples will be unnecessary and no specific management action would result from small changes in the frequency of alleles in the population. However, it would be prudent to conduct analysis on a periodic basis to track trends over time. Genetic studies should occur at the end of the first decade of hatchery operations (years 9-10), in conjunction with reproductive fitness studies.
Budget
The HCP budget allocated a total of $567,840 over the life of the project to monitor phenotypic and genetic traits, tentatively budgeted as $35,490 per year for years 1-4, 9-12, 28-31, and 46-49. Otolith recovery from returning adults was budgeted at $47,320 per year for years 1-12, 28-31, and 46-49. These years were presumably selected to permit collection of the returning adults that had been marked in the earlier years (24-27 and 42-45) and to parallel genetic analyses. Table 2-8 presents the allocated and estimated budgets.

Adaptive Management Plan; Cedar River Sockeye Hatchery…
2-18
TABLE 2-8. BUDGET ALLOCATION FOR HYPOTHESES RELATED TO REPRODUCTIVE FITNESS AND
GENETIC COMPOSITION OF CEDAR RIVER SOCKEYE
HCP Allocation AMP
Hypothesis HCP Budget
Category Years Amounta (per year) Yearsb
Estimated Cost (per year) Comments
Size and age at maturity
Otolith recovery from returning adults
1-12 28-31 46-49
$47,320 Size: annual
Otoliths: 1-10
$45,000c Conduct in conjunction with fecundity and egg size sampling
Fecundity and egg size
Phenotypic and genetic traits
1-4 9-12 28-31 46-49
$35,490 Annual Hatchery Operation
Should be a routine hatchery operation
Spawning date and location
None — — 1-4 $25,000 Conduct in conjunction with otolith recovery
Reproductive Success
None — — 1-2 9-10
$35,000 Combine with genetic composition in all but years 1-4
a. Total amount allocated to all activities within that budget category. b. Study years within the first ten years of the hatchery only. Further studies will be decided
through analysis of study results. c. Size measurements at the hatchery should be integrated with hatchery operations.
Measurements of salmon from the river and otolith extraction and processing are accounted for in the cost estimate. This supplies only a portion of the total amount. A total budget of $167,000 would be required for collection of otoliths in the field and at the hatchery, otolith analysis, fry marking, data analysis and report preparation, and WDFW overhead (Kurt Fresh, WDFW, pers. comm.). $23,000 for fry marking is included in the budget for Uncertainty #1 (see Table 2-3).
2.2.6 Adaptive Management Actions
Size and Age at Maturity
Potential Study Outcomes
Plausible outcomes of this study are as follows:
1. There is no trend in size and age at maturity of Cedar River sockeye over time.
2. There is a trend toward decreasing size at age and increasing age at maturity, or increasing size at age and decreasing age at maturity of Cedar River sockeye over time.
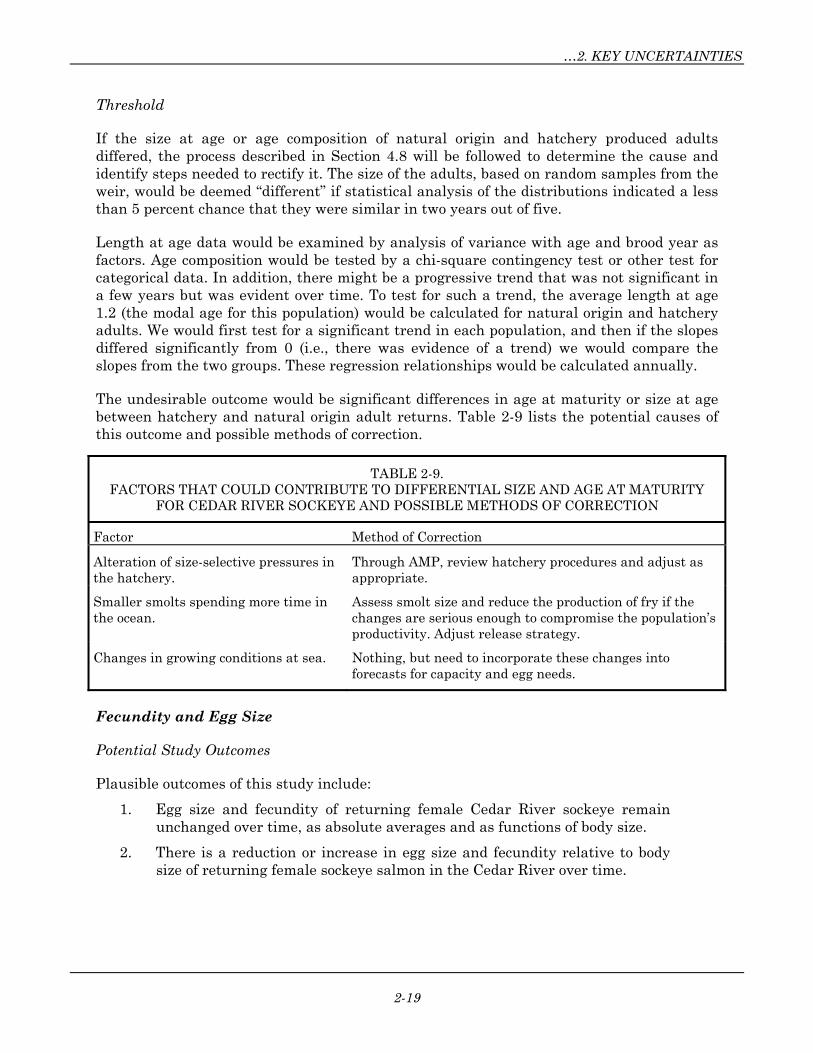
…2. KEY UNCERTAINTIES
2-19
Threshold
If the size at age or age composition of natural origin and hatchery produced adults differed, the process described in Section 4.8 will be followed to determine the cause and identify steps needed to rectify it. The size of the adults, based on random samples from the weir, would be deemed “different” if statistical analysis of the distributions indicated a less than 5 percent chance that they were similar in two years out of five.
Length at age data would be examined by analysis of variance with age and brood year as factors. Age composition would be tested by a chi-square contingency test or other test for categorical data. In addition, there might be a progressive trend that was not significant in a few years but was evident over time. To test for such a trend, the average length at age 1.2 (the modal age for this population) would be calculated for natural origin and hatchery adults. We would first test for a significant trend in each population, and then if the slopes differed significantly from 0 (i.e., there was evidence of a trend) we would compare the slopes from the two groups. These regression relationships would be calculated annually.
The undesirable outcome would be significant differences in age at maturity or size at age between hatchery and natural origin adult returns. Table 2-9 lists the potential causes of this outcome and possible methods of correction.
TABLE 2-9. FACTORS THAT COULD CONTRIBUTE TO DIFFERENTIAL SIZE AND AGE AT MATURITY
FOR CEDAR RIVER SOCKEYE AND POSSIBLE METHODS OF CORRECTION
Factor Method of Correction
Alteration of size-selective pressures in the hatchery.
Through AMP, review hatchery procedures and adjust as appropriate.
Smaller smolts spending more time in the ocean.
Assess smolt size and reduce the production of fry if the changes are serious enough to compromise the population’s productivity. Adjust release strategy.
Changes in growing conditions at sea. Nothing, but need to incorporate these changes into forecasts for capacity and egg needs.
Fecundity and Egg Size
Potential Study Outcomes
Plausible outcomes of this study include:
1. Egg size and fecundity of returning female Cedar River sockeye remain unchanged over time, as absolute averages and as functions of body size.
2. There is a reduction or increase in egg size and fecundity relative to body size of returning female sockeye salmon in the Cedar River over time.

Adaptive Management Plan; Cedar River Sockeye Hatchery…
2-20
Threshold
Egg size and fecundity will be examined by ANOVA with origin (natural or hatchery) and brood year as factors. Such analysis does not consider differences in body size, however. Accordingly, the data will also be examined using ANCOVA (analysis of covariance) with length as the covariate to determine if the natural and hatchery produced fish differ in reproductive output as a function of body length. To test for trends over time we will use both the raw mean egg size and fecundity data and size-adjusted data by using the expected value for each year at a fixed length. That is, we will calculate the slope of the length-fecundity relationship for each year and then estimate the fecundity of females of a given length (e.g., 60 cm) in each year. If any significant patterns are detected, the process described in Section 4.8 will be followed to determine the cause and identify steps needed to rectify it.
The undesirable outcome would be a reduction in egg size or fecundity in females. Table 2-10 lists the potential causes of these reductions and possible methods of correction.
TABLE 2-10. FACTORS THAT COULD CONTRIBUTE TO REDUCED EGG SIZE AND FECUNDITY IN CEDAR
RIVER SOCKEYE FEMALES AND POSSIBLE METHODS OF CORRECTION
Factor Method of Correction
Smaller female body size results in fewer or smaller eggs.
Determine whether the decline is related to growth rate or age at maturity, and examine ecological processes and possible inadvertent selection in the hatchery. Ensure broodstock is representative at the run.
Slower growth in fresh water could result in fewer, larger eggs relative to body size. (Might not be true for sockeye.)
Consider reducing fry production if the changes are serious enough to compromise the population’s productivity.
Slower growth at sea results in fewer, larger eggs relative to body size, or more rapid growth results in more, smaller eggs.
Nothing, but need to incorporate these changes into forecasts for capacity and egg needs.
Spawning Date and Location
This subject examines the pattern of spatial and temporal distribution and the co-variation of these traits with life history patterns and with hatchery/natural origin. The first need for this study is to determine the prevailing patterns, building on detailed work done in 1969 (reported by Ames and Beecher 2001). The second need is to determine whether the hatchery might be affecting these patterns.
Potential Study Outcomes
Plausible outcomes of this study include:
1. The spatial and temporal distributions of spawning by sockeye in the Cedar River are independent.
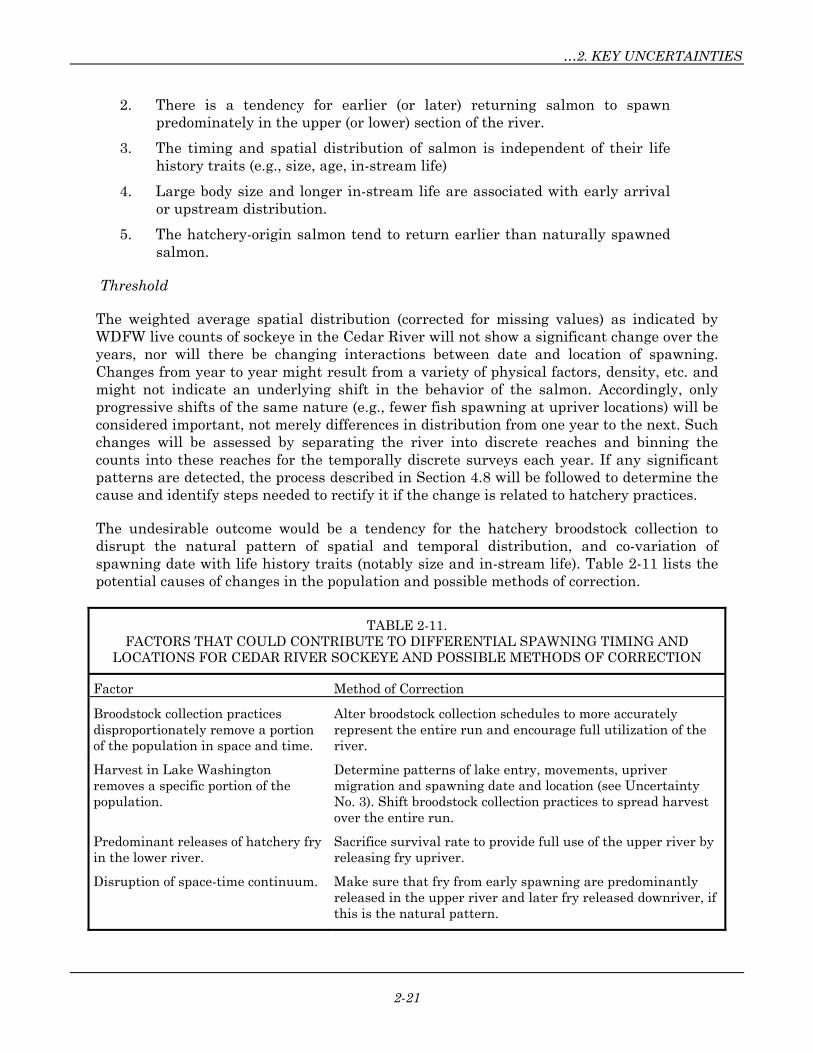
…2. KEY UNCERTAINTIES
2-21
2. There is a tendency for earlier (or later) returning salmon to spawn predominately in the upper (or lower) section of the river.
3. The timing and spatial distribution of salmon is independent of their life history traits (e.g., size, age, in-stream life)
4. Large body size and longer in-stream life are associated with early arrival or upstream distribution.
5. The hatchery-origin salmon tend to return earlier than naturally spawned salmon.
Threshold
The weighted average spatial distribution (corrected for missing values) as indicated by WDFW live counts of sockeye in the Cedar River will not show a significant change over the years, nor will there be changing interactions between date and location of spawning. Changes from year to year might result from a variety of physical factors, density, etc. and might not indicate an underlying shift in the behavior of the salmon. Accordingly, only progressive shifts of the same nature (e.g., fewer fish spawning at upriver locations) will be considered important, not merely differences in distribution from one year to the next. Such changes will be assessed by separating the river into discrete reaches and binning the counts into these reaches for the temporally discrete surveys each year. If any significant patterns are detected, the process described in Section 4.8 will be followed to determine the cause and identify steps needed to rectify it if the change is related to hatchery practices.
The undesirable outcome would be a tendency for the hatchery broodstock collection to disrupt the natural pattern of spatial and temporal distribution, and co-variation of spawning date with life history traits (notably size and in-stream life). Table 2-11 lists the potential causes of changes in the population and possible methods of correction.
TABLE 2-11. FACTORS THAT COULD CONTRIBUTE TO DIFFERENTIAL SPAWNING TIMING AND
LOCATIONS FOR CEDAR RIVER SOCKEYE AND POSSIBLE METHODS OF CORRECTION
Factor Method of Correction
Broodstock collection practices disproportionately remove a portion of the population in space and time.
Alter broodstock collection schedules to more accurately represent the entire run and encourage full utilization of the river.
Harvest in Lake Washington removes a specific portion of the population.
Determine patterns of lake entry, movements, upriver migration and spawning date and location (see Uncertainty No. 3). Shift broodstock collection practices to spread harvest over the entire run.
Predominant releases of hatchery fry in the lower river.
Sacrifice survival rate to provide full use of the upper river by releasing fry upriver.
Disruption of space-time continuum. Make sure that fry from early spawning are predominantly released in the upper river and later fry released downriver, if this is the natural pattern.

Adaptive Management Plan; Cedar River Sockeye Hatchery…
2-22
Reproductive Success
Potential Study Outcomes
Potential outcomes of this hypothesis study include:
1. Hatchery and naturally produced sockeye have similar rates of reproductive success when spawning naturally, and there is no overall trend in fitness over time.
2. Hatchery sockeye have lower rates of reproductive success when spawning naturally than do naturally produced sockeye, and there is a decreasing trend in productivity over time.
Threshold
Estimates of the number of natural origin sockeye salmon fry leaving the Cedar River each year will not show either a significant downward trend over the years, nor a significant correlation with the proportion of hatchery origin spawners in the parental generation. The production of fry is related to both the number of spawning adults and also the peak river discharge during the incubation period. Therefore, the multivariate relationship between fry production and these variables will be calculated, and the residuals from this relationships will be examined from either a time trend or a correlation with the relative abundance of hatchery origin parents. Alternatively, analysis may have to be limited to years with relatively low peak flows (< 100 m3/sec) because when flows are high the survival rates of embryos are so low that there would be little power to detect patterns related to origin or year. If any significant patterns are detected, the process described in Section 4.8 will be followed to determine the cause and identify steps needed to rectify it if the change is related to hatchery practices.
Comparison of adult to adult return rates for hatchery and natural origin sockeye will be made. The adult to adult return for hatchery origin sockeye is expected to exceed that of natural origin sockeye due to the survival benefit of the protected hatchery environment during incubation. The magnitude of this difference will be evaluated each year and over time. Multivariate trend analyses would determine if within year differences in survival rates of the same magnitude over time.
The undesirable outcome would be differential reproductive success between hatchery and naturally produced sockeye or a decreasing trend in fitness in the population over time. Table 2-12 lists the potential causes of the reduced fitness in the population and possible methods of correction.
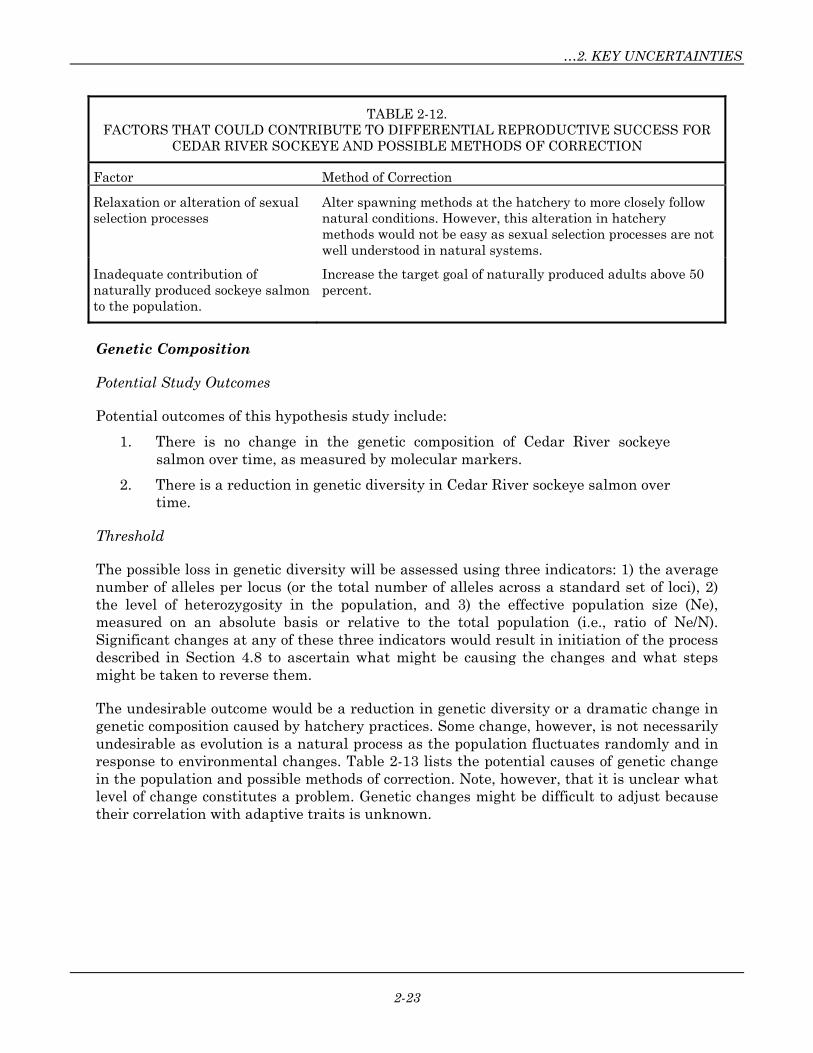
…2. KEY UNCERTAINTIES
2-23
TABLE 2-12. FACTORS THAT COULD CONTRIBUTE TO DIFFERENTIAL REPRODUCTIVE SUCCESS FOR
CEDAR RIVER SOCKEYE AND POSSIBLE METHODS OF CORRECTION
Factor Method of Correction
Relaxation or alteration of sexual selection processes
Alter spawning methods at the hatchery to more closely follow natural conditions. However, this alteration in hatchery methods would not be easy as sexual selection processes are not well understood in natural systems.
Inadequate contribution of naturally produced sockeye salmon to the population.
Increase the target goal of naturally produced adults above 50 percent.
Genetic Composition
Potential Study Outcomes
Potential outcomes of this hypothesis study include:
1. There is no change in the genetic composition of Cedar River sockeye salmon over time, as measured by molecular markers.
2. There is a reduction in genetic diversity in Cedar River sockeye salmon over time.
Threshold
The possible loss in genetic diversity will be assessed using three indicators: 1) the average number of alleles per locus (or the total number of alleles across a standard set of loci), 2) the level of heterozygosity in the population, and 3) the effective population size (Ne), measured on an absolute basis or relative to the total population (i.e., ratio of Ne/N). Significant changes at any of these three indicators would result in initiation of the process described in Section 4.8 to ascertain what might be causing the changes and what steps might be taken to reverse them.
The undesirable outcome would be a reduction in genetic diversity or a dramatic change in genetic composition caused by hatchery practices. Some change, however, is not necessarily undesirable as evolution is a natural process as the population fluctuates randomly and in response to environmental changes. Table 2-13 lists the potential causes of genetic change in the population and possible methods of correction. Note, however, that it is unclear what level of change constitutes a problem. Genetic changes might be difficult to adjust because their correlation with adaptive traits is unknown.
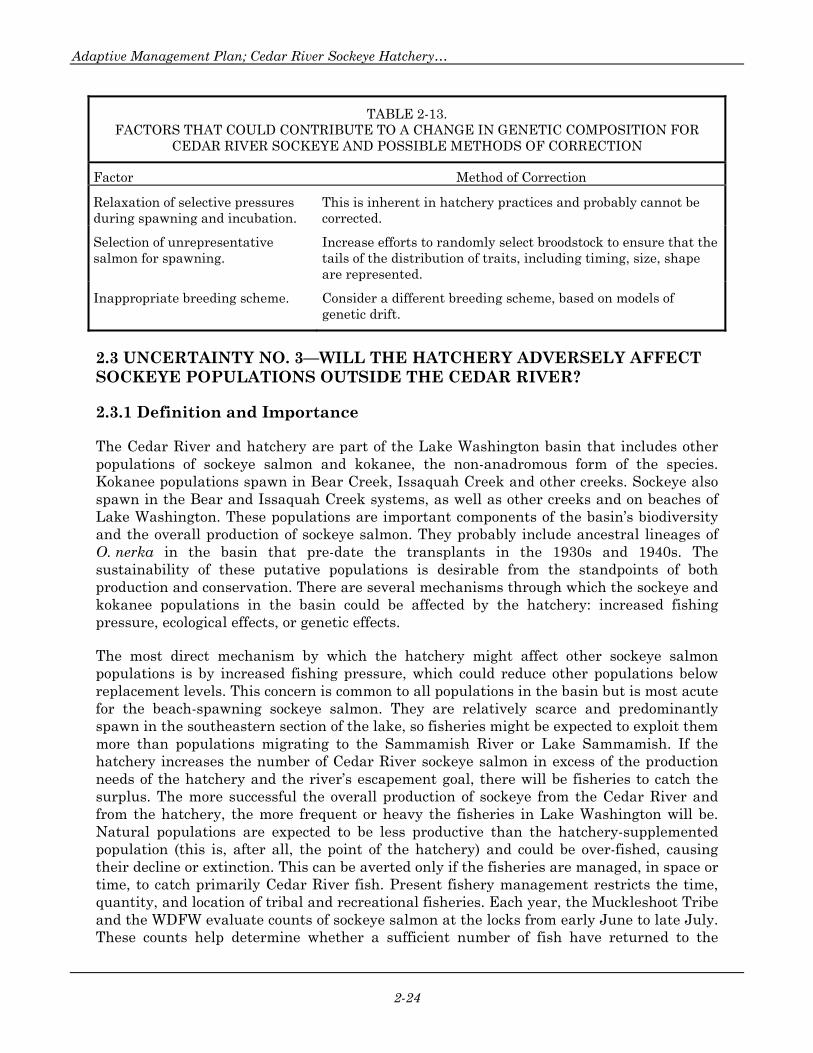
Adaptive Management Plan; Cedar River Sockeye Hatchery…
2-24
TABLE 2-13. FACTORS THAT COULD CONTRIBUTE TO A CHANGE IN GENETIC COMPOSITION FOR
CEDAR RIVER SOCKEYE AND POSSIBLE METHODS OF CORRECTION
Factor Method of Correction
Relaxation of selective pressures during spawning and incubation.
This is inherent in hatchery practices and probably cannot be corrected.
Selection of unrepresentative salmon for spawning.
Increase efforts to randomly select broodstock to ensure that the tails of the distribution of traits, including timing, size, shape are represented.
Inappropriate breeding scheme. Consider a different breeding scheme, based on models of genetic drift.
2.3 UNCERTAINTY NO. 3—WILL THE HATCHERY ADVERSELY AFFECT SOCKEYE POPULATIONS OUTSIDE THE CEDAR RIVER?
2.3.1 Definition and Importance
The Cedar River and hatchery are part of the Lake Washington basin that includes other populations of sockeye salmon and kokanee, the non-anadromous form of the species. Kokanee populations spawn in Bear Creek, Issaquah Creek and other creeks. Sockeye also spawn in the Bear and Issaquah Creek systems, as well as other creeks and on beaches of Lake Washington. These populations are important components of the basin’s biodiversity and the overall production of sockeye salmon. They probably include ancestral lineages of O. nerka in the basin that pre-date the transplants in the 1930s and 1940s. The sustainability of these putative populations is desirable from the standpoints of both production and conservation. There are several mechanisms through which the sockeye and kokanee populations in the basin could be affected by the hatchery: increased fishing pressure, ecological effects, or genetic effects.
The most direct mechanism by which the hatchery might affect other sockeye salmon populations is by increased fishing pressure, which could reduce other populations below replacement levels. This concern is common to all populations in the basin but is most acute for the beach-spawning sockeye salmon. They are relatively scarce and predominantly spawn in the southeastern section of the lake, so fisheries might be expected to exploit them more than populations migrating to the Sammamish River or Lake Sammamish. If the hatchery increases the number of Cedar River sockeye salmon in excess of the production needs of the hatchery and the river’s escapement goal, there will be fisheries to catch the surplus. The more successful the overall production of sockeye from the Cedar River and from the hatchery, the more frequent or heavy the fisheries in Lake Washington will be. Natural populations are expected to be less productive than the hatchery-supplemented population (this is, after all, the point of the hatchery) and could be over-fished, causing their decline or extinction. This can be averted only if the fisheries are managed, in space or time, to catch primarily Cedar River fish. Present fishery management restricts the time, quantity, and location of tribal and recreational fisheries. Each year, the Muckleshoot Tribe and the WDFW evaluate counts of sockeye salmon at the locks from early June to late July. These counts help determine whether a sufficient number of fish have returned to the

…2. KEY UNCERTAINTIES
2-25
system to support fisheries without compromising the escapement goal. If the counts are sufficient, the fishery is typically open in July for a matter of weeks, until the surplus fish are caught. Cedar River sockeye are targeted during fishing openings and, to avoid catch of northern lake tributary sockeye, fishing activities are restricted to the region of the lake south of the Evergreen Point Bridge (Highway 520), under the assumption that sockeye migrating to the north end of the lake will predominantly occupy the area north of the bridge. However, the beach spawning populations in the lake may mix with Cedar River fish, making it difficult to manage separately due to mixing and their small population.
The second mechanism by which the hatchery might affect the other sockeye salmon populations is through changes in the lake’s ecosystem. This uncertainty is addressed in detail below (Uncertainty No. 5).
Third, it is possible that the hatchery might affect the genetic composition (hence the fitness) of other populations. This might occur if significant numbers of Cedar River sockeye strayed and interbred with the other populations.
2.3.2 Existing Data and Knowledge
There has been some research conducted on the genetic structure of various Lake Washington sockeye and kokanee populations. The extent to which these populations are discrete, and which (if any) represent an ancestral lineage has been a subject of considerable research (Hendry et al. 1996; Hendry et al. 2000; Spies et al. 2001; Young et al. 2001) with no absolutely certain conclusions. It is not clear whether further genetic research will resolve the uncertainties surrounding the population structure and ancestry of this species in the basin.
A study of sockeye straying rates from the Cedar River hatchery population into Bear Creek was conducted in 1998, 1999 and 2000 with otolith examination. The level of straying into Bear Creek was negligible since no Cedar River hatchery sockeye were found. While some level of straying might have been detected if the sample size of the study had been increased, the study concluded that hatchery strays, if any, would represent significantly less than 0.5 percent of the Bear Creek adults (Fresh et al. 2001). Straying to other creeks, such as Issaquah Creek, would probably be even less frequent, as they are farther from the Cedar River than Bear Creek. Some level of straying is a natural process in salmon and is not necessarily reason for concern. This issue can be regarded as minor unless hatchery practices are changed markedly from those relevant to the study by Fresh et al. (2001). For example, releases of fry in the lake rather than the river might elevate straying rates.
2.3.3 Remaining Unknowns
A two-year study was initiated in 2003 to learn more about the spatial distribution of sockeye salmon in the lake prior to their ascent into spawning streams, the distribution of specific populations in the lake prior to spawning, and the relationship between date of entry into the lake, population of origin, and spawning date. It also is unknown whether the depth distribution of salmon (hence vulnerability to some fisheries) is similar for all populations and how it changes over the summer. Results from the study are expected to be available in 2006.
Adaptive Management Plan; Cedar River Sockeye Hatchery…
2-26
What is the distribution in the lake of adults from different spawning populations?
By knowing where spawners headed for the Cedar River and the northern tributaries are located within the lake, as well as the extent of their range over the summer, it would be possible to determine the adequacy of the current harvest management regulations. In addition, if the spatial and temporal location of Cedar River sockeye adults were known, fishing could be further managed to minimize catch of other sockeye populations.
What is the population composition of the sockeye harvest in Lake Washington?
It is unknown whether the fisheries (tribal and recreational) catch similar proportions of the different populations of sockeye in Lake Washington, and what the overall patterns of catch by population are. While the aim is to catch only Cedar River sockeye, other populations, such as beach spawners, are probably caught as well. If we understood the patterns of catch, it would be possible to estimate whether harvest of non-Cedar River sockeye occurs at levels that jeopardize their sustainability. If harvest of other sockeye is a problem, it will be important to identify locations and ranges within the lake for these populations and manage fishing accordingly.
What is the relationship between the date of entry into the lake and spawning location?
By knowing the relationship between entry into the lake, timing of spawning, and spawning location, certain time blocks could be set aside as fishing/no-fishing times to maximize harvest of Cedar River fish, minimize catch of other sockeye populations, and protect against compression of the phenotypes and distribution patterns of salmon.
2.3.4 Hypotheses
The following null hypotheses will guide initial monitoring and research for this uncertainty:
• Sockeye harvest in Lake Washington does not capture sockeye from populations outside the Cedar River at levels greater than their productive capacity.
• There is no significant straying by Cedar River hatchery sockeye into other populations.
2.3.5 Monitoring and Research Plan
Harvest
The spatial and temporal distributions of different populations of sockeye in Lake Washington are being examined through a combination of telemetry and conventional tagging. Representative samples of adults entering the system through the locks were tagged and a fraction of them fitted with ultrasonic transmitters and their movements followed in the lake. The combination of tagging techniques should indicate the extent to which sockeye move throughout the lake and the relationship between migration timing into the lake and spawning timing and location. Sockeye salmon could also be caught from
…2. KEY UNCERTAINTIES
2-27
discrete areas in the lake (e.g., with a purse seine) and tagged, but this is not included in the present study. Recovery of tagged salmon at the Cedar River trap and other spawning areas would indicate the spatial distribution patterns of the salmon.
In addition to these directed research projects, the number of non-Cedar River fish caught would need to be compared to escapements to determine if harvest occurs at unsustainable levels. The combination of these methods would provide strong evidence of the extent to which area closures or timing restrictions are likely to protect non-Cedar River populations. It should be noted that the known beach spawning populations in the lake are quite small (often only 100’s of individuals) and that they spawn within the current fishing area. While the pre-spawning timing and distribution of lake spawning sockeye is unknown, there is concern that these small populations could be subjected to harvest rates that are too high through incidental capture during fisheries targeting Cedar River sockeye. These spawning grounds should be surveyed systematically each year.
The tagging studies should occur for up to four years, starting as soon as possible. Further study years should occur in conjunction with changes in harvest regulations. Specifically, in years that regulations are modified, fish harvest should be examined for their population of origin to determine the effectiveness of the new regulations at protecting non-Cedar River fish.
Straying
The results of studies conducted to date indicated that it is unlikely that significant numbers of Cedar River sockeye will stray into other parts of the Lake Washington basin, so this is a much lower priority than studies related to adult arrival, in-lake movements and escapement counts. However, periodic sampling of sockeye otoliths should occur to look for evidence of hatchery-produced fish in all the sockeye salmon spawning grounds in the basin in association with general spawning ground surveys. The study years will depend upon the realized production increases and will be decided by the program management participants.
Budget
A total of $946,400 was allocated to adult survival, distribution, and homing studies for the life of the HCP. Of that $47,320 was allocated for each year in years 1-8 and $35,490 in years 9-10. Table 2-14 presents the budget allocations for studies of harvest and straying.
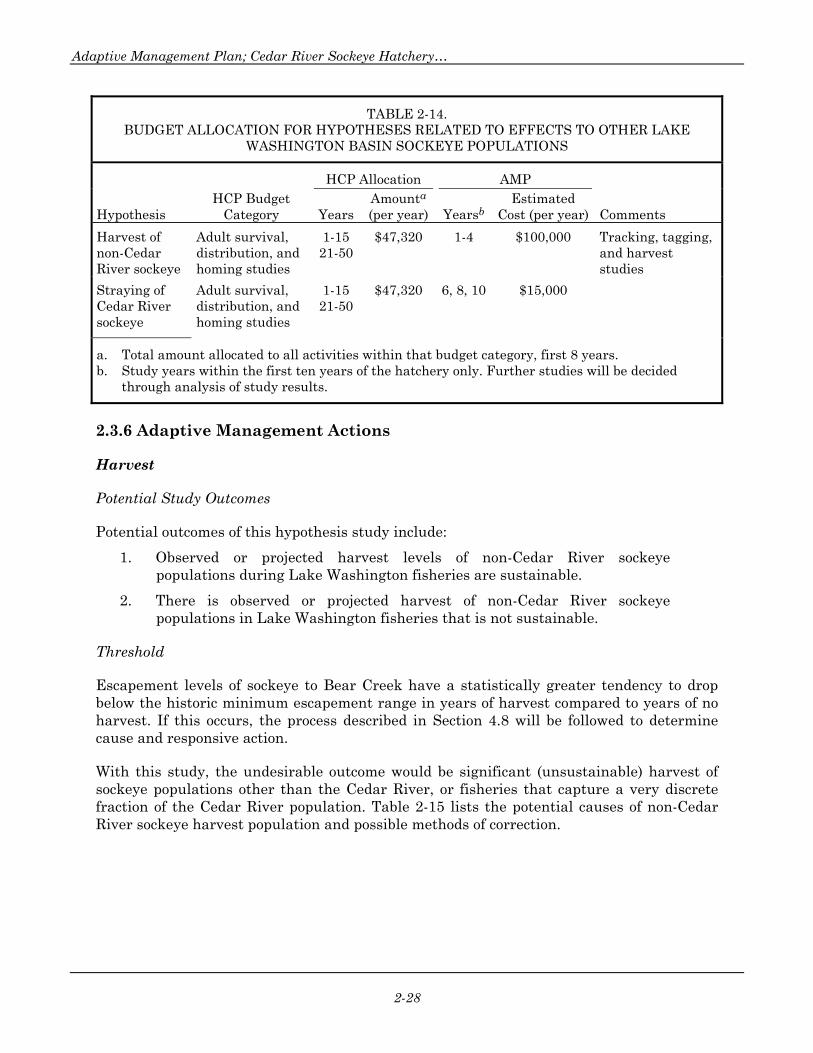
Adaptive Management Plan; Cedar River Sockeye Hatchery…
2-28
TABLE 2-14. BUDGET ALLOCATION FOR HYPOTHESES RELATED TO EFFECTS TO OTHER LAKE
WASHINGTON BASIN SOCKEYE POPULATIONS
HCP Allocation AMP
Hypothesis HCP Budget
Category Years Amounta (per year) Yearsb
Estimated Cost (per year) Comments
Harvest of non-Cedar River sockeye
Adult survival, distribution, and homing studies
1-15 21-50
$47,320 1-4 $100,000 Tracking, tagging, and harvest studies
Straying of Cedar River sockeye
Adult survival, distribution, and homing studies
1-15 21-50
$47,320 6, 8, 10 $15,000
a. Total amount allocated to all activities within that budget category, first 8 years. b. Study years within the first ten years of the hatchery only. Further studies will be decided
through analysis of study results.
2.3.6 Adaptive Management Actions
Harvest
Potential Study Outcomes
Potential outcomes of this hypothesis study include:
1. Observed or projected harvest levels of non-Cedar River sockeye populations during Lake Washington fisheries are sustainable.
2. There is observed or projected harvest of non-Cedar River sockeye populations in Lake Washington fisheries that is not sustainable.
Threshold
Escapement levels of sockeye to Bear Creek have a statistically greater tendency to drop below the historic minimum escapement range in years of harvest compared to years of no harvest. If this occurs, the process described in Section 4.8 will be followed to determine cause and responsive action.
With this study, the undesirable outcome would be significant (unsustainable) harvest of sockeye populations other than the Cedar River, or fisheries that capture a very discrete fraction of the Cedar River population. Table 2-15 lists the potential causes of non-Cedar River sockeye harvest population and possible methods of correction.
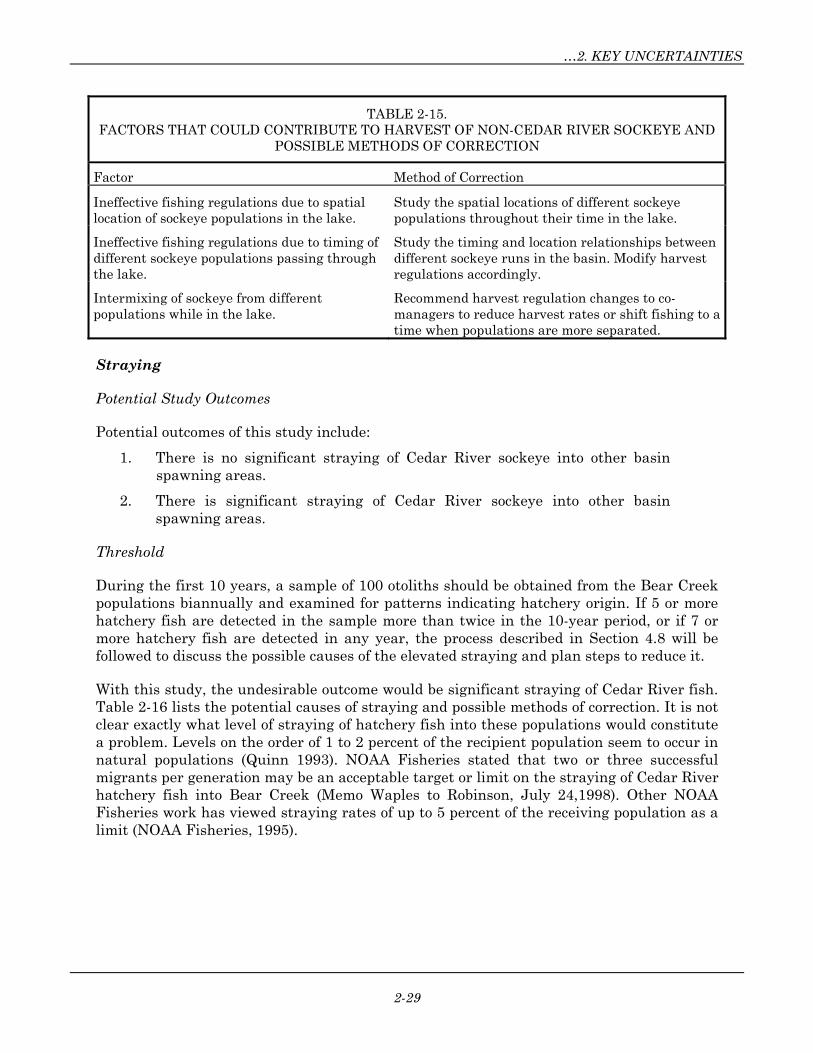
…2. KEY UNCERTAINTIES
2-29
TABLE 2-15. FACTORS THAT COULD CONTRIBUTE TO HARVEST OF NON-CEDAR RIVER SOCKEYE AND
POSSIBLE METHODS OF CORRECTION
Factor Method of Correction
Ineffective fishing regulations due to spatial location of sockeye populations in the lake.
Study the spatial locations of different sockeye populations throughout their time in the lake.
Ineffective fishing regulations due to timing of different sockeye populations passing through the lake.
Study the timing and location relationships between different sockeye runs in the basin. Modify harvest regulations accordingly.
Intermixing of sockeye from different populations while in the lake.
Recommend harvest regulation changes to co-managers to reduce harvest rates or shift fishing to a time when populations are more separated.
Straying
Potential Study Outcomes
Potential outcomes of this study include:
1. There is no significant straying of Cedar River sockeye into other basin spawning areas.
2. There is significant straying of Cedar River sockeye into other basin spawning areas.
Threshold
During the first 10 years, a sample of 100 otoliths should be obtained from the Bear Creek populations biannually and examined for patterns indicating hatchery origin. If 5 or more hatchery fish are detected in the sample more than twice in the 10-year period, or if 7 or more hatchery fish are detected in any year, the process described in Section 4.8 will be followed to discuss the possible causes of the elevated straying and plan steps to reduce it.
With this study, the undesirable outcome would be significant straying of Cedar River fish. Table 2-16 lists the potential causes of straying and possible methods of correction. It is not clear exactly what level of straying of hatchery fish into these populations would constitute a problem. Levels on the order of 1 to 2 percent of the recipient population seem to occur in natural populations (Quinn 1993). NOAA Fisheries stated that two or three successful migrants per generation may be an acceptable target or limit on the straying of Cedar River hatchery fish into Bear Creek (Memo Waples to Robinson, July 24,1998). Other NOAA Fisheries work has viewed straying rates of up to 5 percent of the receiving population as a limit (NOAA Fisheries, 1995).
Adaptive Management Plan; Cedar River Sockeye Hatchery…
2-30
TABLE 2-16. FACTORS THAT COULD CONTRIBUTE TO STRAYING OF CEDAR RIVER SOCKEYE AND
POSSIBLE METHODS OF CORRECTION
Factor Method of Correction
Low release site in the river (insufficient experience for imprinting)
Release hatchery fry further upstream from current locations.
Increased relative production of Cedar River fry. Decrease production levels. Make recommendations to co-managers that will cause harvest of excess adults returning to Cedar River.
2.4 UNCERTAINTY NO. 4—WILL THE HATCHERY PRODUCE ADVERSE CHANGES IN CHINOOK SALMON POPULATIONS?
2.4.1 Definition and Importance
The sockeye salmon hatchery is designed to be benign with respect to other salmonids in the Cedar River. Chinook salmon, one of the other salmonid species in the basin, are part of the Puget Sound Chinook Evolutionarily Significant Unit that is listed as threatened under the Endangered Species Act (ESA). Chinook and sockeye salmon characteristically use different spawning habitats but sympatry, as observed in the Cedar River, is not unprecedented. It is essential that the hatchery not adversely affect the chinook salmon population.
There are several possible modes of interaction between the sockeye hatchery and the chinook salmon population. First, the broodstock collection facility might deter or delay upstream migration (hence distribution, habitat use, and reproductive success) of chinook salmon. Second, large numbers of sockeye salmon returning to the river might disturb the redds of chinook salmon. It is important to note that increased sockeye numbers are not simply a hatchery-related effect but instead are an effect of the mitigation levels identified in the LMA, which is intended to increase the number of sockeye in the river. Lastly, there might be complex ecological interactions involving other species, such as an increase in sockeye salmon fry buffering chinook salmon against predation or sockeye fry serving as a chinook prey item. This last interaction is addressed in Uncertainty No. 5.
2.4.2 Existing Data and Knowledge
Researchers from the City, WDFW, and King County have been conducting studies on chinook spawners in the Cedar River since 1999. Figure 2-2 illustrates the distribution of chinook redds in 1999 and 2003 by river mile (RM). Most chinook salmon spawned above the present location of the broodstock collection weir (RM 6.5) in 1999, 2000 and 2001 (Burton et al. 2001). Twenty nine per cent of the river lies below the location of the broodstock collection weir.
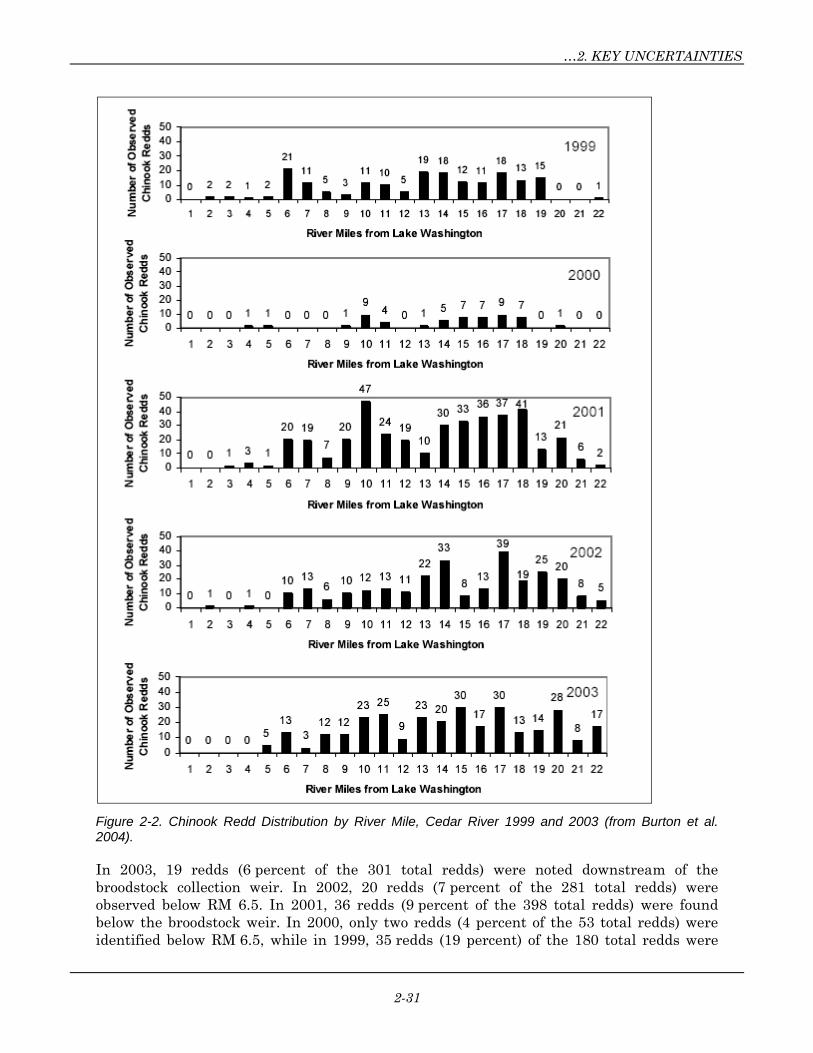
…2. KEY UNCERTAINTIES
2-31
Figure 2-2. Chinook Redd Distribution by River Mile, Cedar River 1999 and 2003 (from Burton et al. 2004).
In 2003, 19 redds (6 percent of the 301 total redds) were noted downstream of the broodstock collection weir. In 2002, 20 redds (7 percent of the 281 total redds) were observed below RM 6.5. In 2001, 36 redds (9 percent of the 398 total redds) were found below the broodstock weir. In 2000, only two redds (4 percent of the 53 total redds) were identified below RM 6.5, while in 1999, 35 redds (19 percent) of the 180 total redds were

Adaptive Management Plan; Cedar River Sockeye Hatchery…
2-32
observed below the weir. (Burton et al. 2004). This suggests that present collection facilities and their operations do not greatly disrupt upstream distribution.
Studies have also been undertaken on the spawning times of sockeye and chinook. The spawning periods of sockeye and chinook salmon overlap broadly, though the sockeye tend to spawn later and over a longer period at present (Figure 2-3; Cascade Environmental Services 1995; Burton et al. 2001). Thus, later redd excavation by sockeye might disturb chinook redds.
Figure 2-3. Average Historical Spawning Curves for Chinook and Sockeye Salmon in the Cedar River (Cascade Environmental Services 1995)
In 1999, the City, WDFW, and King County made observations about sockeye superimposition on chinook redds. Of the 180 chinook redds observed in 1999, five were observed to experience sockeye spawning activity within close proximity and one chinook redd experienced sockeye redd superimposition. Based on these observations, weekly observations were made in 2000 for 52 out of 53 chinook redds to determine the proximity and extent of sockeye spawning near (within 20 feet) incubating chinook. Twenty-two (42 percent) of the observed redds in 2000 had no sockeye spawning activity within 20 feet of their redd mounds. Twenty-four chinook redds (46 percent) had at least one sockeye redd within 20 feet of their mounds. Sockeye spawned directly on the mounds of six chinook redds (11 percent of the observed chinook mounds; Burton et al. 2001).
The extent of chinook redd damage from sockeye spawning activities is unclear. Egg burial depth is positively correlated with body size (Steen and Quinn 1999), so the embryos of larger chinook salmon might not be greatly disturbed by the digging of smaller sockeye salmon. To assess this possibility, the likely egg burial depth of Cedar River sockeye and chinook salmon were estimated from body size data. The chinook female fork length average was estimated at 772 mm, based on unpublished data provided by Larry Lowe, WDFW. These data, collected as post-orbit to hypural lengths, were adjusted to fork length
0
20
40
60
80
100
8/23
8/30 9/6
9/13
9/20
9/27
10/4
10/1
1
10/1
8
10/2
5
11/1
11/8
11/1
5
11/2
2
11/2
9
12/6
12/1
3
12/2
0
12/2
7
1/3
Sp
awn
ing
Co
mp
lete
(%
)
Date
Sockeye
Chinook
…2. KEY UNCERTAINTIES
2-33
using the regression relationship reported by Roni (1992). Using the length-egg burial relationship reported by Steen and Quinn (1999), an average egg burial depth of 22.8 cm for the chinook salmon was estimated. A fork length of 565.5 mm for sockeye salmon was used based on an average of 460 mm mid-eye to hypural length, estimated from data provided by Karl Burton (City of Seattle), Kurt Fresh (WDFW) and Andrew Hendry (University of Massachusetts). The sockeye average egg burial depth was estimated to be 16.7 cm. This is a difference of 6.1 cm in burial depth. However, these estimates are subject to considerable error, as indicated in the reports by Steen and Quinn (1999) and DeVries (1997). It is unclear if a difference of 6 cm is sufficient to protect chinook eggs from damage by sockeye digging.
Cedar River chinook fry are thought to exhibit an ocean-type life history, which typically includes a protracted downstream migration. Fry trapping conducted at the mouth of the Cedar River for sockeye also includes chinook fry and smolt sampling. Trapping is continued through July to adequately trap chinook and understand their timing.
2.4.3 Remaining Unknowns
Will the new broodstock collection facility affect the spawning distribution and reproductive success of chinook salmon?
Since the listing of chinook under the ESA, measures have been taken to avoid delaying their migration at the current weir location. One of the measures includes opening several sections of the weir for fish passage when a chinook is seen holding downstream of the weir. After a chinook is seen holding downstream of the weir for 24 hours, the weir is opened until the chinook passes the weir, or for a period of 12 hours (WDFW 2001). Due to the desire to minimize delay of chinook and to the high number of chinook in the river in 2001, practices often exceeded these protocols. During the 2001 broodstock collection period, the weir was usually opened when chinook were seen in the vicinity of the weir and during some periods the weir was open all night (Brodie Antipa, WDFW, pers. comm.). Data from 1999 and 2000 also suggest that the weir has not significantly delayed chinook migration, based upon their redd location distribution.
However, the replacement hatchery will have a new broodstock collection facility lower on the river. The new facility might affect chinook migration timing and spawning distribution. It is unclear how to determine whether chinook salmon are being delayed, unless they are seen holding below the weir. Perhaps the more important question is whether their spatial distribution is similar to that observed recently (which would assume there is currently no blockage at the weir). The most serious evidence of a problem would be the observation of pre-spawning mortalities of chinook salmon below the weir or much higher densities below the weir than farther upriver.
What is the effect of sockeye redd superimposition on chinook redds?
Based upon the above estimates of chinook and sockeye redd excavation depths, it is unclear if sockeye redd superimposition has significant effects on chinook eggs. The tendency of female salmon to use redd sites excavated by other females, including those of other species (Essington et al. 1998) is known but poorly understood. The critical question is, if smaller salmon (e.g., sockeye) use redd sites containing eggs buried by larger salmon

Adaptive Management Plan; Cedar River Sockeye Hatchery…
2-34
(e.g., chinook), will the eggs of the larger salmon be disturbed or destroyed? The limited literature on inter-specific and intra-specific density dependence in spawning grounds suggests that this is not a simple matter. In the Weaver Creek Spawning Channel, the reproductive success of pink salmon was not affected by densities of sockeye or chum salmon, even though the latter two species were both larger and spawned later than the pink salmon (Essington et al. 2000). Finally, it should be noted that the hatchery is not projected to increase densities of sockeye salmon spawning in the river beyond those set by the present escapement goal.
2.4.4 Hypotheses
The following hypotheses will guide initial research studies related to this uncertainty:
• Operation of the broodstock collection facility does not significantly delay chinook migration or alter spawning distributions.
• There is no significant damage to incubating chinook eggs from sockeye superimposition on chinook redds or reduced chinook reproductive success.
2.4.5 Monitoring and Research Plan
Chinook Migration and Spawning Distribution
The new broodstock collection facility will need to be monitored to ensure that it does not affect chinook passage. Studies on the spatial distribution of chinook spawning should occur during the first several years of the new facility’s operation, and the patterns should be compared to those observed during the past few years. The distribution studies could be similar to current methods, which consist of regular floats of the Cedar River to locate and record chinook redds during the spawning season. In addition, records should be kept at the broodstock collection facility of chinook seen holding downstream and their time of passage, as well as a count of the number of chinook salmon migrating past the collection facility. These records will help evaluate chinook passage times and validate counts in the river. While the count data is not strictly related to the sockeye salmon hatchery, it will be important for determining possible effects of the increase in sockeye numbers on chinook salmon. Chinook and sockeye spawning surveys, along with collection facility observations, should occur annually in years 1-8.
Chinook Redd Superimposition and Reproductive Success
It is neither practical nor acceptable to excavate chinook salmon redds in the Cedar River to determine if there was actual disruption by sockeye salmon digging. Nevertheless, the issue of redd disturbance should be investigated. Initial studies could examine the relationship between the number of chinook fry per female and sockeye densities. Existing data from chinook and sockeye spawning surveys and fry trapping should allow for such a study. Future annual counts of chinook salmon or their redds and fry counts will also be important as hatchery production and sockeye escapement increase.
Observations of sockeye-chinook interactions on the spawning grounds should also be continued. Through annual records of sockeye superimposition on chinook redds,
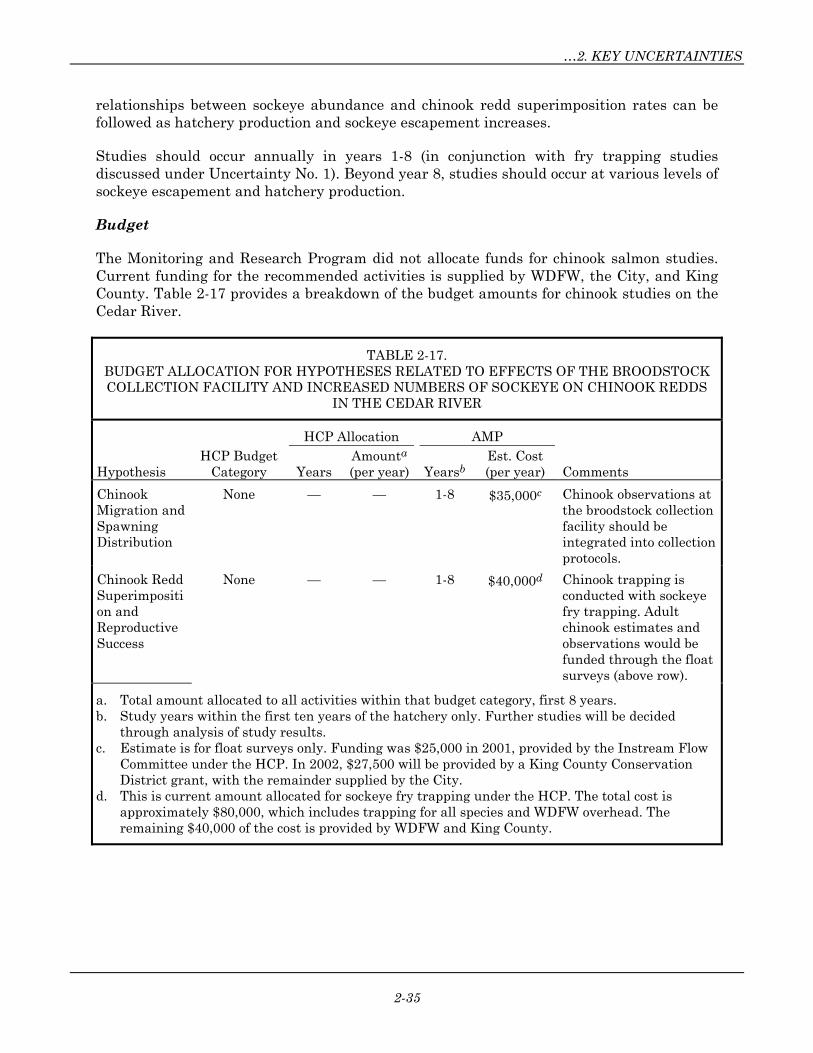
…2. KEY UNCERTAINTIES
2-35
relationships between sockeye abundance and chinook redd superimposition rates can be followed as hatchery production and sockeye escapement increases.
Studies should occur annually in years 1-8 (in conjunction with fry trapping studies discussed under Uncertainty No. 1). Beyond year 8, studies should occur at various levels of sockeye escapement and hatchery production.
Budget
The Monitoring and Research Program did not allocate funds for chinook salmon studies. Current funding for the recommended activities is supplied by WDFW, the City, and King County. Table 2-17 provides a breakdown of the budget amounts for chinook studies on the Cedar River.
TABLE 2-17. BUDGET ALLOCATION FOR HYPOTHESES RELATED TO EFFECTS OF THE BROODSTOCK COLLECTION FACILITY AND INCREASED NUMBERS OF SOCKEYE ON CHINOOK REDDS
IN THE CEDAR RIVER
HCP Allocation AMP
Hypothesis HCP Budget
Category Years Amounta (per year) Yearsb
Est. Cost (per year) Comments
Chinook Migration and Spawning Distribution
None — — 1-8 $35,000c Chinook observations at the broodstock collection facility should be integrated into collection protocols.
Chinook Redd Superimposition and Reproductive Success
None — — 1-8 $40,000d Chinook trapping is conducted with sockeye fry trapping. Adult chinook estimates and observations would be funded through the float surveys (above row).
a. Total amount allocated to all activities within that budget category, first 8 years. b. Study years within the first ten years of the hatchery only. Further studies will be decided
through analysis of study results. c. Estimate is for float surveys only. Funding was $25,000 in 2001, provided by the Instream Flow
Committee under the HCP. In 2002, $27,500 will be provided by a King County Conservation District grant, with the remainder supplied by the City.
d. This is current amount allocated for sockeye fry trapping under the HCP. The total cost is approximately $80,000, which includes trapping for all species and WDFW overhead. The remaining $40,000 of the cost is provided by WDFW and King County.

Adaptive Management Plan; Cedar River Sockeye Hatchery…
2-36
2.4.6 Adaptive Management Actions
Chinook Migration and Spawning Distribution
Potential Study Outcomes
Potential outcomes of this study include:
1. There is no significant delay of migrating chinook at the broodstock collection facility or alteration of spawning distribution.
2. There is a significant delay of migrating chinook at the broodstock collection facility or alteration of spawning distribution.
Threshold
Observations by observers at the broodstock collection facility indicating that more than 5 percent of the chinook that return in a given year are delayed by one day or more will be taken as evidence of delay, and will result in initiating the process described in Section 4.8 to determine the cause and recommend remedial actions. Changes in the spatial distribution of chinook spawning will be inferred from frequency distributions by river mile. There is considerable year-to-year variation (e.g., Figure 2-2). Some changes in distribution might not be consequences of hatchery operations, and some might not be deleterious. However, an increase in chinook salmon spawning below the weir relative to the number spawning above would be cause for concern. A statistically significant increase in the proportion of chinook spawning below the weir will result in initiating the process described in Section 4.8 to determine the cause and recommend remedial actions.
The undesirable outcome would be a significant delay of chinook at the collection facility, as well as an overall change in the distribution of chinook redds in the river. Table 2-18 lists the potential causes of chinook delay and possible methods of correction.
TABLE 2-18. FACTORS THAT COULD CONTRIBUTE TO DELAY OF MIGRATING CHINOOK AND A CHANGE IN SPAWNING DISTRIBUTION AND POSSIBLE METHODS OF CORRECTION
Factor Method of Correction
Infrequent collection facility openings.
Modify weir operational protocols to promote rapid passage of chinook.
Trap shyness on the part of the chinook.
Modify the facility to minimize the effect on chinook.
Chinook Redd Superimposition and Reproductive Success
Potential outcomes of this study include:
1. There is no significant damage to incubating chinook eggs from sockeye superimposition on chinook redds and no change in chinook reproductive success.
…2. KEY UNCERTAINTIES
2-37
2. There is significant damage to incubating chinook eggs from sockeye superimposition on chinook redds and a decline in chinook reproductive success.
Threshold
The production of chinook salmon fry and fingerlings from the river is likely to be a function of the number of spawners in the parental generation and the peak flow in the river during the incubation period. A decrease in fry production, after accounting for these variables, or an inverse correlation between fry production and sockeye salmon density in the river will result in initiating the process described in Section 4.8 to determine the cause and recommend remedial actions.
The undesirable outcome would be significant damage to chinook eggs from sockeye redd superimposition. Table 2-19 lists the potential causes of chinook redd superimposition and decreased chinook reproductive success.
TABLE 2-19. FACTORS THAT COULD CONTRIBUTE TO SOCKEYE REDD SUPERIMPOSITION ON
CHINOOK REDDS AND DECLINING CHINOOK REPRODUCTIVE SUCCESS AND POSSIBLE METHODS OF CORRECTION
Factor Method of Correction
Increase in the number of sockeye spawners or preponderance of late spawning by sockeye.
Alter release locations of hatchery fry or adjust fisheries to keep the escapement close to the goal. The sockeye escapement goal might have to be reduced.
2.5 UNCERTAINTY NO. 5—WILL INCREASED HATCHERY PRODUCTION ALTER AQUATIC COMMUNITY STRUCTURE WITHIN THE LAKE WASHINGTON SYSTEM?
2.5.1 Definition and Importance
Lake Washington serves as the nursery lake for Cedar River sockeye. The lake is a critical transition habitat between the incubation grounds in the Cedar River and other tributaries, and ocean feeding grounds. Hatchery production is expected to increase the number of juvenile sockeye salmon in the lake and this may affect the lake aquatic community. These effects might have ramifications for the hatchery population, other sockeye salmon populations in the basin, and other organisms in the community. These kinds of effects are difficult to predict because of the complex interactions among trophic levels, uncertainty about the factors controlling the abundance of various components of the community, and uncertainty about the future trends in physical factors that might affect the ecosystem. The most obvious ecological interactions involve density, competition and predation.
As stated previously, it is important to acknowledge that an increase in the number of sockeye in the Cedar River and Lake Washington is the intent of the LMA and more generally by the management goals of the co-managers, regardless of whether it is achieved
Adaptive Management Plan; Cedar River Sockeye Hatchery…
2-38
with a hatchery, a spawning channel, or from increased habitat above Landsburg Dam. Therefore, the potential effects on the Lake Washington ecosystem cannot be simply attributable to hatchery operations, and must be considered in relation to the LMA.
2.5.2 Existing Data and Knowledge
Most of the existing data and knowledge about the Lake Washington ecosystem and its relationship to sockeye are referred to in the background portion of this collection of documents. The following is a brief synopsis of the major important interactions.
• The zooplankton Daphnia is the preferred prey item of sockeye in Lake Washington for most of the year.
• Daphnia abundance and size, as well as their relationship to thermal regimes and other zooplankton in Lake Washington, has been studied largely by the University of Washington’s Department of Zoology. The abundance of Daphnia varies seasonally, being scarce in the winter until about April and then being abundant through the fall.
• Daphnia are also preyed upon by other fish species, notably longfin smelt and threespine sticklebacks, and one invertebrate predator, Neomysis mercedis.
• Smelt prey upon Daphnia and thereby compete with sockeye for that resource. However, smelt also prey upon Neomysis and reductions in Neomysis density appear to release Daphnia from strong predation pressures, allowing more food for sockeye. Smelt also seem to buffer predation on sockeye by cutthroat trout (Nowak et al. 2004) and perhaps other piscivorous fish in the years that smelt are abundant.
• Sockeye are preyed upon by many species of predatory fishes, including prickly sculpins, northern pikeminnow (formerly known as northern squawfish), and cutthroat trout. Of these, the trout may be the most important at present and their population seems to have increased over the past decades.
2.5.3 Remaining Unknowns
What is the carrying capacity of Lake Washington for sockeye fry?
Food resources are important because all ecosystems have finite carrying capacities and overabundance of sockeye salmon could reduce the abundance or size distribution of their food resources (chiefly cladocerans and copepods), leading to reduced growth and survival in the lake or at sea. The growth rate of sockeye salmon in the lake is a function of temperature, food quantity and quality, and fish size. In many lakes, the growth of sockeye salmon is density-dependent (see Burgner’s 1987 and 1991 reviews). Evidence for the consequences of exceeding the carrying capacity of a lake was provided by the experiments on Leisure Lake, Alaska (Koenings and Burkett 1987). Increasing densities of sockeye salmon fry resulted in progressively smaller smolts, a higher proportion of the smolts leaving the lake after two rather than one year of lake residence, and a smaller total smolt biomass. Thus, concern about exceeding the carrying capacity of a sockeye salmon rearing
…2. KEY UNCERTAINTIES
2-39
lake has basis in experience. However, some attributes of Lake Washington make it different from other sockeye salmon lakes.
The density of sockeye salmon spawning in the Lake Washington basin (expressed as the number of adult salmon per square kilometer of lake area) has not been especially high (Burgner 1991), and the total of the current escapement goal plus the 262,000 adult mitigation level would leave it well within the range for the species (Figure 2-4). In addition, the sockeye salmon smolts from Lake Washington are at the upper end of the range of sizes seen in natural populations in North America (Figure 2-5; Burgner 1991). This growth may result from both the comparatively mild thermal regime and high density of large prey, notably Daphnia.
The central question is, “What density of sockeye salmon would depress food resources, leading to reduced growth and subsequent survival of sockeye or other ecologically important species in the lake?” Research in other lakes has indicated that larger smolts are more likely to survive at sea than smaller smolts (Henderson and Cass 1991; Koenings et al. 1993). However, within a given lake, relatively little of the year-to-year variation in marine survival is explained by smolt size. Rather, the larger smolts within a year class enjoy a higher probability of survival than smaller smolts, and lakes with smaller smolts tend to have lower survival rates than lakes with larger smolts. Therefore, while smolt sizes between lakes seem to affect marine survival, it appears that year-to-year variation within a lake system does not greatly affect smolt survival. Indeed, there is even evidence that marine survival may be lower for very large smolts than for those of intermediate sizes (Koenings and Burkett 1987). Nevertheless, decreases in smolt size should trigger concern, especially if accompanied by decreases in survival rates or shifts in age composition.
What is the effect of increased numbers of sockeye on piscivore populations?
In examining predator responses to increased sockeye populations, there might be short-term (i.e., behavioral) responses and long-term (numerical) responses. In the short term, increased abundance of sockeye salmon fry might be expected to decrease per capita predation if the number of predators and the number of prey eaten per predator were fixed. However, if the predators congregated at the mouth of the Cedar River to a greater extent than they do at present or in some other way modified their behavior to “specialize” on sockeye salmon then predation per individual sockeye might not decline. In the longer term, if the abundance of sockeye salmon as prey increased the growth rate or abundance of predators, then the increase in fry abundance might be compensated by increased predation. The likelihood of this possibility will depend on the factors controlling abundance of predators but should be considered, at least conceptually.

Adaptive Management Plan; Cedar River Sockeye Hatchery…
2-40
Figure 2-4: Frequency of Lake Spawning Densities for Lakes in the Pacific Northwest, British Columbia, Alaska, and Russia (From Burgner 1991).
Figure 2-5: Frequency of Average Sockeye Smolt Sizes for Nursery Lakes in the Pacific Northwest, British Columbia, Alaska, and Russia (from Burgner 1991, and unpublished data from K. Hyatt, DFO, Nanaimo, B.C., and Cary Feldmann, Puget Sound Energy, pers. comm..).
How does the abundance of sockeye affect other planktivorous fish?
An increase in sockeye numbers in Lake Washington might also affect competitor species, specifically smelt. The effects that smelt and sockeye have on each other are complicated and cannot be well predicted. An increase in the number of sockeye, and their depletion of prey, could cause a decline in the smelt population. In addition, smelt populations could further be reduced through sockeye-induced predation increases. These reduced smelt populations could subsequently affect sockeye through prey reduction (since the Neomysis
0
2
4
6
8
10
12
0-20 21-40 41-60 61-80 81-100 101-120
121-140
141-160
161-180
181-200
Fre
qu
ency
Spawners per lake rearing area
012345678
50-59
60-69
70-79
80-89
90-99
100-109
110-119
120-129
130-139
140-149
150-159
160-169
170-179
Fre
qu
ency
Spawners per lake rearing area
Lake Washington Smolts leaving the LocksLake Washington Pre-
smolts
Lake Washington at 300,000 escapement
goal
Lake Washington with 562,000 spawners

…2. KEY UNCERTAINTIES
2-41
population would presumably not be controlled and would consume more Daphnia) and decreased prey buffering. The situation is further complicated by the tendency of smelt to have a strong year class followed by a weak one. This makes it more difficult to detect ecological effects and relationships in the lake. In summary, the effects of sockeye upon smelt, and the ramifications for the sockeye population, are unknown and could limit the extent to which increased sockeye production is effective at increasing adult returns. Interactions with the lake’s sticklebacks are even less well understood.
2.5.4 Hypotheses
• There is no relationship between sockeye abundance, growth and pre-smolt size in Lake Washington.
• There is no relationship between sockeye abundance and the abundance of predatory fish in Lake Washington.
• There is no relationship between sockeye abundance and the abundance of other planktivorous fish species.
2.5.5 Monitoring and Research Plan
Sockeye Growth
Growth of sockeye in the lake should be examined at various levels of sockeye density. By comparing fry abundance estimates and pre-smolt abundance and size estimates, a relationship between density and growth should be determined. The general description of these methods is discussed under Uncertainty No. 1.
It will be important to include assessment of zooplankton abundance and composition, as well as lake thermal regimes, to be able to account for any variability due to these factors. Abundance of other planktivorous species should also be incorporated since they will influence prey abundance and availability.
Sockeye density and growth data collection should be conducted annually in the first 10 years to track this relationship as hatchery production increases and to account for annual variation. Further study years will be determined through initial study results and direction of program management groups. In general, sampling of pre-smolts and other limnetic fishes is considered part of the baseline assessment needed for the lake.
Predation
It would be very difficult to establish reliable population estimates for fish predators in Lake Washington. Indirectly, predator abundance can be indexed by monitoring the survival of fry to pre-smolt over time. Whether predation will be studied in greater depth, depends on the level of uncertainty associated with predation and that will be determined through the process of establishing monitoring priorities. It is also possible that other entities may see the need for additional information about predator abundance and that this adaptive management program will collaborate with others. Establishing estimates of the major predators in the lake could allow calibration between predator abundance and catches using cheaper, standardized sampling gear (e.g., gill nets for cutthroat trout, northern pikeminnow, and yellow perch; or electrofishing for bass, etc.). This would enable
Adaptive Management Plan; Cedar River Sockeye Hatchery…
2-42
managers to relate catch rates from lower level monitoring efforts back to abundance. If predator studies are done, cutthroat trout, prickly sculpin, northern pike minnow are a few of the species that should be targeted for abundance estimates. A combination of trawl and hydroacoustic methods could be used. Further data that could be useful are seasonal distributions of these fish and overlap in space and time with sockeye, smelt and stickleback.
Planktivore Abundance
The abundance of other planktivorous fishes such as smelt and stickleback should be evaluated to determine how they might be affected by increased sockeye numbers. In addition, information about their abundance could assist in understanding how all lake planktivores cumulatively affect prey species in the lake. It would be possible to look at the relationship between the density of planktivores and the density of their prey, or the density of prey and growth of planktivores. Again, a combination of trawl and hydroacoustic methods should be used as part of the pre-smolt survey and in the fall as well.
To compare data between these three hypotheses, this study should also be conducted annually in years 1-10 to track changes in the planktivore population as hatchery production increases.
Budget
Funding to address issues related to uncertainties in the lake’s carrying capacity and community is designated for year-round studies of the lake’s plankton in years 1-4 at $47,320 in 2001 dollars, and springtime sampling of plankton at $8,281 annually for years 5-10, and $16,562 in total for years 11-15. It is recommended that these budget allocations assist with pre-smolt estimates for sockeye abundance and size data, as well as support some predator and planktivore studies. The planktivore studies could be combined with pre-smolt surveys. Table 2-20 provides a breakdown of budget amounts.
2.5.6 Adaptive Management Actions
Sockeye Growth
Potential Study Outcomes
Potential results of these studies include:
1. There is no relationship between sockeye abundance, growth and pre-smolt size in Lake Washington.
2. Increased sockeye abundance is associated with decreased growth and pre-smolt size in Lake Washington.

…2. KEY UNCERTAINTIES
2-43
TABLE 2-20. BUDGET ALLOCATION FOR HYPOTHESES RELATED TO LAKE WASHINGTON ECOSYSTEM
EFFECTS FROM INCREASED SOCKEYE NUMBERS
HCP Allocation AMP
Hypothesis HCP Budget
Category Years Amounta (per year) Yearsb
Est. Cost (per year) Comments
Sockeye Growth
Plankton Studies
1-4 5-10
$47,320 $8,281
1-10 $45,000 Includes zooplankton, and temperature studies. Pre-smolt estimates are conducted by WDFW. Should they be discontinued, funding should be allocated to that as a priority (see costs in Table 2-3).
Predation rates
None — — Unknown Unknown, depends on
scope
Indirect assessment of predation through calculation of in-lake survival of fry to pre-smolt done annually
Planktivore Abundance
None — — 1-10 $19,000 Coincident with pre-smolt surveys.
a. Total amount allocated to all activities within that budget category, first 10 years. b. Study years within the first ten years of the hatchery only. Further studies will be decided through
analysis of study results.
Threshold
Every five years, a regression analysis will determine if there has been a significant decline in sockeye smolt size over time [=.05]. If a significant decline is established, further analysis will be done to determine if food supply has changed, whether the declining trend correlates with lower freshwater or saltwater survival and whether the annual variation in size correlates with sockeye fry abundance. Based on these analyses and others deemed appropriate by the TWG, the TWG will determine if the development of responses as described in Section 4.8 should be initiated. There is no significant relationship between sockeye abundance and pre-smolt size in Lake Washington when analyzed every five years. If a significant relationship is found, then the process described in Section 4.8 will be followed to determine cause and responsive actions.
The undesirable outcome would be decreased size and growth, correlated with increased marine or in-lake mortality for sockeye. Table 2-21 presents possible factors contributing to this relationship and possible methods of correction. It is important to keep in mind that the food web interactions in Lake Washington are complex and it will be difficult or unwise to try any correction methods other than changes in hatchery production.
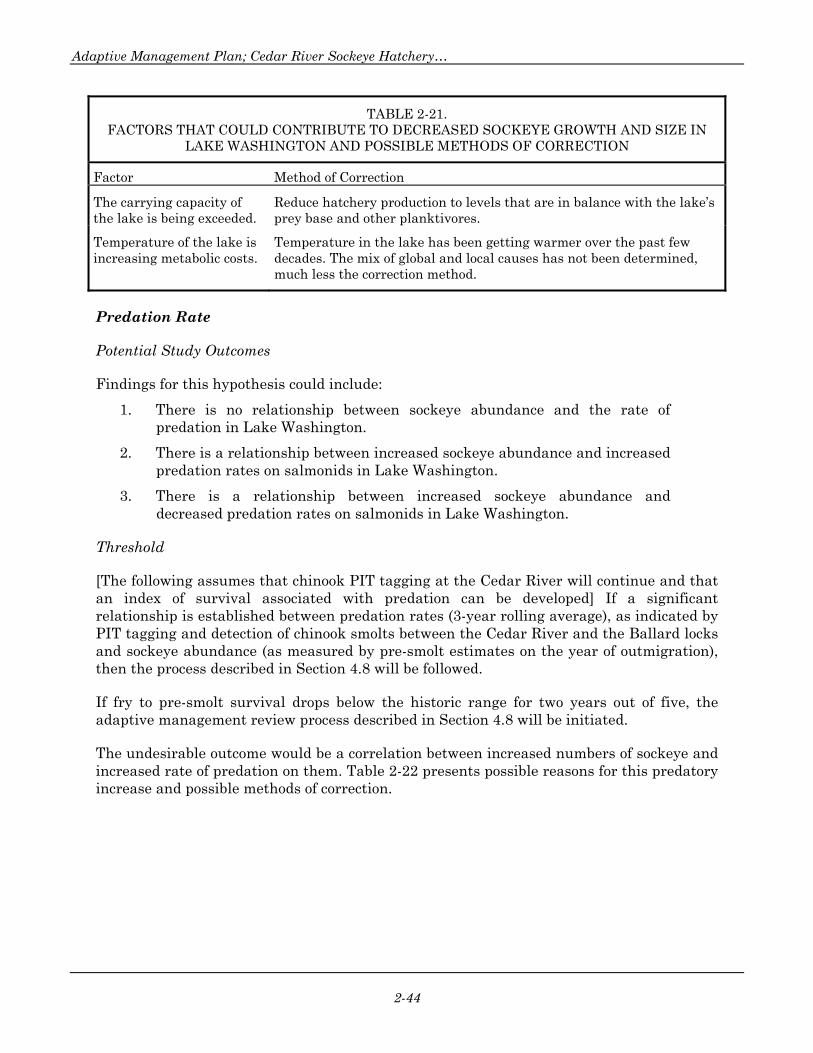
Adaptive Management Plan; Cedar River Sockeye Hatchery…
2-44
TABLE 2-21. FACTORS THAT COULD CONTRIBUTE TO DECREASED SOCKEYE GROWTH AND SIZE IN
LAKE WASHINGTON AND POSSIBLE METHODS OF CORRECTION
Factor Method of Correction
The carrying capacity of the lake is being exceeded.
Reduce hatchery production to levels that are in balance with the lake’s prey base and other planktivores.
Temperature of the lake is increasing metabolic costs.
Temperature in the lake has been getting warmer over the past few decades. The mix of global and local causes has not been determined, much less the correction method.
Predation Rate
Potential Study Outcomes
Findings for this hypothesis could include:
1. There is no relationship between sockeye abundance and the rate of predation in Lake Washington.
2. There is a relationship between increased sockeye abundance and increased predation rates on salmonids in Lake Washington.
3. There is a relationship between increased sockeye abundance and decreased predation rates on salmonids in Lake Washington.
Threshold
[The following assumes that chinook PIT tagging at the Cedar River will continue and that an index of survival associated with predation can be developed] If a significant relationship is established between predation rates (3-year rolling average), as indicated by PIT tagging and detection of chinook smolts between the Cedar River and the Ballard locks and sockeye abundance (as measured by pre-smolt estimates on the year of outmigration), then the process described in Section 4.8 will be followed.
If fry to pre-smolt survival drops below the historic range for two years out of five, the adaptive management review process described in Section 4.8 will be initiated.
The undesirable outcome would be a correlation between increased numbers of sockeye and increased rate of predation on them. Table 2-22 presents possible reasons for this predatory increase and possible methods of correction.
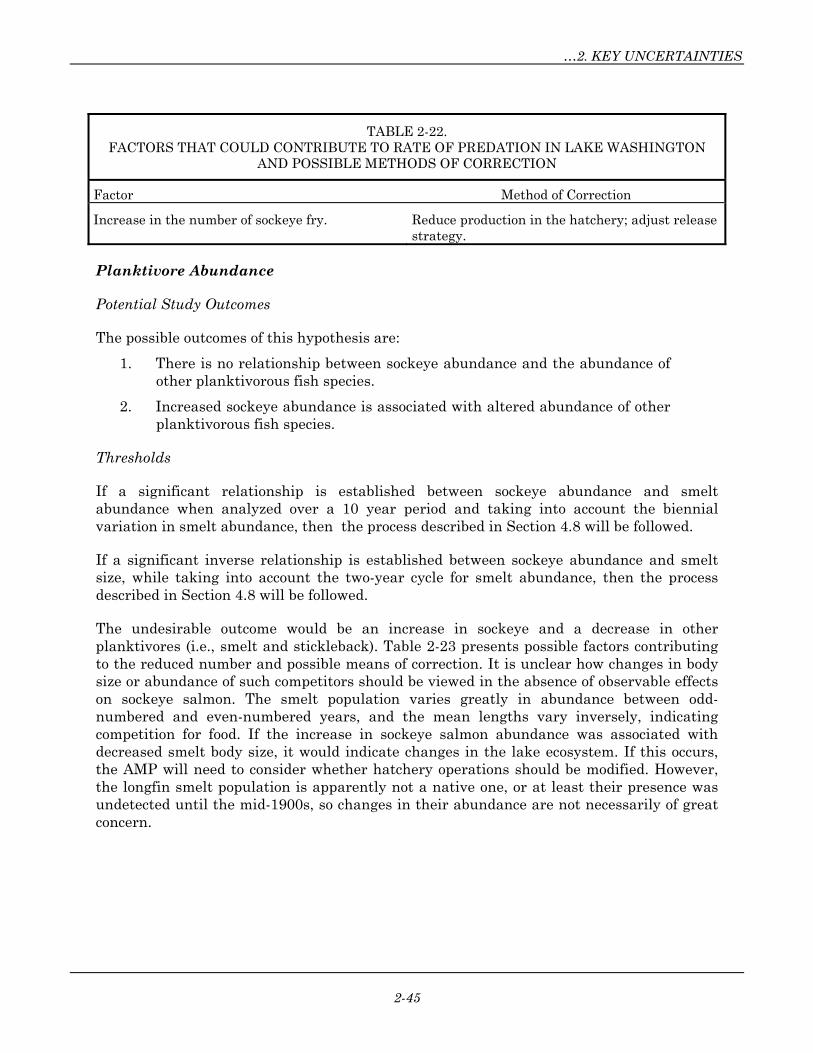
…2. KEY UNCERTAINTIES
2-45
TABLE 2-22. FACTORS THAT COULD CONTRIBUTE TO RATE OF PREDATION IN LAKE WASHINGTON
AND POSSIBLE METHODS OF CORRECTION
Factor Method of Correction
Increase in the number of sockeye fry. Reduce production in the hatchery; adjust release strategy.
Planktivore Abundance
Potential Study Outcomes
The possible outcomes of this hypothesis are:
1. There is no relationship between sockeye abundance and the abundance of other planktivorous fish species.
2. Increased sockeye abundance is associated with altered abundance of other planktivorous fish species.
Thresholds
If a significant relationship is established between sockeye abundance and smelt abundance when analyzed over a 10 year period and taking into account the biennial variation in smelt abundance, then the process described in Section 4.8 will be followed.
If a significant inverse relationship is established between sockeye abundance and smelt size, while taking into account the two-year cycle for smelt abundance, then the process described in Section 4.8 will be followed.
The undesirable outcome would be an increase in sockeye and a decrease in other planktivores (i.e., smelt and stickleback). Table 2-23 presents possible factors contributing to the reduced number and possible means of correction. It is unclear how changes in body size or abundance of such competitors should be viewed in the absence of observable effects on sockeye salmon. The smelt population varies greatly in abundance between odd-numbered and even-numbered years, and the mean lengths vary inversely, indicating competition for food. If the increase in sockeye salmon abundance was associated with decreased smelt body size, it would indicate changes in the lake ecosystem. If this occurs, the AMP will need to consider whether hatchery operations should be modified. However, the longfin smelt population is apparently not a native one, or at least their presence was undetected until the mid-1900s, so changes in their abundance are not necessarily of great concern.
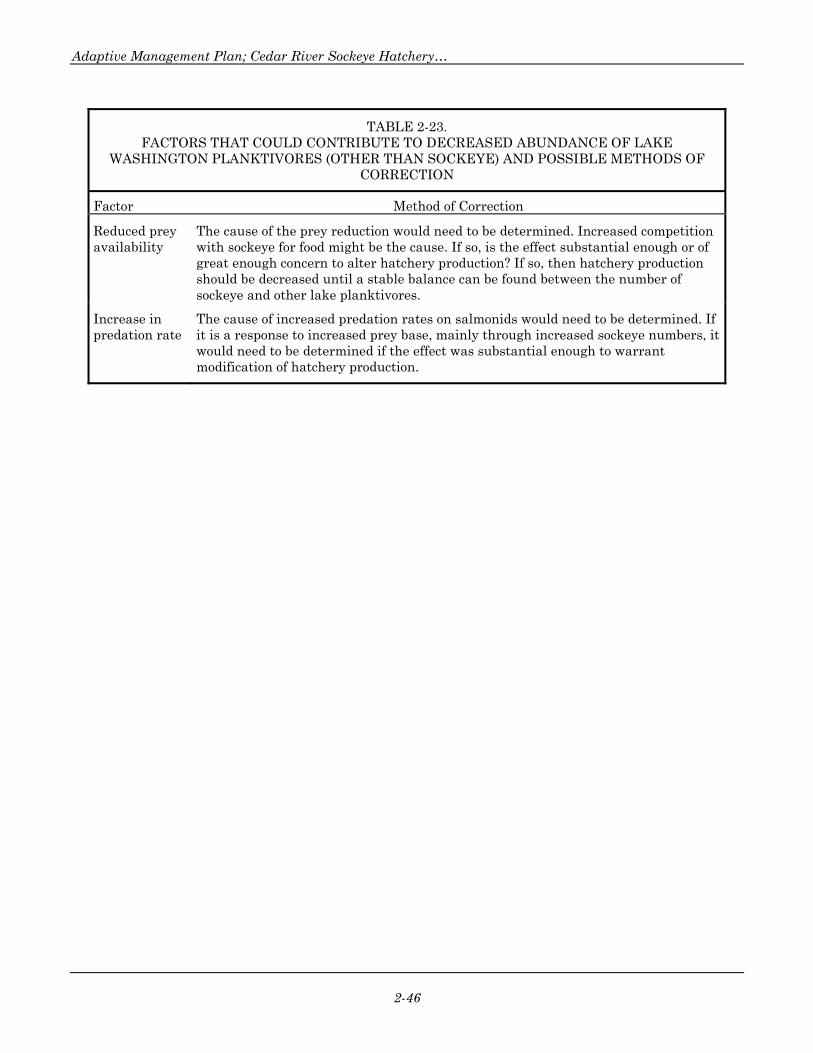
Adaptive Management Plan; Cedar River Sockeye Hatchery…
2-46
TABLE 2-23. FACTORS THAT COULD CONTRIBUTE TO DECREASED ABUNDANCE OF LAKE
WASHINGTON PLANKTIVORES (OTHER THAN SOCKEYE) AND POSSIBLE METHODS OF CORRECTION
Factor Method of Correction
Reduced prey availability
The cause of the prey reduction would need to be determined. Increased competition with sockeye for food might be the cause. If so, is the effect substantial enough or of great enough concern to alter hatchery production? If so, then hatchery production should be decreased until a stable balance can be found between the number of sockeye and other lake planktivores.
Increase in predation rate
The cause of increased predation rates on salmonids would need to be determined. If it is a response to increased prey base, mainly through increased sockeye numbers, it would need to be determined if the effect was substantial enough to warrant modification of hatchery production.
3-1
SECTION 3. ADAPTIVE MANAGEMENT SUMMARY
Table 3-1 presents the five major uncertainties, the proposed initial hypotheses to be tested, potential study outcomes for each hypothesis, and potential management responses to unfavorable outcomes. Proposed thresholds included in the discussion of hypotheses for each uncertainty in Section 2 will undergo further review by the Independent Science Advisors and Technical Working Group, and may change during the implementation of the AMP. Determination of threshold exceedence will be determined by the TWG and confirmed by the ISA, in cases where professional judgement is the primary basis for the decision.
Some of the ecological outcomes could be affected by multiple causes, including some that are independent of the hatchery program. Therefore, it is important to note that an assessment of cause will be conducted when a threshold is reached. This process is intended to determine, insofar as possible, the underlying cause or causes of the change. Using available data and professional judgment, the TWG and the ISA will be asked to assess the likelihood that the hatchery program is a significant contributor to the measured effect. If the experts believe that this is the case, then the TWG and ISA, if needed, would be asked for recommendations for a response.
They will first determine if one of the predefined responses in Table 3-1 would be an effective action. If so, they can recommend it to the AMWG and parties for implementation. If not, the TWG can recommend alternatives including no response, further study or other actions. In making recommendations, the TWG will consider the risk to the resource of exceeding the threshold and become more conservative when there is a high risk. Recommendations would be reviewed by the AMWG and the parties would make the decision regarding the appropriate response. The process for evaluating cause, making recommendations and making decisions will be open to the public.

Adaptive Management Plan; Cedar River Sockeye Hatchery…
3-2
TABLE 3-1. SUMMARY OF AMP UNCERTAINTIES, HYPOTHESES, POTENTIAL RESEARCH OUTCOMES,
AND MANAGEMENT ACTIONS
Hypothesis Potential Outcomes Potential Response Actions
Uncertainty No. 1—Are hatchery and naturally produced fry similar in size, growth, and migration timing, and at a stable population composition?
There is no difference in migration timing between hatchery and naturally produced fry.
1. No significant difference
2. Significant difference*
• Study egg take timing versus river spawning timing and alter broodstock collection as necessary.
• Study egg density and development rate relationships and alter incubation densities or temperature as necessary.
Hatchery and naturally produced fry are similar in size.
1. No size difference 2. Significant size
difference*
• Alter broodstock spawning and collection to account for females of different sizes.
• Adjust release strategy for fry. • Change incubation conditions. • Alter temperature of incubation water.
At the time of pre-smolt surveys, there is no significant difference in size of hatchery and naturally produced fry.
1. No significant difference
2. Significant size difference*
• Examine and alter, if necessary, the fitness level of hatchery fry.
• Adjust release strategy • Adjust timing of hatchery fry to more
closely resemble the natural fry.
At the time of pre-smolt surveys, the proportions of hatchery and natural sockeye are similar to those estimated upon entering the lake as fry.
1. No significant difference
2. Significantly greater*
3. Significantly less
• Evaluate relative trends in key life stages, including fry-to-adult survival rates, to help determine when in life cycle impacts are occurring.
• See corrective measures under pre-smolt size and growth and fry size.
Note: Potential response actions only address the undesirable outcomes, which are followed by an asterisk in the potential outcomes column.

…3. ADAPTIVE MANAGEMENT SUMMARY
3-3
TABLE 3-1 (continued). SUMMARY OF AMP UNCERTAINTIES, HYPOTHESES, POTENTIAL RESEARCH OUTCOMES,
AND MANAGEMENT ACTIONS
Hypothesis Potential Outcomes Potential Response Actions
Uncertainty No. 2—Does the hatchery reduce the reproductive success of Cedar River Sockeye Salmon?
The size and age composition of the population at maturity of Cedar River sockeye will not show a trend over time.
1. No trend
2. Trend to decreasing size and increasing age*
3. Trend to increasing size and decreasing age
• Adjust number of smaller individuals spawned.
• Adjust fry production.
• Assess smolt size
• Adjust release strategy
The relationships between body size, fecundity and egg size of female sockeye in the Cedar River will remain within a normal range.
1. Constant relationship
2. Reduction in egg size and fecundity*
3. Increase in egg size and fecundity
• Adjust number of smaller females spawned.
• Adjust fry production.
• Ensure broodstock is representative of the run.
The spatial and temporal distribution of spawning will remain within a normal range over time.
1. No significant difference
2. Significant difference*
• Alter broodstock collection timing to represent the entire run.
• Shift broodstock collection practices to remove fish from the entire run.
• Assess hatchery practices for unforeseen effects.
There will be no difference in reproductive success between hatchery and naturally produced sockeye spawning naturally or a trend in overall reproductive fitness over time as a result of fish culture practices.
1 Similar rates and no trend
2. No similarity in rates and a decreasing trend*
3. No similarity in rates and an increasing trend
• Alter spawning methods at the hatchery to more closely follow natural conditions.
• Allow a higher proportion of natural spawning.
The genetic composition of the Cedar River sockeye population will not change over time.
1. No change
2. Change*
• Re-examine trapping and spawning protocols at the hatchery and fishery management.
Note: Potential response actions only address the undesirable outcomes, which are followed by an asterisk in the potential outcomes column.

Adaptive Management Plan; Cedar River Sockeye Hatchery…
3-4
TABLE 3-1 (continued). SUMMARY OF AMP UNCERTAINTIES, HYPOTHESES, POTENTIAL RESEARCH OUTCOMES,
AND MANAGEMENT ACTIONS
Hypothesis Potential Outcomes Potential Response Actions
Uncertainty No. 3—Will the hatchery adversely affect sockeye populations outside the Cedar River?
Sockeye harvest in Lake Washington does not capture unacceptable numbers of non-Cedar River sockeye.
1. No significant harvest
2. Significant harvest*
• Recommend study of timing and spatial distribution of various populations while in the lake and adjust harvest locations.
• Make recommendations to co-managers regarding harvest management.
There is no significant amount of Cedar River hatchery sockeye straying into other Lake Washington basin creeks.
1. No significant straying
2. Significant straying*
• Release hatchery fry farther upstream to allow more time for imprinting.
• Reduce hatchery fry production.
• Make recommendations to co-managers regarding increasing escapement to other sites.
Uncertainty No. 4—Will the hatchery produce adverse changes in chinook salmon populations?
Operation of the broodstock collection facility does not significantly delay chinook migration or alter spawning distribution.
1. No significant delay or change in spawning distribution
2. Significant delay and change in spawning distribution*
• Modify operational protocols at the collection facility
• Modify facility design.
There is no significant damage to incubating chinook eggs from sockeye superimposition on chinook redds or reduction in chinook reproductive success.
1. No significant damage or reduced reproductive success
2. Significant damage and reduced reproductive success*
• Make recommendations to co-managers regarding lowering the escapement goal for sockeye.
• Alter fry release strategy (spatial distribution).
Note: Potential response actions only address the undesirable outcomes, which are followed by an asterisk in the potential outcomes column.
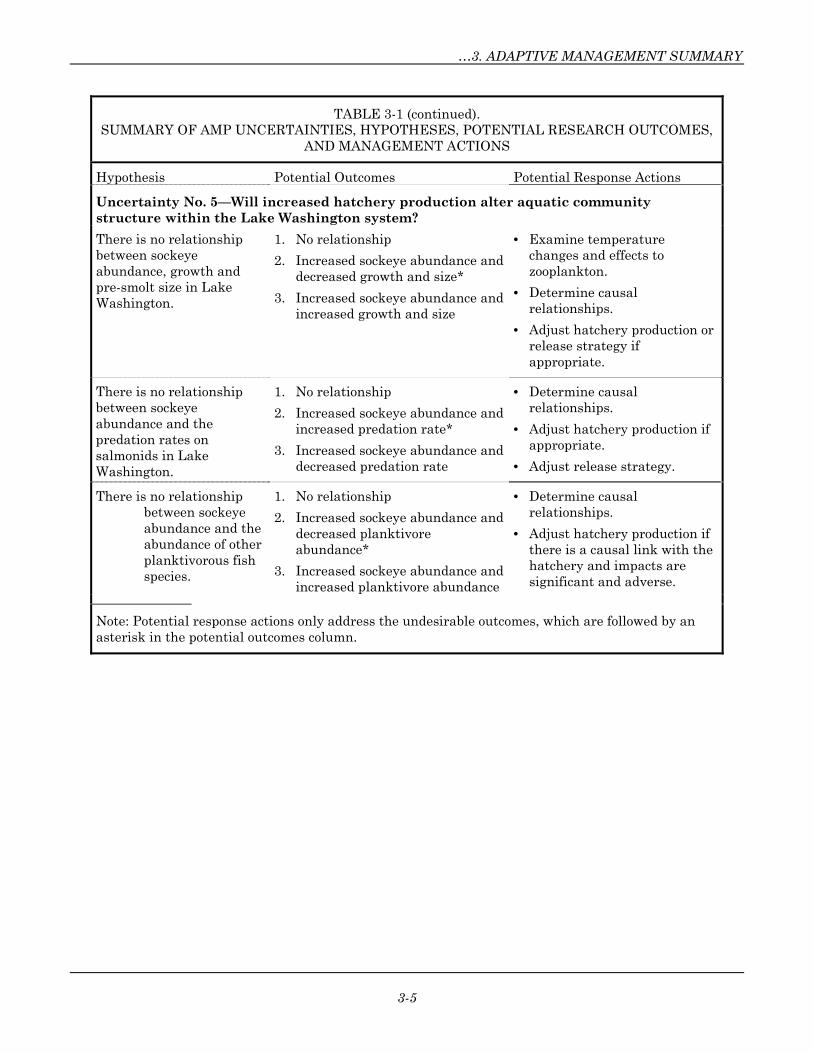
…3. ADAPTIVE MANAGEMENT SUMMARY
3-5
TABLE 3-1 (continued). SUMMARY OF AMP UNCERTAINTIES, HYPOTHESES, POTENTIAL RESEARCH OUTCOMES,
AND MANAGEMENT ACTIONS
Hypothesis Potential Outcomes Potential Response Actions
Uncertainty No. 5—Will increased hatchery production alter aquatic community structure within the Lake Washington system?
There is no relationship between sockeye abundance, growth and pre-smolt size in Lake Washington.
1. No relationship
2. Increased sockeye abundance and decreased growth and size*
3. Increased sockeye abundance and increased growth and size
• Examine temperature changes and effects to zooplankton.
• Determine causal relationships.
• Adjust hatchery production or release strategy if appropriate.
There is no relationship between sockeye abundance and the predation rates on salmonids in Lake Washington.
1. No relationship
2. Increased sockeye abundance and increased predation rate*
3. Increased sockeye abundance and decreased predation rate
• Determine causal relationships.
• Adjust hatchery production if appropriate.
• Adjust release strategy.
There is no relationship between sockeye abundance and the abundance of other planktivorous fish species.
1. No relationship
2. Increased sockeye abundance and decreased planktivore abundance*
3. Increased sockeye abundance and increased planktivore abundance
• Determine causal relationships.
• Adjust hatchery production if there is a causal link with the hatchery and impacts are significant and adverse.
Note: Potential response actions only address the undesirable outcomes, which are followed by an asterisk in the potential outcomes column.


4-1
SECTION 4. AMP MANAGEMENT
4.1 STRATEGY FOR SUCCESS
Section 2 of this document outlines a monitoring and research program considering the base of knowledge that exists and the major uncertainties thought to require careful future monitoring and evaluation. The technical program is expected to evolve each year based on its findings and information from ongoing efforts by the University of Washington, the Washington Department of Fish and Wildlife, the Muckleshoot Indian Tribe, and other investigators. Maximum benefit will be gained from the technical program by the following:
• Strategic use of monitoring resources so that the most important questions are addressed
• Having a well-managed and timely process to analyze the data and to store the results so that they are consistent, retrievable, and accessible to the public for scrutiny
• Establishing criteria for the statistical processes to be used with the various findings and thresholds of variation that can trigger modifications to hatchery operations
• Conducting an open, public process where technical recommendations are considered by the policy group and decisions made consistent with project objectives.
• Broad stakeholder involvement
• Involvement by credible and knowledgeable scientists
• Clear dispute resolution process
• Defined process for voicing minority opinion
• Emphasis on peer review in study plans, analysis and publication.
No matter how good the technical program is, a transparent, predictable and reliable process will be essential to convert the data into usable form and then into the appropriate operational decisions and actions.
There are many possible pitfalls at each step of the adaptive management process, including appropriate and adequate data collection, timely sample processing, analysis of study results, and adjustment of the hatchery program and AMP operations that incorporate the results of the study and its implications. The following steps are recommended to avoid these potential pitfalls:
• Sample and data analysis needs to be conducted in a timely manner. For example, large numbers of otoliths are currently collected in the field from adult and juvenile sockeye salmon. Experience indicates that considerable delay may occur between sample processing and the availability of the data. In order to make informed management decisions, study results must be made available to managers within an acceptable time period. It is expected
Adaptive Management Plan; Cedar River Sockeye Hatchery…
4-2
that project results, along with all study data, be made available within one year of data collection completion.
• The diverse data being collected by multiple investigators needs to be maintained in a database that is well organized and publicly available. Data compilation and management is an essential component of any large investigation. Archived data should include not only the primary data collected (such as redd counts), but the associated metadata as well. Metadata includes such things as the documentation of the study design: objectives, measurement methods, sampling design, and association of each primary data measurement with a time and place. The completeness and adequacy of the metadata are judged relative to the uses that might be contemplated for the analysis and interpretation of the primary data. Ancillary information that is necessary for re-analysis and interpretation of data is “necessary” metadata.
• Effective communication of the scientific findings to decision-makers will depend on having a designated scientific coordinator who will work with the technical work group to integrate and interpret research results and help the managers to translate results into the appropriate decisions (see Section 4.5 for a further discussion of this).
To ensure that program objectives are met, working group participants must act decisively on a scheduled basis to:
• Evaluate the data.
• Make information available to the public.
• Formulate any recommendations to modify hatchery operations.
• Consider and deliberate on these recommendations in a public forum.
• Adopt the changes necessary to meet program objectives.
• Implement those changes in the next cycle of operations.
• Monitor the results of the implemented actions to ensure that anticipated objectives are achieved.
• Periodically review monitoring program and adjust as necessary to address key issues
A proven model for successful adaptive management is for individuals with knowledge and commitment to the success of a program to work together in an open, transparent, agreed-upon structure. It has been shown in other communities that adaptive management of complex and controversial projects can be successful if the parties work together and reach agreement on support of management decisions. The management decisions need to be developed in a public process that has the benefit of comprehensive technical information and input from interested parties.
The evolution of fisheries science and management in the Pacific Northwest is rich in lessons learned from research and extensive fish culture and habitat management programs that have had varying degrees of success. The Pacific Northwest is home to many
…4. PROGRAM MANAGEMENT
4-3
of the world’s leading experts in cold-water ecology, fish culture and fisheries management. The extent of the Cedar River Sockeye Hatchery’s success will depend, in part, on the ability to enlist the proper expertise to deal with each major technical and management issue that arises.
Successful implementation will require commitment by those involved to initiate, maintain and evolve activities that serve the program’s needs. In order to meet the proposed schedule for operating the hatchery in brood year 2007, the adaptive management process must be advanced soon enough to support the operating plan for that year. Suggested implementation steps are:
• Approve the Adaptive Management Plan in 2005 by the LMA parties
• Select a steering committee (by the LMA parties) to manage the AMP startup
• Select a steering committee chairman (by the LMA parties) who would later become operations manager for the Adaptive Management Work Group
• Develop a work plan that will ensure that necessary elements of the AMP, Hatchery Program Management and Annual Operating Plan are in place in time for the first year of operations. See Section 4.5 below for a proposed Implementation Schedule.
4.2 RELEVANT ORGANIZATIONS, COMMITTEES AND PANELS
4.2.1 City of Seattle
The City of Seattle has overall responsibility for implementing the HCP and is one of four parties to the LMA. It is responsible for management of impoundments and diversions of the Cedar River at Landsburg and upstream and for fisheries mitigation as defined in the HCP and LMA.
4.2.2 Washington Department of Fish & Wildlife
The Washington Department of Fish and Wildlife has responsibility for co-management of salmon runs in the Lake Washington Basin under provisions of federal court decisions. It has overall responsibility to preserve, protect and perpetuate the state’s fish and wildlife. Within this broader duty of stewardship, the WDFW is to maximize fishing, hunting and outdoor recreational opportunities and to seek to maintain the economic well being and stability of the fisheries industry in Washington. The agency’s authorities include establishing and enforcing regulations for time, place and manner of taking the state’s component of harvestable salmon and for permitting and regulating in-stream activities.
4.2.3 Muckleshoot Tribe
The Muckleshoot tribe, together with the Suquamish and Tulalip tribes, has responsibility for co-management of salmon runs returning to the Lake Washington Basin under provisions of federal court decisions. These tribes’ authorities include establishing and enforcing regulations for time, place and manner of taking their component of the harvestable quota of salmon.

Adaptive Management Plan; Cedar River Sockeye Hatchery…
4-4
4.2.4 National Marine Fisheries Service
The National Marine Fisheries Service is responsible for the listing and protection of Pacific salmon species at risk under provisions of the Endangered Species Act. Its authorities include review and approval of state plans for recovery of listed species and “taking” under Sections 7 and 10 of the ESA.
4.2.5 U.S. Fish and Wildlife Service
The U.S. Fish and Wildlife Service is responsible for listing and protection of most fresh water fishes, including salmonids, other than salmon that are at risk under provision of the Endangered Species Act. Its authorities include review and approval of state plans for recovery of listed species and actions involving “take” under Sections 7 and 10 of the ESA.
4.2.6 King County
King County is responsible for the protection of water quality and streamside riparian corridors under the provisions of the State Environmental Protection Act and the Shorelines Management Act. Its authorities include issuance of all building permits and special permits for any construction in sensitive areas and within shoreline zones in unincorporated regions of King County.
4.2.7 City of Renton
The City of Renton is responsible for protection of water quality and streamside riparian corridors under the provisions of the State Environmental Protection Act and the Shorelines Management Act. Its authorities include issuance of all building permits and special permits for any construction in sensitive areas and within shoreline zones within Renton City limits.
4.2.8 U.S. Army Corps of Engineers
The Army Corps of Engineers is responsible for regulating construction activities in wetlands and navigable waters under Section 404 of the Clean Water Act and Section 10 of the Rivers and Harbors Act of 1899. Its authorities include issuance of permits for construction in wetlands and within navigable waters.
4.2.9 The Cedar River Anadromous Fish Committee
The Cedar River Anadromous Fish Committee was established by the LMA and serves as an advisory group to the four parties to the agreement. This group has met monthly to review and discuss issues related to fisheries mitigation activities on the Cedar River. The AFC membership presently includes representatives from the following:
• The City of Seattle
• King County
• The Muckleshoot Tribe
• Washington Department of Fish & Wildlife
…4. PROGRAM MANAGEMENT
4-5
• National Marine Fisheries Service
• U.S. Fish and Wildlife
• Puget Sound Anglers
• Washington Trout
• Trout Unlimited
• Long Live the Kings
• Public at large.
4.2.10 The Science Panel
The science panel was assembled in early 2000 by invitation from the City of Seattle. Experts in sockeye biology, Lake Washington ecology, fish diseases, genetics and recent hatchery reform initiatives joined this panel from the University of Idaho, University of Washington, U.S. Fish and Wildlife Service, National Marine Fisheries Service and U.S. Geological Survey. They have provided guidance for the development of operating protocols and the monitoring program of the Cedar River Sockeye Hatchery.
4.3 MANAGEMENT PRINCIPLES
The following principles guide the design of the AMP organization and process:
• Monitoring and research programs need to be designed in response to the needs of management entities by scientists with qualifications and experience relevant to the Cedar River system issues.
• The design and results of monitoring and research programs should be independently reviewed by qualified peers.
• A workable process is required to communicate management needs to researchers, to develop recommendations based upon technical findings and to make and implement the appropriate decisions.
• A public forum is required for transfer of technical results to the management entities and to seek consensus on management response to technical findings.
• Interested parties should be provided access to available information as well as to the process for full and timely participation in proposals and recommendations.
• Consensus will be sought as biological results are evaluated and operating decisions are made.
4.4 AMP PARTICIPANT RELATIONSHIPS
One of the most important elements for a successful AM program is an appropriate management structure to implement the AM process correctly. Gold (2004) cited the following principles that should be considered in establishing a management structure.
• Maximize the collaborative process and public participation

Adaptive Management Plan; Cedar River Sockeye Hatchery…
4-6
• Provide parity between the needs of managers for information to support decision-making and the need for scientists to do the required monitoring and research
• Balancing the need for relevance with the need for quality and objectivity
• Having measurable goals and objectives
• Embracing uncertainty.
Figure 4-1 shows the proposed participants and their relationships for implementation and evolution of the AMP. Other participants in the process are the independent scientists, the researchers, the Technical Work Group and hatchery management. The primary path of communications runs between the Technical Work Group (TWG), the AMWG and the parties to the LMA. The public at large will have access to the information generated by the project as well as be able to participate in the decision-making process. This process is intended to be transparent in order to both serve the public’s interest and provide the opportunity for productive input into management decisions.
4.4.1 Parties to the Landsburg Mitigation Agreement
The LMA states: “The Parties are committed to use adaptive management to address critical questions as they arise, and make changes in management based on the results of monitoring to meet the specific objectives of the program.” In addition, the LMA states: “Except as otherwise provided, changes in all major aspects of study planning, implementation, and coordination with other related studies shall, within the indicated cost constraints, be subject to the approval of the Parties, in consultation with the [AFC] Committee,…”. To be consistent with the LMA, the parties to the LMA will form the decision-making body that receives information and recommendations primarily through the AMWG. Party meetings will be open to the public and held as needed.
4.4.2 Adaptive Management Work Group
The AMWG, composed of agencies and stakeholders with an interest in the Cedar River Sockeye Hatchery Program, formulates recommendations to the parties. Under the LMA, the Cedar River AFC is designated to fulfill the role of the AMWG in providing advice to the parties on the operations and evaluation of the sockeye hatchery. Before the AMWG is formed, the parties will evaluate whether or not there is a need for change to the AFC to fulfill the role of the AMWG. This evaluation will include both the composition of the AFC and the ability of the AMWG to meet its goal of being representational, and discussion with the represented organizations to consider whether changes in individual representatives are needed to seat people best suited to the specific work of the AMWG. The SPU delegate will serve as chairperson and operations manager for the AMWG.
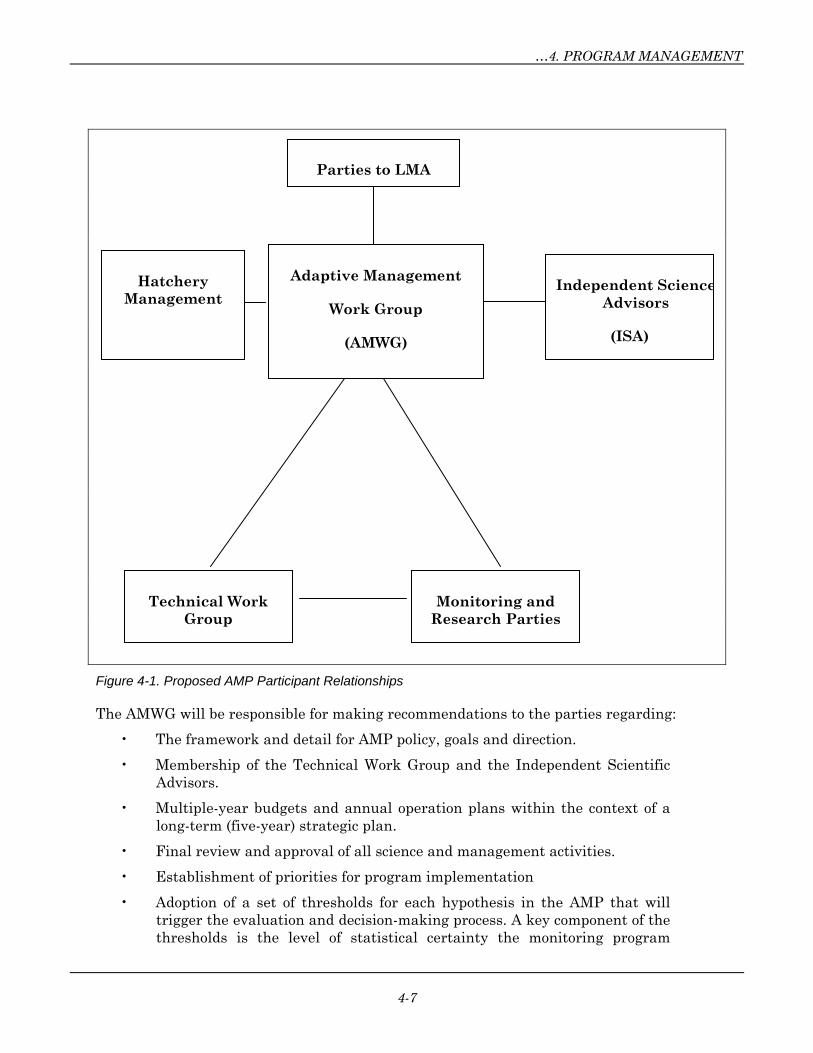
…4. PROGRAM MANAGEMENT
4-7
Figure 4-1. Proposed AMP Participant Relationships
The AMWG will be responsible for making recommendations to the parties regarding:
• The framework and detail for AMP policy, goals and direction.
• Membership of the Technical Work Group and the Independent Scientific Advisors.
• Multiple-year budgets and annual operation plans within the context of a long-term (five-year) strategic plan.
• Final review and approval of all science and management activities.
• Establishment of priorities for program implementation
• Adoption of a set of thresholds for each hypothesis in the AMP that will trigger the evaluation and decision-making process. A key component of the thresholds is the level of statistical certainty the monitoring program
Independent ScienceAdvisors
(ISA)
Technical Work Group
Monitoring and Research Parties
Parties to LMA
Hatchery Management
Adaptive Management
Work Group
(AMWG)
Adaptive Management Plan; Cedar River Sockeye Hatchery…
4-8
should be designed to achieve. The process of evaluating thresholds and for responding to threshold levels will encourage public involvement.
• Adoption of the annual report on current and projected year operations as described in the Operating Protocols.
• Oversight for hatchery operations for compliance with the operating plan with input from the technical work group, other scientific advisors and the public.
In addition, the AMWG will be responsible for the following:
• Assembly and distribution of relevant technical information that comes available in between annual report cycles
• Solicitation and coordination of input from all interested parties.
The AMWG will meet at least annually or as necessary to discuss reports from the Technical Work Group, hatchery managers and others concerning the hatchery program and its effects. These meetings will be public meetings to discuss hatchery activities and findings from the monitoring and research efforts. Meeting topics will generally be scheduled in advance, with agendas issued to the public two weeks in advance of the meetings.
Meetings will be conducted as working sessions where each topic is presented to the attendees by the operations manager or designee, with technical support coming from the ISA or the TWG, as needed. Initial discussions between all members of the AMWG will be conducted to clarify the details and for members to express opinions. This will be followed by any input from the public, and then by debate and the formation of any recommendations to the parties. If there is not consensus with the AMWG on a recommendation, then those holding the minority view shall be given the opportunity to prepare a written statement describing the justification for their position and this statement will be conveyed to the parties for consideration along with the majority’s recommendation.
The AMWG operations manager will be responsible for maintaining regular communications with the co-managers, particularly with regard to run-size predictions and harvest management planning and regulating. The operations manager will also maintain regular contact with the parties, ISA, TWG and Hatchery Manager.
4.4.3 Technical Work Group
The TWG will be responsible for the use of sound science in the evaluation of the hatchery. This group will include at least a minimum of five experts in the following areas: pathology, genetics, Lake Washington ecology, sockeye salmon biology and hatchery reform/operations. In addition to these five positions, it is recommended that two other at large positions be available if needed to provide for either appointment of a generalist or for other technical specialists that are identified. These appointees will be selected by the parties to the LMA in consultation with the AMWG. The TWG will elect a chair from its members. The City of Seattle will provide or arrange for technical support in the area of sampling design and statistical analysis, as needed.

…4. PROGRAM MANAGEMENT
4-9
It is proposed that the membership of the TWG be recruited from federal and state agencies, tribal organizations, universities, or private practice based primarily on the technical expertise needed and the commitment of candidates to sound resource stewardship. In addition to technical capability, potential members will be evaluated on their ability to work as part of a group and on their interest and ability to clearly communicate scientific information to managers and decision-makers. Members will be appointed on staggered terms. Candidates will not be chosen on the basis of representation of specific organizations or agencies.
Operating guidelines for the TWG will be approved by the parties before the TWG begins its work. The TWG will be responsible for the following:
• Reviewing and recommending the criteria and thresholds that would indicate the point at which either changes should be made to the hatchery program or formal evaluation should occur, as appropriate.
• Drafting monitoring and research objectives, protocols and plans.
• Developing and review budgets and RFPs for monitoring work.
• Reviewing monitoring and research reports.
• Overseeing data management and analysis.
• Evaluating the effects of management actions.
• Recommending the appropriate changes to hatchery operation when trigger points are reached.
• Recommending appropriate changes to the criteria and thresholds when appropriate.
• Recommending changes to the Annual Operating Plan.
• Providing technical review of the Annual Report on hatchery operations.
The TWG will meet on a quarterly schedule, or as necessary, to review new information that is accumulating from hatchery operations and the monitoring and research activities, to conduct the business of the group to fulfill its responsibilities, and to finalize recommendations to the AMWG. These meetings will be open to the public.
A scientific coordinator will be selected by the parties to lead the TWG. The coordinator will chair meetings, plan the work of the TWG and represent the TWG before other committees and the parties. The scientific coordinator will be responsible for maintaining open communication links with the parties, the AMWG, hatchery management and the Independent Scientific Advisors. The TWG will provide advice as needed to ensure that the monitoring and research objectives are relevant, realistic and scientifically credible.
4.4.4 Independent Science Advisors
The Independent Science Advisors will serve as a review and recommending body of the AMWG and as an advisory body for the TWG and will make recommendations to resolve conflicts regarding technical, research, and management approaches. Advisors will be expected to provide independent assessments of monitoring data to determine if thresholds
Adaptive Management Plan; Cedar River Sockeye Hatchery…
4-10
are exceeded, in cases where professional judgement is used as the primary basis for the decision. This group will be asked to do periodic program reviews. The results of any ISA review or any ISA recommendations will be given directly to the AMWG, TWG and the parties, with copies available to the public upon request.
A list of Independent Scientific Advisors will be developed that includes specialists in the Northwest, not serving on the TWG, who have the qualifications needed to review scientific and technical aspects of the AMP activities. Individuals such as college professors and scientists associated with state, federal or tribal organizations or in private practice are anticipated to form the pool of talent from which to recruit. Nominations for appointment to this group will be solicited from the stakeholder groups and public at large. The parties will select the names of the advisors, after soliciting advice from the AMWG.
4.4.5 Hatchery Management
Hatchery management will be responsible for implementing the decisions of the parties regarding hatchery management operations and for operating the hatchery in an effective and efficient manner. Hatchery management will be overseen by the parties and will interact with the AMWG and the TWG. This group has the following authorities:
• Implementation of technical, science, management or other activities approved and assigned by the parties in consultation with the AMWG
• Implementation of activities under its own authority, e.g., cost-saving management functions; improvement activities in technical/ management areas
• Make recommendations to changes in operations and policy management actions to the AMWG
4.4.6 Public Involvement
Public involvement plays a critical role in providing extended review of scientific findings and of recommendations made by the AMWG to the parties. Public involvement will be integrated throughout the AMP by providing access to information and recommendations, by providing opportunity to listen to committee deliberations and by providing opportunity to comment to committees.
4.5 AMP IMPLEMENTATION
Successful adaptive management is elusive. It is natural to get comfortable with routine and to resist change. Additionally, different pressures will come from various stakeholders to manage the hatchery to best suit their particular interests. It is essential that the policy/decision makers implement a rigorous program to start and evolve an AMP process that will achieve the stated goals and to do so in a manner that instills confidence in all stakeholders and the public at large that hatchery operations are conducted and modified based on the best scientific information available. Table 4-1 provides a proposed series of the major steps foreseen to get the AMP up and running in concert with the start up of first year hatchery operations.
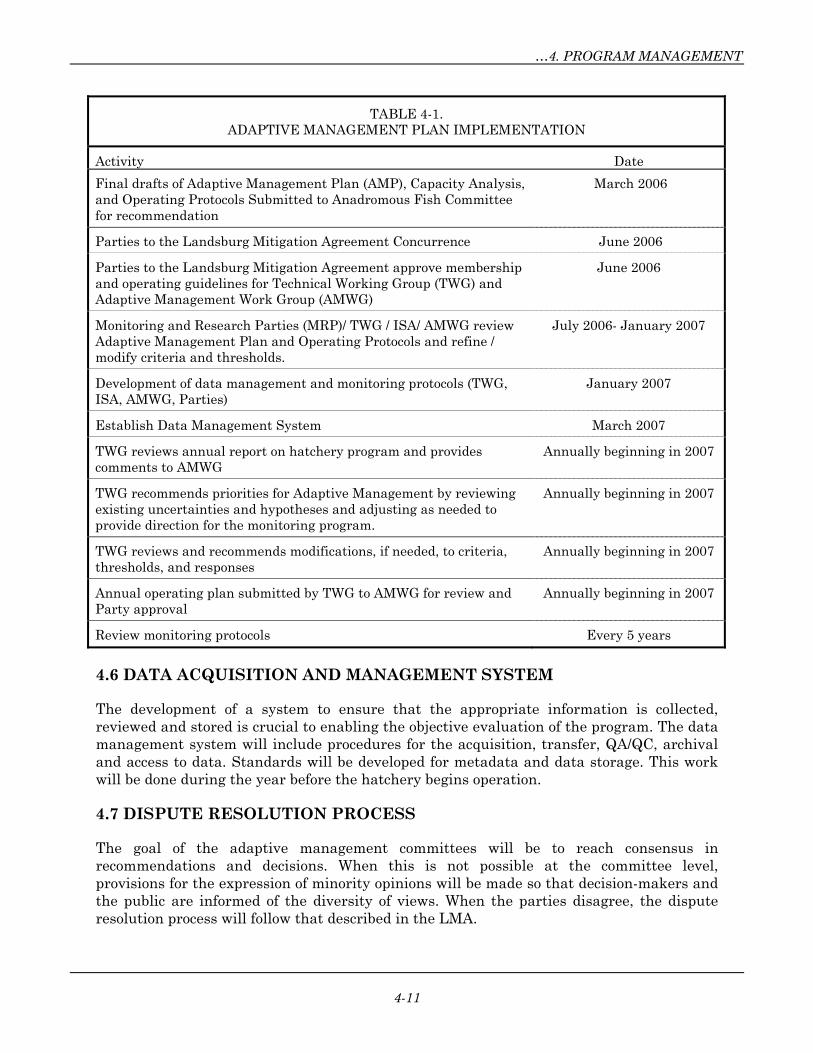
…4. PROGRAM MANAGEMENT
4-11
TABLE 4-1. ADAPTIVE MANAGEMENT PLAN IMPLEMENTATION
Activity Date
Final drafts of Adaptive Management Plan (AMP), Capacity Analysis, and Operating Protocols Submitted to Anadromous Fish Committee for recommendation
March 2006
Parties to the Landsburg Mitigation Agreement Concurrence June 2006
Parties to the Landsburg Mitigation Agreement approve membership and operating guidelines for Technical Working Group (TWG) and Adaptive Management Work Group (AMWG)
June 2006
Monitoring and Research Parties (MRP)/ TWG / ISA/ AMWG review Adaptive Management Plan and Operating Protocols and refine / modify criteria and thresholds.
July 2006- January 2007
Development of data management and monitoring protocols (TWG, ISA, AMWG, Parties)
January 2007
Establish Data Management System March 2007
TWG reviews annual report on hatchery program and provides comments to AMWG
Annually beginning in 2007
TWG recommends priorities for Adaptive Management by reviewing existing uncertainties and hypotheses and adjusting as needed to provide direction for the monitoring program.
Annually beginning in 2007
TWG reviews and recommends modifications, if needed, to criteria, thresholds, and responses
Annually beginning in 2007
Annual operating plan submitted by TWG to AMWG for review and Party approval
Annually beginning in 2007
Review monitoring protocols Every 5 years
4.6 DATA ACQUISITION AND MANAGEMENT SYSTEM
The development of a system to ensure that the appropriate information is collected, reviewed and stored is crucial to enabling the objective evaluation of the program. The data management system will include procedures for the acquisition, transfer, QA/QC, archival and access to data. Standards will be developed for metadata and data storage. This work will be done during the year before the hatchery begins operation.
4.7 DISPUTE RESOLUTION PROCESS
The goal of the adaptive management committees will be to reach consensus in recommendations and decisions. When this is not possible at the committee level, provisions for the expression of minority opinions will be made so that decision-makers and the public are informed of the diversity of views. When the parties disagree, the dispute resolution process will follow that described in the LMA.
Adaptive Management Plan; Cedar River Sockeye Hatchery…
4-12
4.8 PROCESS FOR RESPONDING WHEN THRESHOLDS ARE EXCEEDED
The Adaptive Management Plan establishes thresholds (Section 2) that are used to define in advance what would constitute unusual and undesirable outcomes associated with key uncertainties. These thresholds are defined for each set of hypotheses and are intended to be reviewed during the period prior to implementation and periodically thereafter as information is gathered to ensure that they are set appropriately. Where feasible to do so, statistical testing will be used to determine if thresholds have been exceeded. In other cases, experts will be asked to use statistical and quantitative analyses to aid their determination of whether results are significant. In the latter situation, both the TWG and the ISA would be asked to provide their independent assessments of the data to the Parties. If the Parties conclude that a threshold has been exceeded, the parties will ask the TWG to determine the cause. The TWG would be expected to consult with any of the researchers involved and may consult with Independent Scientists as well. The Parties may decide to ask for an independent assessment of cause by independent scientists. The TWG and the independent scientists (when involved) will provide their findings to the AMWG, along with any actions that they recommend be taken. The AMWG will consider the TWG findings and recommendations, along with any from independent scientists, and develop their recommendation for consideration to the parties. The parties will meet to review reports, hear from the public and decide how to respond to the recommendations. If the parties do not accept the recommendations of the AMWG, the parties must provide reasons for doing so and these shall be provided to the public and committees upon request. If response actions are required, monitoring will continue to determine whether the response action has been successful in reducing the effect so that it drops below the threshold level. If the response action is unsuccessful, further analysis would lead to consideration of alternatives. Thus, the adaptive management process is a cycle involving monitoring, evaluation, adjustments to operations, when necessary, and continued monitoring and evaluation (see Fig. 1-1). For further information see Section 2 and 3.
4.9 SUMMARY
The long-term success of the Cedar River Sockeye Salmon Hatchery hinges upon effective cooperation and coordination between the involved agencies, the Muckleshoot Tribe, the stakeholders, the public and the scientific community. This hatchery is very significant because of its visibility, history, and potential benefit. An extraordinary level of effort is being invested in implementing this sockeye mitigation project in a manner that is compatible with natural systems. There is a risk that complicated procedures could result in excessive costs and reduced benefits. To optimize the scientific and other community benefits, it is incumbent upon all participants to streamline and simplify where possible while striving to meet project objectives.
The Adaptive Management Plan and the other program documents are proposed to become the basis for the Annual Operating Plan for the first year of operations and for the management structure that will be necessary for implementation of a successful Adaptive Management process. Discussions and negotiations between the participants will be needed to finalize the roles and responsibilities of each participant and to select the proper team. Membership in the technical groups and hatchery management should always be based upon technical expertise and professionalism, not on affiliation. Early initiation of

…4. PROGRAM MANAGEMENT
4-13
discussions between the parties and their advisors should lead to an effective startup and hopefully good operating efficiency and more healthy fish in the Lake Washington system.


5-1
SECTION 5. LITERATURE CITED
Ames, J. and H. Beecher. 2001. Incorporating flood risk into controlled spawning flow regimes for Pacific salmon: an example using Cedar River sockeye salmon. Washington Department of Fish and Wildlife Report #FPT 01-13. Olympia, WA. 123 p.
Bams, R.A. 1967. Differences in performance of naturally and artificially propagated sockeye salmon migrant fry, as measured with swimming and predation tests. Journal of the Fisheries Research Board of Canada 24: 1117-1153.
Bentzen, P. and I. Spies. 2000. Investigation of genetic variability within and between Lake Washington sockeye salmon populations using microsatellite markers. Unpublished report submitted to City of Seattle. 20 p.
Brannon, E.L., D.A. Beauchamp, D.E. Campton, C.V.W. Mahnken, and J.R. Winton. 2001. The Cedar River Sockeye Salmon Hatchery Plan. Special Scientific Advisory Panel to the City of Seattle. 55 p.
Burgner, R. L. 1987. Factors influencing age and growth of juvenile sockeye salmon (Oncorhynchus nerka) in lakes, p. 129-142. In: Canadian Special Publication of Fisheries and Aquatic Sciences 96. H. D. Smith, L. Margolis, and C. C. Woods (eds.).
Burgner, R.L. 1991. Life history of sockeye salmon (Oncorhynchus nerka). In C. Groot and L. Margolis (eds.). Pacific salmon life histories. UBC Press. Vancouver, British Columbia. pp. 1-117.
Burton, K., S. Foley and W. Mavros. 2001. Cedar River chinook salmon (Oncorhynchus tshawytscha) redd survey report, 2000: Spawning habitat characteristics, spatial and temporal redd distributions, and the incidence of spawning sockeye in the vicinity of incubating chinook. Report published by Seattle Public Utilities. 43 pp.
Burton, K., L. Lowe and Berge, H. 2004. Cedar River chinook salmon (Oncorhynchus tshawytscha) redd and carcass surveys: annual report 2003.
Carvalho, G. R., T. J. Pitcher, L. K. Park, P. Morgan, R. D. Ward, P. M. Grewe, G. R. Carvalho, L. Hauser, M. Ferguson, F. M. Utter, J. M. Wright, P. Bentzen, and R. Lincoln. 1994. Molecular genetics in fisheries. Reviews in Fish Biology and Fisheries. 4:269-399.
Cascade Environmental Services, Inc. 1995. Cedar River Fall Chinook and Sockeye Salmon Run Timing. Presented to the Cedar River Instream Flow Committee.
Chilcote, M. W., S. A. Leider, and J. J. Loch. 1986. Differential reproductive success of hatchery and wild summer-run steelhead under natural conditions. Transactions of the American Fisheries Society. 115:726-735.
Adaptive Management Plan; Cedar River Sockeye Hatchery…
5-2
DeVries, P. 1997. Riverine salmonid egg burial depths: review of published data and implications for scour studies. Canadian Journal of Fisheries and Aquatic Sciences. 54:1685-1698.
Essington, T. E., P. W. Sorensen, and D. G. Paron. 1998. High rate of redd superimposition by brook trout (Salvelinus fontinalis) and brown trout (Salmo trutta) in a Minnesota stream cannot be explained by habitat availability alone. Canadian Journal of Fisheries and Aquatic Sciences. 55:2310-2316.
Essington, T.E., T.P. Quinn and V.E. Ewert. 2000. Intra- and interspecific competition and the reproductive success of sympatric Pacific salmon. Canadian Journal of Fisheries and Aquatic Sciences 57: 205-213.
Fresh, K.L., S.L. Schroder, E.C. Volk, and J.J. Grimm. 2001. Straying by Cedar River hatchery-produced sockeye salmon to Big Bear Creek, WA. Washington Department of Fish and Wildlife, Olympia, WA. 9 p.
Fresh, K. L., S. L. Schroder, E.C. Volk, J.J. Grimm and M.C. Mizell. 2003 Evaluation of the Cedar River Sockeye Salmon Hatchery: Analyses of Adult Otolith Recoveries. WDFW report. 42 p.
Gold, Barry. 2004. Review of the March 2003 Adaptive Management Plan, Cedar River Sockeye Hatchery.11p.
Halbert, C.L. 1993. How adaptive is adaptive management? Implementing adaptive management in Washington State and British Columbia. Reviews in Fisheries Science 1 (3): 261-283.
Henderson, M. A., and A. J. Cass. 1991. Effect of smolt size on smolt-to-adult survival for Chilko Lake sockeye salmon (Oncorhynchus nerka). Canadian Journal of Fisheries and Aquatic Sciences. 48:988-994.
Hendry, A.P., O.K. Berg and T.P. Quinn. 1999. Breeding date, life history, and energy allocation in a population of sockeye salmon (Oncorhynchus nerka). Oikos 85: 499-514.
Hendry, A.P. and T.P. Quinn. 1997. Variation in adult life history and morphology among Lake Washington sockeye salmon (Oncorhynchus nerka) populations, in relation to habitat features and ancestral affinities. Canadian Journal of Fisheries and Aquatic Sciences 54: 75-84.
Hendry, A.P., T.P. Quinn and F.M. Utter. 1996. Genetic evidence for the persistence and divergence of native and introduced populations of sockeye salmon (Oncorhynchus nerka) within Lake Washington, WA. Canadian Journal of Fisheries and Aquatic Sciences 53: 823-832.
Hendry, A. P., J. K. Wenburg, P. Bentzen E. C. Volk and T. P. Quinn. 2000. Rapid evolution of reproductive isolation in the wild: evidence from introduced salmon. Science 290: 516-518.
…5. LITERATURE CITED
5-3
Holling, C.S. (ed.). 1978. Adaptive Environmental Assessment and Management. John Wiley & Son. New York.
Koenings, J.P. and R.D. Burkett. 1987. Population characteristics of sockeye salmon (Oncorhynchus nerka) smolts relative to temperature regimes, euphotic volume, fry density, and forage base within Alaskan lakes. Pp. 216-234. In: Canadian Special Publication of Fisheries and Aquatic Sciences 96. H. D. Smith, L. Margolis, and C. C. Woods (eds.).
Koenings, J. P., H. J. Geiger, and J. J. Hasbrouck. 1993. Smolt-to-adult survival patterns of sockeye salmon (Oncorhynchus nerka): effects of smolt length and geographic latitude when entering the sea. Canadian Journal of Fisheries and Aquatic Sciences. 50:600-611.
Lee, K.N. 1999. Appraising adaptive management. Conservation Ecology 3 (2): 3 [online] URL: http://www.consecol.org/vol3/iss2/art3.
Leider, S. A., P. L. Hulett, J. J. Loch, and M. W. Chilcote. 1990. Electrophoretic comparison of the reproductive success of naturally spawning transplanted and wild steelhead trout through the returning adult stage. Aquaculture. 88: 239-252.
Nowak, G. M., R. A. Tabor, E. J. Warner, K. L. Fresh and T. P. Quinn. 2004. Ontogenetic shifts in habitat and diet of cutthroat trout in Lake Washington, Washington. North American Journal of Fisheries Management 24: 624-635
Perrin, C. J., and J. R. Irvine. 1990. A review of survey life estimates as they apply to the area-under-the-curve method for estimating the spawning escapement of Pacific salmon. Canadian Technical Report of Fisheries and Aquatic Sciences. 1733:1-49.
Quinn, T.P. 1993. A review of homing and straying of wild and hatchery-produced salmon. Fisheries Research 18: 29-44.
Quinn, T.P., A.P. Hendry and L.A. Wetzel. 1995. The influence of life history trade-offs and the size of incubation gravels on egg size variation in sockeye salmon (Oncorhynchus nerka). Oikos 74: 425-438.
Roni, P. 1992. Life history and spawning habitat in four stocks of large-bodied chinook salmon (Oncorhynchus tshawytscha). Master of Science thesis, University of Washington, Seattle. 93 p.
Ryman, N. 1991. Conservation genetics considerations in fishery management. Journal of Fish Biology. 39:211-224.
Seiler, D. 1994. Cedar River sockeye salmon fry estimation, Final Report: June 1994. Washington Department of Fish and Wildlife. Olympia, WA.
Seiler, D. 1995. Annual Report: Estimation of 1994 Cedar River sockeye salmon fry production. Washington Department of Fish and Wildlife. Olympia, WA.
Seiler, D. and L. Kishimoto. 1996. Annual Report: 1995 Cedar River sockeye salmon fry production evaluation program. Washington Department of Fish and Wildlife. Olympia, WA.
Adaptive Management Plan; Cedar River Sockeye Hatchery…
5-4
Seiler, D. and L. Kishimoto. 1997a. Annual Report: 1996 Cedar River sockeye salmon fry production evaluation. Washington Department of Fish and Wildlife. Olympia, WA.
Seiler, D. and L. Kishimoto. 1997b. Annual Report: 1997 Cedar River sockeye salmon fry production evaluation. Washington Department of Fish and Wildlife. Olympia, WA.
Seiler, D., G. Volkhardt and L. Kishimoto. 2001. 1999 Cedar River Sockeye Salmon Fry Production Evaluation. Washington Department of Fish and Wildlife, Report #FPA 01-14.
Seiler, D., G. Volkhardt and L. Fleischer. 2005A. Evaluation of Downstream Migrant Salmon Production in 2003 from the Cedar River and Bear Creek. WDFW report FPT 05-01. 69 p.
Seiler, D., G. Volkhardt and L. Fleischer. 2005B. Evaluation of Downstream Migrant Salmon Production in 2004 from the Cedar River and Bear Creek. WDFW report FPT 05-05. 65 p.
Spies, I., K. Naish and P. Bentzen. 2001. Microsatellite analysis of current and source populations of sockeye salmon and kokanee (Oncorhynchus nerka) in the Lake Washington basin of Washington state. Unpublished report to City of Seattle. 26 p.
Steen, R.P. and T.P. Quinn. 1999. Egg burial depth by sockeye salmon (Oncorhynchus nerka): implications for survival of embryos and natural selection on female body size. Canadian Journal of Zoology 77: 836-841.
Walters, C.J. (ed.). 1986. Adaptive Management of Renewable Resources. Macmillian. New York.
Waples, R. S. 1991. Genetic interactions between hatchery and wild salmonids: lessons from the Pacific Northwest. Canadian Journal of Fisheries and Aquatic Sciences. 48 (Supplement 1): 124-133.
Washington Department of Fish and Wildlife. 2001. Operational Guidelines for the Cedar River Weir and Fish Trap, 2001 Field Season. Olympia, WA. 3 p.
Washington Department of Fisheries, Washington Department of Wildlife, and Western Washington Treaty Indian Tribes. 1992. 1992 Washington State Salmon and Steelhead Stock Inventory. Olympia, WA. 212 p.
Washington, P.M. and A.M. Koziol. 1993. Overview of the interactions and environmental impacts of hatchery practices on natural and artificial stocks of salmonids. Fisheries Research 18: 105-122.
Young, S.F., M.R. Downen and J.B. Shaklee. 2001. A Microsatellite DNA Based Characterization of Lake Washington/Lake Sammamish Kokanee and Sockeye Salmon, With Notes on Distribution, Timing, and Morphology. Washington Department of Fish and Wildlife, Olympia, WA.