seawater desalination facility on okinawa · 2007-07-25 · introduction okinawa seawater...
TRANSCRIPT

1-27 Miyagi, Chatan-cho, Okinawa 904-0113 Japan e-mail: [email protected]
Seawater Desalination Facility on Okinawa Toru Yamazato Seawater Desalination Center, Chatan Water Administration Office, Okinawa Prefectural Enterprise Bureau 1. Introduction
Okinawa Seawater Desalination Center was completed with full capacity in 1997. The facility was constructed to ease water shortage on Okinawa by converting surrounding clean seawater into drinking water. With ten years of operation, the facility has proved to be successfully functioning to meet demand for drinking water especially in drought situation.
This presentation covers an overview of Okinawa Seawater Desalination Center, issues including product water quality and facility maintenance, and finally, the facility’s overall performance of the past ten years. 2. Overview 2.1 Need for desalination facility on Okinawa
Due to population growth and economic development, the average water consumption on Okinawa doubled from approximately 200,000 m3/day in 1972 to 420,000 m3/day in 2002. Water rationing occurred in 14 years out of 34 years since 1972. The longest water rationing continued for 326 days from 1981 to 1982. The most recent water rationing occurred in 1993.
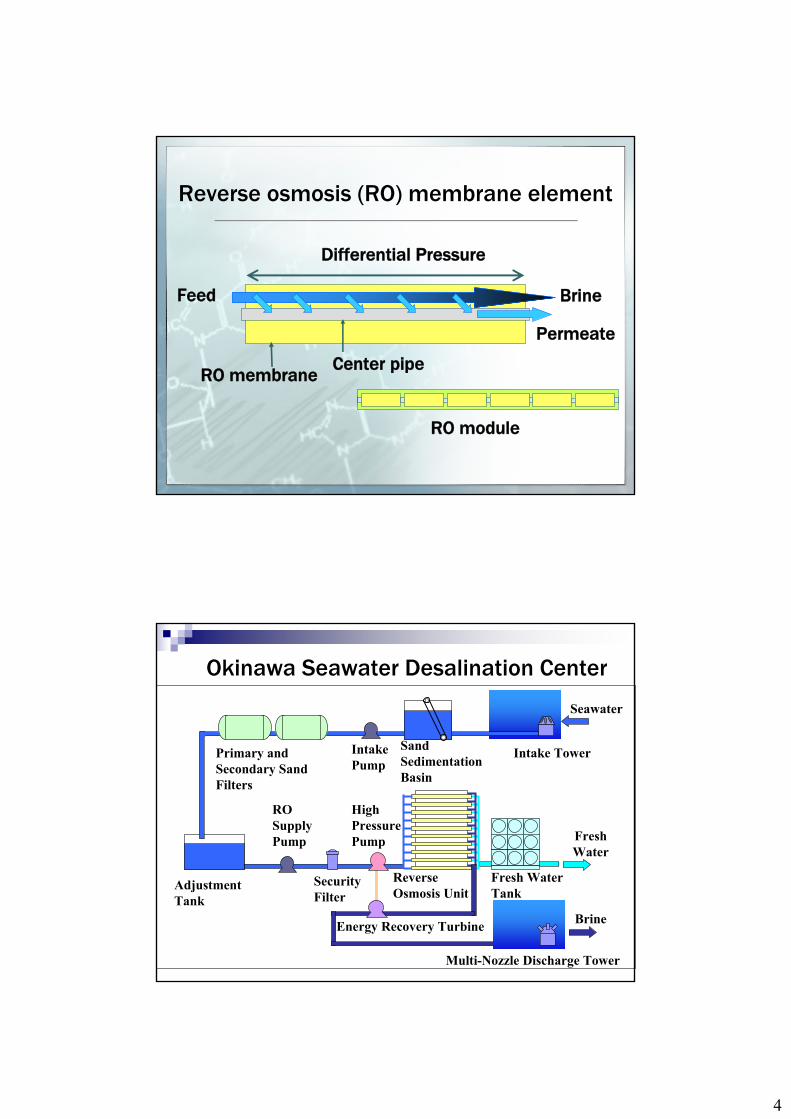
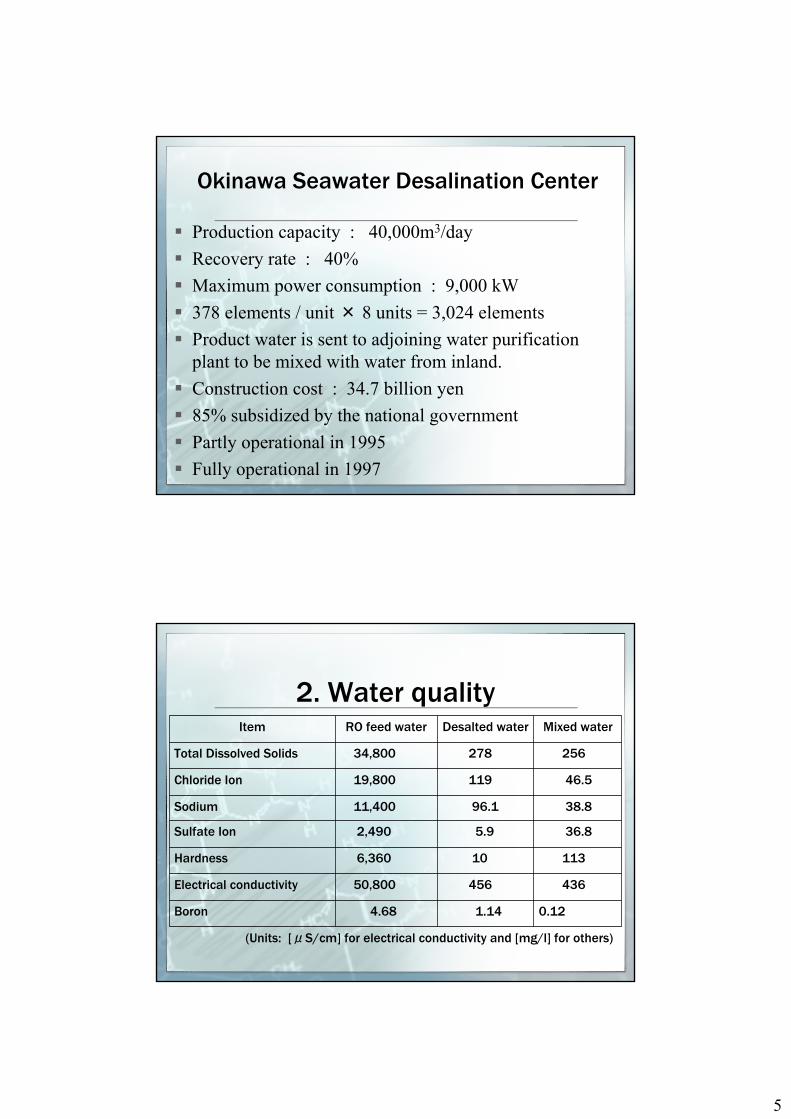
Shortages were anticipated for water resources dependent on the development of dams and rivers. As a countermeasure, the Enterprise Bureau of Okinawa Prefecture decided to promote the desalination project. The first survey was conducted by the Japanese government in 1977, and construction began in 1993. 2.2 Reverse osmosis seawater desalination facility The construction cost of Okinawa Seawater Desalination Center was 34.7 billion yen, 85% of which was subsidized by the national government. The facility exploits reverse osmosis technology to desalt seawater. The production capacity is 40,000 m3/day, which is nearly equal to 10% of the average water consumption on Okinawa. Fig.1 shows the process flow.
The facility needs approximately 9,000 kW of electricity for full operation.

High pressure pumps, which are necessary to bring about reverse osmosis, consume most of the energy. Energy recovery turbines retrieve approximately 30% of the energy from the brine, which still has high pressure.
The desalted fresh water is sent to adjoining Chatan Water Purification Plant and mixed with potable water produced from inland water.
SandSedimentation Basin
Seawater
Intake TowerIntake PumpPrimary and Secondary Sand Filters
Adjustment Tank RO Supply Pump
Security Filter
High Pressure Pump
Reverse Osmosis Unit
Energy Recovery Turbine
Fresh Water Tank
Fresh Water
Brine
Multi-Nozzle Discharge Tower
Fig.1 Process flow of Okinawa Seawater Desalination Center 3. Water quality 3.1 Effect of desalination
In the reverse osmosis (RO) process, most of the substances in seawater are removed. Table.1 compares quality of the RO feed seawater, the desalted product water, and the mixed potable water.
Table.1 Comparison of water quality
Item RO feed water Desalted water Mixed water Total Dissolved Solids 34,800 278 256 Chloride Ion 19,800 119 46.5 Sodium and its compounds 11,400 96.1 38.8 Sulfate Ion 2,490 5.9 36.8 Hardness 6,360 10 113 Electrical conductivity 50,800 456 436 Boron and its compounds 4.68 1.14 0.12
(Units: [μS/cm] for electrical conductivity and [mg/l] for others)

The mixing strategy has several advantages, as explained in the following sections. 3.2 Hardness
Desalted fresh water has an extremely low hardness and is considered corrosive. Usually, a mineralizing process follows the RO process as a post-treatment in order to prevent corrosion. However, since the water produced in Chatan Water Purification Plant has relatively high hardness, the hardness of the mixed water becomes moderate. Therefore, the post-treatment is not needed. 3.3 Conductivity
Salt rejection rate is a great concern in the desalination facility. Electrical conductivity is a good scale of salinity and easy to monitor continuously. Okinawa Seawater Desalination Center has set 720μS/cm as the maximum operational conductivity for the product water. This value corresponds to the allowable concentration of chloride ion according to water quality regulations. 3.4 Boron concentration
Boron is hard to remove in a single stage reverse osmosis process. Japanese water quality regulations demand boron concentration to be less than 1.0 mg/l. Table.1 shows that boron concentration was not sufficiently reduced by the desalination process alone but successfully suppressed by mixing. 4. Maintenance 4.1 Biofouling
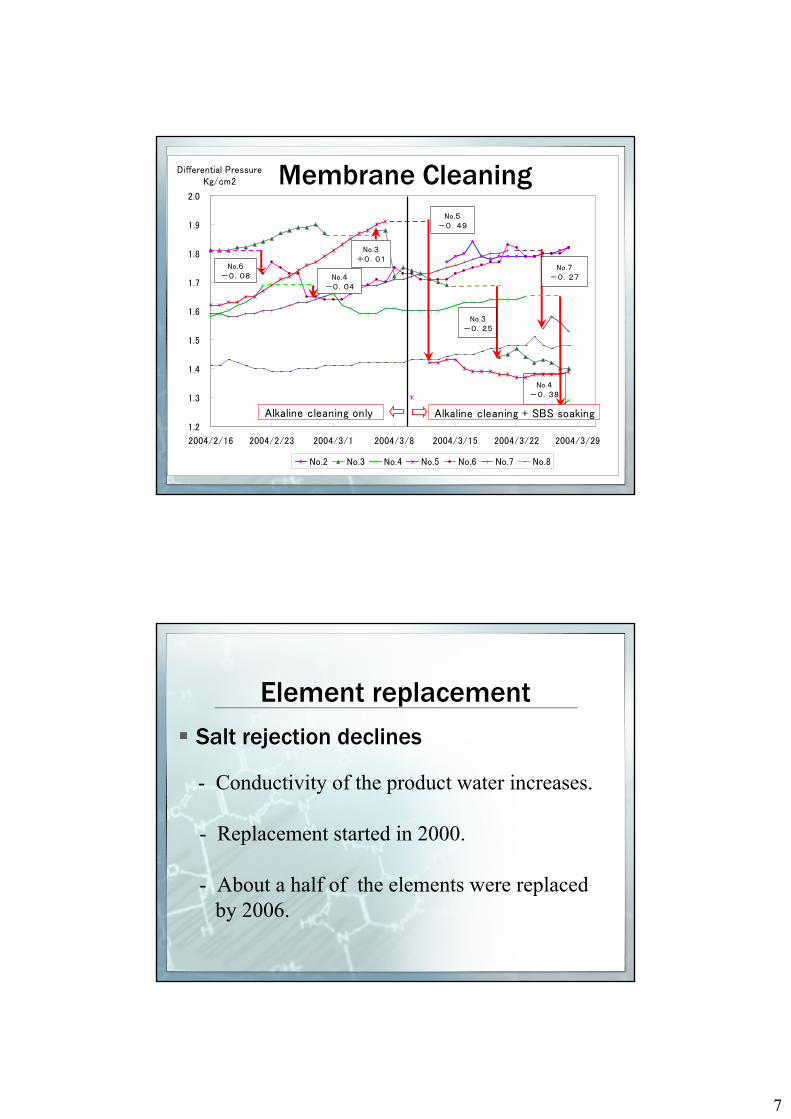
The RO process utilizes polyamide membrane, which does not tolerate oxidizing agents. Since the feed water does not contain chlorine, biofilm tends to grow inside the seawater channel and obstruct the feed flow in the RO elements. This phenomenon, biofouling, may cause irreversible damage to the membrane elements. Okinawa Seawater Desalination Center conducts sulfuric acid shock treatment and membrane cleaning to control biofouling. An effective cleaning method has been established. However, the shock treatment still needs to be investigated to achieve reliable efficiency. 4.2 Element replacement As the RO elements are used, the salt rejection rate declines, and average conductivity of the product water increases. The deteriorated elements must be replaced in order to maintain quality of the product water. The life span of an RO element depends on the operating conditions such as quality of pretreatment. Okinawa Seawater Desalination Center began element replacement in 2000 and had replaced about a half of the originally installed 3,024 elements by 2006.
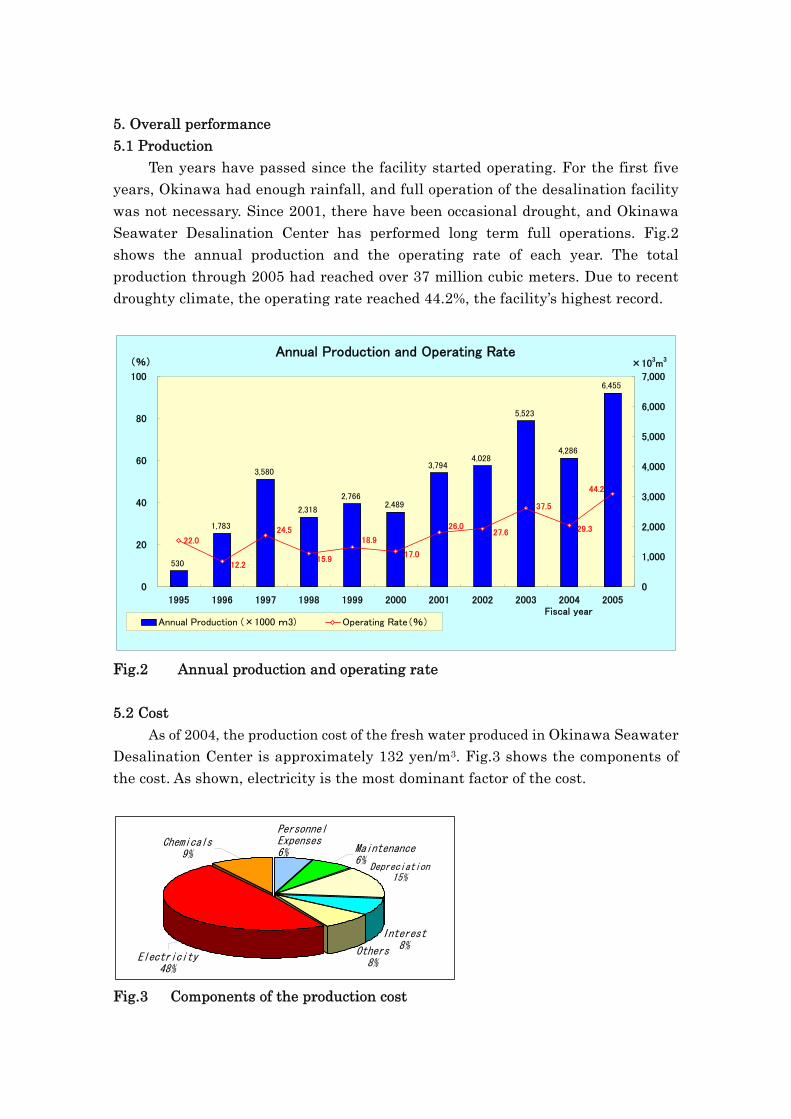
5. Overall performance 5.1 Production Ten years have passed since the facility started operating. For the first five years, Okinawa had enough rainfall, and full operation of the desalination facility was not necessary. Since 2001, there have been occasional drought, and Okinawa Seawater Desalination Center has performed long term full operations. Fig.2 shows the annual production and the operating rate of each year. The total production through 2005 had reached over 37 million cubic meters. Due to recent droughty climate, the operating rate reached 44.2%, the facility’s highest record.
Annual Production and Operating Rate
530
1,783
3,580
2,318
2,7662,489
3,7944,028
5,523
4,286
6,455
22.0
29.3
44.2
12.2
24.5
15.9
18.9
17.0
26.027.6
37.5
0
20
40
60
80
100
1995 1996 1997 1998 1999 2000 2001 2002 2003 2004 2005Fiscal year
(%)
0
1,000
2,000
3,000
4,000
5,000
6,000
7,000
×103m3
Annual Production (×1000 m3) Operating Rate(%)
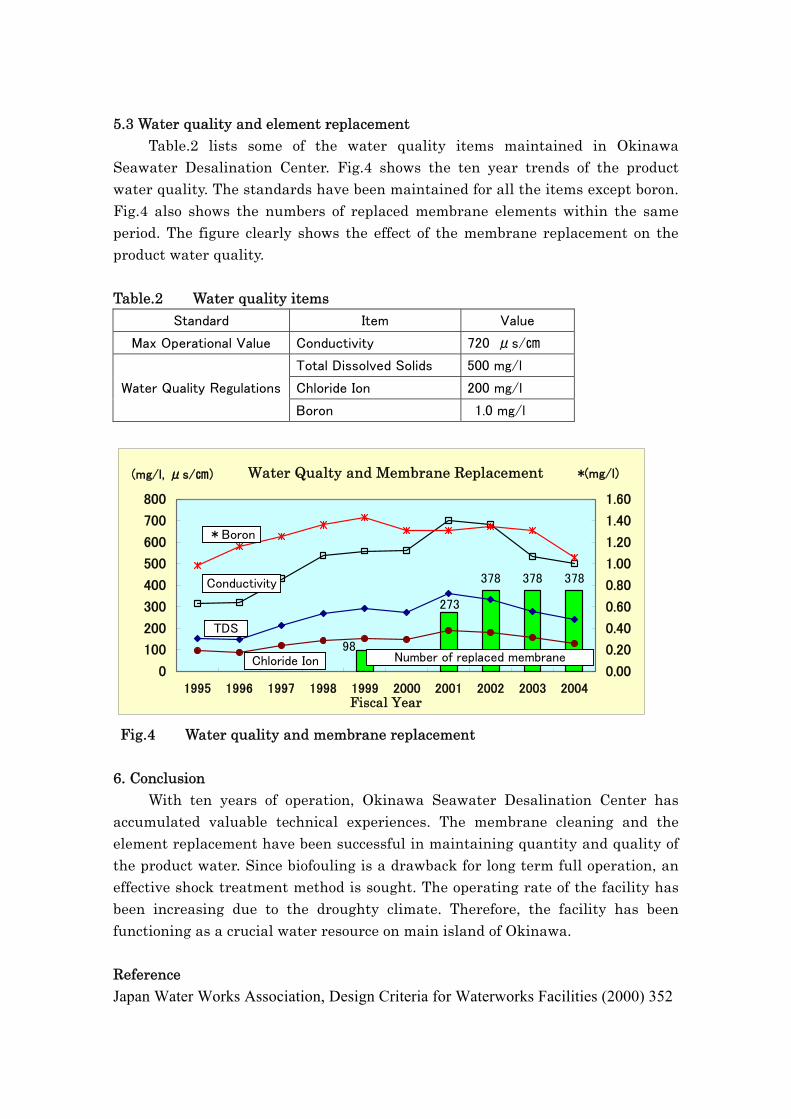
Fig.2 Annual production and operating rate 5.2 Cost As of 2004, the production cost of the fresh water produced in Okinawa Seawater Desalination Center is approximately 132 yen/m3. Fig.3 shows the components of the cost. As shown, electricity is the most dominant factor of the cost.
Electricity48%
Others8%
Depreciation15%
PersonnelExpenses6% Maintenance
6%
Interest8%
Chemicals9%
Fig.3 Components of the production cost
5.3 Water quality and element replacement Table.2 lists some of the water quality items maintained in Okinawa Seawater Desalination Center. Fig.4 shows the ten year trends of the product water quality. The standards have been maintained for all the items except boron. Fig.4 also shows the numbers of replaced membrane elements within the same period. The figure clearly shows the effect of the membrane replacement on the product water quality. Table.2 Water quality items
Water Qualty and Membrane Replacement
378 378 378
273
98
0
100
200
300
400
500
600
700
800
1995 1996 1997 1998 1999 2000 2001 2002 2003 2004Fiscal Year
(mg/l, μs/㎝)
0.00
0.20
0.40
0.60
0.80
1.00
1.20
1.40
1.60
*(mg/l)
Conductivity
TDS
Chloride Ion Number of replaced membrane
*Boron
Fig.4 Water quality and membrane replacement
6. Conclusion With ten years of operation, Okinawa Seawater Desalination Center has accumulated valuable technical experiences. The membrane cleaning and the element replacement have been successful in maintaining quantity and quality of the product water. Since biofouling is a drawback for long term full operation, an effective shock treatment method is sought. The operating rate of the facility has been increasing due to the droughty climate. Therefore, the facility has been functioning as a crucial water resource on main island of Okinawa. Reference Japan Water Works Association, Design Criteria for Waterworks Facilities (2000) 352
Standard Item Value
Max Operational Value Conductivity 720 μs/㎝
Total Dissolved Solids 500 mg/l
Chloride Ion 200 mg/l Water Quality Regulations
Boron 1.0 mg/l
1
Seawater Desalination Facility on Okinawa
Toru YamazatoSeawater Desalination Center
Chatan Water Administration OfficeOkinawa Prefectural Enterprise Bureau
Introduction
1. Overview2. Water quality3. Facility maintenance4. Overall performance

2
1.Overview
Needs for desalinationReverse osmosis seawater desalination facility
Needs for desalination
Water demand doubled in 30 yearsSupply dependent on dams and rivers Merit of desalination
- Abundant water from the sea- Short construction period- Location near consumers

3
Water rationing
Water rationing occurred in 14 years out of 34 years since 1972.The longest continued 326 days.No water service restriction occurred since 1993.
Reverse osmosis
Seawater Fresh waterFresh water
Semi-permeable membrane
Operating pressure : P
Osmotic Pressure :Δπ
Flux : F
P > Δπ
4
Reverse osmosis (RO) membrane element
Center pipeRO membrane
Feed Brine
Permeate
Differential Pressure
RO module
SandSedimentation Basin
Seawater
Intake TowerIntake Pump
Primary and Secondary Sand Filters
AdjustmentTank
RO Supply Pump
Security Filter
High Pressure Pump
Reverse Osmosis Unit
Energy Recovery Turbine
Fresh Water Tank
Fresh Water
Brine
Multi-Nozzle Discharge Tower
Okinawa Seawater Desalination Center
5
Production capacity : 40,000m3/dayRecovery rate : 40%Maximum power consumption : 9,000 kW378 elements / unit × 8 units = 3,024 elementsProduct water is sent to adjoining water purification plant to be mixed with water from inland.Construction cost : 34.7 billion yen85% subsidized by the national governmentPartly operational in 1995Fully operational in 1997
Okinawa Seawater Desalination Center
2. Water quality
0.12 1.144.68Boron
43645650,800Electrical conductivity
113106,360Hardness
36.85.92,490Sulfate Ion
38.896.111,400Sodium
46.511919,800Chloride Ion
25627834,800Total Dissolved Solids
Mixed waterDesalted waterRO feed waterItem
(Units: [μS/cm] for electrical conductivity and [mg/l] for others)

6
3. MaintenanceBiofouling
- Polyamide membrane and oxidizing agents
- Biofilm in the feed channel
- Damage to the membrane elements
Countermeasure for biofoulingSulfuric acid shock treatment
- Acid injection to the feed- pH = 2.5 ~ 3.0 30 minutes- Advantage : Long running time of RO units
Membrane cleaning- Off-line cleaning- pH = 10.5 3 days- Advantage : Fundamental and efficient
7
1.2
1.3
1.4
1.5
1.6
1.7
1.8
1.9
2.0
2004/2/16 2004/2/23 2004/3/1 2004/3/8 2004/3/15 2004/3/22 2004/3/29
Differential PressureKg/cm2
No.2 No.3 No.4 No.5 No.6 No.7 No.8
No.5-0.49
No.3-0.25
No.7-0.27
No.4-0.38
No.3+0.01
No.6-0.08 No.4
-0.04
Alkaline cleaning + SBS soaking Alkaline cleaning only
Membrane Cleaning
Element replacementSalt rejection declines
- Conductivity of the product water increases.
- Replacement started in 2000.
- About a half of the elements were replaced by 2006.

8
4.Overall performance
ProductionCostWater quality and membrane elements
Production and Operating Rate
530
1,783
3,580
2,318
2,7662,489
3,7944,028
5,523
4,286
6,455
22.0
29.3
44.2
12.2
24.5
15.9
18.9
17.0
26.027.6
37.5
0
20
40
60
80
100
1995 1996 1997 1998 1999 2000 2001 2002 2003 2004 2005F iscal year
(%)
0
1 ,000
2 ,000
3 ,000
4 ,000
5 ,000
6 ,000
7 ,000
×103m3
Annual Production (×1000 m3) Operating Rate(%)

9
Long Term Full Operation
0
5 ,000
10 ,000
15 ,000
20 ,000
25 ,000
30 ,000
35 ,000
40 ,000
45 ,000
Oct-0
2
Jan-
03
Apr-0
3
Jul-03
Oct-0
3
Jan-
04
Apr-
04
Jul-04
Date
Production [m3/day]
Production Cost
9,838
6 ,3477 ,545 6,794
10 ,335
15,050
11,69611,000
17 ,626
277
408
363391
280
219
270280
186
0
50
100
150
200
250
300
350
400
450
1997 1998 1999 2000 2001 2002 2003 2004 2005
( Fiscal year )
( Yen / m3 )
0
5,000
10,000
15,000
20,000
25,000
30,000
35,000
40,000
( m3 / day )
Average daily production Production cost per m3

10
Components of Production Cost( 132 yen / m3 , as of 2004 - 40,000m3/day operation is assumed )
Electricity48%
Others8%
Depreciation15%
PersonnelExpenses6% Maintenance
6%
Interest8%
Chemicals9%
Example of standards maintained
Standard Item Value
Max Operational Value Conductivity 720 μS/㎝
TDS 500 mg/l
Chloride Ion 200 mg/l
Boron 1.0 mg/l
Water Quality Regulations

11
Water Quality and Membrane Replacement
378 378 378
273
98
0
100
200
300
400
500
600
700
800
1995 1996 1997 1998 1999 2000 2001 2002 2003 2004
Fiscal Y e ar
(mg/ l, μS/㎝)
0.00
0.20
0.40
0.60
0.80
1.00
1.20
1.40
1.60
* (mg/ l)
Conductivity
TDS
Chloride Ion Replaced Eelements
*Boron
ConclusionOkinawa Seawater Desalination Center accumulated valuable technical experiences.Membrane cleaning and element replacement have been successful.An effective shock treatment method is needed.The operating rate has been increasing due to droughty climate.Therefore, the facility has been functioning as a crucial water resource on Okinawa.

12
END