seb facts and figures january september 2008
DESCRIPTION
TRANSCRIPT

1
www.sebgroup.com
Facts & FiguresJanuary – September 2008

2
PageSEB Group 3 – 30Asset quality 31 – 47Bond portfolios 48 – 57Divisions 58 – 64Merchant Banking 65 – 74Retail Banking 75 – 100Wealth Management 101 – 112Life 113 – 128Macro update 129 – 138
Contents

3
SEB has…an attractive platformhigh customer satisfactionstable profit growthseveral leading positions
...a strong customer base2,500 customers are large companies and financial institutions400,000 SME customers5 million private customers
3
SEB – the key to North-European markets

4
Business Support/Group StaffJan Erik Back / Ingrid Engström / Hans Larsson
Internal Audit
Agneta Brevenhag
Group Credits & Group Risk Control
Johan Andersson
President & CEO
Annika Falkengren
Merchant Banking
Magnus Carlsson
Retail Banking
Bo Magnusson
Life
Anders Mossberg
WealthManagementFredrik Boheman
SEB's organisation

5
Share of operating profitJan – Sep 2008
43%36%
8%13%
Retail Banking
Wealth Management
Life Merchant Banking
9%
9%6%
4%5%
5%
12%
50%
GermanySweden
Lithuania
Latvia
Estonia
Norway
Finland
Denmark
Geography - Adjusted for OtherDivisions - Adjusted for Other

6
Ratings of Skandinaviska Enskilda Banken ABRating target set by SEB Board at AA
Moody’s S&P Fitch DBRS
Bank Senior Rating
Short Term P-1 A-1 F-1 R-1 (middle)
Long Term Aa2 A+ A+ AA (low)
Outlook Negative Negative Stable Stable
Last Action Outlook change Outlook change Outlook change Unaffected rating
Date Dec-08 Oct-08 Jul-08 Jul-08

7
Key figuresSEB Group
Q3 Jan-Sep Q2 Q3 Jan-SepSEK m 2008 2008 2008 2007 2007
Operating income 8,705 27,910 -16% -8% -8%Operating expenses -5,970 -18,442 -7% 7% 7%Operating profit 2,010 7,927 -43% -46% -36%Net profit 1,514 6,171 -46% -51% -38%
Return on Equity, % 8.0 10.9 -7.2 -9.3 -8.1Cost / income ratio 0.69 0.66 0.07 0.10 0.09Credit loss level, % 0.27 0.19 0.10 0.19 0.09
Basel II Core capital ratio, % 8.1 8.1 -0.5 -0.2 -0.2Risk-weighted assets, SEK bn 937 937 66 140 140
Change

8
Profit and loss accountQ3 2008 vs. Q3 2007SEK m Q3 Q3 Change Excluding
2008 2007 % portfoliosNet interest income 4,553 3,917 16Net fee and commissions 3,754 4,101 -8Net financial income -269 163Net life insurance income 504 782 -36Net other income 163 530 -69
Total operating income 8,705 9,493 -8 -12%Staff costs -3,752 - 3,564 5Other expenses -1,820 - 1,691 8Depreciation of assets -398 - 325 22
Total operating expenses -5,970 - 5,580 7Gain/loss tangible/intangible assets 2 Net credit losses etc -725 - 189
Operating profit 2,010 3,726 -46 -48%Net profit 1,514 3,101 -51 -52%

9
Profit and loss accountQ3 2008 vs. Q2 2008SEK m Q3 Q2 Change Excluding
2008 2008 % portfoliosNet interest income 4,553 4,421 3Net fee and commissions 3,754 3,909 -4Net financial income -269 1,161 -123Net life insurance income 504 642 -21Net other income 163 270 -40
Total operating income 8,705 10,403 -16 -14%Staff costs -3,752 -3,993 -6Other expenses -1,820 -2,098 -13Depreciation of assets -398 -354 12
Total operating expenses -5,970 -6,445 -7Gain/loss tangible/intangible assets 1 Net credit losses etc -725 -452 60
Operating profit 2,010 3,507 -43 -34%Net profit 1,514 2,809 -46 -38%

10
Profit and loss accountJan – Sep 2008 vs. Jan – Sep 2007SEK m Jan – Sep Jan – Sep Change Excluding Jan – Dec
2008 2007 % portfolios 2007Net interest income 13,197 11,623 14 15,998Net fee and commissions 11,464 12,922 -11 17,051Net financial income 731 2,819 -74 3,239Net life insurance income 1,859 2,167 -14 2,933Net other income 659 874 -25 1,219Total operating income 27,910 30,405 -8 -6% 40,440Staff costs -11,644 -11,134 5 -14,921Other expenses -5,674 -5,137 10 -6,919Depreciations/amortisations -1,124 -995 13 -1,354Total operating expenses -18,442 -17,266 7 -23,194Gain/loss tangible/intangible assets 4 1 788Net credit losses etc -1,545 -703 120 -1,016Operating profit 7,927 12,437 -36 -30% 17,018Net Profit 6,171 9,885 -38 -32% 13,642

11
SEB GroupIncome, Expenses and Operating profit, SEK m
Operating profit
01 0002 0003 0004 0005 0006 000
Q1-04
Q2-04
Q3-04
Q4-04
Q1-05
Q2-05
Q3-05
Q4-05
Q1-06
Q2-06
Q3-06
Q4-06
Q1-07
Q2-07
Q3-07
Q4-07
Q1-08
Q2-08
Q3-08
*
* One-off charges of SEK 890m in Q4 2005 ** Including sales of Baltic properties in Q4 2007 of SEK 785m
**
0
2,000
4,000
6,000
8,000
10,000
12,000
Q1-04
Q2-04
Q3-04
Q4-04
Q1-05
Q2-05
Q3-05
Q4-05
Q1-06
Q2-06
Q3-06
Q4-06
Q1-07
Q2-07
Q3-07
Q4-07
Q1-08
Q2-08
Q3-08
Excluding portfolios Income Expenses
*

12
3,917
4,553-462
381
53996 82
Q3 2007 Lendingmargin
Lendingvolume
Depositmargin
Depositvolume
Funding &other
Q3 2008
Net interest income analysisSEB Group Q3 2008 vs. Q3 2007SEK m

13
4,4214,553-298
107
538
-6
-209
Q2 2008 Lendingmargin
Lendingvolume
Depositmargin
Depositvolume
Funding &other
Q3 2008
Net interest income analysisSEB Group Q3 2008 vs. Q2 2008SEK m

14
11,623
13,197
338311
670
870
-615
Jan – Sep2007
Lendingmargin
Lendingvolume
Depositmargin
Depositvolume
Funding &other
Jan – Sep2008
Net interest income analysisSEB Group Jan – Sep 2008 vs. Jan – Sep 2007SEK m

15
Net interest and Net fee and commission incomeSEB Group, SEK m
0
1,000
2,000
3,000
4,000
5,000
Q1-04
Q2-04
Q3-04
Q4-04
Q1-05
Q2-05
Q3-05
Q4-05
Q1-06
Q2-06
Q3-06
Q4-06
Q1-07
Q2-07
Q3-07
Q4-07
Q1-08
Q2-08
Q3-08
Net interest income Net fee and commissions

16
Fee and commission incomeGross quarterly development Q1 2004 – Q3 2008 SEB Group, SEK m
0
500
1,000
1,500
2,000
2,500
New issues &advisory
Secondarymarket &
derivatives
Custody &mutual funds
Payment, cards,structuredlending,
deposits,guarantees
Other
Deal driven
Securitiestransaction
driven
Value driven –performance
driven Non-capital market driven
Capital market driven
*
* Q2 2006 adjusted for gross commission on security lending, SEK 200m

17
-400
-200
0
200
400
600
800
1,000
1,200
1,400
1,600
Net financial income Net life insurance income Net other income
Net financial, Life and Other insurance incomeQuarterly development Q1 2004 – Q3 2008 SEB Group, SEK m

18
0
500
1,000
1,500
2,000
2,500
3,000
3,500
4,000
4,500
Staff costs Other expenses Restructuring costs
Cost development per quarterQuarterly development Q1 2004 – Q3 2008* SEB Group, SEK m
* Include capitalisation of acquisition cost in Life from Q1 2005 – onwards** One-off charges of SEK 890m in Q4 2005
**

19
18,679
17,26618,442
736
1,217 129
-66982
-319
Jan-Sep2007
Inflation Organicgrowth +
Acq
Depreciation Variablesalaries
Cost beforeefficiency
gains
Efficiencygains
Redundancycost
Jan-Sep2008
19
Cost managementTotal expenses, Jan-Sep 2008 vs. Jan-Sep 2007
*
• Investments for operational excellence of SEK 668m included• Organic growth of SEK 378m• Acquisitions of KAM, Factorial of SEK 171m
*
SEK 865m from the start
of 2007

20
Return on equitySEB Group, per cent
21.1
12.614.7
15.8
20.8
10.9
19.3
2004 2005 2006 2007 Jan – Sep 2008
Excluding portfolios Return on Equity
*
* 17.0 excluding one-off charges of SEK 890m in Q4 2005

21
Cost/income ratioSEB Group
0.65 0.650.58 0.57
0.66
0.550.63
2004 2005 2006 2007 Jan – Sep 2008
C/I ratio Excluding portfolio losses
*
* 0.62 excluding one-off charges of SEK 890m in Q4 2005

22
Basic earnings per shareSEB Group, SEK
21.83
10.3510.8312.58
18.72
9.00
19.97
2004 2005 2006 2007 Jan – Sep 2008
Excluding portfolios Earnings per share
*
* 13.54 excluding one-off charges of SEK 890m in Q4 2005

23
12 month rolling SEB Group*, SEK m
* Excluding restructuring costs and one-off charges of SEK 890m in Q4 2005
0
5,000
10,000
15,000
20,000
25,000
30,000
35,000
40,000
45,000
Q1-04
Q2-04
Q3-04
Q4-04
Q1-05
Q2-05
Q3-05
Q4-05
Q1-06
Q2-06
Q3-06
Q4-06
Q1-07
Q2-07
Q3-07
Q4-07
Q1-08
Q2-08
Q3-08
Income
Expenses
Operatingprofit

24
Assets under managementSEB Group, SEK bn
Assets under management year-end 2007 1,370Inflow 222 (16%)Outflow -188 (-14%)Acquisition/disposal net 17Change in value -177 (-13%)
Assets under management Sep 2008 1,244 ** Of which:Retail Banking 75Wealth Management 1,181Life 382

25
SEB Group net inflow AuM Jan – Sep 2008, SEK bn
30.234.0
-11.1
2.5
11.11.3
Sweden Other Nordic Germany Baltic countries& Poland
Other & Elim Group

26
Balance sheet Sep 2008 Jun 2008 Sep 2007
Cash and balances with central banks 18,733 27,557 16,402Loans to credit institutions 221,403 219,111 242,706 Loans to the public 1,204,713 1,132,374 1,021,498Financial assets at fair value 633,099 597,723 661,314Available-for-sale financial assets 257,634 247,245 133,608Held-to-maturity investments 2,067 2,266 2,089Investment in associates 1,387 1,361 1,180Tangible and intangible assets 27,163 26,177 22,994Other assets 50,154 50,335 46,864
Total assets 2,416,353 2,304,149 2,148,655Deposits by credit institutions 399,940 397,601 360,609Deposits and borrowings from the public 794,266 757,904 706,623Liabilities to policyholders 206,473 211,938 217,516Debt securities 554,257 506,564 465,381 Financial liabilities at fair value 248,142 229,285 209,380Other liabilities 90,357 83,129 75,966 Provisions 1,378 1,265 1,590Subordinated liabilities 45,736 41,664 38,631Total equity 75,804 74,799 72,959
Total liabilities and equity 2,416,353 2,304,149 2,148,655

27
Relationship Deposits from and Lending to the public 2001 – 2008
30%
40%
50%
60%
70%
80%
90%
100%
2001 2002 2003 2004 2005 2006 2007 Q32008
Deposits to loans ratio

28
Deposits - Interbank
20%
Deposits - General Public
42%
CPs/CDs11%
Schuldscheins and Reg Bonds3%
Mortgage Covered Bonds Sweden10%
Mortgage Covered Bonds Germany2%Public Covered Bonds Germany7%
Senior debt2%
Subordinated debt3%
Funding structureSEB Group, Sep 2008SEK 1,702bn
* Over collateral within covered pools SEK 57bn

29
Net liquidity position across maturities30 Sep, SEK bn
More than 12 months matched funding, i.e. based on no access to capital markets, no refinancing of debt to credit institutions, issued bonds or subordinated capital; and moderate reduction of business activities.
0
50
100
150
200
250
300
1 week
2 weeks
4 weeks
2 months
3 months
4 months
5 months
6 months
9 months
12 months
Year-end 200730-Sep-08
SEB is match-funded approx.
one year
SEK bn

30
Capital adequacy SEB Group
7.9 8.0 7.8 7.5 8.2 8.6 8.1
10.5 10.2 10.3 10.8 11.5 11.010.4
Dec2002
Dec2003
Dec2004
Dec2005
Dec2006
Dec2007
Sep2008
Core capital ratio, % Total capital ratio, %
SEK bnCapital base 52.7 54.7 58.7 76.2 85.8 93.0 97.7Risk-w. Assets 503 535 570 704 741 842 937
Basel I 9,3%
Basel I 7,3%
Basel I 1.045
Basel II

31
Asset quality

32
Credit exposure On and off balance, SEK 1,805bn
14%
40%
14%
6%
26%
Property management
Public administration
BanksCorporate
Households
By sector

33
Credit exposure On and off balance, SEK bn
Sep 2008 (Dec 2007) Nordic German Baltic Total
Corporates 533 (416) 99 (72) 88 (83) 720 (571)
Property Management 119 (100) 98 (87) 28 (26) 245 (212)
Households 313 (292) 94 (87) 61 (55) 469 (434)
Public Administration 20 (18) 87 (66) 6 (3) 113 (88)
Total non-banks 986 (826) 377 (312) 183 (166) 1,547 (1,304)
Banks 204 (187) 52 (58) 2 (3) 258 (248)
Total 1,189 (1,013) 430 (369) 186 (169) 1,805 (1,552)

34
Dec -05 Dec -06 Dec -07 Jun -08 Sep -08Corporates 494 484 571 616 720
Property Management 192 192 212 229 245
Households 319 374 434 463 469
Public Administration 125 97 88 95 113
Total non-banks 1,130 1,146 1,304 1,403 1,547Banks 198 169 248 227 258
Total 1,328 1,315 1,552 1,631 1,805
Credit exposure On and off balance, SEK bn

35
240 269 330 35779
105104 111
Dec 2005 Dec 2006 Dec 2007 Sep 2008
Mortgage Other434
319 374469
Credit exposure – HouseholdsSEK bn

36
186219 227 235 235
55 67 68 70 7228 44 45 47 50
68
73 7679 78
27 20 20 21 22
1010 11 11 11
Dec'06
Dec'07
Mar'08
Jun'08
Sep'08
Dec'06
Dec'07
Mar'08
Jun'08
Sep'08
Dec'06
Dec'07
Mar'08
Jun'08
Sep'08
Mortgage Other
Nordic Germany Baltic
Households Credit PortfolioSEK bn

3737
Corporate credit exposure – by industrySEB Group, SEK bn
458 463
573
720
Dec2005
Dec2006
Dec2007
Sep2008
12%
11%
10%
18%3%
27%
19%
Finance and insurance Wholesale and retailTransportation Other service sectorsConstruction ManufacturingOther

38
40,5%
35,0%
3,3%
2,4%
6,3%
8,0%3,3%1,2%
Sweden Germany EstoniaLatvia Lithuania Other NordicOther European Other
Property management – by geography*SEB Group, SEK bn
101 111137 159
91 8175
86
Dec 2005 Dec 2006 Dec 2007 Sep 2008
Commercial Multi-family
192 192212
245
* By obligor’s domicile

39
0.6%
1.4%
0.2%
1.5%
0%
2%
Dec'03
Mar'04
Jun'04
Sep'04
Dec'04
Mar'05
Jun'05
Sep'05
Dec'05
Mar'06
Jun'06
Sep'06
Dec'06
Mar'07
Jun'07
Sep'07
Dec'07
Mar'08
Jun'08
Sep'08
SEB Group Germany Nordic Baltic
* Impaired loans gross* *Excluding Banks
Impaired Loan Volumes* % of Credit Exposure**
40
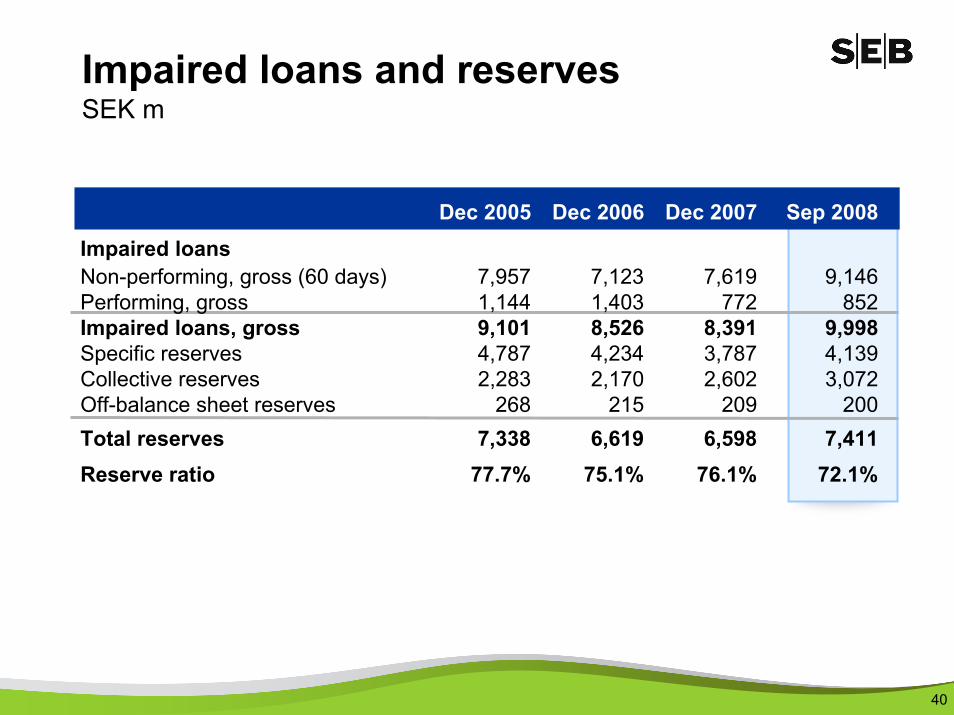
Impaired loans and reservesSEK m
Dec 2005 Dec 2006 Dec 2007 Sep 2008Impaired loansNon-performing, gross (60 days) 7,957 7,123 7,619 9,146Performing, gross 1,144 1,403 772 852Impaired loans, gross 9,101 8,526 8,391 9,998Specific reserves 4,787 4,234 3,787 4,139Collective reserves 2,283 2,170 2,602 3,072Off-balance sheet reserves 268 215 209 200Total reserves 7,338 6,619 6,598 7,411Reserve ratio 77.7% 75.1% 76.1% 72.1%

41
0.000.100.200.300.400.500.600.700.800.90
2003 2004 2005 2006 2007 Q12008*
Q1-Q22008*
Q1-Q32008*
Germany Baltics Nordics SEB Group
Level of Net Credit Losses, %
* Annualised
Estonia 1.31Latvia 0.96Lithuania 0.43Baltics 0.85

42
Credit losses and build up of reserves SEK m
Sum Average/ Jan – Sep Jan – Sep Change8 quarters quarter 2007 2008
Net credit losses, quarterly 2006 – 2008ProvisionsNet collective provisions -597 -75 -405 -419 -14Specific provisions -2,038 -255 -422 -930 -508Reversals of specificprovisions no longer required 772 97 242 194 -48Net provisions for contingent liabilities -2 0 32 -20 -52Net provisions (build-up of reserve) -1,865 -233 -553 -1,175 -622Write-offsTotal write-offs -2,803 -350 -833 -964 -131Reversal of specific provisionsutilized for write-offs 1,421 178 469 489 20Write-offs not previously provided for -1,382 -173 -364 -475 -111Recovered from previous write-offs 477 60 208 122 -86Net write-offs -905 -113 -156 -353 -197
Net credit losses -2,770 -346 -709 -1,528 -819Change in value of seized assets -13 -2 6 -17 -23Net credit losses incl change in value -2,783 -348 -703 -1,545 -842

43
Q3 Q4 Q1 Q2 Q3 Q4 Q1 Q2 Q3Net credit losses, quarterly 2006 2006 2007 2007 2007 2007 2008 2008 2008
ProvisionsNet collective provisions -89 212 -114 -220 -71 15 -112 11 -318Specific provisions -124 -455 -245 -77 -100 -231 -190 -409 -331Reversals of specific provisions no longer required 133 173 75 87 80 163 44 79 71Net provisions for contingent liabilities 1 10 31 -7 8 -24 1 2 -23
Net provisions (build-up of reserve) -80 -60 -253 -217 -83 -77 -257 -317 -601
Write-offsTotal write-offs -334 -444 -243 -240 -350 -562 -332 -367 -265Reversal of specific provisionsutilized for write-offs 196 221 124 131 214 242 201 217 71Write-offs not previously provided for -138 -223 -119 -109 -136 -320 -131 -150 -194Recovered from previous write-offs 81 62 135 43 30 85 24 19 79
Net write-offs -57 -161 16 -66 -106 -235 -107 -131 -115
Net credit losses -137 -221 -237 -283 -189 -312 -364 -448 -716
Change in value of seized assets 1 -1 3 3 - -1 -4 -4 -9
Net credit losses incl change in value -136 -222 -234 -280 -189 -313 -368 -452 -725
Credit losses and build up of reserves quarterly developmentSEK m

44
17 22 22 18 21 2234 39 458 8 8
4 5 6
813
15
1419 20
1014 14
13
2226
564441
34
525041
89
76
Dec'06
Dec'07
Sep '08 Dec'06
Dec'07
Sep '08 Dec'06
Dec'07
Sep '08
Total
Banks
PublicAdministrationHouseholds
PropertyManagementCorporate
SEB Estonia SEB Latvia SEB Lithuania
Growth rates in local currency+38% +17% +40% +18% +47% +30%
2006 2007 2006 2007 2006 2007
+1%
2008 YTD
+4% +13% 2008 YTD 2008 YTD
Baltic countries – Credit exposure On and of balance, SEK bn

45
Baltic countries - Asset Quality
0
50
100
150
200
250
Estonia Latvia Lithuania
Net credit losses Q1 2007 - Q3 2008, SEK m
Impaired loans Q4 Q1 Q2 Q3% 2007 2008 2008 2008
Estonia 0.4 0.7 1.6 2.0Corporate 0.2 0.5 2.0 2.2Private 0.7 1.1 1.3 1.8
Latvia 0.5 0.8 1.1 1.6Corporate 0.3 0.3 0.6 1.0Private 1.0 1.5 2.0 2.8
Lithuania 0.8 0.9 1.0 1.2Corporate 0.8 0.8 0.9 1.1Private 0.8 1.2 1.4 1.6
* Corporate including Property Mangement

46
SEB Estonia
SEB Latvia
SEB Lithuania
Total Baltic
Impaired loans, gross
1,019 694 1,037 2,750
Specific reserves 294 80 401 775Collective 482 384 311 1,177Off balance reserves
0 0 0 0
Total reserves 776 464 713 1,952
Reserve ratio 76.1% 66.8% 68.8% 71.0%
Baltic countries Impaired Loans and ReservesSeptember 2008, SEK m
Impaired loans Q4 Q1 Q2 Q3SEK m 2007 2008 2008 2008
Estonia 186 334 819 1 019Corporate 47 132 570 657Private 138 202 249 362
Latvia 218 301 444 694Corporate 84 86 152 285Private 134 216 292 410
Lithuania 573 682 819 1 037Corporate 398 416 492 633Private 176 266 327 404

47
Estonia Latvia Lithuania Total
Net Write-offs & Actual Losses 3 -11 -1 -9
Net New Specific Provisions -273 -58 -69 -400
Net New Collective Provisions -158 -187 -117 -462
Change in Value of Seized Assets -1 -1 -5 -7
Net Credit Losses -429 -257 -192 -878
Baltic countries – Net Credit Losses Jan – Sep 2008, SEK m
48
Bond portfolios

49
Trading and Treasury etc
Held for trading (MTM over income) Available for sale (MTM over equity)
Mark-to-market losses over income of SEK 3,055m
Mark-to-market loss over equity of SEK 4,518m
The losses are expected to be recovered over time
Further volatility from the mark-to-market of these securities is expected; however with limited impact on income since 87 per cent of the SEK 130bn portfolio is classified as Available-for-sale at 30 September 2008
Investments (MB Credit and PortfolioManagement)
Fixed-income securities portfolio 30 September 2008, SEK 358bn
114
16
227 130
*Net of short and fully matched positions; excluding holdings in the insurance business
Impact on SEB’s portfolio values from credit turbulence since summer 2007

50
*Net of short and fully matched positions; excluding holdings in the insurance business
Structured credits18%
Financials24%
Covered bonds19%
Cover pool25%
Corp, Gov't etc
14%
Merchant Banking 207Group Treasury 143
Other divisions 8
Total 358
SEB Bond Portfolio*30 September, 2008, SEK bn

51
Capital Markets and other
30%
47%
9%
14%
Corporate bonds Financial institutionsGov't Covered bonds
Credit & Portfolio Management
49%42%
9%Structured credits Financial institutionsCovered bonds etc
Trading Investments
Merchant Banking Bond Portfolios30 September, 2008
Volume SEK 77bn Volume SEK 130bn

52
Structured creditsReduced volume: SEK 63bn (71)AAA-rating: 96.8% (99.3)MTM losses highly dependent on seniority, underlying assets and vintage
Financial institutions Unchanged volume: SEK 55bn (55)Rapid credit spread wideningMTM losses on all financial holdings, not only investment banks
Bond investment portfolio – status30 September, 2008 (31 December, 2007)
Covered bonds etc. SEK 12bn (5)
2007 Q1 08 Q2 08 Q3 08-872 -348
-2,134
-2,482
-1,630-1,769
-2,502
-66-56
-122
MTM (SEK m) Equity -698 -4,518
-2,467
AccP/L -3,055
-7,573

53
Structured credits Financial institutions2007 Q1 08 Q2 08 Q3 08
-41 -400
-1,107-1,507
-15-56
P/L
Equity
Acc-794-1,056
-626 -990 -2,738-1,682
-2,291
-1,784 -5,029
2007 Q1 08 Q2 08 Q3 08-26 51
-687-637
-52-78
P/LEquity
Acc-78-563
-72 -438 -1,249-635
-616
-515 -1,864
+ Covered bonds etc accumulated -680
Bond investment portfolio – financial effects30 September, 2008, SEK m
2007 Q1 08 Q2 08 Q3 08-872 -348
-2,134
-2,482-1,630
-1,769
-2,502
-66-56
-122
MTM (SEK m) Equity -698 -4,518
-2,467
AccP/L -3,055
-7,573

54
Limit P/L volatility by increasing AFS portfolios and reducing HFT portfolios Reduce subprime holdings, primarily in the HFT portfolioReduce the credit spread risk through partial hedging (ITRAXX)
30 29
0
26
41
5
ABS Financialinstitutions
Coveredbonds etc.
Q4 07 Q3 08
Held for trading (MTM over income)
Available for sale (MTM over equity)
SEK bn
Bond investment portfolio – strategy
51 51
114
12
1
ABS Financialinstitutions
Coveredbonds etc.
51 49
114
10
1
ABS Financialinstitutions
Coveredbonds etc.
Q2 08
55
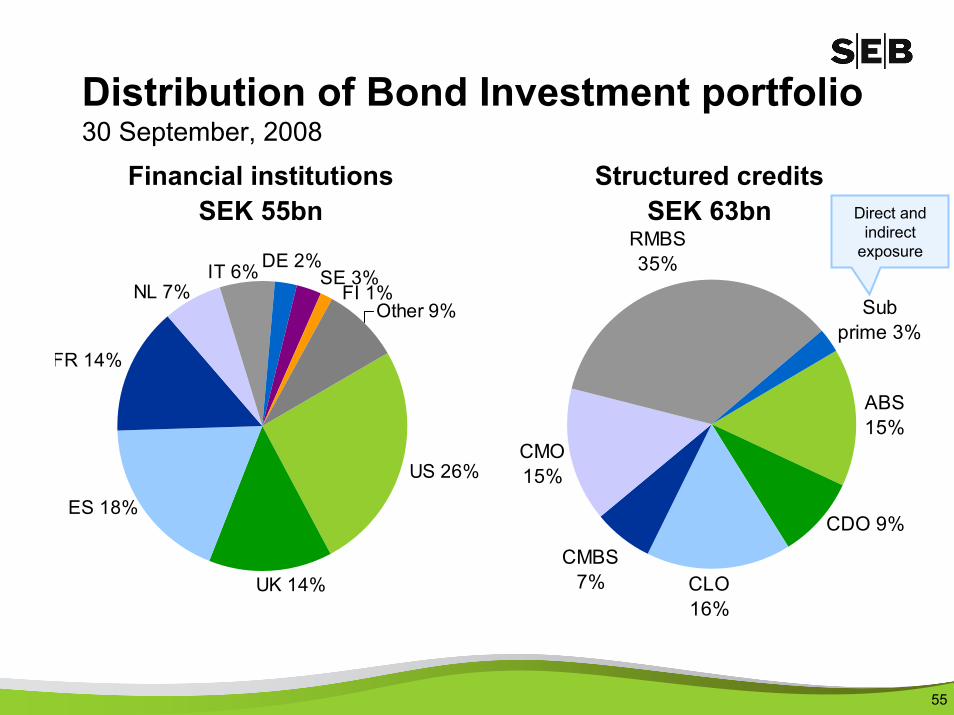
CMBS 7%
CMO 15%
RMBS 35%
Sub prime 3%
CLO 16%
CDO 9%
ABS 15%
Direct and indirect
exposure
Distribution of Bond Investment portfolio30 September, 2008
Financial institutionsSEK 55bn
Structured creditsSEK 63bn
FR 14%
IT 6%NL 7%
Other 9%FI 1%
SE 3%DE 2%
US 26%
UK 14%
ES 18%

56
A high quality investment portfolio initiated 1998 with fixed income securities eligible as central bank collateral
Total volume SEK 63bn – 684 positions
96.8% of the portfolio is rated Aaa/AAA, only 0.2% below investment grade– 9 positions have been downgraded from Aaa/AAA during Q3 by Moody’s
and Standard & Poor’s. Since the summer 2007, 34 positions have been downgraded
– Well diversified across products, asset classes and geographies– Cash-flow based – only one synthetic transaction (USD 10.5m)
Mark-to-market prices applied to all 684 positions– No level 3 assets
Current average remaining maturity ~4 years
Current annual amortisation rate is SEK ~10bn
Main characteristics of structured credits portfolio 30 September, 2008

57
Structured credits portfolio – ratingRating Composition (S&P, Moody’s and Fitch)Outstanding volumes , 30 September, 2008
0.02%0.18%0.07%2.98%
96.75%
0.00%
10.00%
20.00%
30.00%
40.00%
50.00%
60.00%
70.00%
80.00%
90.00%
100.00%
AAA AA/A BBB BB/B CCC
Q4-07 Q1-08 Q2-08 Q3-08

58
Divisions
Please note:A restatement of the divisional financial reporting has been carried out in conjunction with the Q1 2008 report as previously announced.Please consult www.sebgroup.com for more information.

59
Operating profit per divisionJan – Sep 2008 vs. Jan – Sep 2007SEK m
0 1,000 2,000 3,000 4,000 5,000 6,000 7,000
Life
WealthManagement
Retail Banking
MerchantBanking
Jan-Sep 2008
Jan-Sep 2007
Changevs. Jan-Sep 2007
-21% (-11%)
-19%
-31%
-36%
ROEJan-Sep 2008
15.6% (20.2%)
14.5%
19.8%
13.3%
Excl. portfolio losses
Sweden: 3%Germany: -41%Estonia: -67%Latvia: -58%Lithuania: -11%Cards: -7%

60
Q1 Q2 Q3 Q4 Q1 Q2 Q32007 2007 2007 2007 2008 2008 2008
MB 465 492 459 483 526 531 589Retail Banking 468 483 493 513 518 545 561RB Sweden 256 264 271 279 286 303 307RB Estonia 37 39 40 42 42 43 44RB Latvia 31 35 34 36 35 36 37RB Lithuania 46 50 54 59 60 64 69RB Germany 85 81 80 81 81 82 87RB Cards 13 14 14 14 14 17 17Wealth Management 30 31 33 32 31 29 28Life - - - - - - -Other/Elim 54 42 36 39 24 27 27SEB Group 1,017 1,048 1,021 1,067 1,099 1,132 1,205
VolumesPublic lendingSEK bn

61
VolumesPublic depositSEK bn
Q1 Q2 Q3 Q4 Q1 Q2 Q32007 2007 2007 2007 2008 2008 2008
MB 371 384 364 389 409 392 426Retail Banking 231 249 249 262 257 264 269RB Sweden 130 139 139 145 145 149 151RB Estonia 18 20 20 22 20 22 22RB Latvia 16 17 17 18 17 18 17RB Lithuania 25 26 26 30 28 28 30RB Germany 43 46 46 48 47 47 49RB Cards - - - - - - -Wealth Management 47 54 51 53 54 56 52Life - - - - - - -Other/Elim 20 28 43 46 45 46 47SEB Group 670 715 707 750 765 758 794

62
FTEs, end of quarter
Q1 Q2 Q3 Q4 Q1 Q2 Q32007 2007 2007 2007 2008 2008 2008
MB 2,540 2,568 2,550 2,672 2,742 2,760 2,719Retail Banking 8,655 8,912 8,807 8,925 8,995 9,325 9,139RB Sweden 2,742 2,812 2,660 2,736 2,733 2,875 2,738RB Estonia 1,011 1,095 1,061 1,061 1,048 1,084 1,046RB Latvia 1,052 1,089 1,117 1,118 1,108 1,122 1,093RB Lithuania 1,333 1,387 1,428 1,492 1,520 1,579 1,652RB Germany 1,668 1,699 1,728 1,733 1,802 1,830 1,794RB Cards 849 830 813 785 784 835 816Wealth Management 1,099 1,050 1,064 1,073 1,160 1,143 1,123Life 1,194 1,203 1,199 1,218 1,222 1,235 1,250Other/Elim 5,842 5,886 5,820 5,906 7,091 7,182 7,197SEB Group 19,330 19,619 19,440 19,794 21,210* 21,645 21,428
* Whereof 1,039 encompasses the consolidated acquisitions of Factorial bank in Ukraine and Key Asset Management.

63
Summary per division Jan – Sep 2008
Merchant Banking
RetailBanking
WealthManagement Life Other Group
Operating profit, SEK m 4,397 3,603 1,360 852 -2,285 7,927
Business equity, SEK bn 27 25.3 ** 6.6 7.5 75.2 *
Return on equity, % 15.6 14.5 19.8 13.3 10.9
Cost / income ratio 0.55 0.61 0.59 0.66 0.66
RWA, SEK bn, Basel II 473 378 37 49 937
RWA, SEK bn, Basel I 541 426 23 55 1,045
Tax Rate 28% 24% 28% 12%
* Average shareholders' equity
** Where of Sweden 7.4bn Estonia 3.3bn, Latvia 3.1bn, Lithuania 4.4bn, Germany 4.5bn and Cards 2.6bn.

64
01020304050
MerchantBanking
Retail Banking WealthManagement
Life* Group
Jan - Sep 2007 Jan - Sep 2008Cost/income ratio per division
Return on Equity per division, per cent
* Based on operating profit
0.000.200.400.600.801.00
MerchantBanking
Retail Banking WealthManagement
Life Group
Jan- Sep 2007 Jan- Sep 2008
RoE and Cost/Income ratio per division

65
Magnus CarlssonHead of Merchant Banking
Merchant BankingHighlights
Continued strong earnings, despite market dislocations and summer effects
Underlying income in line with Q3 last year
Cost decline 17% from Q2
Operating profit reduced by MTM valuation effects and provisions for exposure on Lehman Brothers
Ranked No. 1 globally for customer satisfaction in cash management (Euromoney)
SEK m Jan – Sep 2008 Δ 2007
Total income 10,381 -11%Interest, net 4,801 17%Commission, net 4,085 -11%Financial, net 1,296 -45%
Total expenses -5,677 -3%Credit losses, net -311 21%Operating profit 4,397 -21%
RoE, % 15.6 20.3C/I 0.55 0.50

66
Merchant Banking SEK m
0
500
1,000
1,500
2,000
2,500
Q1-07 Q2-07 Q3-07 Q4-07 Q1-08 Q2-08 Q3-08
Operating profit Excluding portfolios
0500
1,0001,5002,0002,5003,0003,5004,0004,5005,000
Q1-07 Q2-07 Q3-07 Q4-07 Q1-08 Q2-08 Q3-08
Excluding portfolios Income Expenses

67
40%
37%
23%
Share of income and result by areaJan – Sep 2008, per cent of total
Income Operating profit
34%
41%
25%
Trading and Capital Markets
Global transaction services
CorporateBanking
Trading and Capital Markets
Global transaction services
CorporateBanking

68
Trading and Capital MarketsSEK m
0
300
600
900
1,200
Q1-07 Q2-07 Q3-07 Q4-07 Q1-08 Q2-08 Q3-08
Operating profit Excluding portfolios
0
500
1,000
1,500
2,000
2,500
Q1-07 Q2-07 Q3-07 Q4-07 Q1-08 Q2-08 Q3-08
Excluding portfolios Income Expenses

69
Trading and Capital Markets– focus on client driven activities
45%36%26% 28% 33% 38% 41%
45%49%
44% 46% 64% 46%49%
8%8%22% 15% 11%3%
6% 1%
7%11%8% 5%
4%
Q1 -07
Q2 Q3 Q4 Q1 -08
Q2 Q3
Trading and Capital Markets income by main product cluster, excl. investment portfolios
FX
Structured Derivatives and other TCM
Equities
Capital Markets
●Focus on customer flows ensures continued strong revenues
●Positive profitability trend in FX areas
●Strong revenues and increased market shares in Equities
● Lower profits in fixed income related units due to ongoing uncertainty in credit markets

70
Operating profit
0200400
600800
1,000
Q1-07 Q2-07 Q3-07 Q4-07 Q1-08 Q2-08 Q3-08
0200400600800
1,0001,2001,4001,600
Q1-07 Q2-07 Q3-07 Q4-07 Q1-08 Q2-08 Q3-08
Income Expenses
Corporate banking SEK m
2007 and 2008 including Baltics

71
Operating profit
0
100
200
300
400
Q1-07 Q2-07 Q3-07 Q4-07 Q1-08 Q2-08 Q3-08
0100200300400500600700800900
Q1-07 Q2-07 Q3-07 Q4-07 Q1-08 Q2-08 Q3-08
Income Expenses
Global Transaction Services SEK m
2007 and 2008 including Baltics

72
Custody volume development
0
1,000
2,000
3,000
4,000
5,000
6,000
7,000
2004 2005 2006 2007 20080
20,000
40,000
60,000
80,000
100,000
120,000
140,000
160,000Assets under custody, SEK bn No of transactions/day

73
Market Shares Nordic Stock Exchanges *Jan – Sep 2008
*Source: The Nordic Stock exchanges**Rank based on announced deals. All Nordic involvement. Source: Thomson Financial
4.6%
5.3%
5.4%
5.4%
9.2%
Carnegie
SHB
MorganStanley
Glitnir
SEB
Nordic M&A**
Jan – Sep 2008 (EUR m)
Merchant BankingInvestment banking rankings
9,137
12,163
12,786
15,582
18,127
SEB
UBS
MorganStanley
DeutscheBank
JP Morgan
10 Deals
14 Deals
14 Deals
17 Deals
29 Deals

74
Merchant Banking– Recent rankingsOctober 2008 No. 1 Globally for Overall Customer Satisfaction regarding Cash Management
Best for Real Estate Commercial Banking in the Nordic and Baltic region
Trade and Forfaiting Review July 2008 Best Trade Bank in Northern Europe & Scandinavia
Euromoney July 2008Best for Cash Management in Nordic & Baltic regionBest Equities House in Nordic & Baltic regionBest M&A House in the Nordic & Baltic region
Risk Magazine July 2008 Best derivatives dealer in Sweden
Thomson Rueters Extel June 2008 Best research house in the Nordic countries
Global FinanceApril 2008
World’s Best Developed Market Banks 2008, no. 1 in SwedenWorld’s Best Emerging Market Banks 2008 Central and Eastern Europe, no. 1 in Latvia and Lithuania
Söderberg & Partners February 2008 Best Arranger Structured Products, Sweden
Euroweek February 2008 Best Arranger Nordic Loans, Syndicated Loans and Leveraged Finance Awards 2007
Prospera January 2008 No.1 stockbroker in the Nordic region
FX Week January 2008 Best bank for international currency forecasts in 2007
Global Custodian November 2007October 2007
Top rated in Central and Eastern Europe (2007 Emerging Markets Agent Bank Review)Top rated in all four Nordic markets (2007 Major Market Agent Bank Review )
Global FinanceJanuary 2008
Best Bank for Cash, Liquidity and Risk Management, Nordic RegionBest Trade Finance bank, Nordic Region, Sweden and LithuaniaBest Foreign Exchange Bank and Provider in the Nordic countries and Lithuania
TMI January 2008 Best bank for Cash Management, Nordic RegionBest Bank for supply Chain Finance, Nordic Region

75
Retail Banking
SEK m Jan – Sep 2008 Δ 2007
Total income 12,547 3%Interest, net 7,899 10%Commission, net 4,233 -8%
Total expenses -7,677 6%Credit losses, net -1,267 195%Operating profit 3,603 -19%
RoE, % 14.5 18.6C/I 0.61 0.60
HighlightsBo MagnussonHead of Retail Banking Continued strong income
– NII +10% vs. 2007 offsets low security related fees
– Income growth Q3 +1% vs. Q2
Cost growth in Baltics due to inflation, real estate sale and 2007 sales expansion; higher pension cost in Sweden– Cost Q3 -2% vs. Q2
Profit before credit losses stable
Decrease in operating profit mainly driven by increased provisions in Estonia, Latvia and Lithuania

76
Retail BankingSEK m
Operating profit
0
500
1,000
1,500
2,000
Q1-07 Q2-07 Q3-07 Q4-07 Q1-08 Q2-08 Q3-08
0500
1,0001,5002,0002,5003,0003,5004,0004,5005,000
Q1-07 Q2-07 Q3-07 Q4-07 Q1-08 Q2-08 Q3-08
Income Expenses
77
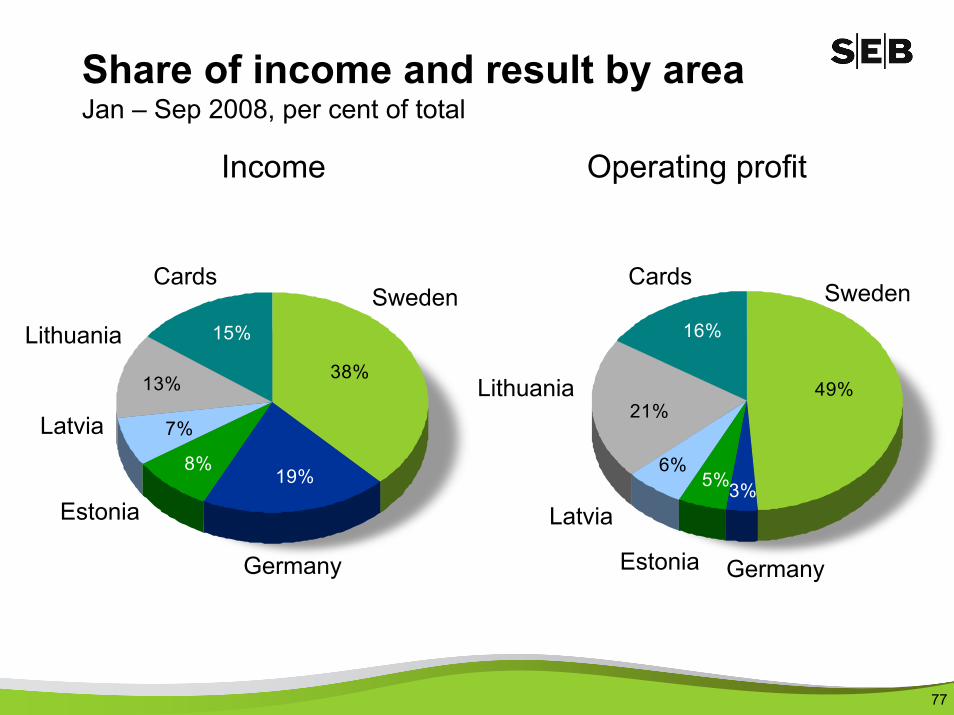
Share of income and result by areaJan – Sep 2008, per cent of total
38%
19%8%
7%
13%
15%
Germany
Latvia
Estonia
SwedenLithuania
Cards
Income
16%
21%
6%5%3%
49%
Germany
Latvia
Sweden
Lithuania
Cards
Estonia
Operating profit

78
Business volume development by areaSEK bn Q3 2008 change vs. Q3 2007 (local currency)
53
27
29
23
70
16
11
15
64
237
Lithuania
Latvia
Estonia
Germany
Sweden 10%
0%
8%
8%
37%
10%
2%
4%
4%
19%
Mortgages Other lending
30
17
22
49
151
Deposits
8%
2%
1%
-2%
8%
Note: Figures for Estonia, Latvia and Lithuania include SEB:s large corporate business volumesSwedish Other lending growth adjusted for transfered leasing volumes

79
41%13%25%21%
Transaction account privateTransaction account corporate & publicSavings account privateSavings account corporate & public
Deposit breakdownPercent of total deposits
45%
24%
21%
10%
Retail Total
Estonia
Sweden Germany
Latvia Lithuania
53%
9%
21%
17%
42%
3%
3%
52%
22%
18%
39%
21%
29%
15%
36%
20%
35%
10%
31%
24%

80
Development of lending market shares – Baltics Per cent, Jan 2005 – Sep 2008
Estonia* Latvia Lithuania
* Sampo as per Q1 2008Swedbank as per Q2 2008
0%
10%
20%
30%
40%
50%
Q105
Q3 Q106
Q3 Q107
Q3 Q108
Q30%
10%
20%
30%
40%
50%
Q105
Q3 Q106
Q3 Q107
Q3 Q108
Q30%
10%
20%
30%
40%
50%
Q105
Q3 Q106
Q3 Q107
Q3 Q108
Q3
SEBSwedbankDnB NordParex BankaSampo/Danske bankNordea

81
Retail SwedenHighlightsSEK m Jan – Sep 2008 Δ 2007
Total income 4,749 4%Interest, net 3,453 14%Commission, net 1,106 -14%
Total expenses -2,899 5%Credit losses, net -86 29%Operating profit 1,764 3%
RoE, % 22.9 22.9 C/I 0.61 0.61
Total lending* 306,600 13%Total deposits 150,600 8%
Continued strong net income growth supported by volume and margin development
Decreased commission income due to brokerage and structured products
Strong SME growth: 5,300 new SME customers (2,800 same period 2007)
Cost affected by higher pension costs
* Adjusted for moved leasing volumes, lending increased with 10%

82
Business volume developmentRetail Sweden, SEK bn
Mortgages
0
50
100
150
200
250
Q105
Q3 Q106
Q3 Q107
Q3 Q108
Q3
CorporatePrivate
Other lending*
0
50
100
150
200
250
Q105
Q3 Q106
Q3 Q107
Q3 Q108
Q3
Deposits
0
50
100
150
200
250
Q105
Q3 Q106
Q3 Q107
Q3 Q108
Q3
* Excluding leasing

83
Market share development Sweden, per cent Corporate
Private
Note: Other lending and deposits=SEB Parent Bank Sweden, i.e. not only Retail Sweden
Mortgages*
0
5
10
15
20
Q105
Q3 Q106
Q3 Q107
Q3 Q108
Q308
Other lending
0
5
10
15
20
Q105
Q3 Q106
Q3 Q107
Q3 Q108
Aug
Deposits
0
5
10
15
20
25
30
Q105
Q3 Q106
Q3 Q107
Q3 Q108
Aug
* New measurement method from Q4 2007. Lowers the volume market share with approximately 0.2 percentage points

84
Mortgages private marketRetail SwedenMarket share, per cent
02468
101214161820
Q105
Q2 Q3 Q4 Q106
Q2 Q3 Q4 Q107
Q2 Q3 Q4 Q108
Q2 Q3
Sales Volume
* New measurement method from Q4 2007. Lowers the volume market share with approximately 0.2 percentage points
*

85
Mortgages private marketTotal SwedenVolumes and margins
0
50
100
150
200
250
Q12005
Q2 Q3 Q4 Q12006
Q2 Q3 Q4 Q12007
Q2 Q3 Q4 Q12008
Q2 Q30.00%
0.25%
0.50%
0.75%
1.00%
1.25%Outstanding volume, SEK bn Average margin

86
Mortgages private marketSwedenCustomers’ choice of fixed / floating interest rates
0%
20%
40%
60%
80%
100%
Q12005
Q2 Q3 Q4 Q12006
Q2 Q3 Q4 Q12007
Q2 Q3 Q4 Q12008
Q2 Q3
FixedFloating

87
Retail GermanyHighlightsSEK m Jan – Sep 2008 Δ 2007
Total income 2,434 -4%Interest, net 1,449 3%Commission, net 960 -11%
Total expenses -2,247 -1%Credit losses, net -67 14%Operating profit 120 -41%
RoE, % 2.8 5.1C/I 0.92 0.90
Total lending 87,000 8%Total deposits 49,200 6%
Reduced profitability due to lower customer activity within securities-related-areas
Higher sales of insurance (+13%) and mortgages (+31%) vs. same period 2007
Stable cost level
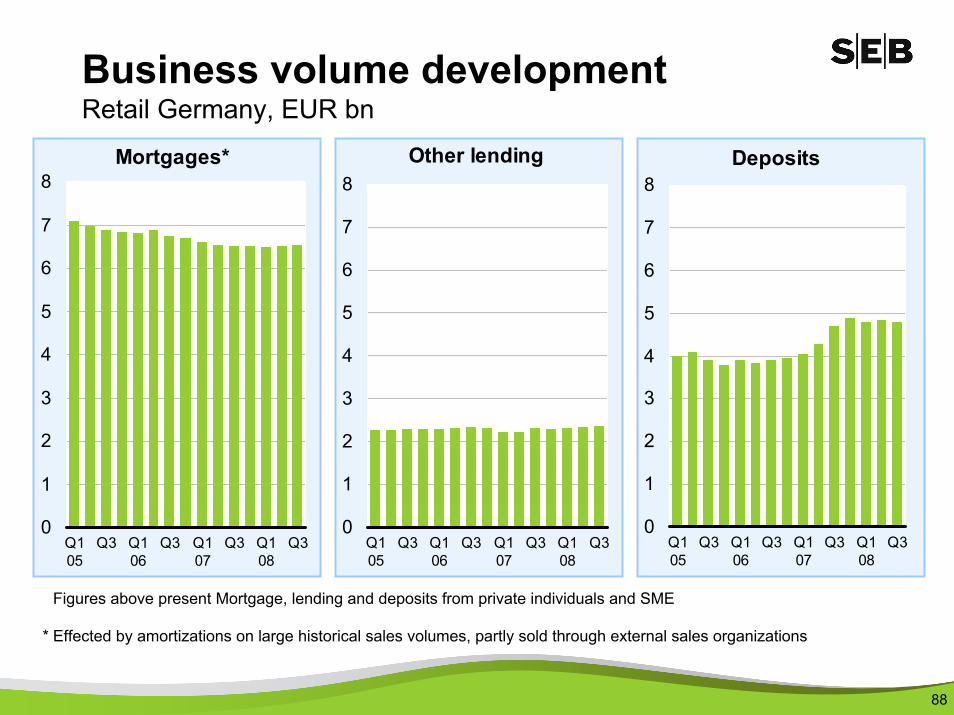
88
Business volume developmentRetail Germany, EUR bn
Mortgages*
0
1
2
3
4
5
6
7
8
Q105
Q3 Q106
Q3 Q107
Q3 Q108
Q3
Other lending
0
1
2
3
4
5
6
7
8
Q105
Q3 Q106
Q3 Q107
Q3 Q108
Q3
Deposits
0
1
2
3
4
5
6
7
8
Q105
Q3 Q106
Q3 Q107
Q3 Q108
Q3
Figures above present Mortgage, lending and deposits from private individuals and SME
* Effected by amortizations on large historical sales volumes, partly sold through external sales organizations

89
New mortgage*
0
50
100
150
200
250
300
350
400
450
Q105
Q3 Q106
Q3 Q107
Q3 Q108
Q3
Customer appointments*
0
5,000
10,000
15,000
20,000
25,000
30,000
35,000
40,000
45,000
50,000
Q105
Q3 Q106
Q3 Q107
Q3 Q108
Q3
Insurance
0
20
40
60
80
100
120
140
Q105
Q3 Q106
Q3 Q107
Q3 Q108
Q3
* by Call centre
EUR m EUR m
* incl. prolongation
Sales developmentRetail Germany

90
Retail Estonia
Highlights
Strong focus on credit quality, including increase of loans overdueIncreased credit provisioning reflecting weakened macro economic outlookReduced lending market shareIncreased savings focus - new mutual funds launched Package solution for private customers’ daily needs attracted more than 30,000 customers, whereof half new to the bankLower cost in Q3 than Q2
SEK m Jan – Sep 2008 Δ 2007
Total income 1,032 8%Interest, net 685 6%Commission, net 255 -2%
Total expenses -426 23%Credit losses, net -428 598%Operating profit 178 -67%
RoE, % 6.1 17.7C/I 0.41 0.36
Total lending 44,500 +12%Total deposits 21,900 +7%

91
Business volume developmentRetail Estonia, EUR bn Corporate
Private
Mortgages
0
1
2
3
Q105
Q3 Q106
Q3 Q107
Q3 Q108
Q3
Other lending
0
1
2
3
Q105
Q3 Q106
Q3 Q107
Q3 Q108
Q3
Deposits
0
1
2
3
Q105
Q3 Q106
Q3 Q107
Q3 Q108
Q3
Mortgages defined as home loans to private individualsNote: Figures include SEB:s large corporate business volumes

92
Market share developmentRetail Estonia, per cent Corporate
Private
Mortgages
0
5
10
15
20
25
30
35
Q105
Q3 Q106
Q3 Q107
Q3 Q108
Aug
Deposits
0
5
10
15
20
25
30
35
Q105
Q3 Q106
Q3 Q107
Q3 Q108
Aug
Mortgage market share for home loans to private individuals

93
Retail Latvia
HighlightsHighlightsSEK m Jan – Sep 2008 Δ 2007
Total income 926 -6%Interest, net 754 4%Commission, net 141 -43%
Total expenses -462 19%Credit losses, net -244 268%Operating profit 220 -58%
RoE, % 8.1 18.6C/I 0.50 0.40
Total lending 37,500 11%Total deposits 17,000 3%
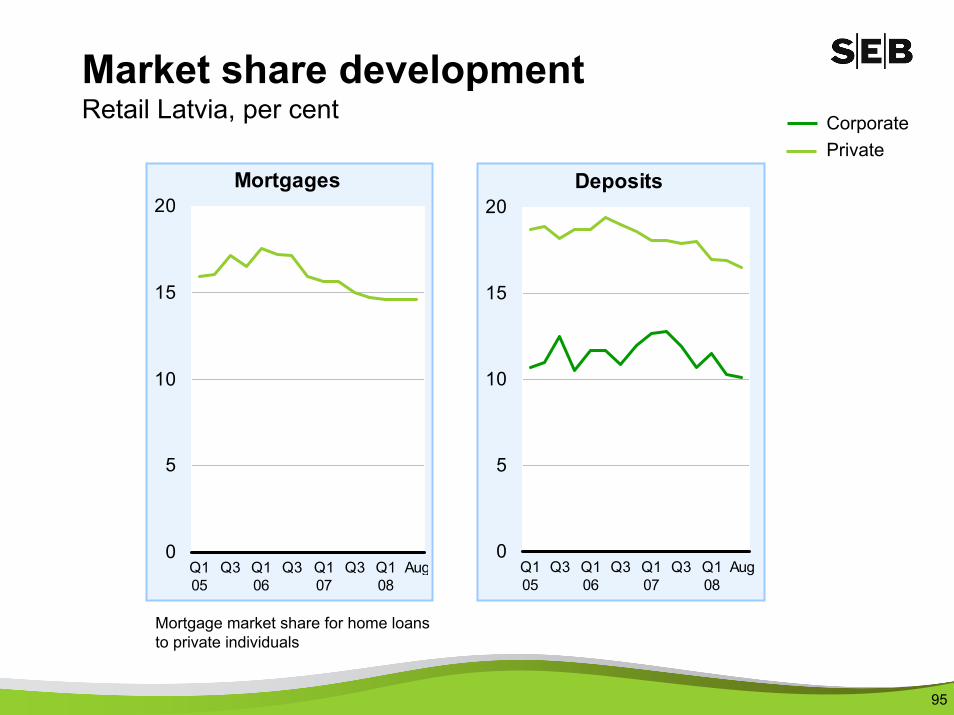
Strong focus on credit quality, including increase of loans overdue
Increased credit provisioning reflecting weakened macro economic outlook
Reduced lending market share
Increased savings focus - new mutual funds launched
Lower cost in Q3 than Q2

94
CorporatePrivate
Business volume developmentRetail Latvia, EUR bn
Mortgages
0
1
2
3
Q105
Q3 Q106
Q3 Q107
Q3 Q108
Q3
Other lending
0
1
2
3
Q105
Q3 Q106
Q3 Q107
Q3 Q108
Q3
Deposits
0
1
2
3
Q105
Q3 Q106
Q3 Q107
Q3 Q108
Q3
Mortgages defined as home loans to private individuals
Note: Figures include SEB:s large corporate business volumes
95
Market share developmentRetail Latvia, per cent
Mortgage market share for home loans to private individuals
CorporatePrivate
Mortgages
0
5
10
15
20
Q105
Q3 Q106
Q3 Q107
Q3 Q108
Aug
Deposits
0
5
10
15
20
Q105
Q3 Q106
Q3 Q107
Q3 Q108
Aug

96
Retail LithuaniaSEK m Jan – Sep 2008 Δ 2007
Total income 1,575 8%Interest, net 1,193 10%Commission, net 311 1%
Total expenses -642 22%Credit losses, net -186 103%Operating profit 747 -11%
RoE, % 19.2 21.1C/I 0.41 0.36
Total lending 68,700 28%Total deposits 30,100 15%
Highlights
Controlled credit growth
Increased credit provisioning reflecting macro economic outlook
Reduced lending market share
SEB awarded best consumer Internet bank in Lithuania for the third consecutive year by Global Finance

97
Business volume developmentRetail Lithuania, EUR bn Corporate
Private
Mortgages
0
1
2
3
4
5
6
Q105
Q3 Q106
Q3 Q107
Q3 Q108
Q3
Other lending
0
1
2
3
4
5
6
Q105
Q3 Q106
Q3 Q107
Q3 Q108
Q3
Deposits
0
1
2
3
4
5
6
Q105
Q3 Q106
Q3 Q107
Q3 Q108
Q3
Mortgages defined as home loans to private individualsNote: Figures include SEB:s large corporate business volumes

98
Market share developmentRetail Lithuania, per cent
Mortgage market share for home loans to private individuals
CorporatePrivate
Mortgages
0
5
10
15
20
25
30
35
40
Q105
Q3 Q106
Q3 Q107
Q3 Q108
Aug
Deposits
0
5
10
15
20
25
30
35
40
Q105
Q3 Q106
Q3 Q107
Q3 Q108
Aug

99
CardsSEK m Jan – Sep 2008 Δ 2007
Total income 1,834 10%Interest, net 364 45%Commission, net 1,445 4%
Total expenses -1,004 3%Credit losses, net -257 204%Operating profit 573 -7%
RoE, % 21.2 28.1C/I 0.55 0.58
Highlights
Continued underlying business growth, turnover +7%
Continued strong cost discipline
Increased losses due to consumer finance transfer and higher fraud
Several new customer offerings launched, e.g. Eurocard Platinum

100
Cards
Turnover cards
203040506070
Q12003
Q2 Q3 Q4 Q12004
Q2 Q3 Q4 Q12005
Q2 Q3 Q4 Q12006
Q2 Q3 Q4 Q12007
Q2 Q3 Q4 Q12008
Q2 Q3
SEKbn
Number of cards
2.62.83.03.23.4
Q12005
Q2 Q3 Q4 Q12006
Q2 Q3 Q4 Q12007
Q2 Q3 Q4 Q12008
Q2 Q3
Millions

101
Fredrik BohemanHead of Wealth Management
Wealth ManagementHighlights
Revenues stable compared to Q2. Strong net interest, weak performance fees. Cost lower than Q2. Profit slightly up compared to Q2
Strong net sales in Q3 for both PB and IC
Assets under management. SEK 1,181bn, -8% since year end
SEB kept capturing volumes on a continued weak net sales market for Swedish mutual funds, SEK +5,9bn vs. total market of SEK -31bn.
SEKm Jan – Sept 2008 Δ 2007
Total income 3,320 -12%Interest, net 678 13%Commission, net 2,562 -17%
Total expenses -1,958 10%
Operating profit 1,360 -31%
RoE, % 19.8 34.5C/I 0.59 0.47

102
Share of income and result by areaJan – Sep 2008, per cent of total
67%
33%
Private Banking
Institutional Clients
Income
25%
75%
Private Banking
Institutional Clients
Operating profit

103
Operating profit
0
200
400
600
800
Q1-07 Q2-07 Q3-07 Q4-07 Q1-08 Q2-08 Q3-08
0200400600800
1,0001,2001,400
Q1-07 Q2-07 Q3-07 Q4-07 Q1-08 Q2-08 Q3-08
Income Expenses
Wealth ManagementSEK m

104
Institutional ClientsSEK m
Operating profit
0
200
400
600
800
Q1-07 Q2-07 Q3-07 Q4-07 Q1-08 Q2-08 Q3-08
0100200300400500600700800900
1,000
Q1-07 Q2-07 Q3-07 Q4-07 Q1-08 Q2-08 Q3-08
Income Expenses

105105
Private BankingSEK m
Operating profit
050
100150200250
Q1-07 Q2-07 Q3-07 Q4-07 Q1-08 Q2-08 Q3-08
0
100
200
300
400
500
Q1-07 Q2-07 Q3-07 Q4-07 Q1-08 Q2-08 Q3-08
Income Expenses

106
1,285
1,181-156
19
33
Dec 2007 Value Fx Net sales Q3 2008
Assets under managementWealth Management, SEK bn

107
Q1-06 Q2-06 Q3-06 Q4-06 Q1-07 Q2-07 Q3-07 Q4-07 Q1-08 Q2-08 Q3-08
Institutional portf incl Stiftelser & Ftg (excl MF) Mutual Funds Private Clients
48%
1,107 1,0791,147 1,192
1,266 1,320 1,300 1,285 1,256
48% 47% 47% 46% 46% 45% 45% 45% 44%
13% 14% 15%15%
15%15% 15% 15% 15% 15%
39% 38% 38% 39% 39% 40% 40% 40% 41%40%
1,217
46%
40%
14%
1,181
Assets under managementper product typeWealth Management, SEK bn
107

108
Total net sales per quarterSEK bn
19,7
9,413,6
7,6
16,4 15,5
6,32,0
8,2 9,0
3,0
2,31,0
0,8
4,1
2,92,6
3,5
5,8
4,9 5,3
10,9
0
5
10
15
20
25
Q12006
Q2 Q3 Q4 Q12007
Q2 Q3 Q4 Q12008
Q2 Q3
IC PB
The figures are not eliminated.

109
Mutual funds per product type Wealth Management, Sep 2008 (Jun 2008)
32.0%
29.1%
12.5%
26.4%
Equity funds 32.0% (35.5 %)
Fixed income funds 26.4% (25.0 %)
Balanced funds 12.5% (12.0 %)
Alternative funds 29.1% (27.5 %)
Total amount SEK 475bn (SEK 496bn)
Note: Key Asset Mgmt is included from Q1-08

110
Swedish Mutual Funds MarketNet sales and SEB market share
-30
-10
10
30
50
70
90
110
2001 2002 2003 2004 2005 2006 2007 Q32008 0
10
20
30
40
50
60
70
Total Net Sales, SEKbn SEB share, %
%N/A
Source: Svensk Fondstatistik
SEK -31bn
SEBSEK +5,9bn

111
-30,000
-20,000
-10,000
0
10,000
20,000
30,000
40,000
50,000
60,000
Jan-05
Maj Sep Jan-06
May Sep Jan-07
May Sep Jan-08
May Sep
SEBSHBRoburNordea
Mutual Funds Net Sales SwedenCumulative Jan 2005 – Sep 2008, including PPMSEKm
Distribution per type of fundJan – Sep 2008
-80%-60%-40%-20%
0%20%40%60%80%
SEB Total
Equity funds Mixed fundsShort bond funds Long bond fundsFund in fund Alternative funds
Activity level – Wealth
Source: Svensk Fondstatistik

112
Performance vs. benchmark 2008
6149
30
79
54
34
0
20
40
60
80
100
2006 2007 Q3 20080
20
40
60
80
100
AuMexceeding benchmark
No. of portfoliosexceeding benchmark

113
LifeAnders MossbergHead of Life
* Based on business result
SEK m Jan – Sep 2008 Δ 2007
Total income 2,525 -13%Total expenses -1,673 6%
Operating profit 852 -36%Change in surplusvalues, net 609 -28%
Business result 1,461 -33%
ROE, %* 22.9 33.9C/I ratio 0.66 0.54
Highlights
Positive sales development – up 11%, despite increasingly competitive markets and financial unrest
Lower operating profit due to adverse equity and interest rate development
Increased costs owing to investments in new markets and higher sales
Provision made to cover potential future guarantees in Nya Liv

114
LifeSEK m
Operating profit
0100200300400500
Q1-07 Q2-07 Q3-07 Q4-07 Q1-08 Q2-08 Q3-08
0
200
400
600
800
1,000
1,200
Q1-07 Q2-07 Q3-07 Q4-07 Q1-08 Q2-08 Q3-08
Income Expenses

115
Share of income and profit by areaLife, Jan – Sep 2008 – per cent of total
63%28%
9%
Sweden
Denmark
International
Income Operating profit
65%
30%
5%
Sweden
Denmark
International
Sweden including central functions etc

116
Results – LifeSEK m
Jan – Sep Jan – Sep Change2008 2007 %
Income unit-linked 1,444 1,589 -9Income other insurance 741 886 -16Other income 340 431 -21Total income 2,525 2,906 -13
Operating expenses -1,838 - 1,683 9Other expenses -23 - 19 20Change in deferred acquisition costs 188 123 53Total expenses -1,673 - 1,579 6
Operating profit 852 1,327 -36Change in surplus values, net 609 842 -28Business result 1,461 2,169 -33Financial effects due to market fluctuations -2,912 374 -Change in assumptions 12 - -Total result -1,439 2,543 -157

117
852
-263 -177 -121 -47
1817316
570
968
1,520
1,802
1997 1998 1999 2000 2001 2002 2003 2004 2005 2006 2007 Jan-Sep
2008
Operating profit developmentLife, SEK m

118
Strong market position in all marketsMarket shares, gross premium income, unit-linked insurance (%, 2008)
1
2
2
3
2
SEBRank
Skandia (15)
Hansa (37)
Sampo (35)
Hansa (30)
Main competitor
Danica (41)
* Sweden new sales** Denmark full year 2007
26
18
33
10
24
0% 20% 40% 60% 80% 100%
Lithuania
Latvia
Estonia
Denmark**
Sweden*
SEB Market share Competitors

119
Market shares, Sweden Unit-linked new business,12 months to September 2008 (2007)
Övriga 0,2% (0,2)
Moderna9,9% (13,5%)
AMF 3,0% (3,1%)
Folksam 8,0% (8,0%)
Danica 3,3% (4,1%)
SHB 4,5% (4,7%)
Swedbank 10,7% (10,5%)
LF 10,4% (10,1%)
Skandia13,9% (13,6%)
SEB Trygg Liv 23,8% (23,6%)
Nordea 7,7% (4,8%)
SPP 4,5% (3,7%)

120
Note: SPE = Single premiums plus regular premiums times ten
Sales (SPE) Life, SEK m
Jan – Sep 2008 Jan – Sep 2007 Change
Unit linked 27,343 25,911 6%
Traditional andSickness/health 8,541 6,410 33%
35,884 32,321 11%

121
0%
20%
40%
60%
80%
100%
2000 2001 2002 2003 2004 2005 2006 2007 Jan-Sep
2008
Traditional andsickness/health
Unit Linked
Note: SPE = Single premiums plus regular premiums times ten
Sales SPE – traditional vs. unit-linkedLife including SEB Pension from 2005 and the Baltics from 2006

122
0%
20%
40%
60%
80%
100%
2000 2001 2002 2003 2004 2005 2006 2007 Jan-Sep
2008
Individual
Corporate
Note: SPE = Single premiums plus regular premiums times ten
Sales SPE – individual vs. corporateLife including SEB Pension from 2005 and the Baltics from 2006

123
Unit-linked insurance sales growthSwedish* sales volumes weighted, SEK bn
27.1
34.931.6
26.722.8
2004 2005 2006 2007 Jan-Sep2008
Market ShareSweden, % 34.6 32.4 29.1 22.1 24.4**
*Including Swedish customers of the Irish subsidiary.
** 12 months to Q2 2008.

124
New business profitLife (2005-2006 only Swedish market), SEK m
Oct 2007- Full year Full year Full yearSep 2008 2007 2006 2005
New sales (single/10+regular) 3,845 3,689 3,345 3,678
Net present value 1,592 1,775 1,788 1,924Acquisition cost -850 -901 -970 -1,116
New business profit 742 874 818 808
Margin*, % 19.3 23.7 24.5 22.0Swedish market 20.5 22.9
* Rolling 12-months comparison

125
Sep Dec Dec Dec2008 2007 2006 2005
Equity * 8,421 8,836 8,450 7,696
Surplus value ** 12,160 14,496 12,872 10,765
* Dividend paid; 2008 SEK -1,275 2007: SEK -1,150 2006: SEK -400m.
** Value of in-force business; Net of DAC, including SEB Link (Denmark) from 2005
Embedded valueLife Holding group, SEK m

126
Life, assets under management(net assets)SEK bn
215
311
368395 408
364
0
100
200
300
400
500
2003 2004 2005 2006 2007 2008 Q3
Traditional and Risk Unit-linked

127
Life, premium income grossSEK bn
13
17
31 31
26
21
0
5
10
15
20
25
30
35
2003 2004 2005 2006 2007 2008 Q3
Traditional and Risk Unit-linked

128
-16,000
-12,000
-8,000
-4,000
0
4,000
8,000
1 2 3 4 5 6 7 8 9 10 11 12 13 14 15 16 17 18 19 20Year
Income/Costs& CF, SEK
Cost Income Accum cash flow
Net present value after sales costs is 11,000 SEK
Acc op result -592 -540 977* SEK 35,000
Profits generated over timeExample: Occupational pension – regular premium*Total duration of 20 years and premium duration of 15 years

129
Macro Update

130
Overall assessment
Asset erosion and financial stress are seriously jeopardising global growth
Inflation risks are fading while deflation is knocking on the door
Downside risks to our previous below consensus forecasts are now materialising
We still welcome further central bank actions, but conclude that fiscal policy must become more proactive to support growth

131
Sweden: Lengthy cyclical slowdown
Exports continuing to lose momentum
Falling asset prices will squeeze consumption
Inflation has peaked
Further interest rate cuts next year
Expansive fiscal policy and budget deficits
GDP and Economic tendency indicator
0
1
2
3
4
5
6
7
97 98 99 00 01 02 03 04 05 06 07 080
20
40
60
80
100
120
140
GDP (LHS) Economic tendency indicator (RHS)
Sources: Statistics Sweden, SEB
Index
Year-on-year percentage change

132
Mainland GDP and Employment
-3
-2
-1
0
1
2
3
4
5
6
03 04 05 06 07 08
GDP Employment
Weaker global demand slows export growth
Buying spree fading –construction falling
Unemployment has bottomed out
Rate cuts
Year-on-year percentage change
Source: Statistics Norway
Norway: Clear deceleration from a high level

133
Finland: Weak growth next year
Sharp decline in leading indicators
Capital spending and exports will decelerate
Private consumption will slow down
Unemployment will start to climb this autumn
High inflation this year, lower next
Index
Source: Reuters EcoWin
Leading indicators
-60
-40
-20
0
20
40
60
80
99 00 01 02 03 04 05 06 07 08
Manufacturing Service Construction

134
Denmark: Close to stagnation
Continued house market correction
Unemployment turns upwards in the second half of 2008
Continued weak private consumption
Exports being squeezed from several directions
Expansive fiscal policy despite inflation upturn
GDP and Economic sentiment indicator
-2
-1
0
1
2
3
4
5
95 96 97 98 99 00 01 02 03 04 05 06 07 080
20
40
60
80
100
120
140
GDP (LHS) Economic sentiment indicator (RHS)
Sources: DG ECFIN, Statistics Denmark
Year-on-year percentage change Index

135
German IFO Index
60
70
80
90
100
110
120
99 00 01 02 03 04 05 06 07 08
Main index Current conditions Expectations
Index
Euro zone: Recession on its way
Sources: Eurostat, SEB
Negative GDP growth in Q2, and probably also in Q3, Q4No private consumption upturn in sightLabour market conditions are beginning to softenInflation will peak in late 2008ECB will cut refi rate to 2.00 per cent next year

136
Baltics: Lengthy adjustment Lengthy recession in Estonia and Latvia; negative growth both in 2008 and 2009Weak growth in less overheated Lithuanian economyDomestic demand remains depressedIncreased exchange rate risk in Estonia and LatviaLarge imbalances will dampen:– Wage inflation declines sharply – Large current account deficits will
shrink, but still high 2010
Year-on-year percentage change
Source: Reuters EcoWin
Retail sales
-15-10
-505
101520253035
01 02 03 04 05 06 07 08
Estonia Latvia Lithuania

137
GDP growth forecasts
2007 2008 2009 2010
United States 2.0 1.3 -1.5 0.8
Euro zone 2.6 1.0 -1.3 0.5
United Kingdom 3.0 0.8 -2.0 0.5
Nordic countries 3.0 1.4 -1.0 0.7
OECD 2.6 1.0 -1.2 0.6
World 5.0 3.4 0.9 2.3

138
SEB Forecasts GDP (%) Inflation (%)2007 2008 2009 2010 2007 2008 2009 2010
Denmark* 1.8 0.2 -1.5 0.0 1.7 3.6 1.8 1.8Finland* 4.4 2.4 -0.3 0.6 1.6 4.0 2.2 1.7Norway 3.7 1.9 0.1 1.8 0.8 3.8 2.1 2.1Sweden 2.9 0.8 -1.3 0.6 2.2 3.6 1.2 0.9Germany* 2.5 1.3 -1.2 0.6 2.3 2.8 1.0 1.2Euro zone* 2.6 1.0 -1.3 0.5 2.1 3.3 0.9 1.0Estonia* 7.1 -2.0 -4.0 -1.0 6.6 10.5 3.9 1.9Latvia* 10.3 -1.5 -5.0 -1.0 10.1 15.5 5.0 3.0Lithuania* 8.8 5.5 -2.0 -2.0 5.8 11.5 8.0 7.0Russia 8.1 6.5 1.0 3.0 9.0 14.0 9.8 8.5Ukraine 7.3 5.0 -5.0 2.0 12.8 24.5 15.0 10.0
Specific GDP growth forecasts
Sources: National statistical agencies, SEB Nordic Outlook October 2008* Harmonised consumer price index