seb pank eur€¦ · seb group is a north european financial group for corporate customers,...
TRANSCRIPT

AS SEB Pank
Annual Report (translation of the Estonian original) 2008

AS SEB Pank, Annual Report 2008
- 1 -
Contents
Statement of the Management Board_____________________ 2 2. Risk policy and management_________________________ 39I. Introduction - general information_______________________ 3 2.1. Risk policy and structure______________________ 39
1. Credit institution____________________________________ 3 2.2. Credit risk_________________________________ 392. Auditor___________________________________________ 3 2.2.1. Credit risk in AS SEB Elu- ja Pensionikindlustus_____ 50
2.3. Market risk_________________________________ 50II. Management Report_________________________________ 4 2.3.1. Foreign exchange risk_________________________ 52
1. Credit institution's group as defined in Credit Institutions Law__ 4 2.3.2. Interest rate risk_____________________________ 541.1. Consolidated group_____________________________ 4 2.3.3. Market risk related to life insurance asset-liability1.2. Members of Management and Supervisory Board matching__________________________________ 57
and shares held by them_________________________ 5 2.3.4. Equity price risk_____________________________ 581.3. Strategy and organisation________________________ 5 2.4. Insurance risk______________________________ 58
2. Highlights_________________________________________ 6 2.5. Concentration of risks________________________ 593. Key Figures________________________________________ 9 2.6. Liquidity risk_______________________________ 61
2.7. Operational risk_____________________________ 63III. Consolidated Financial Statements______________________ 11 2.8. Fair value of financial assets and liabilities_________ 64
1. Consolidated Income Statement_________________________ 11 2.9. Capital management__________________________ 652. Consolidated Balance Sheet____________________________ 12 2.10. Internal control systems_______________________ 683. Consolidated Cash Flow Statement_______________________ 13 2.11. Compliance function_________________________ 684. Changes in Consolidated Shareholders' Equity______________ 14 3. Interest and similar income__________________________ 69
4. Interest expenses and similar charges__________________ 69Notes to Consolidated Financial Statements___________________ 15 5. Fee and commission income_________________________ 69
1. Accounting principles________________________________ 15 6. Fee and commission expense________________________ 701.1. Basis of preparation_____________________________ 15 7. Net income from foreign exchange_____________________ 701.2. Critical accounting estimates and judgements_________ 15 8. Gains less losses from financial assets 1.3. Consolidation_________________________________ 17 at fair value through profit or loss_____________________ 701.4. Foreign currency transactions and assets and 9. Income from insurance activities______________________ 70
liabilities denominated in a foreign currency___________ 18 10. Other income____________________________________ 711.5. Cash and cash equivalents_______________________ 19 11. Personnel expenses_______________________________ 711.6. Financial assets________________________________ 19 12. Other expenses___________________________________ 711.6.1. Loans and receivables___________________________ 20 13. Impairment losses on loans and advances_______________ 721.6.2. Financial assets at fair value through profit or loss______ 23 14. Income tax______________________________________ 721.6.3. Available for sale financial assets__________________ 24 15. Segment analysis_________________________________ 731.7. Offsetting financial instruments____________________ 25 16. Balances with central bank__________________________ 741.8. Tangible and intangible assets other than goodwill_____ 25 17. Loans and advances to credit institutions_______________ 741.9. Goodwill_____________________________________ 27 18. Loans and advances to customers____________________ 751.10. Non-financial assets held for sale___________________ 27 19. Financial investments______________________________ 761.11. Impairment of non-financial assets__________________ 27 20. Other assets_____________________________________ 781.12. Leases - a group is the lessee______________________ 28 21. Investments in associates___________________________ 791.13. Financial liabilities______________________________ 28 22. Intangible assets_________________________________ 801.14. Embedded derivatives___________________________ 29 23. Property plant and equipment________________________ 811.15. Financial Guarantee contracts_____________________ 29 24. Due to credit institutions___________________________ 821.16. Provisions____________________________________ 30 25. Due to customers_________________________________ 821.17. Classification and accounting principles of life insurance 26. Lending funds___________________________________ 83
contracts_____________________________________ 31 27. Other liabilities___________________________________ 831.18. Capitalisation of acquisition costs__________________ 32 28. Deferred income tax liabilities________________________ 841.19. Revenue recognition____________________________ 32 29. Issued debt securities______________________________ 851.20. Dividend income_______________________________ 33 30. Financial liabilities at fair value through profit or loss______ 851.21. Recognition of day one profit and loss_______________ 33 31. Provisions______________________________________ 861.22. Taxation_____________________________________ 33 32. Subordinated loans________________________________ 861.23. Fiduciary activities_____________________________ 34 33. Shareholders____________________________________ 871.24. Changes in the presentation of items of income 34. Dividend policy__________________________________ 88
statement and balance sheet______________________ 34 35. Other reserves___________________________________ 881.25. New International Financial Reporting Standards and 36. Contingent assets and liabilities and commitments________ 89
amendments to published standards and interpretations 37. Events after end of the financial year___________________ 90by the International Financial Reporting Interpretations 38. Related parties___________________________________ 91Committee____________________________________ 35 39. Legal disputes___________________________________ 92
40. Primary statements of parent company as a separate entity__ 93
IV. Independent Auditor's Report________________________ 97V. Proposal of the Management Board regarding the
profit distribution_________________________________ 99VI. Signatures of Supervisory Board to annual report________ 100
AS SEB Pank, Annual Report 2008
- 2 -
Statement of the Management Board Management Board of AS SEB Pank confirms that the Annual Report 2008 consists of the following parts and reports: Introduction – general information (page 3) Management Report (pages 4-10) Consolidated Financial Statements (pages 11-96) Independent Auditor's Report (pages 97-98) Proposal of the Management Board regarding the profit distribution (page 99). The financial and other additional information published in the Annual Report 2008 is true and complete. There is no financial or other information, missing from the Annual Report 2008, which could affect the meaning or contents of the report. Consolidated financial statements give a true and fair view of the actual financial position, results of operations and cash flows of the Group. Consolidated financial statements have been compiled in accordance with the International Financial Reporting Standards, as adopted by the European Union and as stipulated in § 17 of the Estonian Accounting Law. The Annual Report 2008 has been compiled in accordance with the requirements of Estonian laws. AS SEB Pank and subsidiaries of the consolidated group are assumed to be going concern. The audit of consolidated financial statements for the year 2008 was conducted in accordance with International Standards of Auditing. The Annual Report 2008 will be submitted for the approval to the Ultimate Shareholder. Previous Annual Report 2007 was approved on 04.04.2008. Members of Management Board: “_____”________________2009 ______________________ Ahti Asmann “_____”________________2009 ______________________ Paulius Tarbūnas “_____”________________2009 ______________________ Kristoffer Lindberg “_____”________________2009 ______________________ Erki Pugal “_____”________________2009 ______________________ Riho Unt

AS SEB Pank, Annual Report 2008
- 3 -
I. Introduction - general information
1. Credit institutionCompany name AS SEB PankAddress Tornimäe Str.2, Tallinn 15010, EstoniaRegistred in Republic of EstoniaRegistry date 08.12.95Registry code 10004252 (Estonian Commercial Register)Phone +372 6 655 100 Fax +372 6 655 102SWIFT EEUHEE2Xe-mail [email protected] Internet homepage http://www.seb.ee
2. AuditorAudit company AS PricewaterhouseCoopers Registry code 10142876Address Pärnu Str. 15, 10141 Tallinn, Estonia
Report balance sheet date 31.12.08Reporting period 01.01.2008 - 31.12.2008Report currency Euro (EUR), millions
AS SEB Pank, Annual Report 2008
- 4 -
II. Management Report 1. Credit institution's group as defined in Credit Institutions Law 1.1. Consolidated group
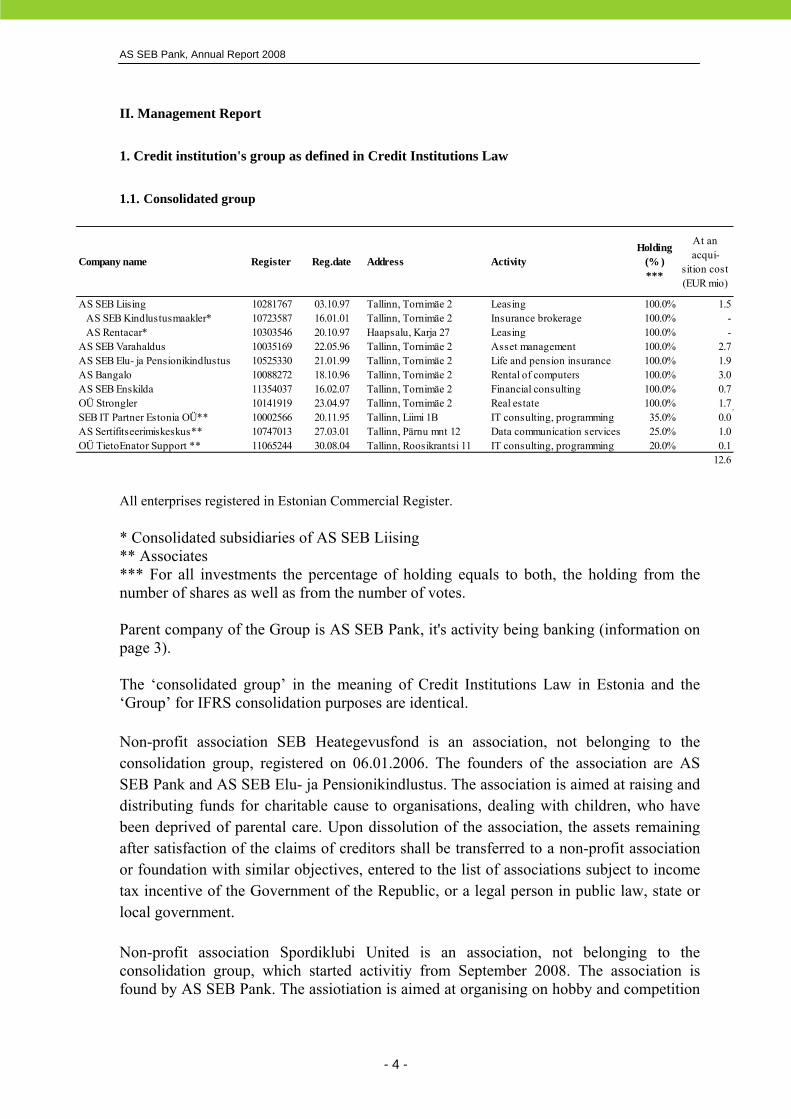
All enterprises registered in Estonian Commercial Register. * Consolidated subsidiaries of AS SEB Liising ** Associates *** For all investments the percentage of holding equals to both, the holding from the number of shares as well as from the number of votes. Parent company of the Group is AS SEB Pank, it's activity being banking (information on page 3). The ‘consolidated group’ in the meaning of Credit Institutions Law in Estonia and the ‘Group’ for IFRS consolidation purposes are identical. Non-profit association SEB Heategevusfond is an association, not belonging to the consolidation group, registered on 06.01.2006. The founders of the association are AS SEB Pank and AS SEB Elu- ja Pensionikindlustus. The association is aimed at raising and distributing funds for charitable cause to organisations, dealing with children, who have been deprived of parental care. Upon dissolution of the association, the assets remaining after satisfaction of the claims of creditors shall be transferred to a non-profit association or foundation with similar objectives, entered to the list of associations subject to income tax incentive of the Government of the Republic, or a legal person in public law, state or local government. Non-profit association Spordiklubi United is an association, not belonging to the consolidation group, which started activitiy from September 2008. The association is found by AS SEB Pank. The assiotiation is aimed at organising on hobby and competition
Company name Register Reg.date Address ActivityHolding
(% ) ***
At an acqui-
sition cost (EUR mio)
AS SEB Liising 10281767 03.10.97 Tallinn, Tornimäe 2 Leasing 100.0% 1.5 AS SEB Kindlustusmaakler* 10723587 16.01.01 Tallinn, Tornimäe 2 Insurance brokerage 100.0% - AS Rentacar* 10303546 20.10.97 Haapsalu, Karja 27 Leasing 100.0% -AS SEB Varahaldus 10035169 22.05.96 Tallinn, Tornimäe 2 Asset management 100.0% 2.7AS SEB Elu- ja Pensionikindlustus 10525330 21.01.99 Tallinn, Tornimäe 2 Life and pension insurance 100.0% 1.9AS Bangalo 10088272 18.10.96 Tallinn, Tornimäe 2 Rental of computers 100.0% 3.0AS SEB Enskilda 11354037 16.02.07 Tallinn, Tornimäe 2 Financial consulting 100.0% 0.7OÜ Strongler 10141919 23.04.97 Tallinn, Tornimäe 2 Real estate 100.0% 1.7SEB IT Partner Estonia OÜ** 10002566 20.11.95 Tallinn, Liimi 1B IT consulting, programming 35.0% 0.0AS Sertifitseerimiskeskus** 10747013 27.03.01 Tallinn, Pärnu mnt 12 Data communication services 25.0% 1.0OÜ TietoEnator Support ** 11065244 30.08.04 Tallinn, Roosikrantsi 11 IT consulting, programming 20.0% 0.1
12.6
AS SEB Pank, Annual Report 2008
- 5 -
level sport events and organising promotions for advertising of own and supporter´s activities. Upon dissolution of the association, the assets shall be transferred to a non-profit association, foundation or other persons filling the objects by articles in public interests. Changes in the consolidated group during the accounting period and plans for year 2009 In January HF Liisingu AS was liquidated, respective entry was made by Estonian Commercial Register on 31.01.2008. In June was sold a subsidary JSC SEB Leasing (Russian entity), which was moved in SEB Group to direct ownership by SEB AB. In June also was sold ownership in the associate Pankade Kaardikeskus AS (card centre), (Note 21). Recent volatility in global financial markets and impact on the Group's financial position of any further deterioration in the liquidity of the financial markets and the increased volatility in the currency and equity markets is described in Note 1.2. on page 16 and in Note 2 on pages 39-68. No such events or trends have occurred by the time of publishing the report, which would affect the strategy of the group in 2009. 1.2. Members of Management and Supervisory Board and shares held by them. Members of the Management Board: Ahti Asmann, Paulius Tarbūnas, Kristoffer Lindberg, Erki Pugal, Riho Unt. Members of the Supervisory Board: Bo Magnusson, Anders Arozin, Ainārs Ozols, Audrius Žiugžda, Ulf Pettersson. The members of AS SEB Pank Management and Supervisory Board and their confidants, as well as the commercial undertakings controlled jointly or severally by the mentioned persons did not hold any shares of AS SEB Pank as of 31.12.2008. 1.3. Strategy and organisation SEB Pank Group, a member of SEB Group, is an Estonian financial group that serves private individuals, companies and the public sector. The bank is a universal bank that offers its customers a wide range of financial services. SEB Group is a North European financial group for corporate customers, institutions and private individuals with 750 branch offices in Sweden, Germany, the Baltic States, Poland, Russia and Ukraine. SEB Group has more than 5 million customers, of whom approximately 2.2 million use the Internet for their banking transactions.

AS SEB Pank, Annual Report 2008
- 6 -
SEB Pank Group brings the vision of the SEB Group, which is to be the leading bank in Northern Europe based on long-term customer relationships, competence and technology, to life. The largest area of our operations is commercial banking and leasing. However, long-term saving products offered by retail banking, asset management and life insurance are with growing importance. Our operations are focused on Estonia. AS SEB Pank acts as a Centre of Excellence within the SEB Group for Asset Management activities concerning Eastern Europe. More than 800,000 customers of SEB Pank Group are served by approximately 1550 employees. The customers are served through many different channels, including our 60 branches, 202 online post offices, 350 ATMs and 6129 POS terminals. There are more than 500,000 debit and credit cards in use. In addition, more than 65% of our customers use our U-Net and U-Net Business services. Customer surveys during 2008 showed that we continue to have very satisfied customers. This is a key strength of our group, a strength that we are determined to maintain. AS SEB Pank is 100% owned by Scandinavian Enskilda Banken (SEB AB), which is a financial group with a remarkable history of business. We receive a lot of support from our parent company and SEB group companies in providing our customers with even better services. In many product/service areas our owner is the strongest bank in the Nordic arena – expertise that we can draw on to serve our customers. In addition, we receive strong support in controlling and managing our risks – something that is especially important given our country’s rapid development and the situation currently in the global financial markets. 2. Highlights Efficiency and development The number of the AS SEB Bank’s active customers grew by 17,500 individuals and 2,000 companies in 2008. Since 7 March 2008, AS SEB Eesti Ühispank has been rebranded and the bank now operates under the name AS SEB Pank. In January, AS SEB Pank successfully launched SEPA payments, becoming the only bank in Estonia to be a direct member of the pan-European clearing system. AS SEB Pank was the first bank in Estonia to gain approval from the Financial Supervisory Authority to use IRB (Internal Ratings Based Approach) and AMA (Advanced Measurement Approach) models for credit and operational risk management and measurement for capital requirements. AS SEB Pank, along with other major banks in Estonia, successfully completed the sale of the card payment processing company Pankade Kaardikeskus AS (PKK) to Northern European Transaction Services (NETS), see Note 21.

AS SEB Pank, Annual Report 2008
- 7 -
SEB group and the leading international insurance company Genworth Financials launched Payment Protection Insurance for private borrowers, which allows their loan obligations to be fulfilled even in the event that they involuntarily become unemployed or temporarily incapacitated as a result of an accident or illness. 2000 clients made use of this opportunity in 2008. Encouraged by the success of SME start packages, SEB group also launched package-based products for private individuals. In terms of pricing the more relevant banking products are free of charge for clients and there is just one fixed monthly fee instead of various bank charges. The packages have proven to be very popular and SEB group has attracted a number of new active customers; in fact 50% of package clients are completely new or previously passive clients. The packages have also boosted customer satisfaction since they make our banking services easier and simpler. By the end of 2008 more than 50,000 clients used package-based pricing. SEB Estonia (AS SEB Pank and his subsidiaries in Estonia) introduced a new service concept in September with a relationship agreement called the SEB Pension Plan. This new concept is something we believe will differentiate us from our main competitors, as we are the only bank in Estonia that provides a systematic overview of pension investments in all three pillars. The SEB Pension Plan attracted 10,000 customers within four months. In October SEB Estonia launched the new II pillar pension fund SEB Optimal Pension, which invests 75% of its assets in less risky instruments: bonds, money market instruments, deposits and other assets. More than 10,000 pensioners opened an account in AS SEB Pank in Q4 in order to obtain their retirement pay through the bank. Previously they received their pension through post offices. AS SEB Pank offered them a special bank card which provides discounts in 185 pharmacies across Estonia operated by AS SEB Pank’s partner Apteek1. The pharmacy discount bank card is the first of its kind in Estonia. SEB Estonia has effectively increased its market share among companies which are starting up. More than half of all newly established companies started their business with AS SEB Pank in 2008. Customer relations and customer satisfaction AS SEB Pank ranked third in an image profile survey carried out in 2008 by TNS Emor in Estonia, up one position on the previous survey. The survey covered 66 major companies in the country and measured their image based on people’s general attitude and perceived strength. The survey was conducted in April and was the eighth of its kind The latest customer satisfaction poll conducted by TNS Emor revealed that despite a difficult year on the financial market and for the world economy, private and corporate customer satisfaction is still highest with AS SEB Pank. The fact that AS SEB Pank’s customer relations are significantly stronger than the European average is also worthy of mentioning. Whereas in Europe the average customer satisfaction index for retail banking is 68, the corresponding index in AS SEB Pank is 77. 98% of our customers are satisfied with our services, and 93% would recommend AS SEB Pank and its services to their
AS SEB Pank, Annual Report 2008
- 8 -
friends and family. Our customers feel that the bank’s main strengths lie in staff competence; its ability to consider the customer’s interests; appealing customer service; and the bank’s good reputation. The Banker, the global financial magazine published by the Financial Times publishing group, selected AS SEB Pank as the best bank in Estonia in 2008 – the second year in a row that AS SEB Pank received the award. AS SEB Pank and AS SEB Enskilda were also recognised as the “Best Equity House in Estonia” by the pre-eminent international finance magazine Euromoney. The magazine highlighted AS SEB Enskilda’s roles in Estonia in the IPO of Arco Vara for €83M in June 2007 as well as the groundbreaking listing of Trigon Agri. In conclusion, Euromoney noted that “of the three banks operating in the Estonian IPO market in the past 12 months – AS SEB Enskilda, Suprema and UniCredit – the first is clearly the market leader.” In early 2009 the world’s leading magazine on securities services, Global Custodian, gave AS SEB Pank’s Custody Services the highest possible rating on the Estonian market – Top Rated, based on customer satisfaction surveys in 2008. Social responsibility and sponsorship AS SEB Pank supports Estonia’s leading business plan competition ‘Ajujaht’, which is designed to contribute to the creation of new knowledge-based companies and to boost the business skills of students and young scientists. 259 business ideas were submitted this year. These are transformed into business plans with the help of experts and perfected until the teams are ready to meet investors and take the idea to a successful launch. The competition will run until spring 2009. In 2008 the MTÜ SEB Heategevusfond (Charity Fund) conducted several campaigns to raise money to support children without parental care. Since the foundation of the fund in 2006 almost 0.6 million euros has been raised in support of children’s shelters and safe houses all over Estonia. Our aim is to provide children who have no parental care with more equal opportunities, allowing them to feel that they are on the same level as peers raised in conventional families, to be active and to broaden their horizons. The bank provides the fund with 0.1 million euros in support every year. To date over 6000 bank customers have joined us in our efforts and are making donations on a regular basis. The funds raised with the help of these good people have been used to organise various events for children – sports days, first aid courses, visits to the theatre and cinema and more. We have also distributed more than 1000 children’s books and bought sports equipment.

AS SEB Pank, Annual Report 2008
- 9 -
3. Key Figures2008 2007
Net profit, EURmio 49.0 129.5
Average equity, EURmio 540.5 452.3Return on equity (ROE), % 9.06 28.64
Average assets, EURmio 5,536.4 5,084.4Return on assets (ROA), % 0.88 2.55
Net interest income (excl. off-balance sheet transactions), EURmio 119.7 102.4Average interest earning assets, EURmio 5,235.2 4,768.2Net interest margin (NIM), % 2.29 2.15
Credit losses adjusted net interest income 71.5 91.4Average interest earning assets, EURmio 5,235.2 4,768.2Credit losses adjusted net interest margin (%) 1.37 1.92
Interest income (excl. off-balance sheet transactions), EURmio 319.1 265.7Average interest earning assets, EURmio 5,235.2 4,768.2Yield on interest earning assets, % 6.10 5.57
Interest expenses (excl. off-balance sheet transactions), EURmio 199.4 163.3Average interest bearing liabilities, EURmio 4,707.7 4,364.8Cost of interest bearing liabilities, % 4.24 3.74
SPREAD, % 1.86 1.83
Cost / Income ratio, % 43.0 39.2
Impaired NPL / gross portfolio, % 2.35 0.38
ExplanationsReturn on equity (ROE) = Net profit / Average equity * 100
Average equity = (equity of annual year + equity of previous year) / 2
Return on assets (ROA) = Net profit / Average assets * 100
Average assets = (assets of annual year + assets of previous year) / 2
SPREAD = Yield on interest earning assets - Cost of interest bearing liabilities
Cost / Income Ratio = Total Operating Expenses / Total Income * 100
Impaired NPL / gross portfolio = Impaired, non-performing loans, gross / Loans and advances to customerswithout allowances for doubtful debt * 100
Net interest margin (NIM) = Net interest income (excl. off-balance sheet transactions) / Average interest earningassets * 100
Yield on interest earning assets = Interest income (excl. off-balance sheet transactions) / Average interestearning assets *100
Cost of interest bearing liabilities = Interest expenses (excl. off-balance sheet transactions) / Average interestbearing liabilities *100
AS SEB Pank, Annual Report 2008
- 10 -
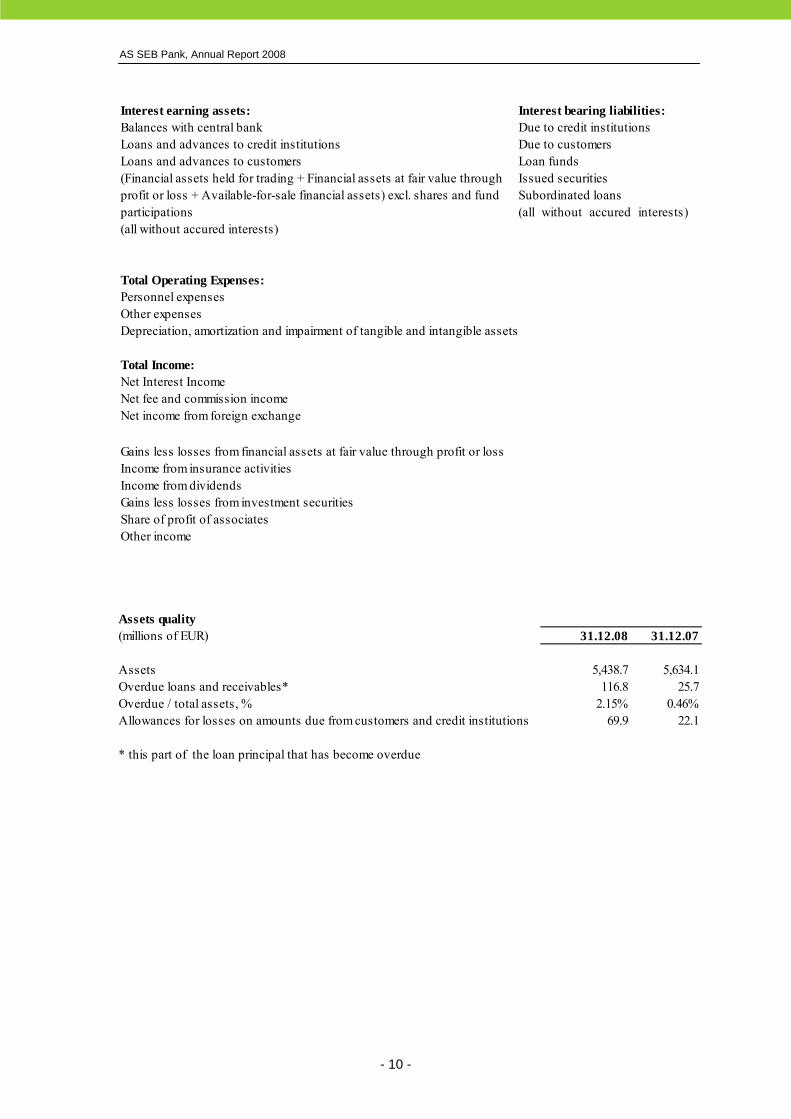
Interest earning assets: Interest bearing liabilities:Balances with central bank Due to credit institutionsLoans and advances to credit institutions Due to customersLoans and advances to customers Loan funds
(all without accured interests) (all without accured interests)
Total Operating Expenses:Personnel expensesOther expensesDepreciation, amortization and impairment of tangible and intangible assets
Total Income:Net Interest IncomeNet fee and commission incomeNet income from foreign exchange
Income from insurance activitiesIncome from dividendsGains less losses from investment securitiesShare of profit of associatesOther income
Gains less losses from financial assets at fair value through profit or loss
(Financial assets held for trading + Financial assets at fair value through profit or loss + Available-for-sale financial assets) excl. shares and fund participations
Issued securities __________ Subordinated loans (all_without_accured_interests)_
Assets quality(millions of EUR) 31.12.08 31.12.07
Assets 5,438.7 5,634.1Overdue loans and receivables* 116.8 25.7Overdue / total assets, % 2.15% 0.46%Allowances for losses on amounts due from customers and credit institutions 69.9 22.1
* this part of the loan principal that has become overdue

AS SEB Pank, Annual Report 2008
- 11 -
The notes on pages 15 - 95 are integral part of these consolidated financial statements.
III. Consolidated Financial Statements
1. Consolidated Income Statement(millions of EUR) Note 2008 2007
Interest and similar income 3 319.1 265.7Interest expenses and similar charges 4 -199.4 -163.3
Net Interest Income 119.7 102.4Fee and commission income 5 66.8 78.5Fee and commission expense 6 -20.3 -25.1
Net fee and commission income 46.5 53.4Net income from foreign exchange 7 8.6 10.3
8 -12.7 3.0
Income from insurance activities 9 -2.9 4.7
Income from dividends 1.9 0.0
21 9.5 1.0
21 0.1 0.7
Other income 1 0.9 35.1
Total income 171.6 210.6
Personnel expenses 11 -43.3 -44.1
Other expenses 12 -26.3 -22.4
22, 23 -4.2 -3.9Total expenses -73.8 -70.4
97.8 140.2
Impairment losses on loans and advances 13 -48.6 -9.7
Profit before income tax 49.2 130.5Income tax 14 -0.2 -1.0
Net profit 15 49.0 129.5
Attributable to the sole equity holder 49.0 129.5
Earnings per share (EUR per share) 33 0.05 0.12Diluted earnings per share (EUR per share) 33 0.05 0.12
Depreciation, amortization and impairment of tangible and intangible assets
Profit before impairment losses on loans and advances
Gains less losses from financial assets at fair value through profit or loss
Gains less losses from investment securities
Share of profit of associates
AS SEB Pank, Annual Report 2008
- 12 -
The notes on pages 15 - 95 are integral part of these consolidated financial statements.
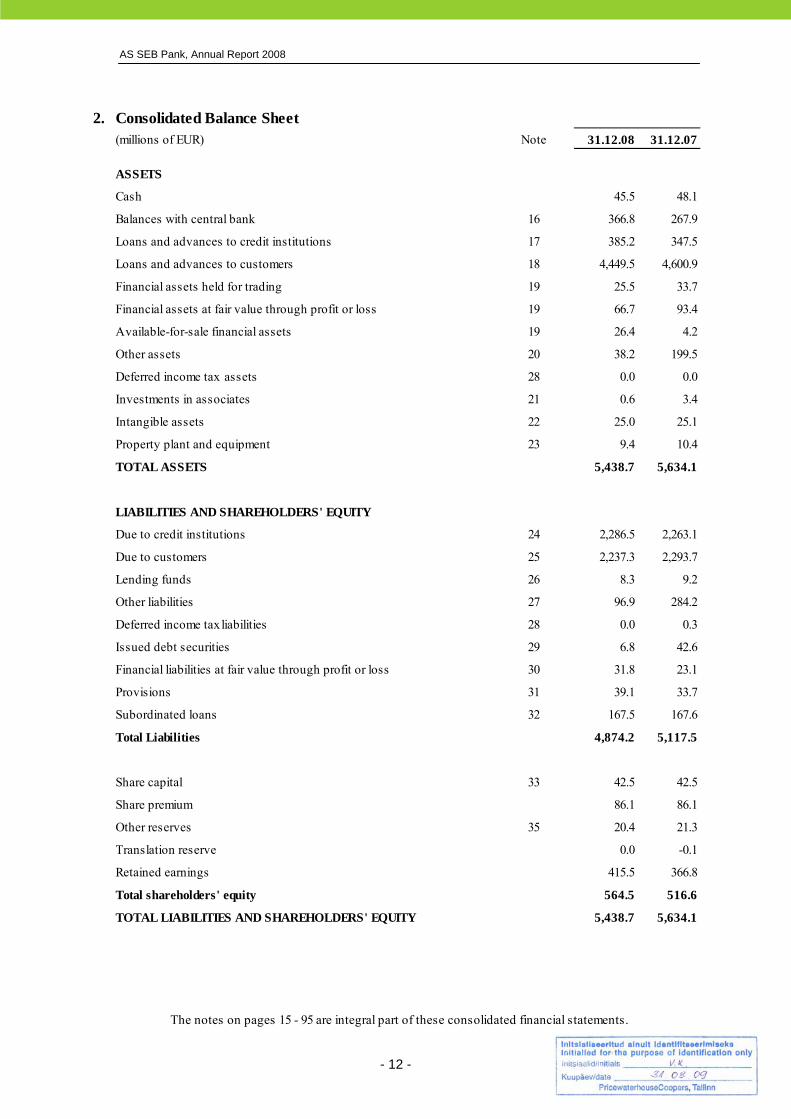
2. Consolidated Balance Sheet(millions of EUR) Note 31.12.08 31.12.07
ASSETS
Cash 45.5 48.1
Balances with central bank 16 366.8 267.9
Loans and advances to credit institutions 17 385.2 347.5
Loans and advances to customers 18 4,449.5 4,600.9
Financial assets held for trading 19 25.5 33.7
Financial assets at fair value through profit or loss 19 66.7 93.4
Available-for-sale financial assets 19 26.4 4.2
Other assets 20 38.2 199.5
Deferred income tax assets 28 0.0 0.0
Investments in associates 21 0.6 3.4
Intangible assets 22 25.0 25.1
Property plant and equipment 23 9.4 10.4
TOTAL ASSETS 5,438.7 5,634.1
LIABILITIES AND SHAREHOLDERS' EQUITY
Due to credit institutions 24 2,286.5 2,263.1
Due to customers 25 2,237.3 2,293.7
Lending funds 26 8.3 9.2
Other liabilities 27 96.9 284.2
Deferred income tax liabilities 28 0.0 0.3
Issued debt securities 29 6.8 42.6
Financial liabilities at fair value through profit or loss 30 31.8 23.1
Provisions 31 39.1 33.7
Subordinated loans 32 167.5 167.6
Total Liabilities 4,874.2 5,117.5
Share capital 33 42.5 42.5
Share premium 86.1 86.1
Other reserves 35 20.4 21.3
Translation reserve 0.0 -0.1
Retained earnings 415.5 366.8
Total shareholders' equity 564.5 516.6
TOTAL LIABILITIES AND SHAREHOLDERS' EQUITY 5,438.7 5,634.1
AS SEB Pank, Annual Report 2008
- 13 -
The notes on pages 15 - 95 are integral part of these consolidated financial statements.
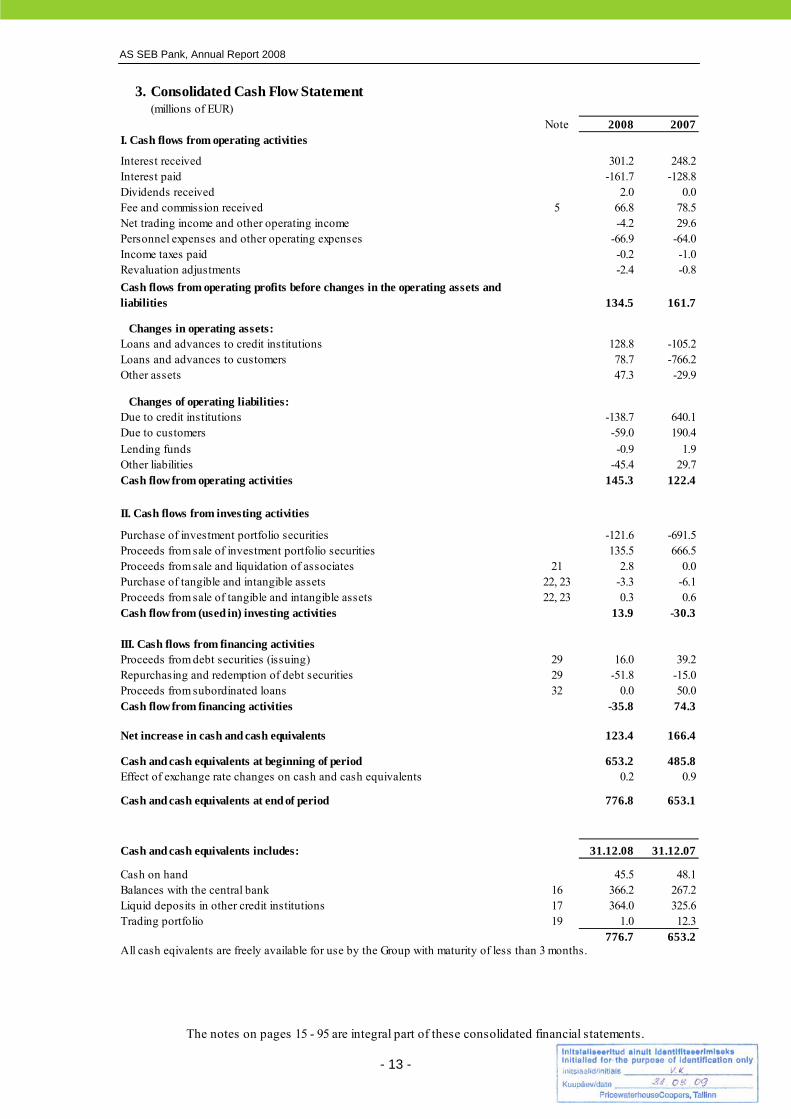
3. Consolidated Cash Flow Statement(millions of EUR)
Note 2008 2007I. Cash flows from operating activities
Interest received 301.2 248.2Interest paid -161.7 -128.8Dividends received 2.0 0.0Fee and commission received 5 66.8 78.5Net trading income and other operating income -4.2 29.6Personnel expenses and other operating expenses -66.9 -64.0Income taxes paid -0.2 -1.0Revaluation adjustments -2.4 -0.8
134.5 161.7
Changes in operating assets:Loans and advances to credit institutions 128.8 -105.2Loans and advances to customers 78.7 -766.2Other assets 47.3 -29.9
Changes of operating liabilities:Due to credit institutions -138.7 640.1Due to customers -59.0 190.4
-0.9 1.9Other liabilities -45.4 29.7Cash flow from operating activities 145.3 122.4
II. Cash flows from investing activities
Purchase of investment portfolio securities -121.6 -691.5Proceeds from sale of investment portfolio securities 135.5 666.5Proceeds from sale and liquidation of associates 21 2.8 0.0Purchase of tangible and intangible assets 22, 23 -3.3 -6.1Proceeds from sale of tangible and intangible assets 22, 23 0.3 0.6Cash flow from (used in) investing activities 13.9 -30.3
III. Cash flows from financing activitiesProceeds from debt securities (issuing) 29 16.0 39.2Repurchasing and redemption of debt securities 29 -51.8 -15.0Proceeds from subordinated loans 32 0.0 50.0Cash flow from financing activities -35.8 74.3
Net increase in cash and cash equivalents 123.4 166.4
Cash and cash equivalents at beginning of period 653.2 485.8Effect of exchange rate changes on cash and cash equivalents 0.2 0.9
Cash and cash equivalents at end of period 776.8 653.1
Cash and cash equivalents includes: 31.12.08 31.12.07
Cash on hand 45.5 48.1Balances with the central bank 16 366.2 267.2Liquid deposits in other credit institutions 17 364.0 325.6Trading portfolio 19 1.0 12.3
776.7 653.2All cash eqivalents are freely available for use by the Group with maturity of less than 3 months.
Cash flows from operating profits before changes in the operating assets and liabilities
Lending funds
AS SEB Pank, Annual Report 2008
- 14 -
The notes on pages 15 - 95 are integral part of these consolidated financial statements.
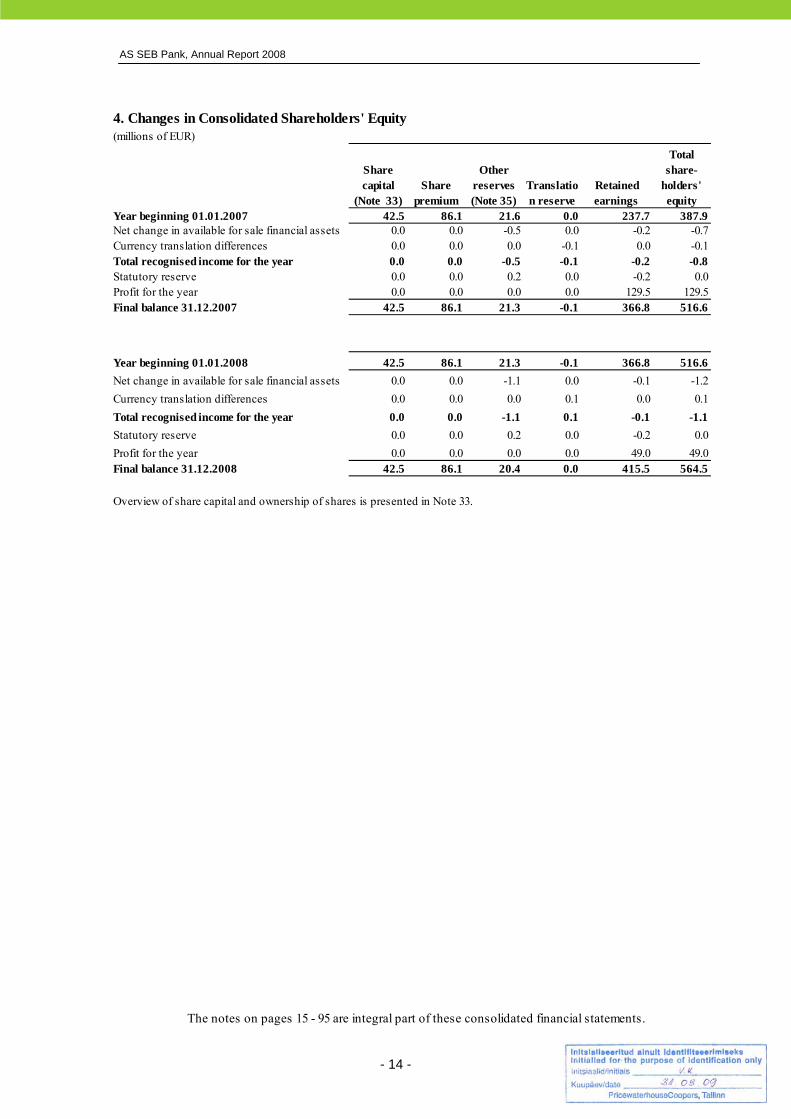
4. Changes in Consolidated Shareholders' Equity(millions of EUR)
Share capital
(Note 33)Share
premium
Other reserves (Note 35)
Translation reserve
Retained earnings
Total share-
holders' equity
Year beginning 01.01.2007 42.5 86.1 21.6 0.0 237.7 387.9Net change in available for sale financial assets 0.0 0.0 -0.5 0.0 -0.2 -0.7Currency translation differences 0.0 0.0 0.0 -0.1 0.0 -0.1Total recognised income for the year 0.0 0.0 -0.5 -0.1 -0.2 -0.8Statutory reserve 0.0 0.0 0.2 0.0 -0.2 0.0Profit for the year 0.0 0.0 0.0 0.0 129.5 129.5Final balance 31.12.2007 42.5 86.1 21.3 -0.1 366.8 516.6
Year beginning 01.01.2008 42.5 86.1 21.3 -0.1 366.8 516.6Net change in available for sale financial assets 0.0 0.0 -1.1 0.0 -0.1 -1.2Currency translation differences 0.0 0.0 0.0 0.1 0.0 0.1Total recognised income for the year 0.0 0.0 -1.1 0.1 -0.1 -1.1Statutory reserve 0.0 0.0 0.2 0.0 -0.2 0.0Profit for the year 0.0 0.0 0.0 0.0 49.0 49.0Final balance 31.12.2008 42.5 86.1 20.4 0.0 415.5 564.5
Overview of share capital and ownership of shares is presented in Note 33.

AS SEB Pank, Annual Report 2008
- 15 -
Note 1 ACCOUNTING PRINCIPLES AS SEB Pank (Reg. No. 10004252) is a credit institution registered in Tallinn (Estonia), Tornimäe Street 2, the sole shareholder of which is SEB AB, who is also the ultimate controlling party, registered in Sweden (Note 33). As at the end of year 2008 SEB Pank Group employed 1 562 people (2007 1 663). 1.1. Basis of preparation These consolidated financial statements of SEB Pank Group (the Group) are prepared in accordance with International Financial Reporting Standards (IFRS) as adopted by the EU. The principal accounting policies applied in the preparation of these consolidated financial statements are set out below. These policies have been consistently applied to all the years presented, unless otherwise stated. These financial statements have been prepared under the historical cost convention, except as disclosed in some of the accounting policies below (i.e. financial assets at fair value). Financial statements have been prepared according to accrual principle of accounting. The Group has prepared these financial statements based on the rules and regulations of the Stock Exchange which require from the issuer also the submission of the financial statements in Euros in addition to the financial statements prepared in Estonian kroons and in the Estonian language on the basis of the Accounting Act. All data in these consolidated financial statement are given in millions of Euros, unless specified otherwise. Estonian kroon is pegged against Euro at 1 EUR=15.6466 EEK. The Group has prepared the consolidated financial statement in Estonian kroons and in the Estonian language which is subject to submission to the Commercial Register. The financial statements prepared in Estonian kroons are available on the company’s website www.seb.ee. When the presentation or classification of items in the consolidated financial statements is amended, comparative amounts for the previous period are also reclassified, if not referred differently in specific accounting principle (Note 1.24). Certain new standards, amendments and interpretations to existing standards have been published by the time of compiling these financial statements that are mandatory for the company’s accounting periods beginning after 1 January 2008 or later periods. The overview of these standards and the Group management estimate of the potential impact of applying the new standards and interpretations is given at the end of this section (Note 1.25). Note 1.25 gives also overview of the new IFRS standards, amendments and interpretations that became effective for the first time for these financial statements and their effect them. 1.2. Critical accounting estimates and judgments The preparation of the consolidated financial statements in accordance with the International Financial Reporting Standards as adopted by the EU requires the use of

AS SEB Pank, Annual Report 2008
- 16 -
certain critical accounting estimates and assumptions that affect the reported amounts of assets and liabilities and disclosure of contingent assets and liabilities at the date of the financial statements and the reported amounts of revenues and expenses for the reporting period. Although these estimates are based on management’s best knowledge and judgement of current events and actions, the actual outcome and the results ultimately may significantly differ from those estimates. More detailed overview of the estimates made is provided under accounting principles or disclosures set out below. Critical estimates and judgement are specifically used in the following areas:
a) Impairment losses on loans and advances (Note 2.2) b) Fair value of financial assets and liabilities (Note 2.8 and Note 19) c) Impairment assessment for goodwill (Note 22)
Estimates and judgments are continually evaluated based on historical experience and other factors, including expectations of future events that are believed to be reasonable under the circumstances. Recent volatility in global financial markets. The ongoing global liquidity crisis which commenced in the middle of 2007 has resulted in, among other things, a lower level of capital market funding, lower liquidity levels across the banking sector, and, at times, higher interbank lending rates and very high volatility in stock markets. The uncertainties in the global financial markets have also led to bank failures and bank rescues in the United States of America, Western Europe, Russia and elsewhere. Indeed the full extent of the impact of the ongoing financial crisis is proving to be impossible to anticipate or completely guard against. Impact on customers/ borrowers. Borrowers of the Group may be affected by the lower liquidity situation and deteriorated general business environment which could in turn impact their ability to repay the amounts owed. Deteriorating operating conditions for borrowers may also have an impact on management's cash flow forecasts and assessment of the impairment of financial and non-financial assets. To the extent that information is available, management has put some industries under special observation has properly reflected revised estimates of expected future cash flows in its impairment assessments. Impact on collateral (especially real estate). The amount of provision for impaired loans is based on management's appraisals of these assets at the balance sheet date after taking into consideration the cash flows that may result from foreclosure less costs for obtaining and selling the collateral. The market in Estonia for many types of collateral, especially real estate, has been severely affected by the recent volatility in global financial markets resulting in there being a low level of liquidity for certain types of assets. Disappearance of an active market for quoted financial instruments. As a result of the recent volatility in financial markets there are no longer regularly occurring transactions on an arm's length basis for certain financial instrument quoted on capital and money market. Hence fair value as at 31.12.2008 of these instruments has been determined using a valuation technique. The objective of the valuation technique is to establish what the transaction price would have been on the reporting date in an arm's length exchange motivated by normal business considerations. Hence determining fair value requires consideration of current market conditions, including the relative liquidity

AS SEB Pank, Annual Report 2008
- 17 -
of the market and current credit spreads. The valuation technique used by management to determine fair value of fixed income instruments was discounted cash flow analysis (Note 1.6.2, 1.6.3). It is very complicated for management to reliably estimate the effects on the Group's financial position of any further deterioration in the liquidity of the financial markets and the increased volatility in the currency and equity markets. Management believes it is taking all the necessary measures to support the sustainability and growth of the Group’s business in the current circumstances." 1.3. Consolidation These consolidated financial statements of the SEB Pank Group comprise of the financial statements of the parent company AS SEB Pank and its subsidiaries as at 31 December 2008. The subsidiaries being consolidated are listed on page 4 (See table 1.1). In the group’s consolidated financial statements, the financial statements of the parent bank and its subsidiaries have been combined on a line-by-line basis. Intra-group balances and intra-group transactions and unrealized gains on transactions between group companies have been eliminated in full. Unrealized losses are also eliminated unless the transaction provides evidence of impairment of the asset transferred. All the subsidiaries that are controlled by AS SEB Pank have been consolidated. The accounts of the subsidiaries used for consolidation have been prepared in conformity with the accounting principles of the parent company. Subsidiaries
AS SEB Pank, Annual Report 2008
- 18 -
Associates Associate is an entity over which the Group has significant influence, but which it does not control. Generally, significant influence is presumed to exist when the Group holds between 20% and 50% of the voting rights. Investments in associates are initially recognized at cost. The Group’s investment in associates includes goodwill (net of any accumulated impairment loss) identified on acquisition (Note 1.8). Investments in associates are accounted for under the equity method of accounting. Under this method, the investment in Group financial statements is increased by the share of post-acquisition profit and reduced by the share of loss or distribution of profit received from the associated company and attributable to the Group and any goodwill impairment. The Group’s share of post-acquisition movements in reserves is recognized in reserves. When the Group’s share of losses in an associate equals or exceeds its interest in the associate, including any other unsecured receivables, the Group does not recognize further losses, unless it has incurred obligations or made payments on behalf of the associate. Unrealized gains on transactions between the Group and its associates are eliminated to the extent of the Group’s interest in the associates. Unrealized losses are also eliminated unless the transaction provides evidence of an impairment of the asset transferred. Accounting policies have been changed where necessary to ensure consistency with the policies adopted by the Group. Parent company separate financial statements – primary statements In the parent separate primary financial statements, disclosed to these consolidated financial statements (see Note 40), the investments into the shares of subsidiaries and associated companies are accounted for at cost less any impairment recognized. 1.4. Foreign currency transactions and assets and liabilities denominated in a foreign currency Functional currency The financial statements of the Group companies have been prepared using the currency (functional currency) which best reflects the company’s economic environment. The functional currency of the parent company and the subsidiary companies registered in Estonia is Estonian kroon. The consolidated financial statements have been presented in millions of Euros, which is the presentation currency of these consolidated financial statement. As Estonian kroon is pegged against Euro at 1 EUR=15.6466 EEK since the introduction of Euro, there are no exchange rate differences due to the conversion of financial statements into Euros. Foreign currency transactions Foreign currency transactions have been presented in Euros and are based on foreign currency exchange rates of the Bank of Estonia (Central Bank) prevailing on the transaction date. In the case of differences in the exchange rates prevailing at the time of the transfer of cash (i.e. settlement) and on the transaction date, the exchange rate differences are recorded in the income statement under the line “Net income from foreign exchange”.

AS SEB Pank, Annual Report 2008
- 19 -
Assets and liabilities denominated in foreign currencies Monetary assets and liabilities and non-monetary assets and liabilities valued at fair value and denominated in foreign currencies have been translated into Estonian kroons based on the foreign currency exchange rates of the Bank of Estonia prevailing on the balance sheet date. Gains and losses on translation form monetary assets and liabilities are recorded in the income statement under the line “Net income from foreign exchange”. Changes in the fair value of monetary securities denominated in foreign currency classified as available- for-sale are analyzed between translation differences resulting from changes in the amortized cost of the security and other changes in the carrying amount of the security. Translation differences related to changes in the amortized cost are recognized in profit or loss as “Net income from foreign exchange", and other changes in the carrying amount are recognized in fair value reserve in equity. Translation differences on non-monetary items, such as equities held at fair value through profit or loss, are reported as part of the fair value gain or loss on line “Gains less losses from financial assets at fair value through profit or loss”. Translation differences on non-monetary items, such as equities classified as available-for-sale financial assets, are included in the fair value reserve in equity. Group companies The results and financial position of all the Group entities (none of which has the currency of a hyperinflationary economy) that have a functional currency different from the presentation currency are translated into the presentation currency. Income statements and cash flows of foreign entities are translated into Estonian kroons at average exchange rates (unless this average is not a reasonable approximation of the cumulative effect of the rates prevailing on the transaction dates, in which case income and expenses are translated at the dates of the transactions) for the year and their balance sheets are translated at the exchange rates ruling on 31 December, the balance sheet date. Unrealized exchange differences arising from the translation are taken to a separate account in shareholders’ equity. When a foreign entity is sold (or part of it is sold), such exchange differences are recognized in the income statement as part of the gain or loss on sale. 1.5. Cash and cash equivalents For the purposes of the cash flow statement, cash and cash equivalents are cash at hand, available for use deposits due from Central Bank and readily available deposits in other credit institutions and also less than 3-month maturity liquid securities acquired for trading purpose or decided to be recognized at fair value through profit or loss at inception. 1.6. Financial assets Financial assets are any assets that are cash, a contractual right to receive cash or another financial asset from another enterprise, a contractual right to exchange financial instruments with another enterprise under conditions that are potentially favourable or an equity instrument of another enterprise. The Group classifies its financial assets in the following categories: 1.6.1. loans and receivables, 1.6.2. financial assets at fair value through profit or loss, 1.6.3. available for sale financial assets. Management determines the classification of its investments at initial recognition. The Group has not classified any financial assets to the Group “held to maturity”.
AS SEB Pank, Annual Report 2008
- 20 -
1.6.1. Loans and receivables Loans and receivables Loans and receivables are non-derivative financial assets with fixed or determinable payments that are not quoted in an active market. They arise when the Group provides money, goods or services directly to a debtor with no intention of trading the resulting receivable. Loans and receivables are recognized in the balance sheet when the cash is paid to the borrower or right to demand payment has arisen and are derecognized only when they are repaid or written-off, regardless of the fact that part of them may be recognized as costs through providing allowances for loans. The loan allowances are presented on the respective balance sheet line at negative value. Loans have been recognized in the balance sheet at amortized cost using the effective interest rate method. Accrued interest on the loans and not yet collected is recorded in the respective balance sheet line. For overdrafts and credit cards, the actual use of the limit by the borrower is stated in the balance sheet. The unused credit limit is recognized as contingent (off-balance sheet) commitment. Repurchase agreements Securities purchased under agreements to resell (‘reverse repos’) are recorded as loans and advances to other banks or customers, as appropriate. The difference between sale and repurchase price is treated as interest and accrued over the life of the agreements using the effective interest method. Securities lent to counterparties are also retained in the financial statements. Leasing receivables Financial lease claims include receivables from financial lease, consumer factoring and installment sale and agreements of payments. A financial lease is a lease transaction where all major risks and rights deriving from the use of the leased assets are transferred from the leasing firm to the lessee. Legal ownership to the property may be transferred to the lessee at the end of the lease period. The receivables from the financial lease agreements are recognized in net present value of the minimum lease payments, from which the payments of principal received have been deducted, plus unguaranteed residual value at the end of contract. Lease payments collected are allocated between repayment of principal and financial income. Financial income is recognized over the rental period based on the pattern reflecting a constant periodic rate of return on the lessor’s net investment in the finance lease. Initial service fees collected at issuance are included into the calculation of effective interest rate and lessor’s net investment. Lessor’s direct expenses, related to the contract, are part of effective interest rate and are booked as decrease of leasing income over the period of leasing contract. Allowances for lease receivables are presented on the respective balance sheet line at negative value. The lease receivable to the client is recognized in the balance sheet as of the moment of delivering the assets being the object of the agreement to the client. In case of transactions, in which the assets being the object of the agreement having a long delivery term have not yet been delivered to the client, the payments received from the lessees under these agreements are recognized in the balance sheet as prepayments of buyers under “accrued

AS SEB Pank, Annual Report 2008
- 21 -
expenses and deferred income”. The amounts paid by the leasing firm for the assets under lease agreements not yet delivered are recognized in the balance sheet as prepayments to suppliers under “accrued income and prepaid expenses”. Factoring and warehouse receipt financing receivables Factoring transactions are considered to be financing transactions where the leasing firm provides the financial resources to its selling partners through transfer of the rights to the receivables from these sales transactions. The leasing firm acquires the right for the receivables payable by the buyer subject to the sales contract. Factoring is the transfer of receivables. Depending on the terms of the factoring contract the buyer either accepts the transfer of substantially all the risks and rewards of the ownership of the receivable (non-recourse factoring) or retains the right to transfer the risks and rewards back to the seller during a pre-specified term (recourse factoring). Transaction is booked as financing in case the leasing company does not own all the rights related to claim. The claim is booked in balance until payment is received or recourse is expired. If contract does not include seller´s guarantee and leasing company acquires control of all rights at the moment of selling the claim, the transactions is booked as acquire of claim in fair value. Later on it is booked in acquisition cost. Derecognition of factoring assets and liabilities follows the regulation in IAS 39 and the assessment is made based on each specific agreement type and status. Warehouse receipt financing transactions are financing transactions, where the lease firm finances its partners, by granting them a loan against pledged stock reserves. Factoring and warehouse receipt financing receivables are recorded in the balance sheet at amortized cost, from which the payments of principal claim collected have been deducted. Allowances for factoring receivables are presented on the respective balance sheet line at negative value. The receivable to the client is recognized as of the moment of factoring the purchase-sale agreement, i.e. as of assuming the receivable. Valuation of loans and receivables The Group assesses consistently whether there is objective evidence that a financial asset or group of financial assets is impaired. A financial asset or a group of financial assets is impaired and impairment losses are incurred only if there is objective evidence of impairment as a result of one or more events that occurred after the initial recognition of the asset (a ‘loss event’) and that loss event (or events) has an impact on the estimated future cash flows of the financial asset or group of financial assets that can be reliably estimated. For valuation of loans and receivables several risks are prudently considered. AS SEB Pank introduced a customer rating system for evaluating corporate loans, corresponding to the principles used in SEB AB, the parent bank of AS SEB Pank. Valuation of the customer receivables is based on the client’s company’s financial position, situation of the industry, trustworthiness of the borrower, competence of the management of the client, timely fulfillment of contractual obligations and other factors, all of which together help to assess the value of the receivable and the amount of incurred loss in the portfolio of loans. Valuation of loans to private individuals is based on timely fulfillment of contractual
AS SEB Pank, Annual Report 2008
- 22 -
obligations, solvency and collateral, age, educational status, length of employment, saving practices and other factors, affecting the credit risk. The Group first assesses whether objective evidence of impairment exists individually for financial assets that are individually significant, and individually or collectively for financial assets that are not individually significant. If the Group determines that no objective evidence of impairment exists for an individually assessed financial asset, whether significant or not, it includes the asset in a group of financial assets with similar credit risk characteristics and collectively assesses them for impairment. Assets that are individually assessed for impairment and for which an impairment loss is or continues to be recognized are not included in a collective assessment of impairment. For the purposes of a collective evaluation of impairment, financial assets are grouped on the basis of similar credit risk characteristics (ie, on the basis of the Group’s grading process that considers asset type, industry, collateral type, past-due status and other relevant factors). Those characteristics are relevant to the estimation of future cash flows for groups of such assets. Future cash flows in a group of financial assets that are collectively evaluated for impairment are estimated on the basis of the contractual cash flows of the assets in the Group and historical loss experience for assets with credit risk characteristics similar to those in the Group. Historical loss experience is adjusted on the basis of current observable data to reflect the effects of current conditions that did not affect the period on which the historical loss experience is based and to remove the effects of conditions in the historical period that do not currently exist. The methodology and assumptions used for estimating future cash flows are reviewed regularly by the Group to reduce any differences between loss estimates and actual loss experience. For assessment of loan losses, the expected collections from the loan and interest payments over the coming periods are considered, as well as expected collections and anticipated proceeds from the realization of collateral, discounted at the financial asset’s original effective interest rate (excluding future credit losses that have not been incurred), which together form a recoverable amount of the loan and help to assess the amount of loss incurred of the loan. The amount of the loss is measured as the difference between the asset’s carrying amount and the present value of estimated future cash flows (recoverable amount). For these assessed incurred loan losses, the relevant allowance has been established. The carrying amount of the asset is reduced through the use of an allowance account and the amount of the loss is recognized in the income statement. Specific and collective (based on incurred loss estimation on the group basis) allowances are provided for individually assessed loans, and group based allowances for homogenous loan groups. If, in a subsequent period, the amount of the impairment loss decreases and the decrease can be related objectively to an event occurring after the impairment was recognized (such as an improvement in the debtor’s credit rating), the previously recognized impairment loss is reversed by adjusting the allowance account. The amount of the reversal is recognized in the income statement in "Impairment losses on loans and advances". When a loan is uncollectible, it is written off against the related allowance for loan impairment. Such loans are written off after all the necessary procedures have been completed and the amount of the loss has been determined.

AS SEB Pank, Annual Report 2008
- 23 -
Loans that are either subject to collective impairment assessment or individually significant and whose terms have been renegotiated are no longer considered to be past due but are treated as normal loans. More detailed overview of the credit risk management principles is given in Note 2 “Risk policy and management” (see page 39). Interest income on loans is presented on the income statement under "Interest and similar income". 1.6.2. Financial assets at fair value through profit or loss Financial assets at fair value through profit or loss include: • financial assets held for trading • financial assets designated at fair value through profit or loss at inception Financial assets held for trading This group of financial assets includes securities acquired or incurred principally for the purpose of selling or repurchasing in the near term or if it is part of a portfolio of identified financial instruments that are managed together and for which there is evidence of a recent actual pattern of short-term profit-taking, and derivatives. Securities acquired or incurred principally for the purpose of selling or repurchasing in the near term This group includes shares and bonds acquired for trading purpose. Trading securities are initially recognized at fair value excluding transaction costs on the trade date and are subsequently presented in fair value. The fair value of held for trading securities quoted on an active market are based on current mid prices, because trading portfolio is maintained only to enable client trading and assets and liabilities to have an offsetting market risk. The shares and debt securities not actively traded on an active market are valued in fair value according to the last quotation from an acknowledged provider with a presumption that there have been regular quotations available for the shares/debt securities and the price volatility has been in normal range for similar instruments. If the price is not available from quotations or there is no sufficient regularity of the quotations or the volatility of the instrument price quotations is outside the normal range, the shares/debt securities are revaluated into fair value based on all available information regarding the issuer to benchmark the financial instrument price against similar instruments available on active market to determine the fair value. For held for trading debt securities, for which the quoted prices from an active market are not available, cash flows are discounted at market interest rates, issuer's risk added. For fund participations (units) NAV bid quotation is used for fair value assessment. In any case, if the market for a financial asset is not active, the Group establishes fair value by using valuation techniques. These include the use of recent arm’s length transactions, discounted cash flow analysis, and other valuation techniques commonly used by market participants.

AS SEB Pank, Annual Report 2008
- 24 -
The unrealized and realized result of the trading securities is recorded in income statement under "Gains less losses from financial assets at fair value through profit or loss ". Dividend income from financial assets that are classified as held for trading, is recognized in income statement on line "Gains less losses from financial assets at fair value through profit or loss" when the entity’s right to receive payment is established. Derivatives Derivatives (forward-, swap- and option transactions) are initially recognized at fair value excluding transaction costs on the trade date and are subsequently presented at fair value. If derivatives are quoted on an active market, market value is used as a fair value. If not, the valuation techniques are used to find the fair value. These transactions are booked in balance sheet as assets, if their fair value is positive and as liabilities, if the fair value is negative. The fair values of derivative assets and liabilities recorded in balance sheet are not netted. The Group does not apply hedge accounting principles for the accounting of derivative financial instruments. In valuation of currency derivatives (excl. currency options), future cash flows are discounted using market interest rates. Currency and equity options are revalued to market value, if active market exists. If a reliable market value can not be obtained, the fair value of options is calculated by using the Black-Scholes model. Currency forward and swap transactions are valued by discounting future cash flows using market interest rate. Respective interest income and the realized profit and unrealized gain/loss from the revaluation of derivatives are recorded in the income statement under "Gains less losses from financial assets at fair value through profit or loss". Financial assets designated at fair value through profit or loss at inception In this class of securities are classified securities where the company has upon initial recognition designated the securities to be recorded as at fair value through profit or loss and as a result the changes in the fair value of these securities are consistently recognized in the profit or loss of the reporting period. In the current reporting period this class of securities included the portfolio of investments acquired and held to cover the insurance and investment contracts concluded by the life insurance company belonging to the group. The realized and unrealized result from the revaluation of these securities is recorded in the income statement under “Income from insurance activities”. Interest income on these instruments are recognized in income statement under “Interest and similar income”. The realized and unrealized result from the revaluation of these securities is recorded in the income statement under “Gains less losses from financial assets at fair value through profit or loss”. 1.6.3. Available-for-sale financial assets Securities are classified as available-for-sale financial assets, if they do not belong to one of the aforementioned categories: financial assets held for trading or other financial assets designated at fair value through profit or loss. Available-for-sale investments are intended to be held for an indefinite period of time, which may be sold in response to needs for
AS SEB Pank, Annual Report 2008
- 25 -
liquidity or changes in interest rates, exchange rates or equity prices; or investments with strategic purpose for long-term holding. Available-for-sale financial assets are recorded at fair value plus transaction costs on their settlement date. Subsequently they are carried at fair value. If the assessment of fair value is not reliable, the securities will be presented at amortized cost (i.e. original acquisition cost less possible write-downs for impairment). The gains and losses arising from changes in the fair value of available for sale financial assets are recognized directly in equity under “revaluation reserve”. The Group assesses consistently whether there is objective evidence that a financial asset available-for-sale is impaired. In the case of equity investments classified as available-for- sale, a significant or prolonged decline in the fair value of the security below its cost is considered in determining whether the assets are impaired. Debt instrument is considered to be impaired when there is a change in expected cash flows to be collected from the instrument. If any such evidence exists for available-for-sale financial assets, the cumulative loss – measured as the difference between the acquisition cost and the current fair value, less any impairment loss on that financial asset previously recognized in profit or loss – is removed from equity and recognized in the income statement. Impairment losses recognized in the income statement on equity instruments are not reversed through the income statement. If, in a subsequent period, the fair value of a debt instrument classified as available-for-sale increases and the increase can be objectively related to an event occurring after the impairment loss was recognized in profit or loss, the impairment loss is reversed through the income statement. When the financial asset is derecognized the cumulative gain previously recognized in equity on that specific instrument is to the extent reversed from equity and the remaining portion is recognized in income statement under "Gains less losses from investment securities". Interest calculated using the effective interest method and foreign currency gains and losses on monetary assets classified as available for sale are recognized in the income statement. Dividends on available-for-sale equity instruments are recognized in the income statement when the entity’s right to receive payment is established. 1.7. Offsetting financial instruments Financial assets and liabilities are offset and the net amount reported in the balance sheet only, when there is a legally enforceable right to offset and there is an intention to settle on net basis or realize the asset and settle the liability simultaneously. 1.8. Tangible and intangible assets other than goodwill Land, buildings, IT equipment, office equipment and other assets of long-term use are recognized in the balance sheet as tangible non-current assets. Intangible assets are identifiable, non-monetary assets without physical substance and currently comprise of acquired software.
AS SEB Pank, Annual Report 2008
- 26 -
Tangible non-current assets and intangible assets are initially recognized at acquisition cost, consisting of the purchase price, nonrefundable taxes and other direct costs related to taking the asset into use. The subsequent expenditure of an item of property, plant and equipment shall be recognized as an asset if these are in accordance with definition of fixed assets and if it is probable that future economic benefits associated with the item will flow to the entity All other repairs and maintenance are charged to other operating expenses during the financial period in which they are incurred. Tangible non-current assets and intangible assets with finite useful lives are subsequently stated at historical cost less depreciation/amortization and any impairment losses. Depreciation/amortization is calculated starting from the month of acquisition until the carrying value reaches the residual value of the asset or if that is considered being insignificant the asset is fully depreciated. For assets having a substantial residual value, only the difference between the acquisition cost and the residual value is depreciated to expense over the useful lifetime of the asset. Assets are depreciated/amortized on straight-line-basis. Depreciation/amortization calculation is based on useful life of the asset, which serves as basis for forming the depreciation/amortization rates. Buildings are depreciated over 20-50 years, intangible assets with limited lifetime are amortized over 3-5 years, and other non-current tangible assets are depreciated over 3-7 years. Land is not depreciated and intangible assets with indefinite useful life are not amortized. The appropriateness of depreciation/amortization rates, methods and residual values are each reporting date assessed. Depreciation, amortization and impairment is recorded in the income statement under "Depreciation, amortization and impairment losses of tangible and intangible assets". Gains and losses on disposals are determined by comparing proceeds with carrying amount. These are included in other operating income / expenses in the income statement. Capitalization of expenses Reconstruction expenditures of bank offices are capitalized as tangible assets and are subsequently charged to the income statement on a straight-line basis over five years (termless contracts) or over the period of the lease. Development Costs Costs associated with developing or maintaining computer software programs are recognized as an expense as incurred. Advertising expenses and the expenses for launching of new products, services and processes are recognized as an expense as incurred. Expenditures related to trademarks etc., developed by the company itself, are also recorded as expense as incurred.
AS SEB Pank, Annual Report 2008
- 27 -
1.9. Goodwill Goodwill represents the excess of the cost of an acquisition over the fair value of the company’s share of the net assets acquired at the date of acquisition, reflecting the part of the acquisition cost that was paid for the assets that are not separately identifiable for the balance sheet purposes. Goodwill acquired from acquisition of a subsidiary is recorded in balance sheet as an intangible asset on a separate line. Goodwill acquired from acquisition of an associate is included in the cost of an associate in the balance sheet. (Note 1.3.) Goodwill is recorded in the balance sheet at the date of acquisition. Subsequently goodwill is recorded in its historical cost less any impairment losses recognized. Goodwill arising from business combinations is not depreciated. Goodwill is instead tested annually (or more frequently if events or changes in circumstances indicate that the impairment may have incurred) for impairment by comparing the carrying amount of the goodwill to its recoverable amount. Goodwill is allocated to cash-generating units for the purpose of impairment testing and the recoverable amount is determined by discounting the expected cash flows of the relevant cash generating unit. An impairment loss is recognized for the amount by which the carrying amount of the goodwill exceeds its recoverable amount. Gains and losses on the disposal of an entity include the carrying amount of goodwill relating to the entity sold. 1.10. Non-financial assets held for sale Assets held for sale are tangible or intangible assets, for which the management has commenced active sales activities and the assets are offered for sale at a reasonable price compared to their fair value, and where it is reasonably expected that these assets will be disposed within 12 months. Assets are classified as assets held for sale and stated at the lower of carrying amount and fair value less costs to sell if their carrying amount is expected to be recovered principally through a sale transaction rather than through a continuing use. Depreciation calculation is terminated for the assets held for sale. Assets held for sale are recorded in balance sheet under “other assets”. 1.11. Impairment of non-financial assets Assets with an indefinite useful life are not subject to amortization and are tested annually for impairment, comparing the carrying value of the asset to its recoverable value. Assets that are subject to amortization/depreciation are reviewed for impairment whenever events or changes in circumstances indicate that the carrying amount may not be recoverable. In such circumstances the recoverable value of the asset is assessed and compared to its carrying value. An impairment loss is recognized for the amount by which the asset’s carrying amount exceeds its recoverable amount. The recoverable amount is the higher of an asset’s fair value less costs to sell and value in use. For the purposes of assessing impairment, assets are grouped at the lowest levels for which there are separately identifiable cash flows (cash-generating units). Non-financial assets other than goodwill that suffered impairment are reviewed for possible reversal of the impairment at each reporting date.
AS SEB Pank, Annual Report 2008
- 28 -
1.12. Leases – the group is the lessee Leases of assets where the lessee acquires substantially all the risks and rewards of ownership are classified as finance leases. Other leases are classified as operating leases. Finance leases are capitalized at the inception of the lease at the lower of the fair value of the leased property or the present value of the minimum lease payments. Each lease payment is allocated between the repayment of a liability and finance charges (interest expense). The interest element of the finance cost is charged to the income statement over the lease period so as to produce a constant periodic rate of interest on the remaining balance of the liability for each period (effective interest rate method). Tangible non-current assets acquired under finance leases are depreciated similarly to acquired assets over the shorter of the useful life of the asset or the lease term. Operating lease payments are recognized in income statement as expense over the rental period on straight line basis. The Group uses operating lease mainly for renting the buildings / premises. Rental expense is recognized in income statement as “other expenses”. 1.13. Financial liabilities Customer Deposits Deposits are recognized in the balance sheet on their settlement date at fair value net of transaction costs and are subsequently measured at amortized cost using effective interest rate method and recorded on line “due to customers”, accrued interests is presented under a respective line in liabilities. Interest expenses are recorded in the income statement under "Interest expenses and similar charges". Borrowings and issued securities Borrowings and issued securities are recognized initially at fair value net of transaction costs (the proceeds received, net of transaction costs incurred). Borrowings and issued securities are subsequently stated at amortized cost using the effective interest rate method; any difference between proceeds (net of transaction costs) and the redemption value is recognized in the income statement over the period of the instrument using effective interest rate. The effective interest rate is the rate that exactly discounts the expected stream of future cash payments through maturity. The amortization of the transaction costs is presented in the income statement together with the interest expenses. The respective interest expenses are recorded in the income statement under "Interest expenses and similar charges". In case there is an unused limit for any borrowings, this is presented as contingent asset. Financial liabilities of an investment contract The life insurance company issues two types of investment contracts: unit-linked investment contracts and investment contracts with guaranteed interest. Unit-linked investment contracts are financial liabilities, the fair value of which depends on certain underlying financial asset. The financial liabilities of unit-linked contracts are at
AS SEB Pank, Annual Report 2008
- 29 -
their initial recognition classified into group “at fair value through profit or loss”. The company has classified the said liabilities into the group “at fair value through profit or loss”, since this eliminates or reduces significantly the asset and liability mismatch, which would occur, if profit and loss from the given assets and liabilities are calculated based on different principles. For investment contracts with guaranteed interest, the amortized cost method is used for measurement. The financial liability comprises payments received from contracts and interest credited to the contracts, less administration fees and risk covers accounted for the past period. The annual guaranteed interest rate on these contracts remains between 3% and 4%, depending on the type of contract, time of conclusion and the currency of the specific contract. Depending on the type of contract, the interest rate is guaranteed either until maturity or for 5 years from conclusion of the contract, thereafter it may be adjusted. The financial liability also includes the amounts of bonuses assigned to the policyholders for the previous accounting years and estimated bonuses for reporting year. 1.14. Embedded derivatives Embedded derivatives are usually separated from the host contract and accounted for in the same way as other derivatives (Note 1.6.2.). Embedded derivatives are not separated, if their economic characteristics and risks are closely related to the economic characteristics and risks of the host contract. However, in some circumstances also not closely related embedded derivatives may be not separated. Some combined instruments (for example structured bonds), i.e. contracts that contain one or more embedded derivatives, are classified as a financial asset or financial liability at fair value through profit or loss. This choice means that the whole combined instrument is valued at fair value and that changes in fair value are recognized in profit or loss. Other type of combined instruments (for example index linked deposits) are separated, so that host contract is recognized as deposit and measured at amortized cost using effective interest rate method, and embedded derivatives are recognized and measured at fair value. 1.15. Financial Guarantee contracts Financial guarantee contracts are contracts that require the issuer to make specified payments to reimburse the holder for a loss it incurs because a specified debtor fails to make payments when due, in accordance with the terms of a debt instrument. Such financial guarantees are given to banks, financial institutions, companies and other bodies on behalf of customers to secure loans, other banking facilities and liabilities to other parties. Financial guarantees are initially recognized in the financial statements at fair value (contract value) on the date the guarantee was given. Subsequent to initial recognition, the bank’s liabilities under such guarantees are recognized at the outstanding value of guarantee. In the income statement the fee income earned on a guarantee is recognized straight line basis over the life of the guarantee. The amounts disbursed to settle the guarantee obligation are recognized in the balance sheet on the date it becomes evident that the guarantee is to be disbursed.
AS SEB Pank, Annual Report 2008
- 30 -
1.16. Provisions Provisions are recognized when the company has a present legal or constructive obligation as a result of past events, it is probable that an outflow of resources will be required to settle the obligation, and a reliable estimate of the amount can be made. The provisions are recognized based on the management’s estimates regarding the amount and timing of the expected outflows. When it is probable that the provision is expected to realise later than 12 months after the balance sheet date it is recorded at discounted value (present value of expected outflows), unless the discounting effect is immaterial. Expense from provisions and from change in carrying value of provisions is recorded in the income statement for the period. Liabilities from insurance contracts Liability from insurance contracts consists of life insurance technical provision, bonus provision and provision for outstanding claims. Life insurance provision Life insurance provision in the balance sheet includes liabilities from insurance contracts to the policyholders calculated on basis of actuarial methods, and the unearned premiums’ provision arising from transfer of the risk premium to the following accounting periods. The provision is determined as the sum of the expected discounted value of the benefit payments and the future administration expenses that are directly related to the contract, less the expected discounted value of the theoretical premiums that would be required to meet the benefits and administration expenses based on the valuation assumptions used (the valuation premiums). The liability is based on assumptions as to mortality, persistency, maintenance expenses and investment income that are established at the time the contract is issued. A margin for adverse deviations is included in the assumptions. The annual interest rate on these contracts remains between 2.5% and 4%, depending on the type of contract, time of conclusion and the currency of the specific contract. Acquisition costs are not deferred under the life insurance provision. As a result, provisions with negative value are not reported in balance sheet and the profit from the insurance contracts is earned and recognised in the statements over the term of the insurance contract. The life insurance provision includes also the amounts of bonuses assigned to the policyholders for the former contract years. Bonus provision Bonus provision for insurance contracts includes amounts, which are based on the decision of management allocated to the insurance contracts in the reporting period and on the account of which the life insurance provisions or financial liabilities will be increased or bonus disbursements made to the clients in the following reporting periods. Provision for outstanding claims Provision for outstanding claims equals the amount that covers the estimated costs related to the disbursement or insured amounts and indemnities of insurance contracts, which arose from insured events or cancellation of insurance contracts that the insurer was notified of before the balance sheet date and relating to insured events that occurred before the balance sheet date, but that were the insurer was not notified of by the balance sheet date. Claims, reported before the balance sheet date, are assessed on an individual basis. The provision for claims, which are incurred but not reported, is calculated using a

AS SEB Pank, Annual Report 2008
- 31 -
statistical estimate based on prior experience related to a time difference between the date of reporting and the date of incurring the claims. Liability adequacy test At each balance sheet date, a liability adequacy test is performed to ensure the adequacy of liabilities net of related deferred acquisition costs arising from insurance contracts. In a liability adequacy test, the current best estimate of future contractual cash flows and claims handling and administration expenses, as well as expected investment return on assets backing such liabilities, are used,. Any deficiency is recognised in profit or loss by writing off deferred acquisition costs and subsequently establishing a provision for losses arising from the liability adequacy test (provision for unexpired risks). Any deferred acquisition costs written off as a result of this test cannot subsequently be reinstated. 1.17. Classification and accounting principles of life insurance contracts According to International Financial Reporting Standard IFRS 4, the contracts concluded by the life insurance company with its clients are classified as insurance contracts or investment contracts For the purpose of IFRS 4, all contracts, which transfer significant insurance risk within the scope of IFRS 4 and under which the company takes a significant insurance risk, agreeing to pay the benefits on the occurrence of insured event are classified as insurance contracts. Such contracts may also transfer financial risk. As a general rule, an insurance risk is considered to be significant, when the possibility of having to pay benefits on the occurrence of an insured event is at least 10% more than the benefits payable if the insured event did not occur. Investment contracts are those contracts that transfer financial risk with no significant insurance risk Revenue recognition Premiums for insurance contracts are recognized as revenue when they are paid by the policyholders. For contracts where insurance risk premiums in a period are intended to cover the claims in that period, those premiums are recognized proportionally over the period of coverage. Amounts received from and paid to the policyholders of investment contracts are accounted for as deposits received or repaid. Fees charged for managing investment contracts are recognized as revenue. These services are provided equally over the lifetime of a contract. Recognition of costs Costs for insurance contracts are recognized as an expense when incurred, with the exception of commissions and other acquisition costs that are directly related to acquisition of new contracts or renewing existing contracts. These are capitalized as deferred acquisition costs (Note 1.18). Insurance claims are recognized as expense when incurred.
AS SEB Pank, Annual Report 2008
- 32 -
Incremental costs directly attributable to securing an investment contract are deferred (Note 1.18.). All other costs of investment contracts, such as non-incremental acquisition costs or maintenance costs, are recognized in the accounting period in which they arise. 1.18. Capitalisation of acquisition costs Acquisition costs of insurance contracts, which are related to securing new contracts are capitalized as an intangible asset. Only direct acquisition costs, like the performance based salary paid for concluding the contracts and commission fees of contracts are capitalized. Calculation is performed on the contractual basis and only for the insurance contracts, where the payment frequency is more than once a year. Depreciation of deferred acquisition costs is on straight-line basis, within period of two months to one year depending on the type of insurance contract. The depreciation period is shorter than the average life of contracts, since calculation of insurance technical provisions under insurance contracts is based on zillmerizing. Other acquisition costs are recognized as expenses when incurred. 1.19. Revenue recognition Interest income and expense Interest income and expense is recognized in income statement for all interest-bearing financial instruments carried at amortized cost using the effective interest rate method. Interest income includes also similar income on interest bearing financial instruments classified at fair value through profit or loss (i.e. traded bonds, etc). The effective interest method is a method of calculating the amortized cost of a financial asset or a financial liability and of allocating the interest income or interest expense over the relevant period. The effective interest rate is the rate that exactly discounts estimated future cash payments or receipts through the expected life of the financial instrument to the net carrying amount of the financial asset or financial liability. When calculating the effective interest rate, the Group estimates cash flows considering all contractual terms of the financial instrument, but does not consider future credit losses. The calculation includes all significant fees paid or received between parties to the contract that are an integral part of the effective interest rate, transaction costs and all other premiums or discounts. Once a financial asset or a group of similar financial assets has been written down as a result of an impairment loss, interest income is recognized using the rate of interest used to discount the future cash flows for the purpose of measuring the impairment loss. Fee and commission income Revenue is recognized in the fair value of the consideration received or receivable for the services provided in the ordinary course of the Group's activities. Fees and commissions are generally recognized on an accrual basis when the service has been provided. Credit issuance fees for loans/leases that, are deferred and recognized as an adjustment to the effective interest rate on the credit. Portfolio management and other advisory service fees, as well as wealth management and custody service fees are recognized based on the applicable service contracts, usually on an accrual basis. Asset management fees related to management of investment funds are recognized over the period the service is provided.
AS SEB Pank, Annual Report 2008
- 33 -
Performance linked fees or fee components are recognized when the performance criteria are fulfilled. Other transaction fee income and other income are recognized on accrual basis at the moment of executing the respective transactions. 1.20. Dividend income Dividends are recognized in the income statement when the entity’s right to receive payment is established. 1.21. Recognition of day one profit and loss The best evidence of fair value at initial recognition is the transaction price (ie, the fair value of the consideration given or received), unless the fair value of that instrument is evidenced by comparison with other observable current market transactions in the same instrument (ie, without modification or repackaging) or based on a valuation technique whose variables include only data from observable markets. Profits on day one can be recognized when a valuation technique is used whose variables include data from observable markets. In other circumstances the day one profit is deferred over the life of transaction. The timing of recognition of deferred day one profit and loss is determined individually. It is either amortized over the life of the transaction, deferred until the instrument´ s fair value can be determined using market observable inputs, or realized through settlement. The financial instrument (separated embedded derivative) is subsequently measured at fair value, adjusted for the deferred day one profit and loss. Subsequent changes in fair value are recognized immediately in the income statement without reversal of deferred day one profits and losses. 1.22. Taxation Corporate income tax According to the Income Tax Act, the annual profit earned by enterprises is not taxed in Estonia and thus there are no temporary differences between the tax bases and carrying values of assets and liabilities and no deferred tax assets or liabilities arise. Instead of taxing the net profit, the distribution of retained earnings is subject to the taxation at the rate of 21/79 (until 31.12.2007: 22/78) on the amount paid out as net dividends. The corporate income tax arising from the payment of dividends is accounted for as an expense in the period when dividends are declared, regardless of the actual payment date or the period for which the dividends are paid Corporate income tax of foreign subsidiaries Profits earned by foreign subsidiaries, adjusted with temporary and permanent differences between the tax bases of assets and liabilities and their carrying values in the balance sheet, are subject to corporate income tax. The tax rate applicable to JSC SEB Leasing belonging until 30.06.2008 to the SEB Pank Group and registered in Russia is 24% from taxable income.
AS SEB Pank, Annual Report 2008
- 34 -
Deferred income tax Deferred tax is provided for all temporary differences between the tax bases of assets and liabilities and their carrying values in the balance sheet. Deferred income tax is determined using tax rates (and laws) that have been enacted or substantially enacted by the balance sheet date and are expected to apply when the related deferred income tax asset is realized or the deferred income tax liability is settled. Main temporary differences arise from different treatment of FX translation gains/losses for accounting and taxation purposes, depreciation of fixed assets and tax losses carried forward. Deferred tax assets are recognized in the balance sheet only if their realization is probable. 1.23. Fiduciary activities The Group provides asset management services and offers fund management services. The assets owned by third parties, but managed by the Group, and income arising thereon, are excluded from these financial statements, as they are not assets of the Group. 1.24. Changes in the presentation of items of income statement and balance sheet Some changes were made in the presentation of items of income statement and balance sheet comparing to the annual report 2007. On the assets side are separately recorded “Financial assets held for trading”, “Financial assets designated at fair value through profit or loss”, “Available-for-sale financial assets”, which were recorded in the one balance sheet line “Securities” in 2007. Derivatives are recorded in the line „Financial assets held for trading”, which were recorded in the balance sheet line „Other assets“ in 2007. On the liability side are separately recorded “Issued debt securities”, “Financial liabilities designated at fair value through profit or loss”, which were recorded in the one balance sheet line “Issued debt securities” in 2007. Derivatives are recorded on the line “Financial liabilities designated at fair value through profit or loss”, which were recorded in the balance sheet line”Other liabilities” in 2007. Breakdown of the balances was described in Notes to the financial statement in 2007.
Assets adjusted balances(millions of EUR) 31.12.08 31.12.07 change 31.12.07Securities 0.0 0.0 -131.3 131.3Financial assets held for trading 25.5 33.7 +33.7 0.0Financial assets at fair value through profit or loss 66.7 93.4 +93.4 0.0Available-for-sale financial assets 26.4 4.2 +4.2 0.0
Liabilities adjusted balances(millions of EUR) 31.12.08 31.12.07 change 31.12.07Other liabilities 96.9 284.2 -20.7 304.9Issued debt securities 6.8 42.7 -2.4 45.0Financial liabilities at fair value through profit or loss 31.8 23.1 +23.1 0.0

AS SEB Pank, Annual Report 2008
- 35 -
1.25. New International Financial Reporting Standards, amendments to published standards and interpretations by the International Financial Reporting Interpretations Committee. Standards, amendments to published standards and interpretations mandatory for the Group’s accounting periods beginning on or after 1 January 2008. IFRIC 11, IFRS 2 - Group and Treasury Share Transactions (effective for annual periods beginning on or after 1 March 2007). The interpretation contains guidelines on the following issues: applying IFRS 2 “Share-based Payment” for transactions of payment with shares which are entered into by two or more related entities; and adopting an accounting approach in the following instances: an entity grants its employees rights to its equity instruments that may or must be repurchased from a third party in order to settle obligations towards the employees; or an entity or its owner grants the entity's employees rights to the entity's equity instruments, and the provider of those instruments is the owner of the entity. This interpretation does not have an impact on the Group’s financial statements. Reclassification of Financial Assets—Amendments to IAS 39, Financial Instruments: Recognition and Measurement, and IFRS 7, Financial Instruments: Disclosures and a subsequent amendment, Reclassification of Financial Assets: Effective Date and Transition. The amendments allow entities the options (a) to reclassify a financial asset out of the held to trading category if, in rare circumstances, the asset is no longer held for the purpose of selling or repurchasing it in the near term; and (b) to reclassify an available-for-sale asset or an asset held for trading to the loans and receivables category, if the entity has the intention and ability to hold the financial asset for the foreseeable future or until maturity (subject to the asset otherwise meeting the definition of loans and receivables). The Group has not elected to make any of the optional reclassifications during the period; as such, this amendment has no impact on the Group’s financial statements New Accounting Pronouncements Certain new standards and interpretations have been published that are mandatory for the Group’s accounting periods beginning on or after 1 January 2009 or later periods and which the Group has not early adopted, but which may have significant impact on the financial statement of the group in future.
IFRS 8, Operating Segments (effective for annual periods beginning on or after 1 January 2009). The standard applies to entities whose debt or equity instruments are traded in a public market or that file, or are in the process of filing, their financial statements with a regulatory organisation for the purpose of issuing any class of instruments in a public market. IFRS 8 requires an entity to report financial and descriptive information about its operating segments, with segment information presented on a similar basis to that used for internal reporting purposes. The Group does expect IFRS 8 to have a affect the financial statements.
Puttable Financial Instruments and Obligations Arising on Liquidation—IAS 32 and IAS 1 Amendment (effective for annual periods beginning on or after 1 January 2009). The amendment requires classification as equity of some financial instruments that meet the definition of financial liabilities. The Group does not expect the amendment to affect its financial statements.
AS SEB Pank, Annual Report 2008
- 36 -
IAS 23, Borrowing Costs (revised March 2007; effective for annual periods beginning on or after 1 January 2009). The main change to IAS 23 is the removal of the option of immediately recognising as an expense borrowing costs that relate to assets that take a substantial period of time to get ready for use or sale. An entity is, therefore, required to capitalise such borrowing costs as part of the cost of the asset. The revised standard applies prospectively to borrowing costs relating to qualifying assets for which the commencement date for capitalisation is on or after 1 January 2009. The Group does not expect the amendment to the standard to have a material effect on its financial statements.
IAS 1, Presentation of Financial Statements (revised September 2007; effective for annual periods beginning on or after 1 January 2009). The main change in IAS 1 is the replacement of the income statement by a statement of comprehensive income which will also include all non-owner changes in equity, such as the revaluation of available-for-sale financial assets. Alternatively, entities will be allowed to present two statements: a separate income statement and a statement of comprehensive income. The revised IAS 1 also introduces a requirement to present a statement of financial position (balance sheet) at the beginning of the earliest comparative period whenever the entity restates comparatives due to reclassifications, changes in accounting policies, or corrections of errors. The Group expects the revised IAS 1 to affect the presentation of its financial statements but to have no impact on the recognition or measurement of specific transactions and balances.
The Group has not early adopted the following other new standards or interpretations, which will not have significant impact on the group financial statements in the future.
IAS 27, Consolidated and Separate Financial Statements (revised January 2008; effective for annual periods beginning on or after 1 July 2009; not endorsed by EU). The revised IAS 27 will require an entity to attribute total comprehensive income to the owners of the parent and to the non-controlling interests even if this results in the non-controlling interests having a deficit balance. It also specifies how an entity should measure any gain or loss arising on the loss of control of a subsidiary. The Group does not expect the amended standard to effect on its financial statements. Vesting Conditions and Cancellations—Amendment to IFRS 2, Share-based Payment (issued in January 2008; effective for annual periods beginning on or after 1 January 2009). The amendment clarifies that only service conditions and performance conditions are vesting conditions. The Group does not expect the amendment to effect on its financial statements.
IFRS 3, Business Combinations (revised January 2008; effective for business combinations for which the acquisition date is on or after the beginning of the first annual reporting period beginning on or after 1 July 2009; not endorsed by EU). The revised IFRS 3 will allow entities to choose to measure non-controlling interests using the existing IFRS 3 method (proportionate share of the acquiree’s identifiable net assets) or at fair value. The revised IFRS 3 is more detailed in providing guidance on the application of the purchase method to business combinations. IFRS 3 is not relevant to the Group as it does not expect a business combination to occur.
IFRIC 12, Service Concession Arrangements (effective for annual periods beginning on or after 1 January 2008; not endorsed by EU). The interpretation contains guidelines on applying the existing standards by entities being parties to service concessions between the public and the private sector. The Group does not expect the interpretation to affect its financial statements.
AS SEB Pank, Annual Report 2008
- 37 -
IFRIC 13, Customer Loyalty Programmes (effective for annual periods beginning on or after 1 July 2008 EU’s endorsement: effective for annual periods beginning after 31 December 2008, early adoption permitted). ). IFRIC 13 clarifies that when goods or services are sold together with a customer loyalty incentive the consideration received is to be allocated between the components using fair values. IFRIC 13 is not relevant to the Group’s operations because no Group companies operate any loyalty programmes.
IFRIC 14, IAS 19—The Limit on a Defined Benefit Asset, Minimum Funding Requirements and their Interaction (effective for annual periods beginning on or after 1 January 2008; EU’s endorsement: effective for annual periods beginning after 31 December 2008, early adoption permitted) The Interpretation contains general guidance on how to assess the limit of the surplus of fair value of a defined benefit plan over the present value of its liabilities which can be recognised as an asset, in accordance with IAS 19. In addition, IFRIC 14 explains how the statutory or contractual requirements of the minimum funding may affect the values of assets and liabilities of a defined benefit plan. The Group does not expect the interpretation to affect its financial statements.
IFRIC 15, Agreements for the Construction of Real Estate (effective for annual periods beginning on or after 1 January 2009; not endorsed by EU). The interpretation applies to the accounting for revenue and associated expenses by entities that undertake the construction of real estate directly or through subcontractors, and provides guidance for determining whether agreements for the construction of real estate are within the scope of IAS 11 or IAS 18. It also provides criteria for determining when entities should recognise revenue on such transactions IFRIC 15 is not relevant to the Group’s operations because it does not have any agreements for the construction of real estate.
IFRIC 16, Hedges of a Net Investment in a Foreign Operation (effective for annual periods beginning on or after 1 October 2008; not endorsed by EU). The interpretation explains which currency risk exposures are eligible for hedge accounting. IFRIC 16 does not have any impact on these financial statements as the Group does not apply hedge accounting.
Cost of an Investment in a Subsidiary, Jointly Controlled Entity or Associate—IFRS 1 and IAS 27 Amendment (issued in May 2008; effective for annual periods beginning on or after 1 January 2009; not endorsed by EU). The amendment allows first-time adopters of IFRS to measure investments in subsidiaries, jointly controlled entities or associates at fair value or at previous GAAP carrying value as deemed cost in the separate financial statements. The amendment also requires distributions from pre-acquisition net assets of investees to be recognised in profit or loss rather than as a recovery of the investment. The amendments will not have any impact on the Group’s financial statements.
Eligible Hedged Items—Amendment to IAS 39, Financial Instruments: Recognition and Measurement (effective with retrospective application for annual periods beginning on or after 1 July 2009; not endorsed by EU). The amendment clarifies how the principles that determine whether a hedged risk or portion of cash flows is eligible for designation should be applied in particular situations. The amendment is not expected to have any impact on the Group's financial statements as the Group does not apply hedge accounting. IFRIC 17, Distribution of Non-Cash Assets to Owners (effective for annual periods beginning on or after 1 July 2009; not endorsed by EU). The interpretation clarifies when and how distribution of non-cash assets as dividends to the owners should be recognised.

AS SEB Pank, Annual Report 2008
- 38 -
IFRIC 17 is not relevant to the Group’s operations because it does not distribute non-cash assets to owners. IFRS 1, First-time Adoption of International Financial Reporting Standards (following an amendment in December 2008, effective for the first IFRS financial statements for a period beginning on or after 1 July 2009; not endorsed by EU ). The revised IFRS 1 retains the substance of its previous version but within a changed structure in order to make it easier for the reader to understand and to better accommodate future changes. The Group concluded that the revised standard does not have any effect on its financial statements. IFRIC 18, Transfers of Assets from Customers (effective for annual periods beginning on or after 1 July 2009; the interpretation has not been adopted by the EU). The interpretation clarifies the accounting for transfers of assets from customers, namely, the circumstances in which the definition of an asset is met; the recognition of the asset and the measurement of its cost on initial recognition; the identification of the separately identifiable services (one or more services in exchange for the transferred asset); the recognition of revenue, and the accounting for transfers of cash from customers. IFRIC 18 is not expected to have any impact on the Group’s financial statements. Improvements to International Financial Reporting Standards (issued in May 2008). In 2007, the International Accounting Standards Board decided to initiate an annual improvements project as a method of making necessary, but non-urgent, amendments to IFRS. The amendments consist of a mixture of substantive changes, clarifications, and changes in terminology in various standards. The substantive changes relate to the following areas: classification as held for sale under IFRS 5 in case of a loss of control over a subsidiary; possibility of presentation of financial instruments held for trading as non-current under IAS 1; accounting for sale of IAS 16 assets which were previously held for rental and classification of the related cash flows under IAS 7 as cash flows from operating activities; clarification of definition of a curtailment under IAS 19; accounting for below market interest rate government loans in accordance with IAS 20; making the definition of borrowing costs in IAS 23 consistent with the effective interest method; clarification of accounting for subsidiaries held for sale under IAS 27 and IFRS 5; reduction in the disclosure requirements relating to associates and joint ventures under IAS 28 and IAS 31; enhancement of disclosures required by IAS 36; clarification of accounting for advertising costs under IAS 38; amending the definition of the fair value through profit or loss category to be consistent with hedge accounting under IAS 39; introduction of accounting for investment properties under construction in accordance with IAS 40; and reduction in restrictions over manner of determining fair value of biological assets under IAS 41. Further amendments made to IAS 8, 10, 18, 20, 29, 34, 40, 41 and to IFRS 7 represent terminology or editorial changes only, which the IASB believes have no or minimal effect on accounting. The Group does not expect the amendments to have any material effect on its financial statements.

AS SEB Pank, Annual Report 2008
- 39 -
2. Risk policy and management 2.1. Risk policy and structure In providing its customers with financial solutions and products AS SEB Pank assumes various risks that must be managed. The ability of the organisation to identify , measure and control different risks, while maintaining an adequate capitalisation to meet unforeseen events, is an important input for the profitability of the entire Group. The Group’s aim is to achieve an appropriate balance between risk and return and minimise potential adverse effects on the Group’s financial performance. AS SEB Pank defines risk as the possibility of a negative deviation from an expected financial outcome. Risk management includes all activities relating to risk-taking, risk mitigation, risk analysis, risk control and follow-up. Independent risk control comprises the identification, measurement, monitoring, stress testing, analysis, reporting and follow-up of risks, separate from the risk-taking functions. The Group’s risk management policies are designed to identify and analyse the risks, to set appropriate risk limits and controls, and to monitor the risks and adherence to limits by means of reliable and up-to-date information systems. The Group regularly reviews its risk management policies and systems to reflect changes in markets, products and emerging best practice. The Management Board is responsible for establishing the main principles for management, control and co-ordination of all risks of AS SEB Pank and to decide on the limits for the various risks. Subordinated to the Management Board are established different committees with mandates to make decisions depending upon the type of risk. The Assets and Liabilities Committee (ALCO) plays the central role in risk management, approving of risk procedures, dealing with issues relating to the overall risk level and deciding and monitoring of various risk limits. Risk management and control is always a prioritised area for the Group, continuously under development. During last years, the main development focus of risk management has been related with implementation of Basel II capital adequacy rules: continuous improvement of Internal Rating Based (IRB) credit risk assessment models, improvement of operational risk measurement and management framework. In 2008 AS SEB Pank received approval from the supervisory authorities to apply the internal models - IRB approach for reporting credit risk capital requirement and Advanced Measurement Approach (AMA) for reporting operational risk capital requirement. During 2008 other most important changes and developments were appointing risk managers in the business units to strengthen the risk management and monitoring function close to business so to have the most effect from it and updating New Product Approval Process. 2.2. Credit risk Assets open to credit risk are receivables from customers, receivables from credit institutions and debt securities and derivatives. Credit risk is a potential loss that may occur in case of improper fulfilment or non-compliance of the client with the contractual obligations as a result of failure of the client’s business operations or other factors.

AS SEB Pank, Annual Report 2008
- 40 -
The principles for measuring and taking credit risk are established with the SEB Pank Group credit policy. The principles of credit policy are the following: a) lending should be in line with credit policy; b) lending should be based upon analysis; c) the basis of all lending activity is credibility; d) the purpose of the credit should be fully understood; e) lending must be in proportion to the capacity to repay; f) borrower should have an identified source of repayment and also a secondary source
for repaying the loan; g) the own (equity) investment of the borrower must be significant in relationship to the
loan; h) lending activity shall take into account any potential adverse effects in the business
cycle; i) lending shall be in line with the bank’s profit goals. Credit risk analysis related to a certain client involves several different activities, like evaluation of the risk of the borrower’s background, structure, management and owner, industry and position of the borrower in that industry, economic environment and position of the borrower, analysis and evaluation of the business plan and submitted cash flow prognosis; evaluation of the reputation, reliability and credit history of the client. Deciding on the risk taking is performed collegially by credit committees and by the authorised persons in accordance with the decision-making limits established by the bank’s management. Deciding on the risk taking in debt securities is part of general credit decision making process. Limit for investing into certain issuer’s debt securities has to be approved by relevant credit committee or by the authorised persons. Credit risk management in AS SEB Elu- ja Pensionikindlustus is described in chapter 2.2.1. Normally AS SEB Pank is not taking investment positions, including credit risk bearing positions, excluding limited volume of trading portfolio, which is regulated by trading portfolio total limit established by ALCO. As of end 2008 the Group has extraordinary investment position from taking over assets of liquidity fund (see Note 8), which Group is planning to liquidate within reasonable time horizon . Credit risk measurement The prime credit risk measure of AS SEB Pank is defined as the maximum potential loss over a certain time horizon at a certain level of confidence. Credit risk is being quantified monthly using the following components Probability of Default (PD), Exposure At Default (EAD) and Loss Given Default (LGD) or the aggregate measure Risk Weighted Assets (RWA). Having estimated PD, EAD and LGD it is possible to calculate expected loss and unexpected loss. Expected loss (EL) can be interpreted as the “normal level” of credit losses and shall be considered as a cost of doing business from a risk point of view. Thus it shall be covered through transaction pricing and risk reserves. Appropriate efforts shall be made to minimise expected losses through ensuring sound internal practices and good internal controls. Unexpected losses (UL) are commonly referred to as the unusual and

AS SEB Pank, Annual Report 2008
- 41 -
large credit losses and are not foreseen to be completely absorbed by day to day transaction profits. The primary protections against such losses are sound internal practices, good internal controls, insurance policies and earnings. The last loss-absorbing resource for unexpected losses is the capital of AS SEB Pank. PD is a measure of probability of default of a given counterparty risk class during the next year, through it’s risk classification, pooling or rating. LGD is an estimate, expressed as a fraction of EAD, of the expected amount of loss in case of counterparty default. The LGD estimates used differ among other things on if it is a secured or unsecured exposure, type of collateral and seniority of the exposure. EAD is defined as the expected outstanding liability of the counterparty at the time of default both on- and off-balance sheet exposures. Conceptually EAD consists of two parts, the current exposure and an estimate of potential future exposure. Estimation of potential future drawdown of available but unused credit commitments are known as credit conversion factors (CCFs). Since the CCF is the only random or uncertain portion of EAD, estimating EAD amounts to estimating these CCFs. Credit risks are mainly measured on two levels – on portfolio and exposure level. For verifying the loan portfolio’s exposure to credit risk, AS SEB Pank uses a portfolio diversification method. The division of financial obligations is monitored by different client segments, products, clients and industries. The Credit Area performs monthly analysis on the credit risk of loan portfolio and informs the bank’s managing bodies of the results. These results are discussed as well as any need for specific attention to or specific analysis for any identified issues. In respect to individual clients the bank prepares regular (annual, quarterly or if needed more often) analyses on the borrowers’ situation as well as their risk level. The analyses are based on annual and quarterly reports, on basis of which the financial situation is evaluated, as well as on credit history and information originating from other sources. Evaluation of the borrowers’ reliability is of critical importance. AS SEB Pank divides loan portfolio into two broad segments: A) corporate portfolio including loans to legal entities belonging to counterparty group’s with credit risk assumed by SEB Pank Group exceeding 287,602 euros and B) retail portfolio consisting of small corporates’ and private individuals’ sub-segments. As of end of 2008 the corporate portfolio amounted to 46% of total loan portfolio (2007: 47%). Based on the results of the analysis, the corporate clients are divided into sixteen risk classes in accordance with the AS SEB Pank risk classification system. Sixteen risk classes belong to 5 quality classes of businesses. According to the risk classification system the risk class assignment is not required for companies or a group of companies with credit risk assumed by the Group less than 287,602 euros, i.e. small corporates. Scoring model is used for evaluation of these borrowers.
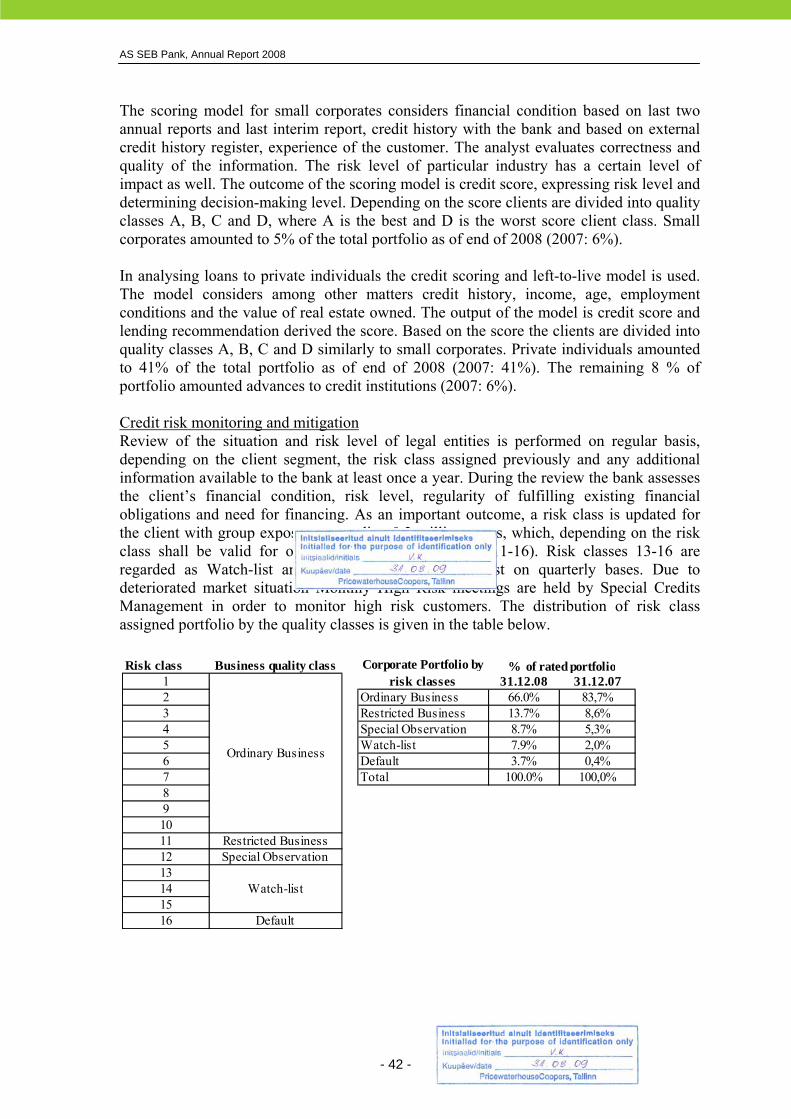
AS SEB Pank, Annual Report 2008
- 42 -
The scoring model for small corporates considers financial condition based on last two annual reports and last interim report, credit history with the bank and based on external credit history register, experience of the customer. The analyst evaluates correctness and quality of the information. The risk level of particular industry has a certain level of impact as well. The outcome of the scoring model is credit score, expressing risk level and determining decision-making level. Depending on the score clients are divided into quality classes A, B, C and D, where A is the best and D is the worst score client class. Small corporates amounted to 5% of the total portfolio as of end of 2008 (2007: 6%). In analysing loans to private individuals the credit scoring and left-to-live model is used. The model considers among other matters credit history, income, age, employment conditions and the value of real estate owned. The output of the model is credit score and lending recommendation derived the score. Based on the score the clients are divided into quality classes A, B, C and D similarly to small corporates. Private individuals amounted to 41% of the total portfolio as of end of 2008 (2007: 41%). The remaining 8 % of portfolio amounted advances to credit institutions (2007: 6%). Credit risk monitoring and mitigation Review of the situation and risk level of legal entities is performed on regular basis, depending on the client segment, the risk class assigned previously and any additional information available to the bank at least once a year. During the review the bank assesses the client’s financial condition, risk level, regularity of fulfilling existing financial obligations and need for financing. As an important outcome, a risk class is updated for the client with group exposure exceeding 0.3 million euros, which, depending on the risk class shall be valid for one year (1-10), half a year (11-16). Risk classes 13-16 are regarded as Watch-list and separately reviewed at least on quarterly bases. Due to deteriorated market situation Monthly High Risk meetings are held by Special Credits Management in order to monitor high risk customers. The distribution of risk class assigned portfolio by the quality classes is given in the table below.
Risk class Business quality class1 31.12.08 31.12.072 Ordinary Business 66.0% 83,7%3 Restricted Business 13.7% 8,6%4 Special Observation 8.7% 5,3%5 Watch-list 7.9% 2,0%6 Default 3.7% 0,4%7 Total 100.0% 100,0%891011 Restricted Business12 Special Observation13141516 Default
Corporate Portfolio by risk classes
% of rated portfolio
Watch-list
Ordinary Business

AS SEB Pank, Annual Report 2008
- 43 -
The distribution of debt securities portfolios (in market value) by quality classes is given in table below.
% of portfolios
Debt Securities Portfolios* by risk
classes 31.12.2008 Ordinary Business 85.0% Restricted Business 4.0% Special Observation 9.5% Watch-list 1.5% Default 0.0% Total 100.0% * AS SEB Elu- ja Pensionikindlustus Unit Link portfolio is excluded as the credit risks in this portfolio are transferred to the customers by the agreements. For regular monitoring of private individuals and small corporates the behavioural scoring models are in use. The models are based on the application scoring models used in loans analysis process. In behavioural scoring there is used a separate quality class E for defaulted clients and an additional class N for small corporates to whom according to the bank’s assessment there is not enough information to assign any other class. Part of the information (payment behaviour, financial situation of the small corporate) is updated regularly (monthly, quarterly), partly is used older available information. Behavioural score is calculated monthly for all private individuals and small corporates loans. The distribution of retail portfolio by quality classes is given in the table below.
Primary responsibility for monitoring the quality of specific client and its loans lies with client executives, who should inform immediately to their department head and if necessary, to the credit area management of occurred problems and accordingly take necessary measures. Impairment and allowance policies The internal rating system is primarily used to measure one of the major sources of risk that drives the occurrence of lending losses - the risk that the counterparty will default on its payment obligations, being probability of default. This is distinct from the risk of loss finally arising after all attempts to recover payments from defaulted counterparties.
Score Business quality classA 31.12.08 31.12.07B Ordinary Business 78.3% 82,0%C Special Observation 18.3% 15,8%D Default 2.3% 0,9%E Default Insufficient information 1.1% 1,3%N Insufficient information Total 100.0% 100,0%
Retail portfolio by behavioral scores
Special Observation
Ordinary Business
% of scored portfolio

AS SEB Pank, Annual Report 2008
- 44 -
The internal rating tool assists management to determine whether objective evidence of impairment exists under IAS 39, based on the following criteria set out by the Group:
• delinquency in contractual payments of principal or interest; • cash flow difficulties experienced by the borrower (eg equity ratio, operating
income or EBITDA margin, debt service coverage etc); • breach of loan covenants or conditions; • initiation of bankruptcy proceedings; • deterioration of the borrower’s competitive position.
The Group’s policy requires that all exposures above 0.3 million euros are reviewed individually at least annually (see above). Impaired allowances on individually assessed accounts are determined by an evaluation of the incurred loss at balance-sheet date on a case-by-case basis, and are applied to all individually significant accounts. The assessment encompasses collateral held (including re-confirmation of its enforceability) and the anticipated receipts for that individual account. Collectively assessed impairment allowances are provided for: (i) portfolios of homogenous assets that are individually below materiality tresholds; and (ii) losses that have been incurred but have not yet been identified, by using the available historical experience, experienced judgement and statistical techniques. Currently the Group uses loss identification period of approximately 4 months based on the analyses that the starting point for the loss event to incur will be the day after the last date the loan is served according to plan. So the identification period would typically be for loans with monthly instalment 29 days prior to the 90-days default event. Credit risk managers in head office and branch credit risk management department perform regular in-depth monitoring of the quality of the loan portfolio. Also the bank's internal audit carries out reviews on valuation of the loan portfolio. During the control for adherence to procedures, availability of required information and documents, regularity of loan servicing (repayments), adequacy of collateral and other factors influencing the risks is verified. Collateral In order to diminish credit risk the bank has established a requirement for the borrowers to provide the bank with collateral in the form of registered immovable property, registered movable property and/or personal sureties as security. The group has implemented guidelines on the acceptability of specific classes of collateral on credit risk mitigation. The principles for granting an unsecured loan are stated in the credit policy and this kind of lending is clearly limited and restricted. The balance of unsecured credits is disclosed just below. The pledged assets have to be insured throughout the loan period in an insurance company accepted by the bank at least for the restoration value. In case of a housing loan also life insurance is required, if the borrower is contributing majority to the family’s income. The aforementioned measures help to control and manage the credit risk as they serve as an alternative source for collecting the loan, in case the borrower is not able to repay the loan from primary cash flow.
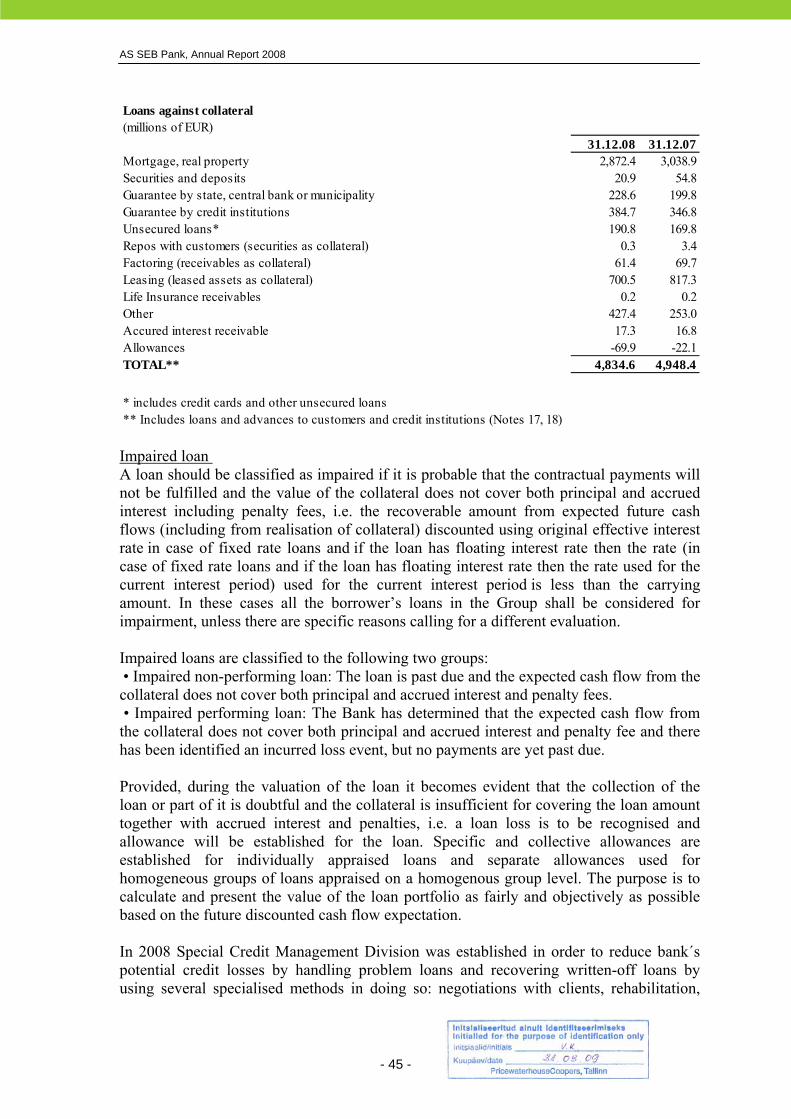
AS SEB Pank, Annual Report 2008
- 45 -
Impaired loan A loan should be classified as impaired if it is probable that the contractual payments will not be fulfilled and the value of the collateral does not cover both principal and accrued interest including penalty fees, i.e. the recoverable amount from expected future cash flows (including from realisation of collateral) discounted using original effective interest rate in case of fixed rate loans and if the loan has floating interest rate then the rate (in case of fixed rate loans and if the loan has floating interest rate then the rate used for the current interest period) used for the current interest period is less than the carrying amount. In these cases all the borrower’s loans in the Group shall be considered for impairment, unless there are specific reasons calling for a different evaluation. Impaired loans are classified to the following two groups: • Impaired non-performing loan: The loan is past due and the expected cash flow from the collateral does not cover both principal and accrued interest and penalty fees. • Impaired performing loan: The Bank has determined that the expected cash flow from the collateral does not cover both principal and accrued interest and penalty fee and there has been identified an incurred loss event, but no payments are yet past due. Provided, during the valuation of the loan it becomes evident that the collection of the loan or part of it is doubtful and the collateral is insufficient for covering the loan amount together with accrued interest and penalties, i.e. a loan loss is to be recognised and allowance will be established for the loan. Specific and collective allowances are established for individually appraised loans and separate allowances used for homogeneous groups of loans appraised on a homogenous group level. The purpose is to calculate and present the value of the loan portfolio as fairly and objectively as possible based on the future discounted cash flow expectation. In 2008 Special Credit Management Division was established in order to reduce bank´s potential credit losses by handling problem loans and recovering written-off loans by using several specialised methods in doing so: negotiations with clients, rehabilitation,
Loans against collateral(millions of EUR)
31.12.08 31.12.07Mortgage, real property 2,872.4 3,038.9Securities and deposits 20.9 54.8Guarantee by state, central bank or municipality 228.6 199.8Guarantee by credit institutions 384.7 346.8Unsecured loans* 190.8 169.8Repos with customers (securities as collateral) 0.3 3.4Factoring (receivables as collateral) 61.4 69.7Leasing (leased assets as collateral) 700.5 817.3Life Insurance receivables 0.2 0.2Other 427.4 253.0Accured interest receivable 17.3 16.8Allowances -69.9 -22.1TOTAL** 4,834.6 4,948.4
4,834.6 4,948.4* includes credit cards and other unsecured loans** Includes loans and advances to customers and credit institutions (Notes 17, 18)

AS SEB Pank, Annual Report 2008
- 46 -
execution, bankruptcy proceedings and to enable getting these specialists involved with these problem loans (or potential problem loans) at the early stage to ensure most valuable outcome. Allowances for credit losses related to on-balance sheet items are provided either specific, collective or on homogenous group basis. The total impairment provision for loans and advances is 69.9 mEUR (2007:22.1) of which 34.7 (2007:1.5) represents the allowance for individually impaired loans and the remaining amount of 35.2 (2007:20.6) represents collective and homogenous groups allowances. SEB Group Retail Provisioning Model’s principles were used to determine homogenous groups’ allowances. The calculated incurred loss levels were adjusted by expert opinion. Taking into account extraordinary economical situation and continuing portfolio quality worsening (increase in non-performing loans (NPL)), which is not reflected immediately in the incurred loss level, the allowances were increased additionally taking into account NPL levels for different product groups. Totally at the end of 2008 the homogenous groups’ allowances were increased up to around 50% of NPL level. By 10% different level of NPL effect is 5.2 EURmio.
Impaired loans and allowances(millions of EUR)
31.12.08 31.12.07Impaired, non-performing loans 53.0 1.6Impaired, performing loans 11.5 1.9Non-performing, homogenous 53.1 16.1Total impaired, non-performing loans (gross)* 117.6 19.6
117.6 19.6Specific allowances -34.8 -1.5Collective allowances -8.8 -5.4Allowances for homogenous groups -26.3 -15.2Total allowances -69.9 -22.1
-69.9 -22.1Allowance ratio (Allowances / Impaired) 59% 113%Specific allowance ratio (Specific allowances / Impaired) 30% 7%
Ratio of impaired loans (Impaired / Loans to customers and credit institutions) 2.43% 0.40%
* Includes due to credit institutions
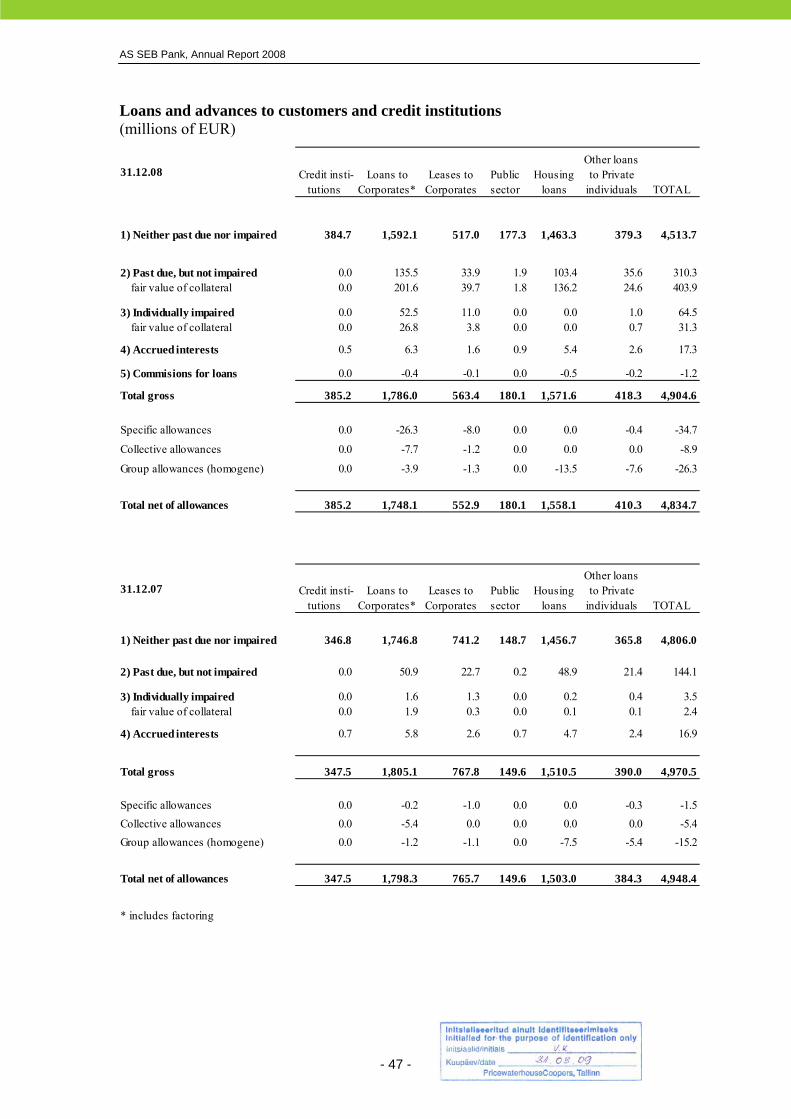
AS SEB Pank, Annual Report 2008
- 47 -
Loans and advances to customers and credit institutions (millions of EUR)
31.12.08 Credit insti-tutions
Loans to Corporates*
Leases to Corporates
Public sector
Housing loans
Other loans to Private
individuals TOTAL
1) Neither past due nor impaired 384.7 1,592.1 517.0 177.3 1,463.3 379.3 4,513.7
2) Past due, but not impaired 0.0 135.5 33.9 1.9 103.4 35.6 310.3 fair value of collateral 0.0 201.6 39.7 1.8 136.2 24.6 403.9
3) Individually impaired 0.0 52.5 11.0 0.0 0.0 1.0 64.5 fair value of collateral 0.0 26.8 3.8 0.0 0.0 0.7 31.3
4) Accrued interests 0.5 6.3 1.6 0.9 5.4 2.6 17.3
5) Commisions for loans 0.0 -0.4 -0.1 0.0 -0.5 -0.2 -1.2
Total gross 385.2 1,786.0 563.4 180.1 1,571.6 418.3 4,904.6
Specific allowances 0.0 -26.3 -8.0 0.0 0.0 -0.4 -34.7
Collective allowances 0.0 -7.7 -1.2 0.0 0.0 0.0 -8.9
Group allowances (homogene) 0.0 -3.9 -1.3 0.0 -13.5 -7.6 -26.3
Total net of allowances 385.2 1,748.1 552.9 180.1 1,558.1 410.3 4,834.7
31.12.07 Credit insti-tutions
Loans to Corporates*
Leases to Corporates
Public sector
Housing loans
Other loans to Private
individuals TOTAL
1) Neither past due nor impaired 346.8 1,746.8 741.2 148.7 1,456.7 365.8 4,806.0
2) Past due, but not impaired 0.0 50.9 22.7 0.2 48.9 21.4 144.1
3) Individually impaired 0.0 1.6 1.3 0.0 0.2 0.4 3.5 fair value of collateral 0.0 1.9 0.3 0.0 0.1 0.1 2.4
4) Accrued interests 0.7 5.8 2.6 0.7 4.7 2.4 16.9
Total gross 347.5 1,805.1 767.8 149.6 1,510.5 390.0 4,970.5
Specific allowances 0.0 -0.2 -1.0 0.0 0.0 -0.3 -1.5Collective allowances 0.0 -5.4 0.0 0.0 0.0 0.0 -5.4Group allowances (homogene) 0.0 -1.2 -1.1 0.0 -7.5 -5.4 -15.2
Total net of allowances 347.5 1,798.3 765.7 149.6 1,503.0 384.3 4,948.4
* includes factoring

AS SEB Pank, Annual Report 2008
- 48 -
* Impaired non-performing loan: The loan is past due and the expected cash flow from the collateral does not cover both principal and accrued interest and penalty fees. ** Impaired performing loan: The Bank has determined that the expected cash flow from the collateral does not cover both principal and accrued interest and penalty fee and there has been identified an incurred loss event, but no payments are yet past due. *** Non-performing loans in homogenous groups: loans where impairment is assessed and allowance provided on each homogenous group basis, not individually for each loan (no individually impaired loans identified). A loan is classified as impaired if it is individually assessed to be impaired, i.e. it is expected that the contractual payments will not be fulfilled and the value of the discounted cash flow to be expected from collateral does not cover both principal and accrued interest and penalty fees.
Quality of loans by classes(millions of EUR)
31.12.08 Credit insti-tutions
Loans to Corporates
Leases to Corporates
Public sector
Housing loans
Other loans to Private
individuals TOTALNormal loans 384.7 1,721.3 547.6 179.2 1,536.1 401.9 4,770.8Impaired non-performing* 0.0 42.7 9.4 0.0 0.0 1.0 53.1Impaired performing** 0.0 9.8 1.6 0.0 0.0 0.1 11.5Homogenous non-performing*** 0.0 6.3 3.3 0.0 30.6 12.9 53.1Accrued interest receivable 0.5 6.3 1.6 0.9 5.4 2.6 17.3Commisions for loans (deferred) 0.0 -0.4 -0.1 0.0 -0.5 -0.2 -1.2
385.2 1,786.0 563.4 180.1 1,571.6 418.3 4,904.6Specific allowances 0.0 -26.3 -8.0 0.0 0.0 -0.4 -34.7Collective and group allowances 0.0 -11.6 -2.5 0.0 -13.5 -7.6 -35.2
385.2 1,748.1 552.9 180.1 1,558.1 410.3 4,834.7
31.12.07 Credit insti-tutions
Loans to Corporates
Leases to Corporates
Public sector
Housing loans
Other loans to Private
individuals TOTALNormal loans 346.8 1,796.3 763.2 148.9 1,496.8 382.1 4,934.1Impaired non-performing* 0.0 0.1 1.2 0.0 0.2 0.1 1.6Impaired performing** 0.0 1.6 0.1 0.0 0.0 0.2 1.9Homogenous non-performing*** 0.0 1.3 0.8 0.0 8.8 5.2 16.1Accrued interest receivable 0.7 5.8 2.5 0.7 4.7 2.4 16.8
347.5 1,805.1 767.8 149.6 1,510.5 390.0 4,970.5Specific allowances 0.0 -0.2 -1.0 0.0 0.0 -0.3 -1.5Collective and group allowances 0.0 -6.6 -1.1 0.0 -7.5 -5.4 -20.6
347.5 1,798.3 765.7 149.6 1,503.0 384.3 4,948.4
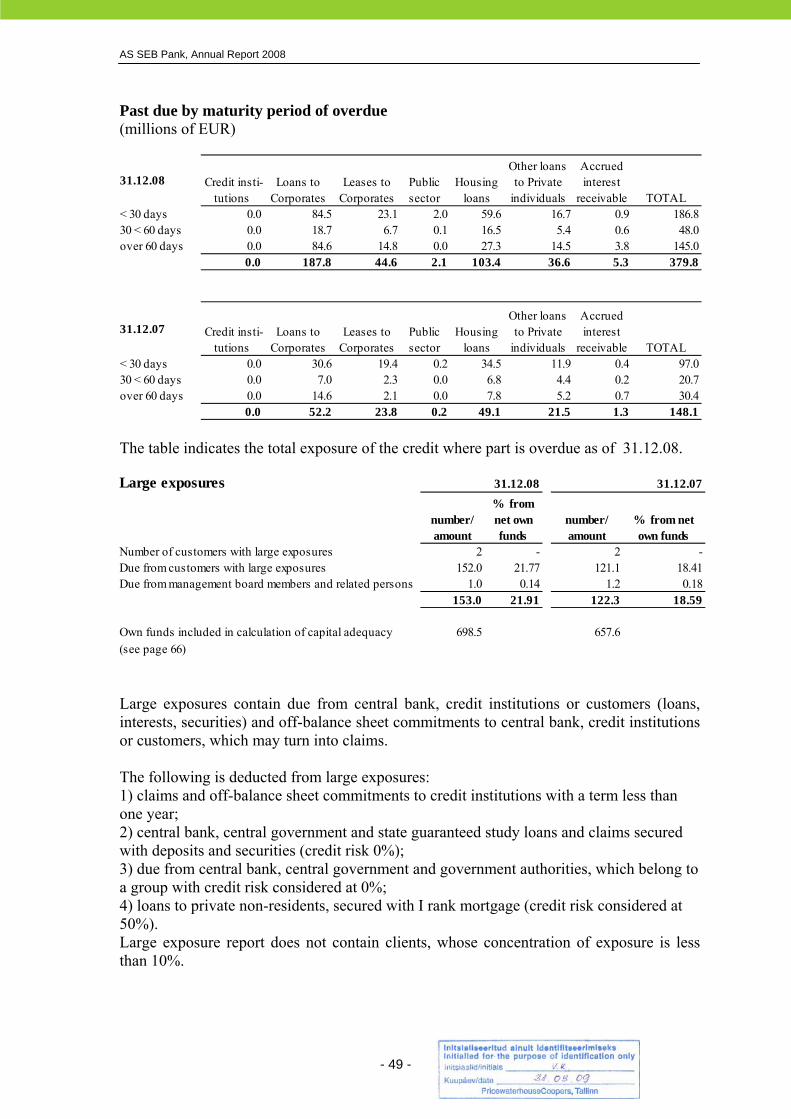
AS SEB Pank, Annual Report 2008
- 49 -
Past due by maturity period of overdue (millions of EUR)
The table indicates the total exposure of the credit where part is overdue as of 31.12.08.
Large exposures contain due from central bank, credit institutions or customers (loans, interests, securities) and off-balance sheet commitments to central bank, credit institutions or customers, which may turn into claims. The following is deducted from large exposures: 1) claims and off-balance sheet commitments to credit institutions with a term less than one year; 2) central bank, central government and state guaranteed study loans and claims secured with deposits and securities (credit risk 0%); 3) due from central bank, central government and government authorities, which belong to a group with credit risk considered at 0%; 4) loans to private non-residents, secured with I rank mortgage (credit risk considered at 50%). Large exposure report does not contain clients, whose concentration of exposure is less than 10%.
31.12.08 Credit insti- tutions
Loans to Corporates
Leases to Corporates
Public sector
Housing loans
Other loans to Private
individuals
Accrued interest
receivable TOTAL< 30 days 0.0 84.5 23.1 2.0 59.6 16.7 0.9 186.830 < 60 days 0.0 18.7 6.7 0.1 16.5 5.4 0.6 48.0over 60 days 0.0 84.6 14.8 0.0 27.3 14.5 3.8 145.0
0.0 187.8 44.6 2.1 103.4 36.6 5.3 379.8
31.12.07 Credit insti- tutions
Loans to Corporates
Leases to Corporates
Public sector
Housing loans
Other loans to Private
individuals
Accrued interest
receivable TOTAL< 30 days 0.0 30.6 19.4 0.2 34.5 11.9 0.4 97.030 < 60 days 0.0 7.0 2.3 0.0 6.8 4.4 0.2 20.7over 60 days 0.0 14.6 2.1 0.0 7.8 5.2 0.7 30.4
0.0 52.2 23.8 0.2 49.1 21.5 1.3 148.1
Large exposures 31.12.08 31.12.07
number/ amount
% from net own funds
number/ amount
% from net own funds
Number of customers with large exposures 2 - 2 -Due from customers with large exposures 152.0 21.77 121.1 18.41Due from management board members and related persons 1.0 0.14 1.2 0.18
153.0 21.91 122.3 18.59
Own funds included in calculation of capital adequacy 698.5 657.6(see page 66)

AS SEB Pank, Annual Report 2008
- 50 -
Large credit risk exposure is the total exposure of one party or related parties to the group which exceeds 10% of the group's net equity (69.8 EURmio as at 31.12.08.), Note 2.9 on page 65. All instruments where credit risk may arise to the group are taken into consideration. The maximum rate of total large exposures all together allowed is 800%. The limit of the total exposure of one party or related parties is 25%. As of 31.12.2008 the group had 2 large risk exposures (2 large risk exposures in 31.12.2007). Total exposure of any group of related parties did not exceed the limit of 25%. 2.2.1. Credit risk in AS SEB Elu- ja Pensionikindlustus Credit risk is the risk that counterparty to a financial instrument causes monetary loss to the other counterparty due to inability to fulfil its obligations. Credit risk arises from the following counterparties of transaction:
• Credit institutions • Reinsurers • Issuers of bonds
To manage credit risk, AS SEB Elu- ja Pensionikindlustus has established a condition to the reinsurance partners upon risk reinsurance that they must have at least rating A by Standard and Poor’s. SwissRe, reinsurer of AS SEB Elu- ja Pensionikindlustus, has rating AA- as at 31.12.2008. Credit risk related to debt securities is managed through the investment policy, which sets the weighted average rating and lowest allowed rating for debt securities. 2.3. Market risk AS SEB Pank defines market risk as the risk of loss or reduction of future net income following changes in interest rates, foreign exchange and equity prices, including price risk in connection with the sale of assets or closing of positions. Market risk may arise from the bank’s activity at the financial markets and it has an impact on the majority of bank products: loans, deposits, securities, credit lines. AS SEB Pank measures the risks using different methods of risk valuation and management pursuant to the type of risk. Important role in risk prevention is diversification of risk assets and limitation for trading positions. Maximum limits approved by the committees, which are in compliance with the limits set by the Bank of Estonia, form the basis for controlling and monitoring the risk of various instrument portfolios. For positions related to market risk nominal limits are applied, which are monitored by trading portfolios on daily basis by Risk Control. Any limit breach shall be reported in accordance with the regulations of Market Risk Policy. In addition to the aforementioned, also scenario analysis is applied in market risk management, which is used for valuing the performance of trading positions in case of more extreme fluctuations in market variables. The overall market risk is measured by using the Value at Risk (VaR) model. VaR is defined as a maximum potential loss that can arise with a certain degree of probability during a certain period of time. For day-to-day risk management, AS SEB Pank has chosen a probability level of 99 percent and a ten-day time horizon. VaR model enables to

AS SEB Pank, Annual Report 2008
- 51 -
effectively measure market risks associated with different instruments and the results are homogeneously comparable. Banking book ten-day average VaR in 2008 was EUR 1.5m (in 2007 EUR 2.2m). AS SEB Pank’s trading risk is relatively small. Equity trading book which was the biggest contributor to AS SEB Pank’s trading risk in 2007 (as per end 2007 ten-day VaR was EUR 0.9m, 2007 average VaR was EUR 1.0m) was significantly decreased by the end of 2008 (ten-day VaR was EUR 0.01m, 2008 average VaR was EUR 0.6m). Actual outcomes are monitored regularly to test the validity of assumptions and factors used in VaR calculation. The use of this approach does not prevent losses outside of these limits in the event of more significant market movements. To withstand the ongoing global financial crisis AS SEB Pank has decreased the trading positions and reduced mismatch in the banking book. Also additional stress testing has been performed to analyse possible worst case scenarios.
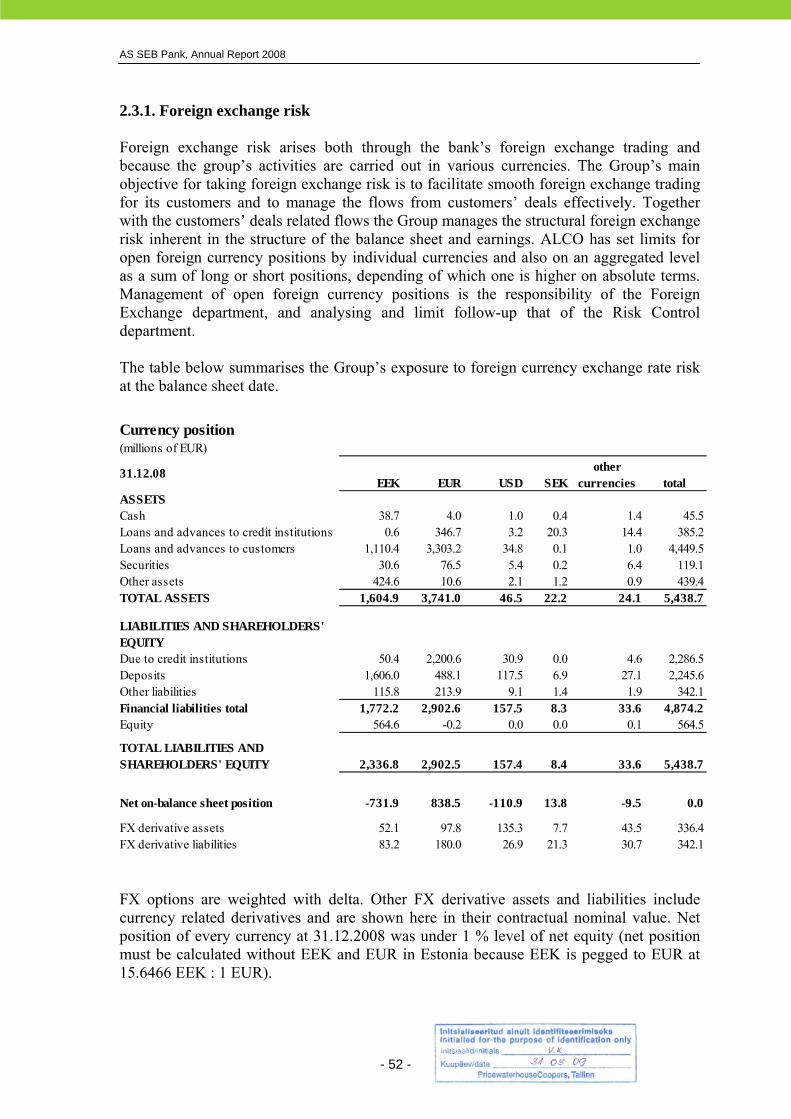
AS SEB Pank, Annual Report 2008
- 52 -
2.3.1. Foreign exchange risk Foreign exchange risk arises both through the bank’s foreign exchange trading and because the group’s activities are carried out in various currencies. The Group’s main objective for taking foreign exchange risk is to facilitate smooth foreign exchange trading for its customers and to manage the flows from customers’ deals effectively. Together with the customers’ deals related flows the Group manages the structural foreign exchange risk inherent in the structure of the balance sheet and earnings. ALCO has set limits for open foreign currency positions by individual currencies and also on an aggregated level as a sum of long or short positions, depending of which one is higher on absolute terms. Management of open foreign currency positions is the responsibility of the Foreign Exchange department, and analysing and limit follow-up that of the Risk Control department. The table below summarises the Group’s exposure to foreign currency exchange rate risk at the balance sheet date.
FX options are weighted with delta. Other FX derivative assets and liabilities include currency related derivatives and are shown here in their contractual nominal value. Net position of every currency at 31.12.2008 was under 1 % level of net equity (net position must be calculated without EEK and EUR in Estonia because EEK is pegged to EUR at 15.6466 EEK : 1 EUR).
Currency position(millions of EUR)
31.12.08EEK EUR USD SEK
other currencies total
ASSETSCash 38.7 4.0 1.0 0.4 1.4 45.5Loans and advances to credit institutions 0.6 346.7 3.2 20.3 14.4 385.2Loans and advances to customers 1,110.4 3,303.2 34.8 0.1 1.0 4,449.5Securities 30.6 76.5 5.4 0.2 6.4 119.1Other assets 424.6 10.6 2.1 1.2 0.9 439.4TOTAL ASSETS 1,604.9 3,741.0 46.5 22.2 24.1 5,438.7
LIABILITIES AND SHAREHOLDERS' EQUITYDue to credit institutions 50.4 2,200.6 30.9 0.0 4.6 2,286.5Deposits 1,606.0 488.1 117.5 6.9 27.1 2,245.6Other liabilities 115.8 213.9 9.1 1.4 1.9 342.1Financial liabilities total 1,772.2 2,902.6 157.5 8.3 33.6 4,874.2Equity 564.6 -0.2 0.0 0.0 0.1 564.5
TOTAL LIABILITIES AND SHAREHOLDERS' EQUITY 2,336.8 2,902.5 157.4 8.4 33.6 5,438.7
Net on-balance sheet position -731.9 838.5 -110.9 13.8 -9.5 0.0
FX derivative assets 52.1 97.8 135.3 7.7 43.5 336.4FX derivative liabilities 83.2 180.0 26.9 21.3 30.7 342.1
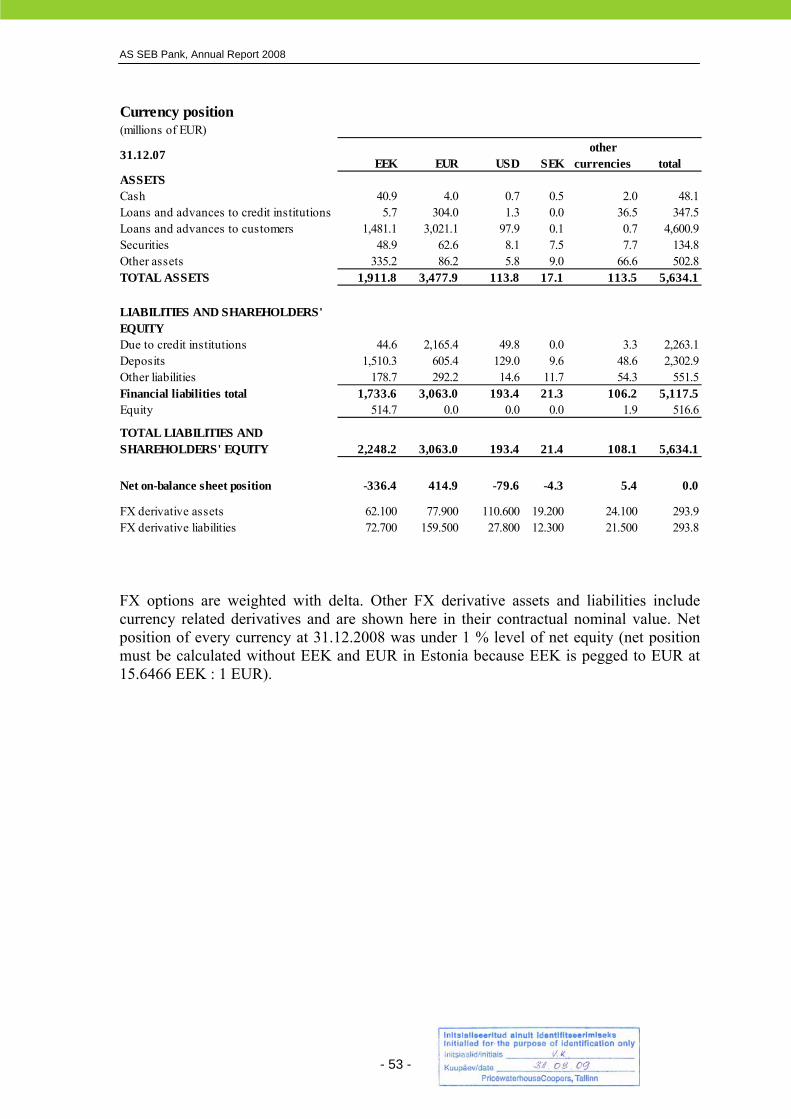
AS SEB Pank, Annual Report 2008
- 53 -
FX options are weighted with delta. Other FX derivative assets and liabilities include currency related derivatives and are shown here in their contractual nominal value. Net position of every currency at 31.12.2008 was under 1 % level of net equity (net position must be calculated without EEK and EUR in Estonia because EEK is pegged to EUR at 15.6466 EEK : 1 EUR).
Currency position(millions of EUR)
31.12.07EEK EUR USD SEK
other currencies total
ASSETSCash 40.9 4.0 0.7 0.5 2.0 48.1Loans and advances to credit institutions 5.7 304.0 1.3 0.0 36.5 347.5Loans and advances to customers 1,481.1 3,021.1 97.9 0.1 0.7 4,600.9Securities 48.9 62.6 8.1 7.5 7.7 134.8Other assets 335.2 86.2 5.8 9.0 66.6 502.8TOTAL ASSETS 1,911.8 3,477.9 113.8 17.1 113.5 5,634.1
LIABILITIES AND SHAREHOLDERS' EQUITYDue to credit institutions 44.6 2,165.4 49.8 0.0 3.3 2,263.1Deposits 1,510.3 605.4 129.0 9.6 48.6 2,302.9Other liabilities 178.7 292.2 14.6 11.7 54.3 551.5Financial liabilities total 1,733.6 3,063.0 193.4 21.3 106.2 5,117.5Equity 514.7 0.0 0.0 0.0 1.9 516.6
TOTAL LIABILITIES AND SHAREHOLDERS' EQUITY 2,248.2 3,063.0 193.4 21.4 108.1 5,634.1
Net on-balance sheet position -336.4 414.9 -79.6 -4.3 5.4 0.0
FX derivative assets 62.100 77.900 110.600 19.200 24.100 293.9FX derivative liabilities 72.700 159.500 27.800 12.300 21.500 293.8

AS SEB Pank, Annual Report 2008
- 54 -
The following table presents sensitivities of profit and loss and equity to reasonable possible changes in exchange rates applied at balance sheet date, with all other variables held constant:
Euro was excluded from the calculation as Estonian kroon exchange rate is pegged against Euro. In 2008 foreign currencies volatilities against Estonian kroon were significantly higher than in 2007. Although higher sensitivity ratio was applied, the impact on profit or loss and equity is in total smaller than in 2007, as the Group’s exposures have been decreased. The Group’s exposure to currency risk at the balance sheet date is representative of the typical exposure during the year, therefore no additional information about annual average is provided here. 2.3.2. Interest rate risk Cash flow interest rate risk is the risk that the future cash flows of a financial instrument will fluctuate because of changes in market interest rates. Fair value interest rate risk is the risk that the value of a financial instrument will fluctuate because of changes in market interest rates. The Group takes on exposure to the effects of fluctuations in the prevailing levels of market interest rates on both its fair value and cash flow risks. Interest margins may increase as a result of such changes but may reduce losses in the event that unexpected movements arise. The Group uses Delta1% methodology for measuring the ALM (assets-liability mismatch) risk, arising from the structure of interest earning assets and interest bearing liabilities. AS SEB Pank defines Delta1% as decrease of potential return due to one-percent change in market rates. In Delta1% calculation it is assumed there is a parallel shift in the yield curve, which means that all interest rates (long- and short-term) will change by 100 b.p. Delta1% method enables to effectively measure the impact of interest rate changes to interest bearing assets and liabilities. Delta1% limit is monitored as a negative or positive
At 31 December 2008 At 31 December 2007
In thousands of EUR
Impact on profit or
lossImpact on
equity
Impact on profit or
lossImpact on
equity
Currencies strengthening by 10% (2007: 5% )
USD strengthening by 10% (2007: 5%) -258 2 -21
RUB strenghtening by 10% (2007: 5%) 120 349 -98
SEK strenghtening by 10% (2007: 5%) 21 -64
Other (excluding EUR) strenghtening by 10% (2007: 5%) 209 -7 180
TOTAL 92 -5 444 -98
Currencies weakening by 10% (2007: 5% )
USD weakening by 10% (2007: 5%) 258 -2 21
RUB weakening by 10% (2007: 5%) -120 -349 98
SEK weakening by 10% (2007: 5%) -21 64
Other (excluding EUR) weakening by 10% (2007: 5%) -209 7 -180
TOTAL -92 5 -444 98
AS SEB Pank, Annual Report 2008
- 55 -
net position respectively, depending of which one is higher. Delta1% should be kept within the limit set by ALCO. Daily management of interest rate risk is the responsibility of the Treasury, and analysing that of the Risk Control department. As per year end, Delta1% was EUR –3.9m (2007: EUR -5.6m). 2008 average Delta1% was EUR -3.7m (2007: EUR -5.0m). The Group Delta1% has been negative which means that the average duration of interest bearing assets is higher than average duration of interest bearing liabilities and the Group is more exposed to interest rate increase. The biggest contributors to the Delta1% figure are loans from the asset side and deposits and funding from the parent company from the liabilities side which balance the mismatch from loans. Further information on interest rate sensitivity can be found through table below “Interest earning assets and interest bearing liabilities by interest repricing period”. In addition to Delta 1%measure the group also assesses the interest risk that would realise in net interest income to be different, in case the interest rates on the market were to change by 1%, i.e. showing the effect on net interest income from these financial instruments that bear floating interest or where repricing of fixed interest is within one year and is not under control by the Group (exposed to market risk). Net interest income (NII) is exposed to external factors such as changes in Euribor, yield curve movements and competitive pressure. The NII risk depends on the overall business profile, especially mismatches between interest-bearing assets and liabilities in terms of volumes and repricing periods. The Group measures the NII risk as the potential change in income, over a pre-defined period, from a standardised shift in the yield curve. As per year-end, the one-year effect of a one per cent “up” scenario was EUR -0.3m (2007: EUR +0.3m). Monitoring and management of the NII risk gives a performance-oriented view and supplements the value-based perspective given by the Delta1% measure described above. Global liquidity crisis has resulted among other things higher interbank lending rates and higher funding costs for AS SEB Pank. To minimise the effect of these changes AS SEB Pank has been keeping assets-liabilities mismatch as low level as possible. Flexibility to assets-liabilities mismatch management is assured by the possibility to adjust funding from parent company.

AS SEB Pank, Annual Report 2008
- 56 -
The table below summarises the Group exposure to interest rate risk. It includes the Group’s financial assets and liabilities at carrying amounts, categorised by the earlier of contractual repricing or maturity date.
Table includes only interest earning assets and interest bearing liabilities. Liabilities don’t include insurance clients’ financial liabilities from investment contracts (Note 27) and provisions from insurance contracts (Note 31) and respective assets to cover the portfolio (total amunt of which being 6.3 million euros as at 31.12.2008 and 10.4 million euros as at 31.12.2007), which earn and bear interest, but the interest belongs to the clients. Also the table does not include the liabilities from factoring (Note 27), commissions for loans and discounting of deposits.
Interest earning assets and interest bearing liabilities by interest fixation period31.12.08
ASSETS < 1 month 1-3 months3-12
months1-2
years2-5
yearsover 5 years Total
Balance sheet
Due from central bank 366.2 0.0 0.0 0.0 0.0 0.0 366.2 366.8Due from credit institutions 384.7 0.0 0.0 0.0 0.0 0.0 384.7 385.2Due from customers 1,410.6 1,259.5 1,179.4 76.5 292.6 215.0 4,433.6 4,449.5Securities 11.7 8.1 1.6 0.7 5.8 11.8 39.7 47.7TOTAL ASSETS 2,173.2 1,267.6 1,181.0 77.2 298.4 226.8 5,224.2 5,249.2
LIABILITIESDue to credit institutions 560.9 535.8 817.2 90.4 250.4 5.8 2,260.5 2,286.5Due to customers 1,721.5 244.8 209.1 26.6 25.8 4.1 2,231.9 2,237.3Lending funds 0.1 0.2 1.0 1.2 2.6 3.0 8.1 8.3Issued debt securities 0.0 0.0 0.0 7.4 0.0 0.0 7.4 7.3Subordinated liabilities 0.0 50.0 117.0 0.0 0.0 0.0 167.0 167.5TOTAL LIABILITIES 2,282.5 830.8 1,144.3 125.6 278.8 12.9 4,674.9 4,706.9
Total interest repricing gap of on-balance sheet position -109.3 436.8 36.7 -48.4 19.6 213.9 549.3 542.3
Derivative assets 209.6 118.7 29.5 6.7 12.9 2.4 379.8 21.9
Irrevocable and revocable interest related assets 0.0 0.0 0.0 0.0 0.0 18.3 18.3 0.0
Derivative liabilities 210.9 122.4 30.2 6.7 12.9 2.4 385.5 27.3
Irrevocable and revocable interest related liabilities 55.7 64.5 236.5 7.7 3.8 2.9 371.1 0.0
Total interest repricing gap -166.3 368.6 -200.5 -56.1 15.8 229.3 190.8 536.9

AS SEB Pank, Annual Report 2008
- 57 -
2.3.3. Market risk related to life insurance asset-liability matching The market risk is one of the most important risks for AS SEB Elu- ja Pensionikindlustus. Market risk in a life insurance company derives from the risk of investing the assets under insurance contracts and investment contracts with guaranteed interest. This risk is managed in AS SEB Elu- ja Pensionikindlustus with an investment policy, which establishes investment restrictions of the aforementioned assets between different asset classes, as well as the diversification requirements of assumed positions towards the clients (Note 27). The European Union is working on new insurer capital adequacy requirements under project Solvency II, where the assessment of market risk plays a major part. AS SEB Elu- ja Pensionikindlustus is making efforts to assess its market risk in conformity with the Solvency II project and in line with the practices of other SEB Group life insurance companies.
31.12.07
ASSETS < 1 month 1-3 months3-12
months1-2
years2-5
yearsover 5 years Total
Balance sheet
Due from central bank 267.2 0.0 0.0 0.0 0.0 0.0 267.2 267.9Due from credit institutions 344.6 0.0 2.2 0.0 0.0 0.0 346.8 347.5Due from customers 1,689.6 1,235.0 1,235.2 73.0 245.7 106.1 4,584.6 4,600.9Securities 22.6 0.0 0.0 0.0 0.0 0.0 22.6 23.6TOTAL ASSETS 2,324.0 1,235.0 1,237.4 73.0 245.7 106.1 5,221.2 5,239.9
LIABILITIESDue to credit institutions 457.4 596.0 852.9 55.0 277.0 0.0 2,238.3 2,263.1Due to customers 1,799.7 186.6 217.4 59.2 19.6 3.9 2,286.4 2,293.7Lending funds 0.2 0.4 1.5 1.5 3.4 2.2 9.2 9.2Issued debt securities 0.0 3.2 31.9 0.0 9.0 0.0 44.1 45.0Subordinated liabilities 0.0 50.0 117.0 0.0 0.0 0.0 167.0 167.6TOTAL LIABILITIES 2,257.3 836.2 1,220.7 115.7 309.0 6.1 4,745.0 4,778.6
Total interest repricing gap of on-balance sheet position 66.7 398.8 16.7 -42.7 -63.3 100.0 476.2 461.3
Derivative assets 113.0 143.0 44.6 2.5 3.6 0.5 307.2 2.5
Irrevocable and revocable interest related assets 0.0 0.0 0.0 5.2 0.0 25.0 30.2 0.0
Derivative liabilities 113.3 142.6 44.6 2.5 3.6 0.5 307.1 2.4
Irrevocable and revocable interest related liabilities 48.2 74.0 342.6 18.0 10.2 2.0 495.0 0.0
Total interest repricing gap 18.2 325.2 -325.9 -55.5 -73.5 123.0 11.5 461.4
AS SEB Pank, Annual Report 2008
- 58 -
2.3.4. Equity price risk Equity price risk arises within market making and trading in equities and related instruments. AS SEB Pank’s equity price risk in trading portfolio as described in chapter 2.3 is not significant. Equity trading portfolio amounted to EUR 0.3m as per end 2008 (EUR 9.2m as per end 2007). 2.4. Insurance risk In its business activities, AS SEB Elu- ja Pensionikindlustus concludes contracts which transfer insurance risk from the policyholder to the company. The insurance risk with regard to an individual contract is defined as a probability that an event, set out in the contract will take place (the insured event) and as uncertainty about the amount payable as a result of it. A corresponding individual risk as the main basis of insurance is incidental and therefore unpredictable. With regard to the portfolio of insurance contracts whose income (premium rates) and provisions are calculated on the basis of the theory of probability, the insurance risk lies in the fact that the actual payments of damages and claims prove to be larger than the recognised (calculated) insurance liabilities. Such a situation may appear if the frequency of the insured events or the amount of individual events exceed the expectations and assumptions of the company. The occurrence of insured events is incidental and therefore the amount of damages and claims differs by years from the assumptions created by using statistical techniques. The larger the portfolio of insurance contracts with similar risk, the smaller the estimated difference of the actual result from the statistical calculated assumption. In addition, a larger variety of risks leads to a smaller probability of the occurrence of one-way events and hence also to a smaller risk of the whole portfolio. AS SEB Elu- ja Pensionikindlustus uses different methods to control and manage insurance risk. The company will use new death rate tables if the tariffs established on the basis of the current death rate tables do not cover sufficiently the insurance risks. The company controls and manages insurance risk also through risk management (underwriting) procedures. The company has also applied the medical examination requirement to the policyholders, if the insured amount of the insurance contract entered into is over 25,565 euros for those who are older than 45 years and 31,956 euros for those who are younger than 45 years. In addition to the above, the company has delimited its participation in respect of the maximum loss of an individual case through a reinsurance contract, under which all risks from individual event, which exceed 1,278-63,912 euros (subject to a contract) are covered by the reinsurer. SEB Elu- ja Pensionikindlustus reinsurance partners are reinsurance companies Swiss re and GenRe.
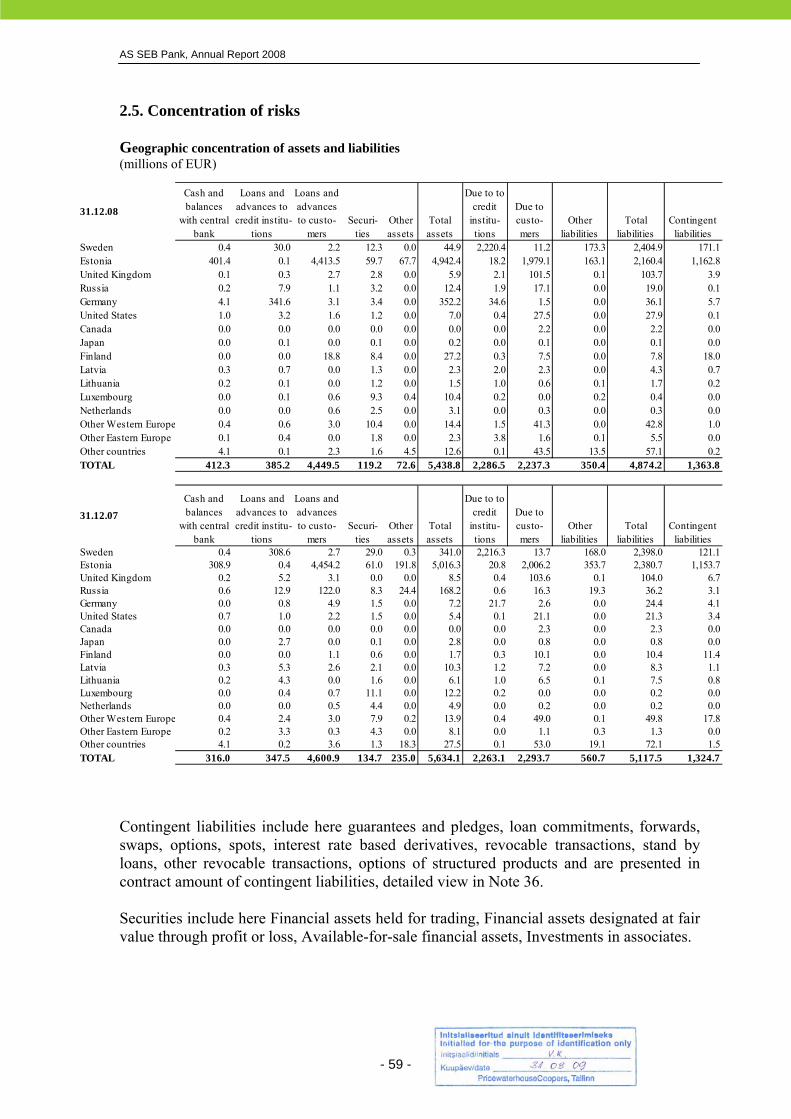
AS SEB Pank, Annual Report 2008
- 59 -
2.5. Concentration of risks Geographic concentration of assets and liabilities (millions of EUR)
Contingent liabilities include here guarantees and pledges, loan commitments, forwards, swaps, options, spots, interest rate based derivatives, revocable transactions, stand by loans, other revocable transactions, options of structured products and are presented in contract amount of contingent liabilities, detailed view in Note 36. Securities include here Financial assets held for trading, Financial assets designated at fair value through profit or loss, Available-for-sale financial assets, Investments in associates.
31.12.08
Cash and balances
with central bank
Loans and advances to credit institu-
tions
Loans and advances to custo-
mersSecuri-
tiesOther assets
Total assets
Due to to credit
institu- tions
Due to custo- mers
Other liabilities
Total liabilities
Contingent liabilities
Sweden 0.4 30.0 2.2 12.3 0.0 44.9 2,220.4 11.2 173.3 2,404.9 171.1Estonia 401.4 0.1 4,413.5 59.7 67.7 4,942.4 18.2 1,979.1 163.1 2,160.4 1,162.8United Kingdom 0.1 0.3 2.7 2.8 0.0 5.9 2.1 101.5 0.1 103.7 3.9Russia 0.2 7.9 1.1 3.2 0.0 12.4 1.9 17.1 0.0 19.0 0.1Germany 4.1 341.6 3.1 3.4 0.0 352.2 34.6 1.5 0.0 36.1 5.7United States 1.0 3.2 1.6 1.2 0.0 7.0 0.4 27.5 0.0 27.9 0.1Canada 0.0 0.0 0.0 0.0 0.0 0.0 0.0 2.2 0.0 2.2 0.0Japan 0.0 0.1 0.0 0.1 0.0 0.2 0.0 0.1 0.0 0.1 0.0Finland 0.0 0.0 18.8 8.4 0.0 27.2 0.3 7.5 0.0 7.8 18.0Latvia 0.3 0.7 0.0 1.3 0.0 2.3 2.0 2.3 0.0 4.3 0.7Lithuania 0.2 0.1 0.0 1.2 0.0 1.5 1.0 0.6 0.1 1.7 0.2Luxembourg 0.0 0.1 0.6 9.3 0.4 10.4 0.2 0.0 0.2 0.4 0.0Netherlands 0.0 0.0 0.6 2.5 0.0 3.1 0.0 0.3 0.0 0.3 0.0Other Western Europe 0.4 0.6 3.0 10.4 0.0 14.4 1.5 41.3 0.0 42.8 1.0Other Eastern Europe 0.1 0.4 0.0 1.8 0.0 2.3 3.8 1.6 0.1 5.5 0.0Other countries 4.1 0.1 2.3 1.6 4.5 12.6 0.1 43.5 13.5 57.1 0.2TOTAL 412.3 385.2 4,449.5 119.2 72.6 5,438.8 2,286.5 2,237.3 350.4 4,874.2 1,363.8
31.12.07
Cash and balances
with central bank
Loans and advances to credit institu-
tions
Loans and advances to custo-
mersSecuri-
tiesOther assets
Total assets
Due to to credit
institu- tions
Due to custo- mers
Other liabilities
Total liabilities
Contingent liabilities
Sweden 0.4 308.6 2.7 29.0 0.3 341.0 2,216.3 13.7 168.0 2,398.0 121.1Estonia 308.9 0.4 4,454.2 61.0 191.8 5,016.3 20.8 2,006.2 353.7 2,380.7 1,153.7United Kingdom 0.2 5.2 3.1 0.0 0.0 8.5 0.4 103.6 0.1 104.0 6.7Russia 0.6 12.9 122.0 8.3 24.4 168.2 0.6 16.3 19.3 36.2 3.1Germany 0.0 0.8 4.9 1.5 0.0 7.2 21.7 2.6 0.0 24.4 4.1United States 0.7 1.0 2.2 1.5 0.0 5.4 0.1 21.1 0.0 21.3 3.4Canada 0.0 0.0 0.0 0.0 0.0 0.0 0.0 2.3 0.0 2.3 0.0Japan 0.0 2.7 0.0 0.1 0.0 2.8 0.0 0.8 0.0 0.8 0.0Finland 0.0 0.0 1.1 0.6 0.0 1.7 0.3 10.1 0.0 10.4 11.4Latvia 0.3 5.3 2.6 2.1 0.0 10.3 1.2 7.2 0.0 8.3 1.1Lithuania 0.2 4.3 0.0 1.6 0.0 6.1 1.0 6.5 0.1 7.5 0.8Luxembourg 0.0 0.4 0.7 11.1 0.0 12.2 0.2 0.0 0.0 0.2 0.0Netherlands 0.0 0.0 0.5 4.4 0.0 4.9 0.0 0.2 0.0 0.2 0.0Other Western Europe 0.4 2.4 3.0 7.9 0.2 13.9 0.4 49.0 0.1 49.8 17.8Other Eastern Europe 0.2 3.3 0.3 4.3 0.0 8.1 0.0 1.1 0.3 1.3 0.0Other countries 4.1 0.2 3.6 1.3 18.3 27.5 0.1 53.0 19.1 72.1 1.5TOTAL 316.0 347.5 4,600.9 134.7 235.0 5,634.1 2,263.1 2,293.7 560.7 5,117.5 1,324.7

AS SEB Pank, Annual Report 2008
- 60 -
Concentration of financial assets and liabilities by economic sector(millions of EUR)
31.12.08 In balance sheet
Economic sector
Cash and loans to central bank,
credit institutions and
customers SecuritiesFinance 798.7 16.7 318.2Real estate 735.1 38.2 164.8Industry 359.7 3.1 100.4Trading 327.5 8.9 180.5Transport 246.7 2.3 88.1Energy, gas and steam plants 150.4 0.0 87.9Agriculture, fishing, forestry 130.6 0.3 6.6Government and state defence 113.1 0.2 24.4Construction 88.8 3.0 116.1Hotels, restaurants 77.3 0.4 12.4Health services, social work 59.8 0.8 7.0Administration and assistance 53.7 2.2 13.2Art, showbusiness, leisure 37.1 2.6 20.6Professional, science and technical work 22.5 0.0 5.6Water supply, canalization, waste management 21.7 0.0 5.8Information and telecommunication 20.1 2.6 6.8Education 18.3 0.0 16.1Mining 3.7 0.7 0.3Exterritorial organisations 0.0 0.2 0.0Other government & social services 62.2 12.3 4.1Individuals 1,989.9 0.2 184.8Derivatives 0.0 24.5 0.0Allowances -69.9 - -TOTAL 5,247.0 119.2 1,363.7
31.12.07 In balance sheet
Economic sector
Cash and loans to central bank,
credit institutions and
customers SecuritiesTrading 663.9 71.2 306.4Industry 461.2 3.9 176.6Finance 435.8 6.3 115.0Transport 274.3 4.7 113.2Real estate development 145.5 8.1 9.9Agriculture, hunting, forestry 125.5 0.0 11.3Energy, gas and water plants 117.3 1.7 60.8Government, soc.insurance 105.0 6.9 24.1Hotels, restaurants 104.8 0.0 6.1Construction 93.4 2.8 113.5Health services, social work 49.5 0.4 11.5Education 6.0 0.0 1.4Mining 4.3 0.1 0.3Fishing 2.0 0.0 0.1Exterritorial organisations 0.0 0.0 0.0Other business services 713.0 2.1 162.3Other government & social services 84.4 4.1 15.6Individuals 1,900.6 1.0 196.6Derivatives 0.0 21.4 0.0Allowances -22.1 0.0 0.0TOTAL 5,264.4 134.7 1,324.7
Contingent liabilities
Contingent liabilities
AS SEB Pank, Annual Report 2008
- 61 -
Contingent liabilities include here guarantees and pledges, loan commitments, forwards, swaps, options, spots, interest rate based derivatives, revocable transactions, stand by loans, other revocable transactions, options of structured products and are presented in contract amount of contingent liabilities, detailed view in Note 36. Securities include here Financial assets held for trading, Financial assets designated at fair value through profit or loss, Available-for-sale financial assets, Investments in associates. The maximum exposure for on and off balance sheet items, subject to credit risk, without taking account of collateral held or other credit enhancements, as of 31.12.2008 was 6.6 bio EUR and as of 31.12. 2007 was 6.6 bio EUR. 2.6. Liquidity risk Liquidity risk is defined as the risk of a loss or substantially higher costs than calculated due to the AS SEB Pank being forced to make business changes or borrow at unfavourable rates in order to meet its payment commitments on time. The bank's liquidity risk is regulated and managed on basis of the mandatory reserve of the Bank of Estonia and internal liquidity limits determined by ALCO. Liquidity risk is measured as cumulative cash flows arising from the assets and liabilities of the bank in various time bands. Liquidity management is based on special models reflecting cash flow behaviour in the case of different scenarios including crisis scenario. The Group’s liquidity management process, as carried out within the Group and monitored by Treasury, includes:
• Day-to-day funding, managed by monitoring future cash flows to ensure that requirements can be met. This includes replenishment of funds as they mature or are borrowed by customers;
• Maintaining a portfolio of highly marketable assets to fulfil mandatory reserve requirement;
• Monitoring liquidity gaps against internal limits; and • Managing the concentration and profile of debt maturities.
Long-term liquidity of the bank is planned and control over liquidity risk management is executed by ALCO. Central and daily management of the bank’s liquidity is the responsibility of the Treasury, and analysing that of the Risk Control department. In current economical situation additional assurance for AS SEB Pank to manage long-term liquidity gives belonging to the international banking group. Liquidity is managed in co-operation with SEB Group Treasury. Through the parent company AS SEB Pank has better access to the international money markets than on individual basis. Next table presents the cash flows payable by the Group under financial liabilities by remaining contractual maturity at the balance sheet date. The amounts disclosed in the table are the contractual undiscounted cash flows.
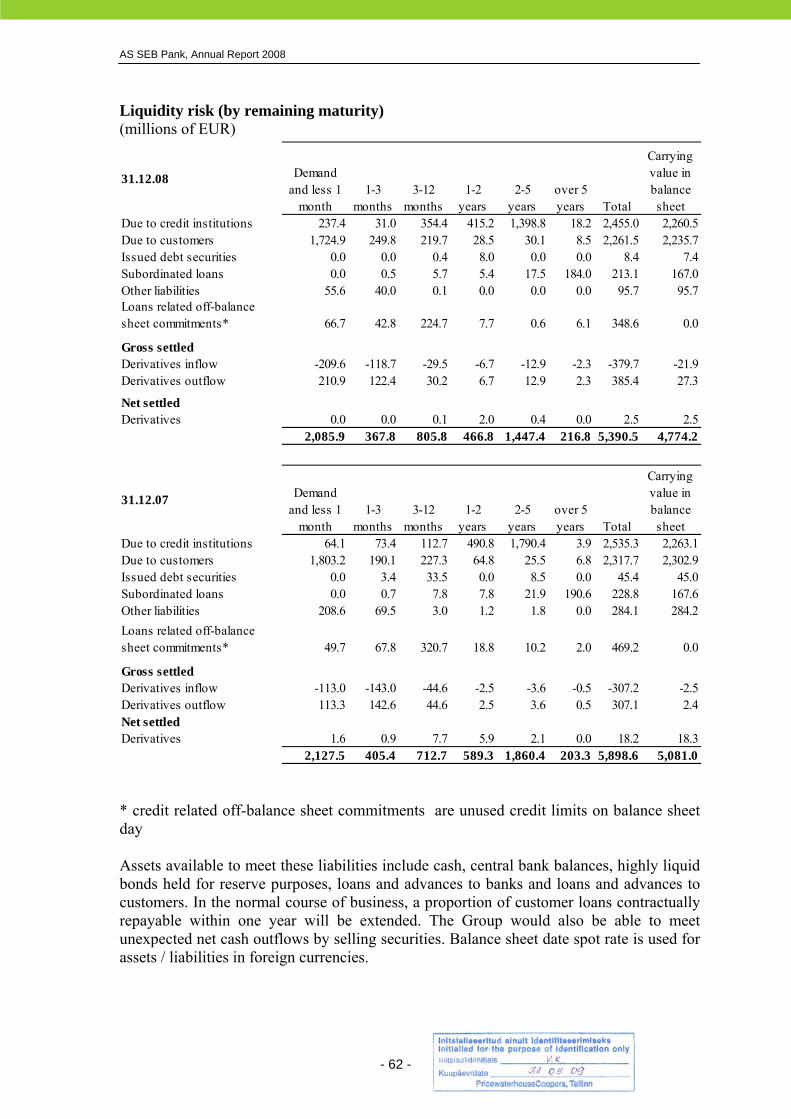
AS SEB Pank, Annual Report 2008
- 62 -
Liquidity risk (by remaining maturity) (millions of EUR)
* credit related off-balance sheet commitments are unused credit limits on balance sheet day Assets available to meet these liabilities include cash, central bank balances, highly liquid bonds held for reserve purposes, loans and advances to banks and loans and advances to customers. In the normal course of business, a proportion of customer loans contractually repayable within one year will be extended. The Group would also be able to meet unexpected net cash outflows by selling securities. Balance sheet date spot rate is used for assets / liabilities in foreign currencies.
31.12.08 Demand and less 1
month1-3
months3-12
months1-2
years2-5
yearsover 5 years Total
Carrying value in balance sheet
Due to credit institutions 237.4 31.0 354.4 415.2 1,398.8 18.2 2,455.0 2,260.5Due to customers 1,724.9 249.8 219.7 28.5 30.1 8.5 2,261.5 2,235.7Issued debt securities 0.0 0.0 0.4 8.0 0.0 0.0 8.4 7.4Subordinated loans 0.0 0.5 5.7 5.4 17.5 184.0 213.1 167.0Other liabilities 55.6 40.0 0.1 0.0 0.0 0.0 95.7 95.7Loans related off-balance sheet commitments* 66.7 42.8 224.7 7.7 0.6 6.1 348.6 0.0
Gross settledDerivatives inflow -209.6 -118.7 -29.5 -6.7 -12.9 -2.3 -379.7 -21.9Derivatives outflow 210.9 122.4 30.2 6.7 12.9 2.3 385.4 27.3
Net settledDerivatives 0.0 0.0 0.1 2.0 0.4 0.0 2.5 2.5
2,085.9 367.8 805.8 466.8 1,447.4 216.8 5,390.5 4,774.2
31.12.07 Demand and less 1
month1-3
months3-12
months1-2
years2-5
yearsover 5 years Total
Carrying value in balance sheet
Due to credit institutions 64.1 73.4 112.7 490.8 1,790.4 3.9 2,535.3 2,263.1Due to customers 1,803.2 190.1 227.3 64.8 25.5 6.8 2,317.7 2,302.9Issued debt securities 0.0 3.4 33.5 0.0 8.5 0.0 45.4 45.0Subordinated loans 0.0 0.7 7.8 7.8 21.9 190.6 228.8 167.6Other liabilities 208.6 69.5 3.0 1.2 1.8 0.0 284.1 284.2Loans related off-balance sheet commitments* 49.7 67.8 320.7 18.8 10.2 2.0 469.2 0.0
Gross settledDerivatives inflow -113.0 -143.0 -44.6 -2.5 -3.6 -0.5 -307.2 -2.5Derivatives outflow 113.3 142.6 44.6 2.5 3.6 0.5 307.1 2.4Net settledDerivatives 1.6 0.9 7.7 5.9 2.1 0.0 18.2 18.3
2,127.5 405.4 712.7 589.3 1,860.4 203.3 5,898.6 5,081.0

AS SEB Pank, Annual Report 2008
- 63 -
2.7. Operational risk Operational risk is the risk of loss due to external events (natural disasters, external crime, etc) or internal factors (e.g. breakdown of IT systems, mistakes, fraud, non-compliance with external and internal rules, other deficiencies in internal controls). AS SEB Pank has established Operational Risk Committee (ORC) – top level advisory group to group’s management on operational risk issues. Operational Risk Committee is a body guiding and co-ordinating the operational risk management in all units, including dealing with security issues, evaluation of technological risks and quality management, acting within the authority granted by the AS SEB Pank Management Board. Operational Risk Policy states minimum standards for operational risk management. AS SEB Pank has developed several techniques to identify, analyse, report and mitigate operational risk:
• Reporting of operational risk events (losses, near misses and extraordinary gains) with automated routing of issues to responsible managers.
• Regular monitoring of Key Risk Indicators. Key indicators serve as early warning signals about changes in risk level and business efficiency. Fluctuations of indicators and reasons of such fluctuations are discussed at monthly ORC meetings.
• Regular process of operational risk self-assessments (ORSA). • Follow-up compliance with New Product Approval Process requirements to
minimize operational risk in product development. • Business continuity planning - establishing business continuity plans for most
critical business processes, recovery plans for IT and insuring physical security in crisis situations.
AS SEB Pank uses an IT-based infrastructure for management of operational risk, security and compliance, the system is in use all over SEB Group. The system enables all staff to register risk-related issues and management at all levels to assess, monitor and mitigate risks and to compile prompt and timely reports. This facilitates management of risk exposures and minimises the severity of incidents in progress. The system also provides input to SEB group’s model for calculating the capital requirement under the Advanced Measurement Approaches. This model, which is used also for economic capital, is based on internal data and on operational losses of a considerable size that have actually occurred in the global financial sector. The quality of the risk management of the units, based upon their self-assessment, is taken into account. Effective operational risk management results in a lower allocation of capital. Insurance agreements concluded by SEB AB apply to AS SEB Pank and cover the following:
• crime insurance, • professional indemnity, • directors and officers liability, • damage caused to a third party resulting from the activity of the bank.
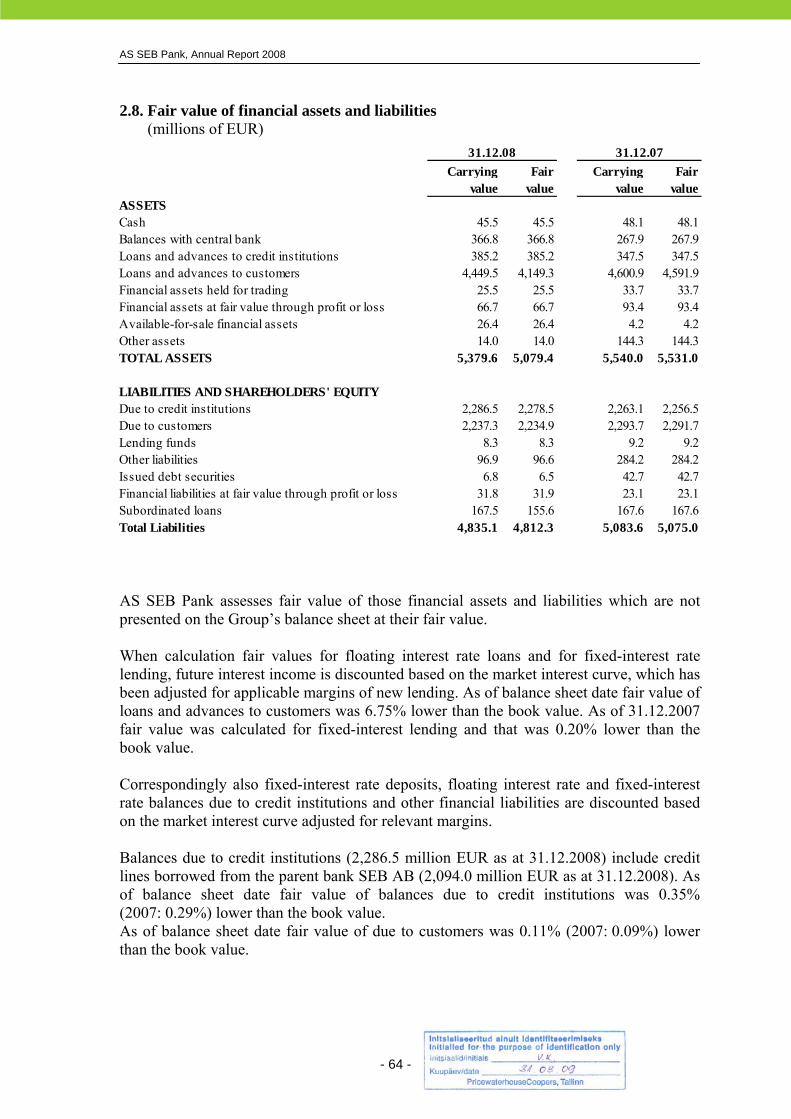
AS SEB Pank, Annual Report 2008
- 64 -
2.8. Fair value of financial assets and liabilities (millions of EUR)
AS SEB Pank assesses fair value of those financial assets and liabilities which are not presented on the Group’s balance sheet at their fair value. When calculation fair values for floating interest rate loans and for fixed-interest rate lending, future interest income is discounted based on the market interest curve, which has been adjusted for applicable margins of new lending. As of balance sheet date fair value of loans and advances to customers was 6.75% lower than the book value. As of 31.12.2007 fair value was calculated for fixed-interest lending and that was 0.20% lower than the book value. Correspondingly also fixed-interest rate deposits, floating interest rate and fixed-interest rate balances due to credit institutions and other financial liabilities are discounted based on the market interest curve adjusted for relevant margins. Balances due to credit institutions (2,286.5 million EUR as at 31.12.2008) include credit lines borrowed from the parent bank SEB AB (2,094.0 million EUR as at 31.12.2008). As of balance sheet date fair value of balances due to credit institutions was 0.35% (2007: 0.29%) lower than the book value. As of balance sheet date fair value of due to customers was 0.11% (2007: 0.09%) lower than the book value.
(millions of EUR) 31.12.08 31.12.07Carrying
valueFair
valueCarrying
valueFair
valueASSETSCash 45.5 45.5 48.1 48.1Balances with central bank 366.8 366.8 267.9 267.9Loans and advances to credit institutions 385.2 385.2 347.5 347.5Loans and advances to customers 4,449.5 4,149.3 4,600.9 4,591.9Financial assets held for trading 25.5 25.5 33.7 33.7Financial assets at fair value through profit or loss 66.7 66.7 93.4 93.4Available-for-sale financial assets 26.4 26.4 4.2 4.2Other assets 14.0 14.0 144.3 144.3TOTAL ASSETS 5,379.6 5,079.4 5,540.0 5,531.0
LIABILITIES AND SHAREHOLDERS' EQUITYDue to credit institutions 2,286.5 2,278.5 2,263.1 2,256.5Due to customers 2,237.3 2,234.9 2,293.7 2,291.7Lending funds 8.3 8.3 9.2 9.2Other liabilities 96.9 96.6 284.2 284.2Issued debt securities 6.8 6.5 42.7 42.7Financial liabilities at fair value through profit or loss 31.8 31.9 23.1 23.1Subordinated loans 167.5 155.6 167.6 167.6Total Liabilities 4,835.1 4,812.3 5,083.6 5,075.0

AS SEB Pank, Annual Report 2008
- 65 -
As of balance sheet date fair value of other financial liabilities was 0.35% (2007: 0%) lower than the book value. For insurance clients’ financial liability there has been performed a liability adequacy test (see Note 1.16 for results). 2.9. Capital management The Group’s Capital Policy defines how capital management should support the business goals. Shareholders’ return requirement shall be balanced against the capital requirements of the regulators and the equity necessary to conduct the business of the Group. ALCO and the Chief Financial Officer are responsible for the process linked to overall business planning, to assess capital requirements in relation to the Group’s risk profile, and to propose a strategy for maintaining the desired capital levels. Together with continuous monitoring, and reporting of the capital adequacy to the Management Board, this ensures that the relationships between shareholders’ equity and regulatory based requirements are managed in such a way that the Group does not jeopardise the profitability of the business and the financial strength of the Group. Capital ratios are the main communication vehicle for capital strength. Following the SEB Group Capital Policy the parent company shall promptly arrange for additional capital if SEB Pank requires capital injections to meet the decided level. The Group analyses the capital effects of Basel II by regularly assessing RWA levels under the new framework and by continuously observing national regulatory developments. The quality of the Group’s credit portfolio and the internal risk management culture translate into substantial RWA reductions – though limited by supervisory floors during the first years of the regime. However, this cannot be equated with a similar capital release, due to the framework’s increased business cycle sensitivity, supervisory evaluation and rating agency considerations. Good risk management notwithstanding, the Group must keep capital buffers against unexpected losses. The regulatory capital requirements serve as one measure of the necessary capital buffer to meet these risks. Requiring a more precise and risk-sensitive measure for internal capital assessment and performance evaluation, SEB group uses an economic capital framework. The Group’s performance evaluation shall be based on the Return on Business Equity („RoBE“) methodology. The Authority requires each bank or banking group to: (a) hold the minimum level of the regulatory capital: net-owners' equity must be over 5 million euros, and (b) maintain a ratio of total regulatory capital to the risk-weighted asset at or above minimum of 10%. According to Insurance Activities Act, The minimum share capital of an insurance undertaking shall be at 3 million euros if the insurance undertaking has the right to engage in life insurance (AS SEB Elu- ja Pensionikindlustus). According to Investment Funds Act, the share capital of a management company shall be equivalent to at least 3 million euros, if the management company manages a mandatory pension fund (AS SEB Varahaldus).

AS SEB Pank, Annual Report 2008
- 66 -
According to Securities Market Act, the share capital of an investment firm shall be equivalent to at least 125 thousand euros , if the firm is providing services of securities portfolio management and is organising the issuance of securities or public offers (AS SEB Enskilda).
Capital adequacy(millions of EUR) Basel II* Basel I
rules rulesCAPITAL BASE 31.12.08 31.12.07Paid-in share capital 42.5 42.5Premium 86.1 86.1General banking reserves 19.5 20.6Retained earnings / loss 356.1 366.8
-0.2 -Unrealised FX differences 0.0 -0.1Intangibles -25.0 -25.1Audited profit for the period (group without life insurance) 54.8Total primary own funds 533.8 490.8Subordinated debt (Note 32) 167.0 167.0Available for sale financial instruments -0.2 -Unrealised part of profit on shares of subsidiaries and associated companies 0.1 -Allowances and adjustments exceeding expected loss 0.0Total supplementary own funds 166.9 167.0Majority holding in other credit and financial institutions 0.2 0.2Majority holding in insurers 1.9 -Total deductions 2.1 0.2Total third level own funds - -Own funds included in calculation of capital adequacy 698.6 657.6
Unrealised profit for previous periods on shares of subsidiaries and associated companies (negative)

AS SEB Pank, Annual Report 2008
- 67 -
In Estonia the Basel II capital adequacy rules are in effect from January 1, 2007. Basel II is new capital adequacy framework which aims to converge regulative capital to the actual capital need of the bank according to its risk profile. Capital requirements for credit risk are reflecting the actual risk better than the previous rules, capital requirements for operational risk are introduced and the risk management and internal capital assessment of
Basel II* Basel Irules rules
CAPITAL REQUIREMENTS 31.12.08 31.12.07Central government and central banks with standardised approach 1.4Municipalities and regions with standardised approach 5.8
0.1Retail claims with standardised approach 18.5Overdue claims with standardised approach 0.2Shares of investment funds with standardised approach 0.3Other assets with standardised approach 5.8
1.3Other companies with IRB 180.0Retail claims with IRB 45.7
259.1 4,893.2Capital requirement for covering interest position risk 1.2Capital requirement for covering equity position risk 0.0
1.3 2.9AMA of operational risk 9.3Capital requirements total 269.7
416.1Capital requirements for calculating capital adequacy 416.1 4,896.1
Total capital requirements for covering the FX risk, commodity risk and position
Transition period floor of own funds if using IRB
*Basel II calculations are made for Group without AS SEB Elu- ja Pensionikindlustus (life insurance),holding in insurer is deducted. Basel I calculations are made for Group with AS SEB Elu- jaPensionikindlustus, holding in subsidiary is eliminated in group consolidation.
State agencies, non-profit institutions and associations with standardised approach
Credit institutions, investment firms and municipalities with IRB
Total capital requirements for covering the credit risk and counterparty credit risk (in Basel I risk weighted assets)
CAPITAL RATIOS Basel II* Basel Irules rules
31.12.08 31.12.07Capital adequacy (%) 16.79 13.20Tier 1 Capital Ratio (%) 12.80 9.85Tier 2 Capital Ratio (%) 3.99 3.35
AS SEB Pank AS SEB Elu- ja PensionikindlustusAS SEB Liising GroupAS SEB VarahaldusAS BangaloAS SEB EnskildaOÜ Strongler
MEMBERS OF CONSOLIDATION GROUP, INCLUDED TO CAPITAL ADEQUACY CALCULATION
MEMBERS OF CONSOLIDATION GROUP, NOT INCLUDED TO CAPITAL ADEQUACY CALCULATION

AS SEB Pank, Annual Report 2008
- 68 -
banks are subject to stricter scrutiny by the supervisors. In period 01.01.2008 - 30.06.2008 SEB Pank Group used standard method for calculation of credit risk and market risk and base method for calculating operational risk. From July 1, 2008, after respective permissions were granted by the supervisors, SEB Pank Group started to use the internal ratings based approach for reporting of credit risk and advanced approach for reporting of operational risk under Basel II. 2.10. Internal control system Internal control system is a management tool that covers the activities of the entire banking Group and forms an integral part of the internal processes in the bank and in the Group. The responsibility for the establishment and operation of internal control system lies with the Management Board; the need for and the scope of controls is determined by the extent and nature of the risks involved. The bank’s Supervisory Board carries out supervision of the activities of the bank and the entire Group by establishing the general risk management principles. To achieve the approved business goals, the Management Board of the bank establishes in accordance with the statutory requirements the necessary sub-plans, incl. competence and scope of liability as well as the internal rules that regulate activities, the accounting rules and the procedure for preparing and submitting operating reports. The Risk Control department co-ordinates the monitoring of the risks involved, and the reporting of the sufficiency of risk capital to the respective management bodies. The Internal Audit department and SEB group Audit Committee are responsible for monitoring of the existence and functioning of efficient internal control system. The SEB group Audit Committee co-ordinates the (internal) audit work in accordance with the group’s business objectives and overall risk assessment. 2.11. Compliance function Compliance function in SEB Pank Group is global and independent from the business organisation. Its tasks are to mitigate compliance risks, ensure compliance quality, drive and promote compliance issues. Compliance supports the business and management by securing that the business in SEB Pank Group is carried out in compliance with regulatory requirements. In matters of common interest, Compliance co-operates with the Legal, Internal Audit, Risk Control and Security functions. The areas of responsibility for the Compliance function relate to areas of customer protection, market conduct, prevention of money laundering and terrorist financing, regulatory systems and controls. The SEB Pank Group’s instruction for the handling of conflicts of interests, ethics policy, market abuse instruction, instruction on measures to prevent money laundering, Code of Business Conduct are of special importance.

AS SEB Pank, Annual Report 2008
- 69 -
Notes 3 - 40 to Financial Statements of AS SEB Pank Group(millions of EUR)
3. Interest and similar income2008 2007
Loans 257.0 203.8Leasing 49.2 46.4Deposits with other banks 12.1 9.5Fixed income securities 0.8 6.0
319.1 265.7
4. Interest expenses and similar charges2008 2007
Credit institutions -109.6 -91.4Time and other saving deposits -43.5 -33.1Demand deposits -34.7 -30.1Subordinated debts -9.4 -7.3Issued bonds -1.8 -1.0Loan funds -0.4 -0.4
-199.4 -163.3
5. Fee and commission income2008 2007
Credit and payment cards 24.1 24.1Securities market services 12.7 15.3Credit contracts* 8.9 13.8Transaction fees 8.4 7.8Non-life insurance brokerage fees 3.0 2.8Income from leasing agreements (full service) 2.9 3.4Corporate Finance fees 2.3 7.2Other 1.6 1.5Income from electronic channels 1.1 0.9Other settlement fees 0.9 0.7Cash handling fees 0.9 1.0
66.8 78.5
* Credit contracts include loan, leasing, letter of credit and guarantee contracts signed with customers,which are short-term and do not constitute interest income, but are of administrative nature forarrangement reorganisation of credits.
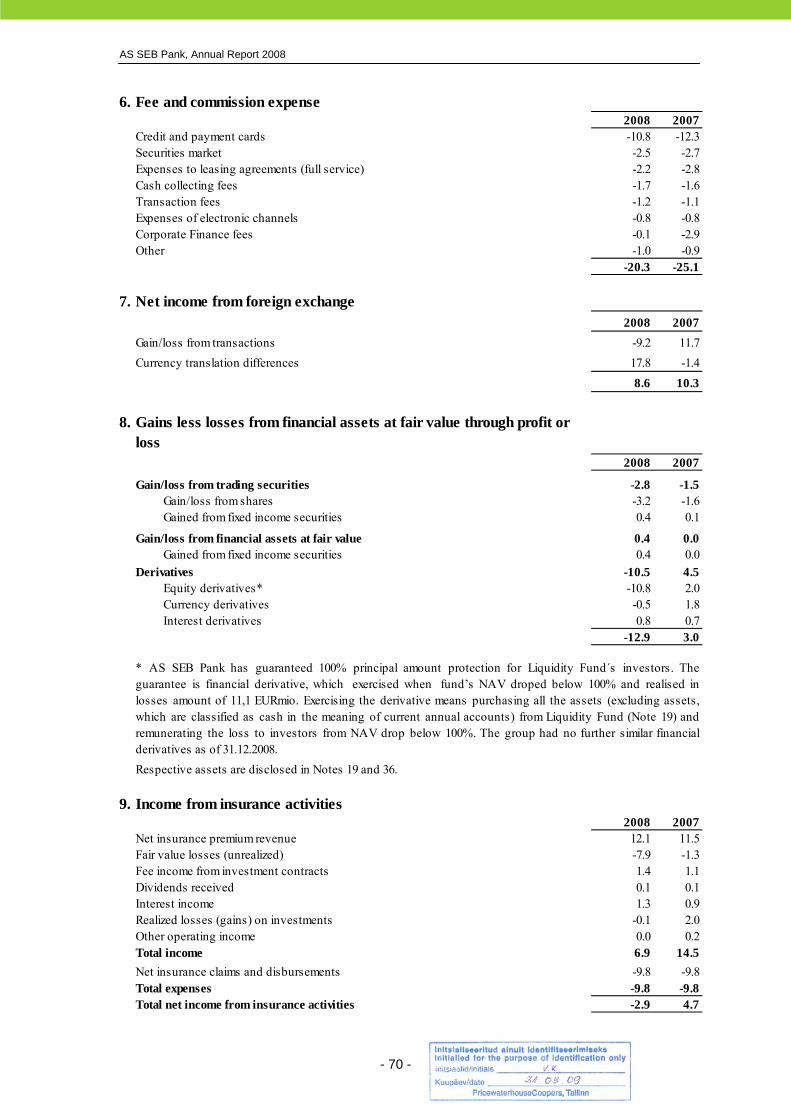
AS SEB Pank, Annual Report 2008
- 70 -
6. Fee and commission expense2008 2007
Credit and payment cards -10.8 -12.3Securities market -2.5 -2.7Expenses to leasing agreements (full service) -2.2 -2.8Cash collecting fees -1.7 -1.6Transaction fees -1.2 -1.1Expenses of electronic channels -0.8 -0.8Corporate Finance fees -0.1 -2.9Other -1.0 -0.9
-20.3 -25.1
7. Net income from foreign exchange2008 2007
Gain/loss from transactions -9.2 11.7Currency translation differences 17.8 -1.4
8.6 10.3
8.
2008 2007
-2.8 -1.5Gain/loss from shares -3.2 -1.6Gained from fixed income securities 0.4 0.1
0.4 0.0Gained from fixed income securities 0.4 0.0
Derivatives -10.5 4.5Equity derivatives* -10.8 2.0Currency derivatives -0.5 1.8Interest derivatives 0.8 0.7
-12.9 3.0
Respective assets are disclosed in Notes 19 and 36.
9. Income from insurance activities2008 2007
Net insurance premium revenue 12.1 11.5Fair value losses (unrealized) -7.9 -1.3Fee income from investment contracts 1.4 1.1Dividends received 0.1 0.1Interest income 1.3 0.9Realized losses (gains) on investments -0.1 2.0Other operating income 0.0 0.2Total income 6.9 14.5Net insurance claims and disbursements -9.8 -9.8Total expenses -9.8 -9.8Total net income from insurance activities -2.9 4.7
Gains less losses from financial assets at fair value through profit or loss
Gain/loss from trading securities
Gain/loss from financial assets at fair value
* AS SEB Pank has guaranteed 100% principal amount protection for Liquidity Fund´s investors. Theguarantee is financial derivative, which exercised when fund’s NAV droped below 100% and realised inlosses amount of 11,1 EURmio. Exercising the derivative means purchasing all the assets (excluding assets,which are classified as cash in the meaning of current annual accounts) from Liquidity Fund (Note 19) andremunerating the loss to investors from NAV drop below 100%. The group had no further similar financialderivatives as of 31.12.2008.

AS SEB Pank, Annual Report 2008
- 71 -
Development costs Costs associated with developing or maintaining computer software programmes are recognised as an expense as incurred. Advertising expenses and the launch of new products, services and processes are expensed as incurred. Expenditures related to trademarks, etc., to be developed inside the company are also expensed at the moment of their occurence (Note 1, page 26). In 2008 AS SEB Pank had expenses for the developing IT systems and electronic products in total amount of 2.8 million euros (2.8 million euros in 2007).
10. Other income2008 2007
Gains on sales of tangible assets and assets held for sale* 0.0 32.8Rental income** 0.1 0.9Penalties 0.3 0.2Other income 0.5 1.2
0.9 35.1
* The divestment of properties, owned by SEB Pank Group, explained in Note 20.
11. Personnel expenses2008 2007
Personnel expenses -31.0 -31.5Social security expenses -10.4 -10.4Other personnel expenses (hiring, training) -1.9 -2.2
-43.3 -44.1
12. Other expenses2008 2007
Penalties -0.1 -0.1Premises cost (rental and utilities)* -8.6 -4.8Advertizing and marketing -4.4 -4.5IT related expenses -4.4 -4.2Other administrative cost -3.9 -4.6Consulting -1.1 -0.8Information services -0.8 -0.6Legal services -0.7 -0.2Deferred acquisition costs -0.1 0.0Other operating expenses -2.2 -2.6
-26.3 -22.4
* Increased in 2008 in connection with the sales of properties that wereused as premises until the end of 2007 (Note 1).
** Rental income in 2008 was earned from properties held for sale and partial rent-out of buildings in our own use.

AS SEB Pank, Annual Report 2008
- 72 -
13. Impairment losses on loans and advances
2008 Credit insti-
tutionsLoans to
CorporatesLeases to
CorporatesHousing
loans
Other loans to Private
individualsSeized assets TOTAL
0.0 -30.9 -9.0 -5.9 -2.4 0.0 -48.2 new loan allowances (Note 18) 0.0 -39.2 -9.1 -8.2 -5.0 0.0 -61.5 recoveries from write-offs 0.0 0.2 0.1 0.0 0.2 0.0 0.5 reversals of allowances (Note 18) 0.0 8.1 0.0 2.3 2.4 0.0 12.8Assets held for sale (Note 23) 0.0 0.0 0.0 0.0 0.0 -0.5 -0.5 reappraisal 0.0 0.0 0.0 0.0 0.0 -0.6 -0.6 realized gains 0.0 0.0 0.0 0.0 0.0 0.1 0.1
0.0 -30.9 -9.0 -5.9 -2.4 -0.5 -48.7
2007 Credit insti-
tutionsLoans to
CorporatesLeases to
CorporatesHousing
loans
Other loans to Private
individualsSeized assets TOTAL
0.2 -5.5 -0.8 -2.8 -2.0 0.0 -10.9 new loan allowances (Note 18) 0.0 -6.7 -1.4 -2.8 -2.3 0.0 -13.2 recoveries from write-offs 0.0 0.9 0.0 0.0 0.2 0.0 1.1 reversals of allowances (Note 18) 0.2 0.3 0.6 0.0 0.1 0.0 1.2Assets held for sale (Note 23) 0.0 0.0 0.0 0.0 0.0 1.2 1.2 reappraisal 0.0 0.0 0.0 0.0 0.0 -0.2 -0.2 realized gains* 0.0 0.0 0.0 0.0 0.0 1.4 1.4
0.2 -5.5 -0.8 -2.8 -2.0 1.2 -9.7
* Realised gain 1.4 EURmio from the sale of real estate seized to secure the right of claimIncome tax14.Income tax
2008 2007Current income tax -0.1 -0.7
Deferred tax expense (Note 28) -0.1 -0.3
-0.2 -1.0
The Group activities include activities in Estonia and Russia.
2008 2007Profit before tax in Russia 1.6 2.3Income tax per tax rate applicable in Russia (24%) 0.4 0.5Tax on expenses not deductible for tax purposes* -0.2 0.4Income tax expense 0.2 0.9
* SEB Leasing´s differences between Russian Satutory accounting, IFRS an Tax accounting
Allowances for loans and advances to customers
Allowances for loans and advances to customers
According to Estonian Income tax law profits earned by the Group are not subject to income tax. The Group's activities inRussia are subject to Russian Income tax.The income tax rate in Russia is 24% of the taxable income. All deferred income tax expense is related to SEB Leasing.Following is the reconcilation of the net income before tax earned in Russia to the effective tax expense:
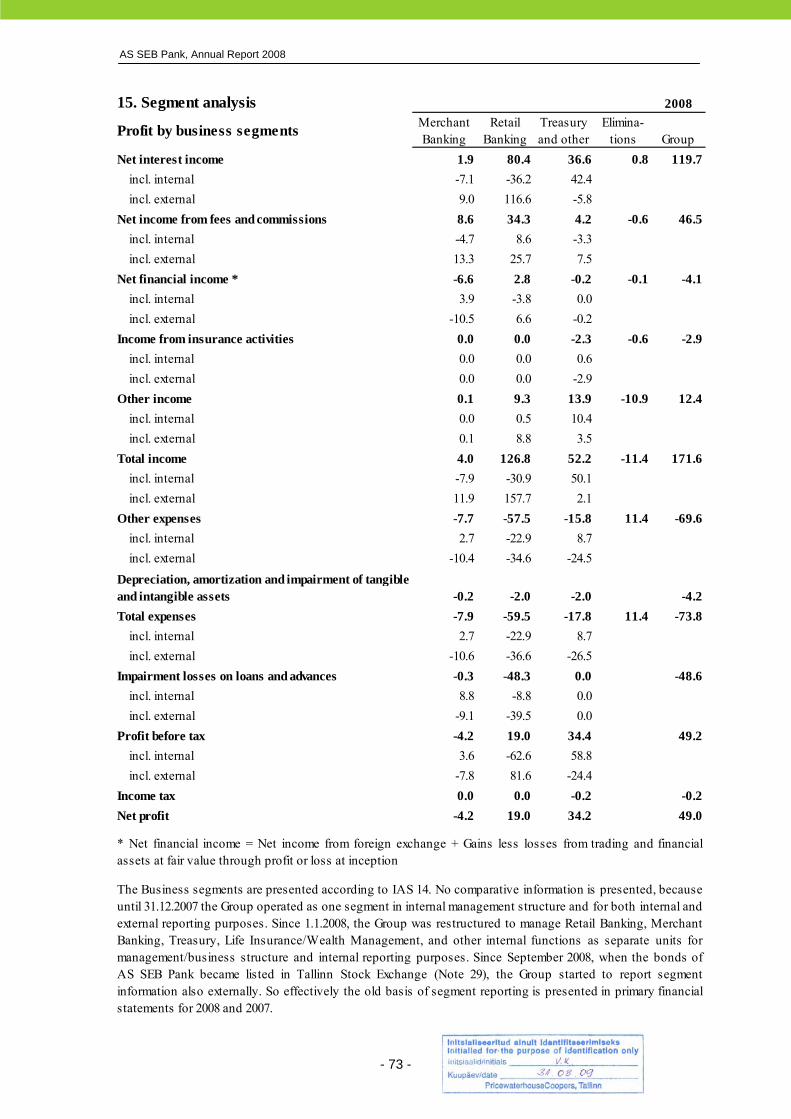
AS SEB Pank, Annual Report 2008
- 73 -
15. Segment analysis 2008
Profit by business segments Merchant Banking
Retail Banking
Treasury and other
Elimina- tions Group
Net interest income 1.9 80.4 36.6 0.8 119.7 incl. internal -7.1 -36.2 42.4 incl. external 9.0 116.6 -5.8Net income from fees and commissions 8.6 34.3 4.2 -0.6 46.5 incl. internal -4.7 8.6 -3.3 incl. external 13.3 25.7 7.5Net financial income * -6.6 2.8 -0.2 -0.1 -4.1 incl. internal 3.9 -3.8 0.0 incl. external -10.5 6.6 -0.2Income from insurance activities 0.0 0.0 -2.3 -0.6 -2.9 incl. internal 0.0 0.0 0.6 incl. external 0.0 0.0 -2.9Other income 0.1 9.3 13.9 -10.9 12.4 incl. internal 0.0 0.5 10.4 incl. external 0.1 8.8 3.5Total income 4.0 126.8 52.2 -11.4 171.6 incl. internal -7.9 -30.9 50.1 incl. external 11.9 157.7 2.1Other expenses -7.7 -57.5 -15.8 11.4 -69.6 incl. internal 2.7 -22.9 8.7 incl. external -10.4 -34.6 -24.5Depreciation, amortization and impairment of tangible and intangible assets -0.2 -2.0 -2.0 -4.2Total expenses -7.9 -59.5 -17.8 11.4 -73.8 incl. internal 2.7 -22.9 8.7 incl. external -10.6 -36.6 -26.5Impairment losses on loans and advances -0.3 -48.3 0.0 -48.6 incl. internal 8.8 -8.8 0.0 incl. external -9.1 -39.5 0.0Profit before tax -4.2 19.0 34.4 49.2 incl. internal 3.6 -62.6 58.8 incl. external -7.8 81.6 -24.4Income tax 0.0 0.0 -0.2 -0.2Net profit -4.2 19.0 34.2 49.0
* Net financial income = Net income from foreign exchange + Gains less losses from trading and financialassets at fair value through profit or loss at inception
The Business segments are presented according to IAS 14. No comparative information is presented, becauseuntil 31.12.2007 the Group operated as one segment in internal management structure and for both internal andexternal reporting purposes. Since 1.1.2008, the Group was restructured to manage Retail Banking, MerchantBanking, Treasury, Life Insurance/Wealth Management, and other internal functions as separate units formanagement/business structure and internal reporting purposes. Since September 2008, when the bonds ofAS SEB Pank became listed in Tallinn Stock Exchange (Note 29), the Group started to report segmentinformation also externally. So effectively the old basis of segment reporting is presented in primary financialstatements for 2008 and 2007.
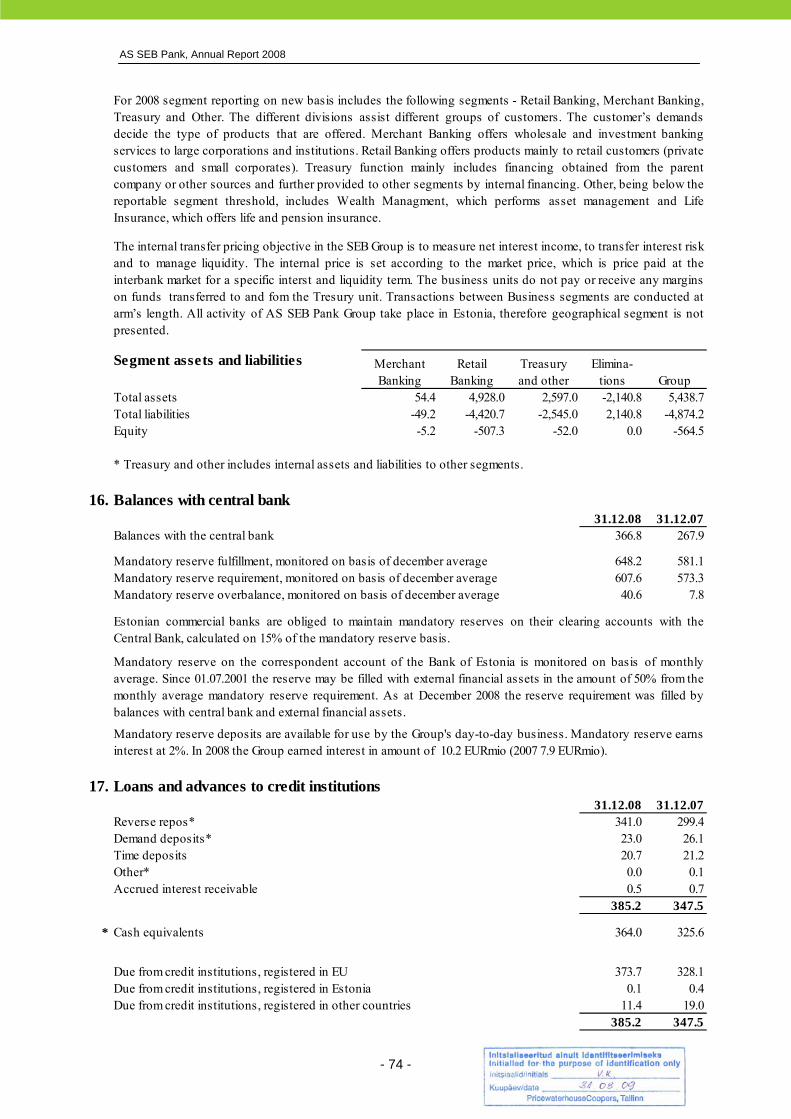
AS SEB Pank, Annual Report 2008
- 74 -
Segment assets and liabilities Merchant Banking
Retail Banking
Treasury and other
Elimina- tions Group
Total assets 54.4 4,928.0 2,597.0 -2,140.8 5,438.7Total liabilities -49.2 -4,420.7 -2,545.0 2,140.8 -4,874.2Equity -5.2 -507.3 -52.0 0.0 -564.5
16. Balances with central bank31.12.08 31.12.07
Balances with the central bank 366.8 267.9
Mandatory reserve fulfillment, monitored on basis of december average 648.2 581.1Mandatory reserve requirement, monitored on basis of december average 607.6 573.3Mandatory reserve overbalance, monitored on basis of december average 40.6 7.8
17. Loans and advances to credit institutions31.12.08 31.12.07
Reverse repos* 341.0 299.4Demand deposits* 23.0 26.1Time deposits 20.7 21.2Other* 0.0 0.1Accrued interest receivable 0.5 0.7
385.2 347.5
* Cash equivalents 364.0 325.6
Due from credit institutions, registered in EU 373.7 328.1Due from credit institutions, registered in Estonia 0.1 0.4Due from credit institutions, registered in other countries 11.4 19.0
385.2 347.5
Estonian commercial banks are obliged to maintain mandatory reserves on their clearing accounts with theCentral Bank, calculated on 15% of the mandatory reserve basis.
Mandatory reserve on the correspondent account of the Bank of Estonia is monitored on basis of monthlyaverage. Since 01.07.2001 the reserve may be filled with external financial assets in the amount of 50% from themonthly average mandatory reserve requirement. As at December 2008 the reserve requirement was filled bybalances with central bank and external financial assets.
Mandatory reserve deposits are available for use by the Group's day-to-day business. Mandatory reserve earnsinterest at 2%. In 2008 the Group earned interest in amount of 10.2 EURmio (2007 7.9 EURmio).
For 2008 segment reporting on new basis includes the following segments - Retail Banking, Merchant Banking,Treasury and Other. The different divisions assist different groups of customers. The customer’s demandsdecide the type of products that are offered. Merchant Banking offers wholesale and investment bankingservices to large corporations and institutions. Retail Banking offers products mainly to retail customers (privatecustomers and small corporates). Treasury function mainly includes financing obtained from the parentcompany or other sources and further provided to other segments by internal financing. Other, being below thereportable segment threshold, includes Wealth Managment, which performs asset management and LifeInsurance, which offers life and pension insurance.
The internal transfer pricing objective in the SEB Group is to measure net interest income, to transfer interest riskand to manage liquidity. The internal price is set according to the market price, which is price paid at theinterbank market for a specific interst and liquidity term. The business units do not pay or receive any marginson funds transferred to and fom the Tresury unit. Transactions between Business segments are conducted atarm’s length. All activity of AS SEB Pank Group take place in Estonia, therefore geographical segment is notpresented.
* Treasury and other includes internal assets and liabilities to other segments.
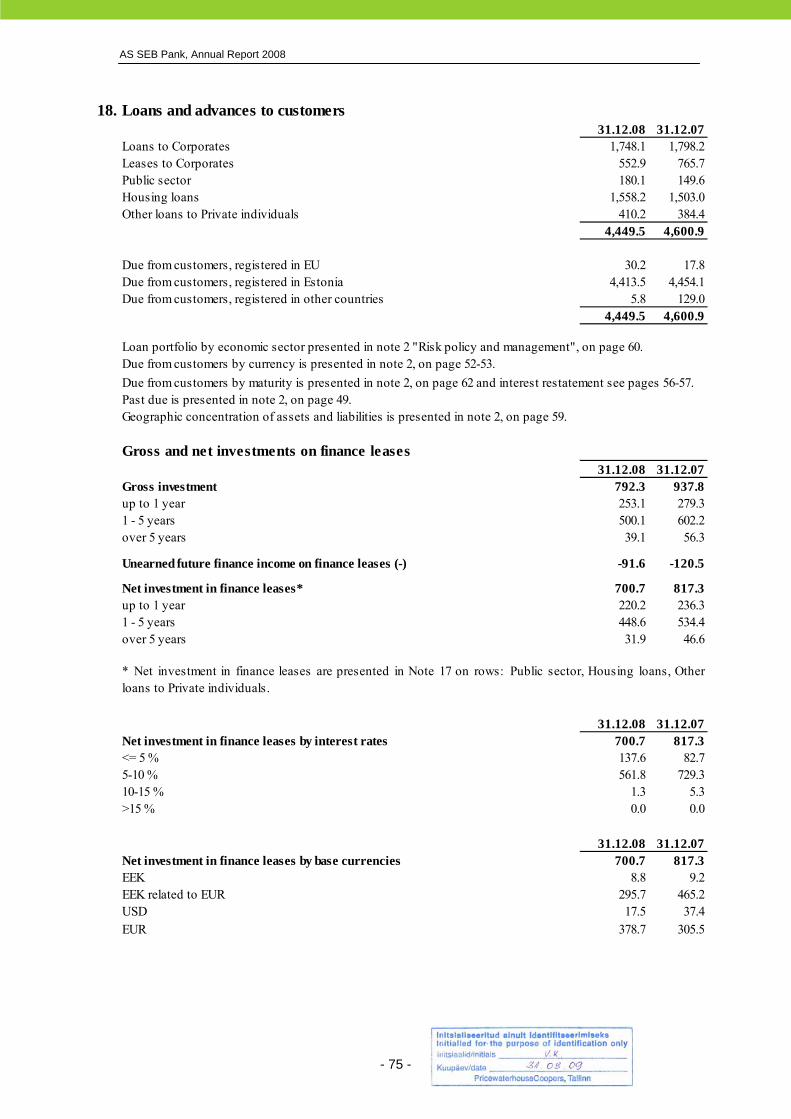
AS SEB Pank, Annual Report 2008
- 75 -
18. Loans and advances to customers31.12.08 31.12.07
Loans to Corporates 1,748.1 1,798.2Leases to Corporates 552.9 765.7Public sector 180.1 149.6Housing loans 1,558.2 1,503.0Other loans to Private individuals 410.2 384.4
4,449.5 4,600.94,449.5 4,600.9
Due from customers, registered in EU 30.2 17.8Due from customers, registered in Estonia 4,413.5 4,454.1Due from customers, registered in other countries 5.8 129.0
4,449.5 4,600.9
Due from customers by currency is presented in note 2, on page 52-53.
Past due is presented in note 2, on page 49.Geographic concentration of assets and liabilities is presented in note 2, on page 59.
Gross and net investments on finance leases31.12.08 31.12.07
Gross investment 792.3 937.8up to 1 year 253.1 279.31 - 5 years 500.1 602.2over 5 years 39.1 56.3
Unearned future finance income on finance leases (-) -91.6 -120.5
Net investment in finance leases* 700.7 817.3up to 1 year 220.2 236.31 - 5 years 448.6 534.4over 5 years 31.9 46.6
31.12.08 31.12.07Net investment in finance leases by interest rates 700.7 817.3<= 5 % 137.6 82.75-10 % 561.8 729.310-15 % 1.3 5.3>15 % 0.0 0.0
31.12.08 31.12.07Net investment in finance leases by base currencies 700.7 817.3EEK 8.8 9.2EEK related to EUR 295.7 465.2USD 17.5 37.4EUR 378.7 305.5
Loan portfolio by economic sector presented in note 2 "Risk policy and management", on page 60.
Due from customers by maturity is presented in note 2, on page 62 and interest restatement see pages 56-57.
* Net investment in finance leases are presented in Note 17 on rows: Public sector, Housing loans, Otherloans to Private individuals.

AS SEB Pank, Annual Report 2008
- 76 -
Allowances for impaired debt*
2008
Credit insti-
tutionsLoans to
CorporatesLeases to
CorporatesPublic sector
Housing loans
Other loans to Private
individuals TOTALAt the beginning of period (January, 1) 0.0 6.8 2.1 0.0 7.5 5.7 22.1Loan allowances (Note 13) 0.0 39.2 9.1 0.0 8.2 5.0 61.5Reversals of allowances (Note 13) 0.0 -8.1 0.0 0.0 -2.3 -2.4 -12.8Loans and advances written off 0.0 -0.4 -0.6 0.0 0.0 -0.1 -1.1Exchange rate adjustments 0.0 0.2 0.0 0.0 0.0 0.0 0.2At the end of period (December, 31) 0.0 37.7 10.6 0.0 13.4 8.2 69.9Recoveries from write-offs 0.0 -0.2 -0.1 0.0 0.0 -0.2 -0.5
2007
Credit insti-
tutionsLoans to
CorporatesLeases to
CorporatesPublic sector
Housing loans
Other loans to Private
individuals TOTALAt the beginning of period (January, 1) 0.3 1.7 4.7 0.0 4.7 3.7 15.1Loan allowances (Note 13) 0.0 6.7 1.4 0.0 2.8 2.3 13.2Reversals of allowances (Note 13) -0.2 -0.3 -0.6 0.0 0.0 -0.1 -1.2Loans and advances written off 0.0 -1.4 -3.3 0.0 0.0 -0.1 -4.8Exchange rate adjustments 0.0 0.0 -0.2 0.0 0.0 0.0 -0.2At the end of period (December, 31) 0.1 6.7 2.0 0.0 7.5 5.8 22.1Recoveries from write-offs 0.0 -0.9 0.0 0.0 0.0 -0.2 -1.1
19. Financial investments31.12.08 31.12.07
Financial assets held for trading 1.0 12.3Shares and fund participations 0.2 9.2incl. listed 0.2 9.2Debt securities and other fixed income securities 0.8 3.1incl. listed 0.8 1.9
Derivatives (Notes 36, 1.24) 24.5 21.4
66.7 93.4Shares and fund participations 35.2 62.5incl. listed 6.0 21.0Debt securities and other fixed income securities 31.5 30.9 incl. valuated based on discounted cash flow method * 4.0 -incl. listed 23.6 20.2
Available for sale financial assets 26.4 4.2Shares and fund participations** 4.6 4.2incl. listed 0.1 0.1Debt securities and other fixed income securities 21.8 0.0 incl. valuated based on discounted cash flow method * 16.5 -incl. listed 0.0 0.0
Total 118.6 131.3
Securities of entities, registered in EU 52.7 61.6Securities of entities, registered in Estonia 59.1 57.5Securities of entities, registered in other countries 6.8 12.2
118.6 131.3
* allowances include both allowances for loans to credit institutions and for loans and advances to customers
Financial assets at fair value through profit or loss at inception
Generally financial investments are revalued in fair value based on active market quotations.
* Yield curves for discounted cash flow method were determined based on market interest rates for respective currency andcredit spreads for respective issuer. Estonian kroon yield curve for longer maturities was constructed using EstonianGovernment Credit Default Swap spread. To capture each bond issuer credit risk, SEB internal credit rating (risk class) was usedas bases for credit spread.** Includes participations in pension funds managed by SEB Varahaldus in the total value of 3.4 mio EUR, ownership of which is required (1-2% of the specific managed fund) according to the Investment Fund's Act.
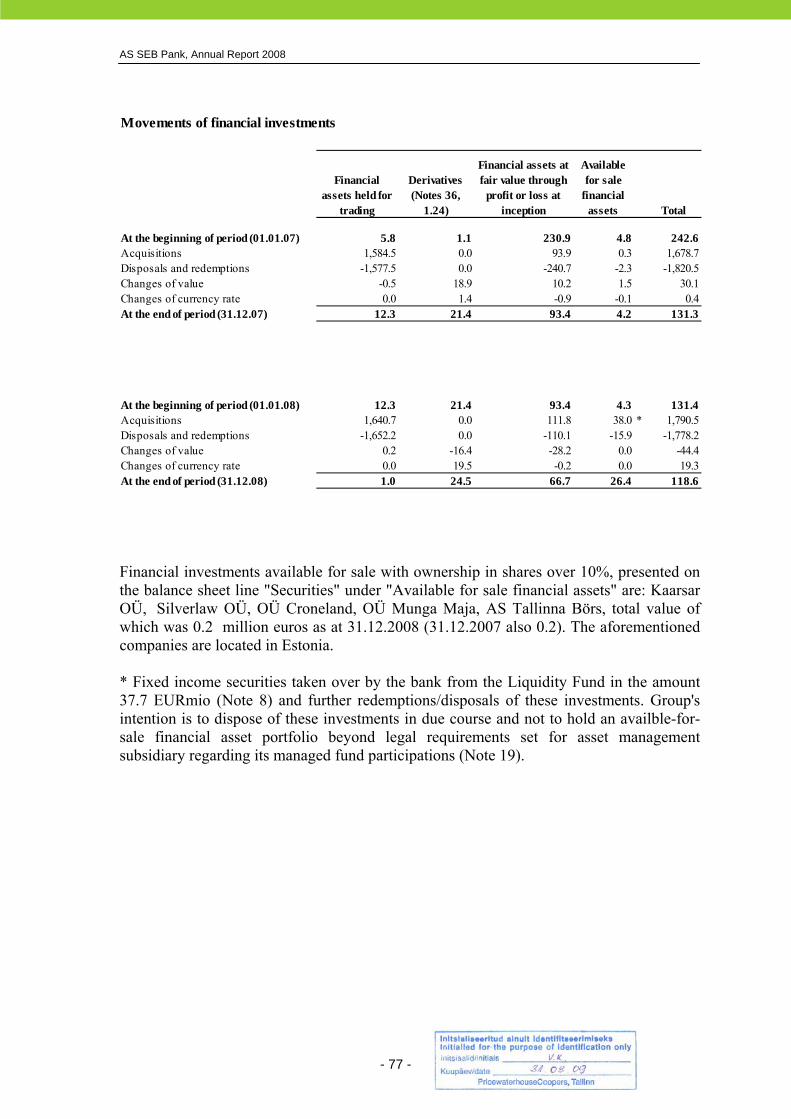
AS SEB Pank, Annual Report 2008
- 77 -
Financial investments available for sale with ownership in shares over 10%, presented on the balance sheet line "Securities" under "Available for sale financial assets" are: Kaarsar OÜ, Silverlaw OÜ, OÜ Croneland, OÜ Munga Maja, AS Tallinna Börs, total value of which was 0.2 million euros as at 31.12.2008 (31.12.2007 also 0.2). The aforementioned companies are located in Estonia. * Fixed income securities taken over by the bank from the Liquidity Fund in the amount 37.7 EURmio (Note 8) and further redemptions/disposals of these investments. Group's intention is to dispose of these investments in due course and not to hold an availble-for-sale financial asset portfolio beyond legal requirements set for asset management subsidiary regarding its managed fund participations (Note 19).
Movements of financial investments
Financial assets held for
trading
Derivatives (Notes 36,
1.24)
Financial assets at fair value through
profit or loss at inception
Available for sale
financial assets Total
At the beginning of period (01.01.07) 5.8 1.1 230.9 4.8 242.6Acquisitions 1,584.5 0.0 93.9 0.3 1,678.7Disposals and redemptions -1,577.5 0.0 -240.7 -2.3 -1,820.5Changes of value -0.5 18.9 10.2 1.5 30.1Changes of currency rate 0.0 1.4 -0.9 -0.1 0.4At the end of period (31.12.07) 12.3 21.4 93.4 4.2 131.3
12.3 21.4 93.4 4.2 131.3
At the beginning of period (01.01.08) 12.3 21.4 93.4 4.3 131.4Acquisitions 1,640.7 0.0 111.8 38.0 * 1,790.5Disposals and redemptions -1,652.2 0.0 -110.1 -15.9 -1,778.2Changes of value 0.2 -16.4 -28.2 0.0 -44.4Changes of currency rate 0.0 19.5 -0.2 0.0 19.3At the end of period (31.12.08) 1.0 24.5 66.7 26.4 118.6
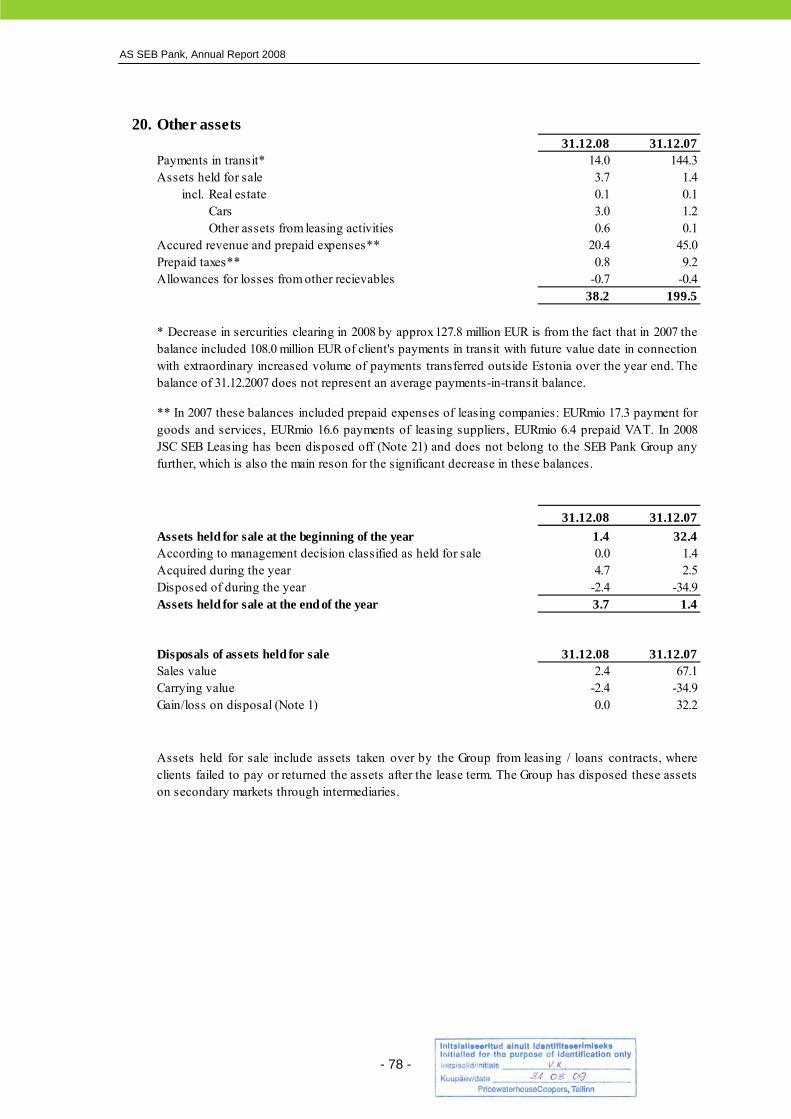
AS SEB Pank, Annual Report 2008
- 78 -
20. Other assets31.12.08 31.12.07
Payments in transit* 14.0 144.3Assets held for sale 3.7 1.4
incl. Real estate 0.1 0.1Cars 3.0 1.2Other assets from leasing activities 0.6 0.1
Accured revenue and prepaid expenses** 20.4 45.0Prepaid taxes** 0.8 9.2Allowances for losses from other recievables -0.7 -0.4
38.2 199.5
31.12.08 31.12.07Assets held for sale at the beginning of the year 1.4 32.4According to management decision classified as held for sale 0.0 1.4Acquired during the year 4.7 2.5Disposed of during the year -2.4 -34.9Assets held for sale at the end of the year 3.7 1.4
Disposals of assets held for sale 31.12.08 31.12.07Sales value 2.4 67.1Carrying value -2.4 -34.9Gain/loss on disposal (Note 1) 0.0 32.2
Assets held for sale include assets taken over by the Group from leasing / loans contracts, whereclients failed to pay or returned the assets after the lease term. The Group has disposed these assetson secondary markets through intermediaries.
* Decrease in sercurities clearing in 2008 by approx127.8 million EUR is from the fact that in 2007 thebalance included 108.0 million EUR of client's payments in transit with future value date in connectionwith extraordinary increased volume of payments transferred outside Estonia over the year end. Thebalance of 31.12.2007 does not represent an average payments-in-transit balance.
** In 2007 these balances included prepaid expenses of leasing companies: EURmio 17.3 payment forgoods and services, EURmio 16.6 payments of leasing suppliers, EURmio 6.4 prepaid VAT. In 2008JSC SEB Leasing has been disposed off (Note 21) and does not belong to the SEB Pank Group anyfurther, which is also the main reson for the significant decrease in these balances.
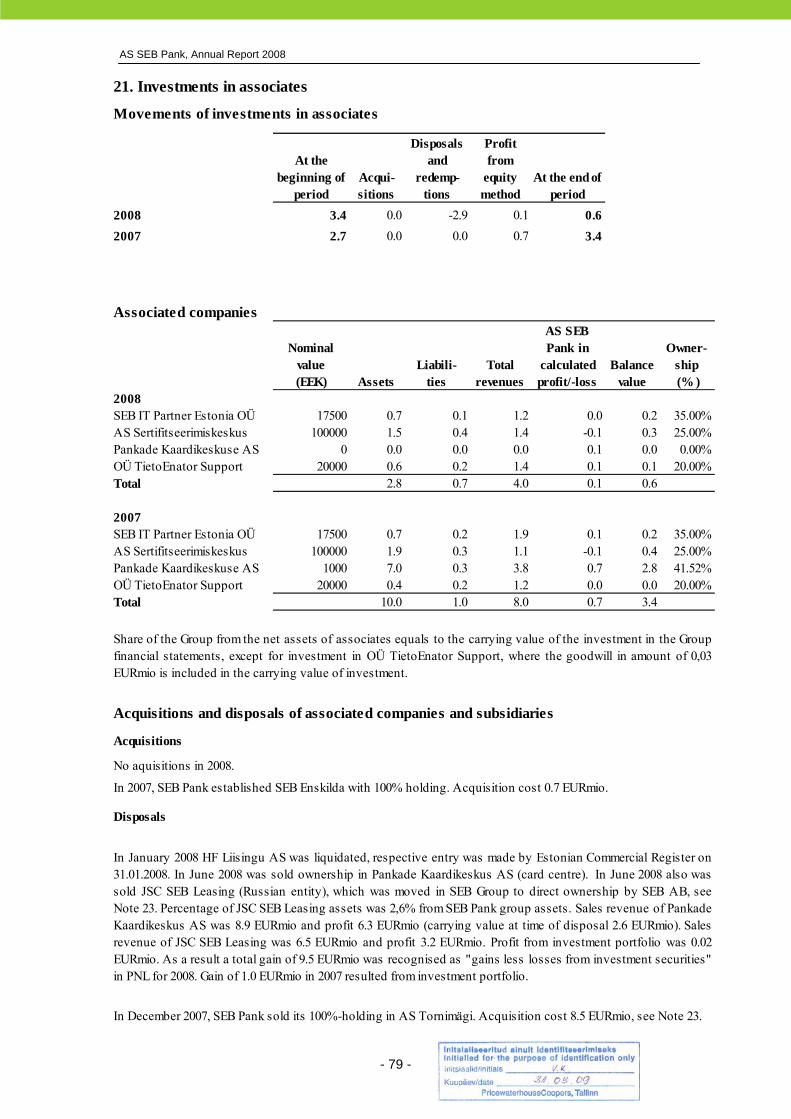
AS SEB Pank, Annual Report 2008
- 79 -
21. Investments in associates
Movements of investments in associates
At the beginning of
periodAcqui- sitions
Disposals and
redemp- tions
Profit from
equity method
At the end of period
2008 3.4 0.0 -2.9 0.1 0.62007 2.7 0.0 0.0 0.7 3.4
Associated companies
Nominal value(EEK) Assets
Liabili- ties
Total revenues
AS SEB Pank in
calculatedprofit/-loss
Balance value
Owner- ship (% )
2008SEB IT Partner Estonia OÜ 17500 0.7 0.1 1.2 0.0 0.2 35.00%AS Sertifitseerimiskeskus 100000 1.5 0.4 1.4 -0.1 0.3 25.00%Pankade Kaardikeskuse AS 0 0.0 0.0 0.0 0.1 0.0 0.00%OÜ TietoEnator Support 20000 0.6 0.2 1.4 0.1 0.1 20.00%Total 2.8 0.7 4.0 0.1 0.6
2007SEB IT Partner Estonia OÜ 17500 0.7 0.2 1.9 0.1 0.2 35.00%AS Sertifitseerimiskeskus 100000 1.9 0.3 1.1 -0.1 0.4 25.00%Pankade Kaardikeskuse AS 1000 7.0 0.3 3.8 0.7 2.8 41.52%OÜ TietoEnator Support 20000 0.4 0.2 1.2 0.0 0.0 20.00%Total 10.0 1.0 8.0 0.7 3.4
Acquisitions and disposals of associated companies and subsidiaries
Acquisitions
No aquisitions in 2008.
In 2007, SEB Pank established SEB Enskilda with 100% holding. Acquisition cost 0.7 EURmio.
Disposals
Share of the Group from the net assets of associates equals to the carrying value of the investment in the Groupfinancial statements, except for investment in OÜ TietoEnator Support, where the goodwill in amount of 0,03EURmio is included in the carrying value of investment.
In January 2008 HF Liisingu AS was liquidated, respective entry was made by Estonian Commercial Register on31.01.2008. In June 2008 was sold ownership in Pankade Kaardikeskus AS (card centre). In June 2008 also wassold JSC SEB Leasing (Russian entity), which was moved in SEB Group to direct ownership by SEB AB, seeNote 23. Percentage of JSC SEB Leasing assets was 2,6% from SEB Pank group assets. Sales revenue of PankadeKaardikeskus AS was 8.9 EURmio and profit 6.3 EURmio (carrying value at time of disposal 2.6 EURmio). Salesrevenue of JSC SEB Leasing was 6.5 EURmio and profit 3.2 EURmio. Profit from investment portfolio was 0.02EURmio. As a result a total gain of 9.5 EURmio was recognised as "gains less losses from investment securities"in PNL for 2008. Gain of 1.0 EURmio in 2007 resulted from investment portfolio.
In December 2007, SEB Pank sold its 100%-holding in AS Tornimägi. Acquisition cost 8.5 EURmio, see Note 23.
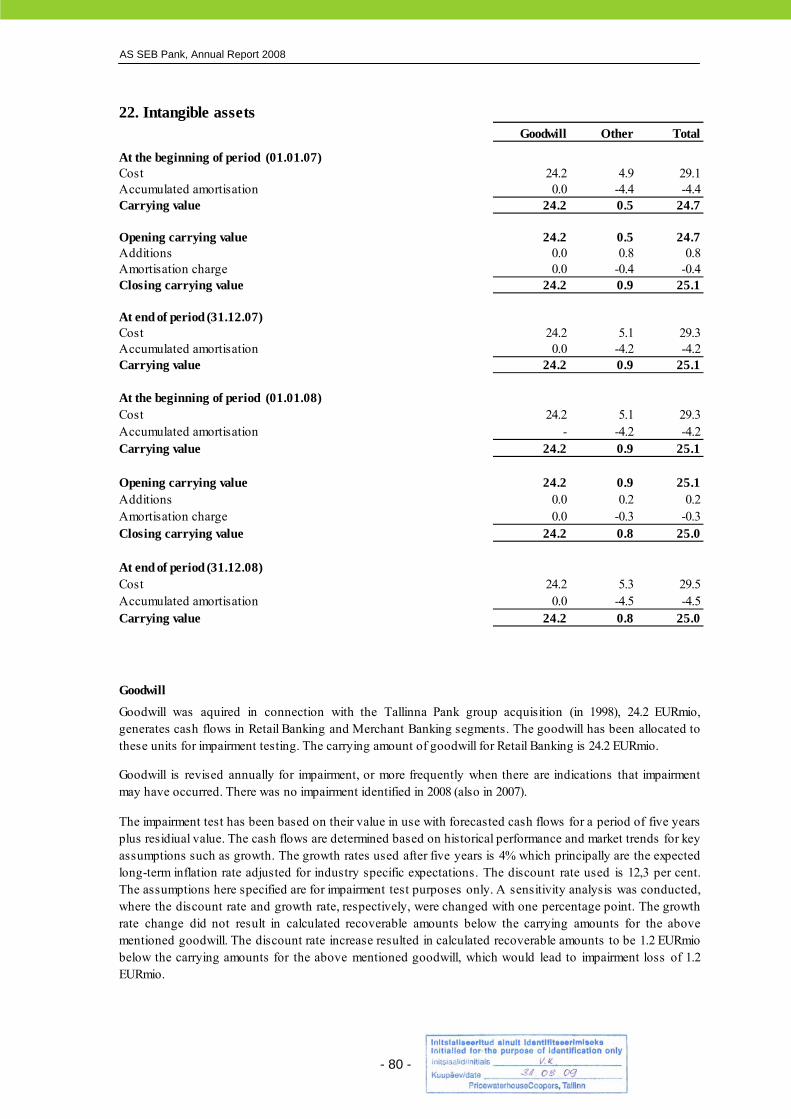
AS SEB Pank, Annual Report 2008
- 80 -
22. Intangible assetsGoodwill Other Total
At the beginning of period (01.01.07)Cost 24.2 4.9 29.1Accumulated amortisation 0.0 -4.4 -4.4Carrying value 24.2 0.5 24.7
Opening carrying value 24.2 0.5 24.7Additions 0.0 0.8 0.8Amortisation charge 0.0 -0.4 -0.4Closing carrying value 24.2 0.9 25.1
25.1At end of period (31.12.07)Cost 24.2 5.1 29.3Accumulated amortisation 0.0 -4.2 -4.2Carrying value 24.2 0.9 25.1
At the beginning of period (01.01.08)Cost 24.2 5.1 29.3Accumulated amortisation - -4.2 -4.2Carrying value 24.2 0.9 25.1
Opening carrying value 24.2 0.9 25.1Additions 0.0 0.2 0.2Amortisation charge 0.0 -0.3 -0.3Closing carrying value 24.2 0.8 25.0
25.0At end of period (31.12.08)Cost 24.2 5.3 29.5Accumulated amortisation 0.0 -4.5 -4.5Carrying value 24.2 0.8 25.0
Goodwill
Goodwill was aquired in connection with the Tallinna Pank group acquisition (in 1998), 24.2 EURmio,generates cash flows in Retail Banking and Merchant Banking segments. The goodwill has been allocated tothese units for impairment testing. The carrying amount of goodwill for Retail Banking is 24.2 EURmio.
Goodwill is revised annually for impairment, or more frequently when there are indications that impairmentmay have occurred. There was no impairment identified in 2008 (also in 2007).
The impairment test has been based on their value in use with forecasted cash flows for a period of five yearsplus residiual value. The cash flows are determined based on historical performance and market trends for keyassumptions such as growth. The growth rates used after five years is 4% which principally are the expectedlong-term inflation rate adjusted for industry specific expectations. The discount rate used is 12,3 per cent.The assumptions here specified are for impairment test purposes only. A sensitivity analysis was conducted,where the discount rate and growth rate, respectively, were changed with one percentage point. The growthrate change did not result in calculated recoverable amounts below the carrying amounts for the abovementioned goodwill. The discount rate increase resulted in calculated recoverable amounts to be 1.2 EURmiobelow the carrying amounts for the above mentioned goodwill, which would lead to impairment loss of 1.2EURmio.

AS SEB Pank, Annual Report 2008
- 81 -
23. Property plant and equipment
Land BuildingsOther tangible
assets TotalAt the beginning of period (01.01.07)Cost 0.0 2.5 30.1 32.6Accumulated depreciation 0.0 -2.1 -21.3 -23.4Carrying value 0.0 0.4 8.8 9.2
Opening carrying value 0.0 0.4 8.8 9.2Additions 0.0 0.7 5.2 5.9Disposals (carrying value)* 0.0 0.0 -0.3 -0.3Depreciation charge 0.0 -0.1 -3.4 -3.5Reclassification 0.0 0.0 -0.6 -0.6Closing carrying value 0.0 1.0 9.7 10.7
Disposal from selling AS Tornimägi (subsidiary), (Note 21) Cost -0.6 -0.6Accumulated depreciation 0.3 0.3Carrying value -0.3 -0.3
At end of period (31.12.07)Cost 0.0 2.2 32.2 34.4Accumulated depreciation 0.0 -1.2 -22.8 -24.0Carrying value 0.0 1.0 9.4 10.4
10.4* Sales revenue 0,04 EURmio, sales profit 0,01 EURmio, writing off 0,27 EURmio
Land BuildingsOther tangible
assets TotalAt the beginning of period (01.01.08)Cost 0.0 2.2 32.2 34.4Accumulated depreciation 0.0 -1.2 -22.8 -24.0Carrying value 0.0 1.0 9.4 10.4
Opening carrying value 0.0 1.0 9.4 10.4Additions 0.0 0.9 2.1 3.0Disposals (carrying value)* 0.0 0.0 -0.2 -0.2Depreciation charge 0.0 -0.3 -3.4 -3.7Reclassification 0.0 0.9 -0.9 0.0Closing carrying value 0.0 2.5 7.0 9.5
Disposal from selling JSC SEB Leasing (subsidiary), (Note 21) Cost -0.1 -0.1Accumulated depreciation 0.0 0.0Carrying value -0.1 -0.1
At end of period (31.12.08)Cost 0.0 4.0 29.3 33.3Accumulated depreciation 0.0 -1.5 -22.4 -23.9Carrying value 0.0 2.5 6.9 9.4
9.4* Sales revenue 0,01 EURmio, sales profit 0,0 EURmio, writing off 0,2 EUR mio

AS SEB Pank, Annual Report 2008
- 82 -
Customer assets under management of the group As of 31.12.2008 the customer securities portfolios under management of the Group amounted to 124.2 million euros (including 46.1 million in portfolio of AS SEB Elu- ja Pensionikindlustus). The total volume of aforementioned portfolios as of 31.12.2007 was 178.6 million euros (including 41.0 million in portfolio of AS SEB Elu- ja Pensionikindlustus). Commission fee is received from management of these portfolios and no credit or market risk is born by the Group.
24. Due to credit institutions31.12.08 31.12.07
Demand deposits 116.1 35.4Time deposits and loans (remaining maturity up to 1 year) 2,142.6 2,200.6Time deposits and loans (remaining maturity more than 1 year) 1.8 2.3Accrued interest payable to credit institutions 26.0 24.8
2,286.5 2,263.1
31.12.08 31.12.07Due to credit institutions, registered in EU 2,263.5 2,241.4Due to credit institutions, registered in Estonia 18.2 20.8Due to credit institutions, registered in other countries 4.8 0.9
2,286.5 2,263.1
25. Due to customers31.12.08 31.12.07
Demand deposits 1,194.2 1,413.1Time deposits and other saving deposits, insurance 939.7 748.6Investment deposits (index-linked) 93.5 124.8Accrued interest payable to customers 9.9 7.2
2,237.3 2,293.7
Non residents 266.5 294.5Residents 1,970.8 1,999.2
2,237.3 2,293.7Due to customers by type of customerDue to corporate customers 1,353.2 1,482.9Due to individuals 884.1 810.8
2,237.3 2,293.7
Due to customers, registered in EU 163.1 181.5Due to customers, registered in Estonia 1,979.1 2,006.2Due to customers, registered in other countries 95.1 106.0
2,237.3 2,293.7
See by remaining maturity in note 2, page 62 and interest restatement maturity page 56-57.See by currency in note 2, page 52.
2.2 billion EUR as at 31.12.2008 and 2.2 billion EUR as at 31.12.2007 are due from group to parent bank SEB.
In 2008 resources from KFW Bankengruppe credit line were disbursed in the total amount of 18.3 million EUR(loan agreement concluded on 26 November 2007), supplementary EU grants were gained in the amount of 0.4million EUR. In 2007 the bank took credit lines from KFW Bankengruppe 25 million EUR with maturity15.09.2017.
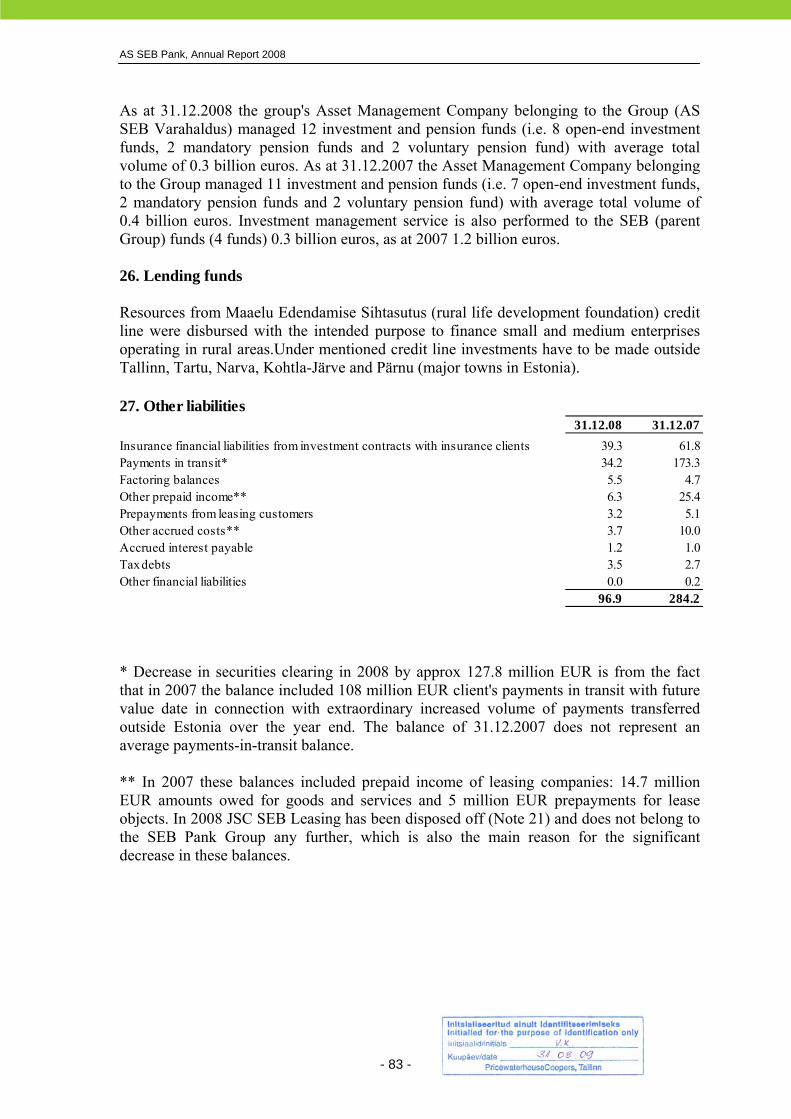
AS SEB Pank, Annual Report 2008
- 83 -
As at 31.12.2008 the group's Asset Management Company belonging to the Group (AS SEB Varahaldus) managed 12 investment and pension funds (i.e. 8 open-end investment funds, 2 mandatory pension funds and 2 voluntary pension fund) with average total volume of 0.3 billion euros. As at 31.12.2007 the Asset Management Company belonging to the Group managed 11 investment and pension funds (i.e. 7 open-end investment funds, 2 mandatory pension funds and 2 voluntary pension fund) with average total volume of 0.4 billion euros. Investment management service is also performed to the SEB (parent Group) funds (4 funds) 0.3 billion euros, as at 2007 1.2 billion euros. 26. Lending funds Resources from Maaelu Edendamise Sihtasutus (rural life development foundation) credit line were disbursed with the intended purpose to finance small and medium enterprises operating in rural areas.Under mentioned credit line investments have to be made outside Tallinn, Tartu, Narva, Kohtla-Järve and Pärnu (major towns in Estonia).
* Decrease in securities clearing in 2008 by approx 127.8 million EUR is from the fact that in 2007 the balance included 108 million EUR client's payments in transit with future value date in connection with extraordinary increased volume of payments transferred outside Estonia over the year end. The balance of 31.12.2007 does not represent an average payments-in-transit balance. ** In 2007 these balances included prepaid income of leasing companies: 14.7 million EUR amounts owed for goods and services and 5 million EUR prepayments for lease objects. In 2008 JSC SEB Leasing has been disposed off (Note 21) and does not belong to the SEB Pank Group any further, which is also the main reason for the significant decrease in these balances.
27. Other liabilities31.12.08 31.12.07
Insurance financial liabilities from investment contracts with insurance clients 39.3 61.8Payments in transit* 34.2 173.3Factoring balances 5.5 4.7Other prepaid income** 6.3 25.4Prepayments from leasing customers 3.2 5.1Other accrued costs** 3.7 10.0Accrued interest payable 1.2 1.0Tax debts 3.5 2.7Other financial liabilities 0.0 0.2
96.9 284.2

AS SEB Pank, Annual Report 2008
- 84 -
Movement of financial liabilities from investment contracts with insurance clients
31.12.08 31.12.07
Financial liabilities from investment contracts – at fair value through profit or loss
Balance at the beginning of the period 54.2 35.7 Payments collected 13.1 22.1 Service fees -0.8 -0.7 Provisions and disbursements -13.1 -4.9 Change in fair value, interest and bonuses -21.3 2.1Balance at the end of the period 32.1 54.3
Financial liabilities from investment contracts – at amortised costBalance at the beginning of the period 7.5 6.2 Premiums collected 1.8 2.0 Service fees -0.5 -0.6 Provisions and disbursements -1.8 -0.4 Change in fair value, interest and bonuses 0.2 0.3Balance at the end of the period 7.2 7.5Total 39.3 61.8
28. Deferred income tax liabilities
31.12.08 31.12.07Deferred tax assets in subsidiary JSC SEB LeasingAt the beginning of period 0.0 0.1Deferred tax expenses / income (Note 14) 0.0 -0.1At end of period 0.0 0.0
Deferred tax liabilities in subsidiary JSC SEB LeasingAt the beginning of period 0.3 0.1Accelerated tax depreciation (Note 14) -0.3 0.2At end of period 0.0 0.3

AS SEB Pank, Annual Report 2008
- 85 -
29. Issued debt securities31.12.08
Buyer / Registry holder Amount in issued currency (mio)
Amountin EURmio
Interest rate
Maturity date
Issued bonds by AS SEB PankEstonian Central Register of Securities* 103.1 EEK 6.6 5.30% 14.06.10Accrued interest payable 0.2
6.8
31.12.07
Buyer / Registry holder Amount in issued currency (mio)
Amountin EURmio
Interest rate
Maturity date
Issued bonds by AS SEB PankEstonian Central Register of Securities 50.7 EEK 3.2 4.09% 14.02.08Estonian Central Register of Securities 23.9 EEK 1.5 4.65% 16.06.08Estonian Central Register of Securities 103.1 EEK 6.6 5.30% 14.06.10Estonian Central Register of Securities 190.6 EEK 12.2 4.65% 16.06.08Estonian Central Register of Securities 47.2 EEK 3.0 4.68% 16.06.08Estonian Central Register of Securities 237.5 EEK 15.2 5.00% 01.10.08Accrued interest payable 0.9
42.6
30. Financial liabilities at fair value through profit or loss
31.12.08 31.12.07Structured bonds* 0.5 2.4Derivatives (Note 36) 31.3 20.7
31.8 23.1
* Nominal amount of structured bonds as of 31.12.2008 was 1,3 EURmio and as of 31.12.2007 2,0 EURmio. Further decrease is from change in fair value.
* Issued bonds by AS SEB Pank are quoted in Tallinn Stock Exchange list of Securities since September, 12 2008.
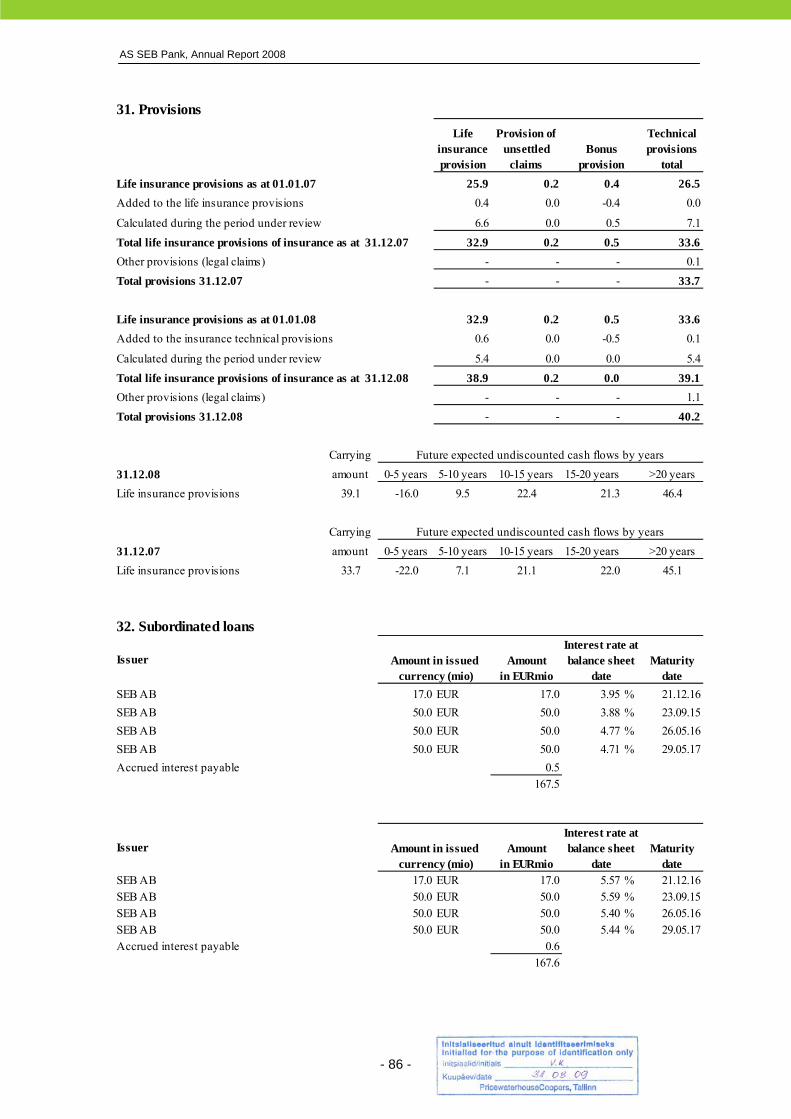
AS SEB Pank, Annual Report 2008
- 86 -
31. ProvisionsLife
insurance provision
Provision of unsettled
claimsBonus
provision
Technical provisions
totalLife insurance provisions as at 01.01.07 25.9 0.2 0.4 26.5Added to the life insurance provisions 0.4 0.0 -0.4 0.0
Calculated during the period under review 6.6 0.0 0.5 7.1
Total life insurance provisions of insurance as at 31.12.07 32.9 0.2 0.5 33.6Other provisions (legal claims) - - - 0.1Total provisions 31.12.07 - - - 33.7
Life insurance provisions as at 01.01.08 32.9 0.2 0.5 33.6Added to the insurance technical provisions 0.6 0.0 -0.5 0.1
Calculated during the period under review 5.4 0.0 0.0 5.4
Total life insurance provisions of insurance as at 31.12.08 38.9 0.2 0.0 39.1Other provisions (legal claims) - - - 1.1Total provisions 31.12.08 - - - 40.2
Carrying Future expected undiscounted cash flows by years
31.12.08 amount 0-5 years 5-10 years 10-15 years 15-20 years >20 yearsLife insurance provisions 39.1 -16.0 9.5 22.4 21.3 46.4
Carrying Future expected undiscounted cash flows by years
31.12.07 amount 0-5 years 5-10 years 10-15 years 15-20 years >20 yearsLife insurance provisions 33.7 -22.0 7.1 21.1 22.0 45.1
32. Subordinated loans
Issuer Amount in issued currency (mio)
Amountin EURmio
Interest rate at balance sheet
dateMaturity
dateSEB AB 17.0 EUR 17.0 3.95 % 21.12.16SEB AB 50.0 EUR 50.0 3.88 % 23.09.15SEB AB 50.0 EUR 50.0 4.77 % 26.05.16SEB AB 50.0 EUR 50.0 4.71 % 29.05.17Accrued interest payable 0.5
167.5
Issuer Amount in issued currency (mio)
Amountin EURmio
Interest rate at balance sheet
dateMaturity
dateSEB AB 17.0 EUR 17.0 5.57 % 21.12.16SEB AB 50.0 EUR 50.0 5.59 % 23.09.15SEB AB 50.0 EUR 50.0 5.40 % 26.05.16SEB AB 50.0 EUR 50.0 5.44 % 29.05.17Accrued interest payable 0.6
167.6

AS SEB Pank, Annual Report 2008
- 87 -
Subordinated debt may be considered as hybrid instrument, which means that due to their partial capital nature may be included under the bank's own funds in case certain requirements are met. In calculation of capital adequacy, loans with the remaining maturity over 5 years meeting certain requirements are included in own funds. Regarding loans with maturity less than 5 years, a 20% straightline depreciation is applied in each following year, thus the loan is not considered own funds when the maturity period is less than one year. Subordinated debt is issued at a variable interest rate and the interest restatemant is sheduled within 12 monthly from the balance sheet date (see Note 2 page 56-57). Interest is restated for 6 months period in advance. Subordinated debt is repayable only on maturity. 33. Shareholders
CountryNumber of
shares% from total
number
Shareholders of AS SEB Pank at 31.12.2008:Skandinaviska Enskilda Banken (SEB) Sweden 66,562,381 100.00
Shareholders of AS SEB Pank at 31.12.2007:Skandinaviska Enskilda Banken (SEB) Sweden 66,562,381 100.00
Nominal value of share: 10 EEK (0.64 EUR)
Maximum number of shares in articles of association: 240,000,000
All issued shares are paid for.
See capital adequacy calculation on page 66.
Share information 31.12.08 31.12.07
Number of shares of AS SEB Pank at end of period 66,562,381 66,562,381
Average number of shares, adjusted with issues 66,562,381 66,562,381
Net profit, EURmio 49.0 129.5Earnings per share (EUR per share) 0.74 1.95
Diluted earnings per share (EUR per share) 0.74 1.95
As the bank did not have potentially issued common stock in 2008 and 2007,the ordinary earnings per share equals the diluted earnings per share.
SEB AB is the ultimate parent of AS SEB Pank. SEB AB (incorporated in Sweden) does not have acontrolling parent company.
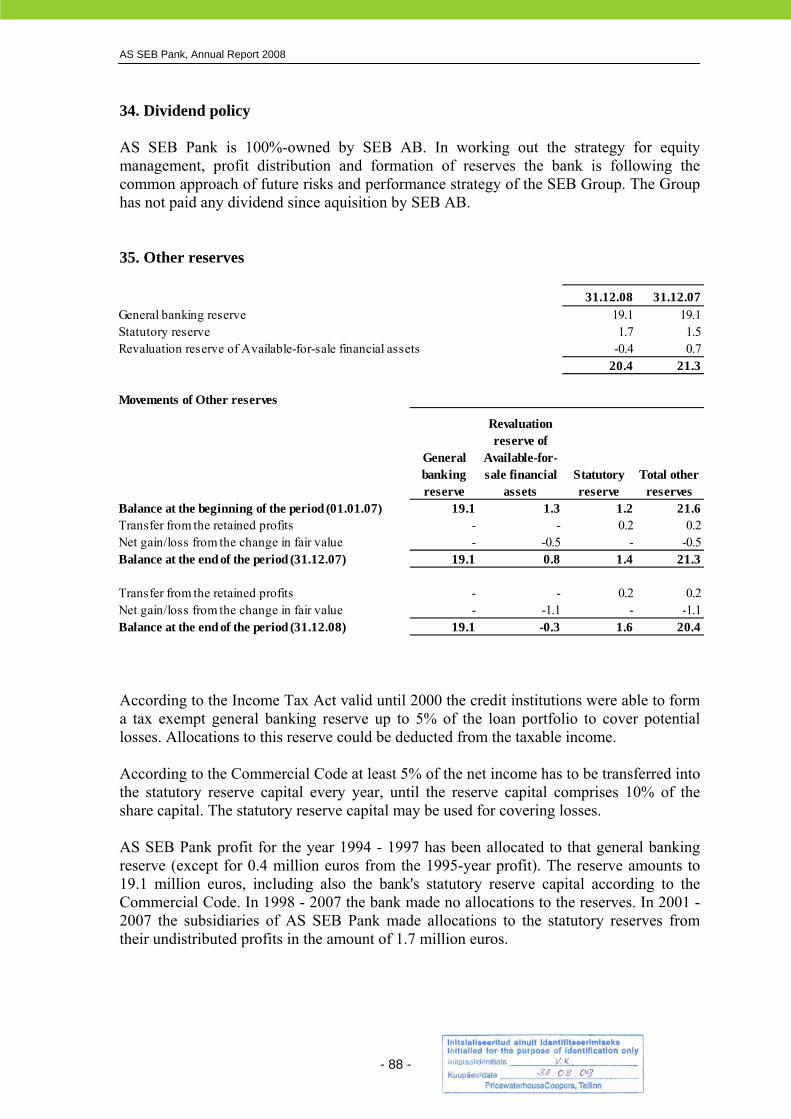
AS SEB Pank, Annual Report 2008
- 88 -
34. Dividend policy AS SEB Pank is 100%-owned by SEB AB. In working out the strategy for equity management, profit distribution and formation of reserves the bank is following the common approach of future risks and performance strategy of the SEB Group. The Group has not paid any dividend since aquisition by SEB AB. 35. Other reserves
According to the Income Tax Act valid until 2000 the credit institutions were able to form a tax exempt general banking reserve up to 5% of the loan portfolio to cover potential losses. Allocations to this reserve could be deducted from the taxable income. According to the Commercial Code at least 5% of the net income has to be transferred into the statutory reserve capital every year, until the reserve capital comprises 10% of the share capital. The statutory reserve capital may be used for covering losses. AS SEB Pank profit for the year 1994 - 1997 has been allocated to that general banking reserve (except for 0.4 million euros from the 1995-year profit). The reserve amounts to 19.1 million euros, including also the bank's statutory reserve capital according to the Commercial Code. In 1998 - 2007 the bank made no allocations to the reserves. In 2001 - 2007 the subsidiaries of AS SEB Pank made allocations to the statutory reserves from their undistributed profits in the amount of 1.7 million euros.
31.12.08 31.12.07General banking reserve 19.1 19.1Statutory reserve 1.7 1.5Revaluation reserve of Available-for-sale financial assets -0.4 0.7
20.4 21.3
Movements of Other reserves
General banking reserve
Revaluation reserve of
Available-for-sale financial
assetsStatutory reserve
Total other reserves
Balance at the beginning of the period (01.01.07) 19.1 1.3 1.2 21.6Transfer from the retained profits - - 0.2 0.2Net gain/loss from the change in fair value - -0.5 - -0.5Balance at the end of the period (31.12.07) 19.1 0.8 1.4 21.3
Transfer from the retained profits - - 0.2 0.2Net gain/loss from the change in fair value - -1.1 - -1.1Balance at the end of the period (31.12.08) 19.1 -0.3 1.6 20.4

AS SEB Pank, Annual Report 2008
- 89 -
* Derivative transactions are executed to cover the client’s position and the derivative risks are not taken to own portfolio. All risks arising from these transactions are fully mitigated with parent company. The equity option prices are calculated using for all input data (e.g. underlying prices or volumes) either independently sourced input (e.g. the underlying prices) or an independent price verification is performed on the next day to compare the values to independently sourced market data (e.g. for volumes), see Note 19.
36. Contingent assets and liabilities and commitments(millions of EUR)
31.12.08 Contract amount Fair valueAssets Liabilities Assets Liabilities
1. Irrevocable transactions 59.2 644.8 0.0 0.0
1.1. Guarantees and pledges 40.9 273.6 0.0 0.0
incl. financial guarantees 40.0 103.9 0.0 0.0
1.2. Loan commitments 18.3 371.2 0.0 0.0
1.3. Other off-balance sheet commitments 0.0 0.1 0.0 0.0
2. Derivatives 719.5 719.0 24.5 31.3
2.1. Currency related derivatives 346.5 352.1 4.4 9.7
2.2. Interest related derivatives 269.4 269.9 17.6 17.6
2.3. Equity related derivatives* 103.6 97.0 2.6 4.0
778.8 1,363.8 24.5 31.3
31.12.07 Contract amount Fair valueAssets Liabilities Assets Liabilities
1. Irrevocable transactions 47.7 744.9 0.0 0.01.1. Guarantees and pledges 17.5 249.8 0.0 0.0 incl. financial guarantees 15.0 87.1 0.0 0.0
1.2. Loan commitments 30.2 494.4 0.0 0.0
1.3. Other off-balance sheet commitments 0.0 0.7 0.0 0.0
2. Derivatives 580.3 579.8 21.4 20.7
2.1. Currency related derivatives 294.9 294.8 2.5 2.4
2.2. Interest related derivatives 187.1 187.1 0.0 0.0
2.3. Equity related derivatives* 98.3 97.9 18.9 18.3628.0 1,324.7 21.4 20.7
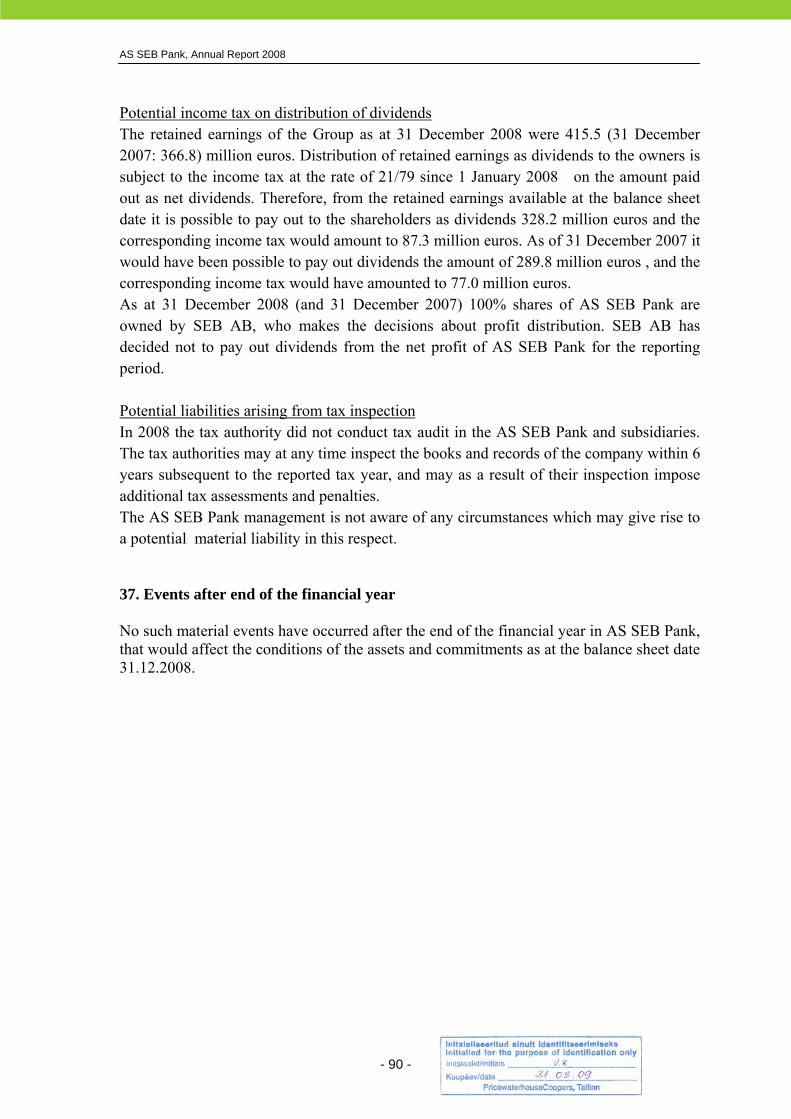
AS SEB Pank, Annual Report 2008
- 90 -
Potential income tax on distribution of dividends The retained earnings of the Group as at 31 December 2008 were 415.5 (31 December 2007: 366.8) million euros. Distribution of retained earnings as dividends to the owners is subject to the income tax at the rate of 21/79 since 1 January 2008 on the amount paid out as net dividends. Therefore, from the retained earnings available at the balance sheet date it is possible to pay out to the shareholders as dividends 328.2 million euros and the corresponding income tax would amount to 87.3 million euros. As of 31 December 2007 it would have been possible to pay out dividends the amount of 289.8 million euros , and the corresponding income tax would have amounted to 77.0 million euros. As at 31 December 2008 (and 31 December 2007) 100% shares of AS SEB Pank are owned by SEB AB, who makes the decisions about profit distribution. SEB AB has decided not to pay out dividends from the net profit of AS SEB Pank for the reporting period. Potential liabilities arising from tax inspection In 2008 the tax authority did not conduct tax audit in the AS SEB Pank and subsidiaries. The tax authorities may at any time inspect the books and records of the company within 6 years subsequent to the reported tax year, and may as a result of their inspection impose additional tax assessments and penalties. The AS SEB Pank management is not aware of any circumstances which may give rise to a potential material liability in this respect. 37. Events after end of the financial year No such material events have occurred after the end of the financial year in AS SEB Pank, that would affect the conditions of the assets and commitments as at the balance sheet date 31.12.2008.

AS SEB Pank, Annual Report 2008
- 91 -
38. Related parties(millions of EUR) 31.12.08 31.12.07
Loans and advances to members of management board of credit institution andinternal audit manager, also their confidants and commercial undertakings, controlledjointly or severally by the mentioned persons. 1.0 1.1
Contingent liabilities to members of management board of credit institution andinternal audit manager, also their confidants and commercial undertakings, controlledjointly or severally by the mentioned persons (credit lines and commitments to extendcredit). 0.0 -0.1
Deposits of members of management board of credit institution and internal auditmanager, also their confidants and commercial undertakings, controlled jointly orseverally by the mentioned persons. -0.4 -0.5
Loans and advances to parent company 37.2 330.4Due to parent company -2,412.1 -2,385.7 incl. subordinated liabilities -167.0 -167.0Contingent assets and commitments to parent company 41.7 139.5Contingent liabilities and commitments to parent company 0.0 -118.2
Loans and advances to enterprises of parent company's consolidation group 343.6 10.4Due to enterprises of parent company's consolidation group -4.4 -1.8Contingent assets and commitments to enterprises of parent company's consolidation group 9.7 1.1Contingent liabilities and commitments to enterprises of parent company's consolidation group -0.1 -1.0
Interest income from parent company 11.1 5.7Interest expence to parent company -114.2 -95.9Commission income from parent company 0.2 1.7Commission expences to parent company -0.1 -0.2
Interest income from enterprises of parent company's consolidation group 0.7 0.2Interest expence to enterprises of parent company's consolidation group -0.1 -0.1Commission income from enterprises of parent company's consolidation group 0.1 1.5Commission expences to enterprises of parent company's consolidation group 0.0 -1.2
Related parties are:- parent company- subsidiaries of parent company;- associates of parent company;- associates of the Group;- members of management board of credit institution and internal audit manager, also their confidants and commercial undertakings, controlled jointly or severally by the mentioned persons.
Interest rates of the loans given to related parties do not differ materially from interest rates of the loans tocustomers. Transactions with related parties have been based on market terms.
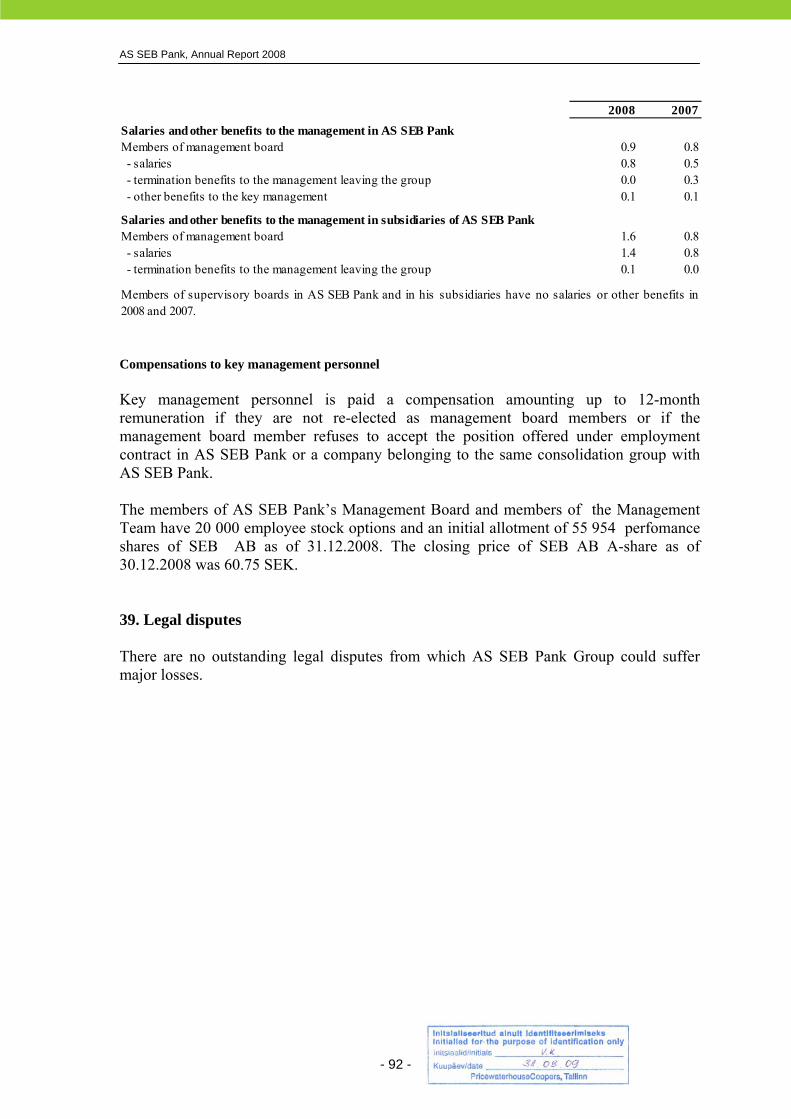
AS SEB Pank, Annual Report 2008
- 92 -
Compensations to key management personnel Key management personnel is paid a compensation amounting up to 12-month remuneration if they are not re-elected as management board members or if the management board member refuses to accept the position offered under employment contract in AS SEB Pank or a company belonging to the same consolidation group with AS SEB Pank. The members of AS SEB Pank’s Management Board and members of the Management Team have 20 000 employee stock options and an initial allotment of 55 954 perfomance shares of SEB AB as of 31.12.2008. The closing price of SEB AB A-share as of 30.12.2008 was 60.75 SEK. 39. Legal disputes There are no outstanding legal disputes from which AS SEB Pank Group could suffer major losses.
2008 2007Salaries and other benefits to the management in AS SEB PankMembers of management board 0.9 0.8 - salaries 0.8 0.5 - termination benefits to the management leaving the group 0.0 0.3 - other benefits to the key management 0.1 0.1
Salaries and other benefits to the management in subsidiaries of AS SEB PankMembers of management board 1.6 0.8 - salaries 1.4 0.8 - termination benefits to the management leaving the group 0.1 0.0
Members of supervisory boards in AS SEB Pank and in his subsidiaries have no salaries or other benefits in2008 and 2007.
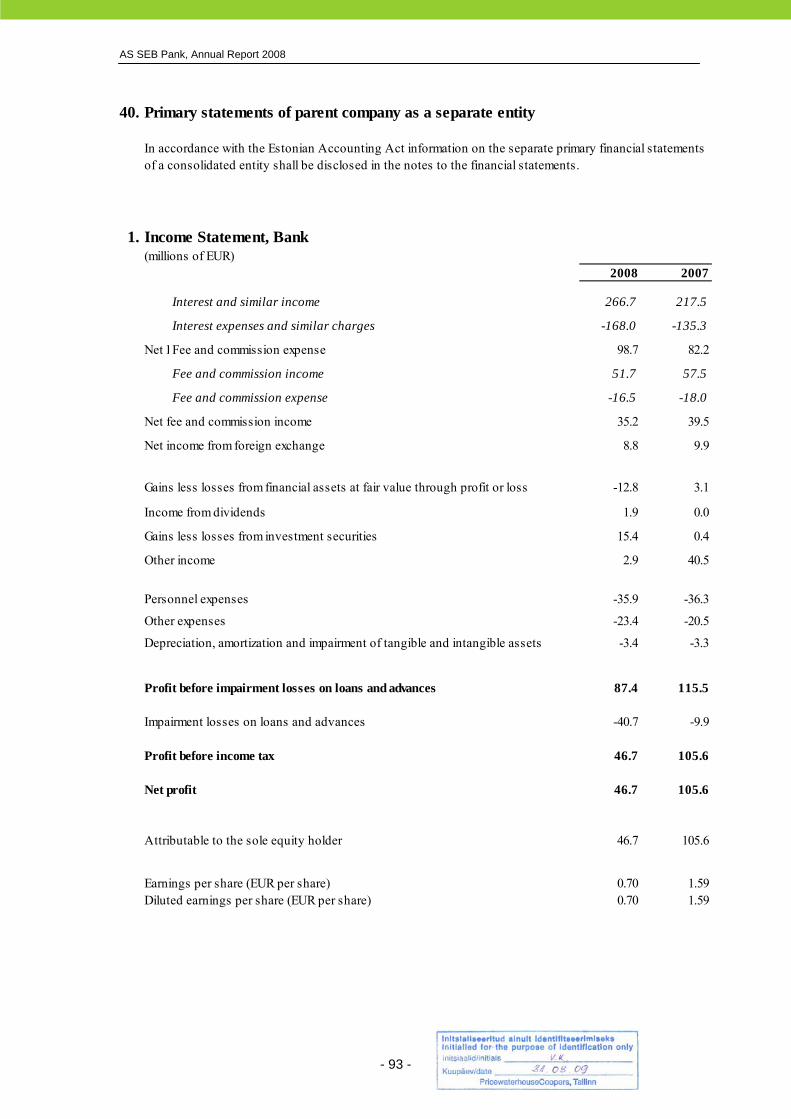
AS SEB Pank, Annual Report 2008
- 93 -
40. Primary statements of parent company as a separate entity
1. Income Statement, Bank(millions of EUR)
2008 2007
Interest and similar income 266.7 217.5
Interest expenses and similar charges -168.0 -135.3
Net I Fee and commission expense 98.7 82.2
Fee and commission income 51.7 57.5
Fee and commission expense -16.5 -18.0
Net fee and commission income 35.2 39.5
Net income from foreign exchange 8.8 9.9
-12.8 3.1
Income from dividends 1.9 0.0
Gains less losses from investment securities 15.4 0.4
Other income 2.9 40.5
Personnel expenses -35.9 -36.3
Other expenses -23.4 -20.5
Depreciation, amortization and impairment of tangible and intangible assets -3.4 -3.3
Profit before impairment losses on loans and advances 87.4 115.5
Impairment losses on loans and advances -40.7 -9.9
Profit before income tax 46.7 105.6
Net profit 46.7 105.6
Attributable to the sole equity holder 46.7 105.6
Earnings per share (EUR per share) 0.70 1.59Diluted earnings per share (EUR per share) 0.70 1.59
Gains less losses from financial assets at fair value through profit or loss
In accordance with the Estonian Accounting Act information on the separate primary financial statements of a consolidated entity shall be disclosed in the notes to the financial statements.
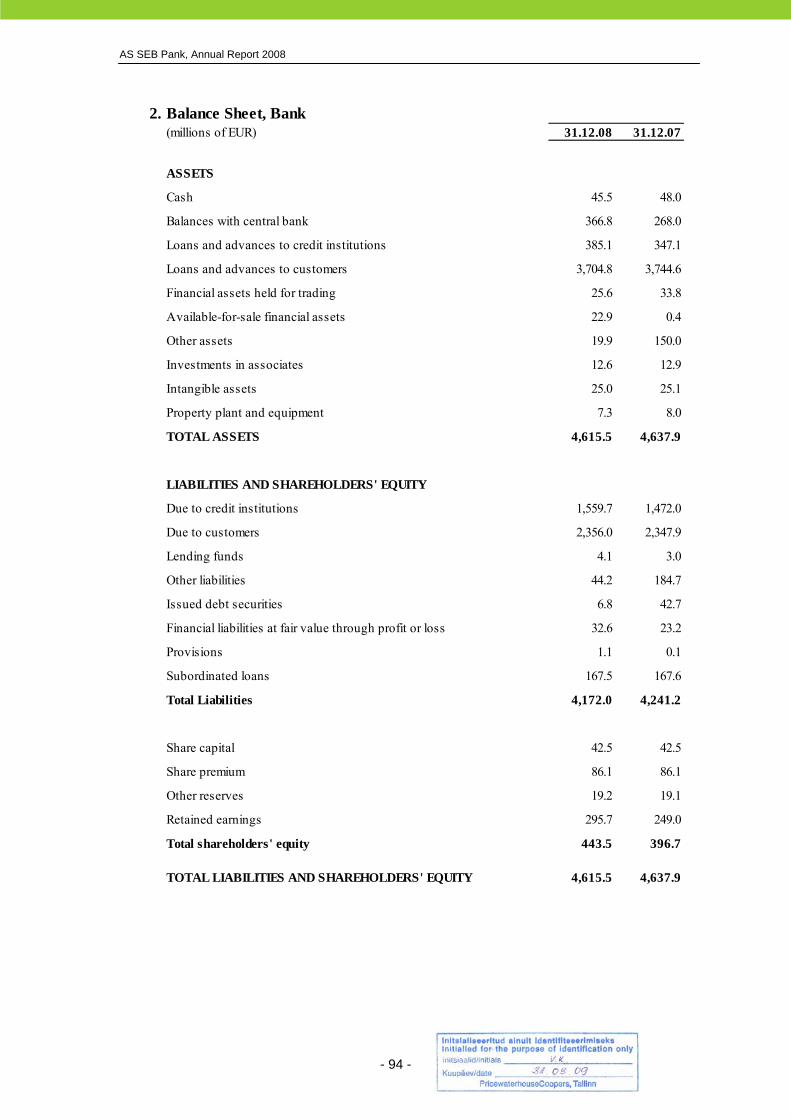
AS SEB Pank, Annual Report 2008
- 94 -
2. Balance Sheet, Bank(millions of EUR) 31.12.08 31.12.07
ASSETS
Cash 45.5 48.0
Balances with central bank 366.8 268.0
Loans and advances to credit institutions 385.1 347.1
Loans and advances to customers 3,704.8 3,744.6
Financial assets held for trading 25.6 33.8
Available-for-sale financial assets 22.9 0.4
Other assets 19.9 150.0
Investments in associates 12.6 12.9
Intangible assets 25.0 25.1
Property plant and equipment 7.3 8.0
TOTAL ASSETS 4,615.5 4,637.9
LIABILITIES AND SHAREHOLDERS' EQUITY
Due to credit institutions 1,559.7 1,472.0
Due to customers 2,356.0 2,347.9
Lending funds 4.1 3.0
Other liabilities 44.2 184.7
Issued debt securities 6.8 42.7
Financial liabilities at fair value through profit or loss 32.6 23.2
Provisions 1.1 0.1
Subordinated loans 167.5 167.6
Total Liabilities 4,172.0 4,241.2
Share capital 42.5 42.5
Share premium 86.1 86.1
Other reserves 19.2 19.1
Retained earnings 295.7 249.0
Total shareholders' equity 443.5 396.7
TOTAL LIABILITIES AND SHAREHOLDERS' EQUITY 4,615.5 4,637.9

AS SEB Pank, Annual Report 2008
- 95 -
3. Cash Flow Statement, Bank(millions of EUR)
2008 2007I. Cash flows from operating activities
Interest received 251.2 202.9Interest paid -137.9 -108.7Dividends received 1.9 0.0Fee and commission received 51.7 57.5Net trading income and other operating income -11.8 33.7Personnel expenses and other operating expenses -65.3 -55.1Revaluation adjustments -0.8 -0.4Cash flows from operating profits before changes in the operating assets and liabilities 89.0 129.9
Changes in operating assets:Loans and advances to credit institutions 130.5 -124.5Loans and advances to customers 0.7 -602.5Other assets 11.6 -8.5
Changes of operating liabilities:Due to credit institutions -48.8 473.0Due to customers 4.8 209.9Lending funds 1.1 0.5Other liabilities -19.8 10.6Cash flow from operating activities 169.1 88.5
II. Cash flows from investing activitiesPurchase of investment portfolio securities -38.4 -586.6Proceeds from sale of investment portfolio securities 31.3 587.2Purchase of subsidaries 0.0 -0.7Proceeds from sale and liquidation of subsidaries 0.1 8.5Proceeds from sale and liquidation of associates 0.3 0.0Purchase of tangible and intangible assets -2.7 -4.3Proceeds from sale of tangible and intangible assets 0.1 0.2Cash flow from (used in) investing activities -9.3 4.3
III. Cash flows from financing activitiesProceeds from debt securities (issuing) 16.0 39.3Repurchasing and redemption of debt securities -51.8 -15.0Proceeds from subordinated loans 0.0 50.0Cash flow from financing activities -35.8 74.3
Net increase in cash and cash equivalents 124.0 167.1
Cash and cash equivalents at beginning of period 652.8 485.6Effect of exchange rate changes on cash and cash equivalents 0.0 0.1
Cash and cash equivalents at end of period 776.7 652.8
Cash and cash equivalents includes: 31.12.08 31.12.07Cash on hand 45.5 48.1Balances with the central bank 366.2 267.2Liquid deposits in other credit institutions 364.0 325.2Trading portfolio 1.0 12.3
776.7 652.8
All cash eqivalents are freely available for use by the Group with maturity of less than 3 months.
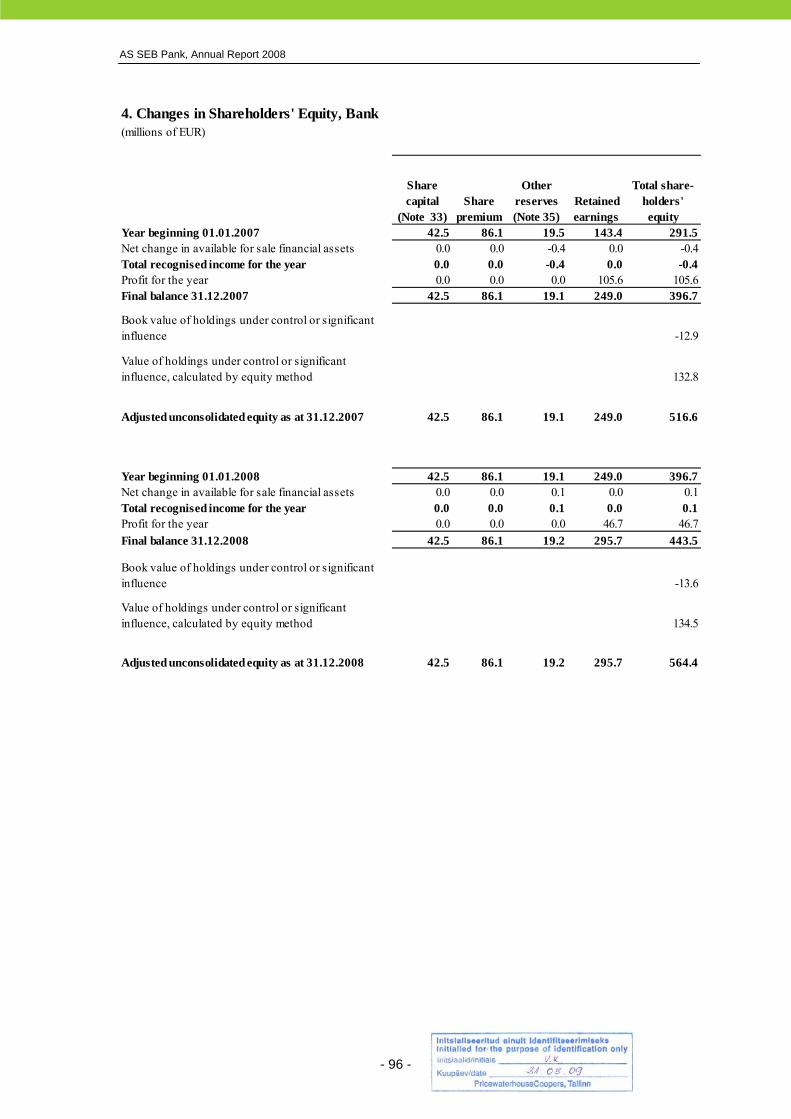
AS SEB Pank, Annual Report 2008
- 96 -
4. Changes in Shareholders' Equity, Bank(millions of EUR)
Share capital
(Note 33)Share
premium
Other reserves (Note 35)
Retained earnings
Total share- holders' equity
Year beginning 01.01.2007 42.5 86.1 19.5 143.4 291.5Net change in available for sale financial assets 0.0 0.0 -0.4 0.0 -0.4Total recognised income for the year 0.0 0.0 -0.4 0.0 -0.4Profit for the year 0.0 0.0 0.0 105.6 105.6Final balance 31.12.2007 42.5 86.1 19.1 249.0 396.7
Book value of holdings under control or significant influence -12.9
Value of holdings under control or significant influence, calculated by equity method 132.8
Adjusted unconsolidated equity as at 31.12.2007 42.5 86.1 19.1 249.0 516.6
Year beginning 01.01.2008 42.5 86.1 19.1 249.0 396.7Net change in available for sale financial assets 0.0 0.0 0.1 0.0 0.1Total recognised income for the year 0.0 0.0 0.1 0.0 0.1Profit for the year 0.0 0.0 0.0 46.7 46.7Final balance 31.12.2008 42.5 86.1 19.2 295.7 443.5
Book value of holdings under control or significant influence -13.6
Value of holdings under control or significant influence, calculated by equity method 134.5
Adjusted unconsolidated equity as at 31.12.2008 42.5 86.1 19.2 295.7 564.4
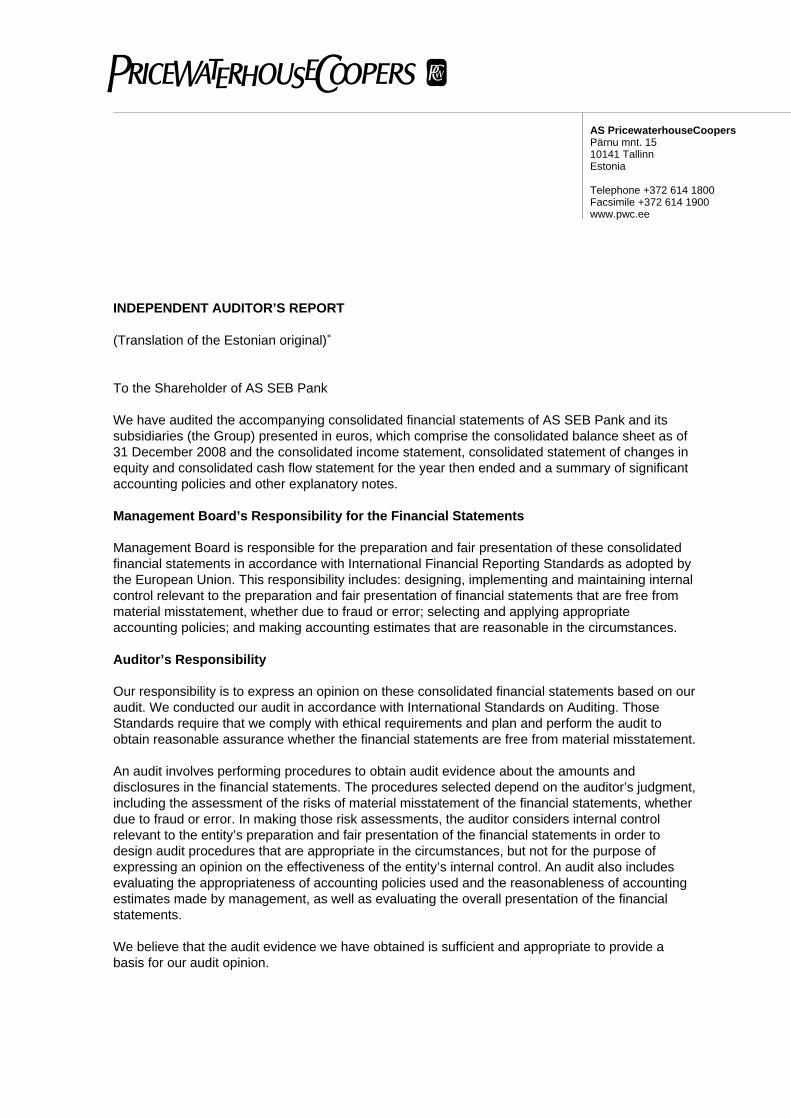
AS PricewaterhouseCoopers Pärnu mnt. 15 10141 Tallinn Estonia Telephone +372 614 1800 Facsimile +372 614 1900 www.pwc.ee
INDEPENDENT AUDITOR’S REPORT (Translation of the Estonian original)∗ To the Shareholder of AS SEB Pank We have audited the accompanying consolidated financial statements of AS SEB Pank and its subsidiaries (the Group) presented in euros, which comprise the consolidated balance sheet as of 31 December 2008 and the consolidated income statement, consolidated statement of changes in equity and consolidated cash flow statement for the year then ended and a summary of significant accounting policies and other explanatory notes. Management Board’s Responsibility for the Financial Statements Management Board is responsible for the preparation and fair presentation of these consolidated financial statements in accordance with International Financial Reporting Standards as adopted by the European Union. This responsibility includes: designing, implementing and maintaining internal control relevant to the preparation and fair presentation of financial statements that are free from material misstatement, whether due to fraud or error; selecting and applying appropriate accounting policies; and making accounting estimates that are reasonable in the circumstances. Auditor’s Responsibility Our responsibility is to express an opinion on these consolidated financial statements based on our audit. We conducted our audit in accordance with International Standards on Auditing. Those Standards require that we comply with ethical requirements and plan and perform the audit to obtain reasonable assurance whether the financial statements are free from material misstatement. An audit involves performing procedures to obtain audit evidence about the amounts and disclosures in the financial statements. The procedures selected depend on the auditor’s judgment, including the assessment of the risks of material misstatement of the financial statements, whether due to fraud or error. In making those risk assessments, the auditor considers internal control relevant to the entity’s preparation and fair presentation of the financial statements in order to design audit procedures that are appropriate in the circumstances, but not for the purpose of expressing an opinion on the effectiveness of the entity’s internal control. An audit also includes evaluating the appropriateness of accounting policies used and the reasonableness of accounting estimates made by management, as well as evaluating the overall presentation of the financial statements. We believe that the audit evidence we have obtained is sufficient and appropriate to provide a basis for our audit opinion.
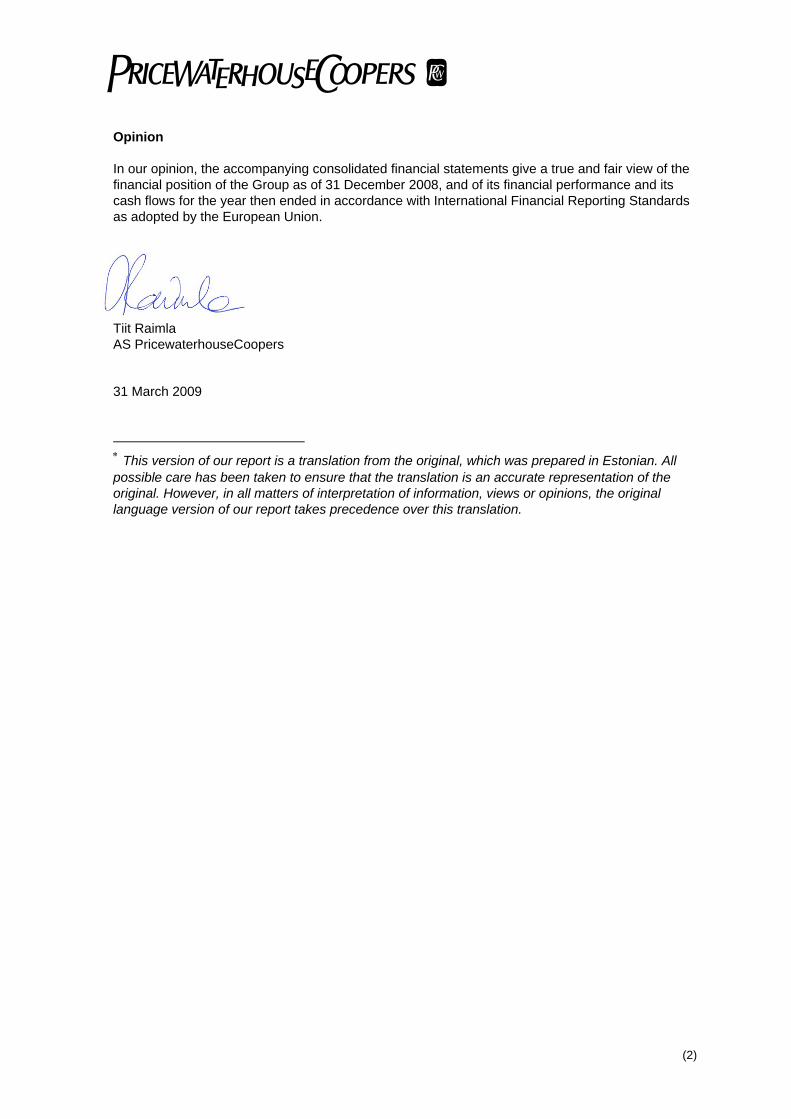
Opinion In our opinion, the accompanying consolidated financial statements give a true and fair view of the financial position of the Group as of 31 December 2008, and of its financial performance and its cash flows for the year then ended in accordance with International Financial Reporting Standards as adopted by the European Union. Tiit Raimla AS PricewaterhouseCoopers 31 March 2009 ∗ This version of our report is a translation from the original, which was prepared in Estonian. All possible care has been taken to ensure that the translation is an accurate representation of the original. However, in all matters of interpretation of information, views or opinions, the original language version of our report takes precedence over this translation.
(2)
AS SEB Pank, Annual Report 2008
- 99 -
AS SEB PANK
Located at Tornimäe 2, Tallinn MANAGEMENT BOARD RESOLUTION No 32
In Tallinn March 10th, 2009
1. To make a proposal to the sole shareholder not to distribute the profit of the
financial year 2008 in the amount of 731,275,624 EEK (seven hundred and thirty-one million, two hundred and seventy-five thousand, six hundred and twenty-four Estonian kroons) /46,737,031 EUR (forty-six million, seven hundred and thirty-seven thousand, thirty-one euros)/.
2. To submit the present resolution to the Supervisory Board of AS SEB Pank for review.
Ahti Asmann Chairman of the Management Board Distribution: Management Board members, Legal Division, Financial Reporting Department

AS SEB Pank, Annual Report 2008
- 100 -
Signatures of Supervisory Board to annual report The Management Board has prepared the management report and the annual accounts of AS SEB Pank for the financial year ended 31 December 2008. The Supervisory Board of AS SEB Pank has reviewed the Annual Report 2008, prepared by the Management Board, consisting of the management report, the annual accounts, the Management Board's proposal for profit distribution and the independent auditors' report, and has approved the annual report for presentation to the sole shareholder. The annual report has been signed by all members of the Supervisory Board : “_____”_______________2009 ________________________ Bo Magnusson “_____”_______________2009 ________________________ Anders Arozin “_____”_______________2009 ________________________ Ainārs Ozols “_____”_______________2009 ________________________ Audrius Žiugžda “_____”_______________2009 ________________________ Ulf Pettersson