sebastian kaiser and friedrich leisch - r: the r project for … · 2008-08-20 · biclust - a...
TRANSCRIPT
biclust - A Toolbox for Bicluster Analysis in
R
Sebastian Kaiser and Friedrich Leisch
Institut fur Statistik
Ludwig-Maximilians-Universitat Munchen
UseR 2008, 13.8.2008, Dortmund

Overview
Outline:
Introduce Biclustering
The biclust - Package
Examples
Future Work

Biclustering
Why Biclustering?
• Simultaneous clustering of 2 dimensions
• Large datasets where clustering leads to diffuse results
• Only parts of the data influence each other

Biclustering
Initial Situation:
Two-Way Dataset
c1 . . . ci . . . cm
r1 a11 . . . ai1 . . . am1... ... . . . ... . . . ...rj a1j . . . aij . . . amj... ... . . . ... . . . ...
rn a1n . . . ain . . . amn

Biclustering
Goal:
Finding subgroups of rows and columns which are as similar as possible
to each other and as different as possible to the rest.
A ∗ ∗ A ∗ A ∗∗ ∗ ∗ ∗ ∗ ∗ ∗∗ ∗ ∗ ∗ ∗ ∗ ∗A ∗ ∗ A ∗ A ∗∗ ∗ ∗ ∗ ∗ ∗ ∗A ∗ ∗ A ∗ A ∗∗ ∗ ∗ ∗ ∗ ∗ ∗
⇒
A A A ∗ ∗ ∗ ∗A A A ∗ ∗ ∗ ∗A A A ∗ ∗ ∗ ∗∗ ∗ ∗ ∗ ∗ ∗ ∗∗ ∗ ∗ ∗ ∗ ∗ ∗∗ ∗ ∗ ∗ ∗ ∗ ∗∗ ∗ ∗ ∗ ∗ ∗ ∗

More than one bicluster?
Most Bicluster Algorithms are iterativ. To find the next bicluster given
n-1 found bicluster you have to either
• ignore the n-1 already found bicluster,
• delete rows and/or columns of the found bicluster or
• mask the found bicluster with random values.

The biclust - Package - Algorithms
Chosen sample of algorithms in order to cover most bicluster outcomes.
Bimax(Barkow et al. (2006)): Groups with ones in binary matrix
CC (Cheng and Church (2000)): Constant values
Plaid (Turner et al. (2005)): Constant values over rows or columns
Spectral (Kluger et al. (2003)): Coherent values over rows and columns
Xmotifs (Murali and Kasif (2003)): Coherent correlation over rows
and columns

The biclust - Package
Function: biclust
The main function of the package is
biclust(data,method=BCxxx(),number,...)
with:
data: The preprocessed data matrix
method: The algorithm used (E. g. BCCC() for CC)
number: The maximum number of bicluster to search for
... : Additional parameters of the algorithms
Returns an object of class Biclust for uniform treatment.

The biclust - Package
Additional methods
Preprocessing: discretize(), binarize(), ...
Visualization: parallelCoordinates(), drawHeatmap(), Bubbleplot()
Validation: jaccardind(), clusterVariance(), ...
Validation: Jaccard
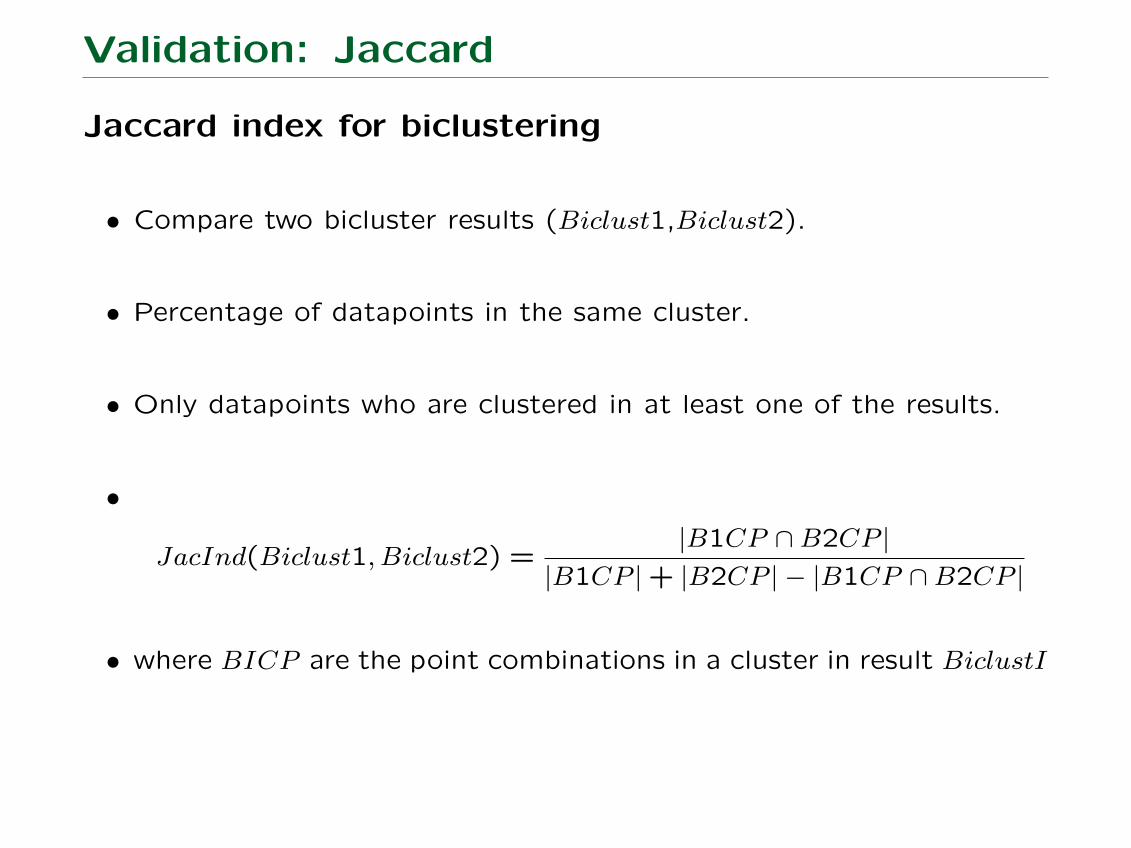
Jaccard index for biclustering
• Compare two bicluster results (Biclust1,Biclust2).
• Percentage of datapoints in the same cluster.
• Only datapoints who are clustered in at least one of the results.
•
JacInd(Biclust1, Biclust2) =|B1CP ∩B2CP |
|B1CP |+ |B2CP | − |B1CP ∩B2CP |
• where BICP are the point combinations in a cluster in result BiclustI

Example
BicatYeast
• Subsample of the Saccharomyces Cerevisiae organism (Yeast)
• Used to present bicluster algorithms by Barkow et al. (2006)
• Microarray data: 419 genes, 80 experiments

Example: BicatYeast
> data(BicatYeast)
> x<-discretize(BicatYeast)
> Xmotif<-biclust(x, method=BCXmotifs(), number=50, alpha=0.05,
+ nd=20, ns=20, sd=5)
> Xmotif
An object of class Biclust
call:
biclust(x = x, method = BCXmotifs(), number = 50, alpha = 0.05)
Number of Clusters found: 15
First Cluster size:
Number of Rows: 175
Number of Columns: 6

Example: BicatYeast
> parallelCoordinates(x=BicatYeast, bicResult=Xmotif, number=6)
2 4 6 8 10 12 14
−0.
50.
00.
5
Gene
Exp
ress
ion
leve
l

Example: BicatYeast
> parallelCoordinates(x=BicatYeast, bicResult=Xmotif, number=1,
+ geneTitle=TRUE)
0 50 100 150
−0.
50.
00.
51.
0
Gene
Exp
ress
ion
leve
l
Bicluster 1 (genes= 157 ; conditions= 6 )

Example: BicatYeast
Jaccard index of the five algorithms on BicatYeast result
BCPlaid BCXmotifs BCCC BCSpect. BCBimax
BCPlaid 1.0000 0.0007 0.0116 0.0000 0.0000
BCXmotifs 0.0007 1.0000 0.1789 0.0935 0.0000
BCCC 0.0116 0.1789 1.0000 0.0898 0.0036
BCSpectral 0.0000 0.0935 0.0898 1.0000 0.0000
BCBimax 0.0000 0.0000 0.0036 0.0000 1.0000

Example: BicatYeast (Jaccard)
Adapted Jaccard Index (Boxplot)
●
●●●
BCPlaid BCXmotifs BCCC BCSpectral BCBimax
0.0
0.1
0.2
0.3
0.4
0.5
0.6
0.7
Candidates
1 −
Jac
card

Example: BicatYeast (Jaccard)
Adapted Jaccard Index (Beplot I)
1 −
Jac
card
0.0
0.1
0.2
0.3
0.4
0.5
0.6
0.7
● ●
●
●
●
●
●
●
● ●
●
●
●
●
●
●
●
●
●●
●
●
●
●
●
●
●
●
●
●
●●
●
●
●
●
●
●
● ●
●
●
●
●
●
●
●
●
●
●
●
●
●
●
●
●
●
●
●
●
●
●
●
●
●
●
●
●
●●
●
●
●
●
●
●
●
●
●
●
● ●
●
●●
● ●
●
●
●
●
●
●
●
●
●
●
●
●
●
●●
●
●
●
●●
●
●
●
●
●
●
● ●
●
●
●
●
●
●
●
●
●
●
●●
●
●
●
●
●
●
●
●
●
●
●
●●
●●
●
●
●
●
●
●
●
●
●
●
●
●
●
●
●
●
●
●
BCCCBCBimaxBCSpectralBCXmotifsBCPlaid
1. 2. 3. 4. 5.
Podium

Example: BicatYeast (Jaccard)
Adapted Jaccard Index (Beplot II)
1 −
Jac
card
0.0
0.1
0.2
0.3
0.4
0.5
0.6
0.7
● ●
●
●
●
●
●
●
● ●
●
●
●
●
●
●
●
●
●●
●
●
●
●
●
●
●
●
●
●
●●
●
●
●
●
●
●
● ●
●
●
●
●
●
●
●
●
●
●
●
●
●
●
●
●
●
●
●
●
●
●
●
●
●
●
●
●
●●
●
●
●
●
●
●
●
●
●
●
● ●
●
●●
● ●
●
●
●
●
●
●
●
●
●
●
●
●
●
●●
●
●
●
●●
●
●
●
●
●
●
● ●
●
●
●
●
●
●
●
●
●
●
●●
●
●
●
●
●
●
●
●
●
●
●
●●
●●
●
●
●
●
●
●
●
●
●
●
●
●
●
●
●
●
●
●
BCCCBCBimaxBCSpectralBCXmotifsBCPlaid
1. 2. 3. 4. 5.
Podium

Example
Australian Tourism Survey
• Survey of the Faculty of Commerce, University of Wollongong
• Questions on activities during the holidays
• 1003 people, 56 question blocks a about 15 questions
• Using a sample of 2 blocks (30 questions)

Example: Tourism Data
> x<-AUSTourismsurvey
> Xmotif<-biclust(x, method=BCXmotifs(), number=10, alpha=0.05,
+ ns=50, nd=50, sd=5)
> Xmotif
An object of class Biclust
call:
biclust(x, method=BCXmotifs(), number=10, alpha=0.05)
Number of Clusters found: 7
First Cluster size:
Number of Rows: 218
Number of Columns: 20

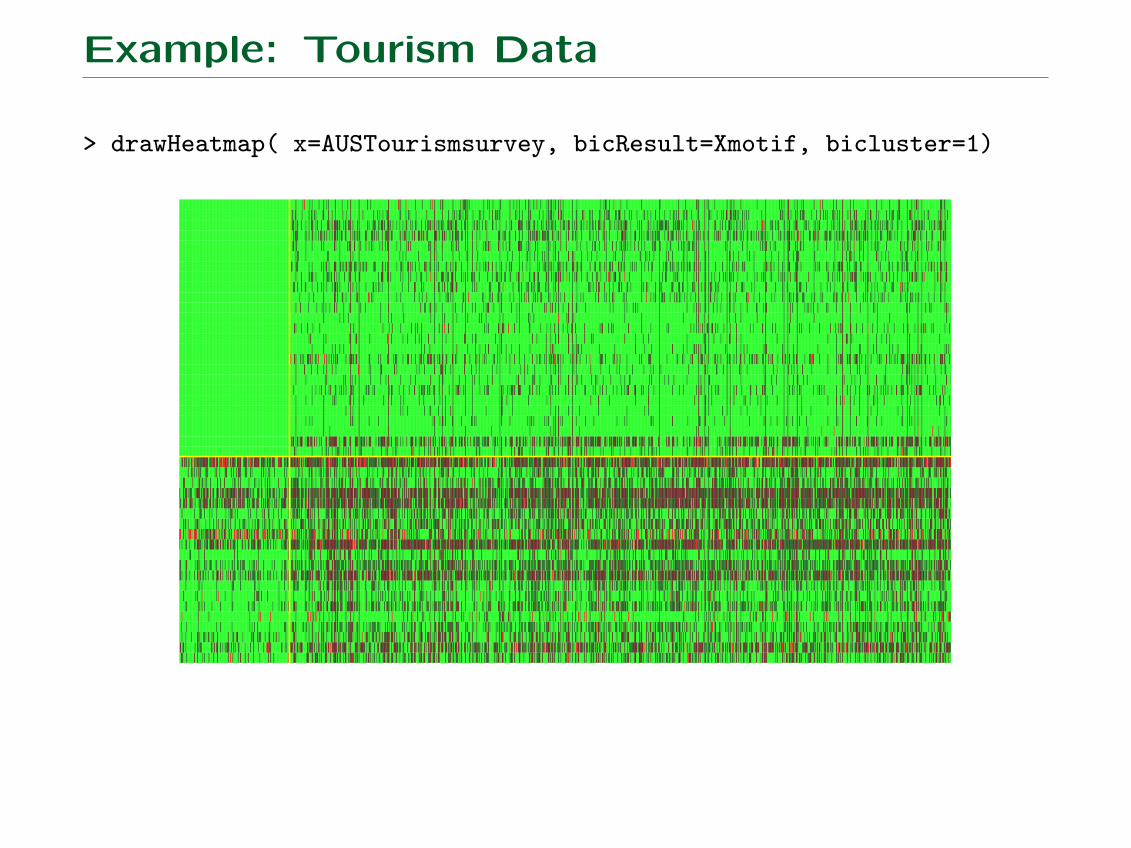
Example: Tourism Data
> parallelCoordinates( x=AUSTourismsurvey, bicResult=Xmotif, bicluster=1)
5 10 15 20
−1.
0−
0.5
0.0
0.5
1.0
Question
Ans
wer
Example: Tourism Data
> drawHeatmap( x=AUSTourismsurvey, bicResult=Xmotif, bicluster=1)

Future Work
• Benchmark algorithms on more difficult scenarios.
• Compare algorithms in different application fields.
• Develop rules to choose bicluster algorithm.
• Develop a model based bicluster algorithm.
• Statistical tests on bicluster results.

Acknowledgments
The package biclust is a joint work with Microarray Analysis and
Visualization Effort, University of Salamanca, Spain, especially Rodrigo
Santamaria.
The benchplot is the work of Manuel Eugster, working group computa-
tional statistics, LMU Munich.
References
biclust - A Toolbox for Bicluster Analysis in R, Kaiser S. and Leisch
F.,Technical Report 28, Accepted for Compstat 2008-Proceedings in Computational
Statistics.
See
http://cran.r-project.org/package=biclust/ for the official release,
http://r-forge.r-project.org/projects/biclust/ for the newest develop-
ments
and
http://www.statistik.lmu.de/~kaiser/bicluster.html for Papers and Links.