second annual nyse small-cap conference for non-u.s. companies new york, may 6 - 7, 2004
TRANSCRIPT

Second Annual NYSE Small-Cap Conferencefor Non-U.S. Companies
New York, May 6 - 7, 2004

Steel Sector
Gerdau S.A. Consolidated
Stock Market

2003 2002 Var. %
1 China 220.1 181.7 21.1%
2 Japan 110.5 107.7 2.6%
3 United States 91.4 92.2 -1.0%
4 Russia 61.3 58.6 4.7%
5 Korea 46.3 45.4 2.0%
6 Germany 44.8 45.0 -0.4%
7 Ukraine 36.7 34.1 7.8%
8 India 31.8 28.8 10.3%
9 Brazil 31.1 29.6 5.1%
10 I taly 26.7 26.0 3.0%
Other 244.4 236.7 3.3%
TOTAL 945.1 885.8 6.7%
World ProductionCrude Steel
In million tons
Sources: IISI and MEPS
In the 1Q 2004,
the world
produced
247.7 million
tons of crude
steel.
Brazil
contributed
with 3.2% of
this tonnage.
03

Largest ProducersCrude Steel 2002
Source: IISI
In million tonsProduction
1 Arcelor 44.0
2 LNM Group 34.8
3 Nippon Steel 29.8
4 POSCO 28.1
5 Shanghai Baosteel 19.1
6 Corus 16.8
7 Thyssen Krupp 16.4
8 NKK 15.2
Company
(LUX)
(ENG)
(JAP)
(KOR)
(CHI)
(ENG)
(GER)
(JAP)
9 Riva 15.0
10 US Steel 14.4
11 Kawasaki 13.7
12 Nucor 12.4
13 Sumitomo 11.8
14 Gerdau 11.5
15 SAIL 11.4
Company Production
(ITA)
(USA)
(JAP)
(USA)
(JAP)
(BRA)
(ENG)
04

OverviewBrazilian Steel Sector - 2003
Belgo (Arcelor) – 33.8%2,654 thousand tons
Gerdau Açominas – 49.6%3,894 thousand tons
Barra Mansa - 5%385 thousand tons
Aços Villares - 6%456 thousand tons
V&M do Brasil - 6%466 thousand tons
LONG STEEL PRODUCERS IN BRAZIL
Source: IBS
CRUDE STEEL PRODUCERS IN BRAZIL
In thousand tonsUsiminas/Cosipa
Gerdau Açominas
Belgo/CST/Acesita (Arcelor)
CSN
Aços Villares
V&M do Brasil
Barra Mansa
8,624
6,976
8,449
5,318
775
551
421
MWL Brasil 36
05
TOTAL 2003: 7,855 thousand tons
TOTAL 2003: 31,150 thousand tons

Exports of Long Steel ProductsBrazilian Steel Sector - 9M2003
Source: IBS
Exports Domestic SalesExports of long steel products
reached 2.2 million tons in 2003, an increase
of 78% YoY.
In million tons
Domestic SalesSep.2003/2001
- 11%
ExportsSep.2003/2001
+85%
2001 2002 2003
Monthly Average 517.2 thousand tons
100
200
300
400
500
600
700Monthly Average
528.2 thousand tonsMonthly Average
461.5 thousand tons
Monthly Average 84.4 thousand tons
Monthly Average 99.2 thousand tons
Monthly Average 156.3 thousand
tons
06

CompetitivenessBrazilian Steel Sector
Source: IBS
EBITDA MARGIN - 2002
Brazil Asia*
* Does not include Japan
Japan EU North America
Others (World)
In %
5
10
15
20
25
30
35
40
Despite increases in the prices of main inputs, Brazil has the highest operating margin in the world.
The mills operate with up-to-date technology due to a permanent investment program.
35%
07

InvestmentsBrazilian Steel Sector
Source: IBS
INVESTMENT SCHEDULE
In US$ million
30 31 29
33 33 34 34 35
40 40
3028 302826 25 25 26 26 25
28 27
31
2423222119181918161617
151313
0
10
20
30
40
50
20071994 95 96 97 98 99 00 01 02 03 04 05 06
In million tons
Apparent Consumption
Installed Capacity
Crude Steel Production
INSTALLED CAPACITY X PRODUCTION X APPARENT CONSUMPTION
08
2003 2004 2005 2006 2007 TOTAL
FLAT STEEL 613.4 694.0 854.4 351.5 117.9 2,631.2
LONG STEEL 290.3 276.2 281.2 185.9 180.1 1,213.7
SPECIALTY STEEL 72.8 58.5 50.4 38.1 32.3 252.1
TOTAL 976.5 1,028.8 1,186.0 575.4 330.4 4,097.0

Steel Sector
Gerdau S.A. Consolidated
Stock Market

Main Products
BILLETS, BLOOMS& SLABS MERCHANT BARS REBARS FABRICATED STEEL
HEAVYSTRUCTURAL SHAPES WIRE-ROD WIRES NAILS
10

Billets, merchant bars, rebars, wire
rod, drawn products, welded
meshes, nails, downstream
products and fabricated steel
products.
Billets, slabs, blooms, merchant bars,
rebars, wire rod, drawn products,
welded wire meshes, structurals,
nails, downstream products, fab.
steel products and specialty steel.
Billets, merchant bars, rebars
and wire rod.
CRUDE STEEL
SLABS, BLOOMS
& BILLETS
In thousand tons
Gerdau Açominas
SouthAmerica
NorthAmerica
7,575
510
6,568
2,610
TOTAL 14,653 2,610
COMMON ROLLED PRODUCTS
4,640
634
6,186
11,460
-
-
PRODUCTS
Installed Capacity
11

12.3 million
9.0 million
AzaChile1992
MRMCanada1995
Part. Açominas
1997AmeriSteel
USA1999
CearenseGuaíra1982
LaisaUruguay
1981
Hime1985
Barão de Cocais1988
CourticeCanada1989
Usiba1989
Piratini1992
Pains1994
Sipsa Argentina
1997
Açominas(control)
2002
Co-Steel2002
20031980 1984 199619921988 2000
Part. Sipar
Argentina1998
Output EvolutionAVERAGE GROWTH RATE
1980 - 2003Crude Steel 10.2% per year
Rolled Products 9.2% per year
14th largest world steel producer according to the IISI. Largest long steel producer in the Americas.
Crude Steel Rolled Products
12
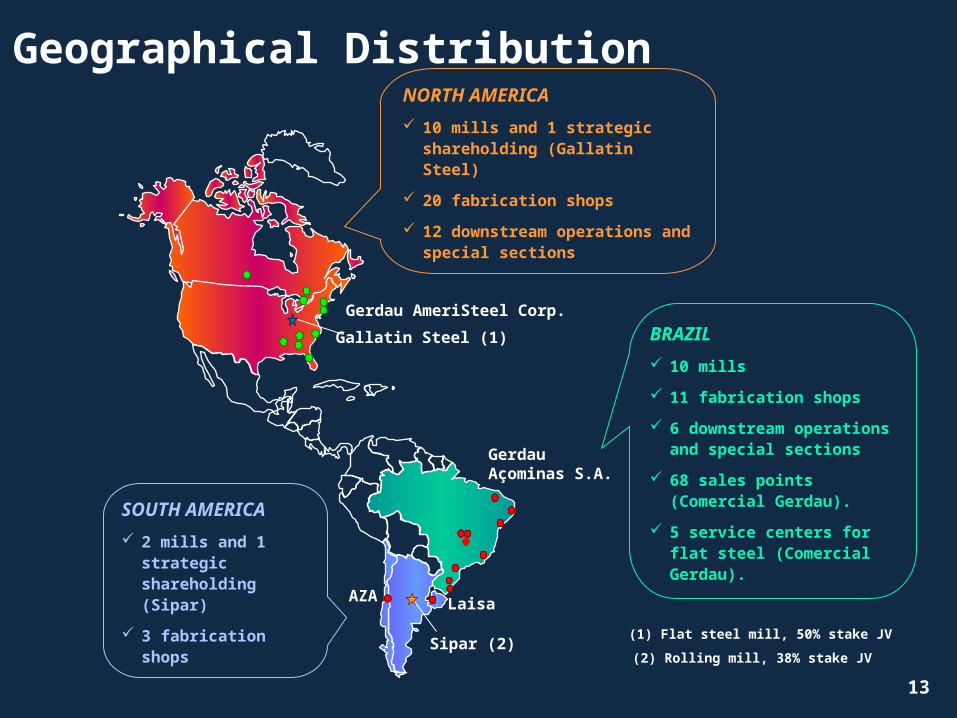
Geographical Distribution
(2) Rolling mill, 38% stake JV
(1) Flat steel mill, 50% stake JV
SOUTH AMERICA
2 mills and 1 strategic shareholding (Sipar)
3 fabrication shops
BRAZIL
10 mills
11 fabrication shops
6 downstream operations and special sections
68 sales points (Comercial Gerdau).
5 service centers for flat steel (Comercial Gerdau).
NORTH AMERICA
10 mills and 1 strategic shareholding (Gallatin Steel)
20 fabrication shops
12 downstream operations and special sections
Gerdau AmeriSteel Corp.
Sipar (2)
Laisa
GerdauAçominas S.A.
AZA
Gallatin Steel (1)
13

Competitive Edge
Focus on long steel products manufacturing and distribution
Market mill approach
Up-to-date technology
Competitive production costs
Diversified production processes
Multiple raw materials sourcing
Vertical and horizontal integration
Relevant market share in every country in which the Company has operations
Financial soundness and access to international capital markets
Confirmed experience in turning around distressed operations
14

Results 1Q20041Q2004 4Q2003 1Q2003
GROSS SALES 4,973 4,169 3,925
Net Sales 4,173 3,516 3,327
Cost of Sales (3,156) (2,648) (2,495)
Gross Profit 1,017 869 832
SG&A (306) (364) (280)
Net Financial Expenses (154) (156) (109)
Other Operating Revenues 18 16 -
Equity Pick Up 17 (14) (89)
Operational Income 593 350 353
Non Operating Revenues/ Expenses (10) 6 (1)
Income Tax & Social Contribution (148) (117) (60)
Statutory Participation (8) (13) (5)
Net Income 427 460 287
Controlling Shareholders 382 458 246
Minority Shareholders 45 2 41 15

NORTH SOUTH TOTAL TOTALBRAZIL AMERICA AMERICA 1Q04 2003
In R$ millionNet Sales 1,988 2,028 157 4,173 13,367 Gross Profit 759 195 63 1,017 3,290 EBITDA 620 204 59 883 2,683 Net Income 324 62 41 427 1,255
In R$/ TonNet Sales 1,221 1,460 1,300 1,330 2,029 Gross Profit 466 140 522 324 499 EBITDA 381 147 489 281 407 Net Income 199 45 339 136 191
In %Gross Margin 38% 10% 40% 24% 25%EBITDA Margin 31% 10% 38% 21% 20%Net Margin 16% 3% 26% 10% 9%
Results by Regions1Q2004
16

Brazil(domestic sales)
Brazil(exports)
NorthAmerica
SouthAmerica
436416
352
376
5,180
3,476
3,400
5,140
3,211
3,376
3,034
1,891
3,874
2,294
1,068
3,656
351
2,264
1,052
3,546
285
927
730
3,152
260505208
2,837208
240499
2,711
1997 1998 1999 2000 2001 2002 2003 1Q04Annualized
3,658 3,811 5,094 7,213 7,394 9,151 12,144 12,492 TOTAL TONS
Sales Track Record
In thousand tons
17

Indebtedness
In R$ million
GROSS DEBT
Short Term
Local Currency
Foreign Currency
Companies Abroad
Long Term
Local Currency
Foreign Currency
Companies Abroad
Cash & Equivalents
Local Currency
Companies Abroad
NET DEBT
6,378 100% 6,263 100%
2,230 35% 2,417 39%
187 3% 281 4%
1,540 24% 1,343 21%
504 8% 794 13%
4,148 65% 3,845 61%
714 11% 717 11%
1,243 19% 1,031 16%
2,191 34% 2,097 33%
1,151 100% 1,017 100%
421 37% 430 42%
730 63% 587 58%
5,228 5,246
DEZ. 03MAR. 04
HEDGE
Total Debt 100%
In US$ (Brazil) 44%
In R$ (Brazil) 14%
Companies Abroad 42%
In R$ million
Debt in US$ (Brazil) 2,783
Swap Operations 1,030
Cash & Equiv. In US$ 730
Total Hedge 1,760
Coverage 0,63X
COST OF DEBT
In % p.a.
In R$ (Brazil) 14.0%
In US$ (Brazil) + FX 5.4%
In Us$ (Abroad) 6.3%
19
FX rate US$ R$ 2.9086 R$ 2.8892

Investments2003
Gerdau AçominasUS$ 230 mm
South AmericaUS$ 7 mm
North AmericaUS$ 59 mm
NEW WIRE-ROD MILL
Installed capacity:
550 thousand tons/year
Total investment:
US$ 66 mm
TOTAL IN 2003: US$ 295 MMFORECAST FOR 2004: US$ 350
MM 20

Operational Integration Combination of strengths of both companies: greater competitiveness
Project developed in partnership between Gerdau and CEA (Employee Investment Club)
Headquarters in Ouro Branco - MG
Gerdau Açominas S.A.Gerdau S.A. Aço Minas Gerais S.A.Açominas
NEW CORPORATE GOVERNANCE
Met. Gerdau S.A.
Gerdau Açominas S.A.
Brazil NorthAmerica
SouthAmerica
Gerdau Ameristeel
Gerdau AZA
Gerdau Laisa
Sipar
Gerdau S.A.
21

Stronger demand in Brazil (domestic market);
Lower interest rates in Brazil expected for the end of the year;
Economic stability in Brazil and uncertainty in the political scenario;
International prices trend: stable to upwards;
North American operations pursuing better results;
US economy recovering;
South American operations in very good shape and improving.
Outlook
22

Steel Sector
Gerdau S.A. Consolidated
Stock Market

Shareholders Structure
Metalúrgica Gerdau S.A.
Other Gerdau Companies 25%
Brazilian Inst. Investors 24%
Foreign Inst. Investors
15%
Other Shareholders
36%
Gerdau S.A.
Met. Gerdau and otherGerdau companies
52%
Brazilian Inst.
Investors 10%
Foreign Inst. Investors
22%
Other Shareholders
16%
Gerdau Açominas S.A.
GerdauGroup
92%
CEA Clube / Fund. Aços 4%
Other Shareholders 4%
24

Adjusted Net Income Dividends paid
Payout of 30% of the Adjusted Net Income.
Dividend payments are being made on a quarterly basis since March 2003.
Dividend Policy
* Met. Gerdau paid a higher amount due to a one-time supplementary dividend payment in 2001. 25
1.080
33.0% 32.6% 52.5% 34.2% PAY OUT
YIELD6.0% 7.9% 17.0% 12.4 %
32.2% 32.8% 35.7% 34.7% 32.5%
3.6% 6.1% 6.8% 7.1 % 3.9%
31.5%
6.2 %
METALÚRGICA GERDAU S.A.In R$ million
234
123
163
54
174
57
413141
546
172
20001999 2001* 2002 2003
763
265
462
165381
125306
98
351
200120001999 2002 2003
GERDAU S.A.In R$ million
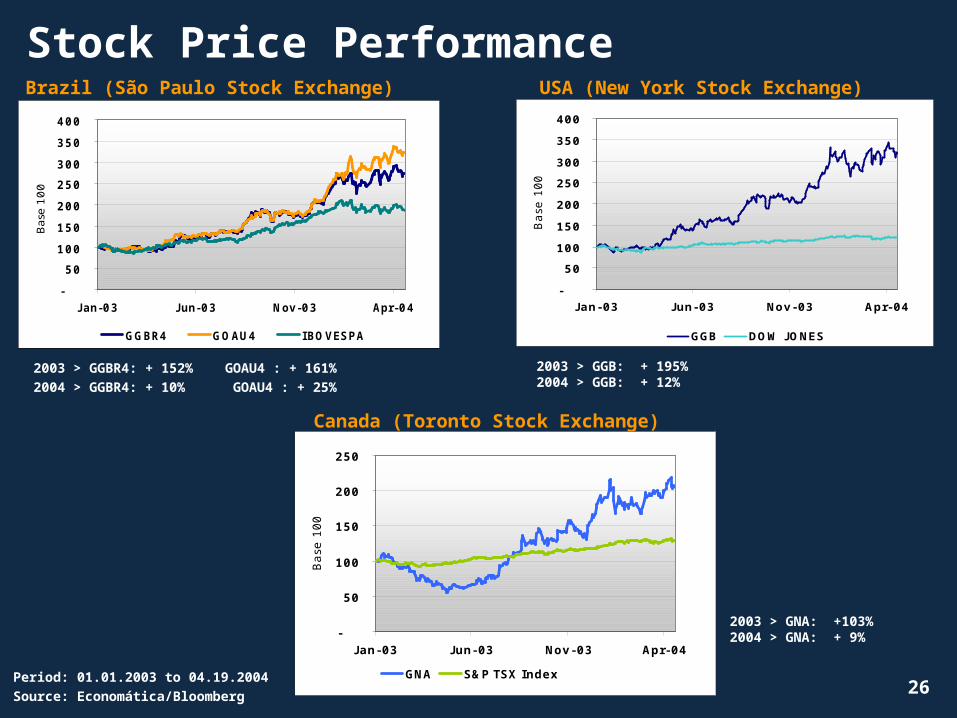
Stock Price Performance
Period: 01.01.2003 to 04.19.2004Source: Economática/Bloomberg
USA (New York Stock Exchange)
Canada (Toronto Stock Exchange)
26
2003 > GGBR4: + 152% GOAU4 : + 161%2004 > GGBR4: + 10% GOAU4 : + 25%
2003 > GGB: + 195%2004 > GGB: + 12%
2003 > GNA: +103%2004 > GNA: + 9%
-
50
100
150
200
250
300
350
400
J an-03 J un-03 Nov-03 Apr-04
Bas
e 1
00
GGBR4 GOAU4 IBOVESPA
-
50
100
150
200
250
300
350
400
Jan-03 Jun-03 Nov-03 Apr-04
Base
100
GGB DOW JONES
-
50
100
150
200
250
Jan-03 Jun-03 Nov-03 Apr-04
Base
100
GNA S&P TSX Index
Brazil (São Paulo Stock Exchange)

1 year 3 years 5 years
Appreciation ChartIn US$
Source: EconomáticaBase: 04.19.2004Dividend-adjusted
USA (NYSE)
GGB+171%
GGB+246%
GGB+304%
DOW+25% DOW
-2.4%DOW0%
1 year 3 years 5 years
BRAZIL (Bovespa)
GGBR4+180%
GGBR4+468%
GGBR4+319%GOAU4
+199%
GOAU+720%
GOAU4+458%
IBOV+82%
IBOV+11%IBOV
13%
Gerdau S.A.
Metalúrgica Gerdau S.A.
Ibovespa
Gerdau - ADR
Dow Jones
27

Comparative ChartGERDAU BELGO CSN USIMINAS NUCOR
STEEL DYNAMICS
TICKER SYMBOL GGBR BELG CSN USIM NUE STLD
Market Capitalization04.19.2004 (US$ mm)
3,367 1,834 4,267 2,581 5,088 1,307
Enterprise Value - EV (US$ mm)
5,183 1,971 5,966 4,920 5,642 1,849
EBITDA annualized(US$ mm)
929 402 1,039 1,063 469 113
EV/ EBITDA annual.(X)
5.6 4.9 5.7 4.6 12.0 16.4
Price04.19.2004 (US$)
22.68 261.16 59.45 11.99 65.09 27.49
Net Income(US$ mm)
434 271 357 452 63 47
P/ E - Price/ Earningsper share (X)
7.7 6.8 11.9 6.0 81.0 27.8
Market Cap/ EBITDA annual.(X)
3.6 4.6 4.1 2.4 10.8 11.6
Source: Economática and company websites28
