second harmonic generation guided raman spectroscopy for
TRANSCRIPT

Second Harmonic Generation Guided Raman Spectroscopy forSensitive Detection of Polymorph TransitionsAzhad U. Chowdhury,† Dong Hye Ye,‡ Zhengtian Song,† Shijie Zhang,† Hartmut G. Hedderich,†
Babita Mallick,§ Satyanarayana Thirunahari,§ Srividya Ramakrishnan,§ Atanu Sengupta,§
Ellen J. Gualtieri,∥ Charles A. Bouman,‡ and Garth J. Simpson*,†
†Department of Chemistry, Purdue University, 560 Oval Drive, West Lafayette, Indiana 47907, United States‡Department of Electrical and Computer Engineering, Purdue University, 465 Northwestern Avenue, West Lafayette, Indiana 47907,United States§Dr. Reddy’s Laboratories, IPDO, Bachupally Campus, Hyderabad, Telengana 500090, India∥Formulatrix, Inc. 10 DeAngelo Drive, Bedford Massachusetts 01730, United States
*S Supporting Information
ABSTRACT: Second harmonic generation (SHG) wasintegrated with Raman spectroscopy for the analysis ofpharmaceutical materials. Particulate formulations of clopidog-rel bisulfate were prepared in two crystal forms (Form I andForm II). Image analysis approaches enable automatedidentification of particles by bright field imaging, followed byclassification by SHG. Quantitative SHG microscopy enableddiscrimination of crystal form on a per particle basis with99.95% confidence in a total measurement time of ∼10 ms perparticle. Complementary measurements by Raman andsynchrotron XRD are in excellent agreement with theclassifications made by SHG, with measurement times of ∼1min and several seconds per particle, respectively. Couplingthese capabilities with at-line monitoring may enable real-time feedback for reaction monitoring during pharmaceuticalproduction to favor the more bioavailable but metastable Form I with limits of detection in the ppm regime.
Crystal form and polymorph transitioning can profoundlyaffect the stability and bioavailability of active pharma-
ceutical ingredients (APIs). Polymorphism refers to theexistence of multiple crystalline solid forms of identicalcomposition, with this multiplicity arising from the packingand/or the relative orientation of molecules in the crystallattice. These differences in crystal lattice of an API generallyexhibit different bioavailability by differing their physicochem-ical properties such as dissolution kinetics, thermodynamicstability, etc.1−4 A classic example is the case of ritonavir, inwhich the marketed final dosage form spontaneously convertedto a more stable and previously unknown crystal form, whichexhibited substantially slower dissolution kinetics and corre-spondingly lower bioavailability.5 A recent study estimates thatmore than 80% of APIs have multiple known polymorphicforms.6
Clopidogrel bisulfate is a particularly interesting example, inwhich seven different polymorphic form have been identified;among them only Form I and Form II are used for the drugformulation.7−9 Clopidogrel bisulfate is a drug that falls intothienopyridine class. It inhibits platelet aggregation and is usedto treat patients with acute coronary syndrome. Only thedextrorotatory enantiomer exhibits antiplatelet aggregation
where the levorotatory enantiomer remains inactive,10 andtherefore the final dosage form is typically a pure enantiomericform preparation. The Form I polymorph is metastable, butexhibits significantly higher bioavailability than the morethermodynamically stable Form II.8 Solvent mediated crystal-lization is the most common method for the production ofclopidogrel bisulfate for pharmaceutical materials, in which thedesired Form I is kinetically the first to be produced, followedby spontaneous transformation to Form II if the reaction isallowed to progress. Both polymorphic forms of clopidogrelbisulfate possess an enantiotropic system where two differentpolymorphs are stable at different temperatures; thus Form Ihas the potential to spontaneously transition to the more stableForm II during manufacture and storage.9,11 Therefore,methods capable of sensitively identifying the early onset ofthe Form I to Form II transition could be used for activecontrol to ensure Form I production during synthesis andstorage. Even a small mass fraction of the more stablepolymorph may negatively impact the dissolution kinetics by
Received: February 3, 2017Accepted: May 8, 2017Published: May 8, 2017
Article
pubs.acs.org/ac
© 2017 American Chemical Society 5958 DOI: 10.1021/acs.analchem.7b00431Anal. Chem. 2017, 89, 5958−5965
serving to nucleate precipitation of the API upon introductionto the gut.12
The Food and Drug Administration (FDA) and othergovernment agencies require thorough characterization of APIsduring filing for a new drug applications (NDAs) andabbreviated new drug applications (ANDAs).2,13,14 High-throughput (HT) analytical methods for APIs screening areadvantageous, spanning the early stages of drug developmentthrough to assessment of the shelf life of final dosages.Assessments of composition are typically performed by batchsampling, in which analysis of representative aliquots is used toassess composition during reaction. Several analytical methodshave been explored for clopidogrel polymorphic formcharacterization and quantification including powder X-raydiffraction (PXRD) analysis,15 vibrational spectroscopictechnique combined with chemometrics,9 solid state stressdegradation studies,16 and X-ray microtomography.17 InPXRDs, Uvarov and Popov have quantified the clopidogrelphase content in the mixture of Form I and Form II using X-raypowder pattern decomposition and classical direct methods.The limit of detection was found to be 1.0−1.5 wt % in bothmethods.15 In another quantitative analysis of clopidogrelbisulfate Form II in Form I, Nemet and co-workers combinedIR and Raman spectroscopy with chemometrics and quantified2% and 3% of Form II in Form I, respectively, with less than 1%limit of detection.9 Recently, a microscopy based approachcombined with image-analysis was developed to extractmorphological details for quantification of trace amount ofpolymorphic phases. In this study, a synchrotron radiation X-ray computed microtomography (SR-μCT) was used forselective and sensitive detection of clopidogrel bisulfatepolymorphs. The limit of detection (LOD) was also found tobe 1%.17 Although, this microscopy based approach showsgood promise in polymorphic phase determination in terms ofrequired time to the sample a large area (2048 × 2048 pixels in2 s, pixel size = 3.7 μm), it is not suitable for online phasemonitoring due to the requirement of a synchrotron radiationsource. Although, these reported techniques are capable ofdetecting polymorphic phases down to ∼1% LOD, none ofthese techniques possesses enough sensitivity to reach LODinto the parts per million (ppm) regime relevant to kineticmodeling of stability and dissolution kinetics.Recent studies have suggested the use of nonlinear optical
imaging for quantifying both overall crystalline content and
crystal polymorphism in pharmaceutical formulations. Theresults of these studies have shown the capabilities of nonlinearoptical imaging to detect organic nanocrystal,18 quantify secondorder nonlinear optical signal from various active pharmaceut-ical ingredients,19,20 detect and characterize metastablepolymorphs,21,22 discriminate polymorphs rapidly,23 detectcrystallinity in ppm regime,24 and quantify second ordernonlinear optical signal per particle basis in powder matrix.25
Previous studies suggested nonlinear optical methods can beused for discrimination of crystal forms in model systems withwell-defined polymorphs, and definitive confirmation has notyet been demonstrated through independent analyses onpharmaceutically relevant materials.The general applicability of SHG for pharmaceutical
materials analysis has been bolstered by the increasing use ofhomochiral small molecules in formulations. The large majorityof new small molecule active pharmaceutical ingredients arehomochiral, with one or more chiral center.26 With theexception of a few relatively rare high-symmetry systems, theremaining common space groups into which a small chiralmolecule can crystallize are symmetry-allowed for SHG-activity.27 The relaxation of phase-matching requirements inSHG microscopy allows for reasonably reliable ab initioprediction of the SHG activities of both small molecule andlarge molecule crystals from the known packing arrange-ments.20,28 Such calculations can help inform the potentialappropriateness of SHG-guided analysis prior to experimentalstudies and to obtain an initial estimate of the anticipateddifference in SHG activity for different polymorphic forms.In this work, we propose the use of Raman and synchrotron
PXRD guided by SHG microscopy for crystal form character-ization of individual ∼100 ng particles of clopidogrel bisulfate.Specifically, the combination of bright field imaging and SHGmicroscopy was used to identify candidate particles forsubsequent Raman and PXRD analysis of crystal form.Measurements are presented for physical mixtures of Form Iand Form II particles, prepared similarly with the exception ofthe reaction time; the reaction time was extended for the FormII production to allow complete transitioning.
■ EXPERIMENTAL SECTION
Materials and Sample Preparation. Pure clopidogrelbisulfate Form I and Form II were produced in-house at Dr.Reddy’s Lab. As produced, both polymorphic forms were
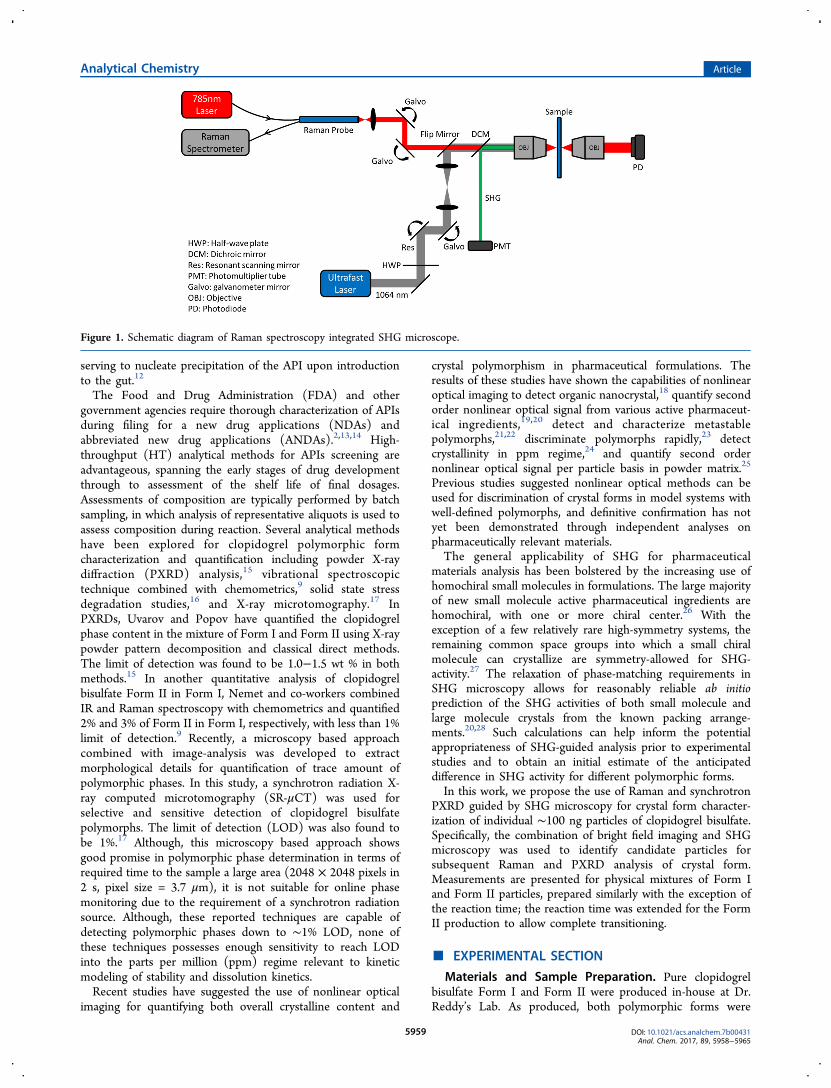
Figure 1. Schematic diagram of Raman spectroscopy integrated SHG microscope.
Analytical Chemistry Article
DOI: 10.1021/acs.analchem.7b00431Anal. Chem. 2017, 89, 5958−5965
5959

generated as white spherical particles, exhibiting a similar sizedistribution with a diameter of ∼25 μm as determined bycalibrated bright field image analysis. Samples was prepared aspowdered blends consisting of 10% clopidogrel bisulfate FormII in Form I by mass. Images were taken for powderscompacted between two glass microscope slides from at leastthree arbitrarily chosen locations of each sample to providerepresentative sampling.SHG Imaging. SHG micrographs were obtained using a
commercial Formulatrix SONICC system, modified in-housefor compatibility with powder analysis. In brief, a Fianiumfemtosecond laser was used as the incident source (170 fs, 1.3W, 1060 nm, 51 MHz repetition rate). SHG images wereproduced by beam-scanning through a 10× objective with a ∼2mm × 2 mm field of view with the SHG measured intransmission. Unless otherwise indicated, 150 mW laser powermeasured at the sample and 1 s image acquisition time was usedfor SHG imaging. Bright field images acquired with a white-light source and a camera in the same instrument were used to
identify particle locations by segmentation algorithms describedin detail in a subsequent section.
SHG Guided Raman Measurement. A prototype built-in-house microscope was used to acquire Raman spectra fromSHG active and inactive particles in each field of view. In thisprototype instrument, output of a Toptica continuous wave(CW) laser (785 nm wavelength) was collected by an opticalfiber of a custom-made Raman probe (InPhotonics, RPS785/24), shown in Figure 1, and recollimated by a 1/2 in. fusedsilica lens. Collimated light then taken through a scan headfollowed by two other fused silica 1 in. lenses in a 4fconfiguration to focus on the sample using a 10× objective. Agalvanometer mirror pair was used in the scan head and precisevoltage controlling on two galvanometer mirrors rapidly drivesthe Raman beam to a location of choice in each field of view.Using of two galvanometer mirrors was advantageous in a waythat it also could be used to scan the sample for spectralimaging. Raman signal from the sample was collected in epi,following the same beam path back through the same Raman
Figure 2. Representation of the segmentation algorithm to perform classification of individual particles. Brightfield (3a) and SHG (3b) images areshown for a mixture of clopidogrel bisulfate (10% Form II/90% Form I). Red cross-hairs in the image indicate the representative candidates for thepolymorphic form classification. The images in parts a and b were brought into the registry and converted to binary images in parts c and d,respectively, to identify (i) the locations of all the particles and (ii) the locations of the SHG-dim fraction. The difference map shown in part e allowsclassification of the Form II particles, indicated by the green circles in part f.
Analytical Chemistry Article
DOI: 10.1021/acs.analchem.7b00431Anal. Chem. 2017, 89, 5958−5965
5960

probe and directed into a Raman spectrometer (SpectraPro300i, Acton Research) to generate the spectrum. There was abuilt-in notch filter in the probe to reject the laser line. A 100 ×1340 CCD array was used for spectral detection employingvendor software (Winspec32). Two different computers wereused in this prototype instrument, one to drive the beam andthe other to collect the spectrum.X-ray Diffraction Measurement. X-ray diffraction (XRD)
measurements were carried out using a SHG integrated XRDmultimodal microscope in Argonne National Laboratory.Instrument details are described elsewhere.29,30 In short, aFianium FemtoPower ∼1060 nm ultrafast fiber laser thatgenerated ∼160 fs pulses centered at 1064 nm, with a 50 MHzrepetition rate was integrated into the GM/CA@ APS beamline23-ID-B at the Advanced Photon Source. The infrared beamwas scanned across the sample through a 10× objective with anumerical aperture (NA) of 0.3 using a resonant scanner and agalvanometer mirror. SHG and bright field images of thetransmitted infrared beam were collected in transmission. Anunattenuated photon flux with a photon energy of 12 keV, 5μm diameter beam was used to generate X-ray scatteringpatterns from highly confined locations. XRD patterns wereacquired with 2 s exposure time per location with another 2 sfor dead time between next exposure in a 4 × 4 grid.Image Segmentation and Registration. An image
segmentation algorithm was developed and written in Matlab,in which a normalized cross correlation (NCC) based templatematching algorithm was trained by images of a 1951 USAFresolution test chart taken by two different modalities: brightfield and SHG. In the following step, Otsu’s adaptivethresholding was applied to SHG images to create binarymasks (Figure 2d). Assuming two polymorphs are present, abimodal intensity distribution in intensity is expected. Otsu’smethod separates image into two classes, i.e., background andforeground; the algorithm starts with an arbitrary thresholdthen searches for an optimal threshold that maximizes theinterclass variance.31 A binary image was also created (Figure2c) using the bright field image followed by removal of residualpixels to match the SHG image dimensions. Subtractionfollowed by pruning the residual mask recovered the particlesthat produced low SHG signals (Figure 2f), identified as theForm II polymorph.
■ RESULTS AND DISCUSSIONPure Sample Measurement. SHG images were obtained
from the pure Form I and Form II powders, the results arepresented in Figure 2. Form I exhibit ∼250 times higher SHGactivity per unit volume than Form II. The integrated intensityover multiple z-planes (Figure 3) totaling a depth of field ∼120μm was divided by the estimated volume of an individualparticle multiplied with the total number of the particles in thefield of view to determine the SHG activity per unit volume,normalized to a reference material of point-source BaTiO3nanoparticles (500 nm). The diameters of particles werecalculated from the bright field measurements and the SHGactivities per particle were recovered using the segmentationalgorithm. The combined mean and standard deviation in theSHG activities on per particle basis were 35 ± 9 counts/μm2 forForm I and 0.095 ± 0.003 counts/μm2 for Form II. In general,higher symmetry crystals tend to produce weaker SHGactivity,28 consistent with the observed trends for clopidogrelbisulfate. Clopidogrel bisulfate Form I is known to adopt amonoclinic unit cell and belongs to the P21 space group, and
Form II has an orthorhombic unit cell and belongs to theP212121 space group.15 Assuming a normal distribution ofuncertainty, individual particles can be assigned to either FormI or Form II with a statistical confidence of 99.995% basedsolely on their differences in SHG activity.
Form I and Form II Mixtures. In order to quantifypolymorphic phase content in a mixture, bright field and SHGimages were taken for a 10% mixture of Form II in Form I. Thecombination of bright-field and SHG micrographs provided ameans to make initial classifications of individual particles aseither Form I or Form II, the process of which is illustrated inFigure 2. Bright field images enabled identification of particlelocations with a high signal-to-noise ratio (SNR), while thedifference in SHG per unit volume (SHG/V) for Forms I andII was used for initial classification of the crystal form. Since thebright field and SHG images were acquired using independentbeam paths, image registration algorithms were developed andemployed to correct for the disparities in the number of pixelsand in the fields of view for the two imaging modalities asdescribed in the Experimental Section. The assumption ofspheroidal particle morphologies (∼25 μm in diameter)reduced complications from particle−particle overlap in thesegmentation algorithm.
Raman Spectroscopy for Crystal Form Discrimination.Following the initial classification by SHG, independentassessment of the crystal form was performed by Ramanspectroscopy using the SHG/V analysis to guide selection ofrelevant particles of interest, the results of which are presentedin Figure 4. Figure 4a and 4b correspond to the postprocessedbright field image and SHG image, respectively. RepresentativeForm II candidates are indicated by the red (SHG activity, low)and Form I candidates by blue (SHG activity, high) circles inboth images. In order to acquire a Raman spectrum from eachparticle, the appropriate position of the Raman acquisition wasselected by a galvanometer mirror pair and Raman scatteringfrom the targeted particles was integrated for ∼1 min (2 s perframe for 30 frames) to generate high SNR spectra. Excellentagreement was observed between the Form II referencespectrum and the Raman spectrum of individual ∼100 ngparticles classified as Form II based on the combined bright-field and SHG/V assessments. Similarly, definitive agreementwas also observed for the Form I reference spectra with those
Figure 3. Integrated SHG intensity measured as the focal plane wastranslated through powders of Form I and Form II CB. The integratedSHG intensity from Form II was rescaled by 100-fold to aid invisualization. Outliers (bright SHG puncta in Form II) were excludedin this calculation.
Analytical Chemistry Article
DOI: 10.1021/acs.analchem.7b00431Anal. Chem. 2017, 89, 5958−5965
5961

obtained from particles classified as Form I in 10% mixturesample.X-ray Diffraction for Further Validation. In addition to
the Raman measurements, SHG guided synchrotron XRDmeasurements were also performed (Figure 5) for the 10%mixture to assess the capabilities of single-particle assessmentsof crystal form by SHG. Figure 5a is the laser transmittanceimage of the 10% mixture, yellow circles in this image indicatethe Form I and Form II identified by the SHG/V measurement.A collimated X-ray beam, 5 μm in diameter, was used to rasterthe particle (shown in the inset of Figure 5b,d). The use of anarrow 5 μm X-ray “mini-beam” enhanced the sensitivity of themeasurement from localized sampling and correspondingbackground reduction. Diffraction images from each rasterscan were integrated to make a single diffraction image.Combinations of diffraction images interrogate a broaderwindow of particle’s crystallographic orientation distributionthus suitable for statistical average, assuming the particlesorientation were uniformly distributed. An integration ofintensities along the azimuthal angle of a diffraction imagerecovers the anticipated powder X-ray diffraction (PXRD)pattern. Experimental diffraction patterns were also comparedto the theoretical predictions of the monoclinic andorthorhombic unit cell, obtained from Cambridge StructuralDatabase (CSD) for Form I and Form II, respectively, shown inFigure 5.
Combining the segmentation with SHG measurementsallows identification of particles of interest based on thedifferences in the SHG/V. From the results in Figure 3,significant differences are expected for the Form I and Form IIpolymorphs. Statistical analysis of the integrated SHG activityper particle basis of both forms suggests a discriminatoryconfidence of 99.995% based on SHG alone. However, theseresults are only valid if the dominant differences are definitivelyconnected directly to polymorphism, rather than other physicaldifferences within the particles (e.g., crystal size distribution,orientation, degree of crystalline order, etc.). Roughlycomparable confidence arises in both the Raman and PXRDanalyses. Because the other spectroscopic methods are based onunique physical properties, the overall rate of misclassification isgiven by the product of the independent rates (for example, amisclassification probability of 0.005% by SHG and 0.1% byRaman would result in a combined misclassification probabilityof one part in 2 × 10⁷).All three approaches (SHG, Raman, PXRD) provided
excellent discriminatory capabilities for crystal form character-ization. In the case of SHG, >99.99% confidence was achievedon a per-particle basis through the combination bright field forparticle localization and average SHG for crystal formdetermination. Qualitatively similar trends were clearlyobserved by both Raman and XRD. While SHG enables thisdiscrimination from a single scalar input (SHG/V), both theRaman and XRD carry additional structural information
Figure 4. Crystal form classification by independent SHG-guided Raman analysis on a per-particle basis. Parts a and b correspond to bright field andSHG images of a 10% mixture of Form II in Form I, respectively. Parts c and d correspond to single particle Raman spectrum and FT-Ramanspectrum, respectively, of Form I and Form II. FT-Raman spectra of both Forms are shifted a few wavenumbers to the right to match the spectrafeature collected from single particle measurements. In both cases, Raman spectra support the preliminary classifications made by SHG microscopy.
Analytical Chemistry Article
DOI: 10.1021/acs.analchem.7b00431Anal. Chem. 2017, 89, 5958−5965
5962

through the recovered spectra (1D) and scattering patterns(2D). However, the greatest discrimination capabilities resultfrom dimension reduction to a single scalar value to optimallyinform crystal form, such that the measurement objectives areultimately based on qualitatively similar inputs.While all three methods allowed high degrees of crystal form
discrimination, SHG microscopy has clear benefits in terms ofsimplicity and measurement time. In practice, conventionalRaman required >several seconds of signal acquisition perparticle to obtain spectra with sufficient SNR for highlyconfident crystal form discrimination, since the spontaneousRaman event is relatively inefficient (1 in 107 Raman scatteringevents relative to Rayleigh scattering).32 For a spectralacquisition time of 60 s, a mixture of 1% Form II would take
∼15 h of continuous signal acquisition from 900 individualparticles followed by post processing of these spectra toquantify polymorphic phase content (assuming no dead timeand detection of 9 Form II particles for an SNR = 3 fromPoisson statistics). The time frame for synchrotron analysis isconsiderably reduced, with as little as 1 s integration time perparticle, corresponding to ∼30 min of acquisition (assuming 1 sdead time for data transfer and sample repositioning).However, synchrotron time is also considerably more difficultto routinely access, given the high demands on beam-time andlimited number of synchrotron facilities. In contrast, SHGimaging allowed characterization of all particles within a 1 × 1mm2 area with 1 s of data acquisition. For an average of ∼200particles in a given field of view, the time frame required to
Figure 5. Initial classification by SHG/V measurement of 10% physical mixture of Form II in Form I and independent evaluation by PXRDmeasurement. Image a corresponds to the bright field image of 1% mixture, and images b and c correspond to the SHG image of the same field ofview. The yellow circles indicate SHG-bright and SHG-dim particles selected as candidates for the diffraction measurements. Experimental powderdiffraction patterns from those particles are compared to the theoretical prediction for Form I and Form II in parts d and e, respectively.
Analytical Chemistry Article
DOI: 10.1021/acs.analchem.7b00431Anal. Chem. 2017, 89, 5958−5965
5963

probe 900 particles is still only a few seconds. To achieve LODof 0.1% would require ∼1 min (40 frames with ∼0.5 s deadtime for sample repositioning between frames), and 100 ppmwould still only require ∼10 min.The relatively low variance in the SHG intensity per particle
is consistent with the presence of numerous small crystalliteswithin each spheroidal particle. The relative standard deviation(RSD) in the SHG/V determination for both Forms I and IIwas ∼15% (calculated from more than 100 particles taken fromdifferent fields of view, yielding 35 ± 9 counts/μm2 for Form Iand 0.095 ± 0.003 counts/μm2 for Form II). The low relativeRSD observed in this study contrasts significantly from SHGmicroscopy measurements in powders, in which the RSDapproached unity for a uniformly distributed population ofBaTiO3 nanoparticles.
25 The low per particle RSD is consistentwith individual particles comprised of polycrystalline conglom-erate, rather than single crystals. For a polycrystallineconglomerate, a representative population of numerous smallcrystallites contributes to the overall SHG intensity observed,rather than a few relatively large sources. In the limit of theaverage crystal size being much less than the focal volume, astatistical population of all sizes and orientations is sampledwithin each individual particle, reducing the particle-to-particlevariance in SHG intensity.It is important to note that the classification of crystal form
on a per-particle basis implicitly assumes that individualparticles will be present as either Form I or Form II, ratherthan a mixture containing both forms in each particle. Inpractice, it is well established that the kinetics of phasetransformation are significantly faster for intraparticle inter-actions,33,34 in which adjacent crystalline domains are inintimate contact within the particle and can serve to nucleateForm II conversion, relative to interparticle interactionsinvolving minimal and transient crystal contact. As such,kinetically it is reasonable to assume that any initial nucleationevent in a given particle results in rapid transition throughoutthe extent of the particle but slow (if any) propagation toadjacent particles, consistent with the expectations of theanalysis.It is also worth considering the ability of SHG alone to
discriminate between the relatively weak Form II and the SHG-inactive amorphous form of clopidogrel bisulfate. While FormII particles do produce SHG significantly greater thanamorphous materials, the signals are sufficiently weak thatdiscrimination between amorphous versus Form II particlesmay be challenging. Fortunately, two strategies can help informsuch decisions. First, reaction monitoring is typically performedthroughout the entire time-course of the reaction, such that thekinetics associated with crystal formation and transitioningcould provide additional insights into the most likelycomposition of a particle exhibiting weak SHG activity.However, more reliable assignments could be made byintegration of Raman spectroscopy with SHG to guide theanalysis to the particles of greatest interest.In light of these collective metrics, SHG-guided Raman can
potentially combine the advantages of both high speed andchemical specificity. In cases in which the composition is clear-cut from SHG alone, confident assessments of crystal form canbe made rapidly on a per-particle basis. In ambiguous caseswhere classification by SHG alone lacks high statisticalconfidence, those particular particles can be flagged forsubsequent analysis by Raman spectroscopy, maximizing the
utilization of the information-rich but time-consumingspectroscopic analysis.
■ CONCLUSIONSIn this study, a prototype instrument (SHG microscopy guidedRaman spectroscopy and powder X-ray diffraction) was used toconfirm the rapidly identified trace polymorphic form ofclopidogrel bisulfate Form II in Form I by SHG measurement.Measurement validations are presented for physical mixtures ofForm I and Form II particles. The combination of bright fieldimaging and SHG microscopy was used to identify candidateparticles for subsequent Raman and PXRD analysis of crystalform. Both the SHG guided Raman and synchrotron PXRDresults support the initial tentative assignments of the crystalform by SHG. Nevertheless, additional benefits of combiningmethods for orthogonal determination, SHG guiding provides ahuge time-saving and enhanced sensitivity by excludingparticles that are unlikely to be Form II based on the presenceof bright SHG. At the same time, quantification of polymorphicphase content becomes very straightforward by rejecting therequirement of a calibration plot that is required for any otherquantitative analytical method. This study potentially canimprove overall yield and polymorphic purity during synthesisand crystallization of clopidogrel bisulfate Form I by identifyingForm II during batch drug product crystallization in real time.
■ ASSOCIATED CONTENT*S Supporting InformationThe Supporting Information is available free of charge on theACS Publications website at DOI: 10.1021/acs.anal-chem.7b00431.
Method for aligning bright field (BF) images and secondharmonic generation (SHG) images acquired by theSONICC system (Formulatrix Inc.) (PDF)
■ AUTHOR INFORMATIONCorresponding Author*E-mail: [email protected] Ramakrishnan: 0000-0002-7892-994XGarth J. Simpson: 0000-0002-3932-848XNotesThe authors declare no competing financial interest.
■ ACKNOWLEDGMENTSThe authors gratefully acknowledge financial support from theNational Science Foundation GOALI award entitled “Inform-ing Amorphous Formulations Design through QuantitativeNonlinear Optical Analysis”, Grant No. 1412888-CHE.
■ REFERENCES(1) Aaltonen, J.; Allesø, M.; Mirza, S.; Koradia, V.; Gordon, K. C.;Rantanen, J. Eur. J. Pharm. Biopharm. 2009, 71, 23−37.(2) Chieng, N.; Rades, T.; Aaltonen, J. J. Pharm. Biomed. Anal. 2011,55, 618−644.(3) Singhal, D.; Curatolo, W. Adv. Drug Delivery Rev. 2004, 56, 335−347.(4) Snider, D. A.; Addicks, W.; Owens, W. Adv. Drug Delivery Rev.2004, 56, 391−395.(5) Bauer, J.; Spanton, S.; Henry, R.; Quick, J.; Dziki, W.; Porter, W.;Morris, J. Pharm. Res. 2001, 18, 859−866.
Analytical Chemistry Article
DOI: 10.1021/acs.analchem.7b00431Anal. Chem. 2017, 89, 5958−5965
5964

(6) Chieng, N.; Rades, T.; Aaltonen, J. J. Pharm. Biomed. Anal. 2011,55, 618−644.(7) Bousquet, A.; Castro, B.; Saint-Germain, J. Polymorphic clopidogrelhydrogenesulphate form. U.S. Patent 6,429,210, August 6, 2002.(8) Lu, J.; Wang, J.; Rohani, S. Cryst. Res. Technol. 2012, 47, 505−510.(9) Nemet, Z.; Demeter, A.; Pokol, G. J. Pharm. Biomed. Anal. 2009,49, 32−41.(10) Badorc, A.; Frehel, D. Dextrorotatory enantiomer of alpha-(4,5,6,7-tetrahydrothieno[3,2-c]pyrid-5-yl)(2-chlorophenyl)methyl acetate,process for its preparation and pharmaceutical compositions containing it.EP Patent EP0281459 A1, September 7, 1988.(11) Koradia, V.; Chawla, G.; Bansal, A. K. Acta Pharm. 2004, 54,193−204.(12) Fahr, A.; Liu, X. Expert Opin. Drug Delivery 2007, 4, 403−416.(13) Raw, A. Adv. Drug Delivery Rev. 2004, 56, 235−236.(14) Raw, A. S.; Furness, M. S.; Gill, D. S.; Adams, R. C.; Holcombe,F. O., Jr.; Yu, L. X. Adv. Drug Delivery Rev. 2004, 56, 397−414.(15) Uvarov, V.; Popov, I. J. Pharm. Biomed. Anal. 2008, 46, 676−682.(16) Raijada, D. K.; Prasad, B.; Paudel, A.; Shah, R. P.; Singh, S. J.Pharm. Biomed. Anal. 2010, 52, 332−344.(17) Yin, X. Z.; Xiao, T. Q.; Nangia, A.; Yang, S.; Lu, X. L.; Li, H. Y.;Shao, Q.; He, Y.; York, P.; Zhang, J. W. Sci. Rep. 2016, 6, 24763.(18) Wanapun, D.; Kestur, U. S.; Kissick, D. J.; Simpson, G. J.;Taylor, L. S. Anal. Chem. 2010, 82, 5425−5432.(19) Toth, S.; Madden, J.; Taylor, L.; Marsac, P.; Simpson, G. Anal.Chem. 2012, 84, 5869−5875.(20) Toth, S. J.; Schmitt, P. D.; Snyder, G. R.; Trasi, N. S.; Sullivan, S.Z.; George, I. A.; Taylor, L. S.; Simpson, G. J. Cryst. Growth Des. 2015,15, 581−586.(21) Chowdhury, A. U.; Dettmar, C. M.; Sullivan, S. Z.; Zhang, S.;Jacobs, K. T.; Kissick, D. J.; Maltais, T.; Hedderich, H. G.; Bishop, P.A.; Simpson, G. J. J. Am. Chem. Soc. 2014, 136, 2404−2412.(22) Hall, V. J.; Simpson, G. J. J. Am. Chem. Soc. 2010, 132, 13598−13599.(23) Schmitt, P. D.; DeWalt, E. L.; Dow, X. Y.; Simpson, G. J. Anal.Chem. 2016, 88 (11), 5760−5768.(24) Newman, J. A.; Schmitt, P. D.; Toth, S. J.; Deng, F.; Zhang, S.;Simpson, G. J. Anal. Chem. 2015, 87 (21), 10950−10955.(25) Chowdhury, A. U.; Zhang, S.; Simpson, G. J. Anal. Chem. 2016,88 (7), 3853−3863.(26) Wu, L.; Vogt, F. G. J. Pharm. Biomed. Anal. 2012, 69, 133−147.(27) Simpson, G. J. Nonlinear Optical Polarization Analysis inChemistry and Biology; Cambridge University Press: New York, 2017.(28) Haupert, L. M.; DeWalt, E. L.; Simpson, G. J. Acta Crystallogr.,Sect. D: Biol. Crystallogr. 2012, 68, 1513−1521.(29) Madden, J. T.; Toth, S. J.; Dettmar, C. M.; Newman, J. A.;Oglesbee, R. A.; Hedderich, H. G.; Everly, R.; Becker, M.; Ronau, J. A.;Buchanan, S. K. J. Synchrotron Radiat. 2013, 20, 531−540.(30) Newman, J. A.; Zhang, S.; Sullivan, S. Z.; Dow, X. Y.; Becker,M.; Sheedlo, M. J.; Stepanov, S.; Carlsen, M. S.; Everly, R. M.; Das, C.J. Synchrotron Radiat. 2016, 23, 959−965.(31) Otsu, N. Automatica 1975, 11, 23−27.(32) Harris, D. C.; Bertolucci, M. D. Symmetry and Spectroscopy: AnIntroduction to Vibrational and Electronic Spectroscopy; CourierCorporation: New York, 1978.(33) Cardew, P.; Davey, R. Proc. R. Soc. London, Ser. A 1985, 398,415−428.(34) Parrinello, M.; Rahman, A. J. Appl. Phys. (Melville, NY, U. S.)1981, 52, 7182−7190.
Analytical Chemistry Article
DOI: 10.1021/acs.analchem.7b00431Anal. Chem. 2017, 89, 5958−5965
5965