second quarter 2014 earnings conference call july 31, …€¦ · second quarter 2014 earnings...
TRANSCRIPT
Occidental Petroleum Corporation
Second Quarter 2014 Earnings Conference Call
July 31, 2014
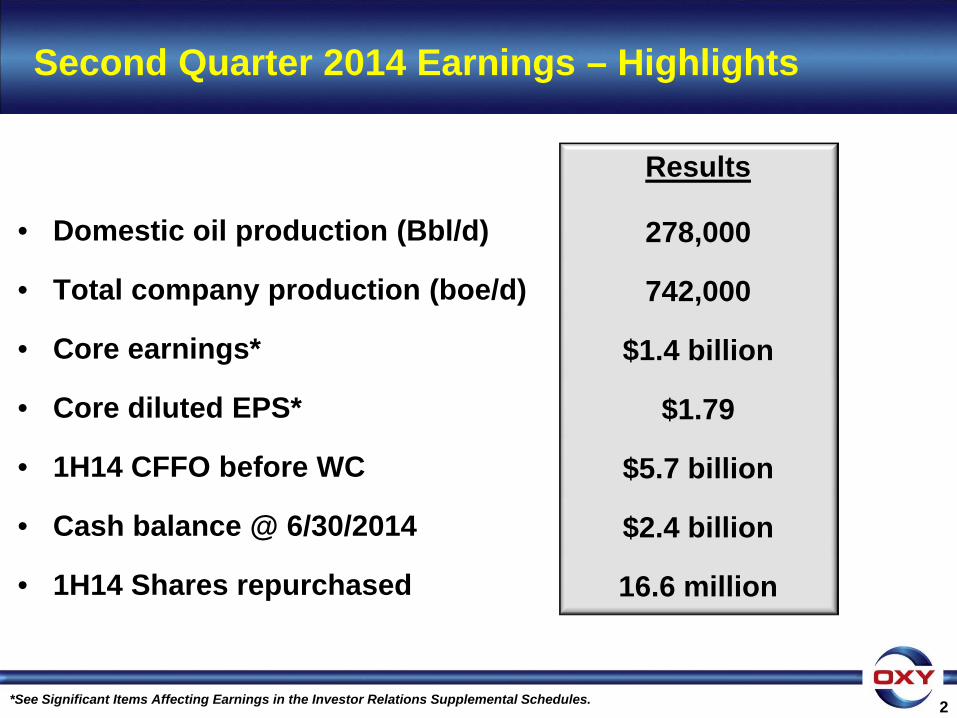
Second Quarter 2014 Earnings – Highlights
• Domestic oil production (Bbl/d)
• Total company production (boe/d)
• Core earnings*
• Core diluted EPS*
• 1H14 CFFO before WC
• Cash balance @ 6/30/2014
• 1H14 Shares repurchased
2 *See Significant Items Affecting Earnings in the Investor Relations Supplemental Schedules.
Results
278,000
742,000
$1.4 billion
$1.79
$5.7 billion
$2.4 billion
16.6 million
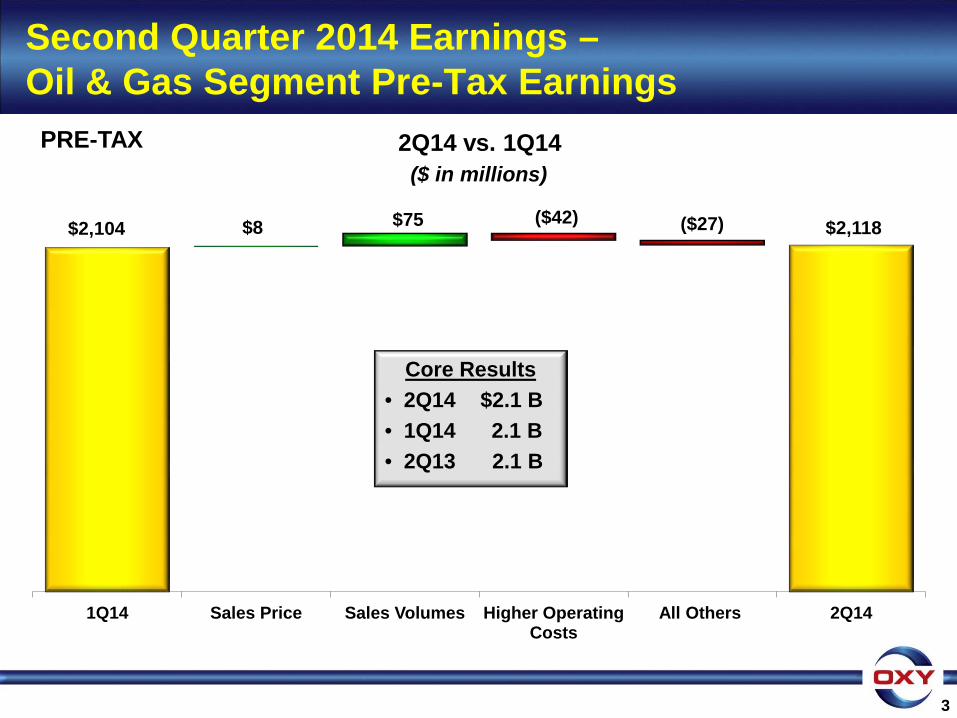
$2,118 $8 ($42) $2,104 $75
1Q14 Sales Price Sales Volumes Higher Operating Costs
All Others 2Q14
3
2Q14 vs. 1Q14 ($ in millions)
Core Results • 2Q14 $2.1 B • 1Q14 2.1 B • 2Q13 2.1 B
Second Quarter 2014 Earnings – Oil & Gas Segment Pre-Tax Earnings
($27)
PRE-TAX
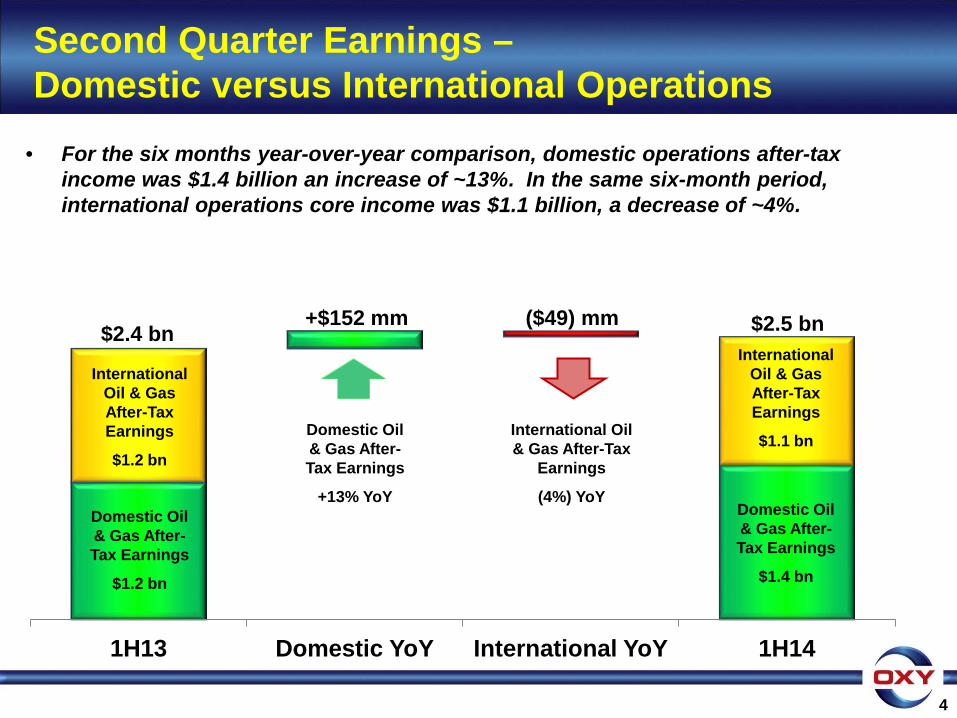
Second Quarter Earnings – Domestic versus International Operations
• For the six months year-over-year comparison, domestic operations after-tax income was $1.4 billion an increase of ~13%. In the same six-month period, international operations core income was $1.1 billion, a decrease of ~4%.
4
1H13 Domestic YoY International YoY 1H14
Domestic Oil & Gas After-Tax Earnings
$1.2 bn
International Oil & Gas After-Tax Earnings
$1.2 bn
Domestic Oil & Gas After-Tax Earnings
$1.4 bn
International Oil & Gas After-Tax Earnings
$1.1 bn Domestic Oil & Gas After-Tax Earnings
+13% YoY
International Oil & Gas After-Tax
Earnings
(4%) YoY
$2.4 bn +$152 mm ($49) mm $2.5 bn
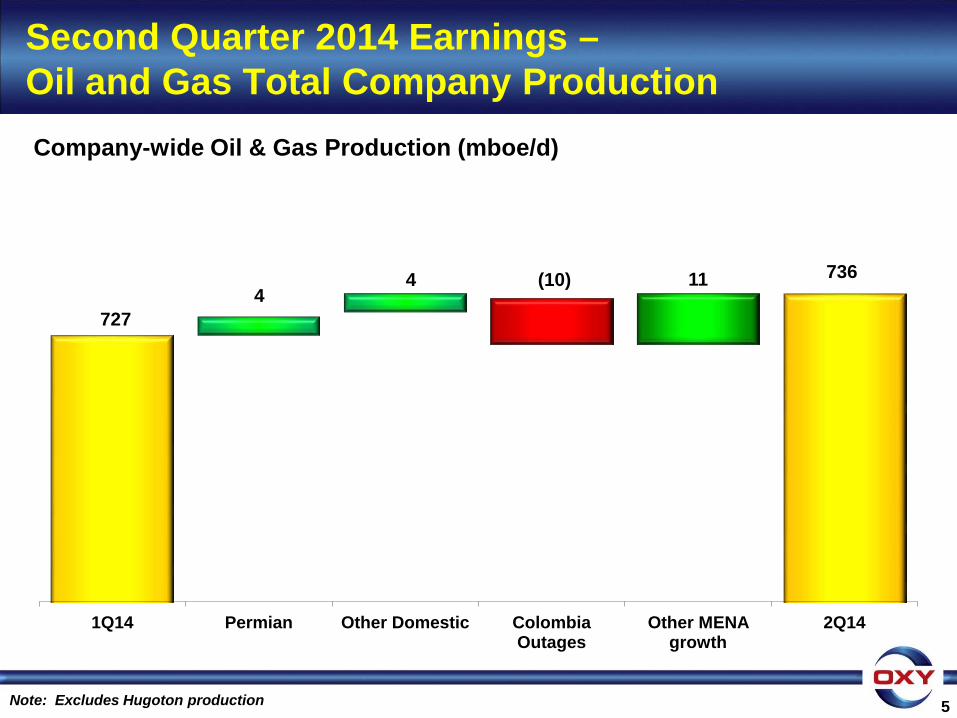
1Q14 Permian Other Domestic Colombia Outages
Other MENA growth
2Q14
5
Second Quarter 2014 Earnings – Oil and Gas Total Company Production
736 (10) 4 4
Company-wide Oil & Gas Production (mboe/d)
727
11
Note: Excludes Hugoton production
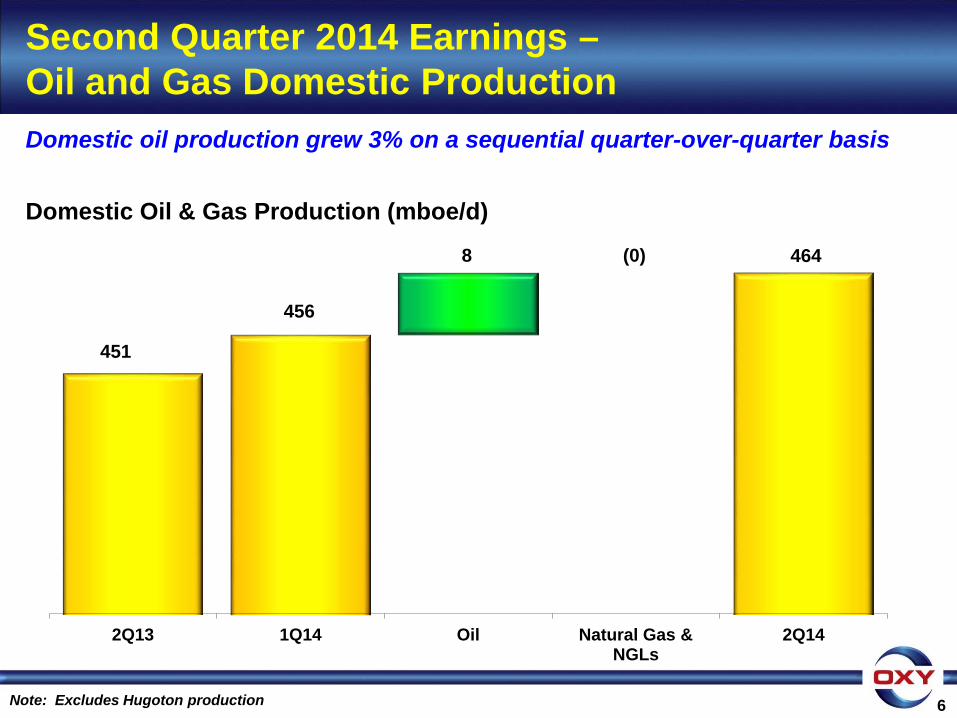
2Q13 1Q14 Oil Natural Gas & NGLs
2Q14
6
Second Quarter 2014 Earnings – Oil and Gas Domestic Production
451
(0)
456
8 464
Domestic Oil & Gas Production (mboe/d)
Note: Excludes Hugoton production
Domestic oil production grew 3% on a sequential quarter-over-quarter basis
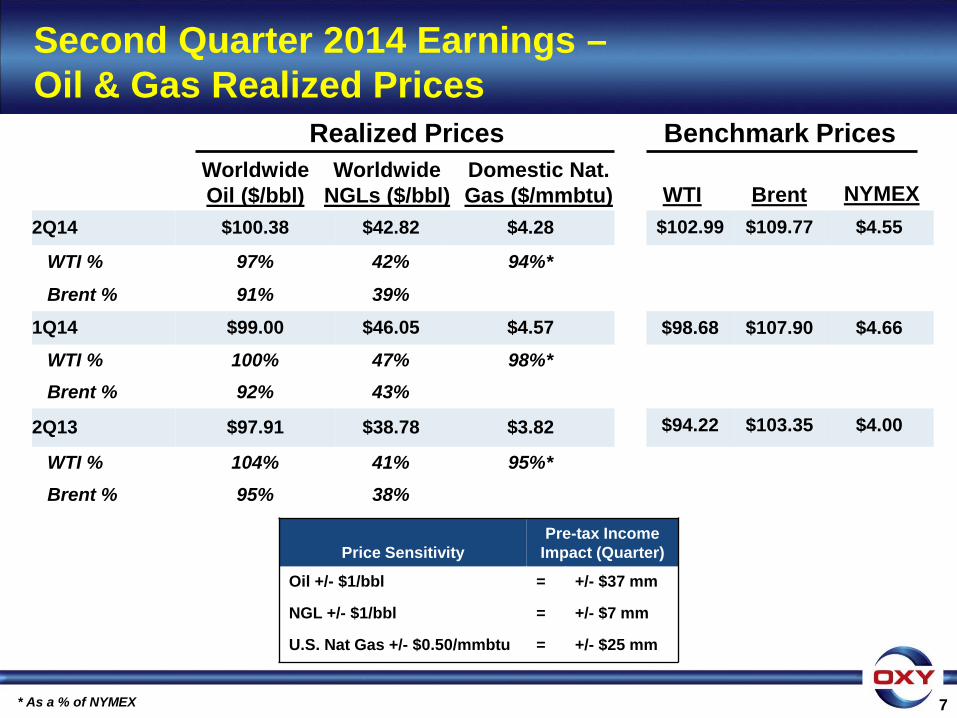
Second Quarter 2014 Earnings – Oil & Gas Realized Prices
Worldwide Oil ($/bbl)
Worldwide NGLs ($/bbl)
Domestic Nat. Gas ($/mmbtu) WTI NYMEX
Price Sensitivity
Pre-tax Income Impact (Quarter)
Oil +/- $1/bbl = +/- $37 mm
NGL +/- $1/bbl = +/- $7 mm
U.S. Nat Gas +/- $0.50/mmbtu = +/- $25 mm
Brent
Realized Prices Benchmark Prices
7 * As a % of NYMEX
2Q14 $100.38 $42.82 $4.28 $102.99 $109.77 $4.55
WTI % 97% 42% 94%*
Brent % 91% 39%
1Q14 $99.00 $46.05 $4.57 $98.68 $107.90 $4.66 WTI % 100% 47% 98%* Brent % 92% 43%
2Q13 $97.91 $38.78 $3.82 $94.22 $103.35 $4.00
WTI % 104% 41% 95%* Brent % 95% 38%
8
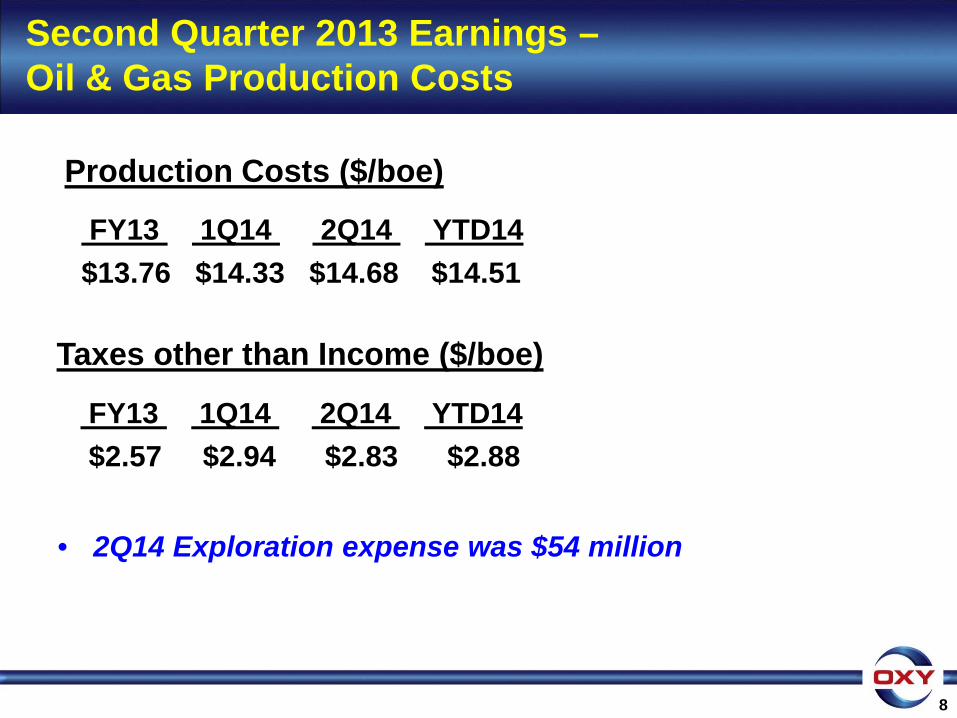
Second Quarter 2013 Earnings – Oil & Gas Production Costs
FY13 1Q14 2Q14 YTD14 $13.76 $14.33 $14.68 $14.51
Production Costs ($/boe)
• 2Q14 Exploration expense was $54 million
Taxes other than Income ($/boe)
FY13 1Q14 2Q14 YTD14 $2.57 $2.94 $2.83 $2.88
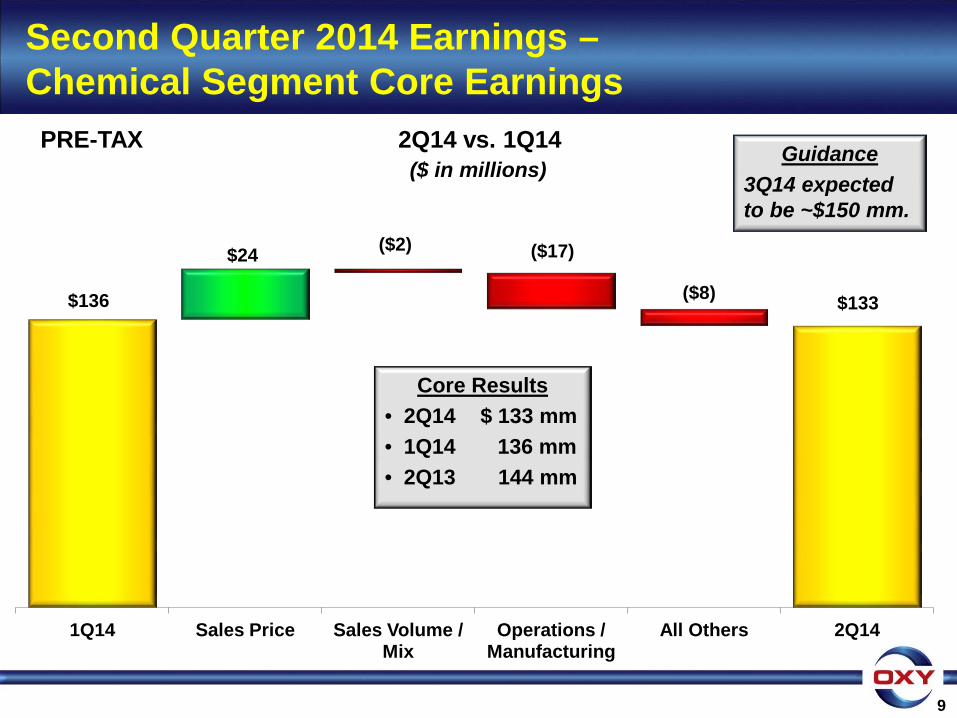
$136
$24 ($2) ($17)
($8) $133
1Q14 Sales Price Sales Volume / Mix
Operations / Manufacturing
All Others 2Q14
9
2Q14 vs. 1Q14 ($ in millions)
Guidance 3Q14 expected to be ~$150 mm.
Second Quarter 2014 Earnings – Chemical Segment Core Earnings
Core Results • 2Q14 $ 133 mm • 1Q14 136 mm • 2Q13 144 mm
PRE-TAX
10
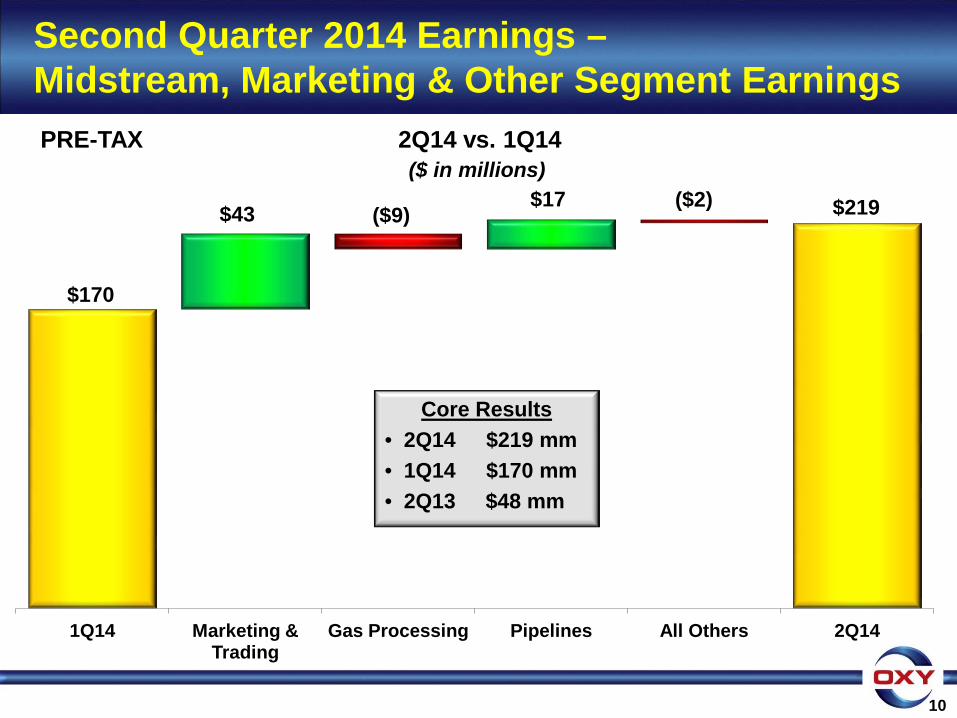
2Q14 vs. 1Q14
$170
$43 ($9) $17 ($2) $219
1Q14 Marketing & Trading
Gas Processing Pipelines All Others 2Q14
($ in millions)
Second Quarter 2014 Earnings – Midstream, Marketing & Other Segment Earnings
Core Results • 2Q14 $219 mm • 1Q14 $170 mm • 2Q13 $48 mm
PRE-TAX
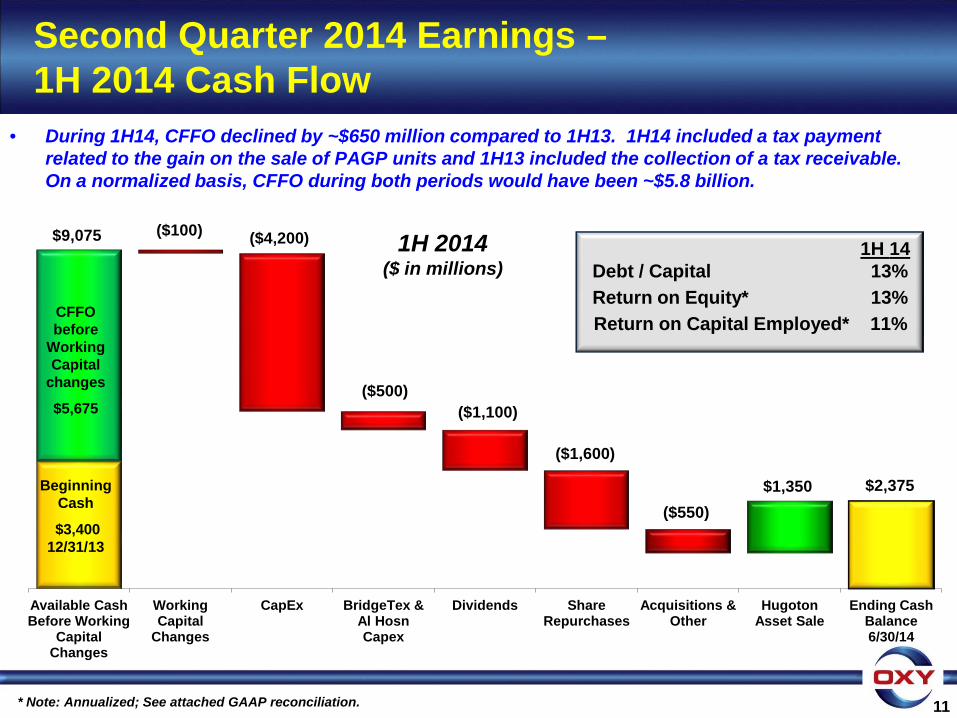
$9,075
($1,100) ($500)
$1,350
Available Cash Before Working
Capital Changes
Working Capital
Changes
CapEx BridgeTex & Al Hosn Capex
Dividends Share Repurchases
Acquisitions & Other
Hugoton Asset Sale
Ending Cash Balance 6/30/14
11
Second Quarter 2014 Earnings – 1H 2014 Cash Flow
1H 2014 ($ in millions)
CFFO before
Working Capital
changes
$5,675
($4,200)
Beginning Cash
$3,400 12/31/13
$2,375
1H 14 Debt / Capital 13%
Return on Equity* 13% Return on Capital Employed* 11%
* Note: Annualized; See attached GAAP reconciliation.
($100)
($1,600)
($550)
• During 1H14, CFFO declined by ~$650 million compared to 1H13. 1H14 included a tax payment related to the gain on the sale of PAGP units and 1H13 included the collection of a tax receivable. On a normalized basis, CFFO during both periods would have been ~$5.8 billion.
12
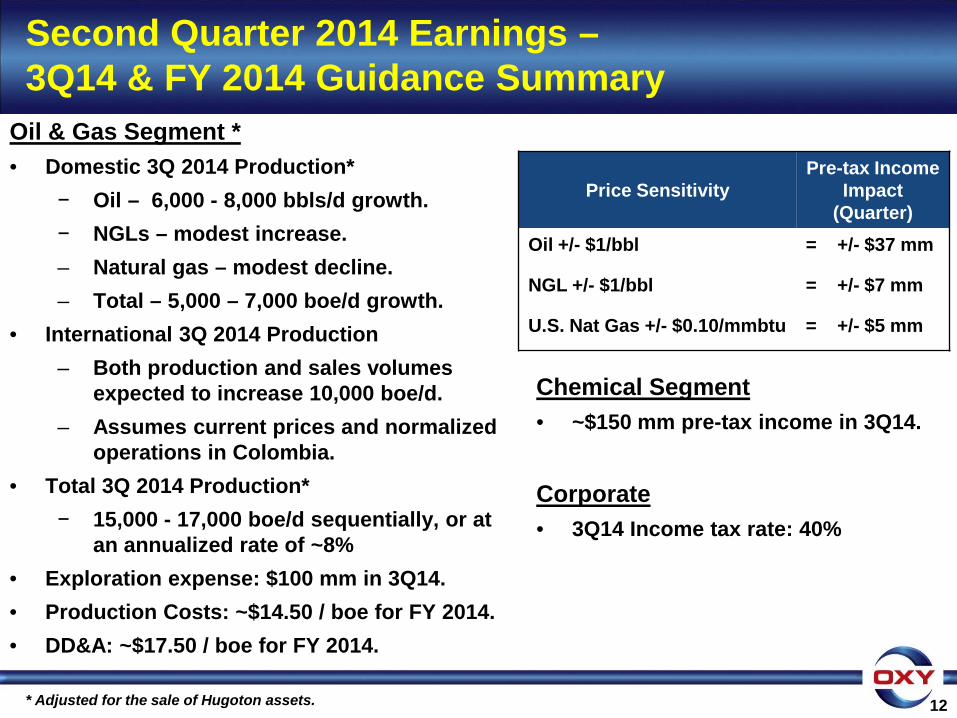
Second Quarter 2014 Earnings – 3Q14 & FY 2014 Guidance Summary
Oil & Gas Segment * • Domestic 3Q 2014 Production*
− Oil – 6,000 - 8,000 bbls/d growth. − NGLs – modest increase. – Natural gas – modest decline. – Total – 5,000 – 7,000 boe/d growth.
• International 3Q 2014 Production – Both production and sales volumes
expected to increase 10,000 boe/d. – Assumes current prices and normalized
operations in Colombia. • Total 3Q 2014 Production*
− 15,000 - 17,000 boe/d sequentially, or at an annualized rate of ~8%
• Exploration expense: $100 mm in 3Q14. • Production Costs: ~$14.50 / boe for FY 2014. • DD&A: ~$17.50 / boe for FY 2014.
Price Sensitivity
Pre-tax Income Impact
(Quarter) Oil +/- $1/bbl = +/- $37 mm
NGL +/- $1/bbl = +/- $7 mm
U.S. Nat Gas +/- $0.10/mmbtu = +/- $5 mm
Chemical Segment • ~$150 mm pre-tax income in 3Q14. Corporate • 3Q14 Income tax rate: 40%
* Adjusted for the sale of Hugoton assets.
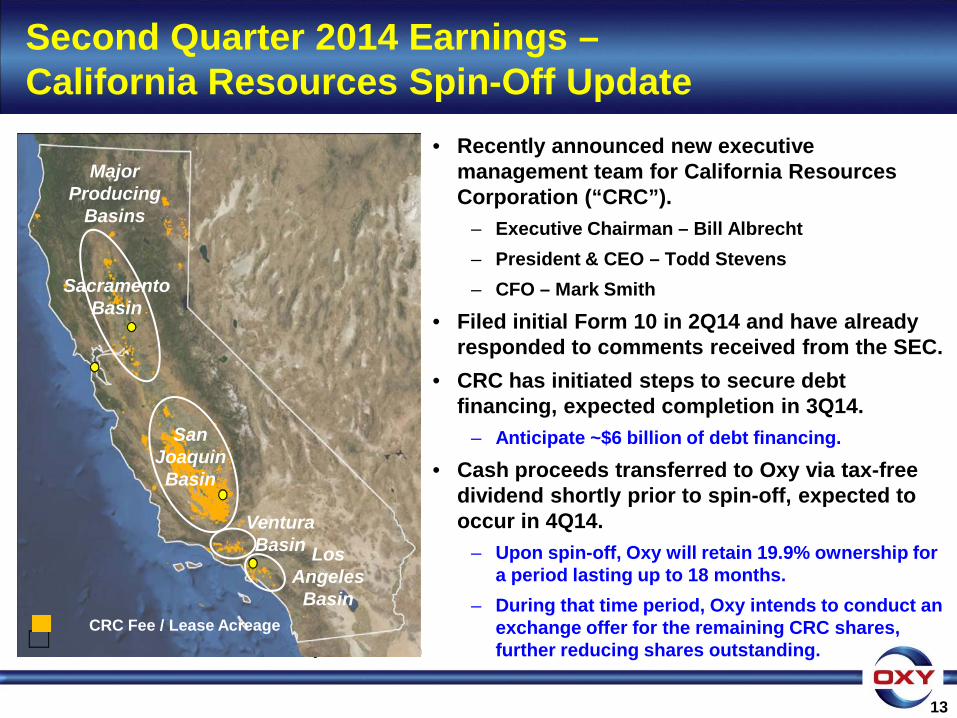
Second Quarter 2014 Earnings – California Resources Spin-Off Update
• Recently announced new executive management team for California Resources Corporation (“CRC”).
– Executive Chairman – Bill Albrecht – President & CEO – Todd Stevens – CFO – Mark Smith
• Filed initial Form 10 in 2Q14 and have already responded to comments received from the SEC.
• CRC has initiated steps to secure debt financing, expected completion in 3Q14.
– Anticipate ~$6 billion of debt financing.
• Cash proceeds transferred to Oxy via tax-free dividend shortly prior to spin-off, expected to occur in 4Q14.
– Upon spin-off, Oxy will retain 19.9% ownership for a period lasting up to 18 months.
– During that time period, Oxy intends to conduct an exchange offer for the remaining CRC shares, further reducing shares outstanding.
13
Oxy Land Position
Major Producing
Basins
CRC Fee / Lease Acreage
Sacramento Basin
San Joaquin Basin
Ventura Basin Los
Angeles Basin
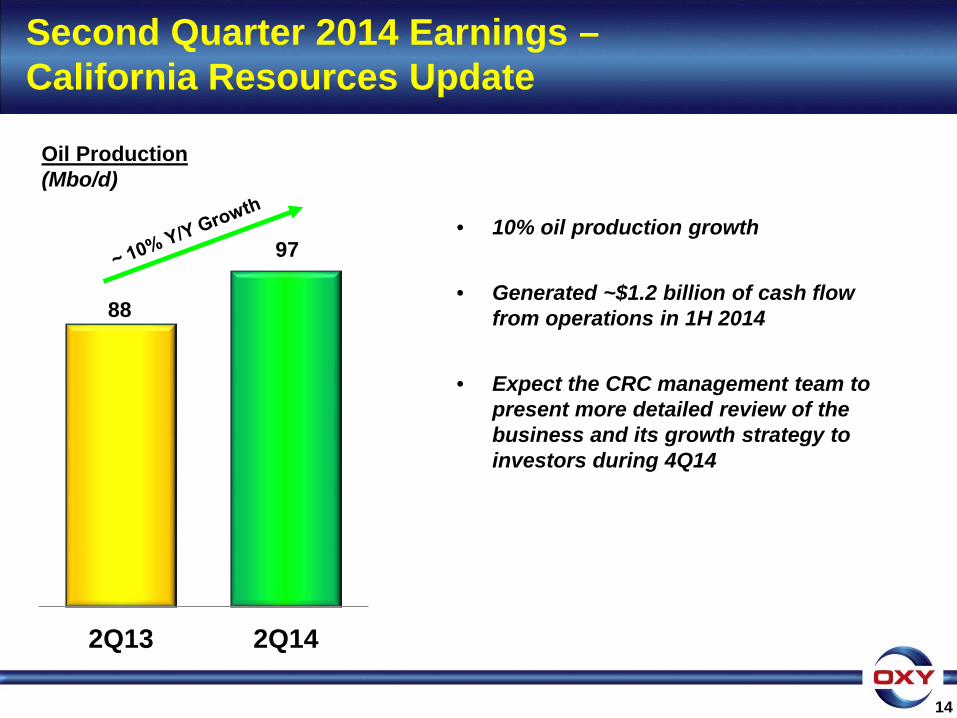
Second Quarter 2014 Earnings – California Resources Update
14
• 10% oil production growth
• Generated ~$1.2 billion of cash flow from operations in 1H 2014
• Expect the CRC management team to present more detailed review of the business and its growth strategy to investors during 4Q14
88
2Q13 2Q14
97
Oil Production (Mbo/d)
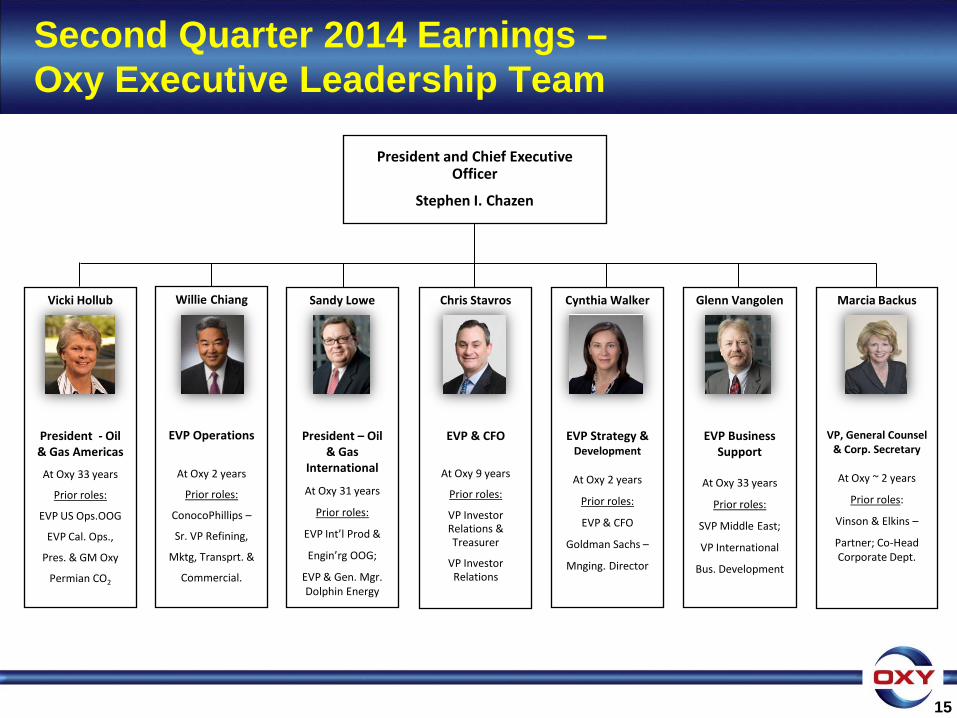
President and Chief Executive Officer
Stephen I. Chazen
Chris Stavros
EVP & CFO
At Oxy 9 years
Prior roles:
VP Investor Relations & Treasurer
VP Investor Relations
Cynthia Walker
EVP Strategy &
Development
At Oxy 2 years
Prior roles:
EVP & CFO
Goldman Sachs –
Mnging. Director
Glenn Vangolen
EVP Business
Support
At Oxy 33 years
Prior roles:
SVP Middle East;
VP International
Bus. Development
Marcia Backus
VP, General Counsel
& Corp. Secretary
At Oxy ~ 2 years
Prior roles:
Vinson & Elkins –
Partner; Co-Head Corporate Dept.
Sandy Lowe
President – Oil
& Gas International
At Oxy 31 years
Prior roles:
EVP Int’l Prod &
Engin’rg OOG;
EVP & Gen. Mgr. Dolphin Energy
Vicki Hollub
President - Oil & Gas Americas
At Oxy 33 years
Prior roles:
EVP US Ops.OOG
EVP Cal. Ops.,
Pres. & GM Oxy
Permian CO2
Willie Chiang
EVP Operations
At Oxy 2 years
Prior roles:
ConocoPhillips –
Sr. VP Refining,
Mktg, Transprt. &
Commercial.
Second Quarter 2014 Earnings – Oxy Executive Leadership Team
15
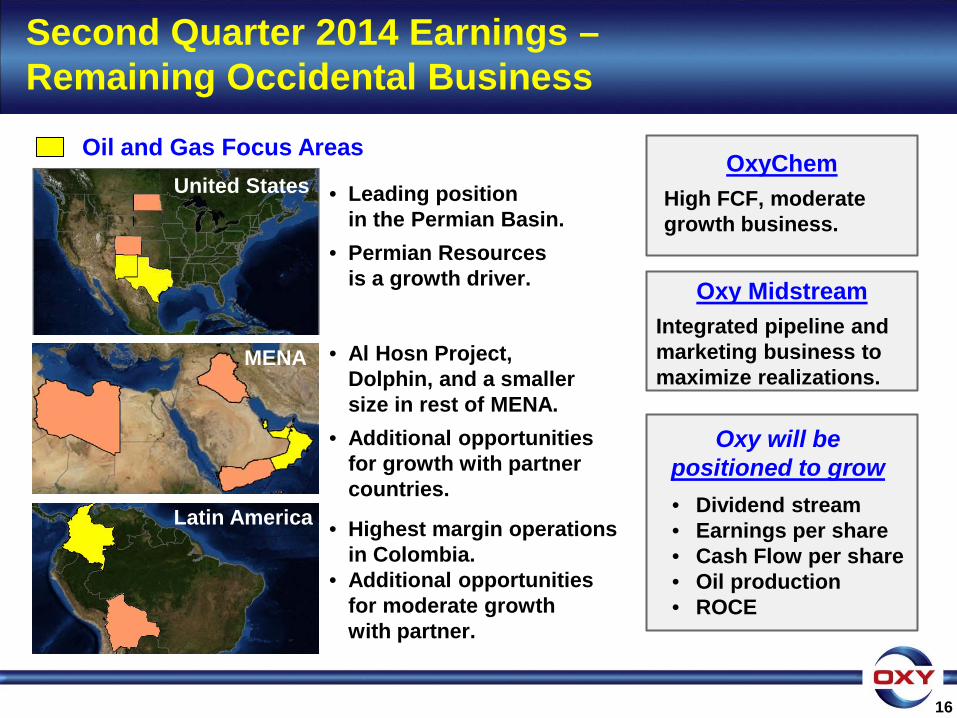
Oil and Gas Focus Areas
MENA
Latin America
Second Quarter 2014 Earnings – Remaining Occidental Business
• Leading position in the Permian Basin.
• Permian Resources is a growth driver.
• Al Hosn Project, Dolphin, and a smaller size in rest of MENA.
• Additional opportunities for growth with partner countries.
• Highest margin operations in Colombia.
• Additional opportunities for moderate growth with partner.
Oxy will be positioned to grow
• Dividend stream • Earnings per share • Cash Flow per share • Oil production • ROCE
16
OxyChem High FCF, moderate growth business.
Oxy Midstream Integrated pipeline and marketing business to maximize realizations.
United States
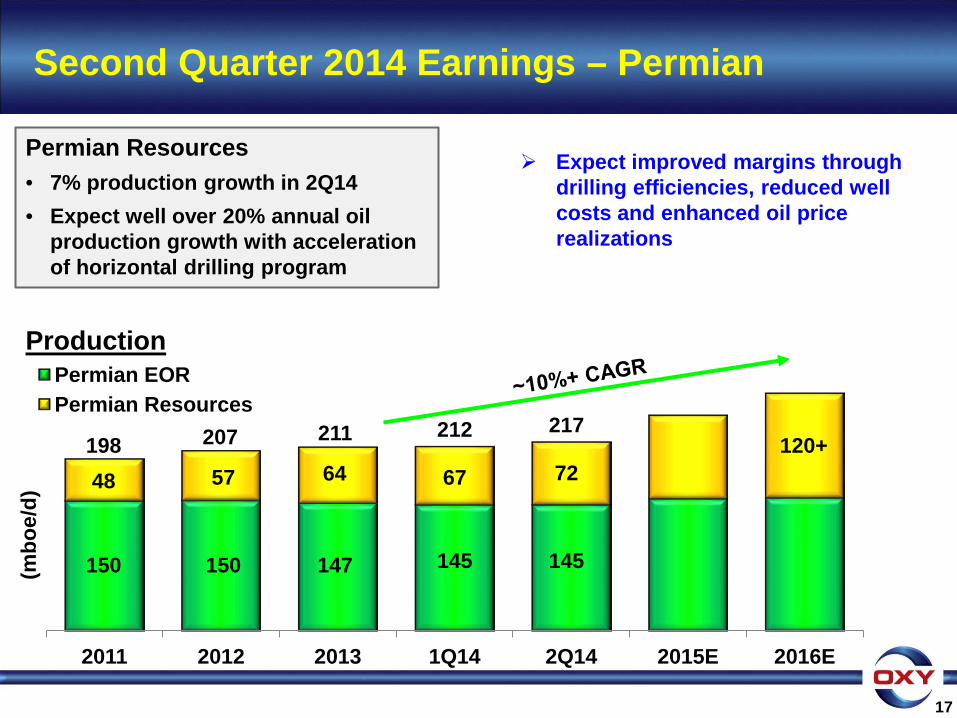
Second Quarter 2014 Earnings – Permian
17
Expect improved margins through drilling efficiencies, reduced well costs and enhanced oil price realizations
207 64
120+
2011 2012 2013 1Q14 2Q14 2015E 2016E
(mbo
e/d)
Permian EOR Permian Resources
211
Production
150
198 57 48
212
67
145
Permian Resources • 7% production growth in 2Q14 • Expect well over 20% annual oil
production growth with acceleration of horizontal drilling program
72
217
145 147 150
18
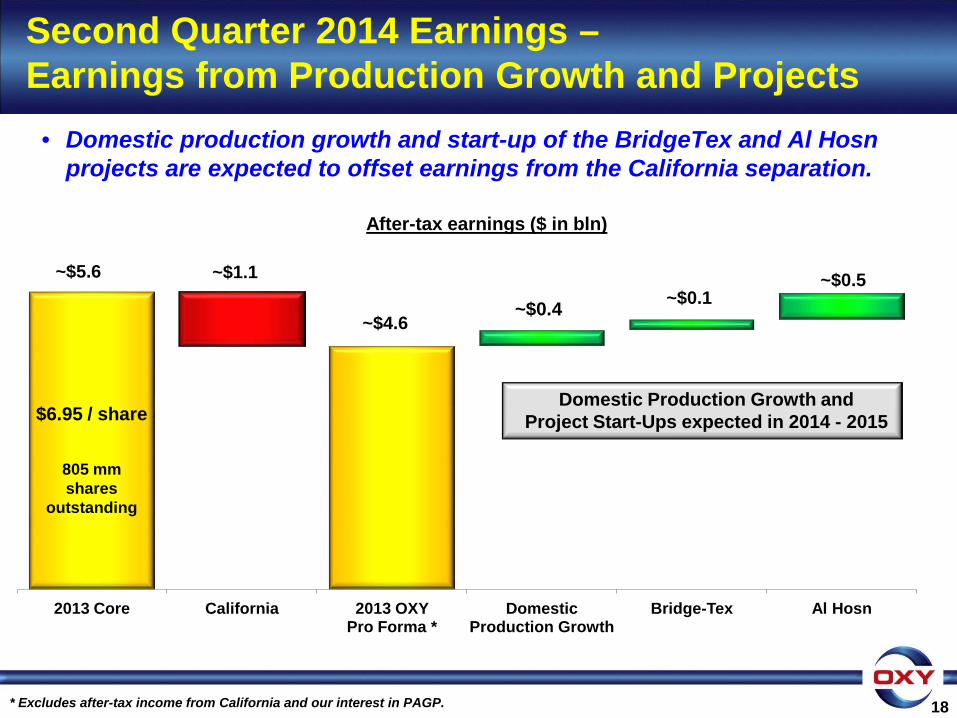
Second Quarter 2014 Earnings – Earnings from Production Growth and Projects
~$4.6
~$5.6 ~$0.1
~$0.5 ~$1.1
2013 Core California 2013 OXY Pro Forma *
Domestic Production Growth
Bridge-Tex Al Hosn
• Domestic production growth and start-up of the BridgeTex and Al Hosn projects are expected to offset earnings from the California separation.
After-tax earnings ($ in bln)
~$0.4
Domestic Production Growth and Project Start-Ups expected in 2014 - 2015
$6.95 / share
805 mm shares
outstanding
* Excludes after-tax income from California and our interest in PAGP.
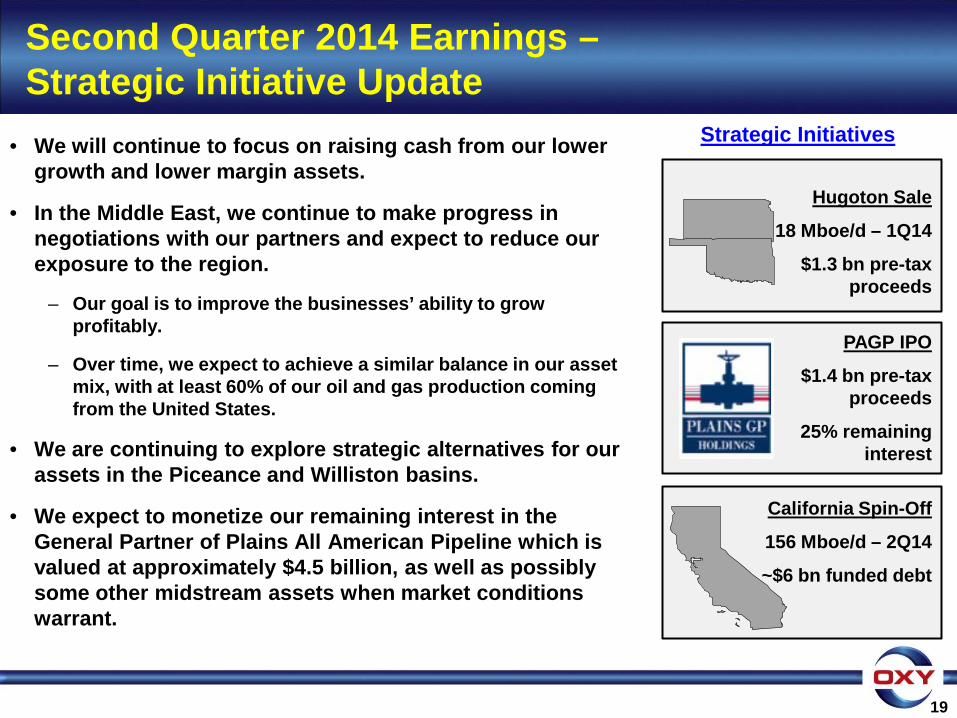
Second Quarter 2014 Earnings – Strategic Initiative Update
• We will continue to focus on raising cash from our lower growth and lower margin assets.
• In the Middle East, we continue to make progress in negotiations with our partners and expect to reduce our exposure to the region.
– Our goal is to improve the businesses’ ability to grow profitably.
– Over time, we expect to achieve a similar balance in our asset mix, with at least 60% of our oil and gas production coming from the United States.
• We are continuing to explore strategic alternatives for our assets in the Piceance and Williston basins.
• We expect to monetize our remaining interest in the General Partner of Plains All American Pipeline which is valued at approximately $4.5 billion, as well as possibly some other midstream assets when market conditions warrant.
19
California Spin-Off
156 Mboe/d – 2Q14
~$6 bn funded debt
Hugoton Sale
18 Mboe/d – 1Q14
$1.3 bn pre-tax proceeds
PAGP IPO
$1.4 bn pre-tax proceeds
25% remaining interest
Strategic Initiatives
20
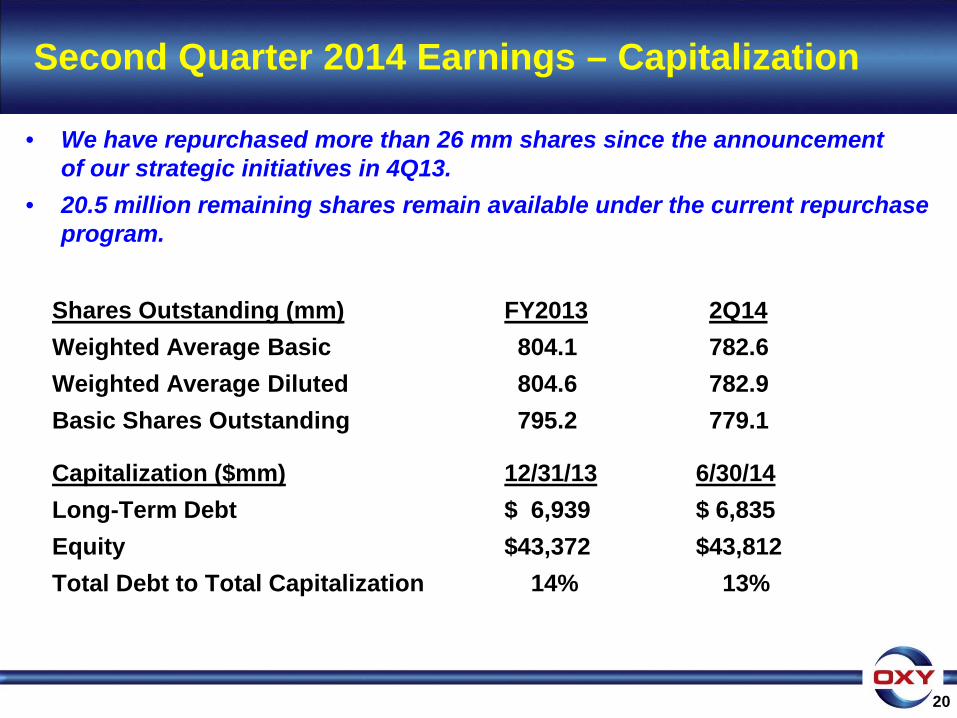
Second Quarter 2014 Earnings – Capitalization
• We have repurchased more than 26 mm shares since the announcement of our strategic initiatives in 4Q13.
• 20.5 million remaining shares remain available under the current repurchase program.
Shares Outstanding (mm) FY2013 2Q14 Weighted Average Basic 804.1 782.6 Weighted Average Diluted 804.6 782.9 Basic Shares Outstanding 795.2 779.1
Capitalization ($mm) 12/31/13 6/30/14 Long-Term Debt $ 6,939 $ 6,835 Equity $43,372 $43,812 Total Debt to Total Capitalization 14% 13%
21
Second Quarter 2014 Earnings – Share Repurchases
~675 mm
20.5 mm ~60 mm
25 mm
779 mm
Basic Shares Outstanding
as of 6/30/2014
Current Repurchase Plan
California Separation PAGP Monetization Pro Forma Basic Shares Outstanding
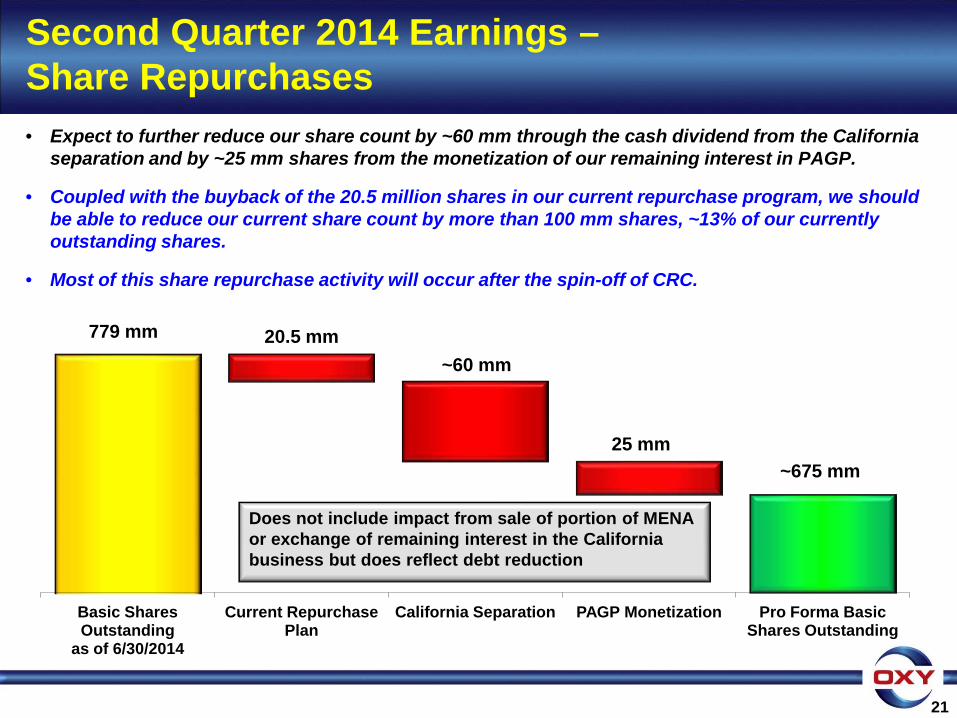
• Expect to further reduce our share count by ~60 mm through the cash dividend from the California separation and by ~25 mm shares from the monetization of our remaining interest in PAGP.
• Coupled with the buyback of the 20.5 million shares in our current repurchase program, we should be able to reduce our current share count by more than 100 mm shares, ~13% of our currently outstanding shares.
• Most of this share repurchase activity will occur after the spin-off of CRC.
Does not include impact from sale of portion of MENA or exchange of remaining interest in the California business but does reflect debt reduction
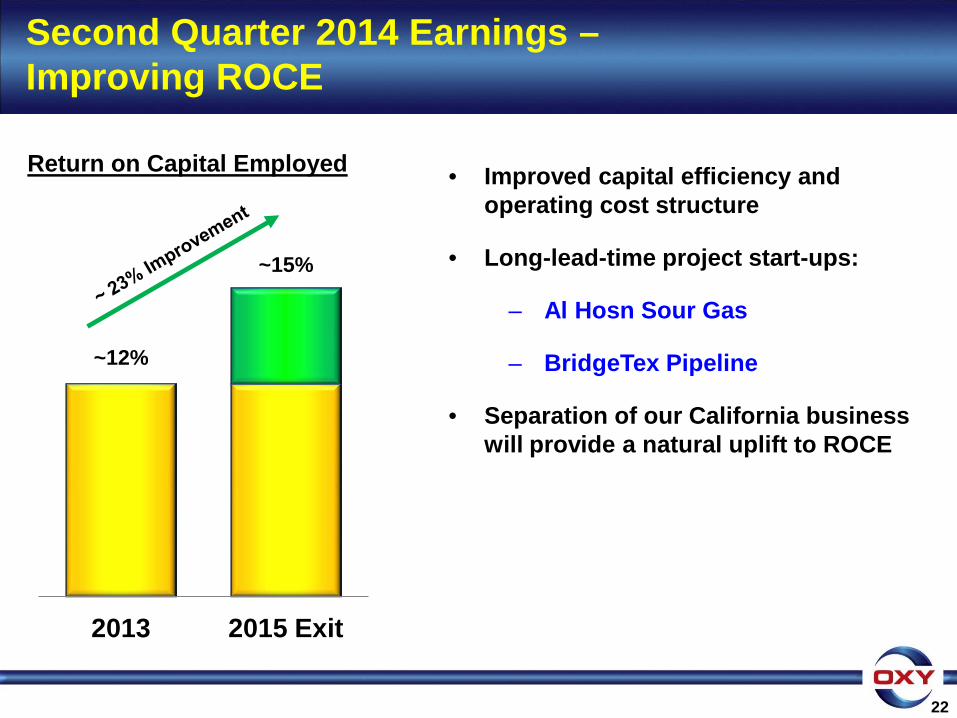
~12%
~15%
2013 2015 Exit
Return on Capital Employed
22
Second Quarter 2014 Earnings – Improving ROCE
• Improved capital efficiency and
operating cost structure
• Long-lead-time project start-ups:
– Al Hosn Sour Gas
– BridgeTex Pipeline
• Separation of our California business will provide a natural uplift to ROCE
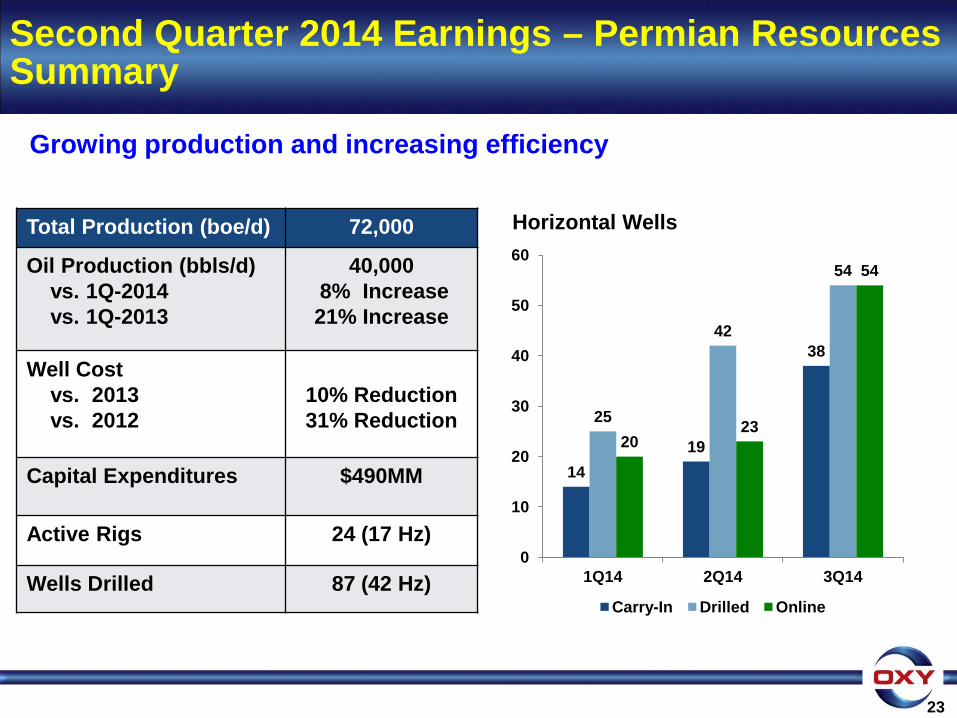
Total Production (boe/d) 72,000
Oil Production (bbls/d) vs. 1Q-2014 vs. 1Q-2013
40,000 8% Increase 21% Increase
Well Cost vs. 2013 vs. 2012
10% Reduction 31% Reduction
Capital Expenditures $490MM
Active Rigs 24 (17 Hz)
Wells Drilled 87 (42 Hz)
Horizontal Wells
14 19
38
25
42
54
20 23
54
0
10
20
30
40
50
60
1Q14 2Q14 3Q14
Carry-In Drilled Online
Growing production and increasing efficiency
Second Quarter 2014 Earnings – Permian Resources Summary
23
Second Quarter 2014 Earnings – Permian Resources Optimizing Designs to Unlock Primary Reserves
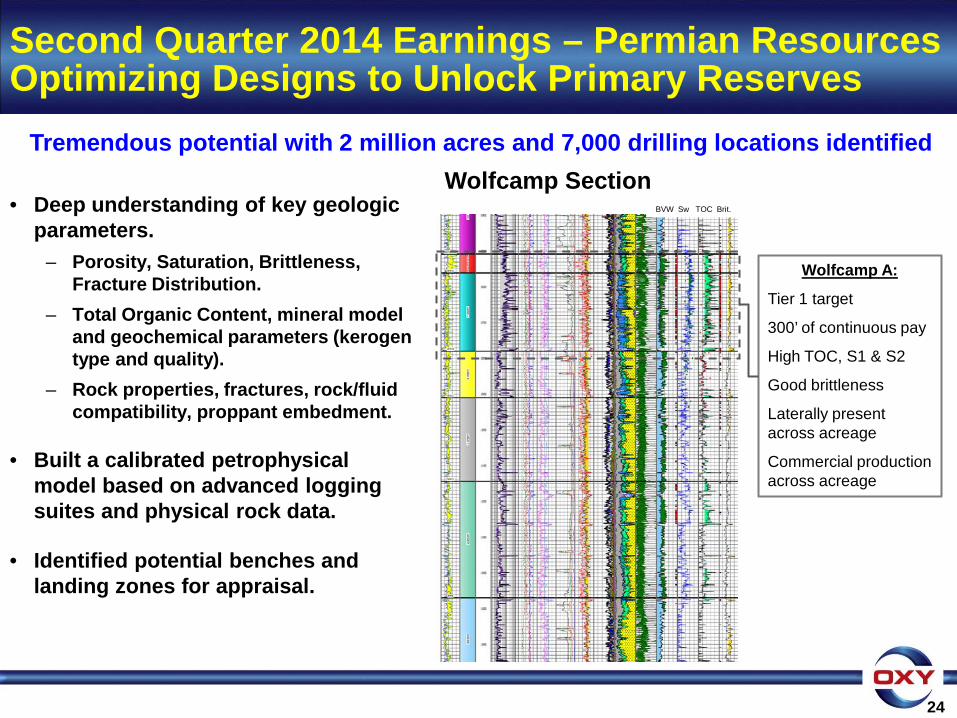
• Deep understanding of key geologic parameters.
– Porosity, Saturation, Brittleness, Fracture Distribution.
– Total Organic Content, mineral model and geochemical parameters (kerogen type and quality).
– Rock properties, fractures, rock/fluid compatibility, proppant embedment.
• Built a calibrated petrophysical model based on advanced logging suites and physical rock data.
• Identified potential benches and landing zones for appraisal.
24
Tremendous potential with 2 million acres and 7,000 drilling locations identified
Wolfcamp A:
Tier 1 target
300’ of continuous pay
High TOC, S1 & S2
Good brittleness
Laterally present across acreage
Commercial production across acreage
BVW Sw TOC Brit.
Wolfcamp Section
500 ft
500 ft
Map View
View Looking South
View Looking East
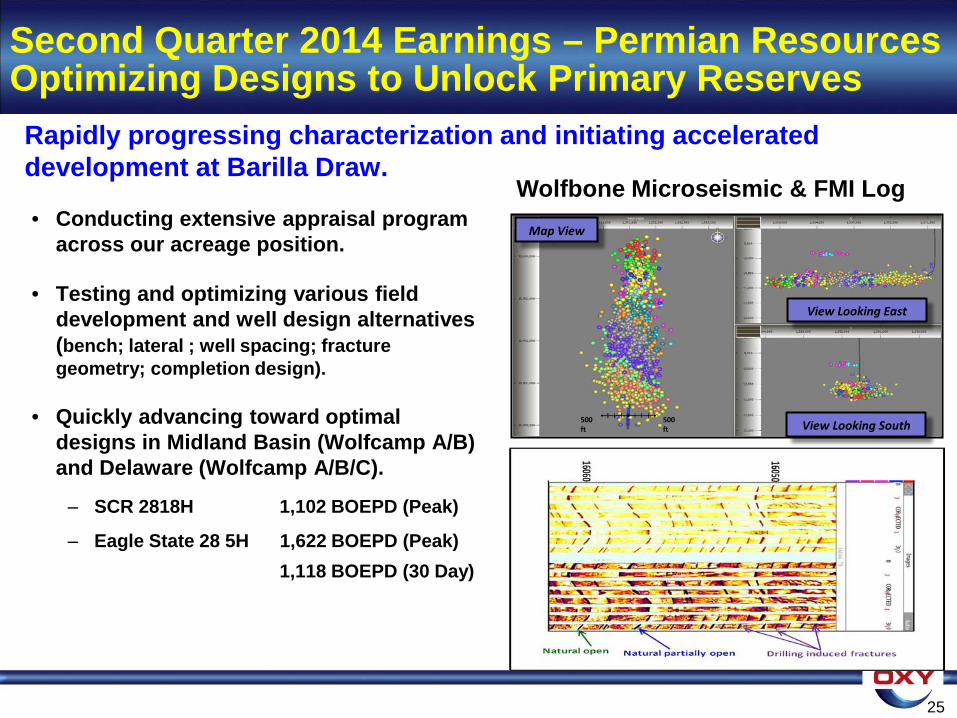
• Conducting extensive appraisal program across our acreage position.
• Testing and optimizing various field development and well design alternatives (bench; lateral ; well spacing; fracture geometry; completion design).
• Quickly advancing toward optimal designs in Midland Basin (Wolfcamp A/B) and Delaware (Wolfcamp A/B/C).
‒ SCR 2818H 1,102 BOEPD (Peak)
‒ Eagle State 28 5H 1,622 BOEPD (Peak) 1,118 BOEPD (30 Day)
Rapidly progressing characterization and initiating accelerated development at Barilla Draw.
Second Quarter 2014 Earnings – Permian Resources Optimizing Designs to Unlock Primary Reserves
Wolfbone Microseismic & FMI Log
25
Second Quarter 2014 Earnings – Permian Resources Efficiently Accelerating Development
26
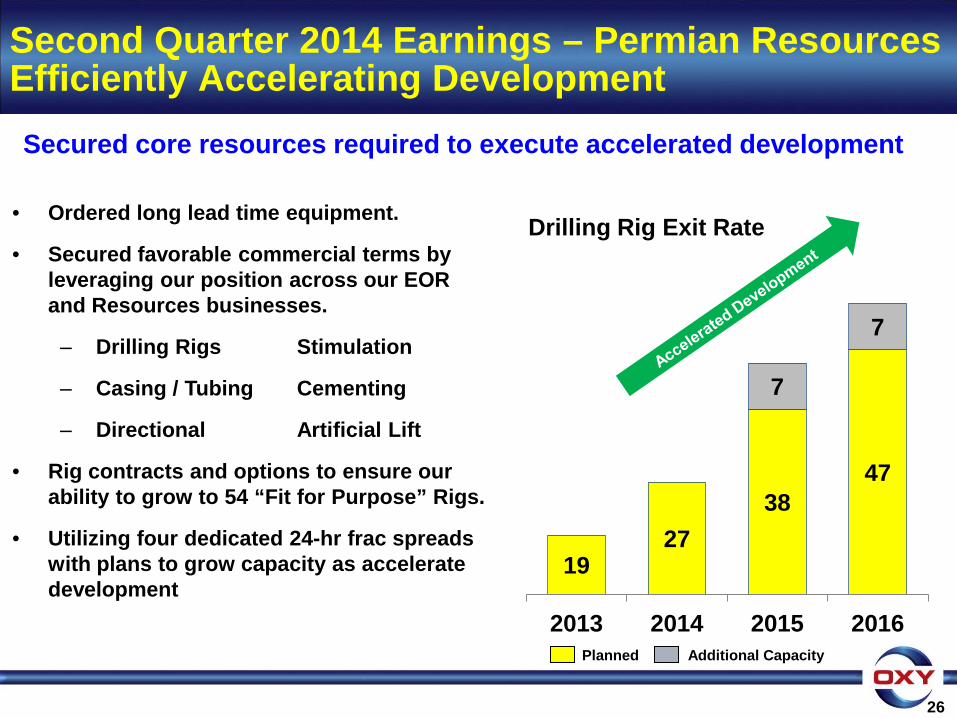
• Ordered long lead time equipment.
• Secured favorable commercial terms by leveraging our position across our EOR and Resources businesses.
‒ Drilling Rigs Stimulation
‒ Casing / Tubing Cementing
‒ Directional Artificial Lift
• Rig contracts and options to ensure our ability to grow to 54 “Fit for Purpose” Rigs.
• Utilizing four dedicated 24-hr frac spreads with plans to grow capacity as accelerate development
Secured core resources required to execute accelerated development
19 27
38 47
7
7
2013 2014 2015 2016
Drilling Rig Exit Rate
Planned Additional Capacity
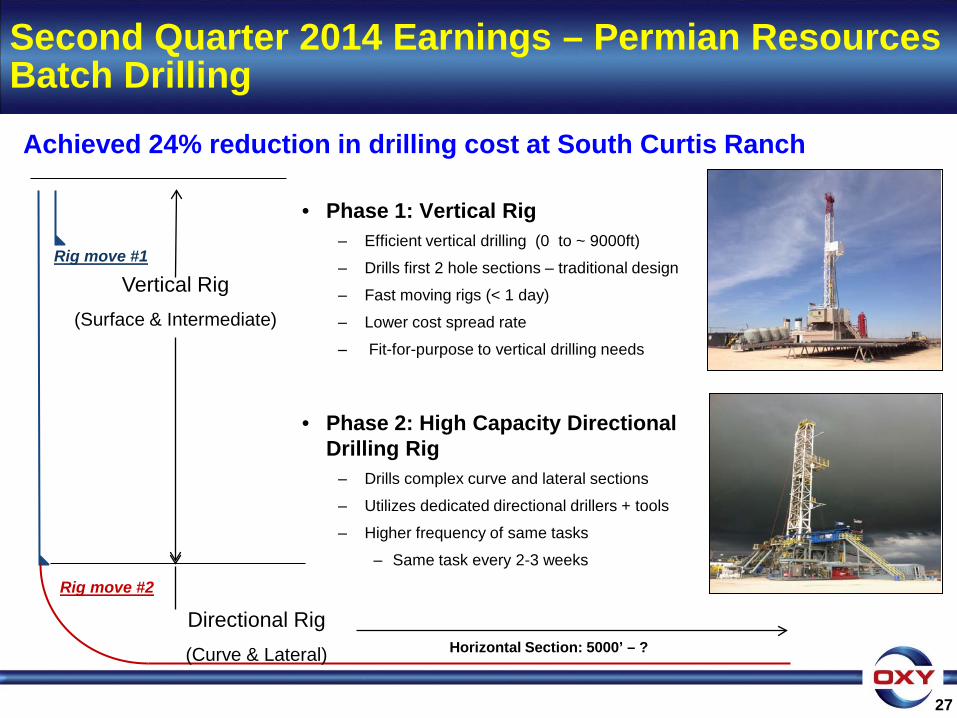
• Phase 1: Vertical Rig ‒ Efficient vertical drilling (0 to ~ 9000ft)
‒ Drills first 2 hole sections – traditional design
‒ Fast moving rigs (< 1 day)
‒ Lower cost spread rate
‒ Fit-for-purpose to vertical drilling needs
• Phase 2: High Capacity Directional Drilling Rig ‒ Drills complex curve and lateral sections
‒ Utilizes dedicated directional drillers + tools
‒ Higher frequency of same tasks
‒ Same task every 2-3 weeks
27
Vertical Rig (Surface & Intermediate)
Directional Rig (Curve & Lateral) Horizontal Section: 5000’ – ?
Rig move #1
Rig move #2
Achieved 24% reduction in drilling cost at South Curtis Ranch
Second Quarter 2014 Earnings – Permian Resources Batch Drilling
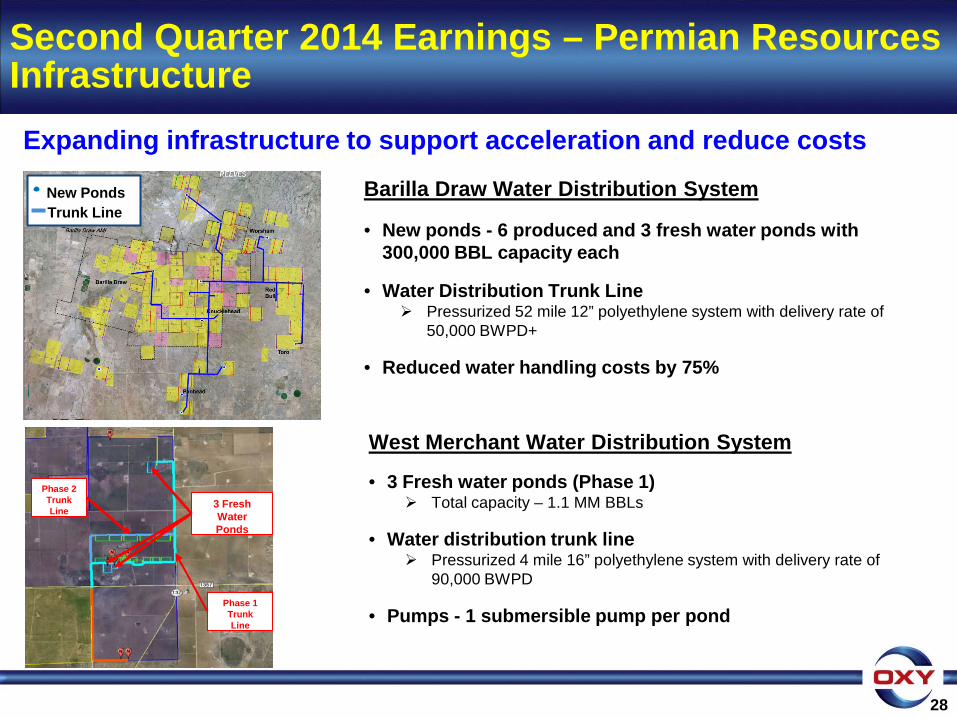
3 Fresh Water Ponds
Phase 1 Trunk Line
Phase 2 Trunk Line
West Merchant Water Distribution System • 3 Fresh water ponds (Phase 1)
Total capacity – 1.1 MM BBLs
• Water distribution trunk line Pressurized 4 mile 16” polyethylene system with delivery rate of
90,000 BWPD
• Pumps - 1 submersible pump per pond
New Ponds Trunk Line
Barilla Draw Water Distribution System
• New ponds - 6 produced and 3 fresh water ponds with 300,000 BBL capacity each
• Water Distribution Trunk Line Pressurized 52 mile 12” polyethylene system with delivery rate of
50,000 BWPD+
• Reduced water handling costs by 75%
28
Expanding infrastructure to support acceleration and reduce costs
Second Quarter 2014 Earnings – Permian Resources Infrastructure
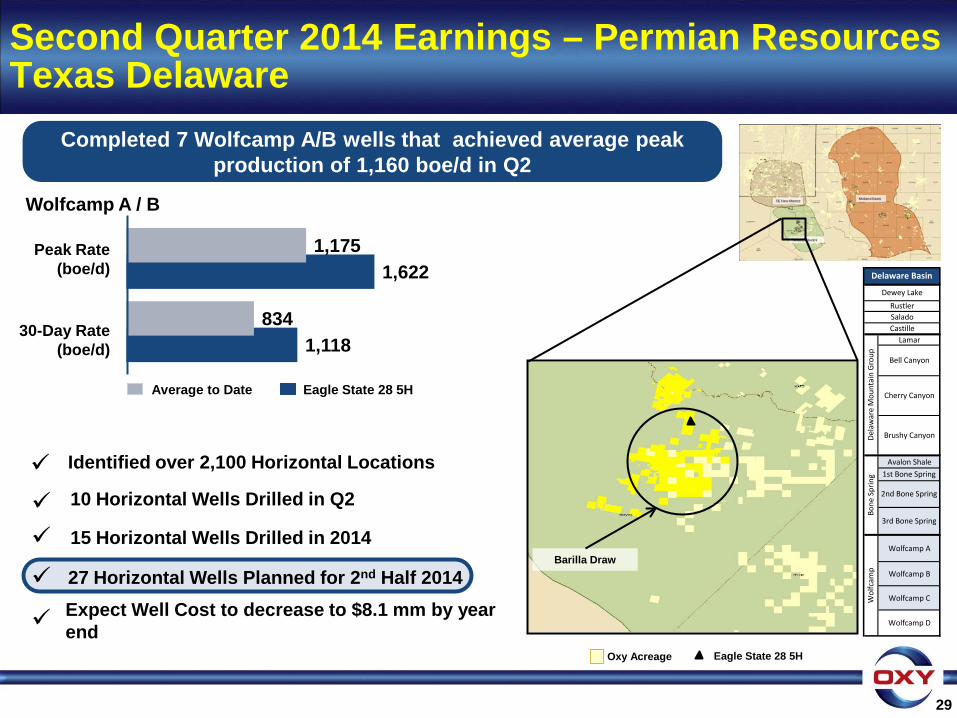
Identified over 2,100 Horizontal Locations
29
Completed 7 Wolfcamp A/B wells that achieved average peak production of 1,160 boe/d in Q2
30-Day Rate (boe/d)
Peak Rate (boe/d)
Eagle State 28 5H Average to Date
15 Horizontal Wells Drilled in 2014
27 Horizontal Wells Planned for 2nd Half 2014
Expect Well Cost to decrease to $8.1 mm by year end
Barilla Draw
Oxy Acreage Eagle State 28 5H
10 Horizontal Wells Drilled in Q2
Lamar
Avalon Shale
Wolfcamp A
Wolfcamp B
Wolfcamp C
Delaware Basin
Dewey LakeRustlerSaladoCastille
Dela
war
e M
ount
ain
Grou
p
Bell Canyon
Cherry Canyon
Brushy Canyon
Bone
Spr
ing 1st Bone Spring
2nd Bone Spring
3rd Bone Spring
Wol
fcam
p
Wolfcamp D
Second Quarter 2014 Earnings – Permian Resources Texas Delaware
1,118
1,622
834
1,175
Wolfcamp A / B
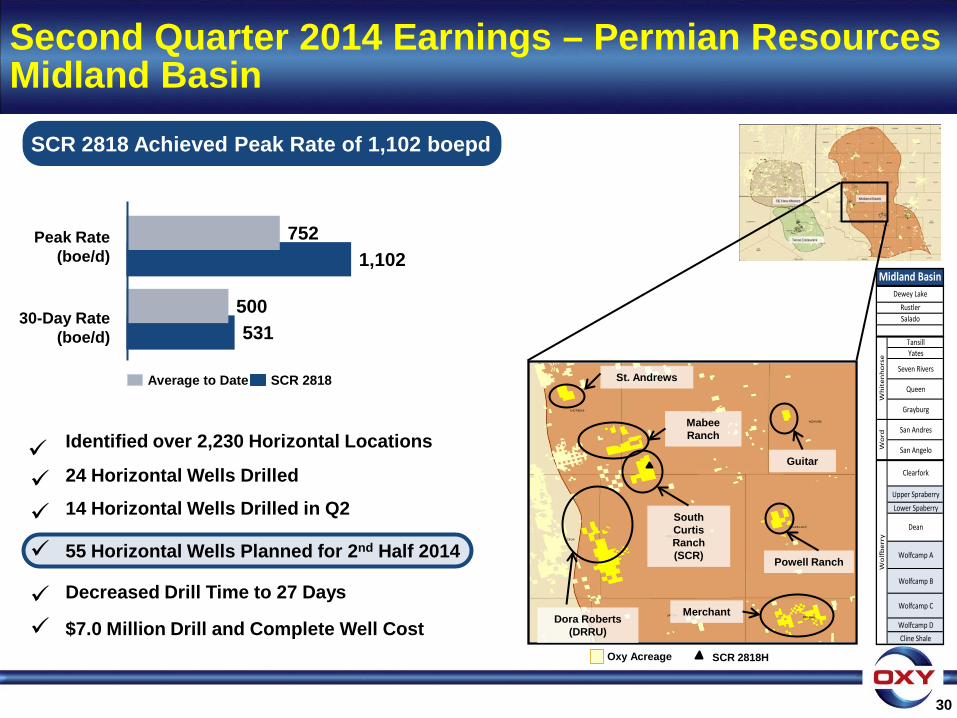
Identified over 2,230 Horizontal Locations
30
SCR 2818 Achieved Peak Rate of 1,102 boepd
24 Horizontal Wells Drilled
14 Horizontal Wells Drilled in Q2
55 Horizontal Wells Planned for 2nd Half 2014
Decreased Drill Time to 27 Days
$7.0 Million Drill and Complete Well Cost
South Curtis Ranch (SCR)
Dora Roberts (DRRU)
Mabee Ranch
St. Andrews
Merchant
Powell Ranch
Guitar
TansillYates
Seven Rivers
Queen
Grayburg
San Andres
San Angelo
Upper SpraberryLower Spaberry
Wolfcamp A
Wolfcamp B
Wolfcamp C
Wolfcamp DCline Shale
Midland BasinDewey Lake
RustlerSalado
Wh
iten
ho
rse
Wo
rdW
olf
ber
ry
Clearfork
Dean
Oxy Acreage SCR 2818H
Second Quarter 2014 Earnings – Permian Resources Midland Basin
30-Day Rate (boe/d)
Peak Rate (boe/d)
SCR 2818 Average to Date
531
1,102
500
752
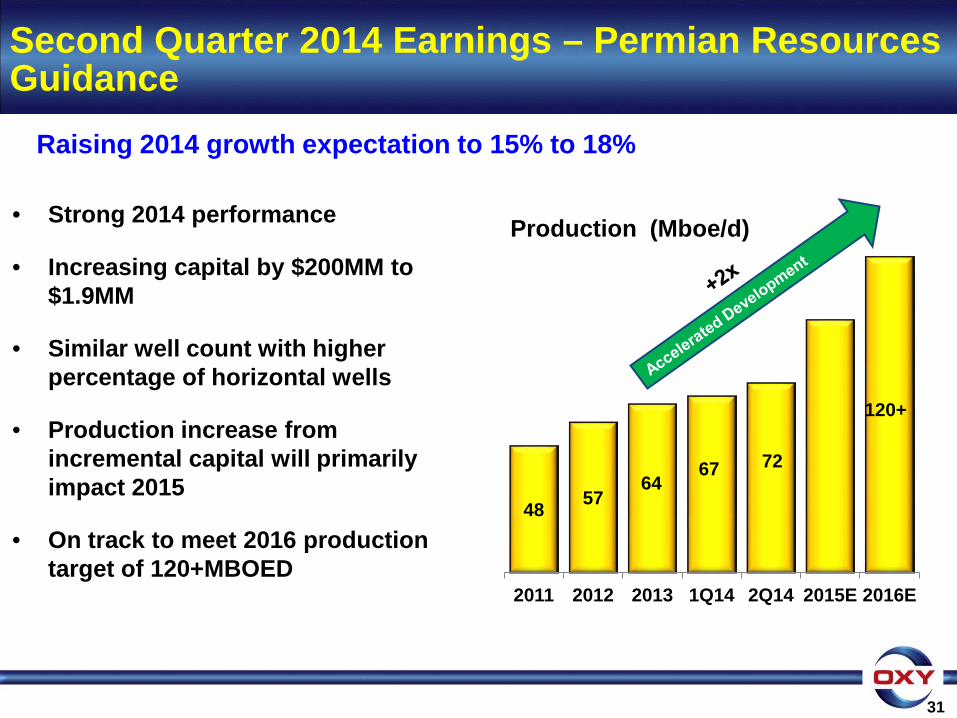
48 57 67 72
120+
2011 2012 2013 1Q14 2Q14 2015E 2016E
Second Quarter 2014 Earnings – Permian Resources Guidance
31
Production (Mboe/d)
Raising 2014 growth expectation to 15% to 18%
64
• Strong 2014 performance
• Increasing capital by $200MM to $1.9MM
• Similar well count with higher percentage of horizontal wells
• Production increase from incremental capital will primarily impact 2015
• On track to meet 2016 production target of 120+MBOED
Second Quarter 2014 Earnings – Midstream Focus and Advantage
• Oxy has a unique competitive advantage and scale in the Permian Basin to drive key strategies Largest producer
Significant midstream/infrastructure owner and operator
Large marketing presence
• Role is to maximize Realized Value for Oxy Production by
Ensuring access to markets
Optimizing existing assets
Building out key assets across the value chain
32
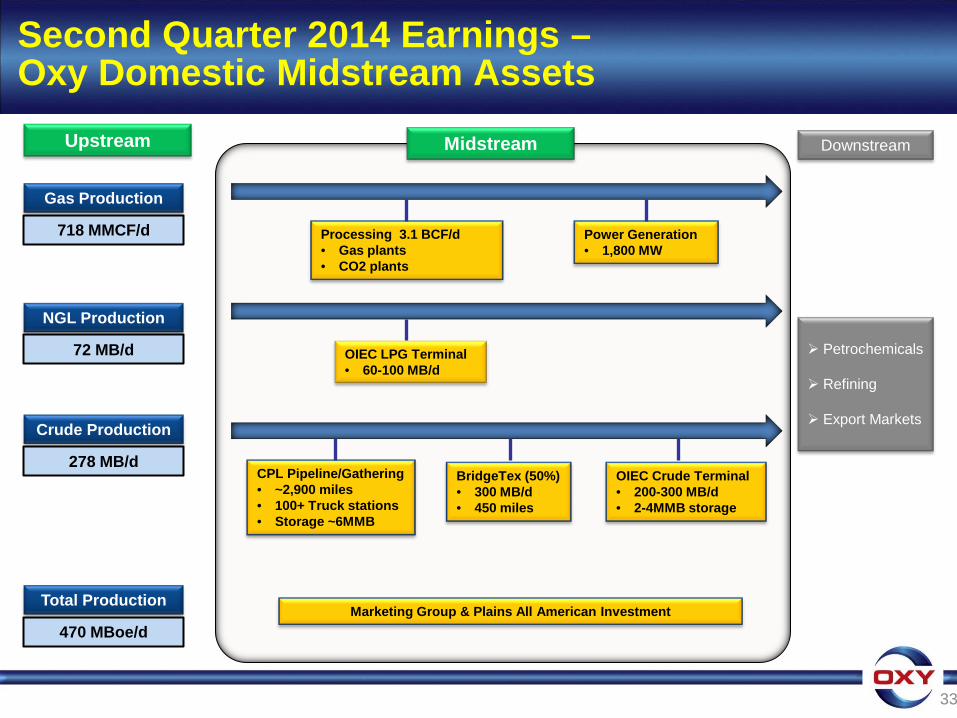
Second Quarter 2014 Earnings – Oxy Domestic Midstream Assets
33
Crude Production
Petrochemicals Refining
Export Markets
Gas Production
Downstream Upstream
NGL Production
718 MMCF/d
72 MB/d
278 MB/d
Total Production
470 MBoe/d Marketing Group & Plains All American Investment
Power Generation • 1,800 MW
Processing 3.1 BCF/d • Gas plants • CO2 plants
Midstream
OIEC LPG Terminal • 60-100 MB/d
OIEC Crude Terminal • 200-300 MB/d • 2-4MMB storage
BridgeTex (50%) • 300 MB/d • 450 miles
CPL Pipeline/Gathering • ~2,900 miles • 100+ Truck stations • Storage ~6MMB
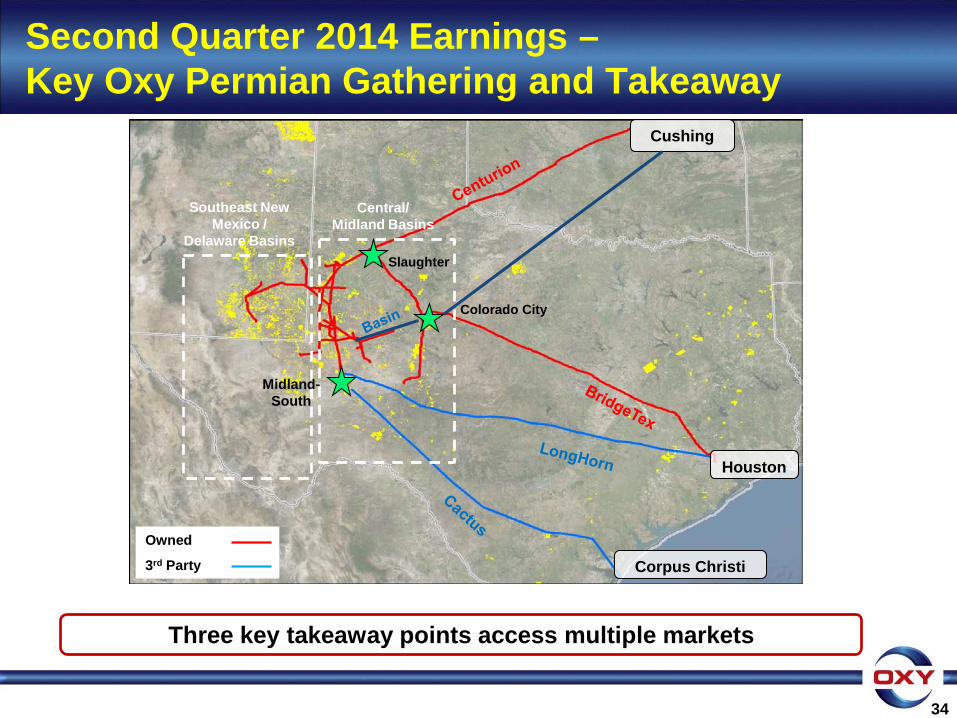
Second Quarter 2014 Earnings – Key Oxy Permian Gathering and Takeaway
34
Cushing
Houston
Corpus Christi
Central/ Midland Basins
Southeast New Mexico /
Delaware Basins
Midland-South
Colorado City
Slaughter
Owned
3rd Party
Three key takeaway points access multiple markets
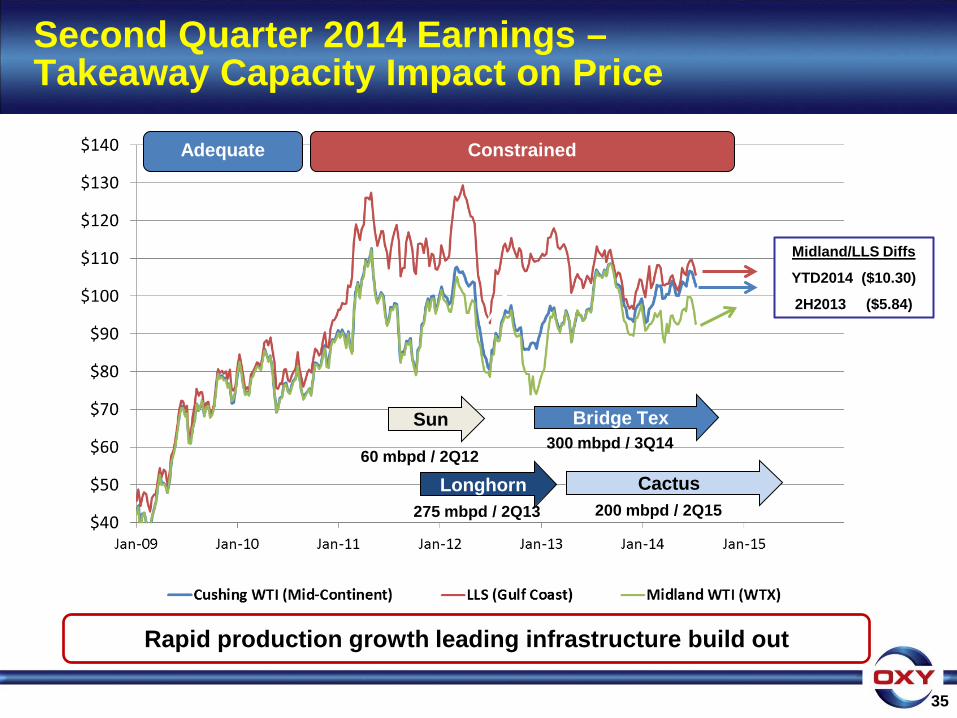
Second Quarter 2014 Earnings – Takeaway Capacity Impact on Price
Rapid production growth leading infrastructure build out
Adequate Constrained
Sun
Longhorn Cactus
Bridge Tex
60 mbpd / 2Q12 300 mbpd / 3Q14
275 mbpd / 2Q13 200 mbpd / 2Q15
35
Midland/LLS Diffs
YTD2014 ($10.30)
2H2013 ($5.84)
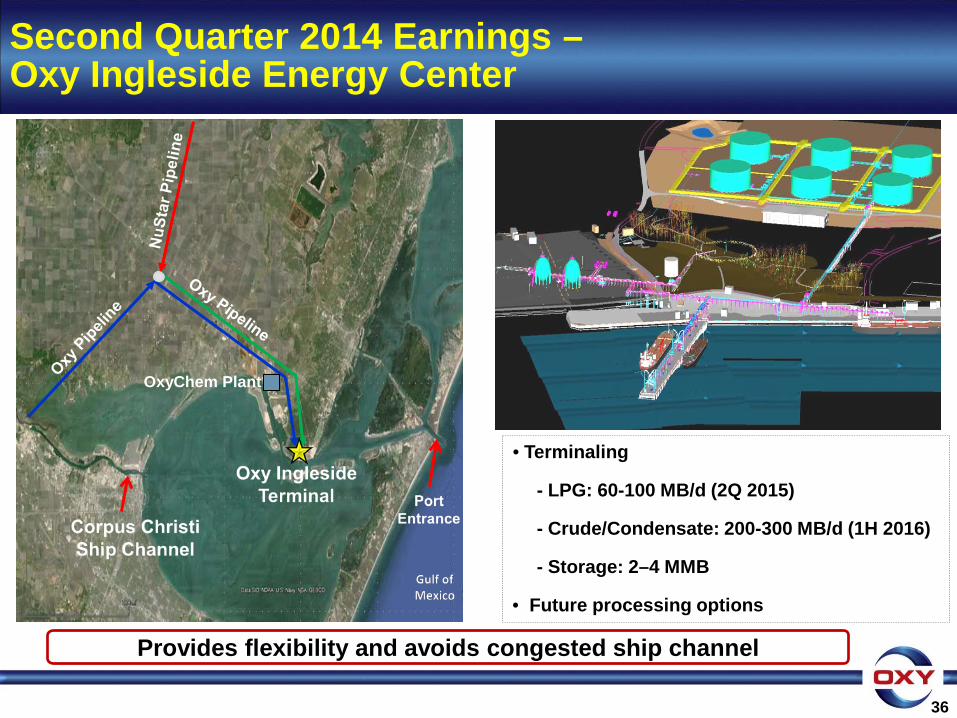
Second Quarter 2014 Earnings – Oxy Ingleside Energy Center
Provides flexibility and avoids congested ship channel
36
• Terminaling
- LPG: 60-100 MB/d (2Q 2015)
- Crude/Condensate: 200-300 MB/d (1H 2016)
- Storage: 2–4 MMB
• Future processing options
OxyChem Plant
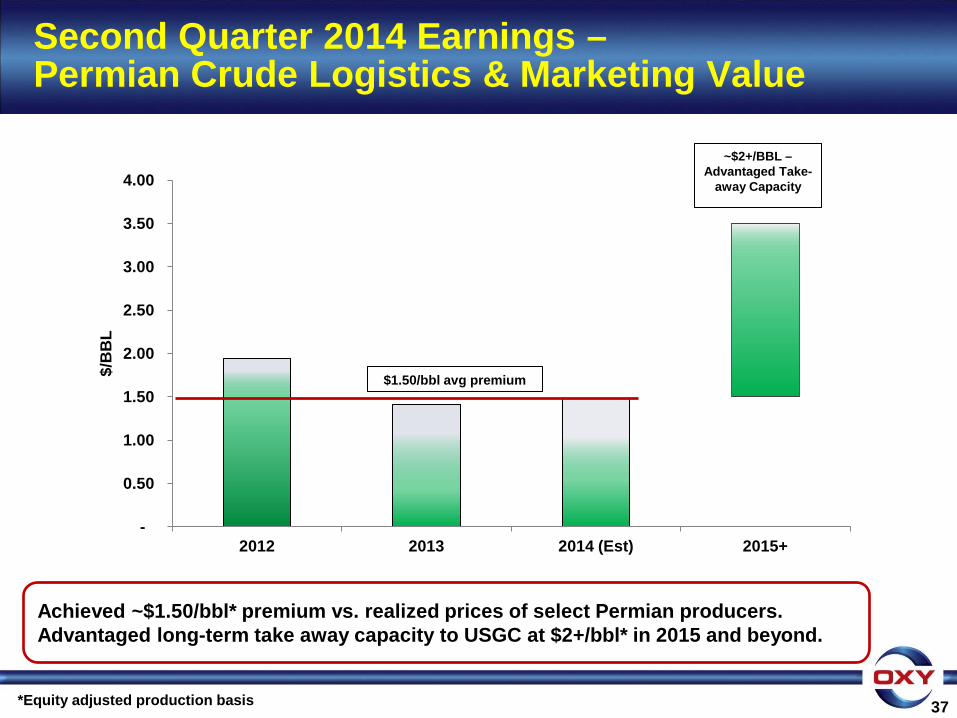
Second Quarter 2014 Earnings – Permian Crude Logistics & Marketing Value
37
-
0.50
1.00
1.50
2.00
2.50
3.00
3.50
4.00
2012 2013 2014 (Est) 2015+
$/B
BL
~$2+/BBL – Advantaged Take-
away Capacity
$1.50/bbl avg premium
Achieved ~$1.50/bbl* premium vs. realized prices of select Permian producers. Advantaged long-term take away capacity to USGC at $2+/bbl* in 2015 and beyond.
*Equity adjusted production basis

Second Quarter 2014 Earnings Conference Call Q&A