second quarter 2016 earnings presentation… · second quarter 2016 earnings presentation july 26,...
TRANSCRIPT

Second Quarter 2016
Earnings Presentation
July 26, 2016
Dick Weil
Chief Executive Officer
Jennifer McPeek
Chief Financial Officer
2
Executive summary
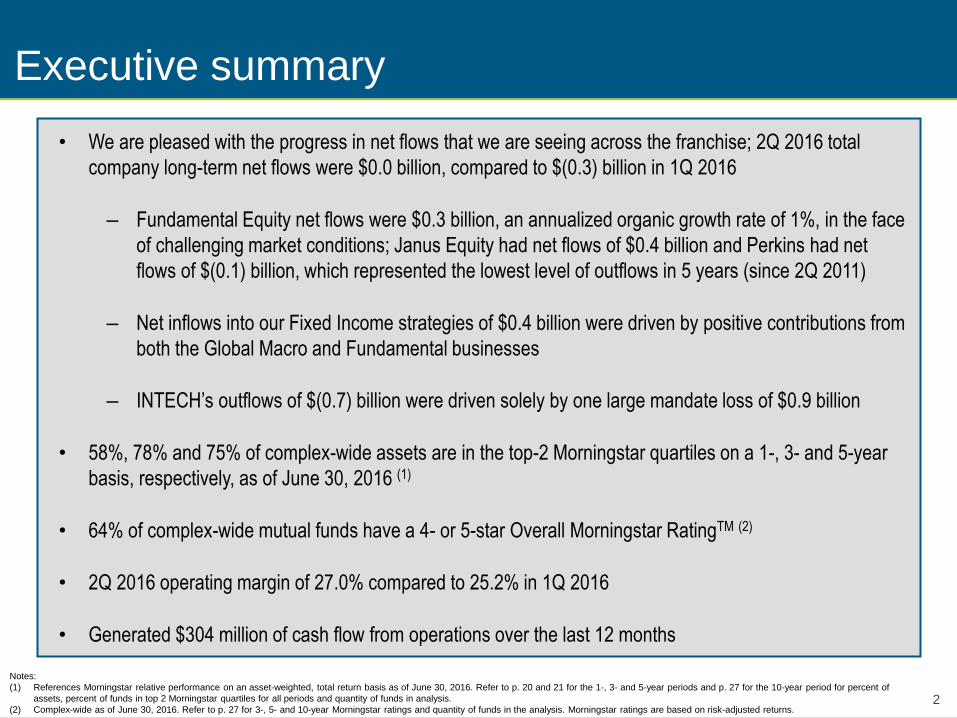
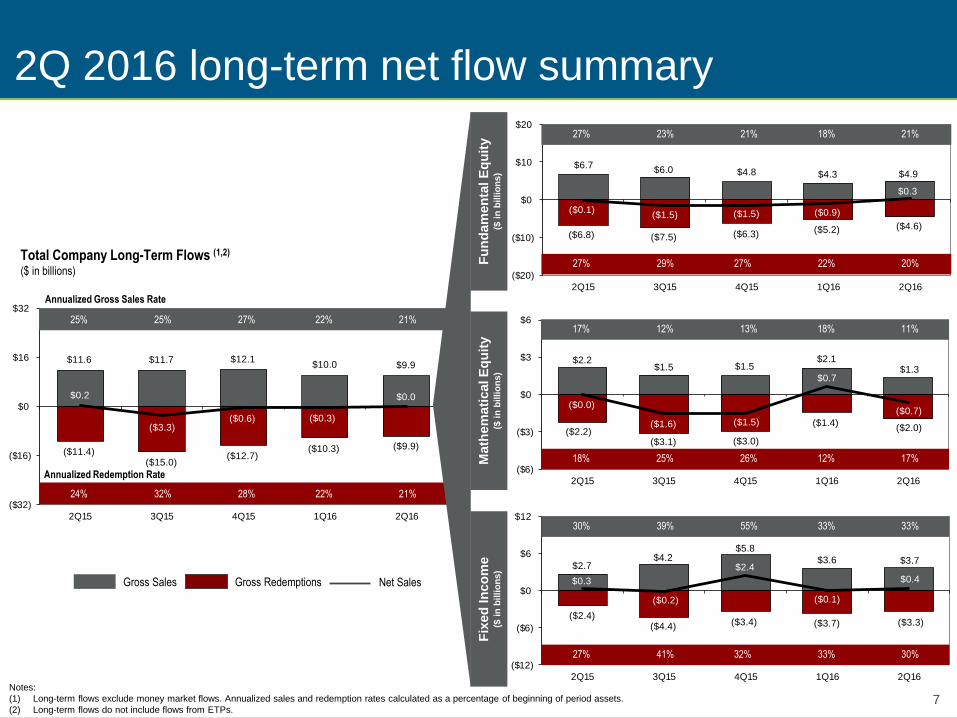
• We are pleased with the progress in net flows that we are seeing across the franchise; 2Q 2016 total
company long-term net flows were $0.0 billion, compared to $(0.3) billion in 1Q 2016
‒ Fundamental Equity net flows were $0.3 billion, an annualized organic growth rate of 1%, in the face
of challenging market conditions; Janus Equity had net flows of $0.4 billion and Perkins had net
flows of $(0.1) billion, which represented the lowest level of outflows in 5 years (since 2Q 2011)
‒ Net inflows into our Fixed Income strategies of $0.4 billion were driven by positive contributions from
both the Global Macro and Fundamental businesses
‒ INTECH’s outflows of $(0.7) billion were driven solely by one large mandate loss of $0.9 billion
• 58%, 78% and 75% of complex-wide assets are in the top-2 Morningstar quartiles on a 1-, 3- and 5-year
basis, respectively, as of June 30, 2016 (1)
• 64% of complex-wide mutual funds have a 4- or 5-star Overall Morningstar RatingTM (2)
• 2Q 2016 operating margin of 27.0% compared to 25.2% in 1Q 2016
• Generated $304 million of cash flow from operations over the last 12 months
Notes:
(1) References Morningstar relative performance on an asset-weighted, total return basis as of June 30, 2016. Refer to p. 20 and 21 for the 1-, 3- and 5-year periods and p. 27 for the 10-year period for percent of
assets, percent of funds in top 2 Morningstar quartiles for all periods and quantity of funds in analysis.
(2) Complex-wide as of June 30, 2016. Refer to p. 27 for 3-, 5- and 10-year Morningstar ratings and quantity of funds in the analysis. Morningstar ratings are based on risk-adjusted returns.
3
Janus Capital Group 2Q 2016 results
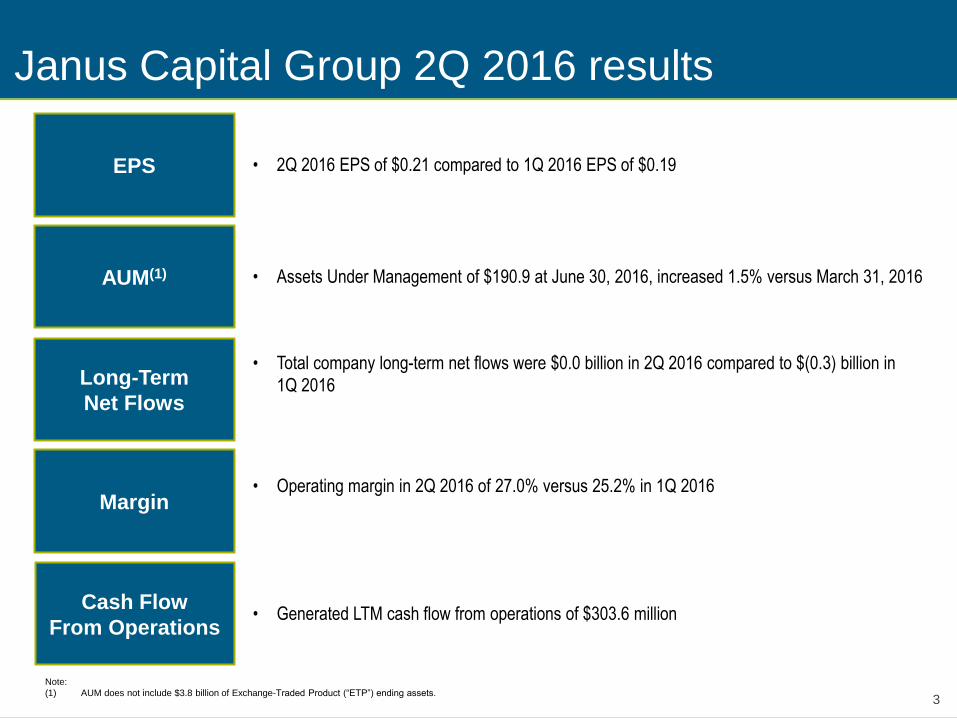
• 2Q 2016 EPS of $0.21 compared to 1Q 2016 EPS of $0.19
• Assets Under Management of $190.9 at June 30, 2016, increased 1.5% versus March 31, 2016
• Operating margin in 2Q 2016 of 27.0% versus 25.2% in 1Q 2016
• Total company long-term net flows were $0.0 billion in 2Q 2016 compared to $(0.3) billion in
1Q 2016
• Generated LTM cash flow from operations of $303.6 million
EPS
AUM(1)
Long-Term
Net Flows
Margin
Cash Flow
From Operations
Note:
(1) AUM does not include $3.8 billion of Exchange-Traded Product (“ETP”) ending assets.

2Q 2016 Results
Jennifer McPeek Chief Financial Officer
5
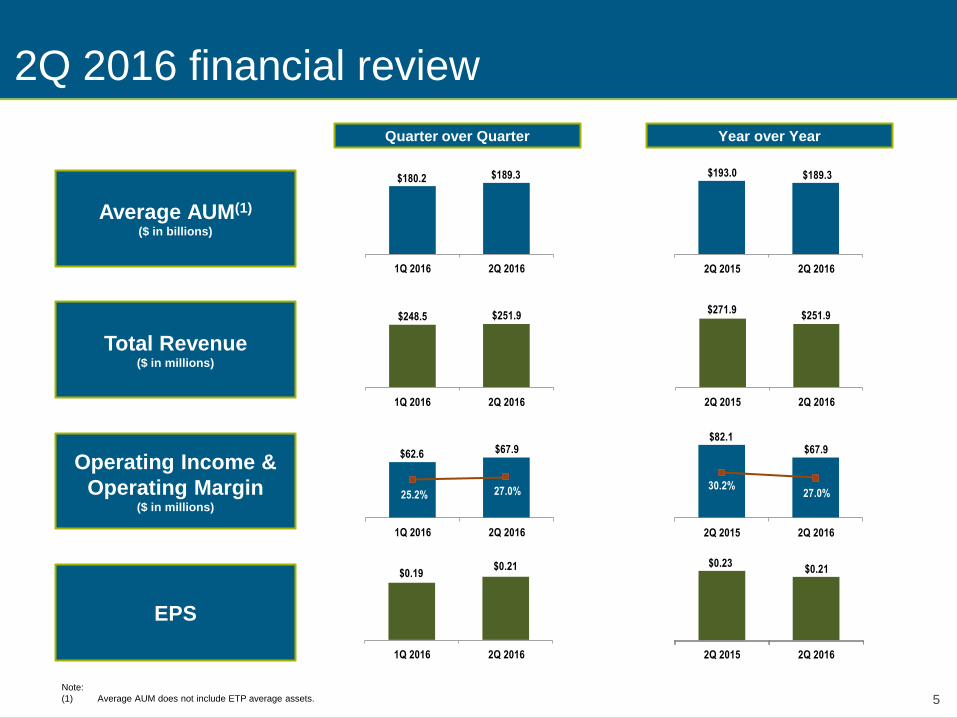
2Q 2016 financial review
EPS
Average AUM(1)
($ in billions)
Total Revenue ($ in millions)
Operating Income &
Operating Margin ($ in millions)
Quarter over Quarter Year over Year
$62.6 $67.9
25.2% 27.0%
1Q 2016 2Q 2016
$0.19 $0.21
1Q 2016 2Q 2016
Note:
(1) Average AUM does not include ETP average assets.
$248.5 $251.9
1Q 2016 2Q 2016
$271.9 $251.9
2Q 2015 2Q 2016
$82.1 $67.9
30.2% 27.0%
2Q 2015 2Q 2016
$193.0 $189.3
2Q 2015 2Q 2016
$0.23 $0.21
2Q 2015 2Q 2016
$180.2 $189.3
1Q 2016 2Q 2016
6
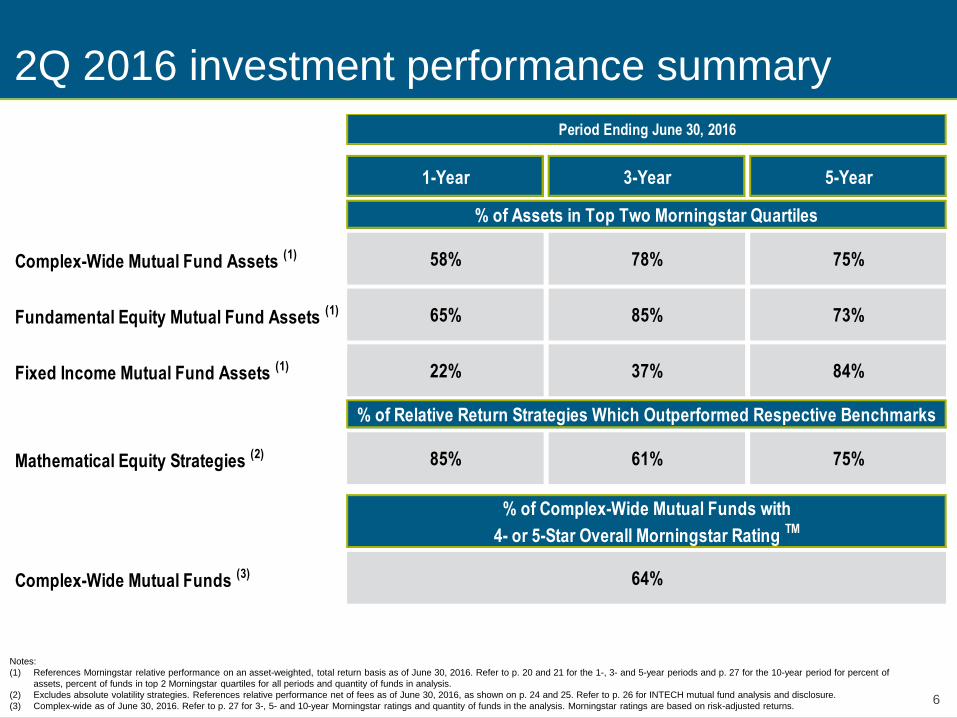
2Q 2016 investment performance summary
Notes:
(1) References Morningstar relative performance on an asset-weighted, total return basis as of June 30, 2016. Refer to p. 20 and 21 for the 1-, 3- and 5-year periods and p. 27 for the 10-year period for percent of
assets, percent of funds in top 2 Morningstar quartiles for all periods and quantity of funds in analysis.
(2) Excludes absolute volatility strategies. References relative performance net of fees as of June 30, 2016, as shown on p. 24 and 25. Refer to p. 26 for INTECH mutual fund analysis and disclosure.
(3) Complex-wide as of June 30, 2016. Refer to p. 27 for 3-, 5- and 10-year Morningstar ratings and quantity of funds in the analysis. Morningstar ratings are based on risk-adjusted returns.
Period Ending June 30, 2016
1-Year 3-Year 5-Year
% of Assets in Top Two Morningstar Quartiles
Complex-Wide Mutual Fund Assets (1) 58% 78% 75%
Fundamental Equity Mutual Fund Assets (1) 65% 85% 73%
Fixed Income Mutual Fund Assets (1) 22% 37% 84%
% of Relative Return Strategies Which Outperformed Respective Benchmarks
Mathematical Equity Strategies (2) 85% 61% 75%
% of Complex-Wide Mutual Funds with
4- or 5-Star Overall Morningstar Rating TM
Complex-Wide Mutual Funds (3) 64%
7
$2.7 $4.2
$5.8
$3.6 $3.7
($2.4)($4.4) ($3.4) ($3.7) ($3.3)
$0.3
($0.2)
$2.4
($0.1)
$0.4
($12)
($6)
$0
$6
$12
2Q15 3Q15 4Q15 1Q16 2Q16
$2.2 $1.5 $1.5
$2.1 $1.3
($2.2)($3.1) ($3.0)
($1.4)($2.0)
($0.0)
($1.6) ($1.5)
$0.7
($0.7)
($6)
($3)
$0
$3
$6
2Q15 3Q15 4Q15 1Q16 2Q16
$6.7 $6.0 $4.8 $4.3 $4.9
($6.8) ($7.5) ($6.3) ($5.2) ($4.6)
($0.1)($1.5) ($1.5) ($0.9)
$0.3
($20)
($10)
$0
$10
$20
2Q15 3Q15 4Q15 1Q16 2Q16
$11.6 $11.7 $12.1$10.0 $9.9
($11.4)($15.0)
($12.7)($10.3) ($9.9)
$0.2
($3.3)($0.6) ($0.3)
$0.0
($32)
($16)
$0
$16
$32
2Q15 3Q15 4Q15 1Q16 2Q16
2Q 2016 long-term net flow summary
Notes:
(1) Long-term flows exclude money market flows. Annualized sales and redemption rates calculated as a percentage of beginning of period assets.
(2) Long-term flows do not include flows from ETPs.
25% 25% 27% 22% 21%
Total Company Long-Term Flows (1,2)
($ in billions)
Gross Redemptions Gross Sales Net Sales
Annualized Redemption Rate
Annualized Gross Sales Rate
27% 23% 21% 18% 21%
27% 29% 27% 22% 20%
17% 12% 13% 18% 11%
18% 25% 26% 12% 17%
30% 39% 55% 33% 33%
27% 41% 32% 33% 30%
Fu
nd
am
en
tal E
qu
ity
($ i
n b
illio
ns)
Math
em
ati
cal E
qu
ity
($ i
n b
illio
ns)
Fix
ed
In
co
me
($
in
billio
ns)
24% 32% 28% 22% 21%
8
2Q 2016 total revenue
Total Revenue ($ in millions)
Note:
(1) Includes mutual fund and private account performance fees.
(1)
Management Fees
Shareowner Servicing Fees and Other
Performance Fees
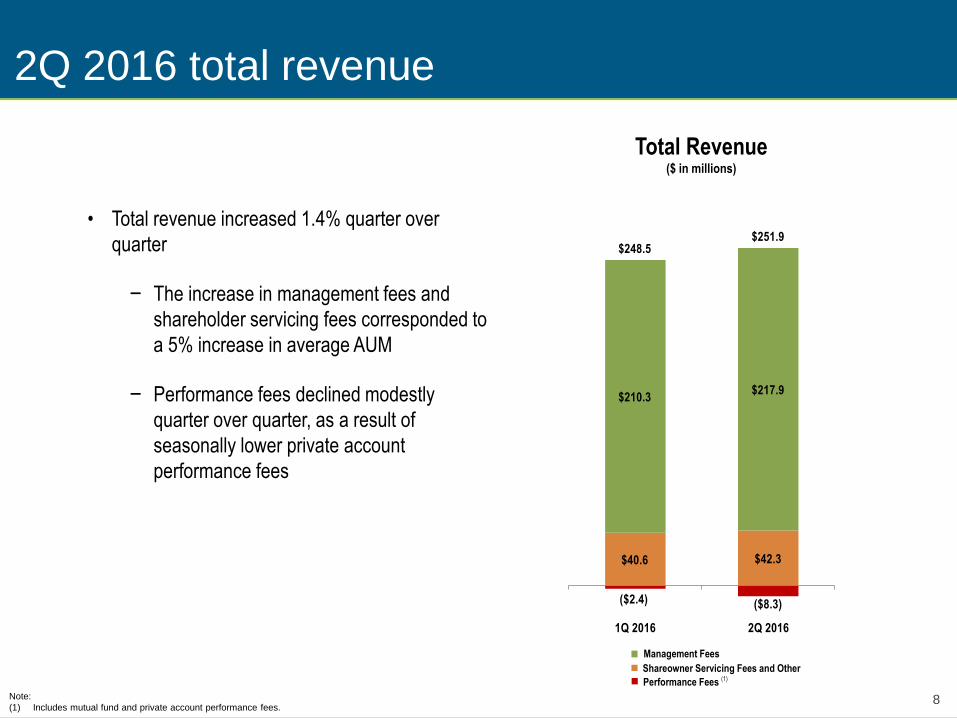
• Total revenue increased 1.4% quarter over
quarter
− The increase in management fees and
shareholder servicing fees corresponded to
a 5% increase in average AUM
− Performance fees declined modestly
quarter over quarter, as a result of
seasonally lower private account
performance fees
$40.6 $42.3
($2.4) ($8.3)
$210.3 $217.9
$248.5 $251.9
1Q 2016 2Q 2016
9
$31.7 $32.3
$9.1 $8.9
$32.4 $33.3
$5.3 $6.9
$19.5 $19.0
$87.9 $83.6
$185.9 $184.0
1Q 2016 2Q 2016
2Q 2016 operating expenses
Operating Expenses ($ in millions)
$79.9 $71.2
$17.7 $16.4
$8.2 $6.2
$39.6
$35.5
$8.4
$8.1
$28.4
$25.3
2Q 2011 3Q 2011
Employee Compensation & Benefits
Long-Term Incentive Compensation
Marketing & Advertising
Distribution
Depreciation & Amortization
G&ANote:
(1) 2016 annual long-term incentive compensation is currently expected to be $70-75 million.
(1)
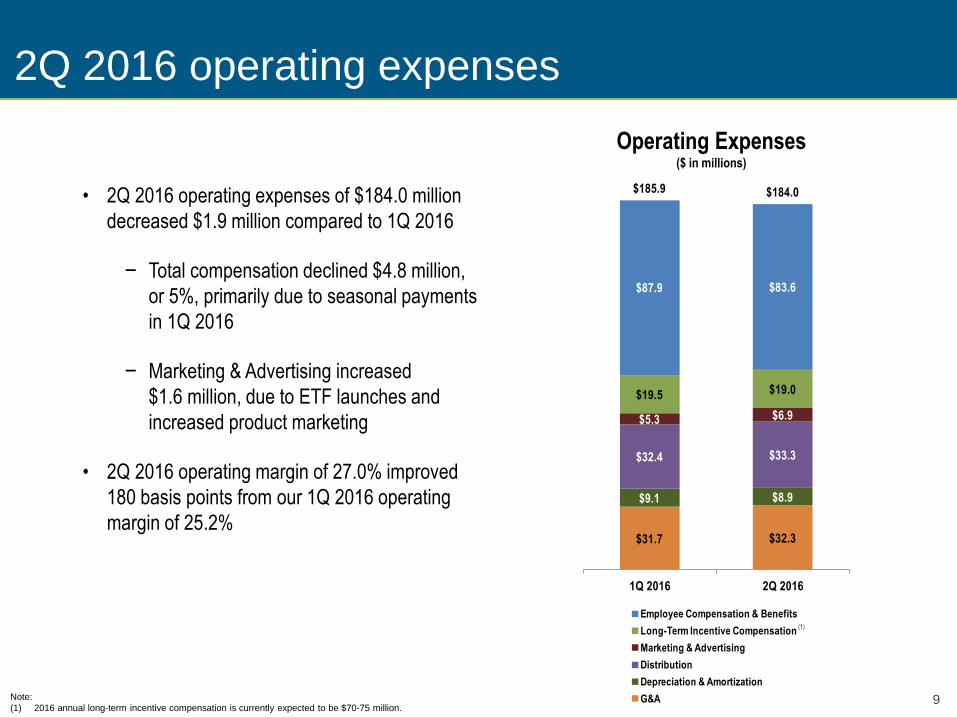
• 2Q 2016 operating expenses of $184.0 million
decreased $1.9 million compared to 1Q 2016
− Total compensation declined $4.8 million,
or 5%, primarily due to seasonal payments
in 1Q 2016
− Marketing & Advertising increased
$1.6 million, due to ETF launches and
increased product marketing
• 2Q 2016 operating margin of 27.0% improved
180 basis points from our 1Q 2016 operating
margin of 25.2%
10
$307 $337
$301$317
$608$654
$295 $295
$108 $109
$403 $404
2Q 2016 balance sheet profile
6/30/2016
2018 Maturity Investment Securities(2)
3/31/2016
Cash
& Investments
Debt Debt
Cash and Cash Equivalents
Notes:
(1) Numbers may not foot due to rounding.
(2) Includes Seed Investments of $280.2 million (including investment securities of consolidated variable interest entities of $38.5 million), Investments in Advised Mutual Funds of $4.3 million and Investments
Related to Deferred Compensation Plans of $16.7 million as of March 31, 2016; includes Seed Investments of $295.4 million (including investment securities of consolidated variable interest entities of $49.2
million), Investments in Advised Mutual Funds of $4.4 million and Investments Related to Deferred Compensation Plans of $16.7 million as of June 30, 2016.
2025 Maturity
Cash
& Investments
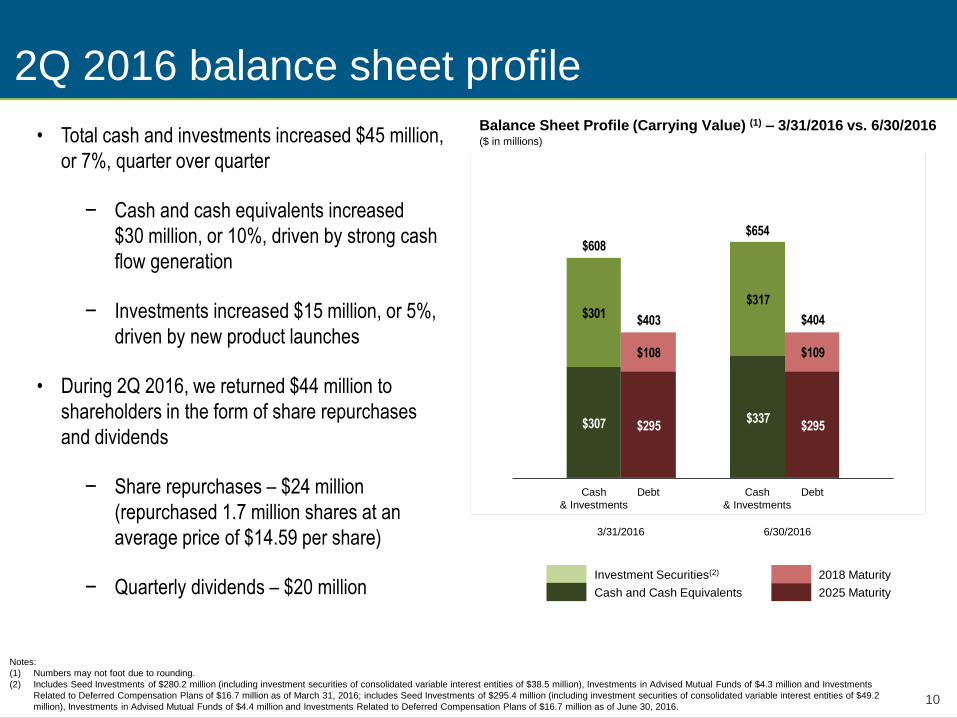
Balance Sheet Profile (Carrying Value) (1) – 3/31/2016 vs. 6/30/2016 ($ in millions) • Total cash and investments increased $45 million,
or 7%, quarter over quarter
− Cash and cash equivalents increased
$30 million, or 10%, driven by strong cash
flow generation
− Investments increased $15 million, or 5%,
driven by new product launches
• During 2Q 2016, we returned $44 million to
shareholders in the form of share repurchases
and dividends
− Share repurchases – $24 million
(repurchased 1.7 million shares at an
average price of $14.59 per share)
− Quarterly dividends – $20 million

Topic of Discussion
Jennifer McPeek
Chief Financial Officer
12
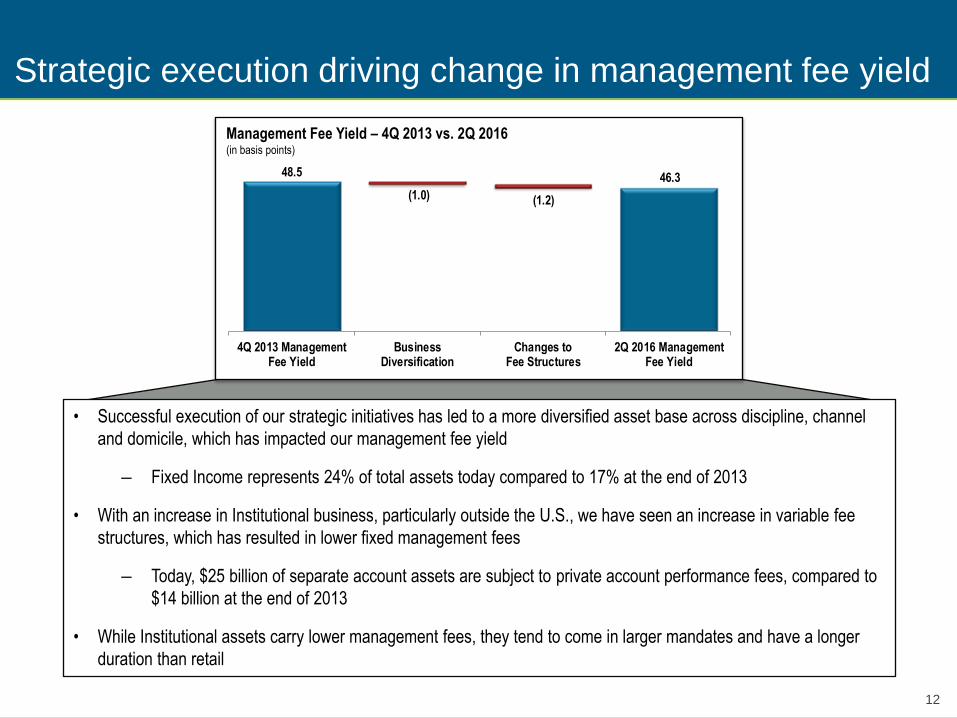
Strategic execution driving change in management fee yield
Management Fee Yield – 4Q 2013 vs. 2Q 2016
(in basis points)
48.5 46.3
(1.0) (1.2)
4Q 2013 ManagementFee Yield
BusinessDiversification
Changes toFee Structures
2Q 2016 ManagementFee Yield
• Successful execution of our strategic initiatives has led to a more diversified asset base across discipline, channel
and domicile, which has impacted our management fee yield
‒ Fixed Income represents 24% of total assets today compared to 17% at the end of 2013
• With an increase in Institutional business, particularly outside the U.S., we have seen an increase in variable fee
structures, which has resulted in lower fixed management fees
‒ Today, $25 billion of separate account assets are subject to private account performance fees, compared to
$14 billion at the end of 2013
• While Institutional assets carry lower management fees, they tend to come in larger mandates and have a longer
duration than retail

Q&A
Jennifer McPeek
Chief Financial Officer
Dick Weil
Chief Executive Officer

Appendix
15
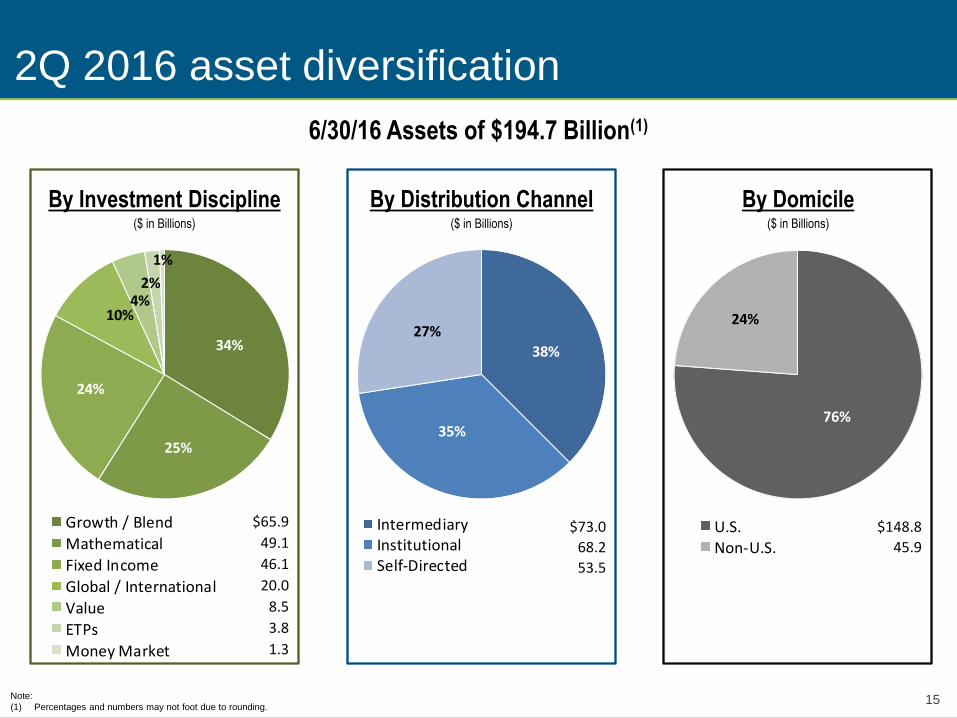
2Q 2016 asset diversification
6/30/16 Assets of $194.7 Billion(1)
By Investment Discipline ($ in Billions)
Note:
(1) Percentages and numbers may not foot due to rounding.
By Distribution Channel ($ in Billions)
By Domicile ($ in Billions)
34%
25%
24%
10%4%2%
1%
Growth / Blend
Mathematical
Fixed Income
Global / International
Value
ETPs
Money Market
38%
35%
27%
IntermediaryInstitutionalSelf-Directed
76%
24%
U.S.Non-U.S.
$65.9
49.1
46.1
20.0
8.5
3.8
1.3
$73.0
68.2
53.5
$148.8
45.9
16
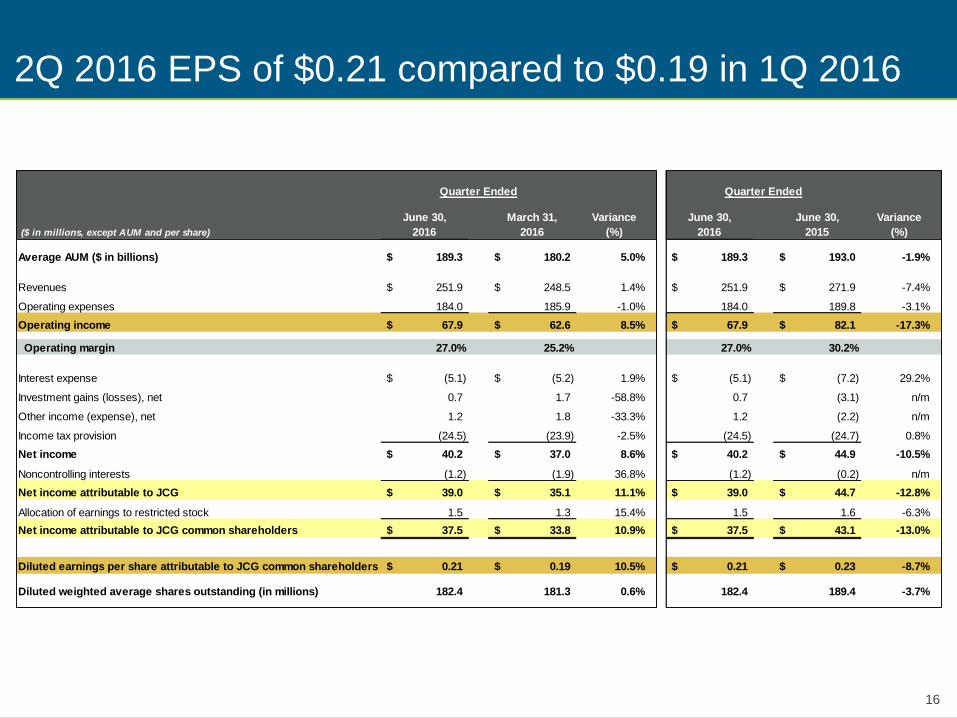
2Q 2016 EPS of $0.21 compared to $0.19 in 1Q 2016
June 30, March 31, Variance June 30, June 30, Variance
($ in millions, except AUM and per share) 2016 2016 (%) 2016 2015 (%)
Average AUM ($ in billions) 189.3$ 180.2$ 5.0% 189.3$ 193.0$ -1.9%
Revenues 251.9$ 248.5$ 1.4% 251.9$ 271.9$ -7.4%
Operating expenses 184.0 185.9 -1.0% 184.0 189.8 -3.1%
Operating income 67.9$ 62.6$ 8.5% 67.9$ 82.1$ -17.3%
Operating margin 27.0% 25.2% 27.0% 30.2%
Interest expense (5.1)$ (5.2)$ 1.9% (5.1)$ (7.2)$ 29.2%
Investment gains (losses), net 0.7 1.7 -58.8% 0.7 (3.1) n/m
Other income (expense), net 1.2 1.8 -33.3% 1.2 (2.2) n/m
Income tax provision (24.5) (23.9) -2.5% (24.5) (24.7) 0.8%
Net income 40.2$ 37.0$ 8.6% 40.2$ 44.9$ -10.5%
Noncontrolling interests (1.2) (1.9) 36.8% (1.2) (0.2) n/m
Net income attributable to JCG 39.0$ 35.1$ 11.1% 39.0$ 44.7$ -12.8%
Allocation of earnings to restricted stock 1.5 1.3 15.4% 1.5 1.6 -6.3%
Net income attributable to JCG common shareholders 37.5$ 33.8$ 10.9% 37.5$ 43.1$ -13.0%
Diluted earnings per share attributable to JCG common shareholders 0.21$ 0.19$ 10.5% 0.21$ 0.23$ -8.7%
Diluted weighted average shares outstanding (in millions) 182.4 181.3 0.6% 182.4 189.4 -3.7%
Quarter Ended Quarter Ended
17
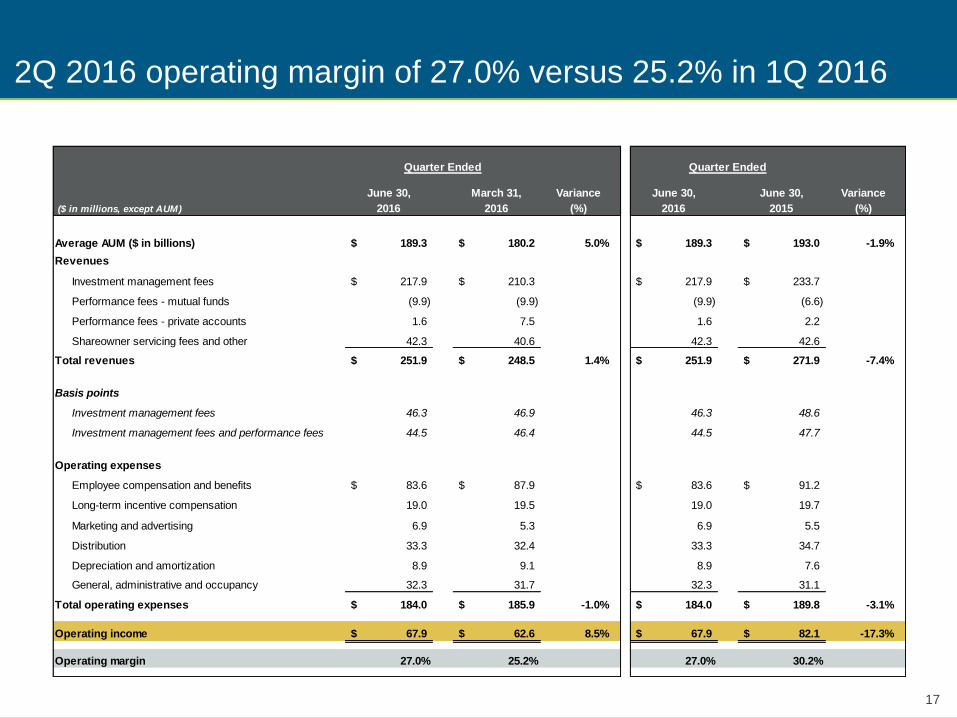
2Q 2016 operating margin of 27.0% versus 25.2% in 1Q 2016
June 30, March 31, Variance June 30, June 30, Variance
($ in millions, except AUM) 2016 2016 (%) 2016 2015 (%)
Average AUM ($ in billions) 189.3$ 180.2$ 5.0% 189.3$ 193.0$ -1.9%
Revenues
Investment management fees 217.9$ 210.3$ 217.9$ 233.7$
Performance fees - mutual funds (9.9) (9.9) (9.9) (6.6)
Performance fees - private accounts 1.6 7.5 1.6 2.2
Shareowner servicing fees and other 42.3 40.6 42.3 42.6
Total revenues 251.9$ 248.5$ 1.4% 251.9$ 271.9$ -7.4%
Basis points
Investment management fees 46.3 46.9 46.3 48.6
Investment management fees and performance fees 44.5 46.4 44.5 47.7
Operating expenses
Employee compensation and benefits 83.6$ 87.9$ 83.6$ 91.2$
Long-term incentive compensation 19.0 19.5 19.0 19.7
Marketing and advertising 6.9 5.3 6.9 5.5
Distribution 33.3 32.4 33.3 34.7
Depreciation and amortization 8.9 9.1 8.9 7.6
General, administrative and occupancy 32.3 31.7 32.3 31.1
Total operating expenses 184.0$ 185.9$ -1.0% 184.0$ 189.8$ -3.1%
Operating income 67.9$ 62.6$ 8.5% 67.9$ 82.1$ -17.3%
Operating margin 27.0% 25.2% 27.0% 30.2%
Quarter Ended Quarter Ended
18
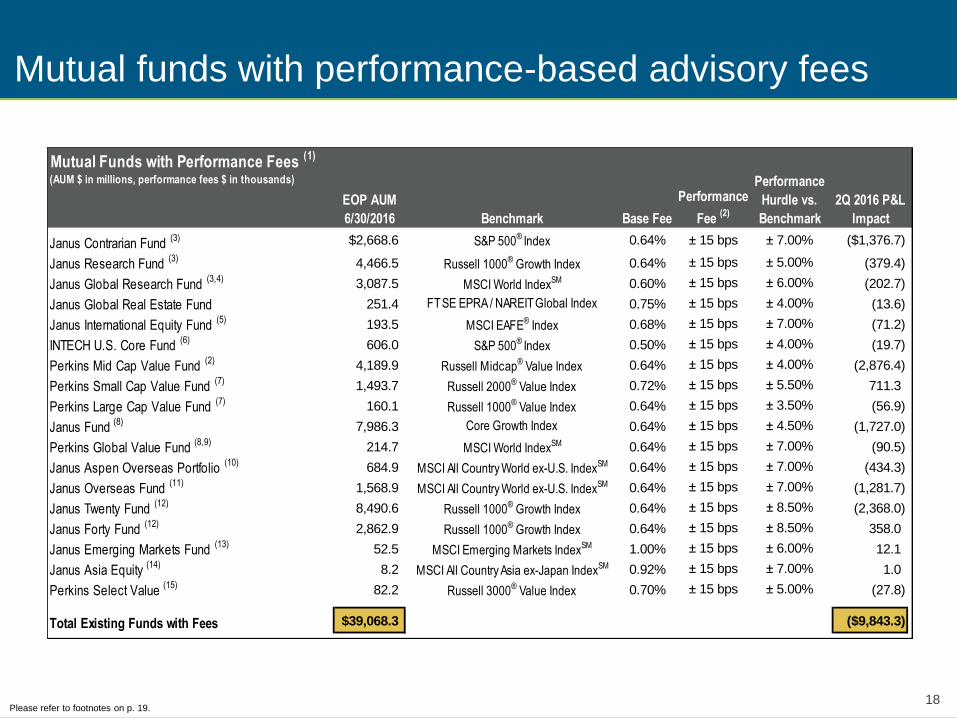
Mutual funds with performance-based advisory fees
Please refer to footnotes on p. 19.
Mutual Funds with Performance Fees (1)
(AUM $ in millions, performance fees $ in thousands)
EOP AUM
6/30/2016 Benchmark Base Fee
Performance
Fee (2)
Performance
Hurdle vs.
Benchmark
2Q 2016 P&L
Impact
Janus Contrarian Fund (3) $2,668.6 S&P 500® Index 0.64% ± 15 bps ± 7.00% ($1,376.7)
Janus Research Fund (3) 4,466.5 Russell 1000® Growth Index 0.64% ± 15 bps ± 5.00% (379.4)
Janus Global Research Fund (3,4) 3,087.5 MSCI World IndexSM 0.60% ± 15 bps ± 6.00% (202.7)
Janus Global Real Estate Fund 251.4 FTSE EPRA / NAREITGlobal Index 0.75% ± 15 bps ± 4.00% (13.6)
Janus International Equity Fund (5) 193.5 MSCI EAFE® Index 0.68% ± 15 bps ± 7.00% (71.2)
INTECH U.S. Core Fund (6) 606.0 S&P 500® Index 0.50% ± 15 bps ± 4.00% (19.7)
Perkins Mid Cap Value Fund (2) 4,189.9 Russell Midcap® Value Index 0.64% ± 15 bps ± 4.00% (2,876.4)
Perkins Small Cap Value Fund (7) 1,493.7 Russell 2000® Value Index 0.72% ± 15 bps ± 5.50% 711.3
Perkins Large Cap Value Fund (7) 160.1 Russell 1000® Value Index 0.64% ± 15 bps ± 3.50% (56.9)
Janus Fund (8) 7,986.3 Core Growth Index 0.64% ± 15 bps ± 4.50% (1,727.0)
Perkins Global Value Fund (8,9) 214.7 MSCI World IndexSM 0.64% ± 15 bps ± 7.00% (90.5)
Janus Aspen Overseas Portfolio (10) 684.9 MSCI All Country World ex-U.S. IndexSM 0.64% ± 15 bps ± 7.00% (434.3)
Janus Overseas Fund (11) 1,568.9 MSCI All Country World ex-U.S. IndexSM 0.64% ± 15 bps ± 7.00% (1,281.7)
Janus Twenty Fund (12) 8,490.6 Russell 1000® Growth Index 0.64% ± 15 bps ± 8.50% (2,368.0)
Janus Forty Fund (12) 2,862.9 Russell 1000® Growth Index 0.64% ± 15 bps ± 8.50% 358.0
Janus Emerging Markets Fund (13) 52.5 MSCI Emerging Markets IndexSM 1.00% ± 15 bps ± 6.00% 12.1
Janus Asia Equity (14) 8.2 MSCI All Country Asia ex-Japan IndexSM 0.92% ± 15 bps ± 7.00% 1.0
Perkins Select Value (15) 82.2 Russell 3000® Value Index 0.70% ± 15 bps ± 5.00% (27.8)
Total Existing Funds with Fees $39,068.3 ($9,843.3)
19
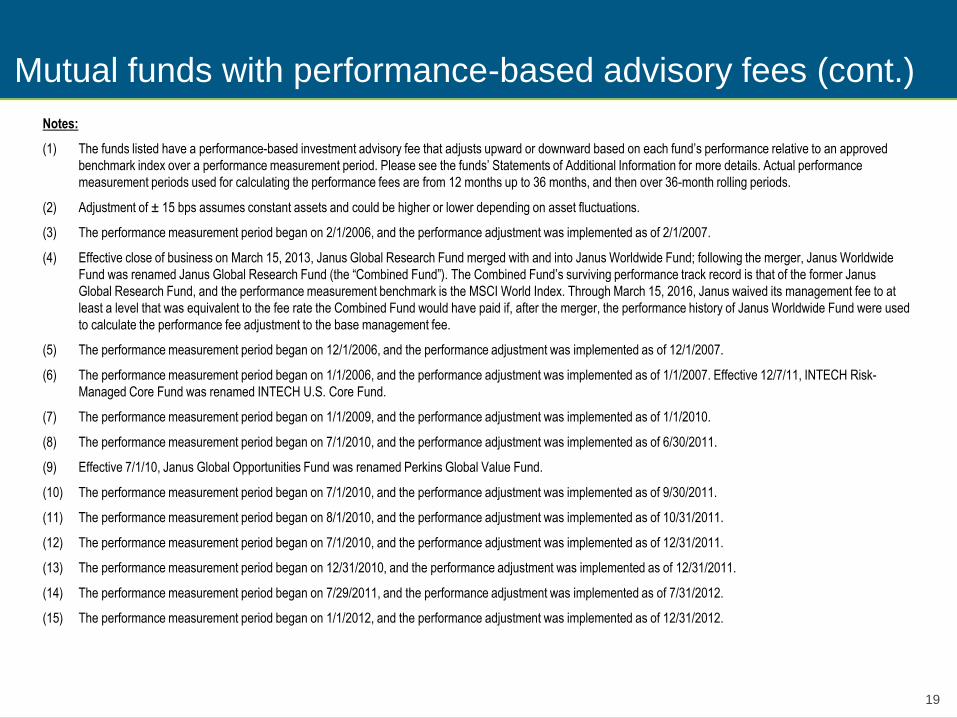
Mutual funds with performance-based advisory fees (cont.)
Notes:
(1) The funds listed have a performance-based investment advisory fee that adjusts upward or downward based on each fund’s performance relative to an approved
benchmark index over a performance measurement period. Please see the funds’ Statements of Additional Information for more details. Actual performance
measurement periods used for calculating the performance fees are from 12 months up to 36 months, and then over 36-month rolling periods.
(2) Adjustment of ± 15 bps assumes constant assets and could be higher or lower depending on asset fluctuations.
(3) The performance measurement period began on 2/1/2006, and the performance adjustment was implemented as of 2/1/2007.
(4) Effective close of business on March 15, 2013, Janus Global Research Fund merged with and into Janus Worldwide Fund; following the merger, Janus Worldwide
Fund was renamed Janus Global Research Fund (the “Combined Fund”). The Combined Fund’s surviving performance track record is that of the former Janus
Global Research Fund, and the performance measurement benchmark is the MSCI World Index. Through March 15, 2016, Janus waived its management fee to at
least a level that was equivalent to the fee rate the Combined Fund would have paid if, after the merger, the performance history of Janus Worldwide Fund were used
to calculate the performance fee adjustment to the base management fee.
(5) The performance measurement period began on 12/1/2006, and the performance adjustment was implemented as of 12/1/2007.
(6) The performance measurement period began on 1/1/2006, and the performance adjustment was implemented as of 1/1/2007. Effective 12/7/11, INTECH Risk-
Managed Core Fund was renamed INTECH U.S. Core Fund.
(7) The performance measurement period began on 1/1/2009, and the performance adjustment was implemented as of 1/1/2010.
(8) The performance measurement period began on 7/1/2010, and the performance adjustment was implemented as of 6/30/2011.
(9) Effective 7/1/10, Janus Global Opportunities Fund was renamed Perkins Global Value Fund.
(10) The performance measurement period began on 7/1/2010, and the performance adjustment was implemented as of 9/30/2011.
(11) The performance measurement period began on 8/1/2010, and the performance adjustment was implemented as of 10/31/2011.
(12) The performance measurement period began on 7/1/2010, and the performance adjustment was implemented as of 12/31/2011.
(13) The performance measurement period began on 12/31/2010, and the performance adjustment was implemented as of 12/31/2011.
(14) The performance measurement period began on 7/29/2011, and the performance adjustment was implemented as of 7/31/2012.
(15) The performance measurement period began on 1/1/2012, and the performance adjustment was implemented as of 12/31/2012.
20
Complex-Wide: Percent in Top 2 Morningstar Quartiles Based on Total Returns
1-Year 3-Year 5-Year
46%
61% 63% 61%
48%
24%
27%31% 33%
39%
88%
94%
88%
94%
71%
0%
10%
20%
30%
40%
50%
60%
70%
80%
90%
100%
3/31/09 6/30/09 9/30/09 12/31/09 3/31/10
Perc
ent
of
Janus M
anaged E
quity J
IF F
unds
.
1st Quartile 2nd Quartile
% of
Funds
% of
Assets
46%
61% 63% 61%
48%
24%
27%31% 33%
39%
88%
94%
88%
94%
71%
0%
10%
20%
30%
40%
50%
60%
70%
80%
90%
100%
3/31/09 6/30/09 9/30/09 12/31/09 3/31/10
Perc
ent
of
Janus M
anaged E
quity J
IF F
unds
.
1st Quartile 2nd Quartile
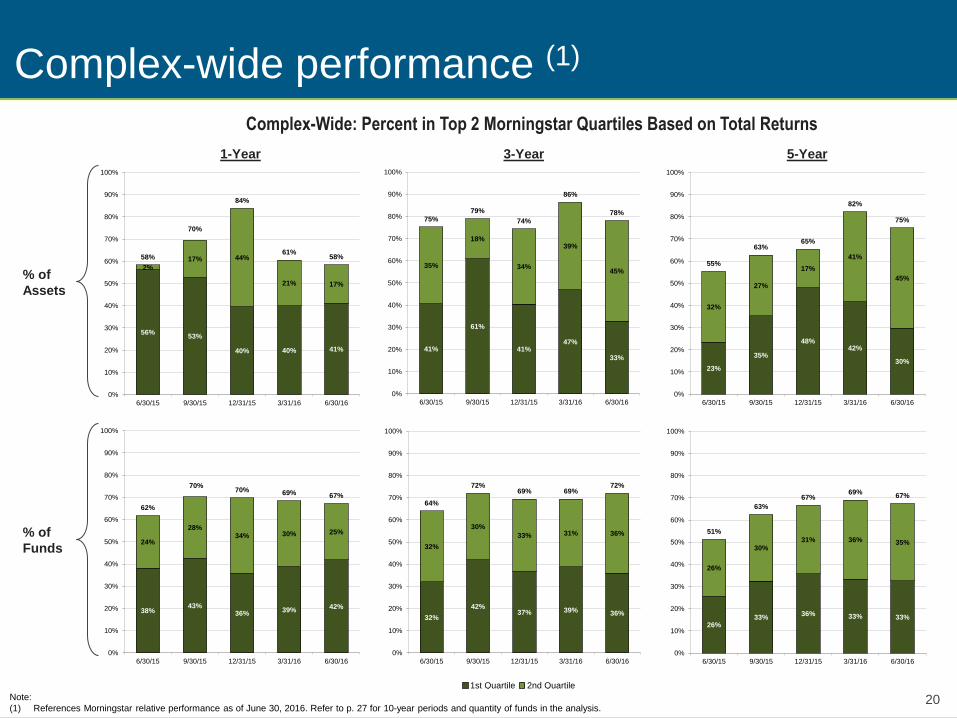
Complex-wide performance (1)
Note:
(1) References Morningstar relative performance as of June 30, 2016. Refer to p. 27 for 10-year periods and quantity of funds in the analysis.
56%53%
40% 40% 41%
2%
17% 44%
21% 17%
58%
70%
84%
61%58%
0%
10%
20%
30%
40%
50%
60%
70%
80%
90%
100%
6/30/15 9/30/15 12/31/15 3/31/16 6/30/16
41%
61%
41%47%
33%
35%
18%
34%
39%
45%
75%
79%
74%
86%
78%
0%
10%
20%
30%
40%
50%
60%
70%
80%
90%
100%
6/30/15 9/30/15 12/31/15 3/31/16 6/30/16
23%
35%
48%42%
30%
32%
27%
17%
41%
45%
55%
63%65%
82%
75%
0%
10%
20%
30%
40%
50%
60%
70%
80%
90%
100%
6/30/15 9/30/15 12/31/15 3/31/16 6/30/16
38%43%
36%39% 42%
24%
28%34% 30% 25%
62%
70%70% 69% 67%
0%
10%
20%
30%
40%
50%
60%
70%
80%
90%
100%
6/30/15 9/30/15 12/31/15 3/31/16 6/30/16
32%
42%37% 39% 36%
32%
30%
33% 31% 36%
64%
72%69% 69%
72%
0%
10%
20%
30%
40%
50%
60%
70%
80%
90%
100%
6/30/15 9/30/15 12/31/15 3/31/16 6/30/16
26%33%
36% 33% 33%
26%
30%31% 36% 35%
51%
63%
67%69%
67%
0%
10%
20%
30%
40%
50%
60%
70%
80%
90%
100%
6/30/15 9/30/15 12/31/15 3/31/16 6/30/16
21
Fundamental Equity: Percent in Top 2 Morningstar Quartiles Based on Total Returns
46%
61% 63% 61%
48%
24%
27%31% 33%
39%
88%
94%
88%
94%
71%
0%
10%
20%
30%
40%
50%
60%
70%
80%
90%
100%
3/31/09 6/30/09 9/30/09 12/31/09 3/31/10
Perc
ent
of
Janus M
anaged E
quity J
IF F
unds
.
1st Quartile 2nd Quartile
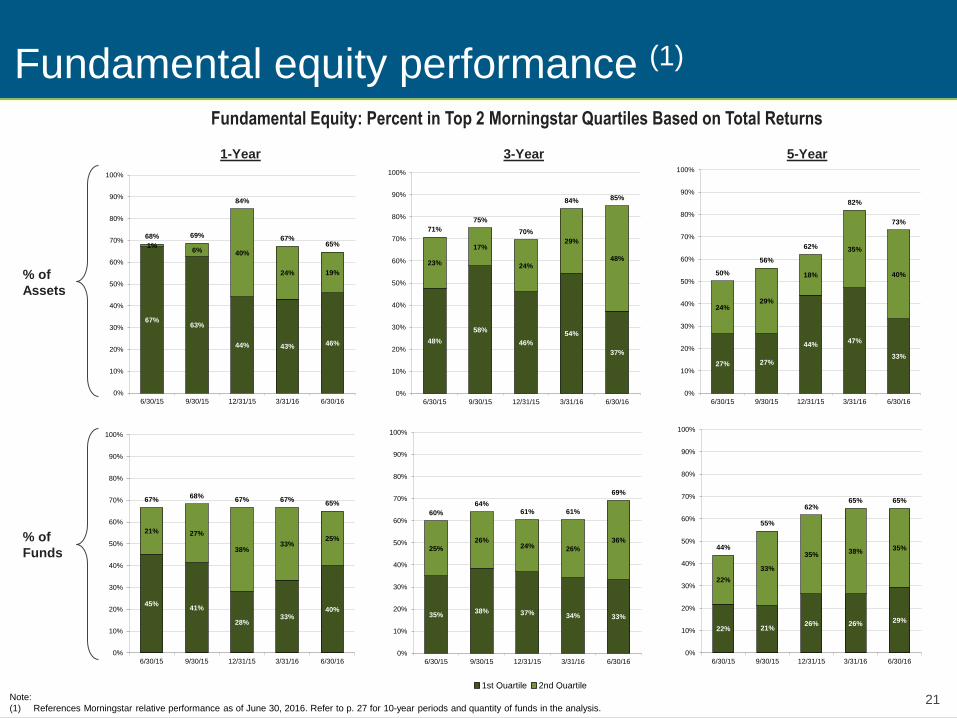
Fundamental equity performance (1)
1-Year 3-Year 5-Year
% of
Funds
% of
Assets
67%63%
44% 43% 46%
1%6% 40%
24% 19%
68% 69%
84%
67%65%
0%
10%
20%
30%
40%
50%
60%
70%
80%
90%
100%
6/30/15 9/30/15 12/31/15 3/31/16 6/30/16
48%
58%
46%
54%
37%
23%
17%
24%
29%
48%
71%
75%
70%
84% 85%
0%
10%
20%
30%
40%
50%
60%
70%
80%
90%
100%
6/30/15 9/30/15 12/31/15 3/31/16 6/30/16
27% 27%
44%47%
33%
24%29%
18%
35%
40%50%
56%
62%
82%
73%
0%
10%
20%
30%
40%
50%
60%
70%
80%
90%
100%
6/30/15 9/30/15 12/31/15 3/31/16 6/30/16
45%41%
28%33%
40%
21% 27%
38%33%
25%
67%68%
67% 67%65%
0%
10%
20%
30%
40%
50%
60%
70%
80%
90%
100%
6/30/15 9/30/15 12/31/15 3/31/16 6/30/16
35%38% 37% 34% 33%
25%
26%24% 26%
36%
60%
64%61% 61%
69%
0%
10%
20%
30%
40%
50%
60%
70%
80%
90%
100%
6/30/15 9/30/15 12/31/15 3/31/16 6/30/16
22% 21%26% 26% 29%
22%
33%
35%38% 35%44%
55%
62%65% 65%
0%
10%
20%
30%
40%
50%
60%
70%
80%
90%
100%
6/30/15 9/30/15 12/31/15 3/31/16 6/30/16
Note:
(1) References Morningstar relative performance as of June 30, 2016. Refer to p. 27 for 10-year periods and quantity of funds in the analysis.
22
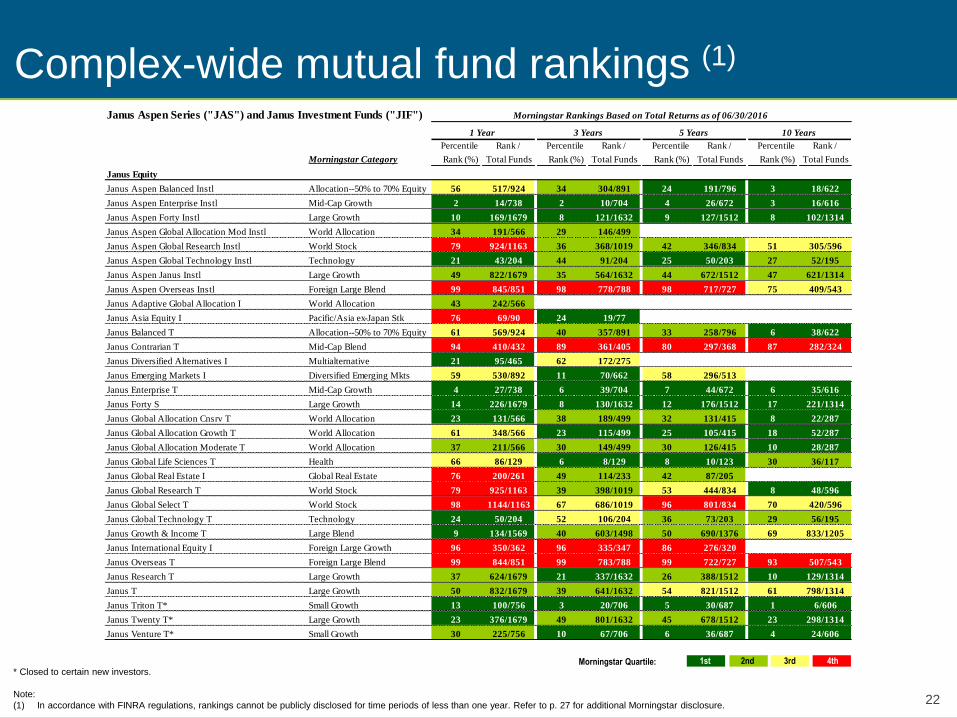
Complex-wide mutual fund rankings (1)
Morningstar Quartile: 1st 2nd 3rd 4th
Janus Aspen Series ("JAS") and Janus Investment Funds ("JIF")
Percentile Rank / Percentile Rank / Percentile Rank / Percentile Rank /
Morningstar Category Rank (%) Total Funds Rank (%) Total Funds Rank (%) Total Funds Rank (%) Total Funds
Janus Equity
Janus Aspen Balanced Instl Allocation--50% to 70% Equity 56 517/924 34 304/891 24 191/796 3 18/622
Janus Aspen Enterprise Instl Mid-Cap Growth 2 14/738 2 10/704 4 26/672 3 16/616
Janus Aspen Forty Instl Large Growth 10 169/1679 8 121/1632 9 127/1512 8 102/1314
Janus Aspen Global Allocation Mod Instl World Allocation 34 191/566 29 146/499 / /
Janus Aspen Global Research Instl World Stock 79 924/1163 36 368/1019 42 346/834 51 305/596
Janus Aspen Global Technology Instl Technology 21 43/204 44 91/204 25 50/203 27 52/195
Janus Aspen Janus Instl Large Growth 49 822/1679 35 564/1632 44 672/1512 47 621/1314
Janus Aspen Overseas Instl Foreign Large Blend 99 845/851 98 778/788 98 717/727 75 409/543
Janus Adaptive Global Allocation I World Allocation 43 242/566 / / /
Janus Asia Equity I Pacific/Asia ex-Japan Stk 76 69/90 24 19/77 / /
Janus Balanced T Allocation--50% to 70% Equity 61 569/924 40 357/891 33 258/796 6 38/622
Janus Contrarian T Mid-Cap Blend 94 410/432 89 361/405 80 297/368 87 282/324
Janus Diversified Alternatives I Multialternative 21 95/465 62 172/275 / /
Janus Emerging Markets I Diversified Emerging Mkts 59 530/892 11 70/662 58 296/513 /
Janus Enterprise T Mid-Cap Growth 4 27/738 6 39/704 7 44/672 6 35/616
Janus Forty S Large Growth 14 226/1679 8 130/1632 12 176/1512 17 221/1314
Janus Global Allocation Cnsrv T World Allocation 23 131/566 38 189/499 32 131/415 8 22/287
Janus Global Allocation Growth T World Allocation 61 348/566 23 115/499 25 105/415 18 52/287
Janus Global Allocation Moderate T World Allocation 37 211/566 30 149/499 30 126/415 10 28/287
Janus Global Life Sciences T Health 66 86/129 6 8/129 8 10/123 30 36/117
Janus Global Real Estate I Global Real Estate 76 200/261 49 114/233 42 87/205 /
Janus Global Research T World Stock 79 925/1163 39 398/1019 53 444/834 8 48/596
Janus Global Select T World Stock 98 1144/1163 67 686/1019 96 801/834 70 420/596
Janus Global Technology T Technology 24 50/204 52 106/204 36 73/203 29 56/195
Janus Growth & Income T Large Blend 9 134/1569 40 603/1498 50 690/1376 69 833/1205
Janus International Equity I Foreign Large Growth 96 350/362 96 335/347 86 276/320 /
Janus Overseas T Foreign Large Blend 99 844/851 99 783/788 99 722/727 93 507/543
Janus Research T Large Growth 37 624/1679 21 337/1632 26 388/1512 10 129/1314
Janus T Large Growth 50 832/1679 39 641/1632 54 821/1512 61 798/1314
Janus Triton T* Small Growth 13 100/756 3 20/706 5 30/687 1 6/606
Janus Twenty T* Large Growth 23 376/1679 49 801/1632 45 678/1512 23 298/1314
Janus Venture T* Small Growth 30 225/756 10 67/706 6 36/687 4 24/606
Morningstar Rankings Based on Total Returns as of 06/30/2016
3 Years1 Year 5 Years 10 Years
* Closed to certain new investors.
Note:
(1) In accordance with FINRA regulations, rankings cannot be publicly disclosed for time periods of less than one year. Refer to p. 27 for additional Morningstar disclosure.
23
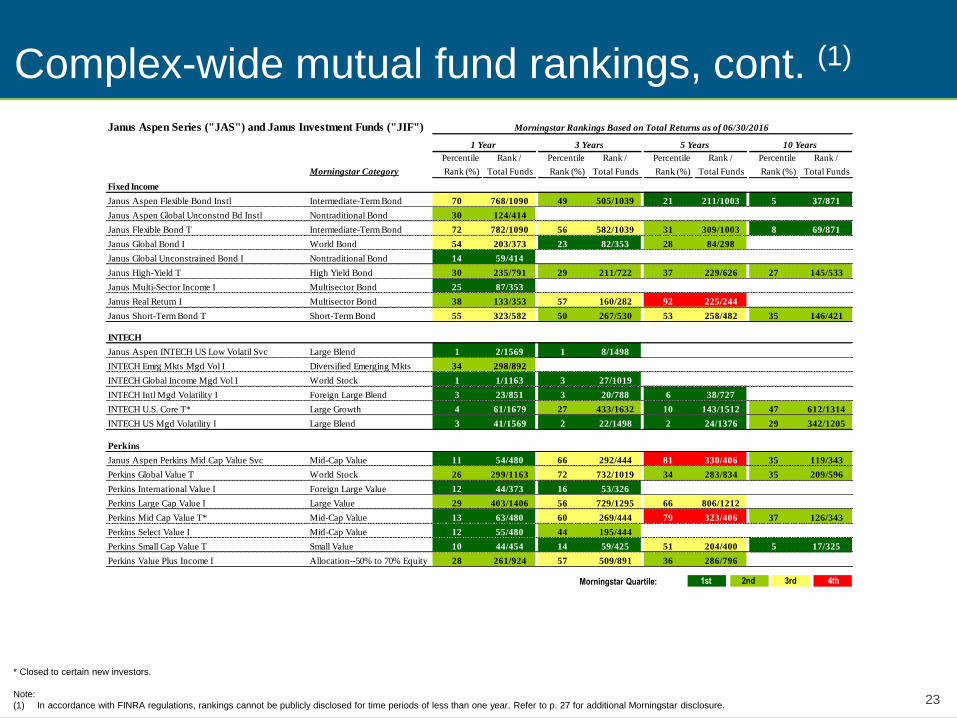
Complex-wide mutual fund rankings, cont. (1)
Morningstar Quartile: 1st 2nd 3rd 4th
* Closed to certain new investors.
Note:
(1) In accordance with FINRA regulations, rankings cannot be publicly disclosed for time periods of less than one year. Refer to p. 27 for additional Morningstar disclosure.
Janus Aspen Series ("JAS") and Janus Investment Funds ("JIF")
Percentile Rank / Percentile Rank / Percentile Rank / Percentile Rank /
Morningstar Category Rank (%) Total Funds Rank (%) Total Funds Rank (%) Total Funds Rank (%) Total Funds
Fixed Income
Janus Aspen Flexible Bond Instl Intermediate-Term Bond 70 768/1090 49 505/1039 21 211/1003 5 37/871
Janus Aspen Global Unconstnd Bd Instl Nontraditional Bond 30 124/414 / / /
Janus Flexible Bond T Intermediate-Term Bond 72 782/1090 56 582/1039 31 309/1003 8 69/871
Janus Global Bond I World Bond 54 203/373 23 82/353 28 84/298 /
Janus Global Unconstrained Bond I Nontraditional Bond 14 59/414 / / /
Janus High-Yield T High Yield Bond 30 235/791 29 211/722 37 229/626 27 145/533
Janus Multi-Sector Income I Multisector Bond 25 87/353 / / /
Janus Real Return I Multisector Bond 38 133/353 57 160/282 92 225/244 /
Janus Short-Term Bond T Short-Term Bond 55 323/582 50 267/530 53 258/482 35 146/421
INTECH
Janus Aspen INTECH US Low Volatil Svc Large Blend 1 2/1569 1 8/1498 / /
INTECH Emrg Mkts Mgd Vol I Diversified Emerging Mkts 34 298/892 / / /
INTECH Global Income Mgd Vol I World Stock 1 1/1163 3 27/1019 / /
INTECH Intl Mgd Volatility I Foreign Large Blend 3 23/851 3 20/788 6 38/727 /
INTECH U.S. Core T* Large Growth 4 61/1679 27 433/1632 10 143/1512 47 612/1314
INTECH US Mgd Volatility I Large Blend 3 41/1569 2 22/1498 2 24/1376 29 342/1205
Perkins
Janus Aspen Perkins Mid Cap Value Svc Mid-Cap Value 11 54/480 66 292/444 81 330/406 35 119/343
Perkins Global Value T World Stock 26 299/1163 72 732/1019 34 283/834 35 209/596
Perkins International Value I Foreign Large Value 12 44/373 16 53/326 /
Perkins Large Cap Value I Large Value 29 403/1406 56 729/1295 66 806/1212
Perkins Mid Cap Value T* Mid-Cap Value 13 63/480 60 269/444 79 323/406 37 126/343
Perkins Select Value I Mid-Cap Value 12 55/480 44 195/444
Perkins Small Cap Value T Small Value 10 44/454 14 59/425 51 204/400 5 17/325
Perkins Value Plus Income I Allocation--50% to 70% Equity 28 261/924 57 509/891 36 286/796
Morningstar Rankings Based on Total Returns as of 06/30/2016
1 Year 3 Years 5 Years 10 Years
24
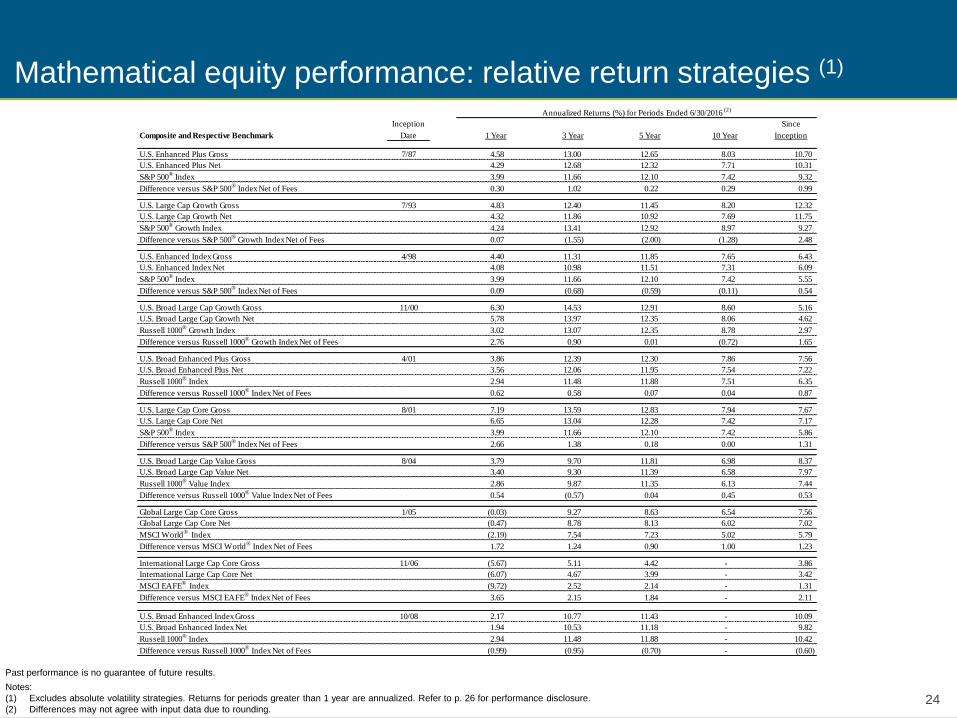
Mathematical equity performance: relative return strategies (1)
Inception Since
Composite and Respective Benchmark Date 1 Year 3 Year 5 Year 10 Year Inception
U.S. Enhanced Plus Gross 7/87 4.58 13.00 12.65 8.03 10.70
U.S. Enhanced Plus Net 4.29 12.68 12.32 7.71 10.31
S&P 500®
Index 3.99 11.66 12.10 7.42 9.32
Difference versus S&P 500®
Index Net of Fees 0.30 1.02 0.22 0.29 0.99
U.S. Large Cap Growth Gross 7/93 4.83 12.40 11.45 8.20 12.32
U.S. Large Cap Growth Net 4.32 11.86 10.92 7.69 11.75
S&P 500®
Growth Index 4.24 13.41 12.92 8.97 9.27
Difference versus S&P 500®
Growth Index Net of Fees 0.07 (1.55) (2.00) (1.28) 2.48
U.S. Enhanced Index Gross 4/98 4.40 11.31 11.85 7.65 6.43
U.S. Enhanced Index Net 4.08 10.98 11.51 7.31 6.09
S&P 500®
Index 3.99 11.66 12.10 7.42 5.55
Difference versus S&P 500®
Index Net of Fees 0.09 (0.68) (0.59) (0.11) 0.54
U.S. Broad Large Cap Growth Gross 11/00 6.30 14.53 12.91 8.60 5.16
U.S. Broad Large Cap Growth Net 5.78 13.97 12.35 8.06 4.62
Russell 1000®
Growth Index 3.02 13.07 12.35 8.78 2.97
Difference versus Russell 1000®
Growth Index Net of Fees 2.76 0.90 0.01 (0.72) 1.65
U.S. Broad Enhanced Plus Gross 4/01 3.86 12.39 12.30 7.86 7.56
U.S. Broad Enhanced Plus Net 3.56 12.06 11.95 7.54 7.22
Russell 1000®
Index 2.94 11.48 11.88 7.51 6.35
Difference versus Russell 1000®
Index Net of Fees 0.62 0.58 0.07 0.04 0.87
U.S. Large Cap Core Gross 8/01 7.19 13.59 12.83 7.94 7.67
U.S. Large Cap Core Net 6.65 13.04 12.28 7.42 7.17
S&P 500®
Index 3.99 11.66 12.10 7.42 5.86
Difference versus S&P 500®
Index Net of Fees 2.66 1.38 0.18 0.00 1.31
U.S. Broad Large Cap Value Gross 8/04 3.79 9.70 11.81 6.98 8.37
U.S. Broad Large Cap Value Net 3.40 9.30 11.39 6.58 7.97
Russell 1000®
Value Index 2.86 9.87 11.35 6.13 7.44
Difference versus Russell 1000®
Value Index Net of Fees 0.54 (0.57) 0.04 0.45 0.53
Global Large Cap Core Gross 1/05 (0.03) 9.27 8.63 6.54 7.56
Global Large Cap Core Net (0.47) 8.78 8.13 6.02 7.02
MSCI World®
Index (2.19) 7.54 7.23 5.02 5.79
Difference versus MSCI World®
Index Net of Fees 1.72 1.24 0.90 1.00 1.23
International Large Cap Core Gross 11/06 (5.67) 5.11 4.42 - 3.86
International Large Cap Core Net (6.07) 4.67 3.99 - 3.42
MSCI EAFE®
Index (9.72) 2.52 2.14 - 1.31
Difference versus MSCI EAFE®
Index Net of Fees 3.65 2.15 1.84 - 2.11
U.S. Broad Enhanced Index Gross 10/08 2.17 10.77 11.43 - 10.09
U.S. Broad Enhanced Index Net 1.94 10.53 11.18 - 9.82
Russell 1000®
Index 2.94 11.48 11.88 - 10.42
Difference versus Russell 1000®
Index Net of Fees (0.99) (0.95) (0.70) - (0.60)
Annualized Returns (%) for Periods Ended 6/30/2016 (2)
Past performance is no guarantee of future results.
Notes:
(1) Excludes absolute volatility strategies. Returns for periods greater than 1 year are annualized. Refer to p. 26 for performance disclosure.
(2) Differences may not agree with input data due to rounding.
25
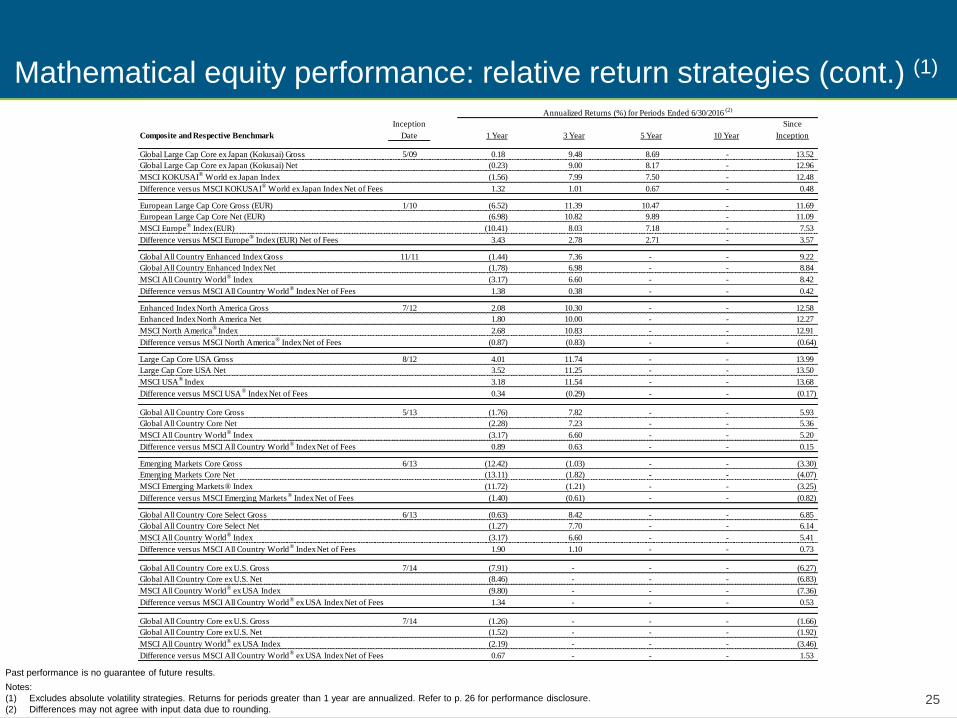
Mathematical equity performance: relative return strategies (cont.) (1)
Inception Since
Composite and Respective Benchmark Date 1 Year 3 Year 5 Year 10 Year Inception
Global Large Cap Core ex Japan (Kokusai) Gross 5/09 0.18 9.48 8.69 - 13.52
Global Large Cap Core ex Japan (Kokusai) Net (0.23) 9.00 8.17 - 12.96
MSCI KOKUSAI®
World ex Japan Index (1.56) 7.99 7.50 - 12.48
Difference versus MSCI KOKUSAI®
World ex Japan Index Net of Fees 1.32 1.01 0.67 - 0.48
European Large Cap Core Gross (EUR) 1/10 (6.52) 11.39 10.47 - 11.69
European Large Cap Core Net (EUR) (6.98) 10.82 9.89 - 11.09
MSCI Europe®
Index (EUR) (10.41) 8.03 7.18 - 7.53
Difference versus MSCI Europe®
Index (EUR) Net of Fees 3.43 2.78 2.71 - 3.57
Global All Country Enhanced Index Gross 11/11 (1.44) 7.36 - - 9.22
Global All Country Enhanced Index Net (1.78) 6.98 - - 8.84
MSCI All Country World®
Index (3.17) 6.60 - - 8.42
Difference versus MSCI All Country World®
Index Net of Fees 1.38 0.38 - - 0.42
Enhanced Index North America Gross 7/12 2.08 10.30 - - 12.58
Enhanced Index North America Net 1.80 10.00 - - 12.27
MSCI North America®
Index 2.68 10.83 - - 12.91
Difference versus MSCI North America®
Index Net of Fees (0.87) (0.83) - - (0.64)
Large Cap Core USA Gross 8/12 4.01 11.74 - - 13.99
Large Cap Core USA Net 3.52 11.25 - - 13.50
MSCI USA®
Index 3.18 11.54 - - 13.68
Difference versus MSCI USA®
Index Net of Fees 0.34 (0.29) - - (0.17)
Global All Country Core Gross 5/13 (1.76) 7.82 - - 5.93
Global All Country Core Net (2.28) 7.23 - - 5.36
MSCI All Country World®
Index (3.17) 6.60 - - 5.20
Difference versus MSCI All Country World®
Index Net of Fees 0.89 0.63 - - 0.15
Emerging Markets Core Gross 6/13 (12.42) (1.03) - - (3.30)
Emerging Markets Core Net (13.11) (1.82) - - (4.07)
MSCI Emerging Markets® Index (11.72) (1.21) - - (3.25)
Difference versus MSCI Emerging Markets®
Index Net of Fees (1.40) (0.61) - - (0.82)
Global All Country Core Select Gross 6/13 (0.63) 8.42 - - 6.85
Global All Country Core Select Net (1.27) 7.70 - - 6.14
MSCI All Country World®
Index (3.17) 6.60 - - 5.41
Difference versus MSCI All Country World®
Index Net of Fees 1.90 1.10 - - 0.73
Global All Country Core ex U.S. Gross 7/14 (7.91) - - - (6.27)
Global All Country Core ex U.S. Net (8.46) - - - (6.83)
MSCI All Country World®
ex USA Index (9.80) - - - (7.36)
Difference versus MSCI All Country World®
ex USA Index Net of Fees 1.34 - - - 0.53
Global All Country Core ex U.S. Gross 7/14 (1.26) - - - (1.66)
Global All Country Core ex U.S. Net (1.52) - - - (1.92)
MSCI All Country World®
ex USA Index (2.19) - - - (3.46)
Difference versus MSCI All Country World®
ex USA Index Net of Fees 0.67 - - - 1.53
Annualized Returns (%) for Periods Ended 6/30/2016 (2)
Past performance is no guarantee of future results.
Notes:
(1) Excludes absolute volatility strategies. Returns for periods greater than 1 year are annualized. Refer to p. 26 for performance disclosure.
(2) Differences may not agree with input data due to rounding.
26
Mathematical equity performance disclosure For the period ending June 30, 2016, 100%, 100%, 100% and 83% of the mathematical equity mutual funds were beating their benchmarks on a 1-, 3-, 5-year and since-fund inception basis. Funds
included in the analysis and their inception dates are: INTECH U.S. Core Fund – Class T (2/03); INTECH U.S. Managed Volatility Fund – Class I (12/05); INTECH International Managed Volatility
Fund – Class I (5/07), INTECH Global Income Managed Volatility Fund – Class I (12/11), Janus Aspen INTECH U.S. Low Volatility Portfolio – Service Shares (9/12) and INTECH Emerging Markets
Managed Volatility Fund – Class I (12/14).
INTECH's focus on managed volatility may keep the Fund from achieving excess returns over its index. The strategy may underperform during certain periods of up markets and may
not achieve the desired level of protection in down markets.
The proprietary mathematical process used by INTECH may not achieve the desired results. Since the portfolios are regularly re-balanced, this may result in a higher portfolio turnover
rate, higher expenses and potentially higher net taxable gains or losses compared to a "buy and hold" or index fund strategy. Past performance cannot guarantee future results.
Investing involves risk, including the possible loss of principal and fluctuation of value.
Performance results reflect the reinvestment of dividends and other earnings. Composite performance results shown are time-weighted rates of return using daily valuation, include the effect of
transaction costs (commissions, exchange fees, etc.), and are gross of non-reclaimable withholding taxes, if any. The composites include all actual fee-paying accounts managed on a fully
discretionary basis according to the investment strategy from inception date, including those no longer under management. Portfolios meeting such criteria enter the composite upon the full first
month under management. Reporting currency is USD, unless otherwise noted.
The gross performance results presented do not reflect the deduction of investment advisory fees. Returns will be reduced by such advisory fees and other contractual expenses as described in
each client’s individual contract.
The net performance results presented reflect the deduction of model investment advisory fees, and not the advisory fees actually charged to the accounts in the composite. Prior to December 31, 2004, the model advisory fees deducted reflect the maximum fixed fee in effect for each strategy. Beginning January 1, 2005, the model advisory fees deducted reflect the standard fee schedule in effect during the period shown, applied to each account in the composite on a monthly basis. Standard fee schedules are available upon request. Actual advisory fees paid may vary among clients invested in the same strategy, which may be higher or lower than the model advisory fees. Some accounts may utilize a performance-based fee.
For U.S. Large Cap Growth from inception to 12/31/05, the composite’s benchmark was the S&P 500/Barra Growth Index (“Barra Growth Index”). In 2005, S&P announced index name and methodology changes affecting the Barra Growth Index, which later became the S&P 500/Citigroup Growth Index (“Citigroup Growth Index”). During the transitional period, from 1/1/06 to 3/31/06, the benchmark return consisted partially of the return of the Barra Growth Index and the Citigroup Growth Index. On 4/1/06, the composite’s benchmark was changed to the Citigroup Growth Index. Effective 12/9/2009, the Citigroup Growth Index's name was changed to S&P 500 Growth Index.
The S&P 500 Growth Index is a market-capitalization-weighted index developed by Standard and Poor's consisting of those stocks within the S&P 500 Index that exhibit strong growth characteristics. The index measures the performance of the growth style of investing in large cap U.S. stocks. The S&P 500 Growth Index will be reconstituted annually.
Prior to May 21, 2010, with respect to non-U.S. securities traded on non-U.S. exchanges, INTECH used fair value prices that reflected current market conditions at the end of regular trading hours of the NYSE, normally 4:00 PM ET, rather than unadjusted closing prices in local markets. Therefore, the prices as well as foreign exchange rates used to calculate the U.S. dollar market values of securities may have differed from those used by an index. Indices generally use the unadjusted closing price in local markets instead of fair value pricing. As of May 21, 2010, prices for non-U.S. securities traded on non-U.S. exchanges are typically valued as of the close of their respective local markets. However, if a significant event takes place between the close of the local market and the close of the U.S. domestic market, a security may be fair valued. Non U.S. securities are translated into U.S. dollars using the 4:00 P.M. London spot rate.
With respect to European Large Cap Core, prices assigned to investments are published prices on their primary markets or exchanges since the composite’s inception.
The returns for the indices shown do not include any transaction costs, management fees or other costs, and are gross of dividend tax withholdings.
Mathematical equity strategies included in the investment performance summaries include those strategies with at least a 1-year track record. Absolute volatility strategies are excluded.
MSCI makes no express or implied warranties or representations and shall have no liability whatsoever with respect to any MSCI data contained herein. The MSCI data may not be further redistributed or used as a basis for other indices or any securities or financial products This report has not been approved, reviewed or produced by MSCI.

27
Other important disclosures Data presented reflects past performance, which is no guarantee of future results. Due to market volatility, current performance may be higher or lower than the performance shown. Call
877.33JANUS (52687) or visit janus.com/advisor/mutual-funds for performance, rankings and ratings current to the most recent month-end.
Janus Capital Group Inc. (“JCG”) provides investment advisory services through its primary subsidiaries, Janus Capital Management LLC (“Janus”), INTECH Investment Management LLC (“INTECH”) and
Perkins Investment Management LLC (“Perkins”).
“Complex-Wide Mutual Funds” means all affiliated mutual funds managed by Janus, INTECH and Perkins. “Fundamental Equity Mutual Funds” means all mutual funds managed by Janus or Perkins that invest in
equity securities. “Fixed Income Mutual Funds” means all mutual funds managed by Janus that invest primarily in fixed income securities. “Mathematical Equity Strategies” means all relative return, discretionary
managed accounts (not mutual funds) that are advised or sub-advised by INTECH.
Mutual fund relative performance analysis shown is for each Fund's parent share class (typically the share class with the longest performance history): Class T, S or I Shares in the Janus retail fund (“JIF”) trust
and the Institutional or Service Shares in the Janus Aspen Series (“JAS”). These share classes may not be eligible for purchase by all investors. Other share classes may have higher sales and management
fees, which can result in differences in performance.
Morningstar Comparative Performance
Morningstar performance on an asset-weighted basis is calculated by taking all funds and assigning the assets under management ("AUM") in each respective fund to either the 1st, 2nd, 3rd or 4th quartile
bucket based on each fund's respective Morningstar relative ranking. The total AUM of each quartile’s bucket is then divided by complex-wide total AUM to arrive at the respective percent of AUM in each bucket.
The Morningstar percentile ranking is based on the fund’s total-return percentile rank relative to all funds that have the same category for the same time period. The highest (or most favorable) percentile rank is
1%, and the lowest (or least favorable) percentile rank is 100%. Morningstar total-return includes both income and capital gains or losses and is not adjusted for sales charges. The top-performing funds in a
category will always receive a rank of 1.
For the 1-, 3-, 5- and 10-year periods ending June 30, 2016, 67%, 72%, 67% and 80% of the 55, 50, 43 and 35 Complex-Wide mutual funds; 65%, 69%, 65% and 76% of the 40, 39, 34 and 29 Fundamental
Equity mutual funds; 56%, 67%, 67% and 100% of the 9, 6, 6 and 4 Fixed Income mutual funds outperformed the majority of their Morningstar peers based on total returns.
On an asset-weighted basis, 81% of the Complex-Wide mutual fund assets, 77% of the Fundamental Equity mutual fund assets and 100% of the Fixed Income mutual fund assets outperformed the majority of
their Morningstar peers based on total returns for the 10-year period.
The Overall Morningstar RatingTM for a fund is derived from a weighted-average of the performance figures associated with its three-, five- and ten-year (if applicable) Morningstar RatingTM metrics.
For each fund with at least a three-year history, Morningstar calculates a Morningstar RatingTM based on a Morningstar Risk-Adjusted Return measure that accounts for variation in a fund’s monthly performance
(including the effects of sales charges, loads, and redemption fees), placing more emphasis on downward variations and rewarding consistent performance. The top 10% of the funds in each category receive 5
stars, the next 22.5% receive 4 stars, the next 35% receive 3 stars, the next 22.5% receive 2 stars and the bottom 10% receive 1 star. (Each share class is counted as a fraction of one fund within this scale and
rated separately, which may cause slight variations in the distribution percentages.) The Morningstar RatingTM may differ among share classes of a mutual fund as a result of different sales loads and/or expense
structures. It may be based, in part, on the performance of a predecessor fund. Morningstar does not rate funds with less than a 3-year performance history.
For the period ending June 30, 2016, 54%, 58% and 57% of Complex-Wide mutual funds had a 4- or 5-star Morningstar rating for the 3-, 5- and 10-year periods based on risk-adjusted returns for 50, 43 and 35
funds, respectively. 50 funds were included in the analysis for the Overall period.
Investing involves risk, including the possible loss of principal. The value of your investment will fluctuate over time and you may gain or lose money. A fund’s performance may be affected by
risks that include those associated with non-diversification, non-investment grade debt securities, high-yield/high-risk securities, undervalued or overlooked companies, investments in specific
industries or countries and potential conflicts of interest. Additional risks to funds may include those associated with investing in foreign securities, emerging markets, initial public offerings, real
estate investment trusts (REITs), derivatives, short sales, commodity linked Investments and companies with relatively small market capitalizations. Each fund has different risks, please see a
Janus prospectus for more information about risks, fund holdings and other details.
28
Other important disclosures Indexes are not available for direct investment; therefore, their performance does not reflect the expenses associated with the active management of an actual portfolio. Russell 1000® Growth Index measures the performance of those Russell 1000 companies with higher price-to-book ratios and higher forecasted growth values. Russell 1000® Value Index measures the performance of those Russell 1000 companies with lower price-to-book ratios and lower forecasted growth values. Russell Midcap® Value Index measures the performance of those Russell Midcap® companies with lower price-to-book ratios and lower forecasted growth rates. Russell 2000® Value Index measures the performance of those Russell 2000® companies with lower price-to-book ratios and lower forecasted growth values. S&P 500® Index is a commonly recognized, market capitalization weighted index of 500 widely held equity securities, designed to measure broad U.S. equity performance. MSCI World IndexSM is a market capitalization weighted index composed of companies representative of the market structure of Developed Market countries in North America, Europe and the Asia/Pacific Region. MSCI EAFE® Index is a market capitalization weighted index composed of companies representative of the market structure of Developed Market countries in Europe, Australasia and the Far East. MSCI World Growth Index is a subset of the Morgan Stanley Capital WorldSM Index which is a market capitalization weighted index composed of companies representative of the market structure of developed market countries around the world. The index includes reinvestment of dividends, net of foreign withholding taxes. MSCI All Country World Index is a free float-adjusted market capitalization weighted index that is designed to measure performance of global developed and emerging equity markets. MSCI All Country World ex USA IndexSM is an unmanaged, free float-adjusted, market capitalization weighted index composed of stocks of companies located in countries throughout the world, excluding the United States. It is designed to measure equity market performance in global developed and emerging markets outside the United States. The index includes reinvestment of dividends, net of foreign withholding taxes. Russell 1000 Index measures performance of the 1,000 largest companies in the Russell 3000 Index. Core Growth Index is an internally calculated, hypothetical combination of unmanaged indices that combines total returns from the Russell 1000® Growth Index (50%) and the S&P 500® Index (50%). MSCI USA Index is a free float-adjusted market capitalization index that is designed to measure large and mid cap U.S. equity market performance. MSCI World ex Australia Index is a free float-adjusted market capitalization weighted index that is designed to measure the equity market performance of developed markets excluding Australia. MSCI KOKUSAI World ex Japan Index is a free float-adjusted market capitalization index that is designed to measure the equity market performance of developed markets excluding Japan. MSCI Europe Index is a free float-adjusted market capitalization weighted index that is designed to measure the equity market performance of the developed markets in Europe. MSCI North America Index is a free float-adjusted market capitalization-weighted index that is designed to measure the performance of the developed equity markets in Canada and the United States. MSCI Emerging Markets Index is a free float-adjusted market capitalization index that is designed to measure equity market performance in the global emerging markets.
Please consider the charges, risks, expenses and investment objectives carefully before investing. For a prospectus or, if available, a summary prospectus containing this and other information, please call Janus at 1-800-525-3713 or download the file from www.janus.com. Read it carefully before you invest or send money.
Funds distributed by Janus Distributors LLC. C-0716-3276 10-15-16
29
Safe harbor statement
This presentation includes statements concerning potential future events involving Janus Capital
Group Inc. that could differ materially from the events that actually occur. The differences could
be caused by a number of factors including those factors identified in Janus’ Annual Report on
Form 10-K for the year ended December 31, 2015, on file with the Securities and Exchange
Commission (Commission file no. 001-15253), including those that appear under headings such
as “Risk Factors” and “Management’s Discussion and Analysis of Financial Condition and
Results of Operations.” Many of these factors are beyond the control of the company and its
management. Any forward-looking statements contained in this presentation are as of the date
on which such statements were made. The company assumes no duty to update them, even if
experience, unexpected events, or future changes make it clear that any projected results
expressed or implied therein will not be realized.