second quarter 2018 business confidence is steady for q2 2018
TRANSCRIPT

Business Expectations Survey 1
Second Quarter 2018
A quarterly survey conducted by the Department of Economic Statistics
Bangko Sentral ng Pilipinas Manila, Philippines
www.bsp.gov.ph
Page 1 of 7
Business Confidence is Steady for Q2 2018
Overall Business Outlook on the Macroeconomy1
Overall Business Confidence Index
Q1 2013 – Q2 2018
43.0
39.5 39.342.7
47.8
40.4
0
10
20
30
40
50
60
70
Q1
2013
Q2 Q3 Q4 Q1
2014
Q2 Q3 Q4 Q1
2015
Q2 Q3 Q4 Q1
2016
Q2 Q3 Q4 Q1
2017
Q2 Q3 Q4 Q1
2018
Q2
Current Quarter
Next Quarter
Business
confidence is
steady for
Q2 2018.
Business optimism on the economy was steady for Q2 2018, with the overall confidence index
(CI)2 declining slightly to 39.3 percent from 39.5 percent for Q1 2018. This means that the
optimists continued to outnumber the pessimists but the margin was almost unchanged from
that of a quarter ago. Specifically, respondents with steady outlook noted that sustained
demand and ongoing market adjustments as a result of the recently enacted Tax Reform for
Acceleration and Inclusion (TRAIN)3 Law were to be expected for the current quarter. Outlook
remained optimistic due to the (a) usual higher demand during summer (given the expected
arrival of local and foreign tourists), enrolment and harvest periods, (b) increase in orders and
volume of production, (c) ongoing rollout of government infrastructure projects with the
“Build, Build, Build” strategy of the administration, (d) positive view on the TRAIN Law as its
revenue is expected to support infrastructure projects of the government, which may attract
new investments, (e) expansion of businesses and new product lines, and (f) sound
macroeconomic conditions. However, there was a slight dent on optimism caused by
expectations of higher consumer prices, partly due to oil price hikes, and peso depreciation.
The sentiment of businesses in the Philippines mirrored the steady business outlook in China,
Chile, Mexico, Germany and the Euro Area. Meanwhile, a less optimistic outlook was
1 The Business Expectations Survey (BES) is a quarterly survey of firms drawn at random from the combined list of the Securities and
Exchange Commission’s Top 7,000 Corporations in 2010 and Business World’s Top 1,000 Corporations in 2016. Results of the BES
provide advance indication of the direction of the change in overall business activity in the economy and in the various measures of
companies’ operations as well as in selected economic indicators. 2 The CI is computed as the percentage of firms that answered in the affirmative less the percentage of firms that answered in the
negative with respect to their views on a given indicator. A positive CI indicates a favorable view, except for the inflation rate and the
peso-borrowing rate, where a positive CI indicates the opposite. 3 The TRAIN Law was signed on 19 December 2017. The package consists of a reduction in personal income taxes, higher excise tax on
petroleum products and coal, higher automobile tax, higher tax on sugar-sweetened beverages, VAT-base expansion, uniform donor
and estate tax, higher excise tax on non-metallic minerals and quarry resources, adjustment in the excise tax of tobacco products,
doubled documentary stamp tax rates on documents, instruments, loan agreements and papers, higher final tax on foreign currency
deposit units and excise tax on cosmetic procedures (Inflation Report 4th
Quarter 2017, Bangko Sentral ng Pilipinas).

Business Expectations Survey Second Quarter 2018
A quarterly survey conducted by the Department of Economic Statistics
Bangko Sentral ng Pilipinas Manila, Philippines
www.bsp.gov.ph
Page 2 of 7
registered by businesses in the United States, France, the Netherlands and Thailand, while
more buoyant views were reported by those in Canada, Hong Kong SAR and South Korea.
For the quarter ahead (Q3 2018), business outlook was less positive. The next quarter CI, at
40.4 percent, was lower than the 47.8 percent in the previous quarter’s survey. Respondents
cited the following factors as reasons behind their lower business confidence: (a) interruption
of business activities during the rainy season, (b) lower consumer demand as households
prioritized enrolment expenses, and (c) expectations of higher commodity prices.
Business
outlook is
more
buoyant in
the AONCR
but less
optimistic in
NCR for the
current
quarter.
By area, the slight decline in overall business confidence for Q2 2018 was traced to the less
favorable business sentiment in the National Capital Region (NCR) (partly due to higher prices
of inputs, e.g., electricity and fuel, and stiffer competition), which more than offset the more
positive outlook of firms in Areas Outside NCR (AONCR).4 Consistent with the overall trend,
businesses in both NCR and AONCR were less optimistic for the next quarter.
Across regions, the outlook was generally favorable for the current quarter. For Q2 2018, the
outlook of firms in Region II was steady. Respondents in nine regions (I, III, V, VII, VIII, IX, X, XI
and XII) were more bullish due to the following: (a) increase in consumer demand and tourist
receipts during summer, enrolment and fiesta seasons, (b) availability of new projects,
(c) business expansion, (d) enhanced business strategies and new product lines, (e) positive
impact of the comprehensive tax reform law on household disposable income, (f) increase in
government spending, and (g) favorable business conditions. Meanwhile, the outlook in
Regions IV and VI was less upbeat. Respondents attributed their less optimistic outlook to
expectations of higher commodity prices, lack of supply of raw materials (e.g., corn, fish),
decline in production and sales with the ongoing export ban for poultry products (in Region IV),
and lower revenues from tourism following the closure of Boracay (in Region VI).
For the quarter ahead (Q3 2018), business confidence was broadly less favorable across
regions as more firms anticipated the seasonal slack in demand during the rainy season. This is
with the exception of firms in Regions IX and XI whose outlook improved due to the expected
commencement of new projects (mostly construction), improved weather forecast, and influx
of tourists during the Kadayawan Festival in August (in Region XI).
The outlook
of trading
firms turns
more upbeat
for Q2 2018.
The outlook of businesses involved in international commodity trading turned more buoyant
for Q2 2018. Among business types, exporters were the most bullish on account of better
prices of export commodities in the world market (particularly metal for the mining industry),
increasing orders from abroad, and anticipated increase in volume of production
(e.g., agricultural products) with the ongoing infrastructure development as well as expected
uptick in investments as an offshoot of the TRAIN Law. Likewise, importers and
domestic-oriented firms were more optimistic as they expected that economic growth would
be driven by robust consumer demand (arising from seasonal factors during summer as well as
the anticipated higher levels of household disposable income as the TRAIN Law takes effect)
and expected gains from enhanced marketing strategies and business processes. The outlook
of dual-activity (both importer and exporter) firms was also more favorable as firms benefited
from expectations of increasing volume of sales/orders, business expansion, introduction of
new product lines, and brisker business conditions.
4 The survey covered all 16 regions of the Philippines. (For the list of regions and the distribution of top 7000 corporations by region,
please see Annexes A and B).

Business Expectations Survey Second Quarter 2018
A quarterly survey conducted by the Department of Economic Statistics
Bangko Sentral ng Pilipinas Manila, Philippines
www.bsp.gov.ph
Page 3 of 7
The outlook
of large firms
follows the
the national
trend for
Q2 2018.
For the quarter ahead (Q3 2018), the outlook of firms across trade groups was mixed.
Exporters and dual-activity firms anticipated that the volume of production and orders would
be sustained for the next quarter, resulting in a steady outlook. Meanwhile, importers and
domestic-oriented firms were less optimistic as they noted that their operations could be
adversely affected by the seasonal slack in domestic demand, stiffer competition, rising fuel
prices, and possible foreign exchange losses due to the peso depreciation.
Business sentiment was generally more positive across employment size for
Q2 2018.5 The outlook of large-sized firms was broadly steady, following the national trend.
Meanwhile, the sentiment of small- and medium-sized firms was more favorable. For the next
quarter (Q3 2018), business confidence waned across employment size.
Sectoral Outlook
Current Quarter Business Outlook Index by Sector
Q1 2013 – Q2 2018
29.4
Industry Sector
38.8
39.0 41.1
Construction Sector
41.2
29.8
42.0
0
10
20
30
40
50
60
70
Q12013
Q2 Q3 Q4 Q12014
Q2 Q3 Q4 Q12015
Q2 Q3 Q4 Q12016
Q2 Q3 Q4 Q12017
Q2 Q3 Q4 Q12018
Q2
42.631.0
34.1
Services Sector
47.8 50.6
42.4
0
10
20
30
40
50
60
70
Q12013
Q2 Q3 Q4 Q12014
Q2 Q3 Q4 Q12015
Q2 Q3 Q4 Q12016
Q2 Q3 Q4 Q12017
Q2 Q3 Q4 Q12018
Q2
Wholesale and Retail Trade Sector
5 Small firms have less than 100 employees; medium firms, 100-499 employees; large firms have over 500 employees.

Business Expectations Survey Second Quarter 2018
A quarterly survey conducted by the Department of Economic Statistics
Bangko Sentral ng Pilipinas Manila, Philippines
www.bsp.gov.ph
Page 4 of 7
The less
favorable
sentiment of
the services
sector weighs
down overall
business
confidence.
Business sentiment for Q2 2018 was generally upbeat across sectors (i.e., construction,
industry, and wholesale and retail trade sectors), except for the services sector whose views
were less positive. For the next quarter (Q3 2018), the outlook across sectors was less buoyant.
Construction firms’ bullish outlook for Q2 2018 was on account of the award of new
construction projects (both public and private) for 2018 and better business environment.
Business confidence across industry sub-sectors (i.e., mining and quarrying, manufacturing,
and agriculture, fishery and forestry) was broadly more positive, except that of the electricity,
gas and water sub-sector, which was less favorable. Respondents attributed their optimism to
anticipation of more robust demand, business expansion and enhancement of marketing
strategies during the current quarter.
The improved outlook of the wholesale and retail trade sector for Q2 2018 was due to
expectations of a brisker domestic economy. This is on the back of the seasonal uptick in
demand during summer, enrolment, and harvest seasons, stronger business activity over the
course of the campaign period for the barangay elections, and expected increase in purchasing
power of consumers with the implementation of the TRAIN Law.
Meanwhile, the less optimistic outlook of the services sector for the current quarter stemmed
from concerns over a weaker peso and higher commodity costs (particularly fuel) in the global
economy.
Business Outlook on Own Operations
Current Quarter Business Activity Index by Sector
Q1 2013 – Q2 2018
Industry Sector
37.9
32.3
44.3
Construction Sector
32.8
35.1
25.9
0
10
20
30
40
50
60
70
Q1
2013
Q2 Q3 Q4 Q1
2014
Q2 Q3 Q4 Q1
2015
Q2 Q3 Q4 Q1
2016
Q2 Q3 Q4 Q1
2017
Q2 Q3 Q4 Q1
2018
Q2
30.0
15.5
36.3
Services Sector
39.1
41.439.4
0
10
20
30
40
50
60
70
Q1
2013
Q2 Q3 Q4 Q1
2014
Q2 Q3 Q4 Q1
2015
Q2 Q3 Q4 Q1
2016
Q2 Q3 Q4 Q1
2017
Q2 Q3 Q4 Q1
2018
Q2
Wholesale and Retail Trade Sector
Revised Page, Item No. 16
31 May 2018 MB Meeting

Business Expectations Survey Second Quarter 2018
A quarterly survey conducted by the Department of Economic Statistics
Bangko Sentral ng Pilipinas Manila, Philippines
www.bsp.gov.ph
Page 5 of 7
Firms are
more upbeat
about their
own business
operations.
The outlook of firms about their own business operations improved for Q2 2018 compared to
that a quarter ago. The outlook of firms on the volume of business activity and total orders
booked was more upbeat, particularly for the industry and wholesale and retail trade sectors.
For the next quarter (Q3 2018), the outlook on volume of business activity was less positive
across sectors.
Average Capacity Utilization
Capacity
utilization
improves.
The average capacity utilization (in the industry and construction sectors) for Q2 2018 was
slightly higher at 74.8 percent (from 74.3 percent in Q1 2018). Likewise, the results of the
Monthly Integrated Survey of Selected Industries (MISSI) of the Philippine Statistics Authority
(PSA) indicated an increase in the level of capacity utilization in Q1 2018 compared to that of
the previous quarter.6
Financial Conditions and Access to Credit7
Firms expect
tighter
financial
conditions
but easy
access to
credit.
The financial conditions index remained in negative territory at -4.8 percent for Q2 2018 from
-4.6 percent in the previous quarter. This means that firms that expected tighter financial
conditions continued to outnumber those that said otherwise. However, firms were of the
view that their financing requirements could be met through available credit as more
respondents reported easy access to credit although the number that said so declined relative
to a quarter ago. The results of the Q1 2018 Senior Bank Loan Officers’ Survey (SLOS) showed
that most of respondent banks continued to maintain their credit standards for loans to both
enterprises and households for the 36th
consecutive quarter since Q2 2009.
Employment and Expansion Plans
Employment
outlook
remains
positive,
while
expansion
plans slightly
decline.
The employment outlook index for the next quarter remained positive across sectors although
lower compared to a quarter ago. This suggests that more firms will continue to hire new
employees than those that indicated otherwise, although the number of new hires could be
lower compared to the previous quarter’s survey. Likewise, the percentage of businesses with
expansion plans in the industry sector for the next quarter edged lower to 34.2 percent from
35.1 percent in the previous quarter. Among sub-sectors, agriculture, fishery and forestry,
mining and quarrying, and manufacturing recorded stronger expansion plans, while those of
electricity, gas and water were slightly lower from a quarter ago.
6 The average capacity utilization of the BES used sample firms from the industry and construction sectors, while that of the MISSI was
based on a sample of large manufacturing firms. The average capacity utilization of the MISSI was higher at 84.2 percent in Q1 2018
compared to 83.9 percent in Q4 2017. 7 Financial conditions refer to the firm’s general cash position, taking into account the level of cash and other cash items and
repayments terms on loans. Access to credit refers to the environment external to the firm, such as the availability of credit from the
banking system and other financial institutions.

Business Expectations Survey Second Quarter 2018
A quarterly survey conducted by the Department of Economic Statistics
Bangko Sentral ng Pilipinas Manila, Philippines
www.bsp.gov.ph
Page 6 of 7
Business Constraints
Domestic
competition
and
insufficient
demand are
the major
risks to
business.
The major business constraints identified by respondents for Q2 2018 were domestic
competition and insufficient demand leading to low sales volume (indicated by 55.2 percent
and 25.2 percent of the total number of respondents, respectively).
Expectations on Key Economic Indicators8
Firms expect
inflation to
increase,
peso to
depreciate
and interest
rates to go
up.
The survey results showed that businesses anticipated inflation to increase but to remain
within target, peso to depreciate, and interest rates to go up for the current quarter and the
next quarter.
Respondents who expected inflation to go up continued to outnumber those who held the
opposite view for Q2 and Q3 2018. Inflationary expectations eased for the next quarter as the
number of respondents who indicated higher inflation declined relative to the previous
quarter’s survey results. Businesses anticipated the rate of increase in prices of consumer
goods and services to stay within the government’s 2 to 4 percent inflation target range for
2018, at 3.8 percent for both Q2 and Q3 2018 (albeit higher from the previous quarter’s survey
results).9
Respondents also anticipated the peso to depreciate for Q2 2018 and Q3 2018. Meanwhile,
the percentage of respondents who expected higher interest rates increased for the current
quarter but decreased for the next quarter compared to those in the previous quarter’s survey.
8 The expectations on key economic indicators are expressed in terms of confidence indices (CIs), which are computed as the
percentage of firms that answered “up” less the percentage of firms that answered “down” with respect to their views on a given key
economic indicator. A positive CI indicates a favorable view, except for the inflation rate and the peso-borrowing rate, where a positive
CI indicates the opposite. 9 Effective 6 March 2018, the Philippine Statistics Authority (PSA) changed the base year of the Consumer Price Index (CPI) from 2006 to
2012. Beginning Q2 2018, the basis of BES respondents’ inflation estimates for the current quarter and next quarter is 2012=100.

Business Expectations Survey Second Quarter 2018
A quarterly survey conducted by the Department of Economic Statistics
Bangko Sentral ng Pilipinas Manila, Philippines
www.bsp.gov.ph
Page 7 of 7
About the Survey
Survey
response
rate is
83.5
percent.
The Q2 2018 BES was conducted during the period 2 April – 22 May 2018. There were
1,466 firms surveyed nationwide. Respondents were drawn from the combined list of the
Securities and Exchange Commission’s Top 7,000 Corporations in 2010 and Business World’s
Top 1,000 Corporations in 2016, consisting of 583 companies in NCR and 883 firms in AONCR,
covering all 16 regions nationwide. The survey response rate for this quarter was higher at
83.5 percent (from 82.3 percent in the previous quarter). The response rate was higher for
both NCR at 80.4 percent (from 80 percent in the previous quarter) and AONCR at 85.5 percent
(compared to 83.8 percent in the previous quarter).
A breakdown of responses by type of business showed that 12 percent were importers,
6.1 percent were exporters, 17.1 percent were both importers and exporters and 58.3 percent
were domestic-oriented. About 6.5 percent of the respondents did not specify their firm type.
By size of employment, the survey showed that 22.2 percent of respondents were large firms,
39.7 percent were medium-sized and 31 percent were small-sized. About 7.1 percent of the
respondents did not specify the number of employees in their company.
The BES sample was derived through stratified random sampling. The combined list of top
corporations was subdivided into 192 strata classified by region—NCR and Areas Outside NCR
(the other 15 regions of the country)—and by industry sub-group, namely: (a) Group 1:
Industry, which consists of manufacturing, mining and quarrying, electricity, gas and water,
and agriculture, fishery and forestry; (b) Group II: Construction; (c) Group III: Services, which
consists of financial intermediation, real estate, renting and business activities, hotels and
restaurants, transport, storage and communications and community, social and personal
services; and (d) Group IV: Wholesale and Retail Trade. Beginning Q1 2012, industry
classification of companies shifted from the 1994 Philippine Standard Industrial Classification
(PSIC) to the 2009 PSIC.

BUSINESS EXPECTATIONS SURVEY 2013 - 2018
Q1 Q2 Q3 Q4 Q1 Q2 Q3 Q4 Q1 Q2 Q3 Q4 Q1 Q2 Q3 Q4 Q1 Q2 Q3 Q4 Q1 Q2
Confidence Index: All Sectors
Current Quarter 41.5 54.9 42.8 52.3 37.8 50.7 34.4 48.3 45.2 49.2 41.4 51.3 41.9 48.7 45.4 39.8 39.4 43.0 37.9 43.3 39.5 39.3
NCR 45.6 60.6 49.9 58.7 40.6 53.4 37.5 49.8 47.3 52.3 45.7 55.2 44.3 53.2 48.1 38.0 40.8 43.8 37.0 44.2 41.1 37.3
AONCR 34.5 45.1 30.7 41.5 33.0 46.1 29.1 45.8 41.5 43.9 33.9 44.3 37.5 40.8 40.5 42.9 36.9 41.7 39.7 41.8 36.7 43.0
Next Quarter 56.4 46.2 60.0 40.7 50.8 48.9 52.9 43.1 58.2 47.3 53.1 43.9 49.6 45.3 56.8 34.5 47.2 42.7 51.3 39.7 47.8 40.4
NCR 60.9 47.8 68.3 42.3 52.7 51.4 56.8 44.1 61.3 50.0 54.5 44.3 48.5 48.8 58.4 33.0 47.8 42.6 52.2 40.1 47.9 39.5
AONCR 48.8 43.4 45.8 38.1 47.3 44.5 46.2 41.4 52.7 42.5 50.8 43.2 51.4 39.1 54.2 37.2 46.3 42.9 49.7 39.2 47.7 41.9
Industry Sector 29.4 47.1 43.0 41.7 34.3 46.5 30.1 31.8 35.7 41.3 29.4 35.3 37.5 44.1 40.8 34.2 41.9 38.8 40.3 33.2 39.0 41.1
Construction Sector 50.5 60.2 41.9 49.6 46.1 60.2 42.3 47.1 56.1 63.2 49.3 49.3 49.3 37.5 41.9 26.2 35.7 41.2 32.8 22.3 29.8 42.0
Wholesale and Retail Trade 41.7 54.1 36.4 59.4 31.9 46.6 31.6 56.1 44.3 49.2 46.7 59.9 38.5 51.9 45.7 42.8 36.6 42.6 32.9 50.1 31.0 34.1
Services Sector 52.0 62.7 50.3 55.0 47.1 58.4 41.0 56.0 54.2 55.2 46.0 57.6 48.0 52.3 50.0 44.9 40.6 47.8 42.0 50.6 50.6 42.4
of which:
Financial Intermediation 81.3 89.4 61.0 76.7 47.4 63.5 51.5 72.9 74.5 72.8 41.6 63.8 45.9 64.4 62.0 44.0 43.6 58.0 50.1 57.0 67.9 41.8
Hotels and Restaurants 41.8 58.9 37.4 79.6 51.6 38.4 8.7 72.3 52.8 31.5 32.2 83.4 57.3 59.3 27.6 46.0 33.2 44.0 13.0 73.0 41.2 19.4
Business Activities 43.7 64.7 43.0 44.8 50.2 59.0 39.1 38.7 35.7 45.7 52.2 45.2 35.4 40.3 44.7 42.1 38.5 49.0 42.1 43.7 48.2 37.0
Real Estate 64.4 68.6 60.4 56.3 52.1 64.2 43.8 66.7 57.6 54.7 46.8 57.4 56.5 57.6 60.2 46.0 38.1 41.3 46.7 57.1 44.8 44.0
Community and Social Services 36.4 46.5 49.3 34.3 42.8 51.7 48.0 45.7 51.7 41.7 40.5 55.9 48.9 54.1 51.8 43.6 41.3 18.3 29.5 38.4 52.0 50.9
Transportation 34.4 33.2 47.6 43.8 37.0 60.8 41.1 51.6 58.3 70.3 52.0 57.6 60.2 49.5 46.1 50.3 47.0 56.9 49.2 43.1 43.1 59.9
Industry Sector 53.8 39.7 48.2 31.7 47.5 39.9 39.9 33.6 51.5 42.4 36.0 35.9 48.7 43.5 48.6 35.9 47.8 39.6 42.4 31.2 47.1 43.2
Construction Sector 43.9 56.2 58.5 56.3 52.4 63.9 53.3 52.2 54.2 55.4 56.2 52.6 49.8 44.0 39.6 55.3 39.2 37.5 46.1 59.7 49.1 37.7
Wholesale and Retail Trade 57.1 40.2 66.9 41.5 47.9 51.5 60.2 41.2 58.7 46.2 60.7 43.9 48.3 43.5 62.8 29.7 45.3 41.5 52.7 41.0 45.3 33.9
Services Sector 60.1 58.1 63.7 46.3 57.1 52.6 57.4 53.6 64.8 52.3 61.0 50.6 51.6 49.2 62.2 33.6 50.4 48.0 59.5 42.3 50.8 44.8
of which:
Financial Intermediation 75.2 83.8 73.2 58.7 53.9 59.4 68.5 56.9 72.4 57.6 72.3 65.6 53.9 55.5 65.3 36.0 56.4 54.8 56.7 58.5 69.8 56.2
Hotels and Restaurants 52.6 54.8 74.1 59.9 47.7 43.2 81.2 54.6 56.3 37.9 72.2 59.9 48.8 38.9 91.6 40.3 47.3 18.7 79.4 48.6 46.8 -6.0
Business Activities 47.9 55.9 60.6 38.8 59.7 54.2 47.6 51.8 63.7 53.7 44.9 24.7 47.8 49.2 50.0 34.7 46.5 50.2 56.3 43.2 42.5 53.1
Real Estate 71.0 52.3 68.7 51.2 64.2 54.7 52.3 62.0 62.5 53.2 68.5 60.6 58.0 53.3 73.1 30.2 46.6 51.2 61.3 43.7 42.4 44.6
Community and Social Services 51.0 45.7 38.3 31.4 52.7 50.3 52.2 41.7 61.5 43.4 43.6 48.9 38.0 39.5 41.5 21.3 31.5 42.8 51.4 9.8 51.8 52.9
Transportation 62.3 45.4 63.4 41.6 58.6 45.7 54.8 52.0 65.9 56.2 72.4 61.3 58.3 47.4 65.6 34.8 65.7 51.1 60.7 32.4 52.0 38.1
Volume of Business Activity Index 25.1 43.5 38.7 43.8 22.7 46.1 28.7 42.7 27.1 40.3 39.0 46.5 24.5 38.8 39.6 34.9 26.1 37.0 35.8 41.6 30.0 39.0
Industry Sector 16.3 38.8 36.1 32.9 20.5 43.6 22.3 26.9 23.6 35.6 27.9 28.9 22.1 33.3 36.2 26.6 26.5 37.9 33.5 30.4 32.3 44.3
Construction Sector 42.6 56.3 33.8 29.1 42.5 49.6 33.2 33.8 39.6 46.2 47.8 46.2 45.8 37.5 30.9 11.7 34.2 32.8 33.6 20.1 35.1 25.9
Wholesale and Retail Trade 26.5 39.8 36.7 48.7 14.8 40.5 24.4 49.8 22.7 40.2 41.8 55.9 20.2 41.2 40.5 42.6 20.0 35.0 30.0 53.3 15.5 36.3
Services Sector 29.8 50.7 44.3 51.2 31.1 54.6 39.5 51.8 33.7 44.1 45.6 53.2 26.6 42.1 43.7 40.0 30.1 39.1 44.4 44.8 41.4 39.4
Financial Intermediation 54.4 65.0 61.0 73.6 34.8 65.8 54.4 72.8 53.3 64.1 45.6 58.7 26.6 60.8 65.6 53.4 38.7 61.6 52.9 65.9 63.4 49.1
Hotels and Restaurants 17.7 47.7 25.8 71.1 19.2 38.8 8.7 62.4 33.7 23.7 38.8 66.7 5.3 32.2 17.6 31.4 11.7 24.3 19.6 67.7 11.5 4.4
Business Activities 21.7 49.2 46.1 45.2 31.4 55.3 40.3 32.7 14.2 35.4 50.0 47.8 24.8 29.2 36.3 38.7 25.9 35.2 46.8 39.4 41.0 40.2
Real Estate 25.1 55.3 43.1 52.9 31.2 51.4 41.9 69.8 33.3 43.0 43.9 52.9 13.0 48.4 60.9 34.8 40.3 37.3 36.2 50.1 42.6 34.3
Community and Social Services 31.8 51.8 42.1 13.4 34.8 50.7 35.6 38.5 30.9 24.8 38.6 36.3 42.6 17.8 31.2 22.3 24.8 14.7 45.5 7.0 30.0 30.4
Transportation 22.2 31.7 33.3 46.1 29.9 52.9 35.8 43.3 43.2 57.8 47.9 59.2 45.9 54.3 33.3 44.9 29.9 40.8 49.7 30.7 34.8 54.3
Volume of Total Order Book Index 20.0 37.2 32.8 38.0 20.0 39.7 26.6 38.3 25.2 34.6 34.0 41.5 21.6 34.1 33.8 31.6 22.0 34.4 32.9 37.4 25.3 36.0
Credit Access Index 16.0 18.1 15.8 16.8 15.0 17.5 15.2 15.1 16.6 14.8 16.6 14.7 14.1 15.9 12.0 13.2 12.8 13.6 12.7 12.1 10.3 9.7
Financial Condition -1.5 1.3 -1.9 -0.5 -2.1 -1.2 -2.9 -2.5 1.3 -0.2 1.1 -0.7 -0.1 1.3 1.5 0.1 -1.2 -2.0 -1.0 -0.9 -4.6 -4.8
73.0 74.0 74.9 75.2 75.2 76.6 76.5 76.9 76.8 77.2 76.2 77.0 74.8 74.0 74.9 74.9 75.0 75.8 76.7 76.0 74.3 74.8
Volume of Business Activity Index 51.1 45.2 55.7 36.8 51.1 46.2 52.7 38.7 54.2 49.3 51.7 37.0 50.7 44.8 49.1 30.1 46.7 44.7 49.6 35.9 48.9 43.2
Employment Outlook Index 23.0 24.1 31.7 23.6 23.3 25.4 27.4 24.1 25.6 20.7 22.3 19.5 27.2 23.8 23.6 19.0 27.4 24.7 27.3 24.7 29.9 24.9
3. Business Outlook Index on the Macroeconomy by Sector: Next Quarter
2015 2017 2018
Average Capacity Utilization in the Industry
and Construction Sectors
20162013
2. Business Outlook Index on the Macroeconomy by Sector: Current Quarter
1. Overall Business Outlook on the Macroeconomy
4. Business Outlook Index on Own Operations: Current Quarter
2014
5. Business Outlook Index on Own Operations: Next Quarter
1

BUSINESS EXPECTATIONS SURVEY2013 - 2018
Q1 Q2 Q3 Q4 Q1 Q2 Q3 Q4 Q1 Q2 Q3 Q4 Q1 Q2 Q3 Q4 Q1 Q2 Q3 Q4 Q1 Q2 Q3 Q4 Q1 Q2 Q3 Q4 Q1 Q2
All Industry Sector 33.9 24.7 26.6 27.0 28.8 29.1 27.8 28.9 29.6 28.7 32.1 30.5 32.9 30.0 34.2 32.0 32.5 29.1 32.9 31.9 31.3 30.3 28.1 31.7 34.9 34.6 32.8 31.1 35.1 34.2
Mining Quarrying 47.3 41.8 62.6 41.1 47.3 35.2 49.7 41.0 40.0 45.0 42.3 55.0 50.9 40.3 30.7 31.8 21.8 31.8 36.1 22.3 31.8 19.4 27.2 13.7 21.6 24.2 33.8 25.5 19.9 23.5
Manufacturing 32.5 24.2 24.9 24.9 27.9 28.6 27.2 28.0 28.4 27.5 31.2 29.2 31.5 28.8 33.2 31.0 31.5 27.8 31.5 31.3 30.8 30.9 27.5 31.5 35.5 34.7 31.8 31.0 35.2 34.4
Electricity, Gas and Water 38.5 23.8 34.4 41.0 32.2 31.3 26.2 38.2 42.3 40.2 35.3 38.7 48.6 50.0 54.5 52.9 44.8 35.7 41.2 34.5 30.8 28.9 36.3 40.1 30.9 34.4 33.4 33.3 36.8 29.2
Agriculture, Fishery and Forestry 45.3 24.3 31.7 41.9 31.5 31.7 30.1 29.7 33.3 30.1 40.3 33.9 33.3 24.8 34.0 28.4 41.5 43.1 46.7 43.8 38.5 27.3 29.5 37.1 38.0 40.7 49.9 33.1 41.4 44.5
High Interest Rate 19.8 19.9 20.1 19.8 14.6 13.8 10.8 9.9 8.7 8.1 7.4 7.3 9.1 9.3 8.4 7.8 7.8 7.3 7.4 7.1 8.3 6.4 6.2 7.1 8.0 7.7 7.0 7.3 10.0 12.1
Unclear Economic Laws 21.2 21.6 21.9 24.2 18.5 17.8 18.1 15.8 13.4 14.1 13.8 11.6 12.0 13.3 13.8 14.4 14.5 14.6 13.6 13.2 13.3 13.6 11.7 15.8 14.2 14.3 13.2 13.9 13.5 13.9
Lack of Equipment 16.1 16.0 17.3 16.7 10.9 10.2 9.9 7.7 11.1 7.0 7.7 6.8 7.1 6.8 6.8 5.8 7.1 7.2 6.2 6.4 6.7 5.6 6.2 6.5 5.2 5.8 5.3 5.7 6.1 5.6
Insufficient Demand 42.2 44.0 43.7 44.4 36.5 36.5 36.5 34.5 32.0 33.5 35.7 34.9 31.6 30.2 29.5 28.4 27.0 25.4 29.0 26.6 26.6 27.5 25.6 24.8 24.0 25.0 24.5 24.2 24.3 25.2
Access to Credit 17.8 18.4 18.6 18.6 11.7 10.5 9.4 8.2 9.4 8.5 6.8 6.2 6.7 6.2 6.0 5.2 7.8 5.8 5.9 4.8 6.4 4.5 4.0 4.7 4.4 3.9 3.9 4.1 4.9 5.0
Financial Problems 22.6 24.4 21.7 22.9 16.9 15.9 13.2 11.6 16.1 12.8 10.9 10.6 10.8 10.3 9.8 10.1 8.1 6.4 7.0 8.0 8.7 7.9 7.3 8.3 7.4 8.5 8.5 7.7 8.0 7.9
Competition 68.8 65.5 68.1 66.4 60.6 62.9 60.7 61.3 60.0 59.8 59.6 58.5 57.9 55.5 54.7 54.5 53.1 57.7 55.4 52.6 53.3 54.2 50.2 52.6 53.0 56.4 53.1 55.9 52.7 55.2
Labor Problems 19.3 21.6 20.4 18.5 13.4 12.5 11.8 11.0 13.7 11.4 10.7 8.6 9.6 9.5 10.2 9.7 11.4 9.4 10.2 10.3 11.5 12.4 10.9 12.4 13.2 13.5 12.7 13.2 12.9 14.4
Lack of Materials Input 18.4 19.1 19.0 18.4 12.4 12.5 11.2 9.4 8.1 8.9 9.4 8.4 6.5 7.6 8.8 9.2 8.1 7.3 7.0 7.5 7.8 7.2 7.1 8.0 8.1 6.6 7.7 7.4 6.8 7.6
Others 21.1 23.6 22.2 25.7 23.0 25.3 22.9 22.5 21.0 22.4 22.3 23.4 22.9 23.2 25.5 25.9 25.5 26.3 23.5 23.1 22.6 23.8 22.7 24.4 23.7 23.1 24.8 23.6 24.6 26.5
None 6.0 7.9 5.7 7.5 8.0 7.6 9.3 9.1 13.2 11.8 8.2 8.2 10.1 10.0 8.6 9.4 10.5 8.4 9.0 9.0 11.5 12.5 10.7 9.8 10.5 10.2 10.1 10.2 11.1 9.8
P/$ Exchange Rate 15.0 19.4 29.3 14.9 11.7 19.3 29.8 32.0 35.1 16.9 -2.4 12.3 3.9 10.1 7.4 10.0 3.1 5.6 2.7 12.3 2.7 23.4 -6.7 -25.7 -22.2 -4.1 -28.7 -18.2 -11.7 -22.7
Inflation Rate 21.3 38.7 32.1 28.3 16.8 15.4 5.4 3.3 1.1 10.4 22.8 25.0 43.0 31.4 40.2 38.7 -0.7 11.6 10.2 18.2 25.2 31.4 25.3 49.4 51.0 49.4 35.9 50.1 61.3 63.5
Peso Borrowing Rate 4.0 13.9 11.1 5.7 -2.1 1.1 -4.5 -11.1 -10.8 -14.4 -3.0 -0.9 11.4 11.3 13.8 16.8 6.9 6.8 8.5 8.1 15.1 12.3 7.9 8.4 12.1 17.4 8.3 14.9 19.6 21.7
Inflation Rate Expectations (in %) 3.3 3.2 2.9 3.4 4.0 4.2 4.3 3.9 3.2 2.7 2.1 1.9 1.6 1.5 2.0 2.3 2.9 3.1 3.1 3.4 3.8
Exchange Rate Expectations (Php : $1.00) 44.9 45.4 47.1 46.8 46.8 48.0 49.5 49.9 50.3 50.9 50.8 51.8
P/$ Exchange Rate 14.1 16.3 31.5 9.8 12.8 16.0 26.7 17.4 26.5 18.0 14.6 10.9 13.1 10.5 16.7 11.6 6.8 3.0 11.9 7.5 6.0 5.6 9.0 -12.6 -14.2 -9.5 -9.5 -13.0 -6.0 -16.6
Inflation Rate 23.5 34.8 29.2 18.2 14.1 18.3 11.5 5.2 9.0 15.3 22.5 18.0 32.0 28.4 38.9 21.1 7.4 15.7 26.4 21.4 32.7 32.3 28.0 35.5 38.6 41.1 42.3 31.9 49.2 47.1
Peso Borrowing Rate 11.7 16.5 12.8 7.0 1.1 4.8 -0.8 -5.0 -4.6 -4.8 2.4 5.7 16.8 18.5 18.7 20.8 11.9 11.3 11.8 12.7 18.0 12.0 12.2 14.3 19.6 19.1 18.2 17.6 23.2 20.6
Inflation Rate Expectations (in %) 3.3 3.3 3.0 3.5 4.1 4.2 4.3 3.9 3.4 2.9 2.3 2.1 1.7 1.6 2.1 2.4 3.0 3.2 3.2 3.5 3.8
Exchange Rate Expectations (Php : $1.00) 44.9 45.7 47.3 46.8 46.8 48.2 49.7 50.0 50.4 51.1 50.9 52.0
Small (<100) 39.2 40.0 38.9 37.0 36.1 33.8 34.0 34.3 36.3 36.8 34.4 34.0 33.7 33.4 33.0 32.1 31.4 31.4 30.8 31.1 31.3 31.9 31.5 31.0 32.0 32.4 30.9 30.4 31.3 31.0
Medium (100-<500) 34.8 35.1 36.3 36.2 35.8 36.0 36.1 38.4 35.6 36.2 38.5 35.9 35.7 36.2 35.9 35.9 36.4 36.8 36.7 36.9 38.9 38.7 34.4 37.6 38.2 38.3 38.4 37.9 39.6 39.7
Large (500 & up) 15.1 13.8 13.5 15.0 15.5 15.5 17.4 13.6 16.8 17.4 16.8 18.7 17.8 19.5 19.3 19.3 19.4 20.5 20.6 21.5 18.9 18.8 18.8 20.7 20.1 21.0 21.9 21.0 22.3 22.2
No Response 10.8 11.0 11.3 11.8 12.7 14.7 12.5 13.7 11.2 9.6 10.3 11.4 12.8 10.9 11.7 12.7 12.8 11.2 11.8 10.5 10.9 10.6 15.3 10.7 9.7 8.3 8.8 10.7 6.8 7.1
All Sectors 1275 1307 1244 1235 1248 1264 1175 1183 1247 1290 1294 1288 1267 1283 1288 1272 1285 1282 1242 1266 1271 1229 1235 1186 1239 1239 1238 1237 1209 1224
Industry 376 378 366 359 384 375 338 353 380 400 401 386 377 381 387 378 393 392 371 387 388 380 381 366 368 376 374 373 365 370
Mining Quarrying 17 19 16 17 19 17 16 17 17 20 19 20 20 20 21 19 19 16 17 19 25 31 33 29 37 36 36 32 33 33
Manufacturing 280 273 265 257 280 273 246 253 282 297 297 289 278 288 288 282 285 287 269 282 249 233 232 228 224 229 228 230 222 225
Electricity, Gas and Water 27 30 27 29 37 34 31 34 35 37 36 34 31 32 33 32 42 38 37 37 56 55 55 53 48 50 49 51 51 54
Agriculture, Fishery and Forestry 52 56 58 56 48 51 45 49 46 46 49 43 48 41 45 45 47 51 48 49 58 61 61 56 59 61 61 60 59 58
Construction 75 88 71 79 74 86 85 84 87 83 84 87 93 91 86 87 80 90 85 82 95 95 103 89 94 88 85 85 85 84
Wholesale and Retail Trade 428 429 405 388 421 415 387 372 405 408 407 423 413 422 417 417 415 394 395 397 370 333 337 318 338 335 329 322 322 330
Services 396 412 402 409 369 388 365 374 375 399 402 392 384 389 398 390 397 406 391 400 418 421 414 413 439 440 450 457 437 440
Financial Intermediation 76 84 85 84 80 81 72 72 72 83 80 80 80 79 84 80 88 90 86 85 78 84 84 82 83 89 85 87 84 83
Hotels and Restaurants 62 63 59 62 48 47 52 49 54 54 52 48 47 50 48 47 47 48 48 48 51 48 49 51 56 55 57 60 52 54
Renting and Business ActivitiesBusiness Activities 69 75 69 68 75 78 70 67 71 73 73 70 60 60 63 65 68 72 64 69 92 93 92 92 104 101 103 106 98 101
Real Estate and Renting 64 62 61 70 51 60 50 61 57 67 70 65 64 64 67 63 66 62 64 66 63 63 58 57 60 61 63 62 63 62
Community and Social Services 60 62 63 61 54 55 58 58 58 59 60 60 60 63 63 59 57 65 60 60 60 55 52 56 59 57 61 63 62 59
Transportation 65 66 65 64 61 67 63 67 63 63 67 69 73 73 73 76 71 69 69 72 74 78 79 75 77 77 81 79 78 81
A quarterly survey conducted by the Bangko Sentral ng Pilipinas
Department of Economic Statistics Manila, Philippines
www.bsp.gov.ph
* From 2001 to 2003, survey respondents came from a random sample of firms in SEC's Top 5000 Corporations in the Philippines which are located in the NCR. Beginning Q4 2003, the survey was expanded
to include those areas which are located outside NCR specifically Regions I, VII & XI. Finally in Q4 2006, the BES was further expanded to become a nationwide survey of firms in the top 5000 corporations.
201820172015
in the negative with respect to their views on a given indicator.
2011
Note: Unless otherwise stated, all numbers are in diffusion indices, i.e., Confidence Index (CI) is computed as the percentage of firms that answered in affirmative less the
percentage of firms that answered
10. Percentage Distribution of Respondent Firms by Employment Size
11. Distribution of Respondent Firms by Sector
6. Companies with Expansion Plans (in percent of total respondents): Next Quarter
7. Business Constraints (in percent to total respondents): Current Quarter
8. Business Expectations Index on Selected Economic Indicators: Current Quarter
9. Business Expectations Index on Selected Economic Indicators: Next Quarter
20162012 20142013
2
Business Expectations Survey2013 - 2018
Q1 Q2 Q3 Q4 Q1 Q2 Q3 Q4 Q1 Q2 Q3 Q4 Q1 Q2 Q3 Q4 Q1 Q2 Q3 Q4 Q1 Q2
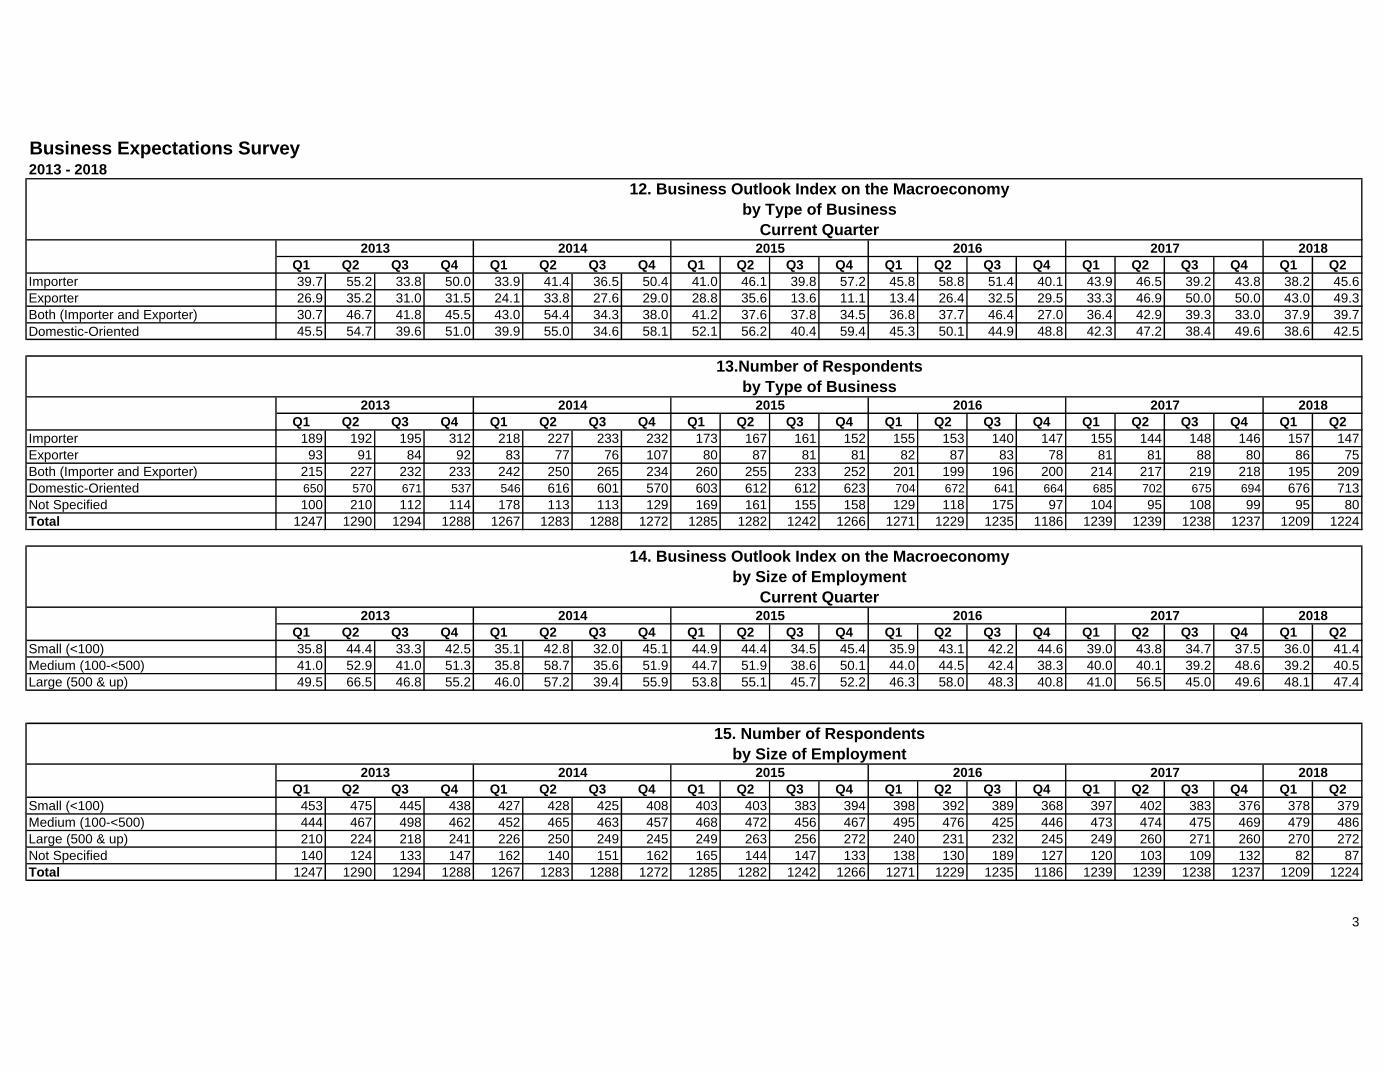
Importer 39.7 55.2 33.8 50.0 33.9 41.4 36.5 50.4 41.0 46.1 39.8 57.2 45.8 58.8 51.4 40.1 43.9 46.5 39.2 43.8 38.2 45.6
Exporter 26.9 35.2 31.0 31.5 24.1 33.8 27.6 29.0 28.8 35.6 13.6 11.1 13.4 26.4 32.5 29.5 33.3 46.9 50.0 50.0 43.0 49.3
Both (Importer and Exporter) 30.7 46.7 41.8 45.5 43.0 54.4 34.3 38.0 41.2 37.6 37.8 34.5 36.8 37.7 46.4 27.0 36.4 42.9 39.3 33.0 37.9 39.7
Domestic-Oriented 45.5 54.7 39.6 51.0 39.9 55.0 34.6 58.1 52.1 56.2 40.4 59.4 45.3 50.1 44.9 48.8 42.3 47.2 38.4 49.6 38.6 42.5
Q1 Q2 Q3 Q4 Q1 Q2 Q3 Q4 Q1 Q2 Q3 Q4 Q1 Q2 Q3 Q4 Q1 Q2 Q3 Q4 Q1 Q2
Importer 189 192 195 312 218 227 233 232 173 167 161 152 155 153 140 147 155 144 148 146 157 147
Exporter 93 91 84 92 83 77 76 107 80 87 81 81 82 87 83 78 81 81 88 80 86 75
Both (Importer and Exporter) 215 227 232 233 242 250 265 234 260 255 233 252 201 199 196 200 214 217 219 218 195 209
Domestic-Oriented 650 570 671 537 546 616 601 570 603 612 612 623 704 672 641 664 685 702 675 694 676 713
Not Specified 100 210 112 114 178 113 113 129 169 161 155 158 129 118 175 97 104 95 108 99 95 80
Total 1247 1290 1294 1288 1267 1283 1288 1272 1285 1282 1242 1266 1271 1229 1235 1186 1239 1239 1238 1237 1209 1224
Q1 Q2 Q3 Q4 Q1 Q2 Q3 Q4 Q1 Q2 Q3 Q4 Q1 Q2 Q3 Q4 Q1 Q2 Q3 Q4 Q1 Q2
Small (<100) 35.8 44.4 33.3 42.5 35.1 42.8 32.0 45.1 44.9 44.4 34.5 45.4 35.9 43.1 42.2 44.6 39.0 43.8 34.7 37.5 36.0 41.4
Medium (100-<500) 41.0 52.9 41.0 51.3 35.8 58.7 35.6 51.9 44.7 51.9 38.6 50.1 44.0 44.5 42.4 38.3 40.0 40.1 39.2 48.6 39.2 40.5
Large (500 & up) 49.5 66.5 46.8 55.2 46.0 57.2 39.4 55.9 53.8 55.1 45.7 52.2 46.3 58.0 48.3 40.8 41.0 56.5 45.0 49.6 48.1 47.4
Q1 Q2 Q3 Q4 Q1 Q2 Q3 Q4 Q1 Q2 Q3 Q4 Q1 Q2 Q3 Q4 Q1 Q2 Q3 Q4 Q1 Q2
Small (<100) 453 475 445 438 427 428 425 408 403 403 383 394 398 392 389 368 397 402 383 376 378 379
Medium (100-<500) 444 467 498 462 452 465 463 457 468 472 456 467 495 476 425 446 473 474 475 469 479 486
Large (500 & up) 210 224 218 241 226 250 249 245 249 263 256 272 240 231 232 245 249 260 271 260 270 272
Not Specified 140 124 133 147 162 140 151 162 165 144 147 133 138 130 189 127 120 103 109 132 82 87
Total 1247 1290 1294 1288 1267 1283 1288 1272 1285 1282 1242 1266 1271 1229 1235 1186 1239 1239 1238 1237 1209 1224
3
2018
2018
2018
2018
201720162015
2015
20162015
2013
2014
by Size of Employment
15. Number of Respondents
2016
2016
2017
2017
2014
2013
2014
2013
Current Quarter
by Size of Employment
2015
12. Business Outlook Index on the Macroeconomy
by Type of Business
Current Quarter
13.Number of Respondents
by Type of Business
14. Business Outlook Index on the Macroeconomy
2013
2014
2017

Business Expectations Survey2013 - 2018
Q1 Q2 Q3 Q4 Q1 Q2 Q3 Q4 Q1 Q2 Q3 Q4 Q1 Q2 Q3 Q4 Q1 Q2 Q3 Q4 Q1 Q2
Importer 52.9 39.1 56.4 38.5 53.2 52.0 51.9 41.4 56.6 46.7 50.3 44.7 51.0 53.6 62.9 40.8 48.4 46.5 53.4 38.4 49.7 47.6
Exporter 44.1 47.3 29.8 38.0 45.8 37.7 46.1 37.4 50.0 41.4 17.3 18.5 37.8 37.9 44.6 30.8 53.1 51.9 51.1 41.3 50.0 50.7
Both (Importer and Exporter) 54.4 48.9 41.8 37.3 51.2 46.8 40.8 44.0 54.2 46.3 43.8 40.5 46.3 42.7 40.8 31.5 39.7 41.9 35.2 34.4 43.1 44.0
Domestic-Oriented 54.9 49.6 61.1 43.2 52.2 51.5 58.4 46.1 61.5 45.6 64.1 50.2 56.0 44.6 63.2 36.7 52.6 42.9 57.3 44.5 50.6 38.4
Q1 Q2 Q3 Q4 Q1 Q2 Q3 Q4 Q1 Q2 Q3 Q4 Q1 Q2 Q3 Q4 Q1 Q2 Q3 Q4 Q1 Q2
Importer 15.2 14.9 15.1 24.2 17.2 17.7 18.1 18.2 13.5 13.0 13.0 12.0 12.2 12.4 11.3 12.4 12.5 11.6 12.0 11.8 13.0 12.0
Exporter 7.5 7.1 6.5 7.1 6.6 6.0 5.9 8.4 6.2 6.8 6.5 6.4 6.5 7.1 6.7 6.6 6.5 6.5 7.1 6.5 7.1 6.1
Both (Importer and Exporter) 17.2 17.6 17.9 18.1 19.1 19.5 20.6 18.4 20.2 19.9 18.8 19.9 15.8 16.2 15.9 16.9 17.3 17.5 17.7 17.6 16.1 17.1
Domestic-Oriented 52.1 44.2 51.9 41.7 43.1 48.0 46.7 44.8 46.9 47.7 49.3 49.2 55.4 54.7 51.9 56.0 55.3 56.7 54.5 56.1 55.9 58.3
Not Specified 8.0 16.3 8.7 8.9 14.0 8.8 8.8 10.1 13.2 12.6 12.5 12.5 10.1 9.6 14.2 8.1 8.4 7.7 8.7 8.0 7.9 6.5
Total 100.0 100.0 100.0 100.0 100.0 100.0 100.0 100.0 100.0 100.0 100.0 100.0 100.0 100.0 100.0 100.0 100.0 100.0 100.0 100.0 100.0 100.0
Q1 Q2 Q3 Q4 Q1 Q2 Q3 Q4 Q1 Q2 Q3 Q4 Q1 Q2 Q3 Q4 Q1 Q2 Q3 Q4 Q1 Q2
Small (<100) 45.0 42.5 54.2 41.1 45.4 44.6 51.3 42.6 54.6 41.2 51.4 43.9 51.0 43.9 56.6 39.7 46.1 41.3 51.2 42.0 48.9 41.2
Medium (100-<500) 56.5 46.5 54.4 37.7 54.9 53.1 50.1 45.3 59.2 48.7 55.3 46.3 49.5 41.8 58.1 33.9 49.3 42.0 50.9 39.0 45.9 39.3
Large (500 & up) 66.7 57.1 55.0 51.0 51.8 50.4 56.6 46.5 67.5 51.7 60.5 44.1 57.1 52.4 58.6 33.1 54.2 50.0 55.7 46.9 55.6 45.2
Q1 Q2 Q3 Q4 Q1 Q2 Q3 Q4 Q1 Q2 Q3 Q4 Q1 Q2 Q3 Q4 Q1 Q2 Q3 Q4 Q1 Q2
Small (<100) 36.3 36.8 34.4 34.0 33.7 33.4 33.0 32.1 31.4 31.4 30.8 31.1 31.3 31.9 31.5 31.0 32.0 32.4 30.9 30.4 31.3 31.0
Medium (100-<500) 35.6 36.2 38.5 35.9 35.7 36.2 35.9 35.9 36.4 36.8 36.7 36.9 38.9 38.7 34.4 37.6 38.2 38.3 38.4 37.9 39.6 39.7
Large (500 & up) 16.8 17.4 16.8 18.7 17.8 19.5 19.3 19.3 19.4 20.5 20.6 21.5 18.9 18.8 18.8 20.7 20.1 21.0 21.9 21.0 22.3 22.2
Not Specified 11.2 9.6 10.3 11.4 12.8 10.9 11.7 12.7 12.8 11.2 11.8 10.5 10.9 10.6 15.3 10.7 9.7 8.3 8.8 10.7 6.8 7.1
Total 100.0 100.0 100.0 100.0 100.0 100.0 100.0 100.0 100.0 100.0 100.0 100.0 100.0 100.0 100.0 100.0 100.0 100.0 100.0 100.0 100.0 100.0
4
2018
2018
2017
2017
2016
2016
Percent to Total
2015
20152014
2014
19. Number of Respondents
2014
Next Quarter
2017
2017
2013
by Size of Employment
2013
2015
2014
2013
2013
18. Business Outlook Index on the Macroeconomy
Percent to Total
2018
2018
by Size of Employment
2016
16. Business Outlook Index on the Macroeconomy
by Type of Business
Next Quarter
17. Number of Respondents
by Type of Business
20162015

Annexes: Business Expectations Survey (BES) Report Q2 2018
Population
SECTOR/SUB-SECTOR Region 1 Region 2 Region 3 Region 4 Region 5 Region 6 Region 7 Region 8 Region 9 Region 10 Region 11 Region 12 CARAGA ARMM CAR NCR Philippines
Agriculture 4 8 1 5 4 5 4 33 9 22 95
Business 1 15 38 1 1 18 2 7 2 568 653
Community 6 14 28 8 8 1 2 4 2 111 184
Construction 1 24 46 8 4 33 3 1 12 1 1 325 459
EGW 4 18 8 1 3 15 3 69 121
Finance 3 8 11 1 4 15 1 1 16 2 2 380 444
Hotels and Restaurants 5 10 7 3 6 13 1 8 135 188
Manufacturing 4 3 164 582 7 8 105 9 3 4 37 7 2 3 836 1774
Mining 4 5 2 1 54 66
Real Estate 9 36 1 4 15 7 2 268 342
Trade 19 11 203 239 36 48 125 11 21 12 89 20 1 1368 2203
Transportation 1 22 28 1 2 14 3 15 3 258 347
Services Sector 13 3 78 148 7 25 83 1 7 3 57 11 2 1720 2158
Industry Sector 8 3 186 602 9 16 129 9 8 8 75 16 1 2 3 981 2056
Grand Total 40 18 491 1035 60 93 370 24 37 23 233 48 4 3 3 4394 6876
Number of Samples
SECTOR/SUB-SECTOR Region 1 Region 2 Region 3 Region 4 Region 5 Region 6 Region 7 Region 8 Region 9 Region 10 Region 11 Region 12 CARAGA ARMM CAR NCR Philippines
Agriculture 3 6 1 3 3 5 4 19 9 22 75
Business 1 9 23 1 1 14 2 5 2 69 127
Community 3 10 19 6 8 1 2 4 1 15 69
Construction 11 23 6 2 14 3 1 9 1 42 112
EGW 3 12 6 2 8 2 1 22 56
Finance 3 6 9 1 3 10 1 1 3 2 2 42 83
Hotels and Restaurants 5 8 6 2 6 9 1 7 18 62
Manufacturing 2 2 21 68 5 6 15 8 1 2 20 7 2 3 97 259
Mining 3 5 2 1 28 39
Real Estate 6 22 1 3 14 4 2 35 87
Trade 17 9 21 32 30 40 22 8 18 9 18 18 1 162 405
Transportation 16 18 2 11 1 11 2 31 92
Services Sector 9 3 55 97 5 21 66 1 5 3 34 9 2 210 520
Industry Sector 5 2 36 83 6 11 31 8 6 6 43 16 1 2 4 169 429
GRAND TOTAL 31 14 123 235 47 74 133 20 30 18 104 44 3 3 4 583 1466
Annex A. Distribution of Combined List of 2010 SEC's Top 7000 Corporations and 2015 Business World's Top 1000 Corporations by Region

Annexes: Business Expectations Survey (BES) Report Q2 2018
Annex B. Regions and Provinces of the Philippines
Regions Provinces
I-Ilocos Ilocos Norte, Ilocos Sur, La Union and Pangasinan
II-Cagayan Valley Batanes, Cagayan, Isabela, Nueva Vizcaya and Quirino
III-Central Luzon Aurora, Bataan, Bulacan, Nueva Ecija, Pampanga, Tarlac and Zambales
IV-Southern Tagalog Cavite, Laguna, Batangas, Marinduque, Occidental Mindoro, Oriental Mindoro, Palawan, Quezon, Rizal and
Romblon
V-Bicol Albay, Camarines Norte, Camarines Sur, Catanduanes, Masbate and Sorsogon
VI-Western Visayas Aklan, Antique, Capiz, Guimaras, Negros Occidental and Iloilo
VII-Central Visayas Cebu, Bohol, Negros Oriental and Siquijor
VIII-Eastern Visayas Biliran, Eastern Samar, Leyte, Northern Samar, Samar and Southern Leyte
IX-Zamboanga Peninsula Zamboanga del Norte, Zamboanga del Sur, Zamboanga Sibugay, Isabela City and Zamboanga City
X-Northern Mindanao Bukidnon, Camiguin, Lanao del Norte, Misamis Occidental and Misamis Oriental
XI-Davao Compostela Valley, Davao del Norte, Davao del Sur and Davao Oriental
XII-SOCCSKARGEN Cotabato, Sultan Kudarat, South Cotabato and Sarangani
Cordillera Administrative Region (CAR) Abra, Apayao, Benguet, Ifugao, Kalinga and Mountain Province
Autonomous Region of Muslim
Mindanao (ARMM)
Basilan (excluding Isabela City), Lanao del Sur, Maguindanao, Sulu and Tawi-Tawi
Caraga Agusan del Norte, Agusan Del Sur, Dinagat Islands, Surigao del Norte and Surigao del Sur
National Capital Region (NCR)1 Caloocan, Las Piñas, Makati, Malabon, Mandaluyong, Manila, Marikina, Muntinlupa, Navotas, Parañaque,
Pasay, Pasig, Pateros, Quezon City, San Juan, Taguig and Valenzuela
1 NCR is composed of 16 highly-urbanized cities and one municipality (Pateros).