second quarter 2021 results presentation july 29, 2021
TRANSCRIPT

Second Quarter 2021Results Presentation
July 29, 2021
TSX:AGI ǀ NYSE:AGI 2
Cautionary Notes
This presentation, the information contained herein, any other materials provided in connection with this presentation and any oral remarks accompanying this presentation (collectively, the “Presentation”), has been prepared by Alamos Gold Inc. (“Alamos” or the “Company”) solely for information purposes. No stock exchange, securities commission or other regulatory authority has approved or disapproved of the information contained herein. This Presentation does not constitute an offering of securities and the information contained herein is subject to the information contained in the Company’s continuous disclosure documents available on the SEDAR website at www.sedar.com or on EDGAR at www.sec.gov.
Cautionary Notes
This Presentation contains statements that constitute forward-looking information as defined under applicable Canadian and U.S. securities laws. All statements in this Presentation other than statements of historical fact, which address events, results, outcomes or development that Alamos expects to occur are, or may be deemed to be “forward-looking statements”. Forward-looking statements are generally, but not always, identified by the use of forward-looking terminology such as "expect", “assume”, “inferred”, “schedule”, "estimate", "budget", “continue”, “potential”, “outlook”, “trending”, “plan” or variations of such words and phrases and similar expressions or statements that certain actions, events or results “may", "could”, “would", "might" or "will" be taken, occur or be achieved or the negative connotation of such terms. Forward-looking statements include information related to Alamos’ net asset value, operating cash flow, free cash flow, forecast gold production, mineral reserves, mineral resources, exploration potential, mine life, gold grades, recoveries, waste-to-ore ratios, total cash cost, all-in sustaining costs, debt levels, capital expenditures, mining and milling rates, development of the Lynn Lake project, the shaft expansion project at Island Gold, construction at La Yaqui Grande, and future plans and objectives based on forecasts of future operational or financial results. Alamos cautions that forward-looking statements are necessarily based upon several factors and assumptions that, while considered reasonable by Alamos at the time of making such statements, are inherently subject to significant business, economic, legal, political and competitive uncertainties and contingencies. Known and unknown factors could cause actual results to differ materially from those projected in the forward-looking statements. Such factors and assumptions include, but are not limited to: changes to current estimates of mineral reserves and mineral resources; the speculative nature of mineral exploration and development, risks in obtaining and maintaining necessary licenses, permits and authorizations for the Company’s development stage and operating assets, Phase III expansion delays at the Island Gold mine; construction delays at La Yaqui Grande, operations may be exposed to new diseases, epidemics and pandemics, including the effects and potential effects of the global COVID-19 widespread pandemic; the impact of the COVID-19 pandemic on the broader market and the trading price of the Company's shares; provincial and federal orders or mandates (including with respect to mining operations generally or auxiliary businesses or services required for our operations) in Canada, Mexico, the United States and Turkey; the duration of regulatory responses to the COVID-19 pandemic; governments and the Company’s attempts to reduce the spread of COVID-19 which may affect many aspects of the Company's operations including the ability to transport personnel to and from site, contractor and supply availability and the ability to sell or deliver gold dore bars; fluctuations in the price of gold or certain other commodities such as, diesel fuel, natural gas, and electricity; changes in foreign exchange rates; the impact of inflation; employee and community relations; litigation and administrative proceedings; changes to production estimates (which assume accuracy of projected ore grade, mining rates, recovery timing and recovery rate estimates which may be impacted by unscheduled maintenance, labour and contractor availability and other operating or technical difficulties); disruptions affecting operations; inherent risks associated with mining and mineral processing; the risk that the Company’s mines may not perform as planned; increased costs associated with mining inputs and labour; contests over title to properties; changes in national and local government legislation (including tax and employment legislation), controls or regulations in Canada, Turkey, the United States and other jurisdictions in which the Company does or may carry on business in the future; risk of loss due to sabotage, protests and other civil disturbances; the costs and timing of construction and development of new deposits; the impact of global liquidity and credit availability and the values of assets and liabilities based on projected future cash flows; risks arising from holding derivative instruments; and business opportunities that may be pursued by the Company. Additional risk factors affecting Alamos and the Company’s ability to achieve the expectations set forth in the forward-looking statements contained in this Presentation are set out in the Company’s latest 40F/Annual Information Form and Management’s Discussion and Analysis, each under the heading “Risk Factors” available on the SEDAR website at www.sedar.com or on EDGAR at www.sec.gov, and should be reviewed in conjunction with this Presentation. The Company disclaims any intention or obligation to update or revise any forward-looking statements whether as a result of new information, future events or otherwise, except as required by applicable law. Market data and other statistical information used throughout this Presentation are based on internal company research, independent industry publications, government publications, reports by market research firms or their published independent sources. Industry publications, governmental publications, market research surveys and forecasts generally state that the information contained therein has been obtained from sources believed to be reliable. Although Alamos believes such information is accurate and reliable, it has not independently verified any of the data from third party sources cited or used for the Company’s management’s industry estimates, nor has Alamos ascertained the underlying economic assumptions relied upon therein. While Alamos believes internal company estimates are reliable, such estimates have not been verified by any independent sources, and Alamos makes no representations as to the accuracy of such estimates..
Note to U.S. Investors
Alamos prepares its disclosure in accordance with the requirements of securities laws in effect in Canada. Terms relating to mineral resources in this presentation are defined in accordance with National Instrument 43-101 Standards of Disclosure for Mineral Projects (“NI 43-101”) under the guidelines set out in the Canadian Institute of Mining, Metallurgy and Petroleum’s Standards, Best Practices and Guidance for Mineral Resources and Mineral Reserves. Alamos may use certain terms, such as “Measured Mineral Resources”, “Indicated Mineral Resources”, “Inferred Mineral Resources” and “Probable Mineral Reserves”. Investors are cautioned not to assume that all or any part of mineral deposits in these categories will ever be converted into Mineral Reserves. “Inferred Mineral Resources” have a great amount of uncertainty as to their existence, and great uncertainty as to their economic and legal feasibility. It cannot be assumed that all or any part of an Inferred Mineral Resource will ever be upgraded to a higher category. Under Canadian rules, estimates of Inferred Mineral Resources may not form the basis of feasibility or pre-feasibility studies, except in very limited circumstances. Disclosure of “contained ounces” in a Mineral Resource is permitted disclosure under Canadian regulations.
Cautionary non-GAAP Measures and Additional GAAP Measures
Note that for purposes of this section, GAAP refers to IFRS. The Company believes that investors use certain non-GAAP and additional GAAP measures as indicators to assess gold mining companies. They are intended to provide additional information and should not be considered in isolation or as a substitute for measures of performance prepared with GAAP. “Cash flow from operating activities before changes in non-cash working capital” is a non-GAAP performance measure that could provide an indication of the Company’s ability to generate cash flows from operations, and is calculated by adding back the change in non-cash working capital to “cash provided by (used in) operating activities” as presented on the Company’s consolidated statements of cash flows. “cash flow per share” is calculated by dividing “cash flow from operations before changes in working capital” by the weighted average number of shares outstanding for the period. “Free cash flow” is a non-GAAP performance measure that is calculated as cash flows from operations net of cash flows invested in mineral property, plant and equipment and exploration and evaluation assets as presented on the Company’s consolidated statements of cash flows and that would provide an indication of the Company’s ability to generate cash flows from its mineral projects. “Mine site free cash flow” is a non-GAAP measure which includes cash flow from operating activities at, less capital expenditures at each mine site. “Return on equity” is defined as earnings from continuing operations divided by the average total equity for the current and previous year. “Mining cost per tonne of ore” and “cost per tonne of ore” are non-GAAP performance measures that could provide an indication of the mining and processing efficiency and effectiveness of the mine. These measures are calculated by dividing the relevant mining and processing costs and total costs by the tonnes of ore processed in the period. “Cost per tonne of ore” is usually affected by operating efficiencies and waste-to-ore ratios in the period. “Total cash costs per ounce”, “all-in sustaining costs per ounce”, and “mine-site all-in sustaining costs” as used in this analysis are non-GAAP terms typically used by gold mining companies to assess the level of gross margin available to the Company by subtracting these costs from the unit price realized during the period. These non-GAAP terms are also used to assess the ability of a mining company to generate cash flow from operations. There may be some variation in the method of computation of these metrics as determined by the Company compared with other mining companies. In this context, “total cash costs” reflects mining and processing costs allocated from in-process and dore inventory and associated royalties with ounces of gold sold in the period. Total cash costs per ounce are exclusive of exploration costs. “All-in sustaining costs per ounce” include total cash costs, exploration, corporate and administrative, share based compensation and sustaining capital costs. “Mine-site all-in sustaining costs” include total cash costs, exploration, and sustaining capital costs for the mine-site, but exclude an allocation of corporate and administrative and share based compensation. “Adjusted net earnings” and “adjusted earnings per share” are non-GAAP financial measures with no standard meaning under IFRS. “Adjusted net earnings” excludes the following from net earnings: foreign exchange gain (loss), items included in other loss, certain non-reoccurring items and foreign exchange gain (loss) recorded in deferred tax expense. “Adjusted earnings per share” is calculated by dividing “adjusted net earnings” by the weighted average number of shares outstanding for the period.
Additional GAAP measures that are presented on the face of the Company’s consolidated statements of comprehensive income and are not meant to be a substitute for other subtotals or totals presented in accordance with IFRS, but rather should be evaluated in conjunction with such IFRS measures. This includes “Earnings from operations”, which is intended to provide an indication of the Company’s operating performance and represents the amount of earnings before net finance income/expense, foreign exchange gain/loss, other income/loss, and income tax expense. Non-GAAP and additional GAAP measures do not have a standardized meaning prescribed under IFRS and therefore may not be comparable to similar measures presented by other companies. A reconciliation of historical non-GAAP and additional GAAP measures are detailed in the Company’s Management’s Discussion and Analysis available at www.alamosgold.com.
Technical Information
Chris Bostwick, FAusIMM, Alamos Gold’s Vice President, Technical Services, has reviewed and approved the scientific and technical information contained in this presentation. Chris Bostwick is a Qualified Person within the meaning of Canadian Securities Administrator’s National Instrument 43-101 (“NI 43-101”). The Qualified Persons for the NI 43-101 compliant mineral reserve and resource estimates are detailed in the tables in the appendix of this Presentation.
TSX:AGI ǀ NYSE:AGI 3
1 Please refer to Cautionary Notes on non-GAAP Measures and Additional GAAP Measures2 Total consolidated all-in sustaining costs include corporate and administrative and share based compensation expenses3 AISC margin calculated as realized gold price less AISC
Q2 2021 highlights
Q2 2021A Q2 2020AYoY %
ChangeQ2 2021A
YTDQ2 2020A
YTD
YoY % Change 2021 Guidance
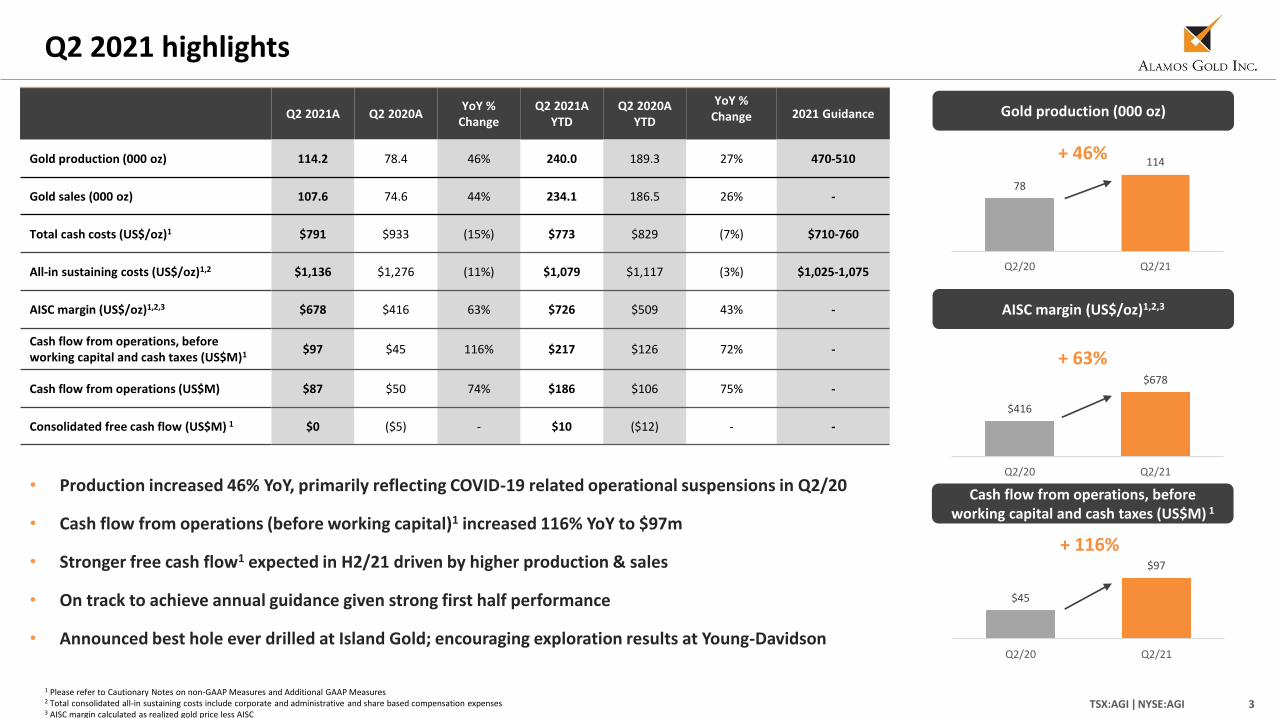
Gold production (000 oz) 114.2 78.4 46% 240.0 189.3 27% 470-510
Gold sales (000 oz) 107.6 74.6 44% 234.1 186.5 26% -
Total cash costs (US$/oz)1 $791 $933 (15%) $773 $829 (7%) $710-760
All-in sustaining costs (US$/oz)1,2 $1,136 $1,276 (11%) $1,079 $1,117 (3%) $1,025-1,075
AISC margin (US$/oz)1,2,3 $678 $416 63% $726 $509 43% -
Cash flow from operations, before working capital and cash taxes (US$M)1 $97 $45 116% $217 $126 72% -
Cash flow from operations (US$M) $87 $50 74% $186 $106 75% -
Consolidated free cash flow (US$M) 1 $0 ($5) - $10 ($12) - -
• Production increased 46% YoY, primarily reflecting COVID-19 related operational suspensions in Q2/20
• Cash flow from operations (before working capital)1 increased 116% YoY to $97m
• Stronger free cash flow1 expected in H2/21 driven by higher production & sales
• On track to achieve annual guidance given strong first half performance
• Announced best hole ever drilled at Island Gold; encouraging exploration results at Young-Davidson
$45
$97
Q2/20 Q2/21
$416
$678
Q2/20 Q2/21
78
114
Q2/20 Q2/21
Cash flow from operations, before working capital and cash taxes (US$M) 1
+ 46%
+ 63%
+ 116%
AISC margin (US$/oz)1,2,3
Gold production (000 oz)
TSX:AGI ǀ NYSE:AGI 4
0
100
200
300
400
500
600
700
800
2020A 2021E 2022E 2023E 2024E 2025E 2026E
Pro
du
ctio
n (
00
0 o
z A
u)
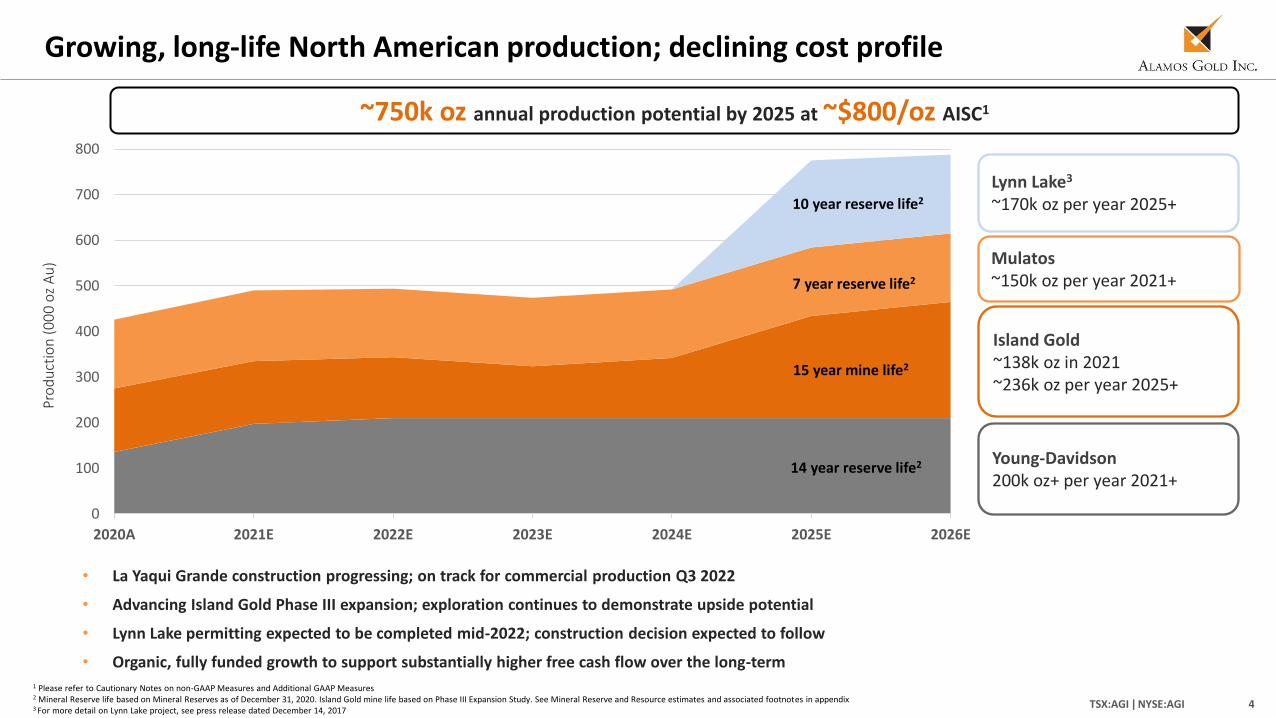
Growing, long-life North American production; declining cost profile
1 Please refer to Cautionary Notes on non-GAAP Measures and Additional GAAP Measures 2 Mineral Reserve life based on Mineral Reserves as of December 31, 2020. Island Gold mine life based on Phase III Expansion Study. See Mineral Reserve and Resource estimates and associated footnotes in appendix3 For more detail on Lynn Lake project, see press release dated December 14, 2017
Lynn Lake3
~170k oz per year 2025+
Mulatos ~150k oz per year 2021+
Island Gold ~138k oz in 2021~236k oz per year 2025+
Young-Davidson200k oz+ per year 2021+
~750k oz annual production potential by 2025 at ~$800/oz AISC1
15 year mine life2
7 year reserve life2
10 year reserve life2
14 year reserve life2
• La Yaqui Grande construction progressing; on track for commercial production Q3 2022
• Advancing Island Gold Phase III expansion; exploration continues to demonstrate upside potential
• Lynn Lake permitting expected to be completed mid-2022; construction decision expected to follow
• Organic, fully funded growth to support substantially higher free cash flow over the long-term

TSX:AGI ǀ NYSE:AGI 51 Please refer to Cautionary Notes on non-GAAP Measures and Additional GAAP Measures 2 Includes capitalized exploration at Island Gold, Young-Davidson, and Mulatos
Financial highlights
Q2 2021A Q2 2020AYoY %
ChangeQ2 2021A
YTDQ2 2020A
YTDYoY %
Change2021 Guidance
Realized gold price (US$/oz) $1,814 $1,692 7% $1,805 $1,626 11% -
Operating revenues (US$M) $195 $126 55% $423 $303 40% -
Cash flow from operations (US$M) $87 $50 74% $186 $106 75% -
Cash flow from operations, before changes in working capital and cash taxes1 (US$M)
$97 $45 116% $217 $126 72% -
Cash flow from operations, before changes in working capital and cash taxes, per share1 $0.25 $0.11 127% $0.55 $0.32 72% -
Net (loss) earnings (US$M) ($173) $12 - ($121) ($1) - -
Net (loss) earnings, per share ($0.44) $0.03 - ($0.31) $0.00 - -
Adjusted net earnings (US$M)1 $39 $10 290% $88 $39 126% -
Adjusted net earnings, per share1 $0.10 $0.03 233% $0.22 $0.10 120% -
Capital expenditures and advances (US$M)2 $87 $55 58% $176 $118 49% $354-384
Consolidated free cash flow (US$M) 1 $0 ($5) - $10 ($12) - -
Cash and cash equivalents (US$M) 4 $234 $221 6% $234 $221 6% -
Cash flow from operations, before changes in working capital (US$M) 1
AISC margin (US$/oz)1,3
3 AISC margin calculated as realized gold price less AISC4 Comparative cash and cash equivalents balance as at December 31, 2020
$416
$933 $830
$768 $678
Q2/20 Q3/20 Q4/20 Q1/21 Q2/21
$45
$130 $127 $120
$97
Q2/20 Q3/20 Q4/20 Q1/21 Q2/21
• Gold sales ~6.6k oz lower than production due to timing of shipments; sales will be realized in Q3/21
• Costs above annual guidance reflecting stronger USD/CAD FX rate of $0.81:1 (guidance based on FX rate of $0.75:1)
• Stronger CAD added $30/oz to total cash costs & $45/oz to AISC in H1/21; similar impact in H2/21 at FX rate of $0.80:1
• Reported net loss of $173m, impacted by non-cash, after-tax impairment charge of Turkish projects of $214m
• Free cash flow neutral, net of $6m cash taxes paid in Mexico, higher capital spend & lower gold sales
• Cash & cash equivalents of $234m and $22m of equity securities; zero debt
Cash flow per share, before working capital (US$M) 1
$0.11
$0.33 $0.32 $0.30 $0.25
Q2/20 Q3/20 Q4/20 Q1/21 Q2/21
TSX:AGI ǀ NYSE:AGI 6
1.0
1.5
2.0
2.5
3.0
2,000
3,500
5,000
6,500
8,000
Q2
/19
Q3
/19
Q4
/19
Q1
/20
Q2
/20
Q3
/20
Q4
/20
Q1
/21
Q2
/21
Mining rate (tpd), LHS Grade mined (g/t Au), RHS
$0
$300
$600
$900
$1,200
$1,500
$1,800
0
10
20
30
40
50
60
Q2
/19
Q3
/19
Q4
/19
Q1
/20
Q2
/20
Q3
/20
Q4
/20
Q1
/21
Q2
/21
Gold Production (koz), LHS Total cash costs (US$/oz), RHS
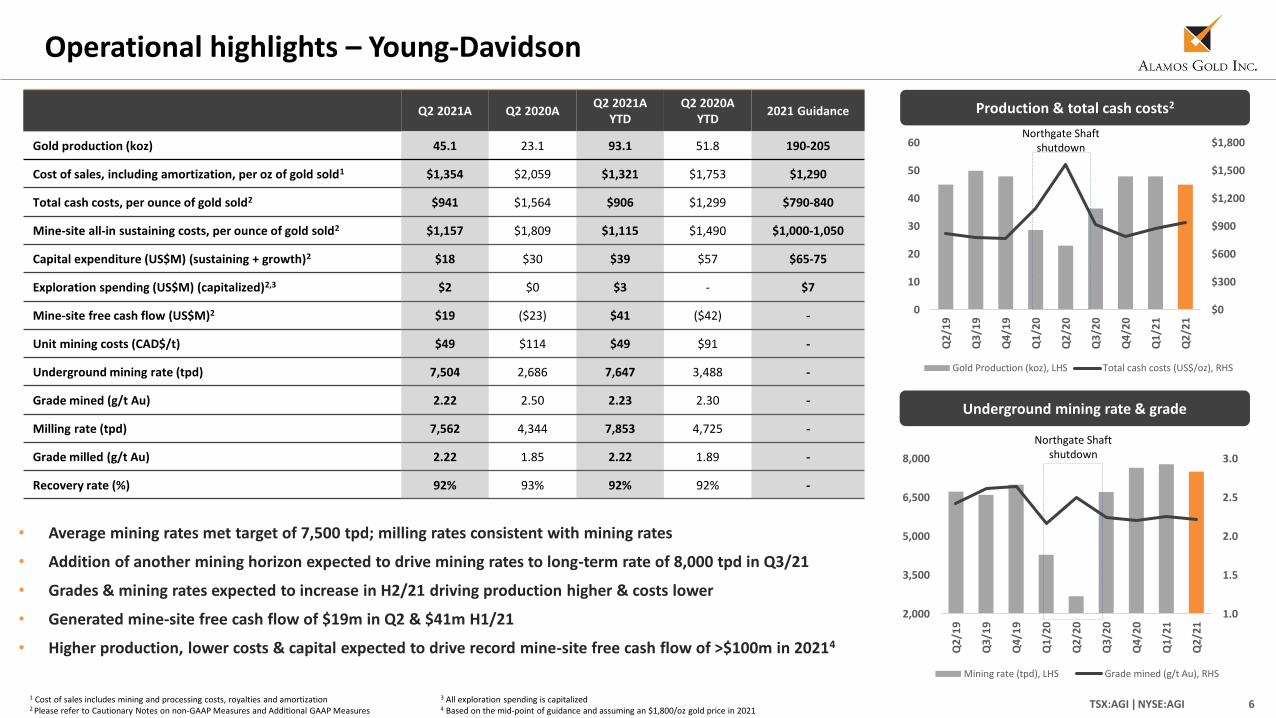
Operational highlights – Young-Davidson
Q2 2021A Q2 2020AQ2 2021A
YTDQ2 2020A
YTD2021 Guidance
Gold production (koz) 45.1 23.1 93.1 51.8 190-205
Cost of sales, including amortization, per oz of gold sold1 $1,354 $2,059 $1,321 $1,753 $1,290
Total cash costs, per ounce of gold sold2 $941 $1,564 $906 $1,299 $790-840
Mine-site all-in sustaining costs, per ounce of gold sold2 $1,157 $1,809 $1,115 $1,490 $1,000-1,050
Capital expenditure (US$M) (sustaining + growth)2 $18 $30 $39 $57 $65-75
Exploration spending (US$M) (capitalized)2,3 $2 $0 $3 - $7
Mine-site free cash flow (US$M)2 $19 ($23) $41 ($42) -
Unit mining costs (CAD$/t) $49 $114 $49 $91 -
Underground mining rate (tpd) 7,504 2,686 7,647 3,488 -
Grade mined (g/t Au) 2.22 2.50 2.23 2.30 -
Milling rate (tpd) 7,562 4,344 7,853 4,725 -
Grade milled (g/t Au) 2.22 1.85 2.22 1.89 -
Recovery rate (%) 92% 93% 92% 92% -
• Average mining rates met target of 7,500 tpd; milling rates consistent with mining rates
• Addition of another mining horizon expected to drive mining rates to long-term rate of 8,000 tpd in Q3/21
• Grades & mining rates expected to increase in H2/21 driving production higher & costs lower
• Generated mine-site free cash flow of $19m in Q2 & $41m H1/21
• Higher production, lower costs & capital expected to drive record mine-site free cash flow of >$100m in 20214
Production & total cash costs2
Underground mining rate & grade
Northgate Shaft shutdown
Northgate Shaft shutdown
1 Cost of sales includes mining and processing costs, royalties and amortization2 Please refer to Cautionary Notes on non-GAAP Measures and Additional GAAP Measures
3 All exploration spending is capitalized4 Based on the mid-point of guidance and assuming an $1,800/oz gold price in 2021
TSX:AGI ǀ NYSE:AGI 7
Operational highlights – Island Gold
Production & total cash costs2
Mining rate & grade mined
1 Cost of sales includes mining and processing costs, royalties and amortization2 Please refer to Cautionary Notes on non-GAAP Measures and Additional GAAP Measures 3 Exploration spending in Q2/21 totaled $5.7m, of which $3.9m was capitalized; H1/21 totaled $10.8m, of which $8.4m was capitalized
Q2 2021A Q2 2020AQ2 2021A
YTDQ2 2020A
YTD2021 Guidance
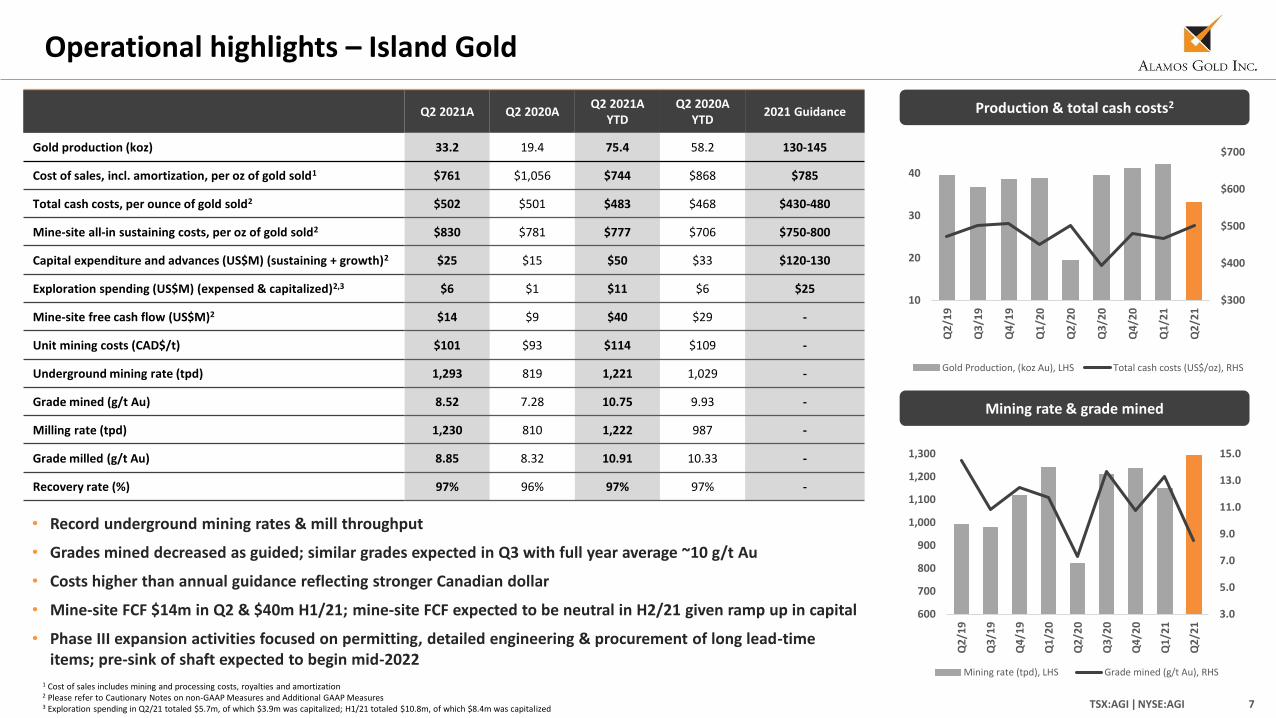
Gold production (koz) 33.2 19.4 75.4 58.2 130-145
Cost of sales, incl. amortization, per oz of gold sold1 $761 $1,056 $744 $868 $785
Total cash costs, per ounce of gold sold2 $502 $501 $483 $468 $430-480
Mine-site all-in sustaining costs, per oz of gold sold2 $830 $781 $777 $706 $750-800
Capital expenditure and advances (US$M) (sustaining + growth)2 $25 $15 $50 $33 $120-130
Exploration spending (US$M) (expensed & capitalized)2,3 $6 $1 $11 $6 $25
Mine-site free cash flow (US$M)2 $14 $9 $40 $29 -
Unit mining costs (CAD$/t) $101 $93 $114 $109 -
Underground mining rate (tpd) 1,293 819 1,221 1,029 -
Grade mined (g/t Au) 8.52 7.28 10.75 9.93 -
Milling rate (tpd) 1,230 810 1,222 987 -
Grade milled (g/t Au) 8.85 8.32 10.91 10.33 -
Recovery rate (%) 97% 96% 97% 97% -
• Record underground mining rates & mill throughput
• Grades mined decreased as guided; similar grades expected in Q3 with full year average ~10 g/t Au
• Costs higher than annual guidance reflecting stronger Canadian dollar
• Mine-site FCF $14m in Q2 & $40m H1/21; mine-site FCF expected to be neutral in H2/21 given ramp up in capital
• Phase III expansion activities focused on permitting, detailed engineering & procurement of long lead-time items; pre-sink of shaft expected to begin mid-2022
$300
$400
$500
$600
$700
10
20
30
40
Q2
/19
Q3
/19
Q4
/19
Q1
/20
Q2
/20
Q3
/20
Q4
/20
Q1
/21
Q2
/21
Gold Production, (koz Au), LHS Total cash costs (US$/oz), RHS
3.0
5.0
7.0
9.0
11.0
13.0
15.0
600
700
800
900
1,000
1,100
1,200
1,300
Q2
/19
Q3
/19
Q4
/19
Q1
/20
Q2
/20
Q3
/20
Q4
/20
Q1
/21
Q2
/21
Mining rate (tpd), LHS Grade mined (g/t Au), RHS

TSX:AGI ǀ NYSE:AGI 8
Operational highlights – Mulatos
Q2 2021A Q2 2020AQ2 2021A
YTDQ2 2020A
YTD2021 Guidance
Gold production (koz) 35.9 35.9 71.5 78.5 150-160
Cost of sales, including amortization, per ounce of gold sold1 $1,395 $1,116 $1,312 $1,078 $1,145
Total cash costs, per ounce of gold sold2 $893 $750 $906 $785 $840-890
Mine-site all-in sustaining costs, per ounce of gold sold2 $1,144 $890 $1,084 $929 $1,060-1,110
Capital expenditure and advances (US$M) (sustaining + growth)2 $31 $5 $64 $12 $125-135
Exploration spending (US$M) (expensed & capitalized)2,3 $3 $1 $4 $2 $9
Mine-site free cash flow (US$M)2 ($12) $19 ($36) $33 -
Waste-to-ore ratio (operating) 2.03 0.81 1.53 0.67 -
Tonnes of ore stacked (tpd) 20,900 15,500 20,600 18,923 -
Grade – crushed & stacked (g/t Au) 1.11 1.41 1.02 1.32 -
Recovery ratio (%) 53% 56% 58% 54% -
Production & total cash costs2
• Higher production expected in H2/21, consistent with full year guidance
• $6m cash tax payments in Q2/21 for 2021 installment payments; no significant cash taxes expected in H2/21
• Mine-site free cash flow of ($12m) reflects $24m growth capital at La Yaqui Grande & $6m cash tax payment
1 Cost of sales includes mining and processing costs, royalties, and amortization2 Please refer to Cautionary Notes on non-GAAP Measures and Additional GAAP Measures
Ore crushed & stacked & grade stacked
3 Exploration spending in Q2/21 was $2.5m, of which $1.0m was capitalized; H1/21 was $4.3m, of which $1.0m was capitalized
0
5,000
10,000
15,000
20,000
25,000
Q2
/19
Q3
/19
Q4
/19
Q1
/20
Q2
/20
Q3
/20
Q4
/20
Q1
/21
Q2
/21
0.00
0.20
0.40
0.60
0.80
1.00
1.20
1.40
1.60
Ore crushed & stacked (tpd), LHS Grade stacked (g/t Au), RHS
$500
$600
$700
$800
$900
$1,000
10
20
30
40
50
Q2
/19
Q3
/19
Q4
/19
Q1
/20
Q2
/20
Q3
/20
Q4
/20
Q1
/20
Q2
/21
Gold production (koz Au), LHS Total cash costs (US$/oz), RHS
TSX:AGI ǀ NYSE:AGI 9
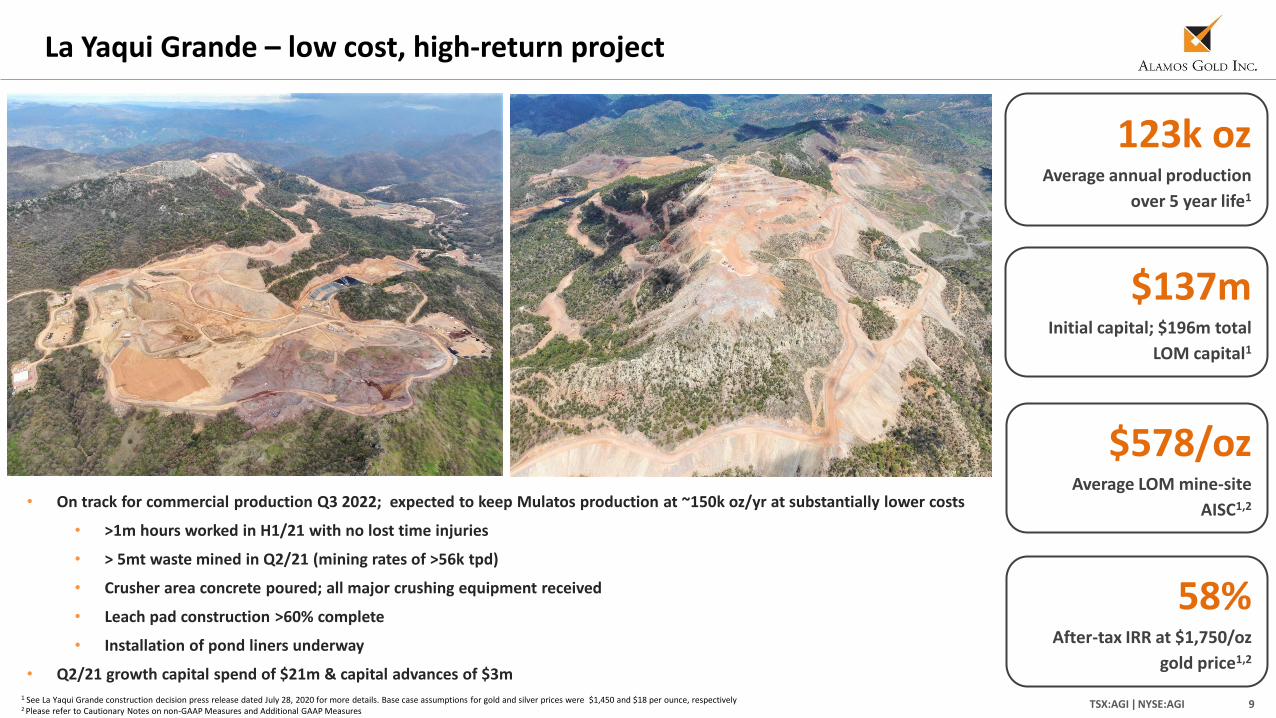
La Yaqui Grande – low cost, high-return project
123k ozAverage annual production
over 5 year life1
$578/ozAverage LOM mine-site
AISC1,2
1 See La Yaqui Grande construction decision press release dated July 28, 2020 for more details. Base case assumptions for gold and silver prices were $1,450 and $18 per ounce, respectively2 Please refer to Cautionary Notes on non-GAAP Measures and Additional GAAP Measures
58%After-tax IRR at $1,750/oz
gold price1,2
$137mInitial capital; $196m total
LOM capital1
• On track for commercial production Q3 2022; expected to keep Mulatos production at ~150k oz/yr at substantially lower costs
• >1m hours worked in H1/21 with no lost time injuries
• > 5mt waste mined in Q2/21 (mining rates of >56k tpd)
• Crusher area concrete poured; all major crushing equipment received
• Leach pad construction >60% complete
• Installation of pond liners underway
• Q2/21 growth capital spend of $21m & capital advances of $3m
TSX:AGI ǀ NYSE:AGI 10
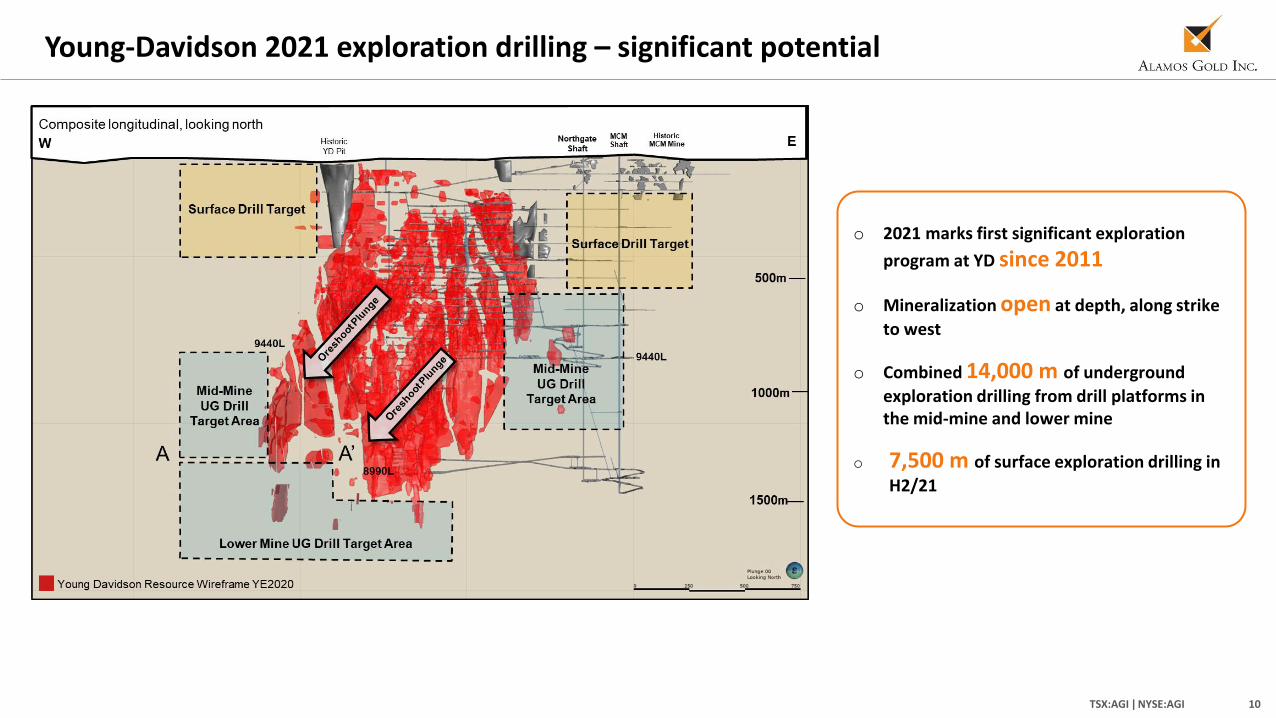
Young-Davidson 2021 exploration drilling – significant potential
o 2021 marks first significant exploration
program at YD since 2011
o Mineralization open at depth, along strike
to west
o Combined 14,000 m of underground
exploration drilling from drill platforms in the mid-mine and lower mine
o 7,500 m of surface exploration drilling in
H2/21

TSX:AGI ǀ NYSE:AGI 11
Young-Davidson exploration drilling – extending gold mineralization within syenite
Detailed Longitudinal – 8960L drilling
o Gold mineralization intersected
within syenite 220 m below
previous Mineral Resources in 2020 and extended an additional
150 m below Inferred Mineral
Resources in 2021
o High-grade mineralization
intersected 200 m outside of the
syenite in the hanging wall and
100 m from syenite contact in
the footwall

TSX:AGI ǀ NYSE:AGI 12
Island Gold 2021 exploration highlights – MH25-08 best hole ever drilled
2 km
- 500 m
Assays
cut to
185 g/t Au
Assays
cut to
225 g/t Au
250 m
W
- 1500 m
- 1000 m
E
Island West
620 Level
840 Level
Island Main
Island East
340 Level
Crown pillar
1000 Level
E
- 500 m
< 4.0
4.0 < 10.0
10.0 < 30.0
>= 30.0
Au Cut (g/t)
< 8
8 < 20
20 < 60
>= 60
Au Cut * True Width (gm/t)
New Drillhole Intersections
Previously Released Drillhole Intersections
HOLE-IDg/t Au Uncut (g/t Au cut) / True Width
metres
Measured Resources
R & R Year End 2020
Proven Reserves
Probable Reserves
Ramp & Development LEGEND
Indicated Resources
Inferred Resources
Diabase Dyke
Mined out
- 2000 m
- 500 m
- 1000 m
- 2000 m
MH25-0734.87 g/t Au (34.87 g/t Au cut) / 5.98 m
MH25-0871.21 g/t Au (39.24 g/t Au cut) / 21.33 m
740-471-4131.58 g/t Au (28.74 g/t Au cut) / 2.43 m
Planned Shaft
- 1500 m

TSX:AGI ǀ NYSE:AGI 13
752 887 1,007 1,215 1,310
91 111
196 184 166 996
908
1,573
2,298
3,208
457 556 662 812 951
0
2
4
6
8
10
12
14
16
(1,000)
-
1,000
2,000
3,000
4,000
5,000
2016 2017 2018 2019 2020
Island Gold – ongoing Reserve & Resource growth highlights significant upside
1 See Mineral Reserve and Resource estimates and associated footnotes in appendix2 Includes Proven & Probable Mineral Reserves of 1.3m oz (4.2 mt at 9.71 g/t Au), Measured & Indicated Mineral Resources of 166,000 oz (0.7 mt at 7.18 g/t Au) & Inferred Mineral Resources of 3.2m oz (6.9 mt at 14.43 g/t Au)
>83% conversion rate of Inferred Mineral
Resources to Reserves3
2.8m ozIncrease in Mineral Reserves &
Resources, since acquisition net of 508k oz of mining depletion3
Mineral Reserve grade
Mineral Reserves
M&I Mineral Resources
Inferred Mineral Resources
Cumulative oz produced
koz
Au
Gra
de
(g/t
Au
)
2
$11/ozDiscovery cost over past three years
18.6 g/t AuAverage grade of 910k oz increase in
2020 Inferred Mineral Resources
3 Since completion of acquisition of Island Gold in November 2017
Reserves & resources at time
of acquisition
Reserves & resources incorporated into
Phase III expansion study
Inferred Resource grade
TSX:AGI ǀ NYSE:AGI 14
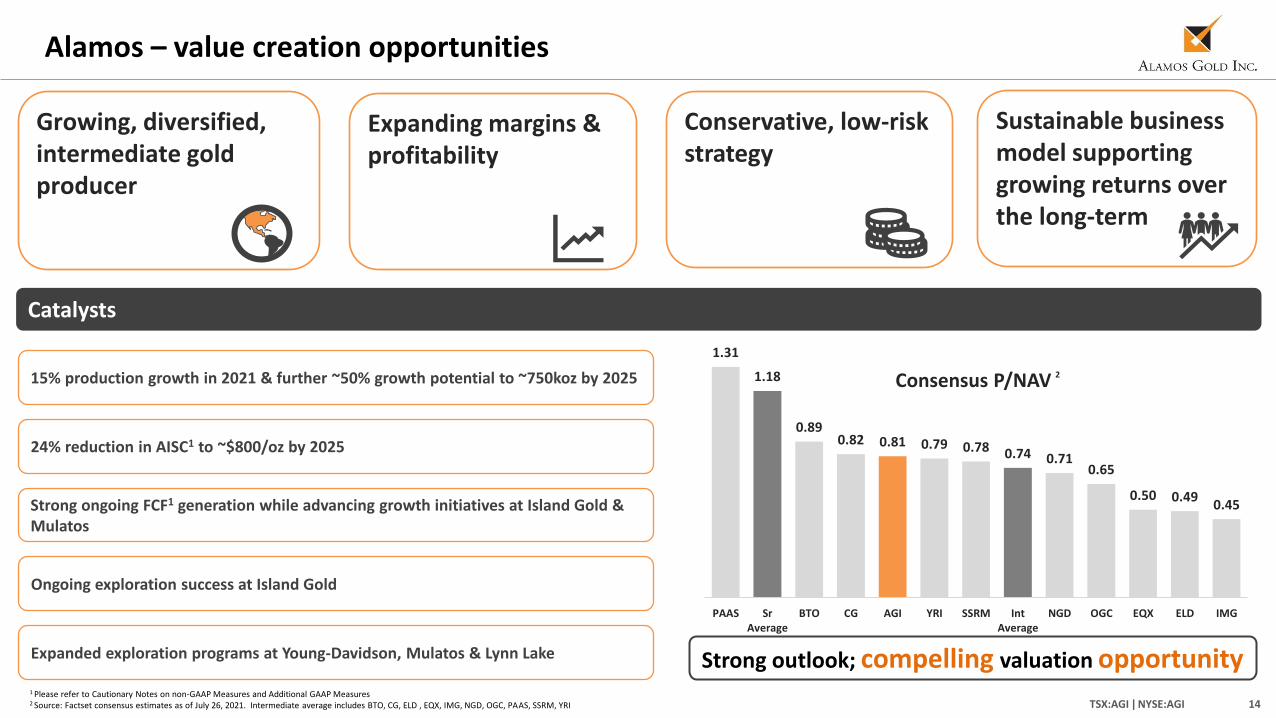
Alamos – value creation opportunities
1 Please refer to Cautionary Notes on non-GAAP Measures and Additional GAAP Measures 2 Source: Factset consensus estimates as of July 26, 2021. Intermediate average includes BTO, CG, ELD , EQX, IMG, NGD, OGC, PAAS, SSRM, YRI
Strong outlook; compelling valuation opportunity
Catalysts
Strong ongoing FCF1 generation while advancing growth initiatives at Island Gold & Mulatos
15% production growth in 2021 & further ~50% growth potential to ~750koz by 2025
24% reduction in AISC1 to ~$800/oz by 2025
Ongoing exploration success at Island Gold
Expanded exploration programs at Young-Davidson, Mulatos & Lynn Lake
2
Growing, diversified, intermediate gold producer
Expanding margins & profitability
Conservative, low-risk strategy
Sustainable business model supporting growing returns over the long-term
1.31
1.18
0.890.82 0.81 0.79 0.78 0.74 0.71
0.65
0.50 0.490.45
PAAS SrAverage
BTO CG AGI YRI SSRM IntAverage
NGD OGC EQX ELD IMG
Consensus P/NAV
TSX:AGI ǀ NYSE:AGI 15
Appendices

TSX:AGI ǀ NYSE:AGI 16
Board of Directors, Executive and Management Team
Board of Directors
Executive and Management Team
Paul J. Murphy John A. McCluskey Elaine Ellingham David Fleck David Gower Claire M. C. Kennedy Monique Mercier J. Robert S. Prichard Kenneth Stowe
Chairman Director Director Director Director Director Director Director Director
John A. McCluskey Jamie Porter Peter MacPhail Christine Barwell Chris Bostwick Luis Chavez Nils Engelstad
President and CEO Chief Financial Officer Chief Operating Officer VP, Human Resources VP, Technical Services Senior VP, Mexico VP, General Counsel
Greg Fisher John Fitzgerald Scott K. Parsons Scott R.G. Parsons Adrian Paulse Rebecca Thompson Colin Webster
VP, Finance VP, Projects VP, Investor Relations VP, Exploration VP, Information Technology VP, Public Affairs VP, Sustainability & External Affairs
TSX:AGI ǀ NYSE:AGI 17
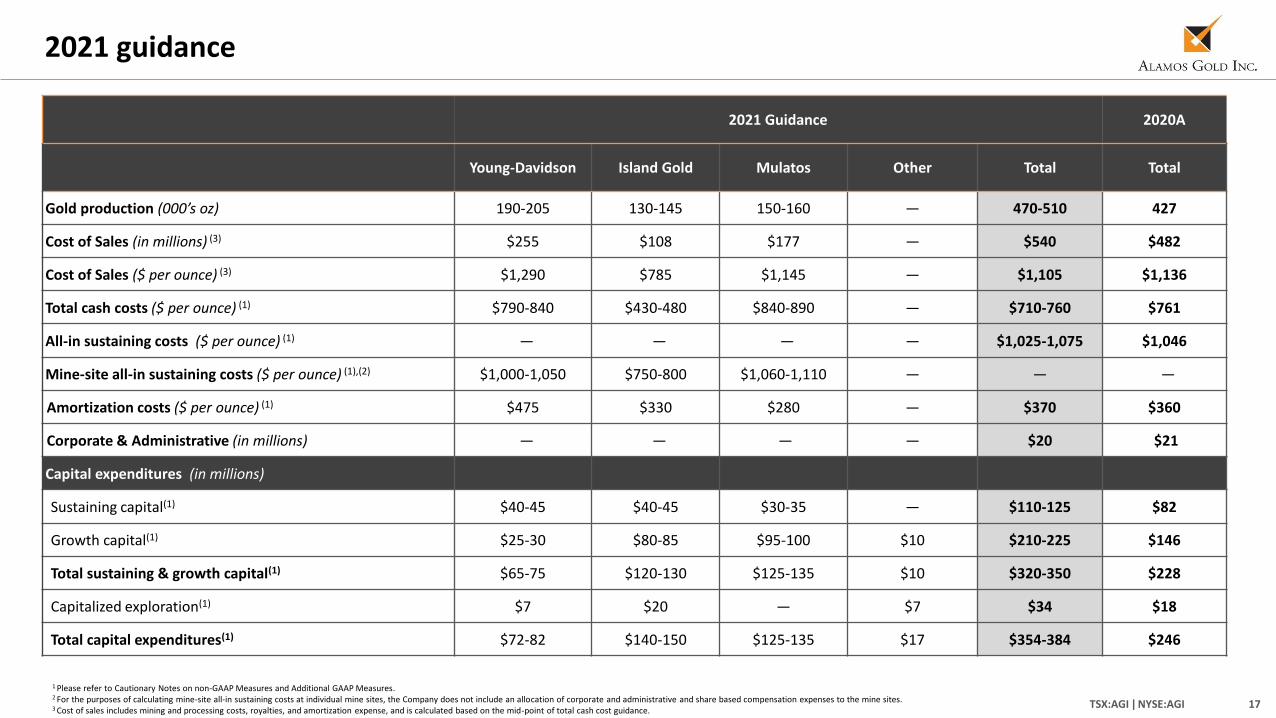
2021 Guidance 2020A
Young-Davidson Island Gold Mulatos Other Total Total
Gold production (000’s oz) 190-205 130-145 150-160 — 470-510 427
Cost of Sales (in millions) (3) $255 $108 $177 — $540 $482
Cost of Sales ($ per ounce) (3) $1,290 $785 $1,145 — $1,105 $1,136
Total cash costs ($ per ounce) (1) $790-840 $430-480 $840-890 — $710-760 $761
All-in sustaining costs ($ per ounce) (1) — — — — $1,025-1,075 $1,046
Mine-site all-in sustaining costs ($ per ounce) (1),(2) $1,000-1,050 $750-800 $1,060-1,110 — — —
Amortization costs ($ per ounce) (1) $475 $330 $280 — $370 $360
Corporate & Administrative (in millions) — — — — $20 $21
Capital expenditures (in millions)
Sustaining capital(1) $40-45 $40-45 $30-35 — $110-125 $82
Growth capital(1) $25-30 $80-85 $95-100 $10 $210-225 $146
Total sustaining & growth capital(1) $65-75 $120-130 $125-135 $10 $320-350 $228
Capitalized exploration(1) $7 $20 — $7 $34 $18
Total capital expenditures(1) $72-82 $140-150 $125-135 $17 $354-384 $246
2021 guidance
1 Please refer to Cautionary Notes on non-GAAP Measures and Additional GAAP Measures.2 For the purposes of calculating mine-site all-in sustaining costs at individual mine sites, the Company does not include an allocation of corporate and administrative and share based compensation expenses to the mine sites.3 Cost of sales includes mining and processing costs, royalties, and amortization expense, and is calculated based on the mid-point of total cash cost guidance.
TSX:AGI ǀ NYSE:AGI 18
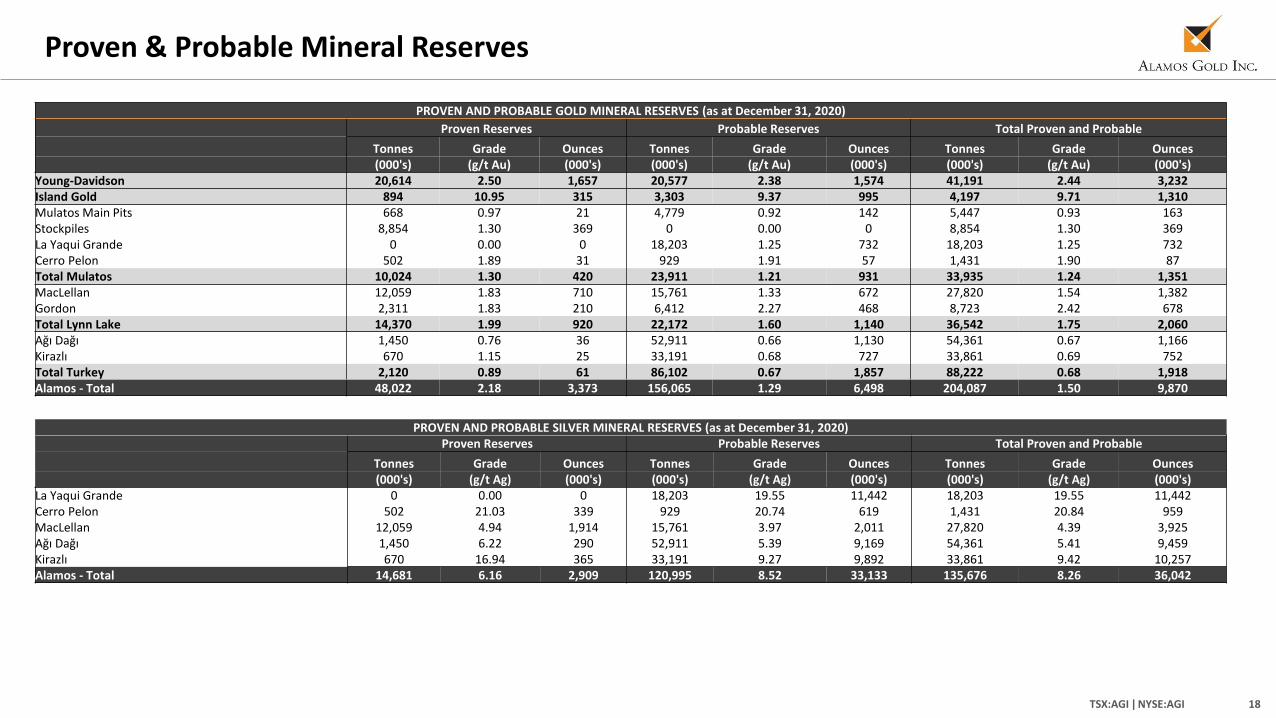
Proven & Probable Mineral Reserves
PROVEN AND PROBABLE GOLD MINERAL RESERVES (as at December 31, 2020)
Proven Reserves Probable Reserves Total Proven and Probable
Tonnes Grade Ounces Tonnes Grade Ounces Tonnes Grade Ounces(000's) (g/t Au) (000's) (000's) (g/t Au) (000's) (000's) (g/t Au) (000's)
Young-Davidson 20,614 2.50 1,657 20,577 2.38 1,574 41,191 2.44 3,232Island Gold 894 10.95 315 3,303 9.37 995 4,197 9.71 1,310Mulatos Main Pits 668 0.97 21 4,779 0.92 142 5,447 0.93 163Stockpiles 8,854 1.30 369 0 0.00 0 8,854 1.30 369La Yaqui Grande 0 0.00 0 18,203 1.25 732 18,203 1.25 732Cerro Pelon 502 1.89 31 929 1.91 57 1,431 1.90 87Total Mulatos 10,024 1.30 420 23,911 1.21 931 33,935 1.24 1,351MacLellan 12,059 1.83 710 15,761 1.33 672 27,820 1.54 1,382Gordon 2,311 1.83 210 6,412 2.27 468 8,723 2.42 678Total Lynn Lake 14,370 1.99 920 22,172 1.60 1,140 36,542 1.75 2,060Ağı Dağı 1,450 0.76 36 52,911 0.66 1,130 54,361 0.67 1,166Kirazlı 670 1.15 25 33,191 0.68 727 33,861 0.69 752Total Turkey 2,120 0.89 61 86,102 0.67 1,857 88,222 0.68 1,918Alamos - Total 48,022 2.18 3,373 156,065 1.29 6,498 204,087 1.50 9,870
PROVEN AND PROBABLE SILVER MINERAL RESERVES (as at December 31, 2020)Proven Reserves Probable Reserves Total Proven and Probable
Tonnes Grade Ounces Tonnes Grade Ounces Tonnes Grade Ounces(000's) (g/t Ag) (000's) (000's) (g/t Ag) (000's) (000's) (g/t Ag) (000's)
La Yaqui Grande 0 0.00 0 18,203 19.55 11,442 18,203 19.55 11,442Cerro Pelon 502 21.03 339 929 20.74 619 1,431 20.84 959MacLellan 12,059 4.94 1,914 15,761 3.97 2,011 27,820 4.39 3,925Ağı Dağı 1,450 6.22 290 52,911 5.39 9,169 54,361 5.41 9,459Kirazlı 670 16.94 365 33,191 9.27 9,892 33,861 9.42 10,257Alamos - Total 14,681 6.16 2,909 120,995 8.52 33,133 135,676 8.26 36,042

TSX:AGI ǀ NYSE:AGI 19
Total Measured & Indicated Mineral ResourcesMEASURED AND INDICATED GOLD MINERAL RESOURCES (as at December 31, 2020)
Measured Resources Indicated Resources Total Measured and Indicated
Tonnes Grade Ounces Tonnes Grade Ounces Tonnes Grade Ounces(000's) (g/t Au) (000's) (000's) (g/t Au) (000's) (000's) (g/t Au) (000's)
Young-Davidson - Surface 496 1.13 18 1,242 1.28 51 1,739 1.24 69Young-Davidson - Underground 6,019 3.44 665 3,253 3.88 406 9,272 3.59 1,071Total Young-Davidson 6,515 3.26 683 4,495 3.16 457 11,011 3.22 1,140Island Gold 14 4.61 2 704 7.23 164 718 7.18 166Mulatos 8,207 1.25 329 63,112 1.08 2,189 71,319 1.10 2,518La Yaqui Grande 0 0.00 0 1,237 0.81 32 1,237 0.80 32Cerro Pelon 74 1.92 5 208 1.39 9 282 1.54 14Carricito 58 0.82 2 1,297 0.82 34 1,355 0.83 36Total Mulatos 8,339 1.25 336 65,854 1.07 2,264 74,193 1.09 2,600MacLellan - Open Pit 902 2.07 60 3,532 1.71 194 4,434 1.78 254MacLellan - Underground 0 0.00 0 123 3.54 14 123 3.54 14Gordon 105 1.86 6 1,511 2.06 100 1,617 2.05 106Burnt Timber 0 0.00 0 1,021 1.40 46 1,021 1.40 46Linkwood 0 0.00 0 984 1.16 37 984 1.17 37Total Lynn Lake 1,007 2.04 66 7,172 1.70 391 8,178 1.74 457Esperanza 19,226 1.01 622 15,126 0.95 462 34,352 0.98 1,084Ağı Dağı 553 0.44 8 34,334 0.46 510 34,887 0.46 518Kirazlı 0 0.00 0 3,056 0.42 42 3,056 0.43 42Çamyurt 513 1.00 16 17,208 0.89 492 17,721 0.89 508Total Turkey 1,066 0.70 24 54,598 0.59 1,044 55,664 0.60 1,068Quartz Mountain 214 0.95 7 11,942 0.87 333 12,156 0.87 339Alamos - Total 36,381 1.49 1,740 159,891 1.00 5,115 196,272 1.09 6,855
MEASURED AND INDICATED SILVER MINERAL RESOURCES (as at December 31, 2020)Measured Resources Indicated Resources Total Measured and Indicated
Tonnes Grade Ounces Tonnes Grade Ounces Tonnes Grade Ounces(000's) (g/t Ag) (000's) (000's) (g/t Ag) (000's) (000's) (g/t Ag) (000's)
La Yaqui Grande 0 0.00 0 1,237 11 448 1,237 11 448Cerro Pelon 74 16.80 40 208 17 114 282 17 154MacLellan - Open Pit 902 8.55 248 3,532 4.64 527 4,434 5.44 775MacLellan - Underground 0 0.00 0 123 6.05 24 123 6.05 24Esperanza 19,226 7.25 4,482 15,126 9.16 4,455 34,352 8.09 8,936Ağı Dağı 553 1.59 28 34,334 2.19 2,417 34,887 2.18 2,445Kirazlı 0 0.00 0 3,056 2.71 266 3,056 2.71 266Çamyurt 513 5.63 93 17,208 6.15 3,404 17,721 6.14 3,497Alamos - Total 21,268 7.15 4,890 74,824 4.84 11,655 96,092 5.36 16,545
TSX:AGI ǀ NYSE:AGI 20
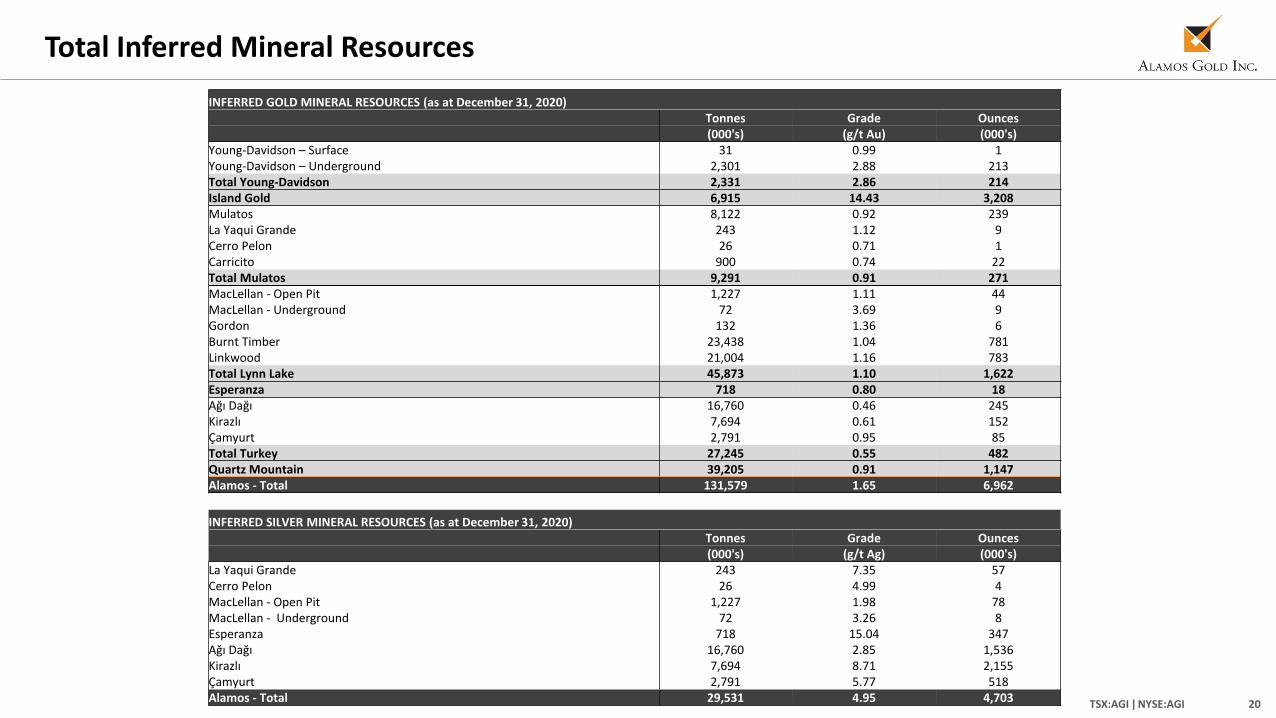
Total Inferred Mineral Resources
INFERRED GOLD MINERAL RESOURCES (as at December 31, 2020)Tonnes Grade Ounces(000's) (g/t Au) (000's)
Young-Davidson – Surface 31 0.99 1Young-Davidson – Underground 2,301 2.88 213Total Young-Davidson 2,331 2.86 214Island Gold 6,915 14.43 3,208Mulatos 8,122 0.92 239La Yaqui Grande 243 1.12 9Cerro Pelon 26 0.71 1Carricito 900 0.74 22Total Mulatos 9,291 0.91 271MacLellan - Open Pit 1,227 1.11 44MacLellan - Underground 72 3.69 9Gordon 132 1.36 6Burnt Timber 23,438 1.04 781Linkwood 21,004 1.16 783Total Lynn Lake 45,873 1.10 1,622Esperanza 718 0.80 18Ağı Dağı 16,760 0.46 245Kirazlı 7,694 0.61 152Çamyurt 2,791 0.95 85Total Turkey 27,245 0.55 482Quartz Mountain 39,205 0.91 1,147Alamos - Total 131,579 1.65 6,962
INFERRED SILVER MINERAL RESOURCES (as at December 31, 2020)Tonnes Grade Ounces(000's) (g/t Ag) (000's)
La Yaqui Grande 243 7.35 57Cerro Pelon 26 4.99 4MacLellan - Open Pit 1,227 1.98 78MacLellan - Underground 72 3.26 8Esperanza 718 15.04 347Ağı Dağı 16,760 2.85 1,536Kirazlı 7,694 8.71 2,155Çamyurt 2,791 5.77 518Alamos - Total 29,531 4.95 4,703
TSX:AGI ǀ NYSE:AGI 21
Notes to Mineral Reserve and Resource estimates
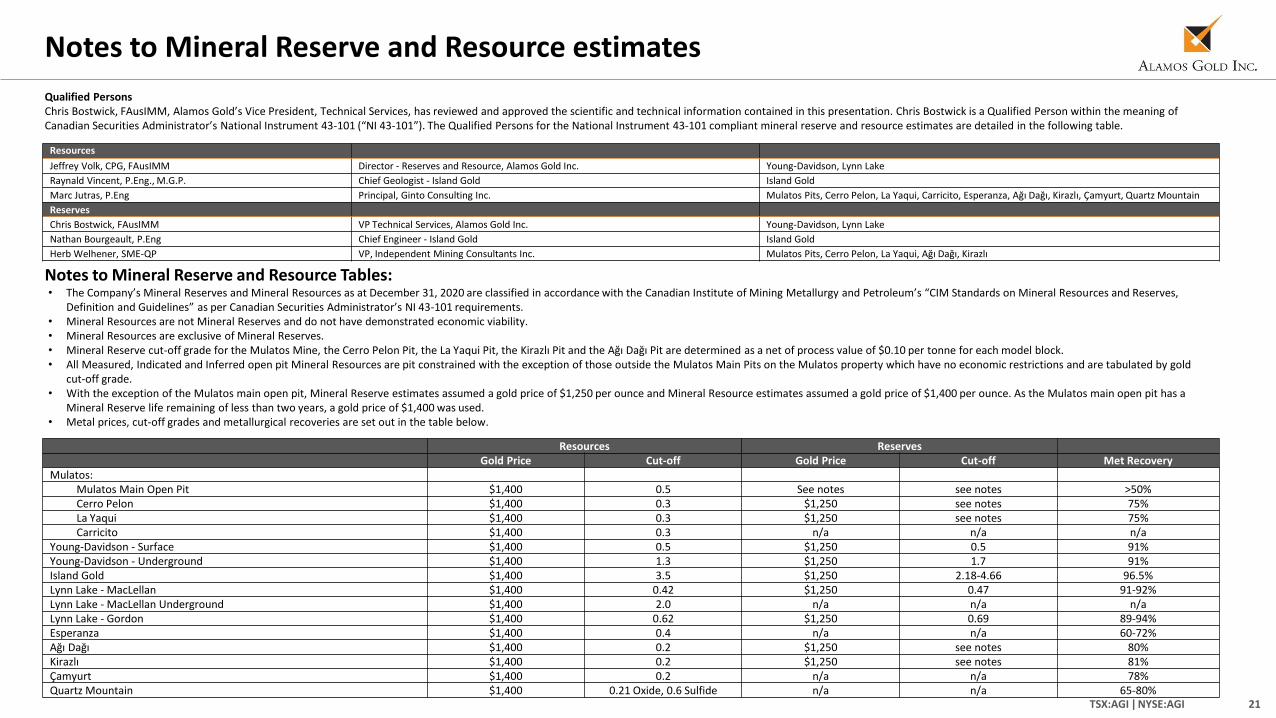
Notes to Mineral Reserve and Resource Tables:• The Company’s Mineral Reserves and Mineral Resources as at December 31, 2020 are classified in accordance with the Canadian Institute of Mining Metallurgy and Petroleum’s “CIM Standards on Mineral Resources and Reserves,
Definition and Guidelines” as per Canadian Securities Administrator’s NI 43-101 requirements. • Mineral Resources are not Mineral Reserves and do not have demonstrated economic viability.• Mineral Resources are exclusive of Mineral Reserves.• Mineral Reserve cut-off grade for the Mulatos Mine, the Cerro Pelon Pit, the La Yaqui Pit, the Kirazlı Pit and the Ağı Dağı Pit are determined as a net of process value of $0.10 per tonne for each model block.• All Measured, Indicated and Inferred open pit Mineral Resources are pit constrained with the exception of those outside the Mulatos Main Pits on the Mulatos property which have no economic restrictions and are tabulated by gold
cut-off grade.• With the exception of the Mulatos main open pit, Mineral Reserve estimates assumed a gold price of $1,250 per ounce and Mineral Resource estimates assumed a gold price of $1,400 per ounce. As the Mulatos main open pit has a
Mineral Reserve life remaining of less than two years, a gold price of $1,400 was used.• Metal prices, cut-off grades and metallurgical recoveries are set out in the table below.
Qualified PersonsChris Bostwick, FAusIMM, Alamos Gold’s Vice President, Technical Services, has reviewed and approved the scientific and technical information contained in this presentation. Chris Bostwick is a Qualified Person within the meaning of Canadian Securities Administrator’s National Instrument 43-101 (“NI 43-101”). The Qualified Persons for the National Instrument 43-101 compliant mineral reserve and resource estimates are detailed in the following table.
Resources
Jeffrey Volk, CPG, FAusIMM Director - Reserves and Resource, Alamos Gold Inc. Young-Davidson, Lynn Lake
Raynald Vincent, P.Eng., M.G.P. Chief Geologist - Island Gold Island Gold
Marc Jutras, P.Eng Principal, Ginto Consulting Inc. Mulatos Pits, Cerro Pelon, La Yaqui, Carricito, Esperanza, Ağı Dağı, Kirazlı, Çamyurt, Quartz Mountain
Reserves
Chris Bostwick, FAusIMM VP Technical Services, Alamos Gold Inc. Young-Davidson, Lynn Lake
Nathan Bourgeault, P.Eng Chief Engineer - Island Gold Island Gold
Herb Welhener, SME-QP VP, Independent Mining Consultants Inc. Mulatos Pits, Cerro Pelon, La Yaqui, Ağı Dağı, Kirazlı
Resources ReservesGold Price Cut-off Gold Price Cut-off Met Recovery
Mulatos:Mulatos Main Open Pit $1,400 0.5 See notes see notes >50%Cerro Pelon $1,400 0.3 $1,250 see notes 75%La Yaqui $1,400 0.3 $1,250 see notes 75%Carricito $1,400 0.3 n/a n/a n/a
Young-Davidson - Surface $1,400 0.5 $1,250 0.5 91%Young-Davidson - Underground $1,400 1.3 $1,250 1.7 91%Island Gold $1,400 3.5 $1,250 2.18-4.66 96.5%Lynn Lake - MacLellan $1,400 0.42 $1,250 0.47 91-92%Lynn Lake - MacLellan Underground $1,400 2.0 n/a n/a n/aLynn Lake - Gordon $1,400 0.62 $1,250 0.69 89-94%Esperanza $1,400 0.4 n/a n/a 60-72%Ağı Dağı $1,400 0.2 $1,250 see notes 80%Kirazlı $1,400 0.2 $1,250 see notes 81%Çamyurt $1,400 0.2 n/a n/a 78%Quartz Mountain $1,400 0.21 Oxide, 0.6 Sulfide n/a n/a 65-80%

TSX:AGI ǀ NYSE:AGI 22
Scott K. Parsons, CFAVP, Investor Relations416.368.9932 x 5439