second quarter ended june 30, 2017 - tfi...
TRANSCRIPT
Second Quarter Ended June 30, 2017
2
In the interest of providing shareholders and potential investors with information regarding TFIInternational, including management’s assessment of future plans and operations, certainstatements in this presentation are forward-looking statements subject to risks, uncertaintiesand other important factors that could cause the Company’s actual performance to differmaterially from those expressed in or implied by such statements.
Such factors are further discussed under Risks and Uncertainties in the Company’s AnnualInformation Form and MD&A, but readers are cautioned that the list of factors that may affectfuture growth, results and performance is not exhaustive, and undue reliance should not beplaced on forward-looking statements.
Although the Company believes that the expectations conveyed by the forward-lookingstatements are based on information available to it on the date such statements were made,there can be no assurance that such expectations will prove to be correct. All subsequentforward-looking statements, whether written or orally attributable to the Company or personsacting on its behalf, are expressly qualified in their entirety by these cautionary statements.
Unless otherwise required by applicable securities laws, the Company expressly disclaims anyintention, and assumes no obligation, to update or revise any forward-looking statements,whether as a result of new information, future events or otherwise.
Forward-Looking Statements
3
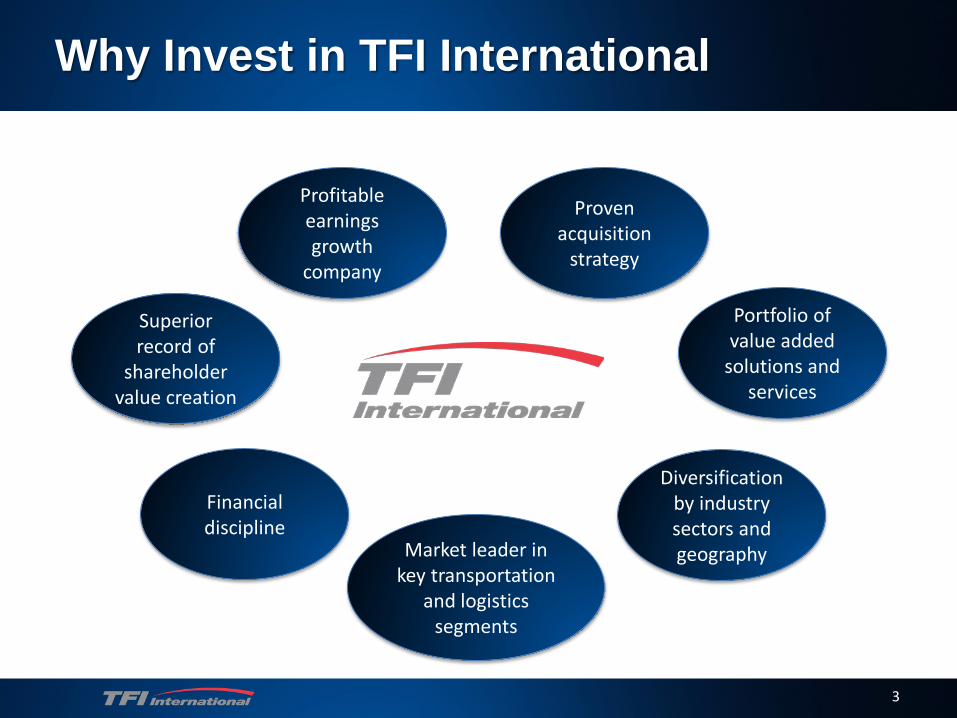
Why Invest in TFI International
Proven acquisition
strategy
Profitable earnings growth
company
Diversification by industry sectors and geographyMarket leader in
key transportation and logistics
segments
Portfolio of value added
solutions and services
Superior record of
shareholder value creation
Financial discipline
4
Creating Shareholder Value
• Solidifying our position as a leader in the North American transportation and logistics industry
• Delivering profitable earnings growth – both organic and through our proven acquisition strategy– Disciplined, strategic, and profitable acquisitions and partnerships– Focus on operations, integration, and realization of synergies
• Maintaining a strong balance sheet and access to capital
• Leveraging our team of dedicated professionals to provide value-added services and solutions across each of our business segments
5
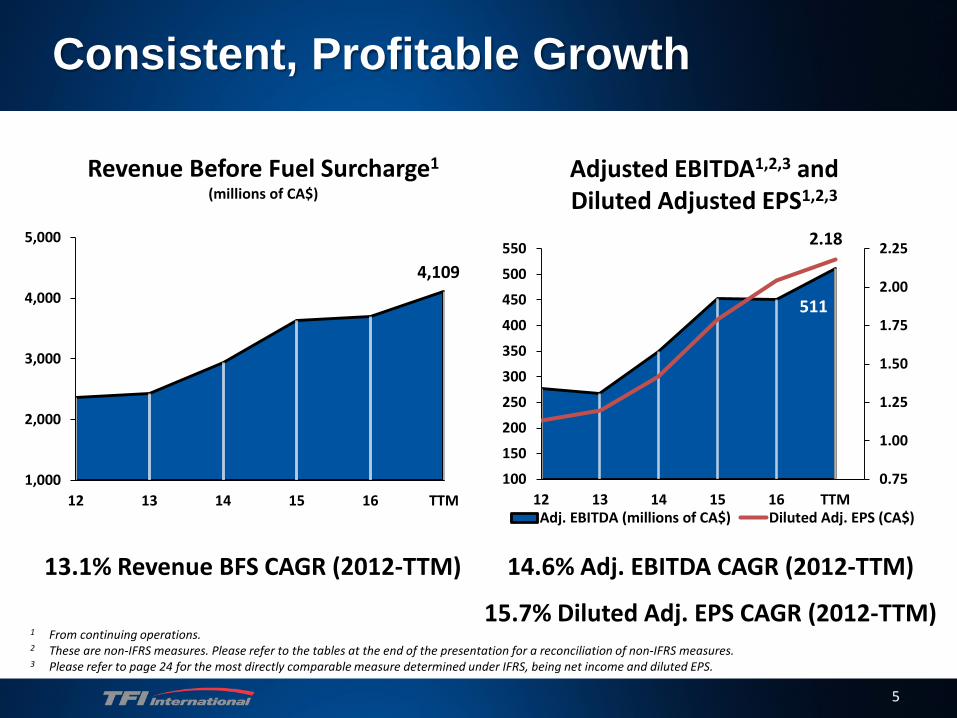
Consistent, Profitable Growth
13.1% Revenue BFS CAGR (2012-TTM) 14.6% Adj. EBITDA CAGR (2012-TTM)
Revenue Before Fuel Surcharge1
(millions of CA$)Adjusted EBITDA1,2,3 andDiluted Adjusted EPS1,2,3
15.7% Diluted Adj. EPS CAGR (2012-TTM)
511
2.18
0.75
1.00
1.25
1.50
1.75
2.00
2.25
100
150
200
250
300
350
400
450
500
550
12 13 14 15 16 TTMAdj. EBITDA (millions of CA$) Diluted Adj. EPS (CA$)
1 From continuing operations.2 These are non-IFRS measures. Please refer to the tables at the end of the presentation for a reconciliation of non-IFRS measures.3 Please refer to page 24 for the most directly comparable measure determined under IFRS, being net income and diluted EPS.
4,109
1,000
2,000
3,000
4,000
5,000
12 13 14 15 16 TTM
6
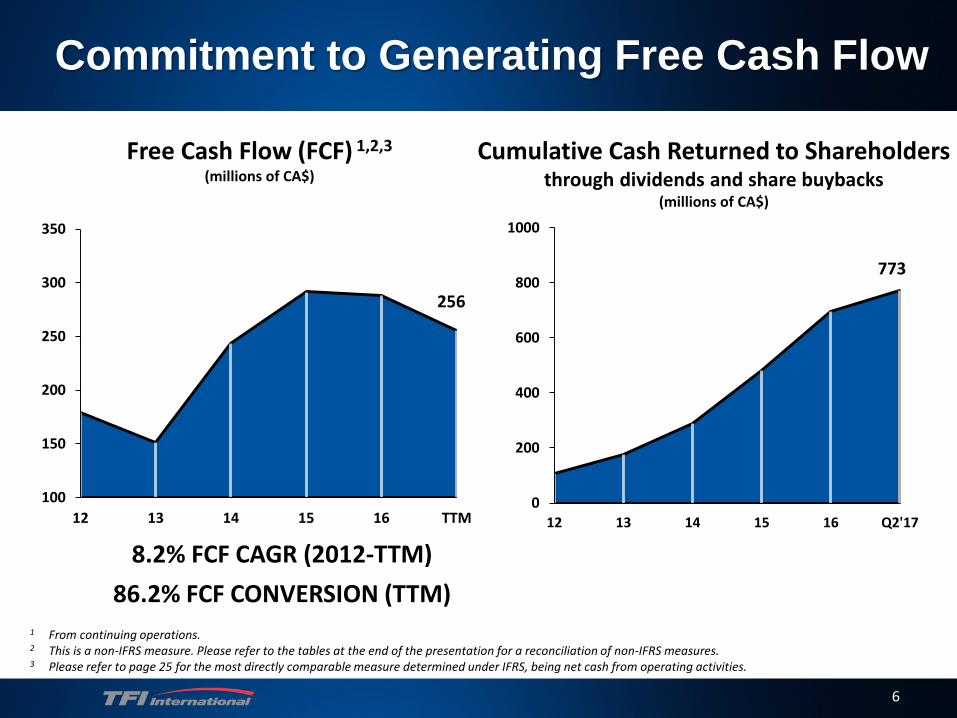
Commitment to Generating Free Cash Flow
Free Cash Flow (FCF) 1,2,3
(millions of CA$)Cumulative Cash Returned to Shareholders
through dividends and share buybacks(millions of CA$)
8.2% FCF CAGR (2012-TTM)86.2% FCF CONVERSION (TTM)
256
100
150
200
250
300
350
12 13 14 15 16 TTM
773
0
200
400
600
800
1000
12 13 14 15 16 Q2'17
1 From continuing operations.2 This is a non-IFRS measure. Please refer to the tables at the end of the presentation for a reconciliation of non-IFRS measures.3 Please refer to page 25 for the most directly comparable measure determined under IFRS, being net cash from operating activities.
0%
50%
100%
150%
200%
250%
300%
Jul-12 Jul-13 Jul-14 Jul-15 Jul-16 Jul-17
7
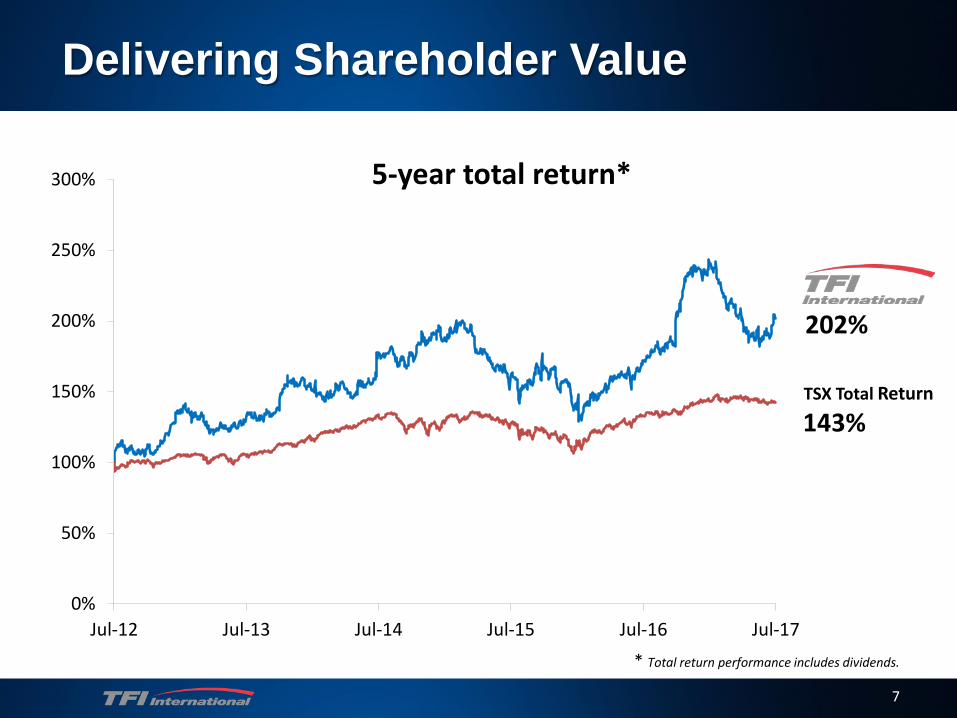
Delivering Shareholder Value
TSX Total Return
* Total return performance includes dividends.
5-year total return*
202%
143%
8
Review of TFI International
9
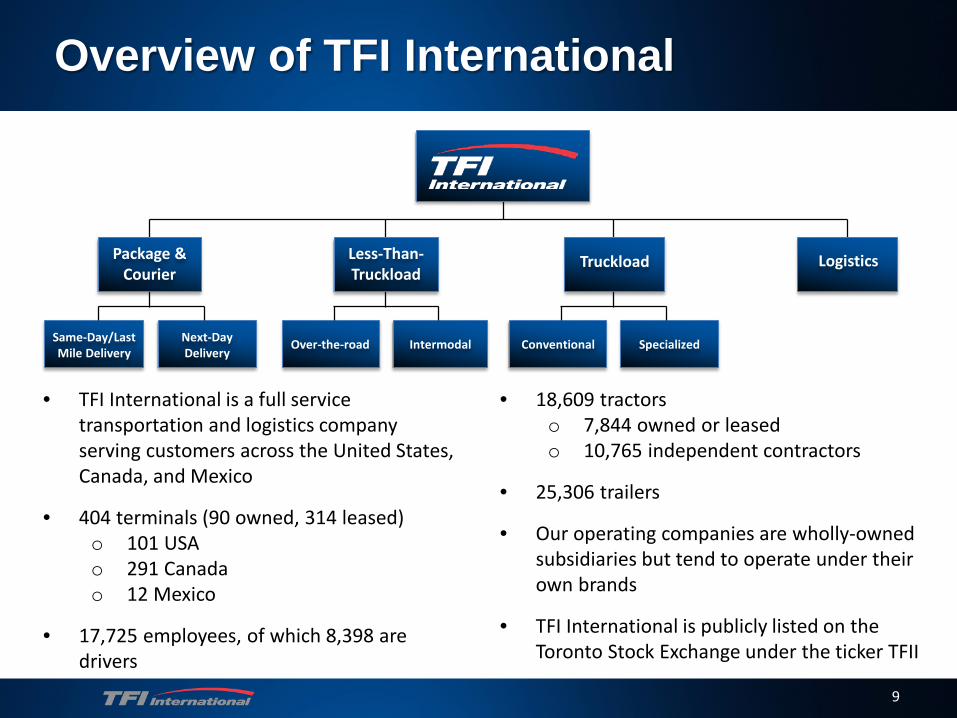
Overview of TFI International
• TFI International is a full service transportation and logistics company serving customers across the United States, Canada, and Mexico
• 404 terminals (90 owned, 314 leased)o 101 USAo 291 Canadao 12 Mexico
• 17,725 employees, of which 8,398 are drivers
• 18,609 tractorso 7,844 owned or leasedo 10,765 independent contractors
• 25,306 trailers
• Our operating companies are wholly-owned subsidiaries but tend to operate under their own brands
• TFI International is publicly listed on the Toronto Stock Exchange under the ticker TFII
Same-Day/Last Mile Delivery
Next-Day Delivery
Over-the-road Intermodal Conventional Specialized
Package &Courier
Less-Than-Truckload
Truckload Logistics
10
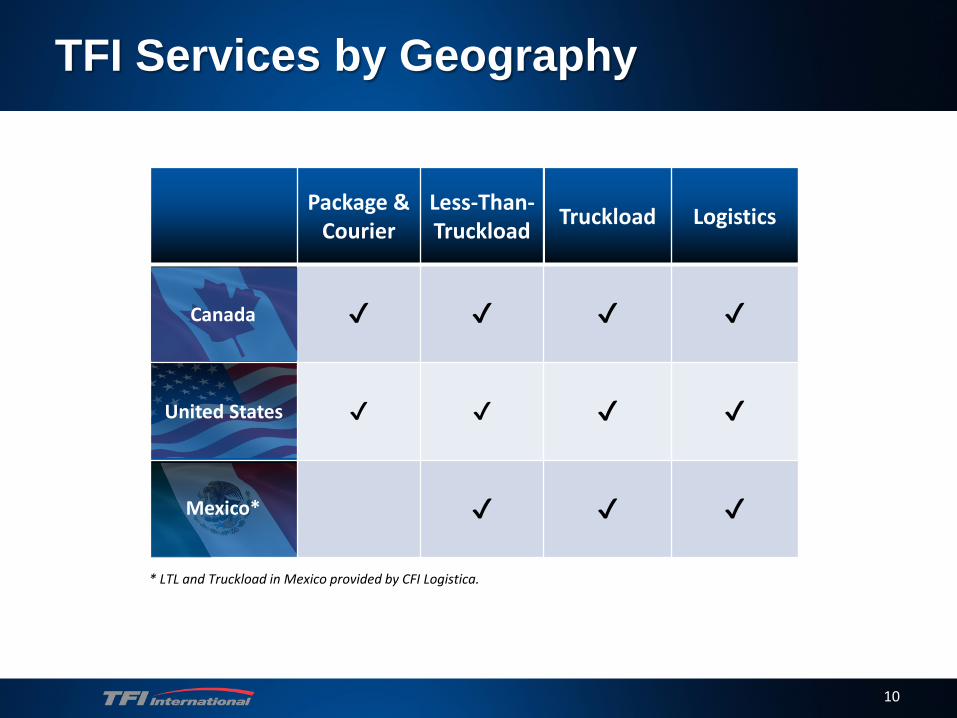
TFI Services by Geography
Package & Courier
Less-Than-Truckload Truckload Logistics
✔ ✔ ✔ ✔
✔ ✔ ✔ ✔
✔ ✔ ✔
Canada
United States
Mexico*
* LTL and Truckload in Mexico provided by CFI Logistica.
11
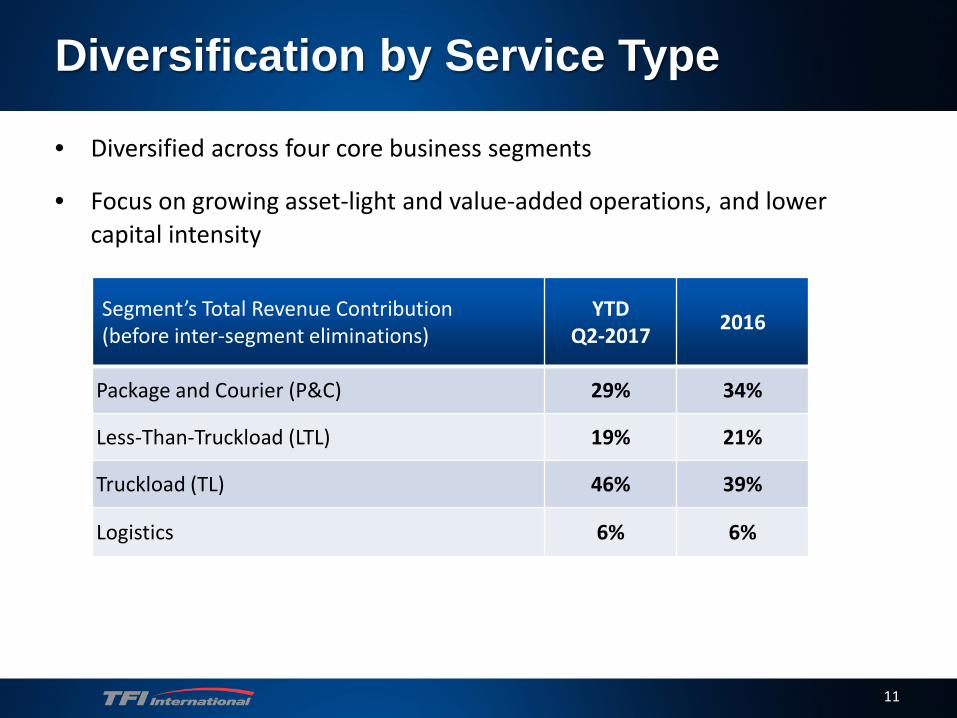
Diversification by Service Type
• Diversified across four core business segments
• Focus on growing asset-light and value-added operations, and lower capital intensity
Segment’s Total Revenue Contribution (before inter-segment eliminations)
YTDQ2-2017 2016
Package and Courier (P&C) 29% 34%
Less-Than-Truckload (LTL) 19% 21%
Truckload (TL) 46% 39%
Logistics 6% 6%
12
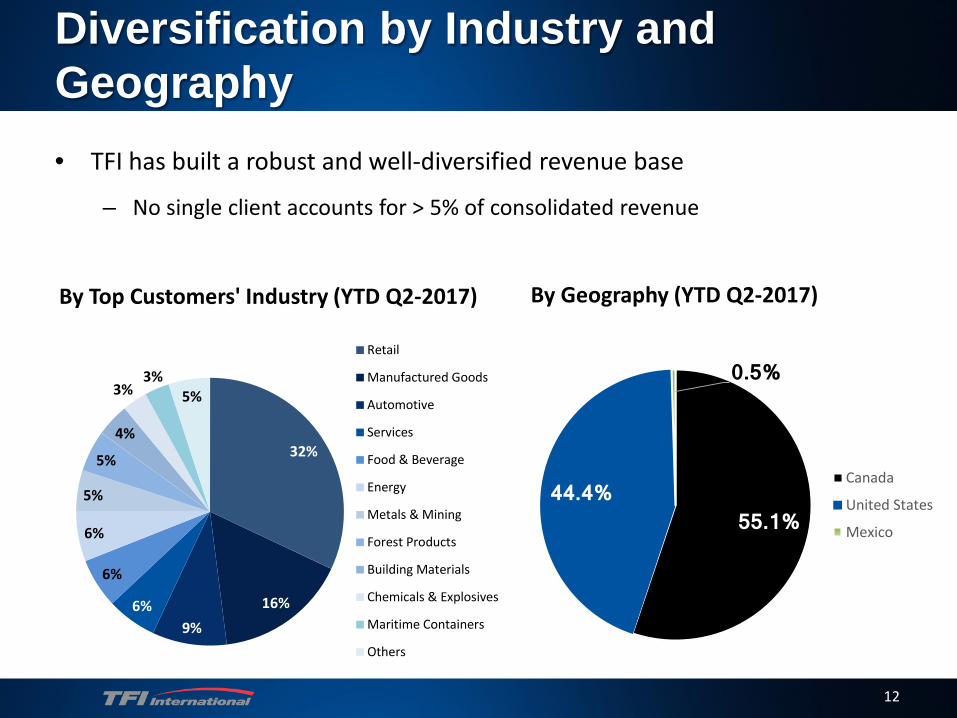
Diversification by Industry and Geography• TFI has built a robust and well-diversified revenue base
– No single client accounts for > 5% of consolidated revenue
By Top Customers' Industry (YTD Q2-2017) By Geography (YTD Q2-2017)
32%
16%9%
6%
6%
6%
5%
5%
4%
3%3%
5%
Retail
Manufactured Goods
Automotive
Services
Food & Beverage
Energy
Metals & Mining
Forest Products
Building Materials
Chemicals & Explosives
Maritime Containers
Others
55.1%44.4%
0.5%
Canada
United States
Mexico
13
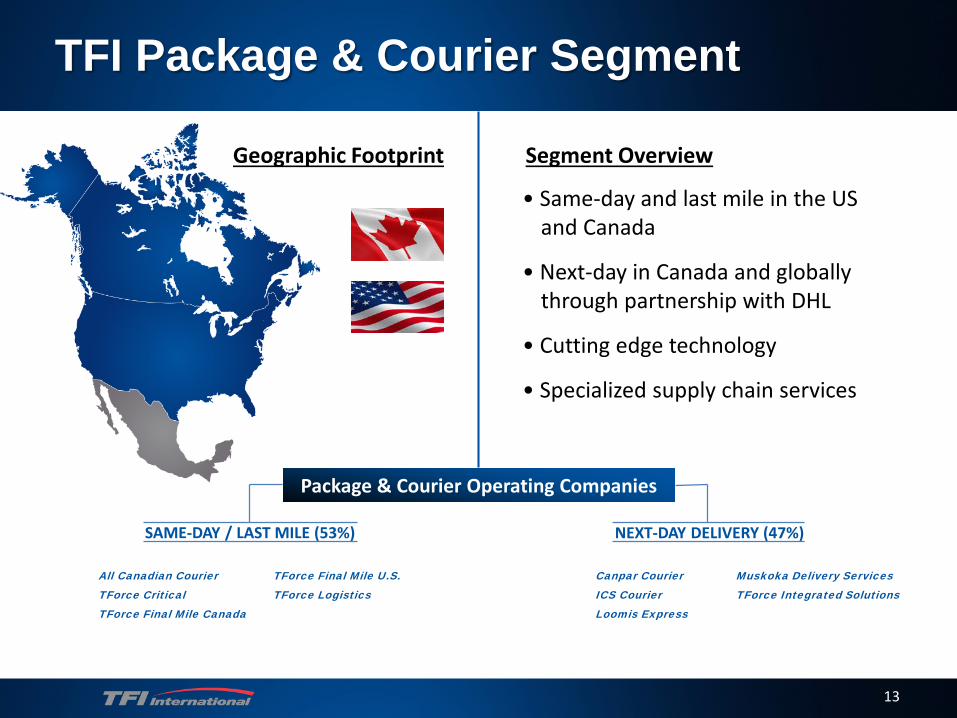
TFI Package & Courier Segment
Segment OverviewGeographic Footprint
Package & Courier Operating Companies
SAME-DAY / LAST MILE (53%) NEXT-DAY DELIVERY (47%)
• Same-day and last mile in the US and Canada
• Next-day in Canada and globally through partnership with DHL
• Cutting edge technology
• Specialized supply chain services
All Canadian CourierTForce CriticalTForce Final Mile Canada
Canpar CourierICS CourierLoomis Express
TForce Final Mile U.S.TForce Logistics
Muskoka Delivery ServicesTForce Integrated Solutions
14
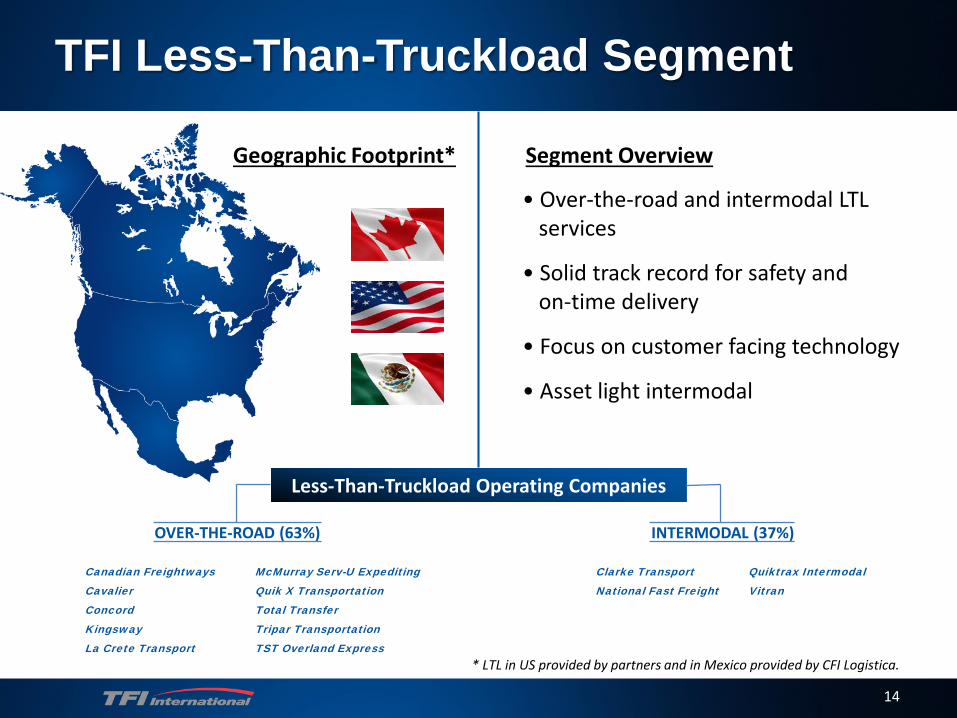
TFI Less-Than-Truckload Segment
• Over-the-road and intermodal LTL services
• Solid track record for safety and on-time delivery
• Focus on customer facing technology
• Asset light intermodal
Segment OverviewGeographic Footprint*
Less-Than-Truckload Operating Companies
OVER-THE-ROAD (63%) INTERMODAL (37%)
* LTL in US provided by partners and in Mexico provided by CFI Logistica.
Canadian Freightways CavalierConcord Kingsway La Crete Transport
Clarke Transport National Fast Freight
Quiktrax Intermodal Vitran
McMurray Serv-U ExpeditingQuik X Transportation Total Transfer Tripar Transportation TST Overland Express
15
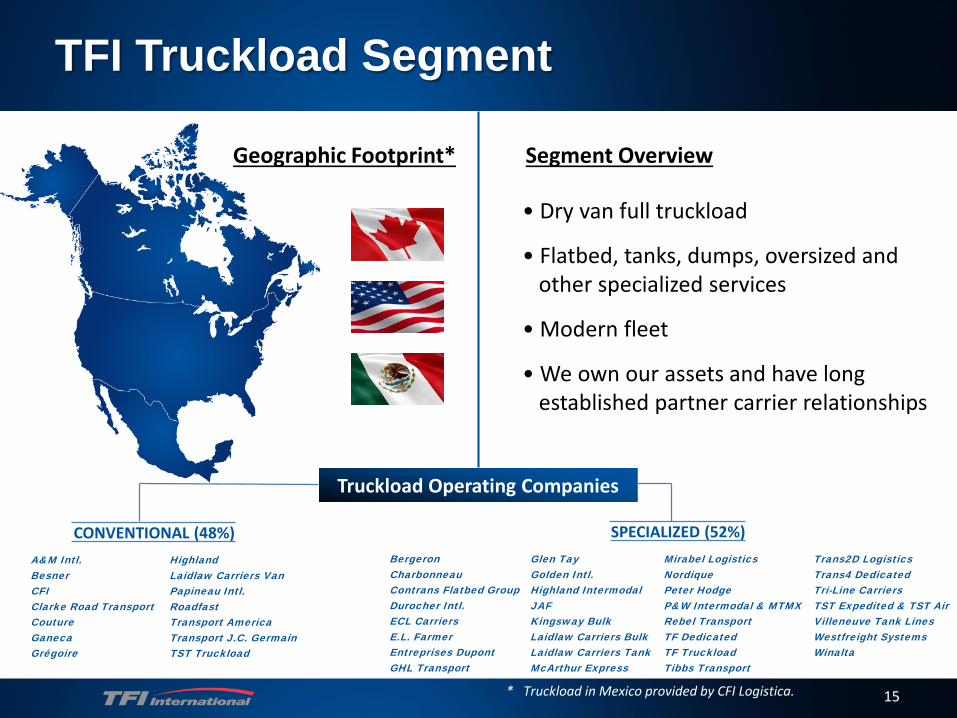
TFI Truckload Segment
• Dry van full truckload
• Flatbed, tanks, dumps, oversized and other specialized services
• Modern fleet
• We own our assets and have long established partner carrier relationships
Segment Overview
Truckload Operating Companies
CONVENTIONAL (48%) SPECIALIZED (52%)
Geographic Footprint*
* Truckload in Mexico provided by CFI Logistica.
A&M Intl.Besner CFIClarke Road Transport CoutureGanecaGrégoire
BergeronCharbonneauContrans Flatbed GroupDurocher Intl.ECL CarriersE.L. FarmerEntreprises DupontGHL Transport
Highland Laidlaw Carriers VanPapineau Intl.RoadfastTransport AmericaTransport J.C. GermainTST Truckload
Glen TayGolden Intl. Highland Intermodal JAF Kingsway BulkLaidlaw Carriers BulkLaidlaw Carriers TankMcArthur Express
Mirabel LogisticsNordique Peter HodgeP&W Intermodal & MTMX Rebel TransportTF DedicatedTF TruckloadTibbs Transport
Trans2D LogisticsTrans4 DedicatedTri-Line Carriers TST Expedited & TST AirVilleneuve Tank Lines Westfreight Systems Winalta
16
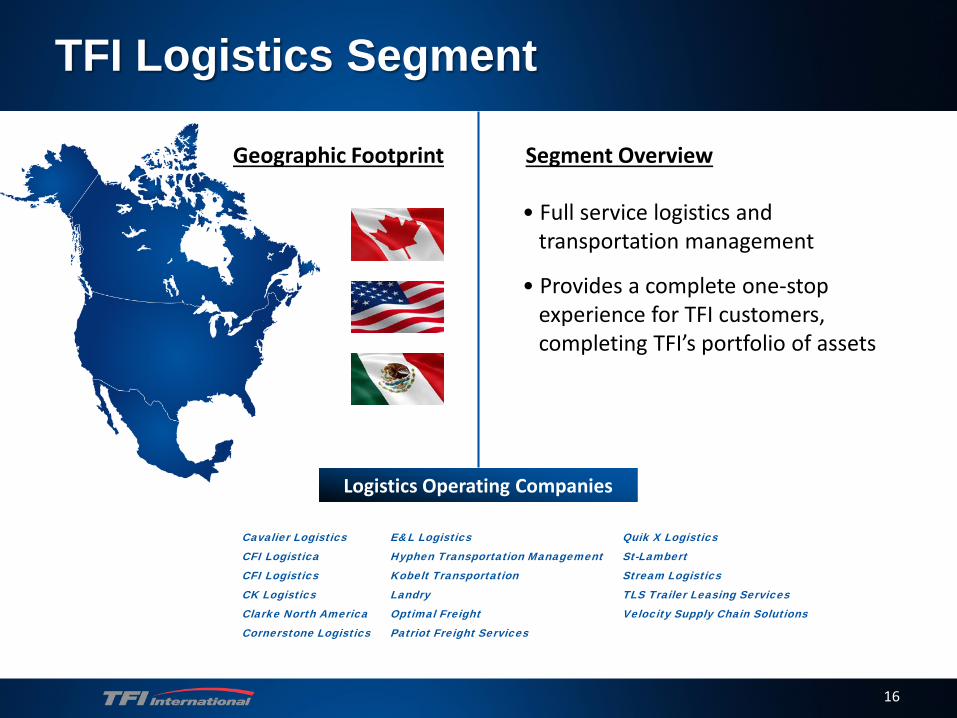
TFI Logistics Segment
• Full service logistics and transportation management
• Provides a complete one-stop experience for TFI customers, completing TFI’s portfolio of assets
Segment Overview
Logistics Operating Companies
Geographic Footprint
Cavalier LogisticsCFI LogisticaCFI LogisticsCK LogisticsClarke North AmericaCornerstone Logistics
E&L LogisticsHyphen Transportation ManagementKobelt TransportationLandryOptimal FreightPatriot Freight Services
Quik X LogisticsSt-LambertStream LogisticsTLS Trailer Leasing ServicesVelocity Supply Chain Solutions
17
Growth Opportunities
18
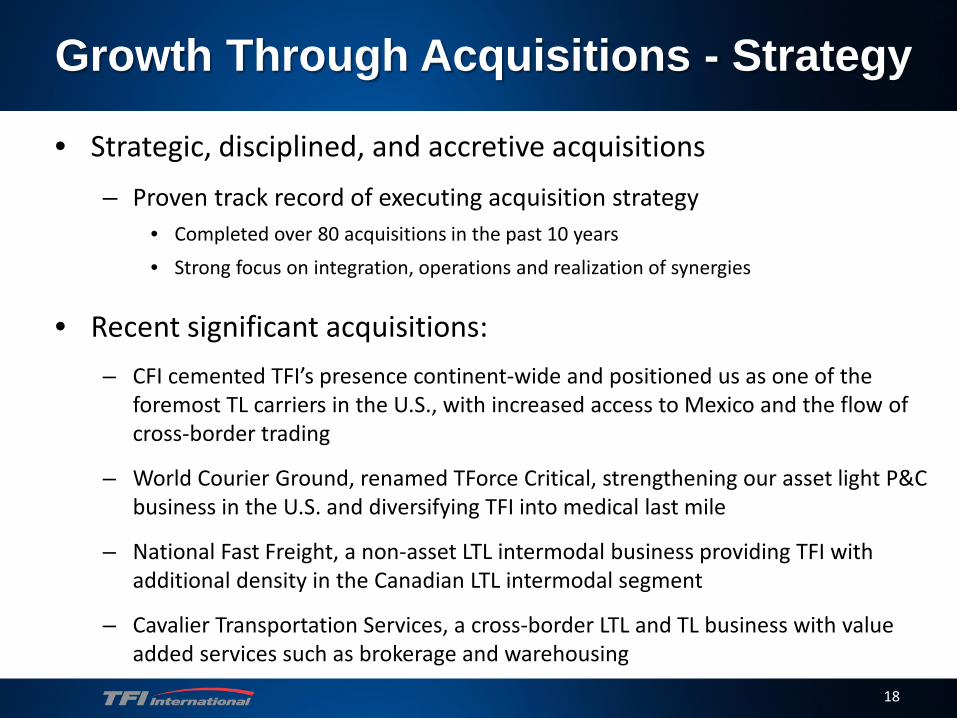
Growth Through Acquisitions - Strategy
• Strategic, disciplined, and accretive acquisitions– Proven track record of executing acquisition strategy
• Completed over 80 acquisitions in the past 10 years• Strong focus on integration, operations and realization of synergies
• Recent significant acquisitions: – CFI cemented TFI’s presence continent-wide and positioned us as one of the
foremost TL carriers in the U.S., with increased access to Mexico and the flow of cross-border trading
– World Courier Ground, renamed TForce Critical, strengthening our asset light P&C business in the U.S. and diversifying TFI into medical last mile
– National Fast Freight, a non-asset LTL intermodal business providing TFI with additional density in the Canadian LTL intermodal segment
– Cavalier Transportation Services, a cross-border LTL and TL business with value added services such as brokerage and warehousing
19
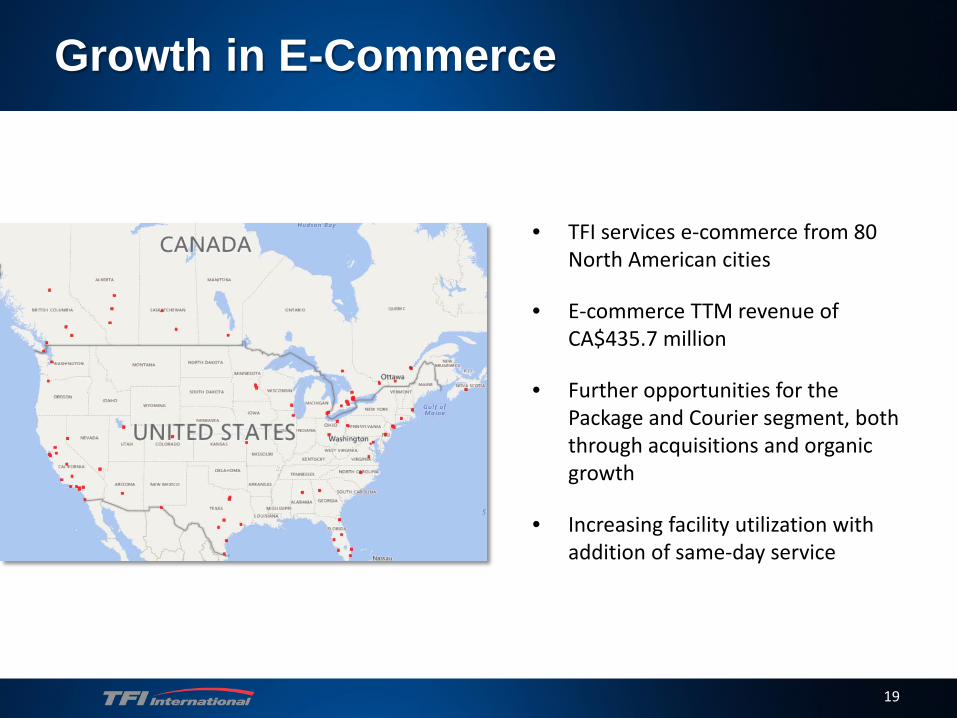
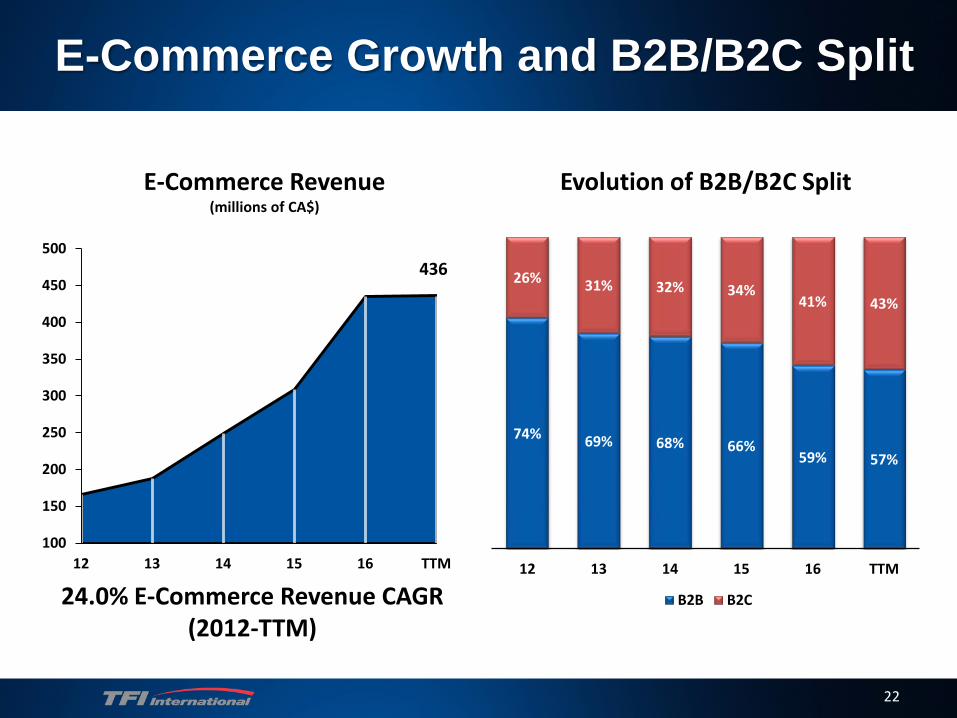
Growth in E-Commerce
• TFI services e-commerce from 80 North American cities
• E-commerce TTM revenue of CA$435.7 million
• Further opportunities for the Package and Courier segment, both through acquisitions and organic growth
• Increasing facility utilization with addition of same-day service
20
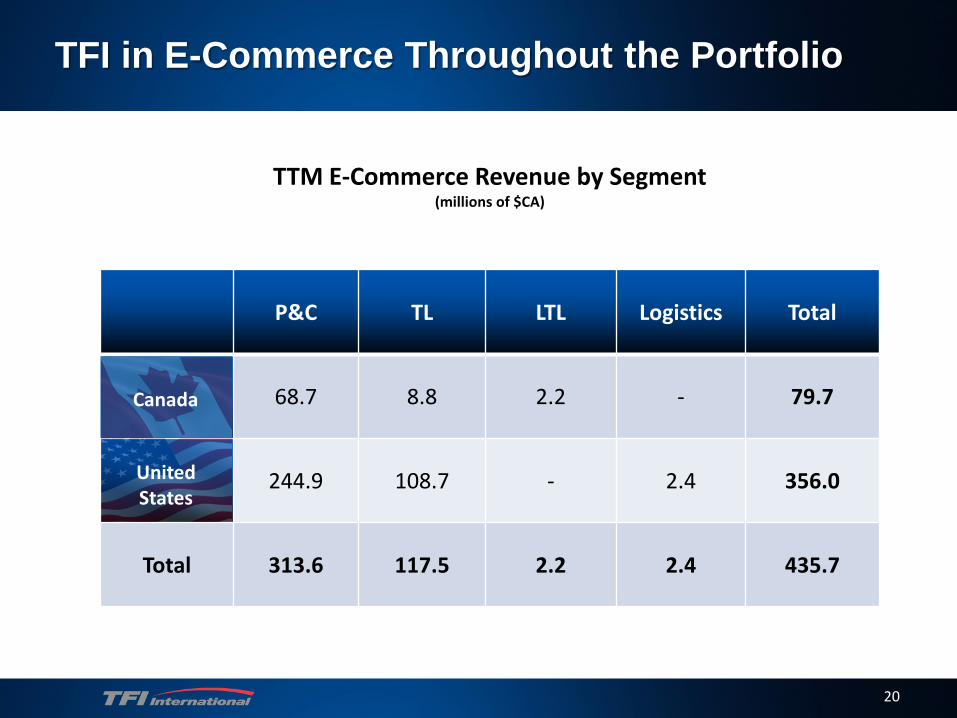
TFI in E-Commerce Throughout the Portfolio
P&C TL LTL Logistics Total
68.7 8.8 2.2 - 79.7
244.9 108.7 - 2.4 356.0
Total 313.6 117.5 2.2 2.4 435.7
TTM E-Commerce Revenue by Segment(millions of $CA)
Canada
United States
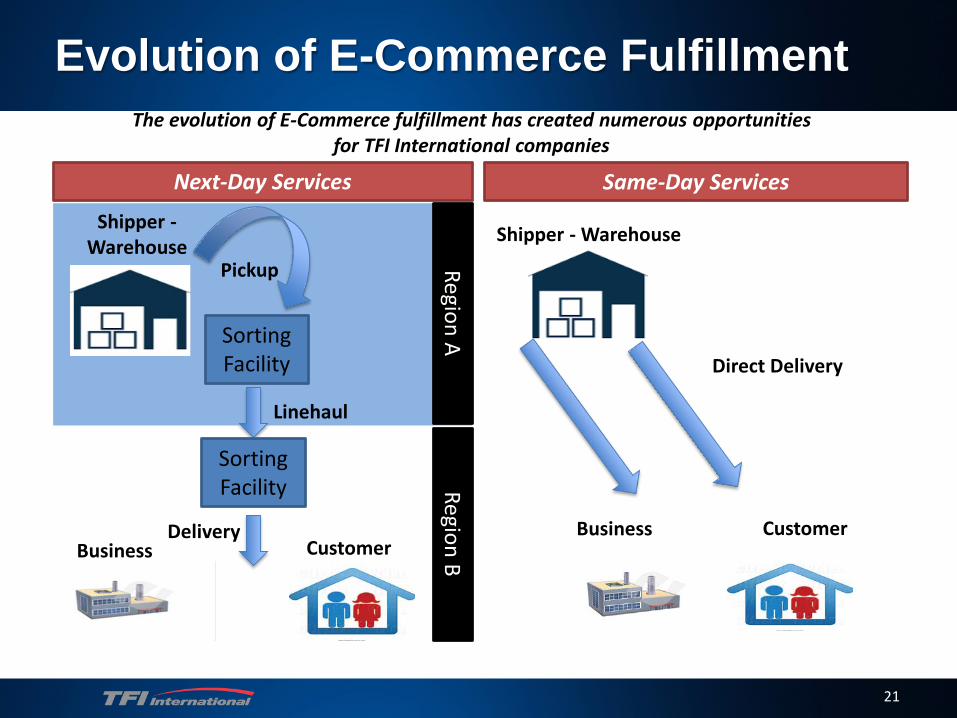
The evolution of E-Commerce fulfillment has created numerous opportunitiesfor TFI International companies
21
Shipper - Warehouse
Direct Delivery
CustomerBusiness
Sorting Facility
Region ARegion BBusiness
Linehaul
Delivery
Pickup
Sorting Facility
Shipper -Warehouse
Next-Day Services Same-Day Services
Customer
Evolution of E-Commerce Fulfillment
22
E-Commerce Growth and B2B/B2C Split
Evolution of B2B/B2C Split
74% 69% 68% 66%59% 57%
26% 31% 32% 34%41% 43%
12 13 14 15 16 TTM
B2B B2C
436
100
150
200
250
300
350
400
450
500
12 13 14 15 16 TTM
E-Commerce Revenue(millions of CA$)
24.0% E-Commerce Revenue CAGR (2012-TTM)
23
(From continuing operations)
Financial Highlights
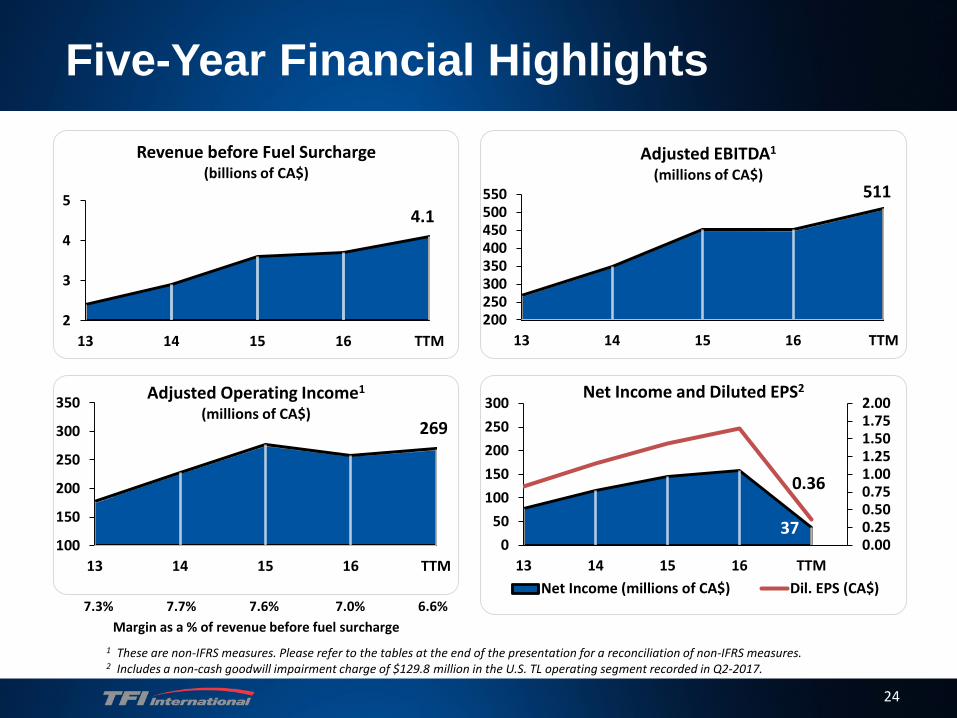
269
100
150
200
250
300
350
13 14 15 16 TTM
Adjusted Operating Income1
(millions of CA$)
24
Five-Year Financial Highlights
7.3% 7.7% 7.6% 7.0% 6.6% Margin as a % of revenue before fuel surcharge
1 These are non-IFRS measures. Please refer to the tables at the end of the presentation for a reconciliation of non-IFRS measures.2 Includes a non-cash goodwill impairment charge of $129.8 million in the U.S. TL operating segment recorded in Q2-2017.
511
200250300350400450500550
13 14 15 16 TTM
Adjusted EBITDA1
(millions of CA$)
4.1
2
3
4
5
13 14 15 16 TTM
Revenue before Fuel Surcharge(billions of CA$)
37
0.36
0.000.250.500.751.001.251.501.752.00
050
100150200250300
13 14 15 16 TTMNet Income (millions of CA$) Dil. EPS (CA$)
Net Income and Diluted EPS2
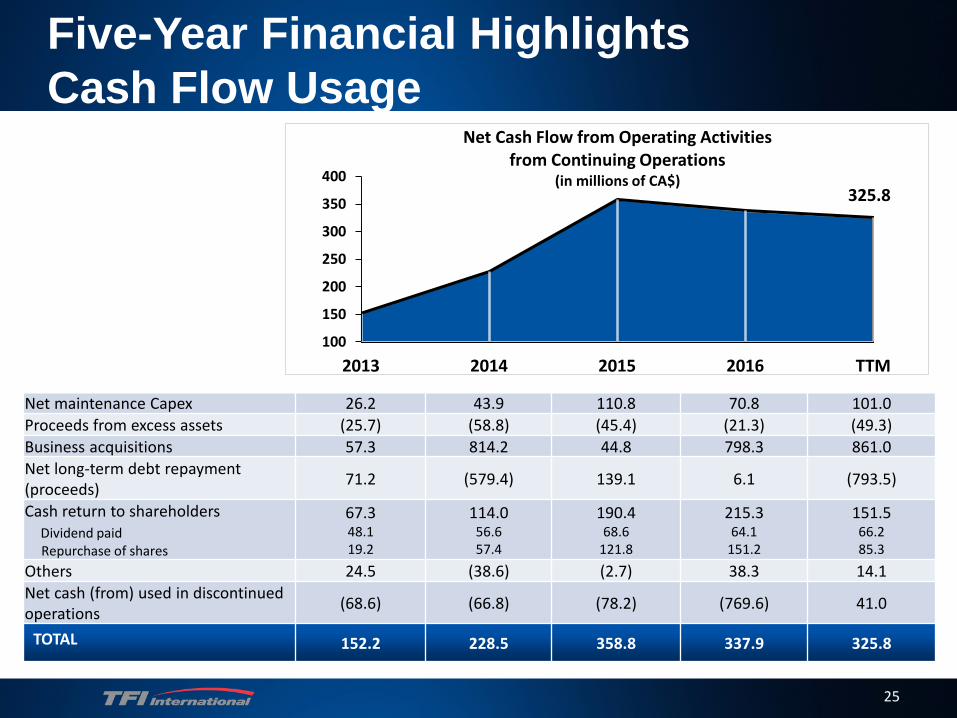
Net maintenance Capex 26.2 43.9 110.8 70.8 101.0Proceeds from excess assets (25.7) (58.8) (45.4) (21.3) (49.3)Business acquisitions 57.3 814.2 44.8 798.3 861.0Net long-term debt repayment (proceeds) 71.2 (579.4) 139.1 6.1 (793.5)
Cash return to shareholdersDividend paidRepurchase of shares
67.348.119.2
114.056.657.4
190.468.6
121.8
215.364.1
151.2
151.566.285.3
Others 24.5 (38.6) (2.7) 38.3 14.1Net cash (from) used in discontinuedoperations (68.6) (66.8) (78.2) (769.6) 41.0
TOTAL 152.2 228.5 358.8 337.9 325.8
25
Five-Year Financial Highlights Cash Flow Usage
325.8
100
150
200
250
300
350
400
2013 2014 2015 2016 TTM
Net Cash Flow from Operating Activitiesfrom Continuing Operations
(in millions of CA$)
3.5%
1.0%
1.5%
2.0%
2.5%
3.0%
3.5%
4.0%
13 14 15 16 TTM
26
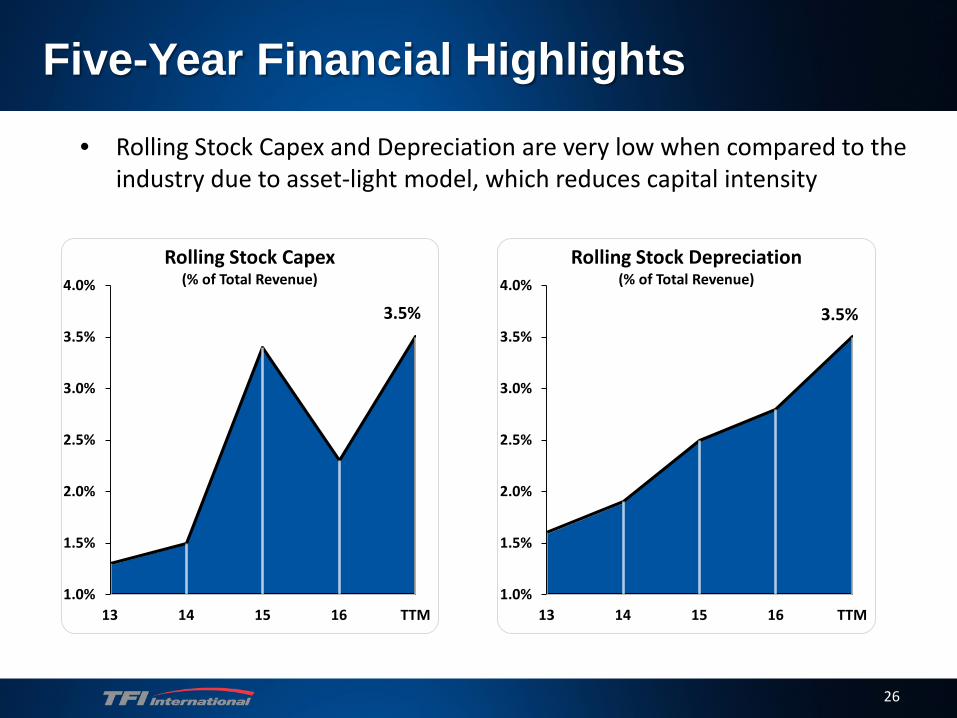
Five-Year Financial Highlights• Rolling Stock Capex and Depreciation are very low when compared to the
industry due to asset-light model, which reduces capital intensity
Rolling Stock Depreciation(% of Total Revenue)
3.5%
1.0%
1.5%
2.0%
2.5%
3.0%
3.5%
4.0%
13 14 15 16 TTM
Rolling Stock Capex(% of Total Revenue)
27
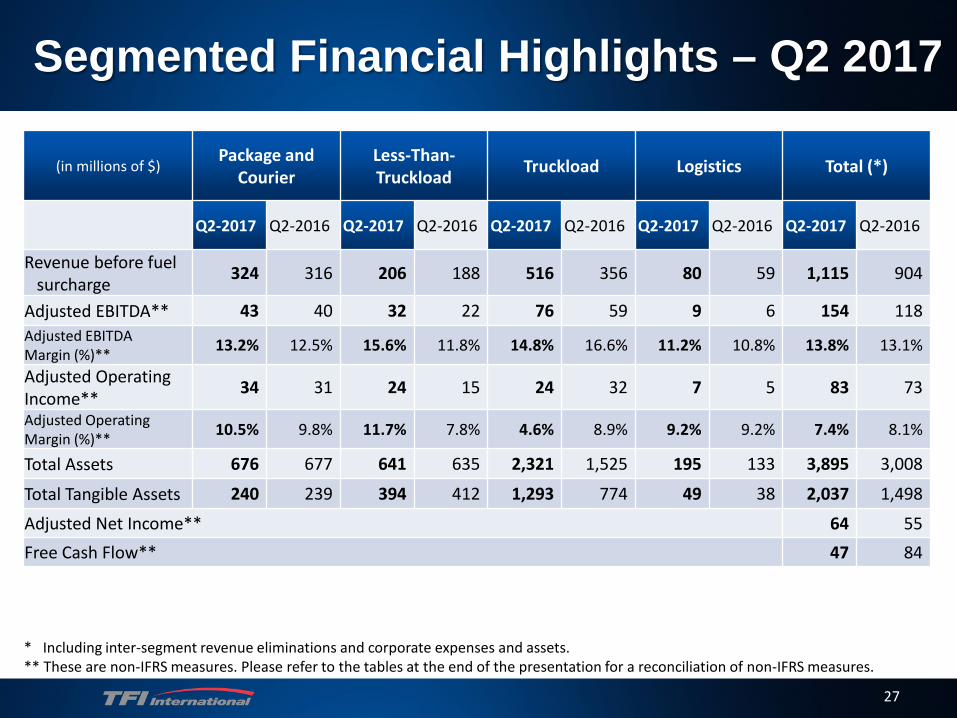
Segmented Financial Highlights – Q2 2017
(in millions of $)Package and
CourierLess-Than-Truckload Truckload Logistics Total (*)
Q2-2017 Q2-2016 Q2-2017 Q2-2016 Q2-2017 Q2-2016 Q2-2017 Q2-2016 Q2-2017 Q2-2016
Revenue before fuelsurcharge 324 316 206 188 516 356 80 59 1,115 904
Adjusted EBITDA** 43 40 32 22 76 59 9 6 154 118Adjusted EBITDA Margin (%)** 13.2% 12.5% 15.6% 11.8% 14.8% 16.6% 11.2% 10.8% 13.8% 13.1%
Adjusted Operating Income** 34 31 24 15 24 32 7 5 83 73
Adjusted Operating Margin (%)** 10.5% 9.8% 11.7% 7.8% 4.6% 8.9% 9.2% 9.2% 7.4% 8.1%
Total Assets 676 677 641 635 2,321 1,525 195 133 3,895 3,008
Total Tangible Assets 240 239 394 412 1,293 774 49 38 2,037 1,498
Adjusted Net Income** 64 55Free Cash Flow** 47 84
* Including inter-segment revenue eliminations and corporate expenses and assets.** These are non-IFRS measures. Please refer to the tables at the end of the presentation for a reconciliation of non-IFRS measures.
28
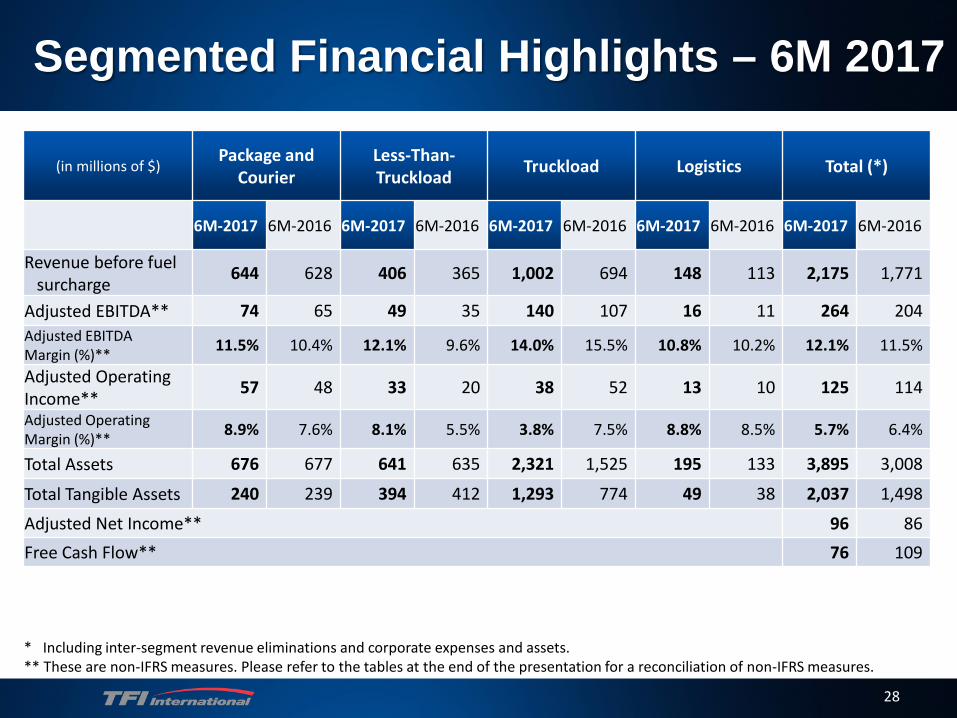
Segmented Financial Highlights – 6M 2017
(in millions of $)Package and
CourierLess-Than-Truckload Truckload Logistics Total (*)
6M-2017 6M-2016 6M-2017 6M-2016 6M-2017 6M-2016 6M-2017 6M-2016 6M-2017 6M-2016
Revenue before fuelsurcharge 644 628 406 365 1,002 694 148 113 2,175 1,771
Adjusted EBITDA** 74 65 49 35 140 107 16 11 264 204Adjusted EBITDA Margin (%)** 11.5% 10.4% 12.1% 9.6% 14.0% 15.5% 10.8% 10.2% 12.1% 11.5%
Adjusted Operating Income** 57 48 33 20 38 52 13 10 125 114
Adjusted Operating Margin (%)** 8.9% 7.6% 8.1% 5.5% 3.8% 7.5% 8.8% 8.5% 5.7% 6.4%
Total Assets 676 677 641 635 2,321 1,525 195 133 3,895 3,008
Total Tangible Assets 240 239 394 412 1,293 774 49 38 2,037 1,498
Adjusted Net Income** 96 86Free Cash Flow** 76 109
* Including inter-segment revenue eliminations and corporate expenses and assets.** These are non-IFRS measures. Please refer to the tables at the end of the presentation for a reconciliation of non-IFRS measures.
2.9x
4.6x
3.6x 3.5x 3.3x
13 14 15 16 TTM
Total Debt / Adjusted EBITDA*
29
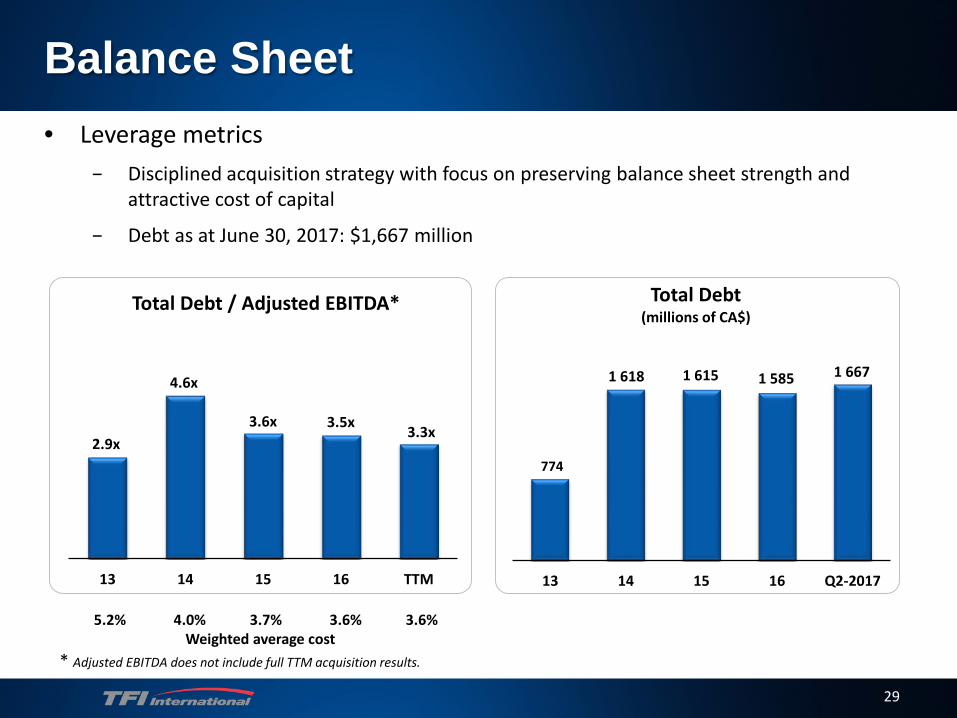
Balance Sheet• Leverage metrics
− Disciplined acquisition strategy with focus on preserving balance sheet strength and attractive cost of capital
− Debt as at June 30, 2017: $1,667 million
774
1 618 1 615 1 585 1 667
13 14 15 16 Q2-2017
Total Debt(millions of CA$)
5.2% 4.0% 3.7% 3.6% 3.6%Weighted average cost
* Adjusted EBITDA does not include full TTM acquisition results.
30
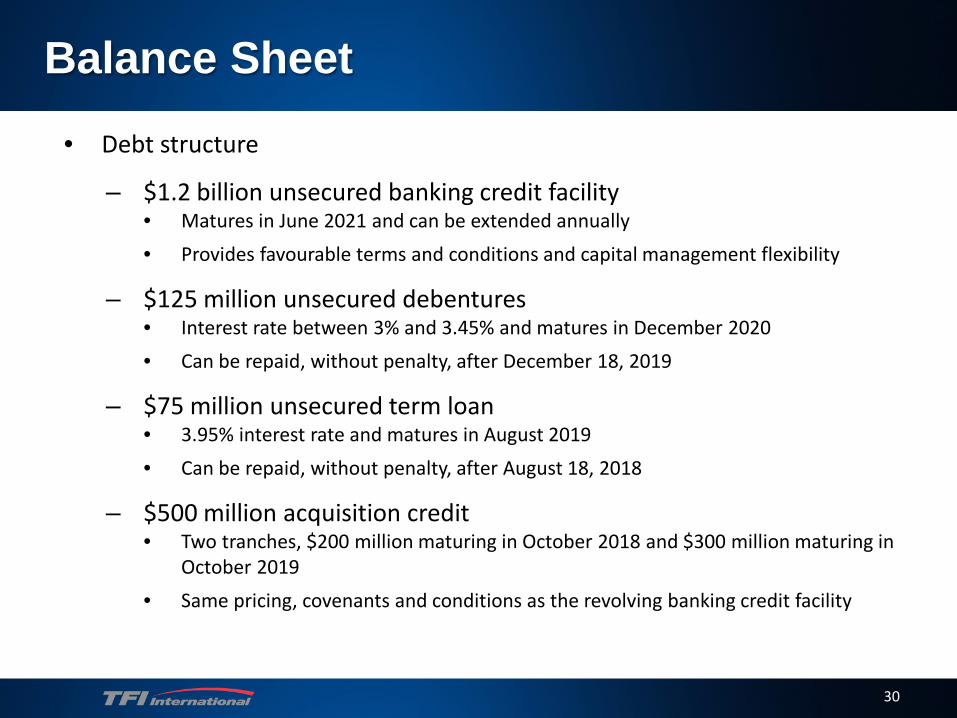
Balance Sheet• Debt structure
– $1.2 billion unsecured banking credit facility • Matures in June 2021 and can be extended annually• Provides favourable terms and conditions and capital management flexibility
– $125 million unsecured debentures• Interest rate between 3% and 3.45% and matures in December 2020• Can be repaid, without penalty, after December 18, 2019
– $75 million unsecured term loan• 3.95% interest rate and matures in August 2019• Can be repaid, without penalty, after August 18, 2018
– $500 million acquisition credit • Two tranches, $200 million maturing in October 2018 and $300 million maturing in
October 2019• Same pricing, covenants and conditions as the revolving banking credit facility
31
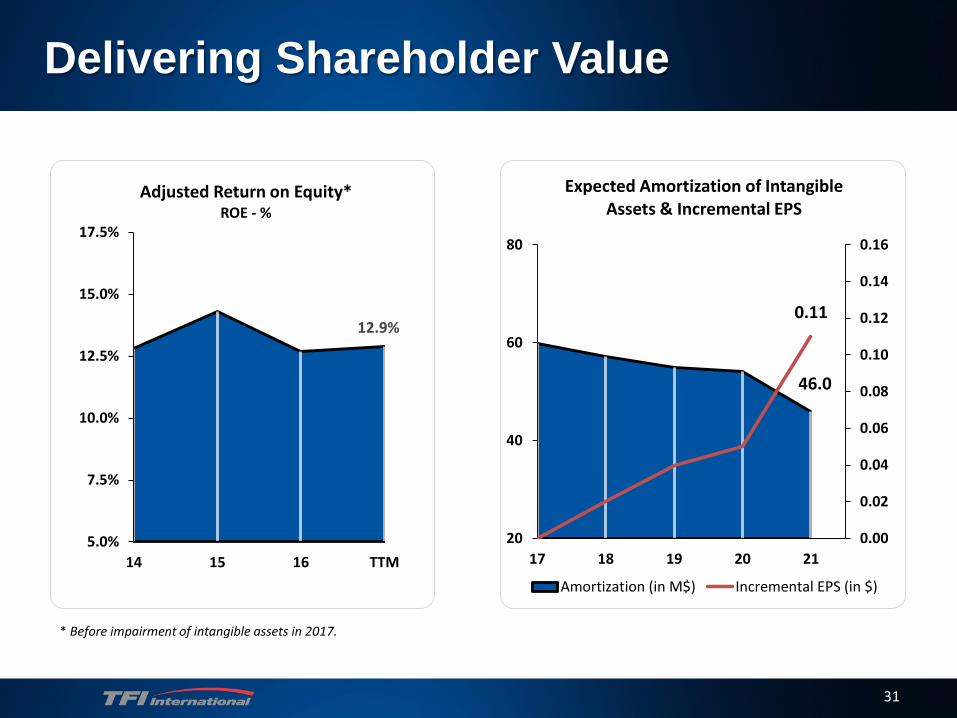
46.0
0.00
0.02
0.04
0.06
0.08
0.10
0.12
0.14
0.16
20
40
60
80
17 18 19 20 21
Expected Amortization of Intangible Assets & Incremental EPS
Amortization (in M$) Incremental EPS (in $)
0.1112.9%
5.0%
7.5%
10.0%
12.5%
15.0%
17.5%
14 15 16 TTM
Adjusted Return on Equity*ROE - %
* Before impairment of intangible assets in 2017.
Delivering Shareholder Value
32
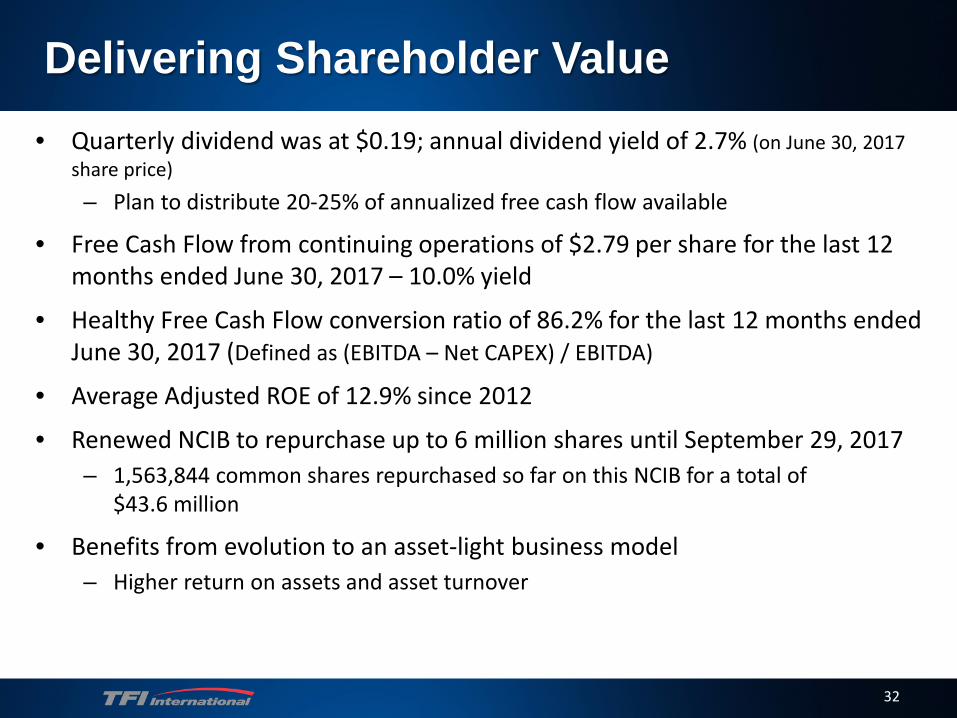
• Quarterly dividend was at $0.19; annual dividend yield of 2.7% (on June 30, 2017 share price)– Plan to distribute 20-25% of annualized free cash flow available
• Free Cash Flow from continuing operations of $2.79 per share for the last 12 months ended June 30, 2017 – 10.0% yield
• Healthy Free Cash Flow conversion ratio of 86.2% for the last 12 months ended June 30, 2017 (Defined as (EBITDA – Net CAPEX) / EBITDA)
• Average Adjusted ROE of 12.9% since 2012
• Renewed NCIB to repurchase up to 6 million shares until September 29, 2017– 1,563,844 common shares repurchased so far on this NCIB for a total of
$43.6 million
• Benefits from evolution to an asset-light business model– Higher return on assets and asset turnover
Delivering Shareholder Value
33
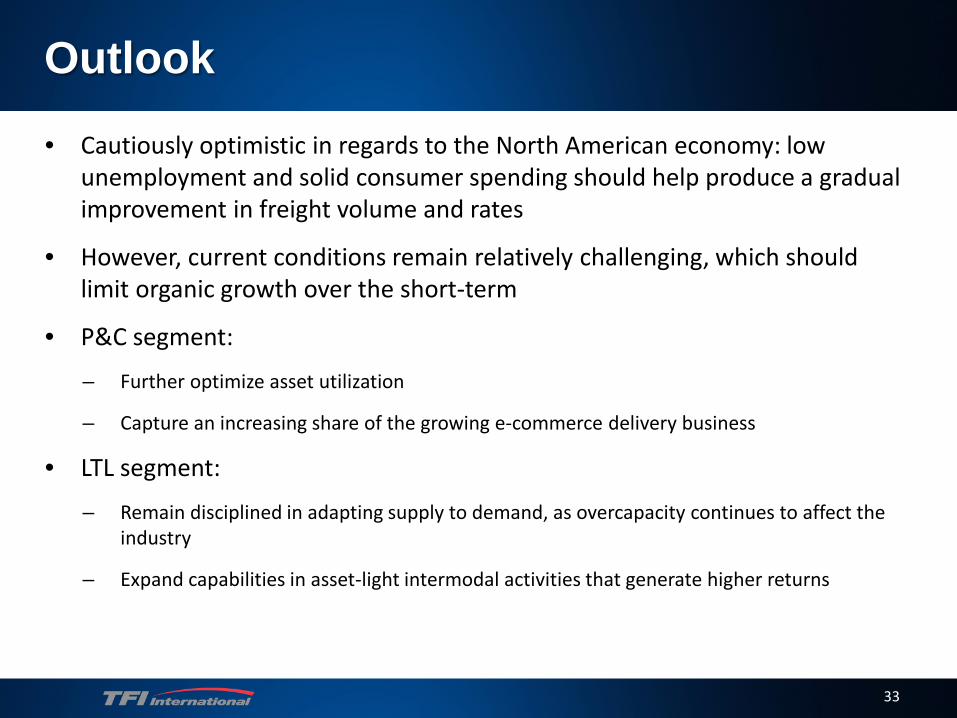
• Cautiously optimistic in regards to the North American economy: low unemployment and solid consumer spending should help produce a gradual improvement in freight volume and rates
• However, current conditions remain relatively challenging, which should limit organic growth over the short-term
• P&C segment:
– Further optimize asset utilization
– Capture an increasing share of the growing e-commerce delivery business
• LTL segment:
– Remain disciplined in adapting supply to demand, as overcapacity continues to affect the industry
– Expand capabilities in asset-light intermodal activities that generate higher returns
Outlook
34
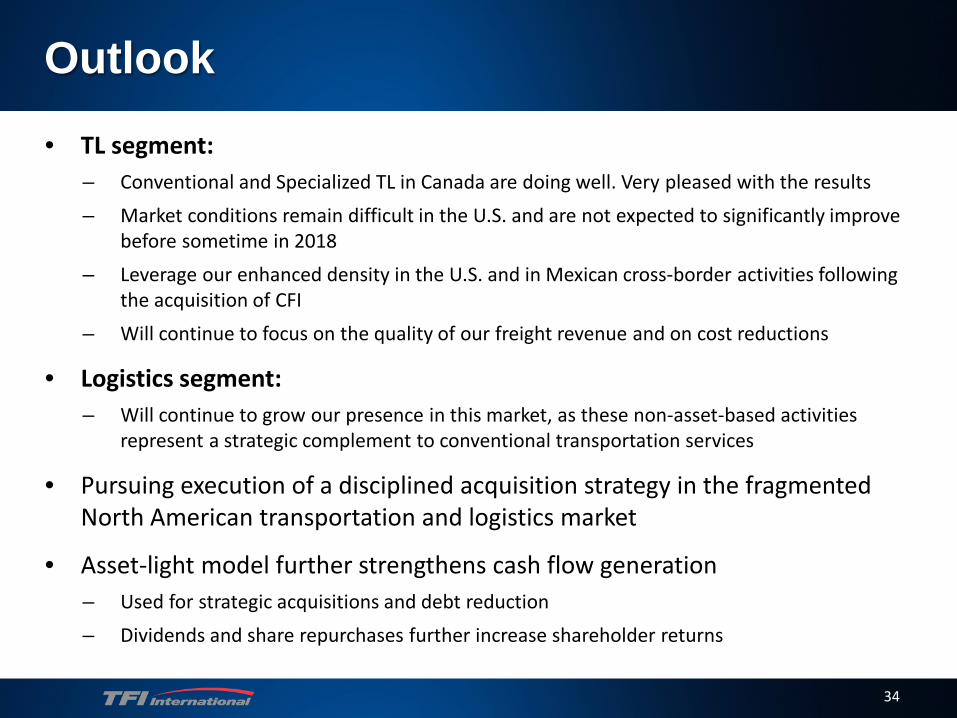
• TL segment: – Conventional and Specialized TL in Canada are doing well. Very pleased with the results– Market conditions remain difficult in the U.S. and are not expected to significantly improve
before sometime in 2018– Leverage our enhanced density in the U.S. and in Mexican cross-border activities following
the acquisition of CFI– Will continue to focus on the quality of our freight revenue and on cost reductions
• Logistics segment: – Will continue to grow our presence in this market, as these non-asset-based activities
represent a strategic complement to conventional transportation services
• Pursuing execution of a disciplined acquisition strategy in the fragmented North American transportation and logistics market
• Asset-light model further strengthens cash flow generation – Used for strategic acquisitions and debt reduction– Dividends and share repurchases further increase shareholder returns
Outlook
35
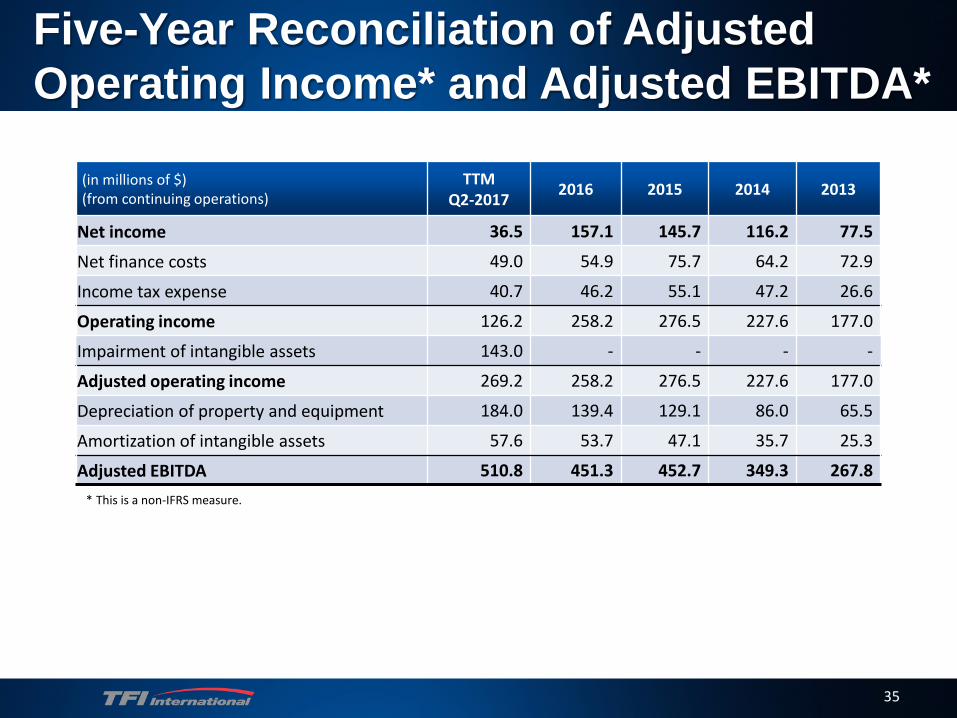
Five-Year Reconciliation of Adjusted Operating Income* and Adjusted EBITDA*
(in millions of $) (from continuing operations)
TTMQ2-2017 2016 2015 2014 2013
Net income 36.5 157.1 145.7 116.2 77.5
Net finance costs 49.0 54.9 75.7 64.2 72.9
Income tax expense 40.7 46.2 55.1 47.2 26.6
Operating income 126.2 258.2 276.5 227.6 177.0
Impairment of intangible assets 143.0 - - - -
Adjusted operating income 269.2 258.2 276.5 227.6 177.0
Depreciation of property and equipment 184.0 139.4 129.1 86.0 65.5
Amortization of intangible assets 57.6 53.7 47.1 35.7 25.3
Adjusted EBITDA 510.8 451.3 452.7 349.3 267.8* This is a non-IFRS measure.
36
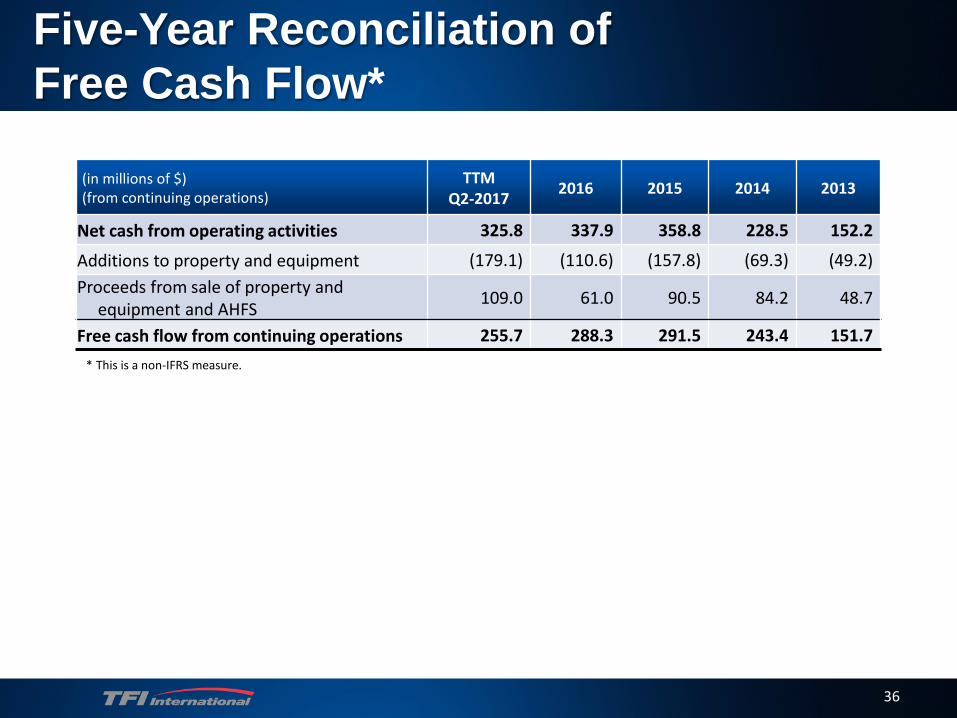
Five-Year Reconciliation ofFree Cash Flow*
(in millions of $)(from continuing operations)
TTMQ2-2017 2016 2015 2014 2013
Net cash from operating activities 325.8 337.9 358.8 228.5 152.2
Additions to property and equipment (179.1) (110.6) (157.8) (69.3) (49.2)Proceeds from sale of property and
equipment and AHFS 109.0 61.0 90.5 84.2 48.7
Free cash flow from continuing operations 255.7 288.3 291.5 243.4 151.7* This is a non-IFRS measure.
37
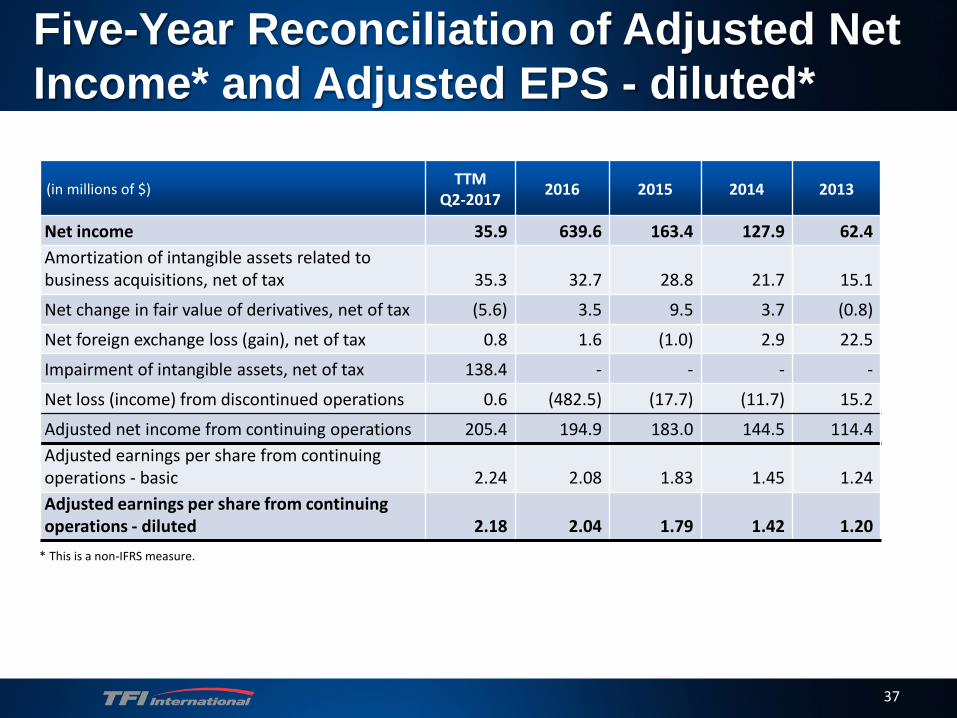
Five-Year Reconciliation of Adjusted Net Income* and Adjusted EPS - diluted*
(in millions of $) TTMQ2-2017 2016 2015 2014 2013
Net income 35.9 639.6 163.4 127.9 62.4 Amortization of intangible assets related to business acquisitions, net of tax 35.3 32.7 28.8 21.7 15.1
Net change in fair value of derivatives, net of tax (5.6) 3.5 9.5 3.7 (0.8)
Net foreign exchange loss (gain), net of tax 0.8 1.6 (1.0) 2.9 22.5
Impairment of intangible assets, net of tax 138.4 - - - -
Net loss (income) from discontinued operations 0.6 (482.5) (17.7) (11.7) 15.2
Adjusted net income from continuing operations 205.4 194.9 183.0 144.5 114.4 Adjusted earnings per share from continuing operations - basic 2.24 2.08 1.83 1.45 1.24 Adjusted earnings per share from continuing operations - diluted 2.18 2.04 1.79 1.42 1.20
* This is a non-IFRS measure.
38
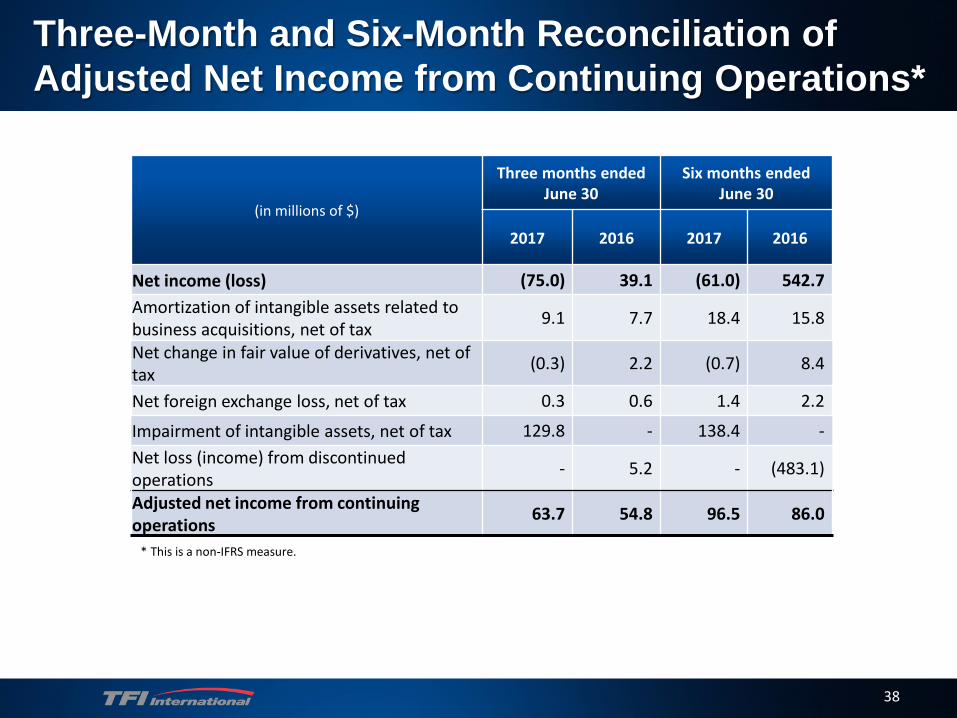
Three-Month and Six-Month Reconciliation of Adjusted Net Income from Continuing Operations*
* This is a non-IFRS measure.
(in millions of $)
Three months endedJune 30
Six months endedJune 30
2017 2016 2017 2016
Net income (loss) (75.0) 39.1 (61.0) 542.7Amortization of intangible assets related to business acquisitions, net of tax 9.1 7.7 18.4 15.8
Net change in fair value of derivatives, net of tax (0.3) 2.2 (0.7) 8.4
Net foreign exchange loss, net of tax 0.3 0.6 1.4 2.2
Impairment of intangible assets, net of tax 129.8 - 138.4 -Net loss (income) from discontinued operations - 5.2 - (483.1)
Adjusted net income from continuing operations 63.7 54.8 96.5 86.0
39
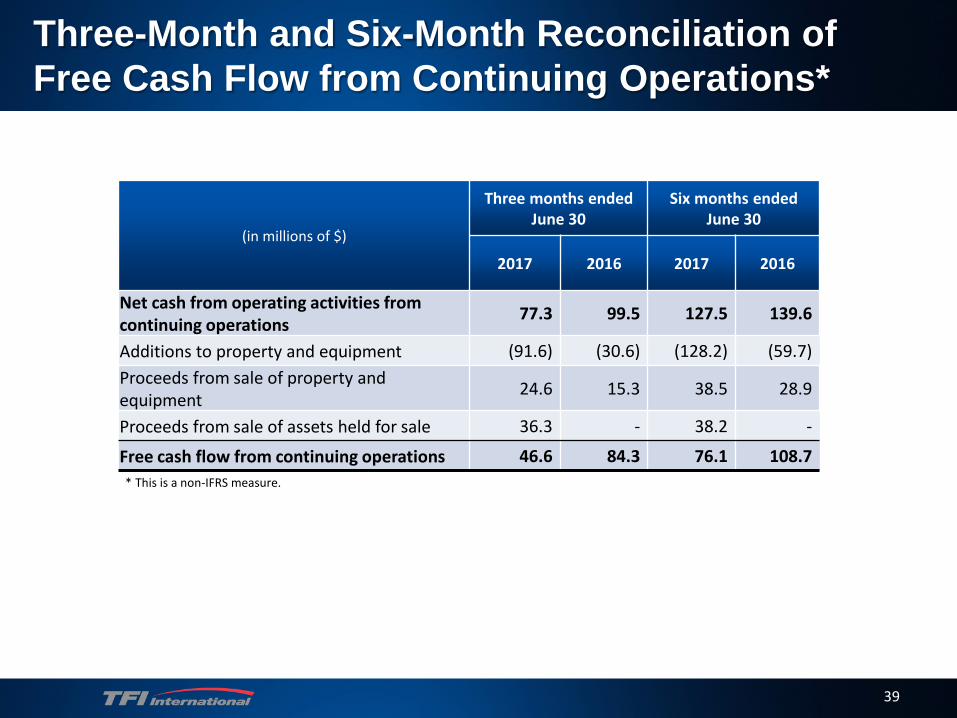
Three-Month and Six-Month Reconciliation ofFree Cash Flow from Continuing Operations*
* This is a non-IFRS measure.
(in millions of $)
Three months endedJune 30
Six months endedJune 30
2017 2016 2017 2016
Net cash from operating activities from continuing operations 77.3 99.5 127.5 139.6
Additions to property and equipment (91.6) (30.6) (128.2) (59.7)Proceeds from sale of property and equipment 24.6 15.3 38.5 28.9
Proceeds from sale of assets held for sale 36.3 - 38.2 -
Free cash flow from continuing operations 46.6 84.3 76.1 108.7