second quarter report for fy 2019 · 2019-10-30 · fy 2019: second quarter report the 7th...
TRANSCRIPT

Second Quarter Report for FY 2019(Fiscal Year ending March 2020)
Details of Business Results
AMANO CORPORATION (Ticker: 6436)October 30, 2019
Contact :
TEL :Web site :
Corporate Planning Unit,Corporate Planning Division +81(0)45-439-1591http://www.amano.co.jp/English/

FY 2019: Second Quarter Report
The 7th Medium-term Business Plan The 2nd Stage Towards a 100-year Company
Business Forecast for FY2019
The prospect of operating performance or forecast complied by Amano is basedon the current information available, and it includes potential risks or uncertainties. Please note that actual operating performance may change substantially from what is described here as a result of various changing factors.
P.3
P.19
P.25
【 Index 】

FY 2019: Second Quarter Report(Fiscal Year ending March 2020)
3

◆ Consolidated
◆ ACJ * ACJ; Amano Corporation Japan
◆ Consolidated performance (Year-on-year)
FY 2019: 1st Half Accumulated Results (FY end March 2020)
(In million yen)
Amount % Change(%) Amount % Amount % Amount % Amount %% % % % % %
Net sales 63,500 100.0 4.1 64,874 100.0 61,008 100.0 3,866 6.3 1,374 102.2Gross profit 28,200 44.4 4.3 28,820 44.4 27,036 44.3 1,784 6.6 620 102.2SG&A 22,200 35.0 3.1 21,646 33.4 21,533 35.3 113 0.5 (553) 97.5Operating profit 6,000 9.4 9.0 7,174 11.1 5,502 9.0 1,671 30.4 1,174 119.6Non-operating income 500 0.8 6.4 466 0.7 470 0.8 (3) (0.8) (33) 93.3Non-operating expense 0 0.0 9,999.9 180 0.3 48 0.1 132 272.8 180 9,999.9
Ordinary profit 6,500 10.2 9.7 7,459 11.5 5,924 9.7 1,535 25.9 959 114.8Extraordinary profit 0 0 9,999.9 3 0.0 8 0.0 (4) (55.7) 3 9,999.9
Extraordinary loss 0 0 9,999.9 149 0.2 10 0.0 138 1,278.5 149 9,999.9Net income attributable toowners of the parent company 4,000 6.3 4.5 4,679 7.2 3,828 6.3 851 22.2 679 117.0
*FX Rates:(Quarterly Average) US$ 105.00 US$ 109.98 US$ 108.52EUR 125.00 EUR 124.07 EUR 130.66
Disclosed plan 1st Half endedSeptember 30, 2019
1st Half endedSeptember 30, 2018 Change Change over plan
(In million yen)
Amount % Change(%) Amount % Amount % Amount % Amount %% % % % % %
Net sales 34,800 100.0 2.7 35,672 100.0 33,885 100.0 1,787 5.3 872 102.5Gross profit 14,700 42.2 2.7 15,360 43.1 14,317 42.3 1,042 7.3 660 104.5SG&A 10,800 31.0 3.0 10,787 30.2 10,487 31.0 299 2.9 (12) 99.9Operating profit 3,900 11.2 1.8 4,573 12.8 3,830 11.3 743 19.4 673 117.3Non-operating income 1,350 3.9 (0.9) 1,479 4.1 1,362 4.0 117 8.7 129 109.6Non-operating expense 50 0.1 87.8 83 0.2 26 0.1 57 214.4 33 167.4Ordinary profit 5,200 14.9 0.7 5,969 16.7 5,165 15.2 803 15.6 769 114.8Extraordinary profit 0 0.0 9,999.9 0 0.0 0 0.0 0 9,999.9 0 9,999.9
Extraordinary loss 0 0.0 9,999.9 112 0.3 2 0.0 109 4,396.6 112 9,999.9
Net income 3,800 10.9 2.7 4,202 11.8 3,699 10.9 503 13.6 402 110.6
Disclosed plan 1st Half endedSeptember 30, 2019
1st Half endedSeptember 30, 2018 Change Change over plan
1 Sales: Up \ 3,866 Mil ( Up 6.3 % )Up 3,586 Mil ( Up 8.0 % )Up 1,194 Mil ( Up 9.0 % )Up 2,366 Mil ( Up 8.0 % )
Up 279 Mil ( Up 1.7 % )Up 771 Mil ( Up 7.4 % )Dn 492 Mil ( Dn 8.4 % )
2 Gross Profit: Up \ 1,784 Mil ( Up 6.6 % )44.4 % Up 0.1 %
・Time Information Segment : Up 0.5 %・Environmental Segment : Dn 1.1 %
3 SG&A: Up \ 113 Mil ( Up 0.5 % )・Labor Cost Up 433 Mil ( Up 3.2 % )・Other Costs Dn 320 Mil ( Dn 4.0 % )
4 Operating Profit Up \ 1,671 Mil ( Up 30.4 % )・Time Information Segment: \ 6,862 Mil ( Up 1,725 Mil )・Environmental Segment: \ 2,359 Mil ( Dn 4 Mil )・Company-wide Expense: \ -2,048 Mil ( Dn 49 Mil )
● Operating profit Ratio (FY2018: 11.5%, Half ended Sep.30,2018: 9.0%)
● ROE (FY2018: 8.7%)
● (FY2018: 1.76 times, Half ended Sep.30,2018:1.80 times)
Consolidated Sales/ Parent Sales Ratio
Gross Profit Ratio:
・Time Information Segment: Incl: Information Systems: Incl: Parking Systems:
・Environmental Segment:Incl: Environmental Systems: Incl:Clean Systems:
11.1%
1.80 times
―
4

◆ Consolidated
◆ ACJ
FY 2019 : 1st Half Accumulated Results (FY end March 2020)Sales by business division
(In million yen)
Amount % Change% Amount % Amount % Amount % Amount %% % % % % %
Information Systems 14,300 22.5 7.9 14,445 22.3 13,251 21.7 1,194 9.0 145 101.0Time Management Products 1,600 2.5 (5.7) 1,722 2.7 1,696 2.8 25 1.5 122 107.6Parking Systems 31,200 49.2 4.8 32,131 49.5 29,765 48.8 2,366 8.0 931 103.0Total: Time Information Segment 47,100 74.2 5.3 48,299 74.5 44,712 73.3 3,586 8.0 1,199 102.5Environmental Systems 10,500 16.5 0.3 11,238 17.3 10,466 17.1 771 7.4 738 107.0Clean Systems 5,900 9.3 1.2 5,337 8.2 5,829 9.6 (492) (8.4) (562) 90.5Total: Environmental Segment 16,400 25.8 0.6 16,575 25.5 16,296 26.7 279 1.7 175 101.1
Grand total 63,500 100.0 4.1 64,874 100.0 61,008 100.0 3,866 6.3 1,374 102.2
Business division Disclosed plan1st Half endedSeptember 30,
2019
1st Half endedSeptember 30,
2018Change Change over plan
(In million yen)
Amount % Change% Amount % Amount % Amount % Amount %% % % % % %
Information Systems 8,000 23.0 8.8 8,548 24.0 7,350 21.7 1,198 16.3 548 106.9Time Management Products 1,400 4.0 (1.1) 1,467 4.1 1,415 4.2 51 3.6 67 104.8Parking Systems 14,100 40.5 0.6 14,432 40.4 14,013 41.3 418 3.0 332 102.4Total: Time Information Segment 23,500 67.5 3.2 24,448 68.5 22,780 67.2 1,667 7.3 948 104.0Environmental Systems 9,000 25.9 1.4 8,990 25.2 8,873 26.2 116 1.3 (10) 99.9Clean Systems 2,300 6.6 3.1 2,234 6.3 2,231 6.6 2 0.1 (65) 97.1Total: Environmental Segment 11,300 32.5 1.8 11,224 31.5 11,105 32.8 119 1.1 (76) 99.3
Grand total 34,800 100.0 2.7 35,672 100.0 33,885 100.0 1,787 5.3 872 102.5
Change over planBusiness division Disclosed plan1st Half endedSeptember 30,
2019
1st Half endedSeptember 30,
2018Change
5

◆ Quarterly Financials
◆ Quarterly Sales
FY 2019: Consolidated performance by quarter(FY end March 2020)
(In million yen)
Amount % Amount % Amount %% % %
Net sales 30,444 100.0 34,430 100.0 64,874 100.0Gross profit 13,308 43.7 15,511 45.1 28,820 44.4SG&A 11,011 36.2 10,635 30.9 21,646 33.4Operating profit 2,297 7.5 4,876 14.2 7,174 11.1Non-operating income 220 0.7 245 0.7 466 0.7Non-operating expense 76 0.3 104 0.3 180 0.3Ordinary profit 2,441 8.0 5,017 14.6 7,459 11.5Extraordinary profit 1 0.0 2 0.0 3 0.0Extraordinary loss 2 0.0 146 0.4 149 0.2Net income attributable to owners of theparent company 1,420 4.7 3,258 9.5 4,679 7.2
* FX Rates︓(Quarterly Average) US$ 110.30 US$ 109.66 US$ 109.98EUR 125.28 EUR 122.86 EUR 124.07
FY2019 1Q FY2019 2Q 1st Half endedSeptember 30, 2019
(In million yen)
Amount % Amount % Amount %% % %
Information Systems 6,602 21.6 7,842 22.8 14,445 22.3Time Management Products 848 2.8 873 2.5 1,722 2.7Parking Systems 15,214 50.0 16,917 49.1 32,131 49.5Total: Time Information Segment 22,665 74.4 25,633 74.4 48,299 74.5Environmental Systems 5,280 17.4 5,957 17.3 11,238 17.3Clean Systems 2,497 8.2 2,839 8.3 5,337 8.2Total: Environmental Segment 7,778 25.6 8,797 25.6 16,575 25.5
Grand total 30,444 100.0 34,430 100.0 64,874 100.0
Business divisionFY2019 1Q FY2019 2Q 1st Half ended
September 30, 2019
6

1,783
3,844 3,512
5,209
1,390
4,112 3,053
6,605
2,297
4,876
6.6%
12.5%11.6% 14.4%
4.9%
12.5%9.8%
16.7%
7.5% 14.2%
△ 10.0%
△ 5.0%
0.0%
5.0%
10.0%
15.0%
20.0%
25.0%
0
1,000
2,000
3,000
4,000
5,000
6,000
7,000
FY20171Q 2Q 3Q 4Q
FY20181Q 2Q 3Q 4Q
FY20191Q 2Q
(In million yen)
Operating profitOperating profit ratio
27,18730,774 30,162
36,281
28,18032,828 31,225
39,479
30,44434,430
05,000
10,00015,00020,00025,00030,00035,00040,00045,000
FY20171Q 2Q 3Q 4Q
FY20181Q 2Q 3Q 4Q
FY20191Q 2Q
(In million yen)■ Sales
■ Operating Profit
Consolidated Sales & Operating Profit (Quarterly)
7

●Time Information SegmentUp 8.0% Y-O-Y
●Environmental SegmentUp 1.7% Y-O-Y UP 33.6
Dn 0.2 % Y-O-Y% Y-O-Y ●Time Information Segme
●Environmental Segment
5,137 6,862
2,364 2,359
(1,999) (2,048)
5,502 7,174
(3,000)
(1,000)
1,000
3,000
5,000
7,000
9,000
11,000
FY20181st Half
FY20191st Half
Company-wideExpenses
EnvironmentalSegment
Time InformationSegment
13,251 14,445
1,696 1,722
29,76532,131
44,71248,299
0
10,000
20,000
30,000
40,000
50,000
FY20181st Half
FY20191st Half
Parking Systems
Time Management Products
Information Systems
(In million yen)
10,466 11,238
5,829 5,337
16,296 16,575
02,0004,0006,0008,000
10,00012,00014,00016,00018,000
FY20181st Half
FY20191st Half
Clean Systems
Environmental Systems
(In million yen)
(In million yen)
Company-wide Expenses
【References】Increase / decrease in gross profit margin
Sales & Operating Profit by Business Segment(In million yen)
Sales Sales Sales Sales% % % % % %
Time Information Segment 22,665 2,432 10.7 25,633 4,430 17.3 48,299 6,862 14.2 44,712 5,137 11.5 3,586 8.0 1,725 33.6Environmental Segment 7,778 883 11.4 8,797 1,475 16.8 16,575 2,359 14.2 16,296 2,364 14.5 279 1.7 (4) (0.2)Company-wide Expenses (1,018) (1,029) (2,048) (1,999) (49) 9,999.9
Total 30,444 2,297 7.5 34,430 4,876 14.2 64,874 7,174 11.1 61,008 5,502 9.0 3,866 6.3 1,671 30.4
FY2019 1Q FY2019 2Q 1st Half endedSeptember 30, 2019
Operating profit Operating profit Operating profit Operating profit Operating profit
Change Y-O-Y1st Half endedSeptember 30, 2018
Sales
< Sales> < Operating profit>
①FY2018 2Q/FY2019 2QConsolidated ACJ
②FY2018/FY2019 2QConsolidated ACJ
Clean Systems
Environmental Systems
Parking Systems
Time Management Products
Information Systems
Clean Systems
Environmental Systems
Parking Systems
Time Management Products
Information Systems
8

Performance by Business Division
9

ー Consolidated ー
<Quarterly Sales (FY2017.1Q〜FY2019.2Q) >
<Sales (Y-O-Y)>
(In million yen)
ー ACJ ー
・N. America:Sales Grew at Accu-Time Systems Inc.
・Europe:Sales lower at Horoquartz, S.A.(due to FX rates)
※ Increased Domestic & Overseas Sales
・ Strong Orders for Software and Cloud Services・ Lower T&A Terminal sales・ Increased demand in the Public sector
(In million yen)< Sales by Region >
Information Systems
10

※ Increased Domestic Sales, Lower Overseas Sales
・European Sales Flat・Lower Sales in N. America & Asia
・Higher Sales for TimeP@ck Series
・Basic Time Recorders;Domestic and export sales volume declined
Time Management Products
ー Consolidated ー
<Quarterly Sales (FY2017.1Q〜FY2019.2Q) >
<Sales (Y-O-Y)>ー ACJ ー
11
(In million yen)
(In million yen)< Sales by Region >

※ Increased Domestic & Overseas Sales・Increased orders from Large-scale Projects and
Parking Operators・Parking commissioned management services
remained firm・Increased orders for Bicycle Parking Systems
・N. America; Amano McGann Inc; Sales Higher, Profitability advancing towards recovery
・Asian Sales Higher (Korea and Malaysia were Strong)
Parking Systems
ー Consolidated ー
<Quarterly Sales (FY2017.1Q〜FY2019.2Q) >
<Sales (Y-O-Y)>ー ACJ ー
12
(In million yen)
(In million yen)< Sales by Region >
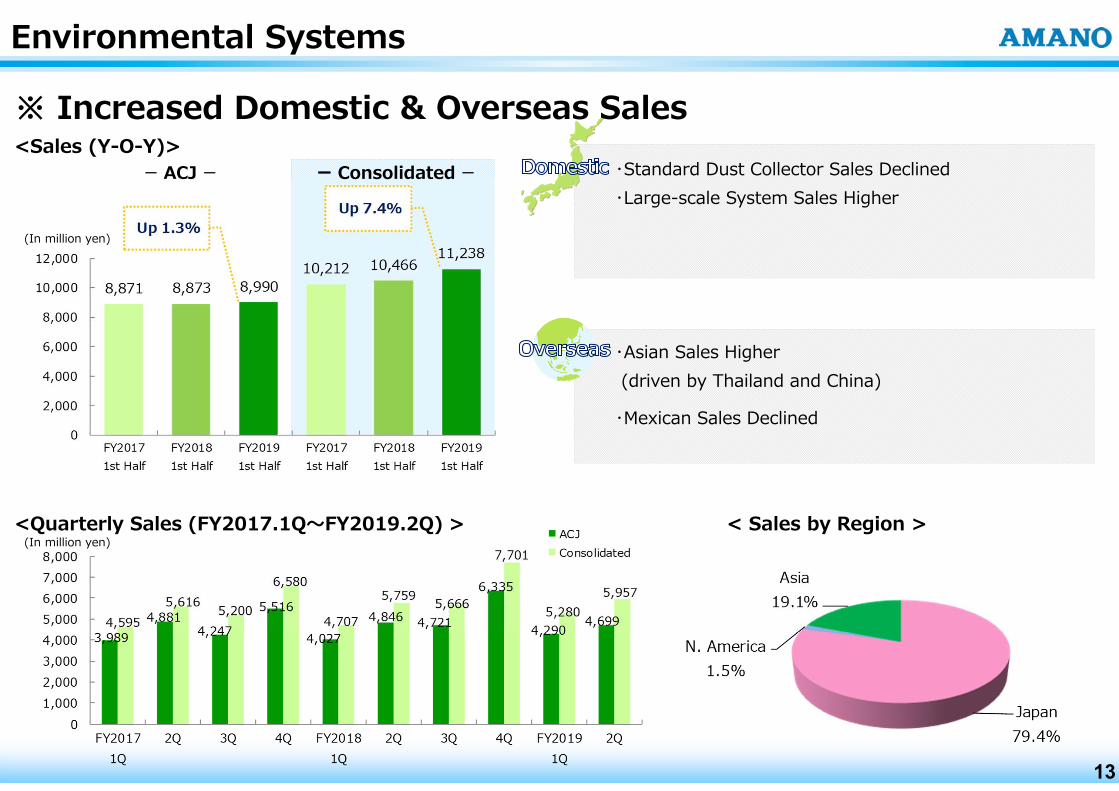
・Standard Dust Collector Sales Declined・Large-scale System Sales Higher
・Asian Sales Higher(driven by Thailand and China)
・Mexican Sales Declined
Environmental Systems
ー Consolidated ー
<Quarterly Sales (FY2017.1Q〜FY2019.2Q) >
<Sales (Y-O-Y)>ー ACJ ー
13
(In million yen)
(In million yen)
※ Increased Domestic & Overseas Sales
< Sales by Region >

ー Consolidated ー
※ Domestic Sales Flat, Lower Overseas Sales
・Orders for the new robotic scrubber “EGrobo” is favorable
・Cleaning equipment sales declined
・N. America; Sales Declined
Clean Systems
<Quarterly Sales (FY2017.1Q〜FY2019.2Q) >
<Sales (Y-O-Y)>ー ACJ ー
14
(In million yen)
(In million yen)< Sales by Region >

Geographic Segment Information
*Report of all overseas units are as of year ending December.
Performance of group companies
15
(In million yen)
Sales Sales Sales Sales% % % % % %
North America 4,289 (115) (2.7) 4,658 (80) (1.7) 8,947 (195) (2.2) 8,798 (685) (7.8) 149 1.7 489 (71.5)Europe 2,244 135 6.0 2,136 164 7.7 4,380 299 6.8 4,609 313 6.8 (229) (5.0) (13) (4.4)Asia 4,859 433 8.9 4,770 457 9.6 9,629 890 9.3 7,759 682 8.8 1,870 24.1 208 30.5
Overseas groupcompanies
11,393 453 4.0 11,564 541 4.7 22,957 994 4.3 21,166 310 1.5 1,791 8.5 684 220.6
*Exchange rate: US$ 110.30 US$ 109.66 US$ 109.98 US$ 108.52EUR 125.28 EUR 122.86 EUR 124.07 EUR 130.66
N.America 59 Mil N.America 59 Mil N.America 119 Mil N.America 103 MilEurope 77 Mil Europe 75 Mil Europe 152 Mil Europe 160 Mil
Sales Sales Sales SalesDomestic Group
companies 5,310 698 13.1 5,639 895 15.9 10,950 1,593 14.6 10,732 1,363 12.7 218 2.0 230 16.9
Operating profitOperating profit Operating profit Operating profit Operating profit Sales
FY2019 1Q(Apr - Jun, 2019)
FY2019 2Q(Jul - Sep, 2019) FY2019 1st Half FY2018 1st Half Change Y-O-Y
*Goodwill Amortization:
Operating profit
FY2019 1Q(Jan - Mar, 2019)
FY2019 2Q(Apr - Jun, 2019) FY2019 1st Half FY2018 1st Half Change Y-O-Y
Operating profit Operating profit Operating profit Operating profit Sales
-

(In million yen)CONSOLIDATED B/S FY2019 2Q FY2018
19.9.30 19.3.31Assets 148,025 147,609 416
Cash & Bank Deposits 47,905 45,558 2,346Notes and accounts receivable - trade 30,715 35,367 (4,651)Inventories 11,011 10,184 827Othe Current Assets 4,865 4,338 527Fixed Assets 53,526 52,160 1,366
Liabilities 41,700 41,017 683Notes and accounts payable - trade 12,520 14,279 (1,758)Other Current Liabilities 22,127 21,290 837Other Fixed Liabilities 7,052 5,447 1,604
Net Assets 106,325 106,592 (267)Shareholder's Equity 109,728 109,178 549Valuation & Conversion Adjustments (4,094) (3,216) (877)
Non-Controlling shareholder's interests 691 630 61Total Liabilities & Net Assets 148,025 147,609 416
Change
Consolidated Balance Sheet
16

(In million yen)
Consilidated Cash Flows (CF)FY20191st Half
FY20181st Half
19.9.30 18.9.30CF from Operating Activities 9,699 6,755 2,943CF from Investing Activities (2,667) (4,801) 2,134FCF 7,032 1,953 5,078CF from Financial Activities (4,697) (2,814) (1,883)Net Increase (decrease) in Cash & Equivalents 2,059 (1,353) 3,413Cash & Cash Equivalents at End of Year 44,547 38,878 5,668
CAPEX(tangible fixed asset) 2,204 1,168 1,036CAPEX(intangible asset) 335 316 19Depreciation 2,442 1,842 601
Change
The CAPEX and Depreciation figures onwards does not include software for sale and M&As.
Consolidated Statements of Cash Flows
17
(*) Amano subsidiaries subject to IFRS have applied IFRS 16 "Leases" for fiscal year 2019 and its impact is reflected in the CAPEX and Depreciation expenses.CAPEX and Depreciation expenses excluding the impact are as follows:
■ FY2019 1st half(Consolidated)CAPEX(tangible fixed asset)1,504CAPEX(intangible asset) 335Depreciation 1,838
(In million yen)
(*)
(*)
(*)

(in million yen)
FY2014 FY2015 FY2016 FY2017 FY2018 FY20191st half
FY2019Full Year
Plan
Consolidated CAPEX[tangible fixed asset] 2,545 2,787 3,101 3,099 2,751 2,204 5,810
Consolidated CAP E [intangible asset] 4,297 3,858 615 642 715 335 888
Total 6,842 6,645 3,717 3,742 3,468 2,540 6,699
ACJ CAPEX[tangible fixed asset] 721 1,083 1,426 1,112 924 645 1,346
ACJ CAPEX[intangible asset] 1,450 3,058 309 323 251 186 375
Total 2,171 4,142 1,736 1,435 1,175 832 1,721
Depreciation (Consolidated) 4,137 4,415 3,549 3,593 3,833 2,442 5,072
Depreciation (ACJ) 1,921 2,047 1,255 1,327 1,273 630 1,420
The CAPEX and Depreciation figures for FY2016 onwards does not include software for sale and M&As.
CAPEX & Depreciation
18
(*) Amano subsidiaries subject to IFRS have applied IFRS 16 "Leases" for fiscal year 2019 and the impact is reflected in the actual results and plans.CAPEX and Depreciation expenses excluding the impact are as follows:
■ FY2019 1st half(Consolidated)CAPEX(tangible fixed asset)1,504CAPEX(intangible asset) 335Depreciation 1,838
■ FY2019 Full Year Plan(Consolidated)CAPEX(tangible fixed asset) 3,109CAPEX(intangible asset) 888Depreciation 3,878
(In million yen)
(*)
(*)
(*)

The 7th Medium-Term Business Plan(FY2017-FY2019)
19

91,812 78,586 83,302 88,146 90,295
102,131 109,837
119,506 120,124 124,405 131,713
142,000
5,371
1,927 4,383 5,917
7,329 8,826 9,357
12,942 13,165 14,350 15,161 16,000
0
5,000
10,000
15,000
20,000
25,000
30,000
20,000
40,000
60,000
80,000
100,000
120,000
140,000
160,000
FY2008 FY2009 FY2010 FY2011 FY2012 FY2013 FY2014 FY2015 FY2016 FY2017 FY2018 FY2019Plan
Roadmap of the Medium-term Business Plan
4th Medium-term Plan5th Medium-term Plan
6th Medium-term Plan7th Medium-term Plan
(In Million Yen)(In Million Yen)Original Plan Revised Plan
138,000138,000
16,50016,500
20
FY2008 FY2009 FY2010 FY2011 FY2012 FY2013 FY2014 FY2015 FY2016 FY2017 FY2018 FY2019
4th Medium‐term Plan 5th Medium‐term Plan 6th Medium‐term Plan
Global Niche TopEstablishing new businesses
FY2013Sales: over ¥103BnOperating Profit: over ¥10Bn
Re-building profit structure & strengthening global strategy
FY2010Net Sales: over ¥114bnOrdinary Profit: over ¥12.7bn
Global Growth Strategy To becomea 100-year Company Challenge to a New Stage
FY2016Sales: over ¥130BnOperating Profit: over ¥13Bn
Expand Corporate Scale & Establish Growth Drivers
7th Medium‐term Plan
2nd Stage Towards a 100-year Company
Quantum Leap
FY2019Sales: over ¥140BnOperating Profit: over ¥16Bn
Innovative Creation of Value for Sustainable Growth

The 7th Medium-Term Business Plan Concept (Apr. 2017- Mar. 2020)The 7th Medium-Term Business Plan Concept (Apr. 2017- Mar. 2020)
Business Concept
21

The 7th Medium-Term Business Plan the theme, “Regional growth strategies”
ACJ +Domestic Group( )
¥7.3Bn ¥8.4Bn ¥9.0Bn
FY2016 FY2017 FY2018
¥12.0Bn ¥14.5Bn ¥17.8Bn
FY2016 FY2017 FY2018
¥18.8Bn ¥18.0Bn ¥18.3Bn
FY2016 FY2017 FY2018
¥92.7Bn ¥93.9Bn ¥96.8Bn
FY2016 FY2017 FY2018
Clean SystemsEnvironmental SystemsParking SystemsTime Management ProductsInformation Systems
22

(In million yen)
Change% Change% Change%% % %
Sales 124,405 3.6 131,713 5.9 142,000 138,000 4.8Operating profit 14,350 9.0 15,161 5.7 16,000 16,500 8.8Operating profit Ratio 11.5% 11.5% 11.3% 12.0%Ordinary profit 15,060 9.1 16,090 6.8 16,400 16,900 5.0Net income attributable to owners ofthe parent company 10,019 8.6 9,142 (8.8) 10,800 11,000 20.3
(In million yen)
Amount % Change% Amount % Change% Amount Change% Amount % Change%% % % % % %
Information Systems 26,759 21.5 7.9 29,176 22.2 9.0 32,000 22.5 31,500 22.8 8.0Time Management Products 3,751 3.0 (1.7) 3,609 2.7 (3.8) 3,300 2.3 3,500 2.5 (3.0)Parking Systems 60,757 48.8 4.0 63,879 48.5 5.1 68,000 47.9 67,500 48.9 5.7Total: Time Information Segment 91,268 73.3 4.9 96,665 73.4 5.9 103,300 72.7 102,500 74.2 6.0Environmental Systems 21,993 17.7 1.3 23,833 18.1 8.4 25,200 17.8 24,100 17.5 1.1Clean Systems 11,143 9.0 (2.3) 11,213 8.5 0.6 13,500 9.5 11,400 8.3 1.7Total: Environmental Segment 33,136 26.7 0.1 35,047 26.6 5.8 38,700 27.3 35,500 25.8 1.3Grand total 124,405 100.0 3.6 131,713 100.0 5.9 142,000 100.0 138,000 100.0 4.8
FX Conversion Rates: US$ 112.04 US$ 110.37 US$ 105.00 US$ 105.00 EUR 127.19 EUR 130.00 EUR 114.00 EUR 125.00
FY2017 Result FY2018 Result MTBP FY2019 Plan FY2019 Revised PlanAmount Amount Amount Amount
FY2017 Result FY2018 Result MTBP FY2019 Plan FY2019 Revised Plan
Numerical Targets for FY2017-FY2019
23
(*)MTBP : Medium-Term Business Plan
◆ Business Plan
◆Sales Plan

Returns to shareholders
24
43.4 42.8 43.7 43.0 43.3
65.9
43.7
20.0
30.0
40.0
50.0
60.0
70.0
80.0
FY2013 FY2014 FY2015 FY2016 FY2017 FY2018 FY2019Forcast
(%)
Normal dividends49.5
Total Return Ratio 55.0
13.0 15.0 20.0 23.0 23.0 25.0 28.017.0
23.028.0
29.034.0
55.0
36.0
30.038.0
48.052.0
57.0
80.0
64.0
2.93.3
3.9 4.1 4.2
5.7
4.4
0.0
1.0
2.0
3.0
4.0
5.0
6.0
0.0
10.0
20.0
30.0
40.0
50.0
60.0
70.0
80.0
90.0
100.0
FY2013 FY2014 FY2015 FY2016 FY2017 FY2018 FY2019Forcast
Year-end dividend(yen)Interim dividend(yen)Net Asset Payout Ratio(%)
Special dividends
20.0
Normal dividends
35.0
25.0
<Dividend per Share and Consolidated Net Asset Payout Ratio >
・Consolidated Dividend Payout Ratio: Target above 40.0% ・Net Asset Payout Ratio: Target above 2.5%
<Consolidated Dividend Payout Ratio and Total Return Ratio >
◎ Dividend Policy Stable dividends + performance incentives
★ The acquisition of treasury stock・ Acquisition period・ Total number of acquired stocks・ Total amount of acquired stocks
︓ From October 2018 to March 2019︓ 1 Million︓ 2,326 Million yen
・Total Return Ratio : Target above 55.0%NEW

Business Forecast for FY2019 (Fiscal Year ending March 2020)
25

●Consolidated (In million yen)
Amount (%) Change(%) Amount (%) Change(%) Amount (%) Amount (%)% % % % % %
Net sales 138,000 100.0 4.8 63,500 100.0 4.1 131,713 100.0 61,008 100.0Gross profit 61,000 44.2 4.7 28,200 44.4 4.3 58,246 44.2 27,036 44.3SG&A 44,500 32.2 3.3 22,200 35.0 3.1 43,084 32.7 21,533 35.3Operating profit 16,500 12.0 8.8 6,000 9.4 9.0 15,161 11.5 5,502 9.0Ordinary profit 16,900 12.2 5.0 6,500 10.2 9.7 16,090 12.2 5,924 9.7Net income attributable to ownersof the parent company 11,000 8.0 20.3 4,000 6.3 4.5 9,142 6.9 3,828 6.3
●ACJ (In million yen)
Amount (%) Change(%) Amount (%) Change(%) Amount (%) Amount (%)% % % % % %
Net sales 77,000 100.0 2.9 34,800 100.0 2.7 74,796 100.0 33,885 100.0Gross profit 33,100 43.0 2.7 14,700 42.2 2.7 32,222 43.1 14,317 42.3SG&A 21,600 28.1 2.5 10,800 31.0 3.0 21,066 28.2 10,487 31.0Operating profit 11,500 14.9 3.1 3,900 11.2 1.8 11,155 14.9 3,830 11.3Ordinary profit 13,500 17.5 2.2 5,200 14.9 0.7 13,210 17.7 5,165 15.2Net Income 9,500 12.3 (3.3) 3,800 10.9 2.7 9,827 13.1 3,699 10.9
1st HalfFY2018 Result
Full Year 1st Half
FY2019 PlanFull Year 1st Half Full Year 1st Half
FY2018 Result
FY2019 PlanFull Year
Business Forecast for the Full FY2019◆ Consolidated
◆ ACJ
26

(In million yen)
Amount % Amount % Amount % Amount %% % % % %
Information Systems 31,500 22.8 2,323 8.0 14,445 22.3 17,054 23.3 29,176 22.2Time Management Products 3,500 2.5 (109) (3.0) 1,722 2.7 1,777 2.4 3,609 2.7Parking Systems 67,500 48.9 3,620 5.7 32,131 49.5 35,368 48.4 63,879 48.5Total: Time Information Segment 102,500 74.3 5,834 6.0 48,299 74.5 54,200 74.1 96,665 73.4Environmental Systems 24,100 17.5 266 1.1 11,238 17.3 12,861 17.6 23,833 18.1Clean Systems 11,400 8.3 186 1.7 5,337 8.2 6,062 8.3 11,213 8.5Total: Environmental Segment 35,500 25.7 452 1.3 16,575 25.5 18,924 25.9 35,047 26.6
Grand total 138,000 100.0 6,286 4.8 64,874 100.0 73,125 100.0 131,713 100.0
●Unconsolidated(In million yen)
Amount % Amount % Amount % Amount %% % % % %
Information Systems 18,500 24.0 1,467 8.6 8,548 24.0 9,951 24.1 17,032 22.8Time Management Products 3,100 4.0 36 1.2 1,467 4.1 1,632 4.0 3,063 4.1Parking Systems 30,400 39.5 340 1.1 14,432 40.4 15,967 38.6 30,059 40.2Total: Time Information Segment 52,000 67.5 1,845 3.7 24,448 68.5 27,551 66.7 50,154 67.1Environmental Systems 20,100 26.1 168 0.8 8,990 25.2 11,109 26.8 19,931 26.6Clean Systems 4,900 6.4 189 4.0 2,234 6.3 2,665 6.5 4,710 6.3Total: Environmental Segment 25,000 32.5 357 1.5 11,224 31.5 13,775 33.3 24,642 32.9
Grand total 77,000 100.0 2,203 2.9 35,672 100.0 41,327 100.0 74,796 100.0
Business divisionPlan Year endingMarch 31, 2020
Result1st Half
Plan2nd Half
Year endingMarch 31, 2019
Change
Business divisionPlan Year endingMarch 31, 2020
Result1st Half
Plan2nd Half
Year endingMarch 31, 2019
Change
◆ Consolidated
◆ ACJ
*The plan for the 2nd Half is shown as “Full Year Plan minus 1st Half Results”
Sales Forecast for the Full FY2019 by Business Division
27

10,750 11,788 11,702 12,261 13,251 14,445
12,80813,724 13,087
14,49815,925
17,05423,558
25,512 24,78926,759
29,17631,500
0
5,000
10,000
15,000
20,000
25,000
30,000
35,000
FY2014 FY2015 FY2016 FY2017 FY2018 FY2019Forcast
2nd Half 1st Half
Up 8.0%
・MH(Middle High) market;Promote VG+ZeeM packaged dealsCollaborate with CREOPromote Hosting & Cloud Based Solutions(VG Cloud)
・ML(Middle Low) market; Promote NX(T&A / Payroll) + "e-AMANO(Personnel affairs notification service)" packaged deals
・Developing public markets
・Strengthen Terminal Business
・N. America; Accu-Time Systems Inc. Expand cloud services, strengthen terminal proposals
・Europe; Horoquartz, S.A. Expand customer basePromote 3-in-1 proposals which includes T&A, Access and Cards
The 7th Medium-term Business PlanBrand Strategy by BusinessThe 7th Medium-term Business PlanBrand Strategy by Business
HR Solution Vendor
Information Systems: Action Plan
(In million yen)
28

1,957 2,015 1,844 1,773 1,696 1,722
2,143 2,1501,974 1,978 1,913 1,777
4,100 4,1653,818 3,751 3,609 3,500
0
500
1,000
1,500
2,000
2,500
3,000
3,500
4,000
4,500
5,000
FY2014 FY2015 FY2016 FY2017 FY2018 FY2019Forcast
2nd Half 1st Half Dn 3.0%
・Uncovering new demand from the basic timerecorder marketStrengthen online store and sales over the internet
・Expand TimeP@CK salesEnhancing charged member services
・N. America; Restructure Sales Channels & Deploy Online Sales
・Europe; Establish sales network, deploy online sales
HR Solution Vendor
Time Management Products : Action Plan
(In million yen)
29
The 7th Medium-term Business PlanBrand Strategy by BusinessThe 7th Medium-term Business PlanBrand Strategy by Business

23,551 25,478 27,283 27,955 29,765 32,131
28,26630,306 31,119 32,802
34,11435,368
51,81755,784 58,402
60,75763,879
67,500
0
10,000
20,000
30,000
40,000
50,000
60,000
70,000
80,000
FY2014 FY2015 FY2016 FY2017 FY2018 FY2019Forcast
2nd Half 1st Half
Up 5.7%
・Closer ties with major operators
・Medium small operatorsParking Data Center; Enhance Services
・Management services; Expand holistic solutionsPromote Packaged Installation of Car & Bicycle Parking
・Expand new markets Bicycle parking , security gates, toll roads
・New product launch
・Strengthening group collaboration
・N.America; Re-estabishing the sales regime and management controls
・Europe; Reinforce Sales Organization and Management Service Business
・Asia; Expand Management service business
Parking Total Solution Vendor
Parking Systems: Action Plan
(In million yen)
30
The 7th Medium-term Business PlanBrand Strategy by BusinessThe 7th Medium-term Business PlanBrand Strategy by Business

8,732 9,849 10,053 10,212 10,466 11,238
11,90711,981 11,659 11,781
13,367 12,861
20,63921,830 21,712 21,993
23,833 24,100
0
5,000
10,000
15,000
20,000
25,000
30,000
FY2014 FY2015 FY2016 FY2017 FY2018 FY2019Forcast
2nd Half 1st Half
Up 1.1%
・North & Central America;Expand standard equipment sales to the auto industryDevelop new markets
・Asia; Reinforce sales and engineeringDevelop the Chinese and Vietnamese markets
・Increase global project orders initiated domestically
・Increase orders for standard dust collectors Strengthen proposals for mid and large sized models
・Expand holistic sales by including peripheral devicesPowder Conveying & Deodorizing Equipment
M2M Partial Solution Vendor
Environmental Systems: Action Plan
(In million yen)
31
The 7th Medium-term Business PlanBrand Strategy by BusinessThe 7th Medium-term Business PlanBrand Strategy by Business

4,3925,719 5,716 5,759 5,829 5,337
5,328
6,494 5,685 5,384 5,384 6,062
9,720
12,21311,401 11,143 11,213 11,400
0
2,000
4,000
6,000
8,000
10,000
12,000
14,000
FY2014 FY2015 FY2016 FY2017 FY2018 FY2019Forcast
2nd Half 1st Half
Up 1.7%(In million yen)
・Develop markets for robotic cleaners
・Promote the Sales of Auto Floor Scrubber "EG Series"
・Expand sales of compact cordless polishers
・Strengthen Holistic Cleanliness Proposals Total Solutions; Hard & Software,
Maintenance and Services
・Mining the factory market
・N. America; Strengthen business foundationExpand the wooden floor sanding business
Robotics Solution Vendor
Clean Systems: Action Plan
32
The 7th Medium-term Business PlanBrand Strategy by BusinessThe 7th Medium-term Business PlanBrand Strategy by Business

●Time Information SegmentUp 6.0% Y-O-Y
●Environmental Segment ※ Operating Profit Up 8.8% Y-O-YUp 1.3% Y-O-Y
●Time Information Segment UP 11.8 % Y-O-Y●Environmental Segment Dn 2.2 % Y-O-Y
29,176 31,500
3,609 3,500
63,879 67,500
96,665 102,500
0
40,000
80,000
120,000
FY2018 Result FY2019 Plan
(In million yen)
Parking Systems
Time Management Products
Information Systems
23,833 24,100
11,213 11,400
35,047 35,500
0
10,000
20,000
30,000
40,000
FY2018 Result FY2019 Plan
(In million yen)
Clean Systems
EnvironmentalSystems
13,590 15,200
5,621 5,500
(4,049) (4,200)
15,161 16,500
(5,000)
0
5,000
10,000
15,000
20,000
FY2018 Result FY2019 Plan
(In million yen)Company-wideExpenses
EnvironmentalSegment
Time InformationSegment
Company wide expenses
【Sales】 【Operating profit】
FY2019 Sales & Operating Profit by Segment -Full Year Forecast-
33
(In million yen)
FY2019 Plan FY2018 ResultSales Sales
% % % %Time Information Segment 102,500 15,200 14.8 96,665 13,590 14.1 5,834 6.0 1,609 11.8Environmental Segment 35,500 5,500 15.5 35,047 5,621 16.0 452 1.3 (121) (2.2)Company-wide Expenses (4,200) (4,049) (150)
Total 138,000 16,500 12.0 131,713 15,161 11.5 6,286 4.8 1,338 8.8
Operating profit Operating profit Sales
Change Y-O-YOperating profit

0
500
000
500
000
18.31Q
2Q 3Q 4Q 19.31Q
2Q 3Q 4Q 20.31Q
2Q
HardwareSoftwareMaintenance & suppliesDifferenceTotal
0
300
600
900
200
18.31Q
2Q 3Q 4Q 19.31Q
2Q 3Q 4Q 20.31Q
2Q
Time recorders, stamps
Maintenance & supplies
Difference
Total
0
000
000
000
000
18.31Q
2Q 3Q 4Q 19.31Q
2Q 3Q 4Q 20.31Q
2Q
System & Merchandise
Maintenance & supplies
Difference
Total
<Information Systems>
<Time Management Products>
<Parking Systems>
18.31Q
2Q 3Q 4Q 19.31Q
2Q 3Q 4Q 20.31Q
2Q
Standard unit
Large systems
Maintenance & supplies
Difference
Total
18.31Q
2Q 3Q 4Q 19.31Q
2Q 3Q 4Q 20.31Q
2Q
Cleaning equipment
Maintenance & supplies
Difference
Total
* Indicating Y-O-Y Variance
<Environmental Systems>
<Clean Systems>
Quarterly Sales by Item (actual results)
34
