second quarter sector statistics report for the … · of 2.8 percentage points when compared to...
TRANSCRIPT

SECOND QUARTER SECTOR STATISTICS REPORT FOR
THE FINANCIAL YEAR 2017/2018 (1ST
OCTOBER – 31ST
DECEMBER 2017)
Direct any queries on the report to:
Director/Competition, Tariffs and Market Analysis
Tel:+254-703 042000, +254 - 713 172000
Email: [email protected]
Website: www.ca.go.ke
Disclaimer: Although every effort has been made to ensure accuracy of the data contained in this report, the Authority is not liable for inaccuracies in any of the information contained in this report, which is contingent upon the operators/service providers’ compliance returns.

Table of Contents
Table of Contents .......................................................................................................................... 2
LIST OF TABLES ........................................................................................................................ 3
LIST OF FIGURES ...................................................................................................................... 3
LIST OF ABBREVIATIONS ...................................................................................................... 4
I. PRELIMINARY NOTES ...................................................................................................... 5
II. REPORT SUMMARY ........................................................................................................... 5
1 CELLULAR MOBILE SERVICES .................................................................................... 7
1.1 Mobile Subscriptions ................................................................................................ 7
1.2 Mobile Money Transfer .......................................................................................... 10
1.3 Mobile Number Portability .................................................................................... 10
1.4 Local Mobile Traffic and Usage Pattern .............................................................. 11
1.4.1 Local Voice Traffic .................................................................................................... 11 1.4.2 Local Mobile Voice Traffic per Operator .................................................................. 12
1.4.3 Minutes of Use per Month per User .......................................................................... 14
1.4.4 Domestic Short Messaging Service (SMS)................................................................ 15
1.5 Roaming Traffic ...................................................................................................... 16
1.6 International Mobile Traffic .................................................................................. 17
2 FIXED TELEPHONE SERVICE ..................................................................................... 18
2.1 Fixed Network Subscriptions ................................................................................. 18
2.2 Fixed Network Traffic ............................................................................................ 18
2.3 International Fixed Voice Traffic .......................................................................... 19
3 DATA/INTERNET SERVICES ........................................................................................ 19
3.1 Data/Internet Subscriptions ................................................................................. .. 19
3.2 Broadband Services ................................................................................................ 23
3.2.1 Broadband Subscriptions ........................................................................................... 23 3.2.2 Fixed Broadband Subscriptions by Speed ................................................................. 24
3.3 International Bandwidth ........................................................................................ 24
3.4 Registered Domain Names ..................................................................................... 25
4 National Cyber Threat Landscape .................................................................................... 26
4.1 Cyber Threats Detected .......................................................................................... 26
4.2 Validated and Responded to Cyber Threats ........................................................ 26
5 BROADCASTING .............................................................................................................. 27
2

5.1 Digital Terrestrial Television ................................................................................. 27
5.2 Digital Terrestrial Television sites rollout ............................................................ 27
5.3 Set top Boxes ............................................................................................................ 27
5.4 FM Radio Stations .................................................................................................. 28
6 POSTAL AND COURIER SERVICES ............................................................................ 28
6.1 Postal and Courier Traffic ..................................................................................... 28
6.2 Number of Postal and Courier Outlets ................................................................. 28
7 TARIFFS, PROMOTIONS AND SPECIAL OFFERS ................................................... 29
8 CONCLUSION ................................................................................................................... 30
LIST OF TABLES
TABLE 1: MOBILE SUBSCRIPTIONS PER OPERATOR ......................................................................... 10
TABLE 2: MOBILE MONEY TRANSFER SERVICE .............................................................................. 10
TABLE 3: MOBILE NUMBER PORTABILITY ...................................................................................... 11
TABLE 4: LOCAL MOBILE VOICE TRAFFIC IN MINUTES ................................................................... 11
TABLE 5: LOCAL MOBILE VOICE TRAFFIC BY OPERATOR ................................................................ 13
TABLE 6: SHORT MESSAGING SERVICE PER OPERATOR .................................................................. 16
TABLE 7: ROAMING TRAFFIC ......................................................................................................... 16
TABLE 8: INTERNATIONAL MOBILE TRAFFIC .................................................................................. 17
TABLE 9: LOCAL FIXED NETWORK TRAFFIC IN MINUTES ............................................................... 18
TABLE 10: INTERNATIONAL FIXED VOICE TRAFFIC ........................................................................ 19
TABLE 11: DATA/INTERNET SUBSCRIPTIONS .................................................................................. 20
TABLE 12: FIXED/WIRELESS INTERNET SUBSCRIPTIONS BY SERVICE PROVIDER................................ 23
TABLE 13: INTERNATIONAL INTERNET AVAILABLE BANDWIDTH (GBPS)......................................... 25
TABLE 14: INTERNATIONAL INTERNET USED BANDWIDTH (GBPS) .................................................. 25
TABLE 15: NUMBER OF DOMAIN NAMES ........................................................................................ 26 TABLE 16: CYBER THREATS VALIDATED AND RESPONDED ............................................................... 27
TABLE 17: POSTAL AND COURIER TRAFFIC .................................................................................... 28
TABLE 18: TARIFFS........................................................................................................................ 29
TABLE 19: PROMOTIONS AND SPECIAL OFFERS .............................................................................. 30
LIST OF FIGURES
FIGURE 1: MOBILE SUBSCRIPTIONS ..................................................................................................7
FIGURE 2: NET ADDITIONS IN MOBILE SUBSCRIPTIONS.....................................................................8
FIGURE 3: MARKET SHARE FOR MOBILE SUBSCRIPTIONS PER OPERATOR .........................................9
FIGURE 4: PROPORTION OF ON NET TO OFF NET VOICE TRAFFIC PER OPERATOR (%) ....................13
FIGURE 5: PROPORTION OF TOTAL ON-NET TO TOTAL OFF NET MOBILE VOICE TRAFFIC ..............14
FIGURE 6: MINUTES OF USE PER MONTH PER USER ........................................................................15
FIGURE 7: FIXED NETWORK SUBSCRIPTIONS ..................................................................................18
FIGURE 8: TOTAL DATA/INTERNET SUBSCRIPTIONS .........................................................................21
3

FIGURE 9: MOBILE DATA/INTERNET SUBSCRIPTIONS .......................................................................22
FIGURE 10: BROADBAND SUBSCRIPTIONS .......................................................................................23
FIGURE 11: FIXED BROADBAND SUBSCRIPTIONS BY SPEED .............................................................24
FIGURE 12: NUMBER OF POSTAL COURIER OUTLETS ......................................................................29
LIST OF ABBREVIATIONS DTT Digital Terrestrial Television
EASSy Eastern Africa Submarine Cable Systems
ICTs Information Communication Technologies
EVDO Evolution-Data Optimized LION2 Lower Indian Ocean Network GSM Global Systems for Mobile Communications Mbps Megabits per second Gbps Gigabits per second MMS Multimedia Service MoU Minutes of Use MVNO Mobile Virtual Network Operator SEACOM Sea Sub-Marine Communications Limited KW Kilowatts SIM Subscriber Identification Module SMS Short Messaging Service TEAMS The East African Marine System VSAT Very Small Aperture Terminal FY Financial Year DDoS Distributed Denial-of-Service ADN African Digital Network Limited OTT Over-The-Top KE-CIRT/CC National Kenya Computer Incident Response Team/Coordination
Centre
4

I. PRELIMINARY NOTES
This report is based on data provided by service providers in the communications sector as per their license conditions.
The information provided in this report is subject to review in case of any revisions or updates from the service providers.
II. REPORT SUMMARY
The Second Quarter Sector Statistics Report provides an overview of the communications sector
performance and trends for the period 1st
October to 31st
December 2017 on the following service categories:
Mobile Telephony Services
Fixed Telephony Services
Data/Internet Services
Broadcasting Services
Postal and Courier Services
Tariffs, Promotions and Special Offers
National Cyber Security Threats
Key ICT Indicators
INDICATORS Jul-Sep 2017 Oct-Dec 2017 % change
Q1 Q2 Q1 to Q2
Mobile Subscriptions (Millions) 41.028 42.815 4.4
Fixed subscriptions 71,118 69,861 -1.8
Mobile Penetration 90.4 94.3 4.3
Fixed Telephone Penetration 0.16 0.15 -6.3
VOICE TRAFFIC IN MINUTES
Mobile On-Net Voice Traffic (Billions) 9.920 10.493 5.8
Mobile Off-Net Voice Traffic (Billions) 1.147 1.298 13.2
International Incoming Mobile Voice Traffic 147.098 157.392 7.0
(Millions)
International Outgoing Mobile Voice Traffic 111.501 107.512 -3.6
(Millions)
Roaming-out (Own Subscribers) (Millions) 44.265 40.660 -8.1
Roaming-in (Foreign Subscribers) (Millions) 35.053 35.010 -0.1
Total Local Fixed network traffic 603,200 585,744 -2.9
International Incoming Fixed Network Voice traffic 2.172 2.104 -3.1
(Millions)
International Outgoing Fixed Network Voice traffic 1.452 1.301 -10.4
(Millions)
5

International Outgoing Fixed Network VoIP traffic 686,886 643,109 -6.4
MOBILE SMS TRAFFIC
SMS On-Net (Billions) 18.754 17.333 -7.6
SMS Off-Net (Millions) 539.534 697.840 29.3
International Incoming SMS (Millions) 10.053 14.595 45.2
International Outgoing SMS (Millions) 9.578 9.283 -3.1
MOBILE MONEY TRANSFER SERVICES
Number of Active Mobile Money Transfer 28.192 30.000 6.4
Subscriptions (Millions)
Number of Registered Mobile Money Agents 184,537 198,234 7.4
Number of Transactions-Sending and Withdrawal 537.242 607.413 13.1
(Millions)
Value of Transactions- Sending and Withdrawal 1.659 1.763 6.3
(Ksh.) trillions
DATA/INTERNET SERVICES
Data/ Internet Subscriptions (Millions) 30.891 33.365 8.0
Total Available International Bandwidth (Gbps) 2909.512 3182.592 9.4
Total Used International Bandwidth (Gbps) 887.187 916.287 3.3
Broadband Penetration 38.8 39.7 2.3
BROADCASTING SERVICES
Number of free-to-air TV channels 62 64 3.2
Number of Radio FM stations 178 178 0.0
Digital Terrestrial Television Signal Population 83.6 85.8 2.6
Coverage (%)
POSTAL AND COURIER SERVICES
Postal Outlets 623 623 0.0
Private Courier Outlets 997 997 0.0
Number of Letters (Up to 350 gms) Posted Locally 16.027 16.03 0.0
(Millions)
Total Courier Items Sent Locally (Millions) 1.712 1.855 8.4
International Incoming Letters (Up to 350 gms) 1.078 1.064 -1.3
(Millions)
International Outgoing Letters (Up to 350 gms) 1.083 1.090 0.6
(Millions)
Total Population in Kenya (Millions) 45.4 45.4 0.0
NATIONAL CYBER THREAT LANDSCAPE
Number of Cyber Security Alerts Received - 4,589 -
Number of Cyber Threats Validated and Resolved - 539 -
6

1 CELLULAR MOBILE SERVICES
1.1 Mobile Subscriptions
The performance of mobile telephony sub-sector registered substantial growth during the
second quarter of the financial year 2017/18. The number of active1 mobile subscriptions rose
from 41.0 million recorded in the first quarter to 42.8 million subscriptions, which marked a growth of 4.4 per cent over the period. Subsequently, the mobile penetration level increased to 94.3 per cent from 90.4 per cent recorded in the preceding quarter.
Figure 1 illustrates the trends in mobile subscriptions and penetration levels.
Figure 1: Mobile Subscriptions
Source: CA, Operators’ Returns
During the quarter under review, net additions in mobile subscriptions were recorded at 1.7 million up from 768,831 subscriptions reported in the preceding quarter.
Figure 2 shows the net additions in mobile subscriptions
1 Active means subscriptions that have generated revenue within the last 90 days
7

Figure 2: Net Additions in Mobile Subscriptions
Source: CA, Operators’ Returns.
Safaricom PLC registered 69.1 per cent market share in mobile subscriptions marking a decline of 2.8 percentage points when compared to 71.9 per cent recorded during the previous quarter.
The market shares for Airtel Networks Limited rose to 17.2 per cent from 14.9 per cent recorded during the previous quarter.
Telkom Kenya Limited gained 0.6 per centage points to register a market share of 9.0 per cent from 8.4 per cent posted in the previous quarter. On the other hand, Finserve Africa Limited lost by 0.2 percentage points to post a market share of 4.5 per cent.
The market shares for Sema Mobile Services and Mobile Pay Limited remained unchanged at 0.0 per cent and 0.2 per cent respectively.
Figure 3 illustrates mobile subscriptions market shares per operator.
8

Figure 3: Market Share for Mobile Subscriptions Per Operator
Source: CA, Operators’ Returns.
During the period under review, the number of pre-paid mobile and postpaid mobile subscriptions stood at 41.4 million and 1.4 million respectively.
Safaricom PLC reported a total of 29.5 million mobile subscriptions with 28.2 million being prepaid and 1.2 million postpaid.
The total number of mobile subscriptions recorded by Airtel Networks Limited rose to 7.3 million subscriptions from 6.1 million. This marked an increase of 20.7 per cent during the
quarter.
Telkom Kenya Limited registered 12.4 per cent increase in mobile subscriptions to post 3.8 million subscriptions from 3.4 million recorded in the preceding quarter.
Finserve Africa Limited registered a growth of 1.2 per cent during the period under review to record 1.93 million subscriptions up from 1.90 million reported during the previous period.
Mobile Pay limited recorded 89,892 pre-paid mobile subscriptions up from last quarter’s 88,853. On the other hand, Sema Mobile Services lost its mobile subscriptions by 50.2 percent to register 112 subscriptions from 263 recorded in the previous quarter.
The number of pre-paid and post-paid subscriptions by operator is as indicated in Table 1
9

Table 1: Mobile Subscriptions per Operator
Name of operator Dec-17 Sep-17 Quarterly Pre-paid Post-paid Total Pre-paid Post-paid Total variation
(%)
Safaricom PLC 28,297,097 1,267,077 29,564,174 28,241,267 1,249,029 29,490,296 0.3
Airtel Networks 7,232,787 137,248 7,370,035 5,963,595 141,241 6,104,836 20.7
Limited
Telkom Kenya 3,850,432 10,127 3,860,559 3,423,685 12,291 3,435,976 12.4
Limited Finserve Africa 1,930,337 - 1,930,337 1,908,083 - 1,908,083 1.2
Limited
Sema Mobile 112 - 112 263 - 263 -57.4
Services Mobile Pay 89,892 - 89,892 88,853 - 88,853 1.2
Limited
Total 41,400,657 1,414,452 42,815,109 39,625,746 1,402,561 41,028,307 4.4
Source: CA, Operators’ Returns.
1.2 Mobile Money Transfer
As at 31st
December 2017, the number of active mobile money transfer subscriptions and agents stood at 30.0 million and 198,234 respectively. A total of 607.4 million mobile money transfer
transactions2 valued at Ksh. 1.763 trillion were carried. In addition, there were 308.6 million
mobile commerce 3 transactions valued at Ksh.1.1 trillion. The value of person-to-person
transfers amounted to Ksh. 596.4 million.
Table 2 shows the details of mobile money transfer and mobile commerce services.
Table 2: Mobile Money Transfer Service
Service Oct -Dec 17
Agents Subscriptio Number of Value of Mobile Value of mobile Person to
ns transactions transactions commerce commerce (Kshs) Person transfers
(Kshs) transactions (Kshs)
M-Pesa 152,077 23,417,713 493,063,124 1,409,832,629,332 372,062,839 907,322,698,113 492,601,868,872 Airtel Money 23,515 2,794,543 2,614,891 1,586,285,529 3,232,246 2,996,628,670 1,015,097,253
Equitel - 1,930,337 110,517,554 350,546,346,428 65,946,671 258,957,426,783 102,026,734,760
Money Mobikash* 16,749 1,772,696 815,881 127,032,829 6,430 9,227,168 22,876,608
Mobile Pay 5,893 89,892 402,044 1,464,115,021 - - 776,763,956
Total 198,234 30,005,181 607,413,494 1,763,556,409,139 441,248,186 1,169,285,980,734 596,443,341,449
Source: CA, Operators’ Returns. *Provisional data
1.3 Mobile Number Portability As illustrated in table 3, the number of mobile in-ports increased by four-fold during the period under review to record 1,594 in-ports from 295 in-ports reported in the previous quarter.
2 Mobile Money Transfer Transactions-Sending and Withdrawals
3 Mobile Commerce Transactions-Pay Bill, Buy goods and Services
10

Table 3: Mobile Number Portability
Period Oct - Dec 17 Jul - Sep 17 Quarterly Oct - Dec 16
Variation (%)
Number of 1,594 295 440.0 404 in-ports
Source: CA, Operators’ Returns.
1.4 Local Mobile Traffic and Usage Pattern
1.4.1 Local Voice Traffic
During the period under review, the total mobile voice traffic grew by 6.5 per cent to register 11.8 billion minutes from 11.0 billion minutes recorded in the previous period.
On-net mobile voice traffic grew by 5.8 per cent to stand at 10.4 billion minutes from 9.920
minutes recorded during the previous period. Off net mobile voice traffic rose by 13.1 per cent to post 1.2 billion minutes. Further, mobile to fixed voice traffic increased to 23.2 million
minutes from 23.0 million minutes recorded in the previous quarter
The quarter under review saw traffic terminating on mobile networks increase to 11.7 billion
minutes from 11.0 billion minutes recorded in the previous quarter. Incoming mobile voice traffic from other networks to own network rose by 17.4 per cent to record 1.2 billion minutes
from 1.0 billion minutes. Fixed network to mobile network voice traffic declined by 11.1 per
cent to register 9.7 million minutes during the period under review.
Table 4 shows a summary of local mobile voice traffic.
Table 4: Local Mobile Voice traffic in Minutes
Mobile Traffic Oct -Dec 17 Jul - Sep 17 Quarterly Oct -Dec 16
Variation
(%) By Traffic originating (outgoing traffic)
Own Network –Own 10,493,091,107 9,920,177,093 5.8 9,522,341,685
Network Own Network to
Other Mobile 1,298,099,413 1,147,363,309 13.1 1,321,393,435
Networks
Mobile Network to 23,253,694 23,061,836 0.8 16,362,117
Fixed Network Total Traffic
Origination 11,814,444,214 11,090,602,238 6.5 10,860,097,237
(Outgoing)
By Traffic terminating (incoming traffic) Own Network –Own 10,493,091,107 9,920,173,686 5.8 9,522,341,685
Network
11

Other Mobile Networks to Own 1,290,211,269 1,098,769,647 17.4 1,258,551,962
Network Fixed Network to 9,791,760 11,008,590 -11.1 10,313,024
Mobile Network
Total traffic
termination 11,793,094,136 11,029,951,923 6.9 10,791,206,671
(Incoming)
Source: CA, Operators’ Returns.
1.4.2 Local Mobile Voice Traffic per Operator
Safaricom PLC recorded a total of 8.55 billion minutes of local mobile voice traffic during the
quarter under review up from 8.51 billion minutes registered in the previous quarter. On -net
and off-net mobile voice minutes stood at 8.2 billion and 350.9 million minutes respectively. Despite the increase in voice traffic, its voice market share declined by 4.4 percentage points
during the period under review to stand at 72.5 per cent.
Airtel Networks Limited recorded mobile voice traffic of 2.5 billion minutes up from 1.9 billion minutes recorded in the previous quarter. Consequently, its voice market share went up by 4.6 percentage points to stand at 22.0 per cent.
Telkom Kenya Limited on the other hand recorded a total of 608.6 million minutes in local
mobile voice traffic up from 589.8 million minutes reported during the previous period. However, its voice market share declined marginally by 0.1 percentage points to stand at 5.2 per
cent.
Finserve Africa Limited recorded local mobile voice traffic of 37.5 million minutes during the quarter marking a decline of 7.2 per cent when compared to 40.4 million minutes registered in
the preceding quarter. Its voice market share stood at 0.3 percent.
Sema Mobile Services reported growth in local mobile voice traffic during the period under
review to record 39,711 minutes from 39,255 minutes recorded during the previous period. On
the other hand, Mobile Pay Limited registered a decline of 8.7 per cent in voice traffic to post 27,448 minutes whereas the market share remained unchanged at 0.0 percent. .
Local mobile voice traffic by operator and their respective market shares is illustrated in Table 5
12

Table 5: Local Mobile Voice traffic by Operator
Period Name of Safaricom Airtel Telkom Kenya Finserve Sema Mobile
Operator/Indicator PLC Networks Limited Africa Mobile Pay
Kenya Limited Limited Services Limited
Oct - Dec 17 On-net 8,200,724,633 1,874,925,780 413,559,948 3,874,294 3,258 3,194
Off-net 350,913,622 718,367,640 195,092,257 33,665,187 36,453 24,254
Total 8,551,638,255 2,593,293,420 608,652,205 37,539,481 39,711 27,448
Market share (%) 72.5 22.0 5.2 0.3 0.0 0.0
Jul - Sep 17 On-net 8,199,176,321 1,311,373,880 405,843,313 3,777,017 3,407 3,155
Off-net 310,876,214 615,752,439 184,032,672 36,639,218 35,848 26,918
Total 8,510,052,535 1,927,126,319 589,875,985 40,416,235 39,255 30,073
Market share (%) 76.9 17.4 5.3 0.4 0.0 0.0
Oct - Dec 16 On-net 8,343,311,000 765,210,000 409,803,391 4,013,903 3,391 -
Off-net 398,022,273 699,698,004 181,107,643 42,526,701 38,814 -
Total 8,741,333,273 1,464,908,004 590,911,034 46,540,604 42,205 -
Market Share (%) 80.6 13.5 5.4 0.4 0.0 -
Source: CA, Operators’ Returns.
The proportion of on-net to off-net mobile voice traffic per operator is illustrated in figure 4
Figure 4: Proportion of On-Net to Off-Net Voice Traffic per Operator (%)
Source: CA, Operators’ Returns.
13

As illustrated in figure 5, on net traffic accounted for 89.0 per cent of the mobile voice traffic during the period under review.
Figure 5: Proportion of Total On-Net to Total Off-Net Mobile Voice Traffic
Source: CA, Operators’ Returns.
1.4.3 Minutes of Use per Month per User
The Minutes of Use per Month per User was registered at 92.0 minutes during the period up from 90.1 minutes recorded in the previous quarter
14

Figure 6: Minutes of Use per Month per User
Source: CA, Operators’ Returns.
1.4.4 Domestic Short Messaging Service (SMS)
The total number of messages sent from Safaricom PLC network stood at 17.1 billion down from 18.7 billion messages recorded in the previous quarter. Equally, its SMS market share dropped to post 96.3 per cent from 97.0 per cent registered in the preceding quarter.
The volume of SMS traffic originating from Airtel Networks Limited rose by 12.7 per cent during the period under review to post 557.9 million messages from 495.2 million messages recorded in the previous quarter, thus recording a market share of 3.1 per cent.
Telkom Kenya Limited on the other hand recorded a total of 99.3 million messages sent from its network up from 66.7 million messages registered in the previous quarter. Its SMS market share stood at 0.6 per cent up from 0.3 per cent posted in the preceding quarter.
Finserve Africa Limited registered a growth of 2.4 percent to record 8.5 billion messages during the period under review from 8.3 billion recorded in the preceding quarter.
During the period under review, Sema Mobile Services and Mobile Pay Limited registered 7,633 and 23,093 outgoing messages respectively. Each of their market shares stood at 0.0 per cent.
SMS traffic and the corresponding market share per operator is as shown in Table 6
15

Table 6: Short Messaging Service per Operator
Period Name of Safaricom Airtel Telkom Finserve Sema Mobile
Operator/Indicator PLC Networks Kenya Africa Mobile Pay
Kenya Limited Limited Limited Services Limited
Oct-Dec 17 On-net 16,924,173,424 184,995,402 22,896,061 1,581,536 510 2,442
Off-net 241,318,520 373,003,788 76,499,650 6,990,772 7,123 20,651
Total 17,165,491,944 557,999,190 99,395,711 8,572,308 7,633 23,093
Market share (%) 96.3 3.1 0.6 0.0 0.0 0.0
Jul-Sep 17 On-net 18,553,469,372 183,995,402 15,434,827 1,379,787 952 2,412
Off-net 169,983,328 311,263,007 51,279,958 6,992,663 9,485 5,656 Total 18,723,452,700 495,258,409 66,714,785 8,372,450 10,437 8,068
Market share (%) 97.0 2.6 0.3 0.0 0.0 0.0 Oct-Dec 16 On-net 14,891,334,324 346,466,628 25,253,090 1,108,527 1,319 -
Off-net 188,113,470 346,925,711 49,824,968 8,488,753 14,426 - Total 15,079,447,794 693,392,339 75,078,058 9,597,280 15,745 -
Market Share (%) 95.1 4.4 0.5 0.1 0.0 -
Source: CA, Operators’ Returns.
1.5 Roaming Traffic
The volume of Roaming-out4 voice traffic stood at 40.6 million minutes with roaming traffic
within EAC region posting 34.4 million minutes. The out roamers sent 12.7 million messages and consumed 6.0 million MB of data.
The volume of Roaming-in5 voice traffic was recorded at 35.0 million minutes with in-roamers
from EAC region contributing 31.2 million minutes. Also the in-roamers send 6.1 million messages and used 16.0 million MB of mobile data.
Table 7: Roaming Traffic
Oct- Dec 2017
Name of Roaming-Out (Own Subscribers) Roaming-In (Foreign Subscribers) Country Voice SMS Data Voice SMS Data
Uganda 27,545,796 4,426,511 1,340,172 18,689,523 451,201 490,106
Tanzania 1,870,730 2,104,293 1,240,889 408,845 1,247,343 310,742 Rwanda 2,264,832 406,291 294,214 6,238,350 105,304 138,917
Burundi 24,629 26,285 4,939 8,727 11,147 1,161 S. Sudan 2,732,734 520,905 14,298 5,873,369 69,221 3566
Others 6,221,939 5,257,965 3,108,148 3,792,175 4,255,522 15,074,624
Total 40,660,660 12,742,250 6,002,660 35,010,989 6,139,738 16,019,116
Source: CA, Operators’ Returns.
4 Roaming-out is traffic originated and terminated by subscribers of national networks as users of foreign networks.
5 Roaming -in is traffic originated and terminated by foreign subscribers as users of local network.
16
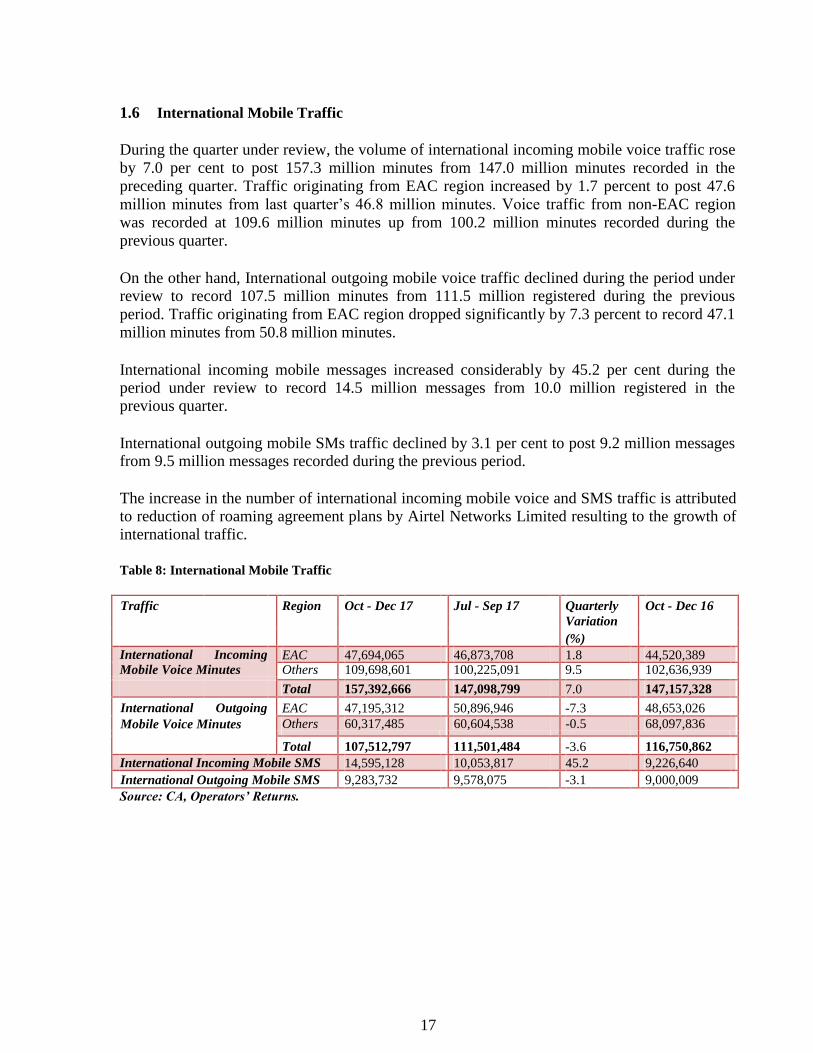
1.6 International Mobile Traffic
During the quarter under review, the volume of international incoming mobile voice traffic rose
by 7.0 per cent to post 157.3 million minutes from 147.0 million minutes recorded in the
preceding quarter. Traffic originating from EAC region increased by 1.7 percent to post 47.6
million minutes from last quarter’s 46.8 million minutes. Voice traffic from non-EAC region
was recorded at 109.6 million minutes up from 100.2 million minutes recorded during the
previous quarter.
On the other hand, International outgoing mobile voice traffic declined during the period under review to record 107.5 million minutes from 111.5 million registered during the previous
period. Traffic originating from EAC region dropped significantly by 7.3 percent to record 47.1
million minutes from 50.8 million minutes.
International incoming mobile messages increased considerably by 45.2 per cent during the period under review to record 14.5 million messages from 10.0 million registered in the previous quarter.
International outgoing mobile SMs traffic declined by 3.1 per cent to post 9.2 million messages from 9.5 million messages recorded during the previous period.
The increase in the number of international incoming mobile voice and SMS traffic is attributed to reduction of roaming agreement plans by Airtel Networks Limited resulting to the growth of international traffic.
Table 8: International Mobile Traffic
Traffic Region Oct - Dec 17 Jul - Sep 17 Quarterly Oct - Dec 16
Variation
(%) International Incoming EAC 47,694,065 46,873,708 1.8 44,520,389
Mobile Voice Minutes Others 109,698,601 100,225,091 9.5 102,636,939
Total 157,392,666 147,098,799 7.0 147,157,328
International Outgoing EAC 47,195,312 50,896,946 -7.3 48,653,026 Mobile Voice Minutes Others 60,317,485 60,604,538 -0.5 68,097,836
Total 107,512,797 111,501,484 -3.6 116,750,862 International Incoming Mobile SMS 14,595,128 10,053,817 45.2 9,226,640
International Outgoing Mobile SMS 9,283,732 9,578,075 -3.1 9,000,009
Source: CA, Operators’ Returns.
17

2 FIXED TELEPHONE SERVICE
2.1 Fixed Network Subscriptions
During the quarter under review the number of fixed terrestrial connections stood at 69,564 down from 70,803 connections registered in the previous quarter. Fixed wireless subscriptions dropped to 297 from 315 lines reported in the preceding quarter. The fixed network has exhibited a downward trend over time as illustrated in figure 7. This is attributed to the slow expansion of the network and adoption of its services due to the stiff competition from mobile networks that are easily accessible and less prone to vandalism.
Figure 7: Fixed Network Subscriptions
Source: CA, Operators’ Returns.
2.2 Fixed Network Traffic During the period under review, the total local fixed network voice traffic dropped by 2.9 per
cent to post 585,744 minutes from 603,200 minutes recorded in the previous quarter. Fixed-to-fixed local traffic recorded 257,874 minutes down from 303,504 minutes recorded in the
previous quarter while fixed wireless to fixed wireless traffic increased to 327,870 minutes from 299,696 minutes.
Table 9 illustrates the trend in fixed network traffic.
Table 9: Local Fixed Network Traffic in Minutes
Local Fixed Network traffic Oct - Sep 17 Jul-Sep 17 Quarterly Oct - Dec 16
Variation
(%)
Fixed-fixed 257,874 303,504 -15.0 339,715
18

Fixed wireless-fixed wireless 327,870 299,696 9.4 335,408
Total Local Fixed network 585,744 603,200 -2.9 675,123
traffic Source: CA, Operators’ Returns.
2.3 International Fixed Voice Traffic International incoming fixed voice traffic dropped by 3.1 per cent during the period under review to register 2.10 million minutes from 2.17 million minutes recorded in the previous quarter.
Similarly, fixed voice traffic terminating on other countries was recorded at 1.3 million minutes down from 1.4 million minutes registered during the previous quarter.
International outgoing fixed network VoIP declined by 3.9 per cent to register 643,109 minutes from 668,886 minutes registered in the previous quarter.
The trend in International fixed network traffic is outlined in Table 10.
Table 10: International Fixed Voice Traffic
International Fixed Network Oct - Dec 17 Jul-Sep 17 Quarterly Oct - Dec 16
traffic Variation (%)
International Incoming
Fixed Network Voice traffic 2,104,847 2,172,315 -3.1 2,573,212
International Outgoing Fixed
Network Voice traffic 1,301,545 1,452,130 -10.4 2,090,833
International Outgoing Fixed
Network VoIP traffic 643,109 668,886 -3.9 1,000,509
Source: CA, Operators’ Returns.
3 DATA/INTERNET SERVICES
3.1 Data/Internet Subscriptions The uptake of data services has continued to grow significantly as witnessed during the quarter
under review, which is largely constituted by mobile data subscriptions. Total data/Internet
subscriptions stood at 33.3 million up from 30.8 million subscriptions reported in the previous quarter marking an 8.0 per cent growth.
Mobile data/Internet has witnessed strong growth over the past quarters as observed during the
period under review. The number of mobile data/Internet subscriptions rose to register 33.0 million from 30.6 million posted during the preceding quarter marking growth of 8.0 per cent.
19

The tremendous growth is attributed to the increased roll out of 3G and 4G mobile networks across the country.
During the quarter under review, the number of terrestrial wireless data subscriptions grew by 29.2 per cent to record 82,362 subscriptions from 63,749 recorded in the preceding quarter.
Satellite subscriptions registered 8.0 per cent growth to stand at 769 from 712 subscriptions recorded in the previous quarter. On the other hand, Fixed DSL subscriptions dropped to 1,953
from 2,106 subscriptions recorded during the preceding quarter.
Fibre Optic data subscriptions increased to 99,643 during the quarter under review from 90,548
subscriptions reported in the previous quarter marking a growth of 10.0 per cent during the period.
During the quarter under review, the number of fixed cable modem subscriptions declined by
2.7 per cent to 96,876 from 99,564 subscriptions reported in the previous quarter. Other fixed
data subscriptions rose by 9.4 per cent to reach 6,700 from 6,127 subscriptions recorded during the previous quarter.
The number of data/Internet subscriptions and users is as indicated in Table 11.
Table 11: Data/Internet Subscriptions
Internet/Data Subscriptions Oct-Dec 17 Jul-Sep 17 Quarterly Oct-Dec 16
Variation (%)
Mobile Data Subscriptions 33,076,894 30,628,340 8.0 26,521,037 Terrestrial Wireless Data 82,362 63,749 29.2 29,724
Subscriptions
Satellite Data Subscriptions 769 712 8.0 584
Fixed DSL Data Subscriptions 1,953 2,106 -7.3 2,483
FixedFibreOptic Data 99,643 90,548 10.0 39,255
Subscriptions
Fixed Cable Modem 96,876 99,564 -2.7 86,139
Subscriptions Other Fixed Data Subscriptions 6,700 6,127 9.4 -
Total Internet Subscriptions 33,365,197 30,891,132 8.0 26,679,222
Source: CA, Operators’ Returns.
As illustrated in Figure 8, the number of data/internet subscriptions stood at 33.3 million at the end of the quarter under review
20

Figure 8: Total Data/Internet subscriptions
Source: CA, Operators’ Returns. The information on Internet Penetration was not included in this report
because the Authority is in the process of reviewing the methodology for estimating Internet Penetration in line
with current market developments and international standards.
Safaricom PLC mobile data/Internet subscriptions recorded a market share of 72.8 per cent
down from 76.0 per cent recorded in the previous quarter. On the other hand, the market share for Airtel Networks Limited rose by 2.8 percentage points to reach 18.5 per cent.
Telkom Kenya Limited posted a market share of 7.8 per cent up from 7.3 per cent reported in the preceding quarter.
The market share for Finserve Africa Limited stood at 0.6 per cent down from 0.7 per cent posted in the preceding quarter.
Mobile Pay Limited and Sema Mobile Services market share for mobile data remained unchanged at 0.3 per cent and 0.0 per cent respectively.
The market shares for mobile data/Internet market per operator are shown in Figure 9.
21

Figure 9: Mobile data/Internet Subscriptions
Source: CA, Operators’ Returns.
During the period under review there were substantial changes in fixed/wireless data
subscriptions and the respective market shares per service provider. Wananchi Group Limited recorded the largest market share at 36.7 per cent, which was a drop compared to 41.0 per cent
registered in the previous quarter.
Safaricom PLC gained 1.5 per centage points to register a market share of 16.7 per cent.
Similarly, Mawingu Networks Limited recorded an increase of 4.7 per centage points to stand at 16.1 per cent during the period under review. Jamii Telecommunications Limited was fourth
with a market share of 12.5 percent.
Other operators offering fixed/wireless data/Internet recorded a market share of 0.5 per cent representing 1,500 subscriptions, which was a decline of 0.1 per centage points.
The number of fixed/wireless data subscriptions and respective market shares per service provider is as show in table 12.
22

Table 12: Fixed/Wireless Internet Subscriptions by service provider
Name of Service Provider Oct - Dec 17 Market share (%)
Wanachi Group (Kenya) Limited 105,713 36.7
Safaricom PLC 48,267 16.7 Mawingu Networks Limited 46,527 16.1
Jamii Telecommunications Limited 36,179 12.5 Argon Telecom Services Limited 22,466 7.8
Access Kenya Group 13,623 4.7
Liquid Telecommunications Kenya Limited 8,754 3.0
Telkom Kenya Limited 3,772 1.3
Iway Africa Kenya Limited 906 0.3
Mobile Telephone Networks Business Kenya Limited 596 0.2
Other fixed/Terrestrial wireless service providers 1,500 0.5
Total 288,303 100.0
Source: CA, Operators’ Returns.
3.2 Broadband Services
3.2.1 Broadband Subscriptions During the quarter under review, the total number of broadband subscriptions stood at 18.0 million up from 17.6 million subscriptions registered in the previous quarter. This translated to broadband penetration level of 39.7 per cent during the period under review.
The trend in broadband subscriptions and penetration levels is illustrated in Figure 10.
Figure 10: Broadband Subscriptions
Source: CA, Operators’ Returns.
23

3.2.2 Fixed Broadband Subscriptions by Speed
As illustrated in figure 11, speeds less than or equal to 256Kbps recorded the least number of subscriptions whereas speeds greater than 2Mbps registered the highest number of subscriptions.
Figure 11: Fixed Broadband Subscriptions by Speed
Subs
crip
tions
180,000
160,000
140,000
120,000
Bro
adba
n
d
100,000
80,000
60,000
of 40,000
No
.
20,000
-
Dec-16 Mar-17
Jun-17 Sep-17 Dec-17
<256Kbps
>256Kbps ≤ 512Kbps
>512Kbps ≤ 1Mbps
>1Mbps ≤ 2Mbps
>2Mbps
Source: CA, Operators’ Returns.
3.3 International Bandwidth The total international Internet bandwidth available in the country (Lit/equip capacity) increased
to 3,182.592 Gbps during the quarter under review, up from 2,909.512 Gbps recorded in the previous quarter, representing a growth of 9.4 per cent. The increase to 148.6 Gbps from 83.0 is
attributed to the expansion of capacity by Lion 2, a submarine cable lading company, in order to meet the increasing demand for bandwidth in the country.
During the period under review, Satellite Internet Bandwidth increased by 79.7 per cent to stand at 5.592 Gbps from 3.112Gbps recorded during the previous quarter.
The trend in international available bandwidth is as shown in table 13.
24

Table 13: International Internet Available Bandwidth (Gbps)
International Connectivity Oct-Dec 17 Jul-Sep 17 Quarterly Oct-Dec 16 Jul-Sep 16 Quarterly
Bandwidth Variation (%) Variation (%)
SEACOM 2,020.0 2,020.0 0.0 1,250.0 1,250.0 0.0
TEAMS 702.0 702.0 0.0 700.0 700.0 0.0 EASSY 106.4 101.4 4.9 39.1 39.1 0.0
Lion 2 148.6 83.0 79.0 39.2 39.2 0.0
Satellite Internet 5.592 3.112 79.7 0.473 0.473 0.0
Bandwidth
Total International 3,182.592 2,909.512 9.4 2,028.745 2,028.745 0.0
Internet Bandwidth
(Gbps)
Source: CA, Operators’ Returns.
The total international used Internet bandwidth rose to 916.287 Gbps during the quarter under
review from 887.187 Gbps recorded in the preceding quarter marking a growth of 3.3 per cent. This translates to 28.8 per cent of the total International available bandwidth being used in the
country.
During the quarter under review, the used undersea cable bandwidth stood at 911.80Gbps up from 884.50Gbps recorded in the preceding quarter. Similarly, used satellite bandwidth increased by 67.0 per cent to stand at 4.487Gbps.
The trend in international used bandwidth is illustrated in Table 14.
Table 14: International Internet Used Bandwidth (Gbps)
International Leased (Used) Bandwidth Oct-Dec 17 Jul-Sep 17 Quarterly Oct-Dec 16
Variation (%)
International Undersea Internet 911.80 884.50 3.1 860.30
Connectivity Bandwidth (Gbps)
International Satellite Internet 4.487 2.687 67.0 0.270
Connectivity Bandwidth
Total International Internet 916.287 887.187 3.3 860.570
Connectivity Bandwidth (Gbps)
Source: CA, Operators’ Returns.
3.4 Registered Domain Names
As at 31st
December 2017 the total number of domains stood at 73,972 with “.co.ke” recording 68,430 domains which translated to 92.51 per cent of the total domains as shown in Table 15
25

Table 15: Number of Domain Names
Sub- Use Oct-Dec 17 Jul-Sep 17
Domain
No. of Percentage No. of Percentage
Domains (%) Domains (%)
CO.KE Companies 68,430 92.51 64,575 92.82
GO.KE Government Entities 414 0.55 400 0.57
OR.KE Non Profit Making Organizations 1,981 2.68 1,994 2.87
AC.KE Institutions of Higher Education 768 1.04 738 1.06
SC.KE LowerandMiddleLevel 1,027 1.39 991 1.43
Institutions
NE.KE Personal Websites and E-mail 466 0.63 324 0.47
ME.KE Personal Websites and E-mail 386 0.52 327 0.47
MOBI.KE Mobile Content 126 0.17 52 0.07
INFO.KE Information 374 0.51 166 0.24
Total 73,972 100 69,567 100
Source: Kenya Network Information Centre (KeNIC)
4 National Cyber Threat Landscape
4.1 Cyber Threats Detected
During the quarter under review, a total of 4,589 cyber threats were detected by the National KE-CIRT/CC.
4.2 Validated and Responded to Cyber Threats
The National KE-CIRT/CC analyzed and validated the 4,589 cyber threats. It also identified 539
cyber threats that were critical and required immediate response. The most experienced cyber
threats were various forms of system misconfigurations that made computers/networks to be
vulnerable and susceptible to cyber-attacks. These type of threats were recorded at 187.
Malware attacks were also very prominent at140 cases, indicating the growth of malicious
activities by this method. This was followed closely by online impersonations that stood at 104.
This may have been occasioned by the heightened political and electioneering environment
during the period.
The various categories of the cyber threats handled during this period is indicated in table 16:
26

Table 16: Cyber threats validated and responded
Cyber Attack Vector Oct - 17 Nov - 17 Dec - 17 Total
DDOS 1 0 2 3
Domain Impersonation 0 2 2 4 Fake News 3 3 0 6
Malware 10 9 121 140 Online Fraud 8 9 7 24
Online Hate Speech 30 26 6 62 Online Impersonation 26 45 33 104
Phishing 3 2 1 6 Spam 0 1 0 1
System Misconfiguration 14 28 145 187 Website defacement 1 1 0 2
Total 96 126 317 539
Source: National KE-CIRT/CC
5 BROADCASTING
5.1 Digital Terrestrial Television
At the end of the quarter under review, the number of free-to-air TV channels on the digital
terrestrial platform stood at 64 up from 62 channels reported in the previous quarter. On the
other hand, the number of pay TV service providers on the Digital Terrestrial Television (DTT) platform remained unchanged (GoTV and StarTimes).
5.2 Digital Terrestrial Television sites rollout
The digital TV broadcasting signal population coverage increased to 85.8 per cent as at the end
of the period under review up from 83.6 per cent reported as at 30th
September 2017. This is
attributed to signal rollout by ADNL in Kilifi, Taita Taveta, Tana River, Kitui, Makueni, Samburu, Trans Nzoia, Busia, Baringo, Bomet and upgrade of transmitters by SIGNET to high power in Wajir and Maralal sites.
5.3 Set top Boxes
As at 31st
December 2017, the number of Free-to-Air set top boxes (FTA STBs) and Pay TV decoders purchased stood at 969,896 and 4,523,210 respectively.
27

5.4 FM Radio Stations
The number of FM radio stations in the country remained at 178 stations as at the end of the period under review.
6 POSTAL AND COURIER
SERVICES 6.1 Postal and Courier Traffic
The number of letters posted locally stood at 16.03 million during the period under review up
from 16.02 million letters recorded in the previous quarter. Total courier items sent locally were recorded at 1.8 million up from 1.7 million items posted during the previous period marking an
increase of 8.4 per cent.
International incoming letters declined by 1.3 per cent during the quarter under review to post 1.06 million from 1.07 million letters posted in the previous quarter. On the contrary, international outgoing letters grew by 0.6 per cent to post 1.09 million letters.
The postal and courier traffic is shown in Table 17
Table 17: Postal and Courier Traffic
Post and Courier Traffic Oct-Dec 17 Jul-Sep 17 Quarterly Oct- Dec 16
Variation (%)
Number of Letters (Up to 350 16,030,166 16,027,218 0.0 15,894,540
gms) Posted Locally
Total Courier Items Sent 1,855,492 1,712,189 8.4 1,679,188
Locally
International Incoming Letters 1,064,615 1,078,968 -1.3 2,299,588
(Up to 350 gms)
International Outgoing Letters 1,090,331 1,083,343 0.6 1,907,271
(Up to 350 gms)
Source: CA, Operators’ Returns.
6.2 Number of Postal and Courier Outlets As shown in figure 12, the number of postal and private courier outlets remained unchanged at 623 and 997 respectively.
28

Figure 12: Number of Postal Courier Outlets
Source: CA, Operators’ Returns.
7 TARIFFS, PROMOTIONS AND SPECIAL OFFERS During the quarter under review, the Authority received a total of 34 applications for tariffs and
promotions & special offers, all of which were reviewed and approved. The total number of applications received during the period increased by 70 per cent in comparison to those received
in the previous quarter.
Tables 18 and 19 show the detailed distribution of the applications
Table 18: Tariffs
Service Oct – Dec 17 provider Voice SMS Data Airtime Bundle Mobile Others Total
Money
Safaricom - - - - 1 - 2 3
PLC Airtel - - 3 - - - - 3
Networks
Limited
Telkom - - 6 - 2 - - 8
Kenya
Total - - 9 - 3 - 2 14
Source: CA, Operators’ Returns.
29

Table 19: Promotions and Special Offers
Service Oct – Dec 17 provider Voice SMS Data Bundle Airtime Lucky Others
7 Total
Draw6
Safaricom - - 6 2 3 - 5 16
PLC
Airtel - - - - - 1 - 1
Networks
Limited
Telkom - - - - 1 - 2 3
Kenya
Total - - 6 2 4 1 7 20
Source: CA, Operators’ Returns.
8 CONCLUSION
The Second Quarter of the Financial Year 2017/18 was marked by significant growth and uptake of ICT services in the country. This growth is evidence that the current government
policies, regulations and initiatives on ICT are quite effective. Local mobile voice traffic increased significantly as a result of the several special offers and promotions carried out by the
various service providers during the festive season.
The completion of the Voice Infrastructure project being undertaken by the Authority under the
Universal Service Fund and aimed at closing voice gaps in 78 sub-locations is expected to grow
mobile penetration in the country. Further, mobile money services played a key role in
providing safe, secure and cheap financial services in areas where many Kenyans have no
access to formal banking systems. The mobile money platform is expected to maintain an
upward trend in the coming quarters due to the significant increase in the number of services
offered on the platform and subsequently the increasing demand and popularity of the services.
The data/Internet segment maintained an upward trend during the period under review as
Kenyans continued to embrace and take up e-commerce services. The increased uptake of social
media platforms, OTTs and other technological developments such as video on demand have
resulted to increased demand for and use of bandwidth in the country. The same trend is
expected in the coming quarters as the Authority is currently undertaking a key project on
Education Broadband that is aimed at providing broadband connectivity of 5 Mbps downlink
and 1Mbps to 896 Public Secondary Schools during the current financial year. The Authority is
also in the process of licensing new players for LTE/4G services through the assignment of
700MHz, 800 MHz and 450 MHz. These initiatives are expected to play a major role in
boosting internet penetration levels in the country in the near future.
6 “Lucky draw” is a game of chance where the operator has no control over the specific user to receive a
reward set out.
7“Other” refers to promotions that cannot be clearly attributed to any particular service or bundle of services, neither can they be attributed to a lucky draw
30

The postal and courier market segment which exhibited downward trends in the previous
quarters reported an increase in the number of letters and courier items sent during the period under review. This growth was as a result of the National Examinations which are conducted
around the same period as well as the Christmas and New Year festive seasons during which families, relatives and friends highly exchanged success cards and greetings cards respectively.
Published: April 2018
Author: Communications Authority of Kenya (CA)
31