secondary progressive multiple sclerosis
TRANSCRIPT
Secondary progressive MS
Professor Gavin Giovannoni
Blizard Institute, Barts and The London School of Medicine and Dentistry

Disclosures
Over the last 15 years Professor Giovannoni has received personal compensation for participating on Advisory Boards in relation to clinical trial design, trial steering committees and data and safety monitoring committees from: Abbvie, Bayer-Schering Healthcare, Biogen-Idec, Canbex, Eisai, Elan, Fiveprime, Genzyme, Genentech, GSK, GW Pharma, Ironwood, Merck, Merck-Serono, Novartis, Pfizer, Roche, Sanofi-Aventis, Synthon BV, Teva, UCB Pharma and Vertex Pharmaceuticals.
Professor Giovannoni would like to acknowledge and thank Biogen-Idec and Genzyme for making available data slides on natalizumab and alemtuzumab for this presentation. He would also like to thank numerous colleagues for providing him with data and/or slides for this, and other, presentations.
Professor Giovannoni’s visit to Lebanon has been kindly sponsored by Novartis, therefore please interpret anything he says about Novartis’s product in this context.
This presentation has been designed and prepared by Professor Giovannoni with no input from any other parties.

What is SPMS?

? SPMS
The age at onset and the speed of progression in SPMS does not depend on preceding relapses
Kremenchutzky et al. Brain 2006
SPMS
SPMS
“The diagnosis of SPMS is done retrospectively”

The age at onset and the speed of progression in SPMS does not depend on preceding relapses
Time to sustained EDSS 6 in the London, Ontario cohort
PP: Primary Progessive MS
SP: Secondary Progressive MS
SAP: Single Attack-Progressive MS
Kremenchutzky et al. Brain 2006
From the onset of MS
From the onset of the progressive phase

Brain atrophy occurs across all stages of the disease
De Stefano, et al. Neurology 2010
n= 963 MSers

Can we modify the course of SPMS?

Kappos et al, Neurology 2005
The effect of immunomodulation by interferon ß in SPMS depends on residual inflammation

Kappos et al, Neurology 2005
The effect of immunomodulation by interferon ß in SPMS depends on residual inflammation

Hartung et al. Lancet 2002:360:2018-25.

Hartung et al. Lancet 2002:360:2018-25.

12
Window of therapeutic efficacy
Coles et al. J Neurol. 2006 Jan;253(1):98-108..

13
Disability progression in two phases
In RRMS, gender, age at onset, residual deficit after the first relapse, and relapses during the first 2 years
are independent predictors of disability progression only in phase 1
DS
S S
co
re
Years from clinical onset of MS
6
5
4
3
2
1
0
0 5 10 15 20 25 30
7
Phase 2
Phase 1
Natural History
Leray E et al. Brain 2010;133:1-14.

14
TOP: Natalizumab Stabilises EDSS Scores in Patients with
Either a High or Low Starting EDSS Score at Baseline
0.0
0.5
1.0
1.5
2.0
2.5
3.0
3.5
4.0
4.5
5.0
0 6 12 18 24 30 36 42 48
Med
ian
ED
SS
Sco
re
Time (months)
Kappos L et al. Presented at ENS; June 9–12, 2012; Prague, Czech Republic. O261.
Baseline EDSS Score ≤3.0 (n=1591)
Baseline EDSS Score >3.0 (n=1840)


Therapeutic lag hypothesis
therapeutic lag

Gd
T2
CU
R
DP
Therapeutic lag: NEDA
Havrdova et al. Lancet Neurol. 2009 Mar;8(3):254-60.

Gd
T2
CU
R
DP
15% vs 47% Δ 32%
13% vs 68% Δ 55%
6% vs 37% Δ 31%
Therapeutic lag: effect of natalizumab on NEDA
Havrdova et al. Lancet Neurol. 2009 Mar;8(3):254-60.

Natalizumab Effect on EDSS Progression by Treatment Duration
TOP Trial: Multiple event analyses per treatment epoch
9.5%
5.7%
0%
5%
10%
15%
20%
25%
30%
Month 0-24 Month 25-48
n=496 n=496 P
rop
ort
ion
of
pat
ien
ts w
ith
12
-mo
nth
su
stai
ned
1 p
oin
t ED
SS p
rogr
essi
on
P=0.0167*
40% 10.9%
8.5%
0%
5%
10%
15%
20%
25%
30%
Month 0-24 Month 25-48
n=496 n=496
Pro
po
rtio
n o
f p
atie
nts
wit
h 6
-mo
nth
su
stai
ned
1 p
oin
t ED
SS p
rogr
essi
on
P=0.1630
6-month sustained progression 12-month sustained progression
Difference of rates of EDSS progression between the two treatment epochs was significant for the 12-month confirmed progression
Wiendl H. et al. ECTRIMS 2013, Copenhagen October 2-5 , Poster P1050.
Biogen Idec data on file.

The vast majority of patients who experienced disability progression in the first two years remained free of disability progression in the next 2 years
6/496 (1.2%) patients had a 12-month confirmed
progression in the two treatment epochs.
11/496 (2.2%) patients had a 6-month confirmed
progression in the two treatment epochs.
Wiendl H. et al. ECTRIMS 2013, Copenhagen October 2-5 , Poster P1050.
Biogen Idec data on file.
Natalizumab Effect on EDSS Progression by Treatment Duration
TOP Trial: Multiple event analyses per treatment epoch

-1.0%
-0.8%
-0.6%
-0.4%
-0.2%
0.0% Years 0-2
-0.82%
-0.80%
P=0.822†
Placebo (N=315) Natalizumab (N=627)
Year 0-1* Year 1-2
-0.40%
-0.56%
-0.43%
-0.24%
P=0.004†
P=0.002†
†Difference between treatments; ‡Change from baseline; Miller DH et al. Neurology 2007;68:1390-1401.
AFFIRM Study: natalizumab and brain atrophy
Mean
(S
E)
perc
en
tag
e c
han
ge i
n B
PF

Brain atrophy in natalizumab-treated patients: 3-year follow-up
Sastre-Garriga et al. MSJ 2014.
-0.6%
-1.4%
-0.1% -0.5%
-0.7%
-0.2%

28
CARE-MS I & II Three-Year MRI Outcomes Change in Brain Parenchymal Fraction (BPF)
Alemtuzumab slowed brain volume loss over 3 years, as assessed by change in BPF
For both patient populations, the median percentage reduction in BPF observed in in Year 3 (0.19% and 0.10%, respectively) was smaller than that observed in Year 1 (0.59% and 0.48%) and Year 2 (0.25% and 0.22%)
Percentage Change in BPF in Formerly Treatment-Naive Patients (CARE-MS I)
Percentage Change in BPF in Patients Who Relapsed on Prior Therapy (CARE-MS II)
Me
dia
n C
ha
ng
e F
rom
Ba
se
lin
e, %
(9
5%
CI)
Year No. of Patients 371 367 351 323
% Change from Previous Year – –0.59% –0.25% –0.19%
Me
dia
n C
ha
ng
e F
rom
Ba
se
lin
e, %
(9
5%
CI)
Year 428 414 405 359
– –0.48% –0.22% –0.10%
No. of Patients
% Change from Previous Year
0 1 2 3
-1 .5 0
-1 .2 5
-1 .0 0
-0 .7 5
-0 .5 0
-0 .2 5
0 .0 0
0 1 2 3
-1 .5 0
-1 .2 5
-1 .0 0
-0 .7 5
-0 .5 0
-0 .2 5
0 .0 0
AAN 2014
Blitz S65-008

Therapeutic lag
Yr -1 Yr -2 Yr +1 Yr +2 Yr +3 Yr +4 Yr +5 Yr +6 Yr +7
IFN-beta-1b
Placebo
No treatment
No treatment
9H
PT,
co
gnit
ion
, bra
in a
tro
ph
y
Progression from inflammation in years -2 and -1
Progression from inflammation in years +1 and +2
Progression from inflammation in years +3 to +5
Note the slopes are
bow parallel because IFN-beta was stopped after
year +2
Delayed effect on disability progression from IFN-beta treatment in years 1 & 2
Time

Glatiramer acetate in PPMS: results of a multinational, multicenter, double-blind, placebo-controlled trial
Wolinsky et al. Ann Neurol 2007;61:14–24.

Length-dependent neuropathy

CNS fibre length – bladder

CNS fibre length – motor

CNS fibre length – visual

vs.
Short axon
Long axon
Length-dependent axonopathy

vs.
= focal acute inflammatory lesions
vs.
Short axon
Long axon
Length-dependent axonopathy
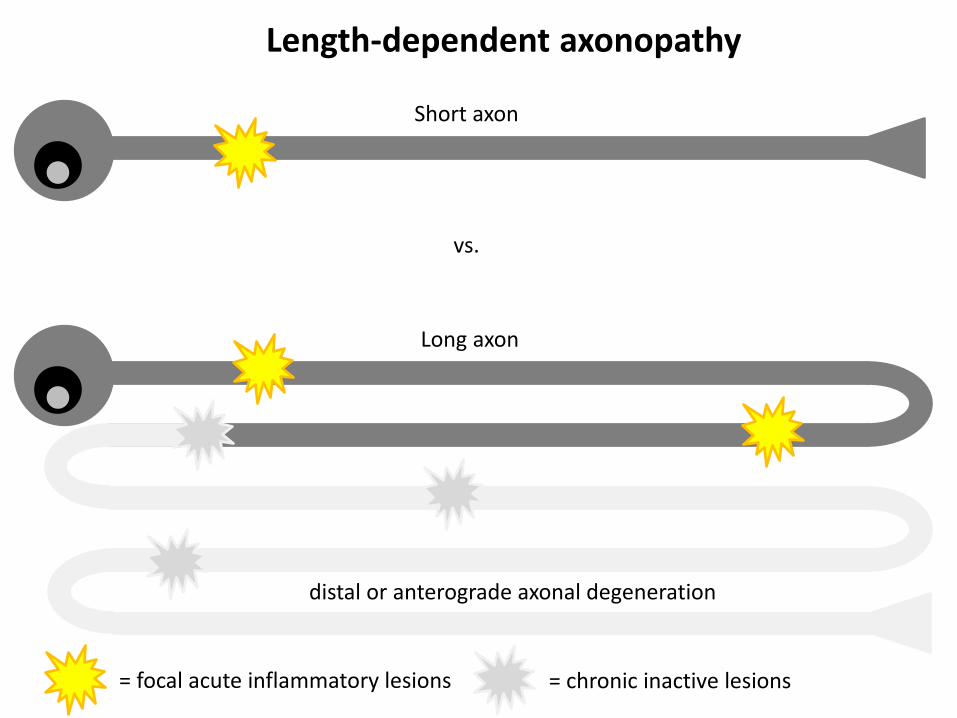
distal or anterograde axonal degeneration
= focal acute inflammatory lesions
vs.
Short axon
Long axon
= chronic inactive lesions
Length-dependent axonopathy

proximal or retrograde axonal degeneration
distal or anterograde axonal degeneration
= focal acute inflammatory lesions
vs.
Short axon
Long axon
= chronic inactive lesions
secondary neuronal loss
Length-dependent axonopathy

Reserve capacity & functional recovery
Acute attack: functional deficit

Reserve capacity & functional recovery
Recovery due to axonal plasticity: no functional deficit, but reduced reserve capacity

Reserve capacity & functional recovery
New focal inflammatory lesions

Reserve capacity & functional recovery
New focal inflammatory lesions; larger deficit in pathway with reduced functional reserve

Reserve capacity & functional recovery
Recovery due to axonal plasticity: fixed deficit in pathway with reduced reserve capacity

44
Therapeutic window 5
Asynchronous progressive MS hypothesis
Motor system to legs
Lower limb sensory
Bladder Therapeutic window 1
Therapeutic window 2
Therapeutic window 4
Upper limb sensory
Upper limb motor
Cognition
Vision
Etc.
Therapeutic window 6
Therapeutic window 7
Therapeutic window 8
Therapeutic window 9
Therapeutic window 10, etc….
Diagnosis of clinically-apparent progressive MS
Effective DMTs could still target the remaining windows of therapeutic opportunity for individual neurological systems despite some systems have entered the clinically-apparent progressive phase of the disease
Cerebellar or balance systems

45
First
Relapse
3 6 9 12 15 18 21 24 27 30
Months Since Relapse
0
10
20
30
40
50
60
70
80
90
100
Pati
en
ts w
ith
co
mp
lete
reco
very
(%
)
Placebo Natalizumab
Natalizumab and Clinical Recovery from Relapses
Lublin F. et al. ECTRIMS 2013, Copenhagen October 3rd , Poster P524.
Overall population : Subjects with an increase of EDSS ≥ 1.0 point at relapse
*Based on Cox Proportional Hazards model adjusted for baseline EDSS, age, gender, relapses in year prior to enrollment, disease
duration, baseline Gd-enhancing lesions and baseline T2 lesion volume.
AFFIRM: Probability of 12-week confirmed complete
recovery from relapses
76.0%
43.1%
Adjusted HR for natalizumab vs placebo=1.673
(95% CI:1.046–2.678); 67% increase; P=0.0319*
Placebo (N=86) Natalizumab (N=70)

46
84%91%
70%71% 74%68%
0%
20%
40%
60%
80%
100%
Overallpopulation
BaselineEDSS<3.0
Baseline EDSS≥3.0
n=140 n=93 n=80 n=143
Pro
po
rtio
n o
f p
ati
en
ts (
%)
Placebo
Natalizumab
**P=0.0088 **P=0.0019 P=0.8259
At least 0.5 point EDSS increase
n=47 n=63
At least 1.0 point EDSS increase
61%71%
43%49% 50% 48%
0%
20%
40%
60%
80%
100%
Overallpopulation
BaselineEDSS<3.0
Baseline EDSS≥3.0
n=140 n=93 n=80 n=143
Pro
po
rtio
n o
f p
ati
en
ts (
%)
*P=0.0349 **P=0.0048 P=0.5976
n=47 n=63
Lublin F. et al. ECTRIMS 2013, Copenhagen October 3rd , Poster P524.
Disabling Magnitude of Relapses in AFFIRM
EDSS change from pre-relapse to at relapse
46
Natalizumab and Clinical Recovery from Relapses

Goodkin et al. Ann Neurol. 1995 Jan;37(1):30-40.

Goodkin et al. Ann Neurol. 1995 Jan;37(1):30-40.

Expanded Disability Status Scale (EDSS)

Ceiling & Floor Effects

Effect of dronabinol on progression in progressive multiple sclerosis (CUPID): a randomised, placebo-controlled trial
Zajicek et al. Lancet Neurol 2013; 12: 857–65.

0 200 400 600 800 1000 1200
0.0
0.2
0.4
0.6
0.8
1.0
Time to EDSS progression (days)
P(E
DS
S p
rog
ressio
n)
Treatment group
Active
Placebo
Slides courtesy of John Zajicek.
Effect of dronabinol on progression in progressive multiple sclerosis (CUPID): a randomised, placebo-controlled trial

0 200 400 600 800 1000 1200
0.0
0.2
0.4
0.6
0.8
1.0
Time to EDSS progression (days)
P(E
DS
S p
rog
ressio
n)
Baseline EDSS score
4
4.5
5
5.5
6
6.5
Slides courtesy of John Zajicek.
Effect of dronabinol on progression in progressive multiple sclerosis (CUPID): a randomised, placebo-controlled trial

0 200 400 600 800 1000 1200
0.0
0.2
0.4
0.6
0.8
1.0
Time to EDSS progression (days)
P(E
DS
S p
rog
ressio
n)
Treatment group
Active
Placebo
Log rank test P = 0.01
Slides courtesy of John Zajicek.
Effect of dronabinol on progression in progressive multiple sclerosis (CUPID): a randomised, placebo-controlled trial

55
Trial activity targeting progressive pathology
MRI Events
1st clinical attack
Time (Years)
Subclinical disease
Inflammation
Brain volume loss
Neuroaxonal loss
Dis
eas
e S
eve
rity
SPMS RRMS
1st MRI lesion
Relapses
CIS RIS R-SPMS
RIS = radiologically isolated syndrome; CIS = clinically isolated syndrome, RRMS = relapsing-remitting MS; R-SPMS = relapsing secondary progressive MS; SPMS = secondary progressive MS; PPMS = primary progressive MS
SPMS: Natalizumab, Siponimod, DMF
Late SPMS: SMART STUDY fluoxetine, amiloride, riluzole
Early SPMS: oxcarbazepine
CIS: PHENYTOIN RRMS: ? DE-FLAMES STUDY
PPMS
PPMS: Fingolimod, Ocrelizumab, Laquinimod
SP&PPMS: Ibudilast

Effect of high-dose simvastatin on brain atrophy and disability in secondary progressive multiple sclerosis (MS-STAT): a randomised, placebo-controlled, phase 2 trial
Chataway Lancet 2014; 383: 2213–21.

57
Therapeutic hierarchy
Neuro-restoration
Remyelination
Neuroprotection
Anti-inflammatory
Therapeutic pyramid
Anti-ageing
Brain
Health
Initiative
• Smoking
• Exercise
• Diet
• Sleep
• Co-morbidities
• Infections
• Concomitant
medications

Conclusions We need to rethink our definition of SPMS
– ~ PPMS (chronic progressive MS)
– length-dependent central axonopathy
– therapeutic lag
– asynchronous progressive model
Major implications for clinical trial design – Can we measure reserve capacity in the individual functional systems?
– What is the optimal trial duration to address the therapeutic lag?
– Can we design better outcome measures to address therapeutic lag?
Asynchronous progressive MS – Should we only be targeting systems with reserve capacity in SPMS?
Holistic approach to SPMS – Smoking
– Exercise
– Diet
– Sleep
– Co-morbidities
– Infections
– Concomitant medications