secondary two mathematics: an integrated approach module 9 ... · module 9 probability by the...
TRANSCRIPT

©"2013"Mathematics"Vision"Project"|"MVP"In"partnership"with"the"Utah"State"Office"of"Education"""
Licensed(under(the(Creative(Commons(Attribution4NonCommercial4ShareAlike(3.0(Unported(license."
Secondary Two Mathematics: An Integrated Approach
Module 9 Probability
By
The Mathematics Vision Project:
Scott Hendrickson, Joleigh Honey, Barbara Kuehl, Travis Lemon, Janet Sutorius
www.mathematicsvisionproject.org
In partnership with the Utah State Office of Education
1

© 2013 Mathematics Vision Project | MVP In partnership with the Utah State Office of Education
Licensed under the Creative Commons Attribution-NonCommercial-ShareAlike 3.0 Unported license.
Module 9 – Probability Classroom Task: 9.1 TB or Not TB – A Develop Understanding Task Estimating conditional probabilities and interpreting the meaning of a set of data (S.CP.6, S.MD.7+) Ready, Set, Go Homework: Probability 9.1
Classroom Task: 9.2 Chocolate versus Vanilla – A Solidify Understanding Task Examining conditional probability using multiple representations (S.CP.6) Ready, Set, Go Homework: Probability 9.2 Classroom Task: 9.3 Fried Freddy’s – A Solidify Understanding Task Using sample to estimate probabilities (S.CP.2, S.CP.6) Ready, Set, Go Homework: Probability 9.3 Classroom Task: 9.4 Visualizing with Venn – A Solidify Understanding Task Creating Venn diagram’s using data while examining the addition rule for probability (S.CP.6, S.CP.7) Ready, Set, Go Homework: Probability 9.4 Classroom Task: 9.5 Freddy Revisited – A Solidify Understanding Task Examining independence of events using two-way tables (S.CP.2, S.CP.3, S.CP.4, S.CP.5) Ready, Set, Go Homework: Probability 9.5 Classroom Task: 9.6 Striving for Independence – A Practice Understanding Task Using data in various representations to determine independence (S.CP.2, S.CP.3, S.CP.4, S.CP.5) Ready, Set, Go Homework: Probability 9.6
2

© 2013 Mathematics Vision Project | MVP In partnership with the Utah State Office of Education
Licensed under the Creative Commons Attribution-NonCommercial-ShareAlike 3.0 Unported license.
9.1 TB or Not TB? A Develop Understanding Task
Tuberculosis (TB) can be tested in a variety of ways, including a skin test. If a person has
turberculosis antibodies, then they are considered to have TB. Below is a tree diagram
representing data based on 1,000 people who have been given a skin test for turberculosis.
1. Use your knowledge to write several probability statements about this test (based on the
numbers provided).
2. Look over the statements you wrote. Put an asterisk (*) next to those that are conditional
probability statements (statements based on margin “row” or “column” percentages). If
there are not any, add some now.
3. Part of understanding the world around us is being able to take information, make sense of
it, and then explain it to others. Based on your statements above, what would you say to a
friend regarding the validity of their results if they are testing for TB and only get a skin
test? Be sure to use data to best inform your friend.
¤20
13 w
ww
.flic
kr.c
om/p
hoto
s/su
ndaz
ed/ 3

© 2013 Mathematics Vision Project | MVP In partnership with the Utah State Office of Education
Licensed under the Creative Commons Attribution-NonCommercial-ShareAlike 3.0 Unported license.
Other questions to consider….
4. In this situation, explain the consequences of errors (having a test with incorrect results).
5. If a health test is not 100% certain, why might it be beneficial to have the results lean more
toward a false positive?
6. Is a sample space of 200 enough to indicate whether or not this is true for an entire
population?
7. How would you answer the young adult who tested positive and asks, “Do I really have TB?”
4

© 2013 Mathematics Vision Project | MVP In partnership with the Utah State Office of Education
Licensed under the Creative Commons Attribution-NonCommercial-ShareAlike 3.0 Unported license.
9.1 TB or Not TB? A Develop Understanding Task
Purpose: The purpose of this task is for students to analyze and make sense of data. Students will connect their prior understandings of tree diagrams (from earlier grades) and frequency tables (from Secondary Mathematics I) to analyze a tree diagram and explain the results to others. The focus of this task is to highlight the information revealed as a result of the conditional probability statements. Questions such as ‘How does the subgroup information tell us a more complete story?’ should be addressed in this task. Note to teacher: Throughout the module, students will be analyzing data but will have other areas of focus (such as representations, the addition rule, and notation). Therefore, it is important that the focus of this task is to get out the relative frequency statements and to have students make sense of the situation. Core Standards Focus:
S.CP.6: Find the conditional probability of A given B as the fraction of B’s outcomes that also belong to A, and interpret the answer in terms of the model.
S.MD.7 (+): Analyze decisions and strategies using probability concepts (e.g., product testing, medical testing, pulling a hockey goalie at the end of a game). Related Standards: S.CP.3, S.CP. 4, S.CP.5
Launch (Whole Class): Start this task by sharing how important it is to know how to read and make sense of data. In the health care field, there are lots of tests used to determine whether or not a patient has an infection or a disease. It is also important to note that not all tests are accurate 100% of the time, which is why there is sometimes more than one test to determine a diagnosis. Read the directions from the task and have students analyze the data by answering the questions. If students are not familiar with the symbol used for conditional probability that is given on the tree diagram, explain this to them (Tested positive|TB means “the number of patients who tested positive, given that they have TB”). Explore (Small Group): Give students time to make sense of the diagram independently and then have them work in pairs to create statements. If a group seems stumped, you can ask questions like:
x What information does this diagram tell you? x Is this TB test always 100% accurate? How do you know? x Do most people test positive or negative based on the skin test results? x What other information can you determine?
It is best to stay away from specific questions at this time as part of this task is for students to make sense and interpret the data themselves. The low threshold of this task is that most students should

© 2013 Mathematics Vision Project | MVP In partnership with the Utah State Office of Education
Licensed under the Creative Commons Attribution-NonCommercial-ShareAlike 3.0 Unported license.
be able to create statements such as “36.1% of the population tested have TB antibodies and tested positive”. As you monitor, if you notice students are not writing any conditional statements, probe groups that are finishing quickly to analyze the results of a specific branch (for example, ‘What do you know about patients who test positive, given that they have TB?’). Be sure to have students write out their statements in their journal and not just say them. This assists students in communicating conditional probabilities. If they need prompting, you may wish to give an example or two using phrases such as “out of” or “given that” or “If… then”.
As you prepare for the whole group discussion, choose a group to chart some of their statements related to the total number of people who took the skin test. Also select students to share their conditional statements who have articulated understanding.
Discuuss (Whole Class): For the whole group discussion, the goal is for students to be able to answer “How accurate is the tuberculosis (TB) test?” using data. There are several ways to do this, with the following as one possibility:
First, have group who charted statements related to the total share and explain what this meant to them. Highlights of this conversation include results of certain aspects of the sample (percent who have antibodies, percent who test positive, etc.) and that the test is accurate ‘most’ of the time. While this is good information, taking a deeper look can reveal more information. Next, sequence the students you selected earlier to share their conditional statements and ask them what their statement reveals. Be sure each statement is worded correctly, and make the appropriate adjustments for those who need it.
Discussion items that you may wish to make sure come out:
1. Meaning of error (false positive/false negative) and why this particular data leans more toward a false positive.
2. The law of large numbers. The sample size of this data is 1,000. What does this mean for an individual who has a skin test for TB?
3. How does exploring conditional probabilities allow for investigation of the accuracy of medical tests?
Aligned Ready, Set, Go: Probability RSG 9.1

Probability* 9.1*!
!
©"2013"MATHEMATICS"VISION"PROJECT"|"MVP"In"partnership"with"the"Utah"State"Office"of"Education"""
Licensed!under!the!Creative!Commons!Attribution4NonCommercial4ShareAlike!3.0!Unported!license"
!
!"
!
!!
Ready,'Set,'Go!''!
'
Ready'Topic:!Venn!Diagrams,!create!and!read.!!For'each'Venn'Diagram'provided'answer'the'questions.'
!1.!How!many!students!were!surveyed?!!2.!What!were!the!students!asked?!!3.!How!many!students!are!in!both!choir!and!band?!!4.!How!many!students!are!not!in!either!choir!or!band?!!5.!What!is!the!probability!that!a!randomly!selected!student!would!be!in!band?!
!!This!Venn!Diagram!represents!enrollment!in!some!of!the!elective!courses.!!6.!What!does!the!95!in!the!center!tell!you?!!!7.!What!does!the!145!tell!you?!!!8.!How!many!total!students!are!represented!in!the!diagram?!!9.!Which!elective!class!has!the!least!number!of!students!enrolled?!!!!
!!
* 2013!www.flickr.com/photos/sundazed/!Name:!
5
Probability* 9.1*!
!
©"2013"MATHEMATICS"VISION"PROJECT"|"MVP"In"partnership"with"the"Utah"State"Office"of"Education"""
Licensed!under!the!Creative!Commons!Attribution4NonCommercial4ShareAlike!3.0!Unported!license"
!
!"
!
!!
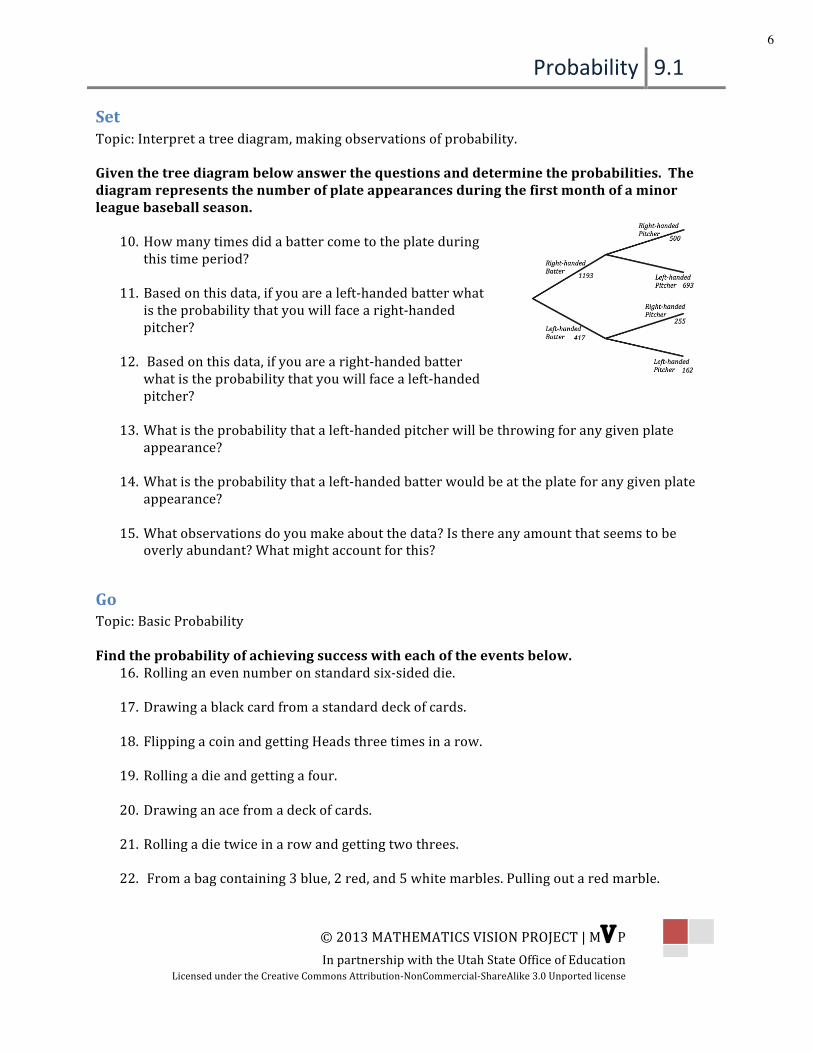
Set'Topic:!Interpret!a!tree!diagram,!making!observations!of!probability.!!!Given'the'tree'diagram'below'answer'the'questions'and'determine'the'probabilities.''The'diagram'represents'the'number'of'plate'appearances'during'the'first'month'of'a'minor'league'baseball'season.'!
10. How!many!times!did!a!batter!come!to!the!plate!during!this!time!period?!
!11. Based!on!this!data,!if!you!are!a!left4handed!batter!what!
is!the!probability!that!you!will!face!a!right4handed!pitcher?!
!12. !Based!on!this!data,!if!you!are!a!right4handed!batter!
what!is!the!probability!that!you!will!face!a!left4handed!pitcher?!
!13. What!is!the!probability!that!a!left4handed!pitcher!will!be!throwing!for!any!given!plate!
appearance?!!
14. What!is!the!probability!that!a!left4handed!batter!would!be!at!the!plate!for!any!given!plate!appearance?!
!15. What!observations!do!you!make!about!the!data?!Is!there!any!amount!that!seems!to!be!
overly!abundant?!What!might!account!for!this?!!
Go'Topic:!Basic!Probability!!Find'the'probability'of'achieving'success'with'each'of'the'events'below.'
16. Rolling!an!even!number!on!standard!six4sided!die.!!
17. Drawing!a!black!card!from!a!standard!deck!of!cards.!!
18. Flipping!a!coin!and!getting!Heads!three!times!in!a!row.!!
19. Rolling!a!die!and!getting!a!four.!!
20. Drawing!an!ace!from!a!deck!of!cards.!!
21. Rolling!a!die!twice!in!a!row!and!getting!two!threes.!!
22. !From!a!bag!containing!3!blue,!2!red,!and!5!white!marbles.!Pulling!out!a!red!marble.!
6

© 2013 Mathematics Vision Project | MVP In partnership with the Utah State Office of Education
Licensed under the Creative Commons Attribution-NonCommercial-ShareAlike 3.0 Unported license.
9.2 Chocolate versus Vanilla A Solidify Understanding Task Danielle loves chocolate ice cream much more than vanilla and was explaining to her best friend Raquel that so does most of the world. Raquel disagreed and thought vanilla is much better. To settle the argument, they created an online survey asking people to choose their favorite ice cream flavor between chocolate and vanilla. After completing the survey, the following results came back:
x There were 8,756 females and 6,010 males who responded. x Out of all the males, 59.7% chose vanilla over chocolate. x 4,732 females chose chocolate.
1. Upon first observations, which flavor do you think “won”? _____________________. Write
a sentence describing what you see at ‘first glance’ that makes you think this.
2. Raquel started to organize the data in the following two-way table. See if you can help complete this (using counts and not percentages):
3. Organize the same data in a Venn diagram and a tree diagram.
Chocolate Vanilla Total Female 8,756 Male 6,010 Total
¤20
13 w
ww
.flic
kr.c
om/p
hoto
s/ih
eart
spam
/
7

© 2013 Mathematics Vision Project | MVP In partnership with the Utah State Office of Education
Licensed under the Creative Commons Attribution-NonCommercial-ShareAlike 3.0 Unported license.
4. Using your organized data representations, write probabilities that help support your claim regarding the preferred flavor of ice cream. For each probability, write a complete statement as well as the corresponding probability notation.
5. Looking over the three representations (tree diagram, two-way table, and Venn diagram), what probabilities seem to be easier to see in each? What probabilities are hidden or hard to see?
Highlighted (easier to see) Hidden Tree diagram
Tree diagram
Two-way table
Two-way table
Venn diagram
Venn diagram
6. Getting back to ice cream. Do you think this is enough information to proclaim the statement that one ice cream is favored over another? Explain.
8

© 2013 Mathematics Vision Project | MVP In partnership with the Utah State Office of Education
Licensed under the Creative Commons Attribution-NonCommercial-ShareAlike 3.0 Unported license.
Chocolate versus Vanilla – Teacher Notes
A Solidify Understanding Task
Purpose:
The purpose of this task is for students to interpret information provided that allows them to make
sense of and organize data in a tree diagram, a two-way table, and a Venn diagram. Students will
solidify their understanding of conditional probability by writing statements supported by data
collected to justify the flavor of ice cream preferred by most. In this task, students will:
Ɣ Organize data into a tree diagram, two-way table, and a Venn diagram
Ɣ Calculate probabilities and conditional probabilities of A given B as the fraction of B’s
outcomes that also belong to A, and interpret the answer in terms of the model
Ɣ Highlight the different representations and become more familiar with what each
representation highlights and conceals.
Ɣ Continue to become more familiar with probability notation.
Ɣ Make decisions about meaning of data.
Core Standards Focus:
S.CP.4: Construct and interpret two-way frequency tables of data when two categories are
associated with each object being classified. Use the two-way table as a sample space to decide if
events are independent and to approximate conditional probabilities.
S.CP.6: Find the conditional probability of A given B as the fraction of B’s outcomes that also belong
to A, and interpret the answer in terms of the model.
Related Standards: S.CP.3, S.CP.5 , S.MD.6
Launch (Whole Class):
Begin by reading the context of the problem and the data provided by the survey. Have students individually make a decision to question 1. This is their ‘estimation’ using their first impression reasoning. Give students wait time to write their first impression. To launch the rest of the task, explain to students that they will be organizing the data into the three representations (tree diagram, Venn diagram, and two way table). They will use this information to further make claims regarding the ‘favorite ice cream flavor’.
Explore (Small Group):
As you monitor, listen for students to make sense of the data provided so that they can complete the
tree diagram. Allow for time so that students can determine what information is still needed and
how to go about finding this. If after a couple of minutes you notice a group that seems to be stuck
as to how to begin, ask probing questions such as “What part of the tree diagram needs to still be
completed?” followed by “How could you find the solution to that part of the diagram (such as the
number of females who prefer vanilla ice cream) or (the number of males who prefer vanilla ice

© 2013 Mathematics Vision Project | MVP In partnership with the Utah State Office of Education
Licensed under the Creative Commons Attribution-NonCommercial-ShareAlike 3.0 Unported license.
cream)?” Also look for the common error a group could make by calculating 59.7% of the total to determine the number of males who like Vanilla ice cream. To clarify, have the group explain the diagram and their calculation. Likely, they will notice their mistake and recalculate to find 59.7% of the males instead of the total. If not, ask them to explain the meaning of the bullet point in the given data that reads “Out of all the males, 59.7% chose vanilla over chocolate.” As students move from completing one representation to the others (tree, Venn, table), listen for explanations they have for determining values in each representation and any connections they make between representations (as you monitor, select students to share based on these explanations). Below is the completed two way table to assist in making sure student calculations are accurate as well as a couple of probability statements students may choose to use.
For those who chose vanilla: P(vanilla) = 7614/14766 P(vanilla|male) = 3590/6010
Begin the whole group discussion after most students have completed part I.
Discuss (Whole Class):
Sequence students to share their strategies for organizing data. Include connections they notice between representations. Use misconceptions students may have had during small groups to highlight how to determine values. For each situation, encourage students to use appropriate academic language.
Explore Part II (Small Groups):
Have students complete questions 5 and 6. Students should be able to articulate how each representation organizes the data to highlight certain information. The goal of this portion of the task is for students to become more comfortable with each representation so they can choose which representation to use in the future when organizing data. If students seem stuck, ask them to write a probability that is ‘easier’ to see in the tree diagram than in the other two representations. Likewise, write a probability that is ‘easier’ to see in the two way table or that is ‘easier’ to see in the Venn Diagram.
Discuss Part II (Whole Class):
Chocolate Vanilla Total Female 4,732 4,024 8,756 Male 2,420 3,590 6,010 Total 7,152 7,614 14,766

© 2013 Mathematics Vision Project | MVP In partnership with the Utah State Office of Education
Licensed under the Creative Commons Attribution-NonCommercial-ShareAlike 3.0 Unported license.
Complete the chart as a whole group after students have had time to think about this themselves. To conclude, answer question six by discussing the law of large numbers and randomness.
Aligned Ready, Set, Go: Probability RSG 9.2
Probability* 9.2*!
!©"2013"MATHEMATICS"VISION"PROJECT"|"MVP"In"partnership"with"the"Utah"State"Office"of"Education"""
Licensed!under!the!Creative!Commons!Attribution4NonCommercial4ShareAlike!3.0!Unported!license"
!
!"
!
!!
Ready,'Set,'Go!''!
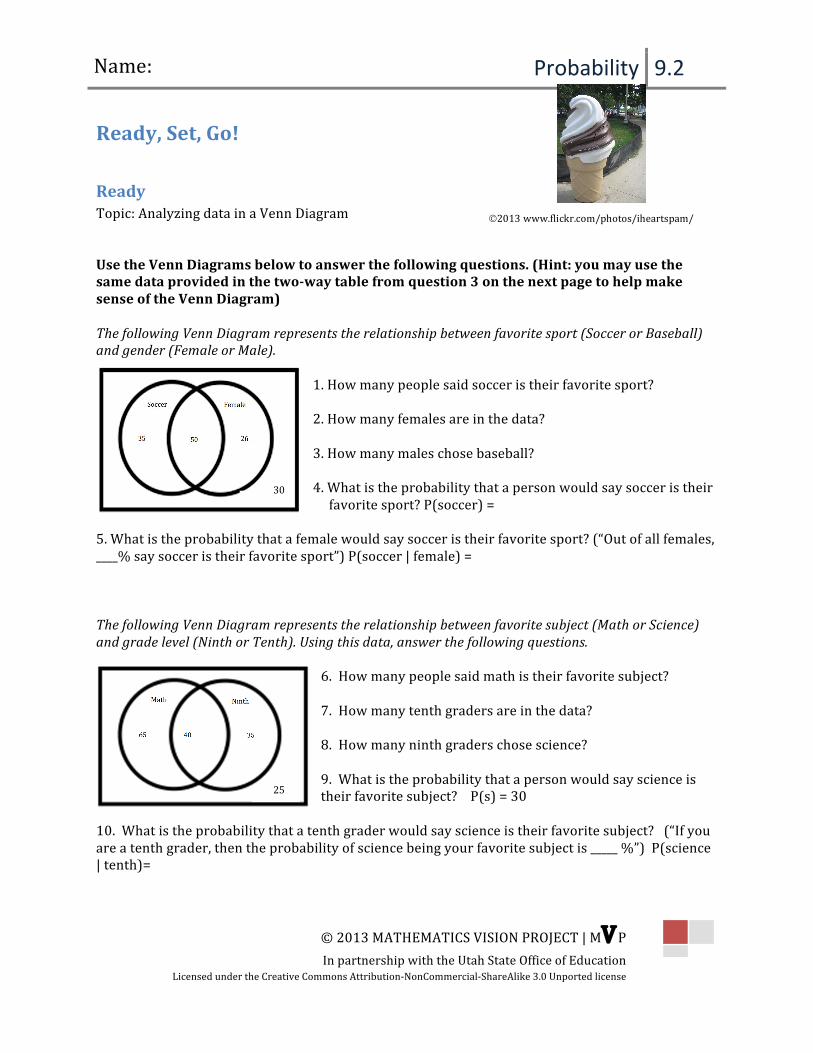
Ready'Topic:!Analyzing!data!in!a!Venn!Diagram!!!Use'the'Venn'Diagrams'below'to'answer'the'following'questions.!(Hint:'you'may'use'the'same'data'provided'in'the'twoCway'table'from'question'3'on'the'next'page'to'help'make'sense'of'the'Venn'Diagram)'!The!following!Venn!Diagram!represents!the!relationship!between!favorite!sport!(Soccer!or!Baseball)!and!gender!(Female!or!Male).!!
!1.!How!many!people!said!soccer!is!their!favorite!sport?!!2.!How!many!females!are!in!the!data?!!3.!How!many!males!chose!baseball?!!4.!What!is!the!probability!that!a!person!would!say!soccer!is!their!!!!!!!!favorite!sport?!P(soccer)!=!!!
5.!What!is!the!probability!that!a!female!would!say!soccer!is!their!favorite!sport?!(“Out!of!all!females,!____%!say!soccer!is!their!favorite!sport”)!P(soccer!|!female)!=!!!!!The!following!Venn!Diagram!represents!the!relationship!between!favorite!subject!(Math!or!Science)!and!grade!level!(Ninth!or!Tenth).!Using!this!data,!answer!the!following!questions.!
!6.!!How!many!people!said!math!is!their!favorite!subject?!!7.!!How!many!tenth!graders!are!in!the!data?!!8.!!How!many!ninth!graders!chose!science?!!9.!!What!is!the!probability!that!a!person!would!say!science!is!their!favorite!subject?!!!!P(s)!=!30!!
10.!!What!is!the!probability!that!a!tenth!grader!would!say!science!is!their!favorite!subject?!!!(“If!you!are!a!tenth!grader,!then!the!probability!of!science!being!your!favorite!subject!is!_____!%”)!!P(science!|!tenth)=!!
Name:!
©2013!www.flickr.com/photos/iheartspam/!!
!30!
!25!

Probability* 9.2*!
!
©"2013"MATHEMATICS"VISION"PROJECT"|"MVP"In"partnership"with"the"Utah"State"Office"of"Education"""
Licensed!under!the!Creative!Commons!Attribution4NonCommercial4ShareAlike!3.0!Unported!license"
!
!
"
!
!
!
Set'Topic:!Writing!conditional!statements!from!a!two4way!table.!
!
11.!Complete!the!table!and!write!three!conditional!statements.!
! Soccer!! Baseball! Total!
Male! ! 30! !
Female! 50! ! 76!
Total! 85! ! !
!
12.!Complete!the!table!about!preferred!genre!of!reading!and!write!three!conditional!statements.!
!Fiction!
Non4!
Fiction!Total!
Male! ! 10! !
Female! 50! ! 60!
Total! 85! ! !
!
13.!Complete!the!table!about!favorite!color!of!M&M’s!and!write!three!conditional!statements.!
! Blue!! Green! Red! Other! Total!
Male! 15! 20! 15! ! 60!
Female! 30! 20! ! 10! !
Total! 45! ! ! ! 130!
!14.!Use!the!information!provided!to!make!a!tree!diagram,!a!two4way!table!and!a!Venn!Diagram.!
• Data!was!collected!at!the!movie!theater!last!fall.!Not!about!movies!but!clothes.!
• 6,525!people!were!observed.!
• 3,123!had!on!shorts!and!the!rest!had!on!pants!
• 45%!of!those!wearing!shorts!were!denim.!
• Of!those!wearing!pants!88%!were!denim.!
!
!
!
!
!
!
!
!
!
!
!
!
10

Probability* 9.2*!
!
©"2013"MATHEMATICS"VISION"PROJECT"|"MVP"In"partnership"with"the"Utah"State"Office"of"Education"""
Licensed!under!the!Creative!Commons!Attribution4NonCommercial4ShareAlike!3.0!Unported!license"
!
!"
!
!!
Go'Topic:!Fractions,!Percent!and!there!operations!!Find'the'desired'values.'
15.!!What!is!half!of!one4third?! 16.!!What!is!one4third!of!two4fifths?!
17.!!What!is!one4fourth!of!four4sevenths?! 18.!!What!percent!is!!!!?!
19.!!What!is!35%!of!50?! 20.!!Seventy!is!60%!of!what!number?!
21.!!Write! !!"!as!a!percent.! 22.!!Write!!!!as!a!percent.!
23.!!What!is!52%!of!1,200?! 24.!!What!percent!is!32!of!160?!
25.!!Sixty!is!what!percent!of!250?! 26.!!What!percent!of!350!is!50?!
'!!
11

9.3!Fried&Freddy’s!!A"Solidify!Understanding+Task!Danielle!was!surprised!by!the!results!of!the!survey!to!determine!the!‘favorite!ice!cream’!between!chocolate!and!vanilla!(See!task!9.2!!Chocolate)vs.)Vanilla).!The!reason,!she!explains,!is!that!she!had!asked!several!of!her!friends!and!the!results!were!as!follows:!
!
!
!
1. In!this!situation,!chocolate!is!most!preferred.!How!would!you!explain!to!her!that!this!data!may!be!less!‘valid’!compared!to!the!data!from!the!previous!survey?!
!
Using!a!sufficiently!large!number!of!trials!helps!us!estimate!the!probability!of!an!event!happening.!If!the!sample!is!large!enough,!we!can!say!that!we!have!an!estimated!probability!outcome!for!the!probability!of!an!event!happening.!If!the!sample!is!not!randomly!selected!(only!asking!your!friends)!or!not!large!enough!(collecting!four!data!points!is!not!enough!information!to!estimate!long!run!probabilities),!then!one!should!not!estimate!large!scale!probabilities.!Sometimes,!our!sample!increases!in!size!over!time.!Below!is!an!example!of!data!that!is!collected!over!time,!so!the!estimated!probability!outcome!becomes!more!precise!as!the!sample!increases!over!time.!!
Freddy!loves!fried!food.!His!passion!for!the!perfect!fried!food!recipes!led!to!him!opening!the!restaurant,!“Fried!Freddies.”!His!two!main!dishes!are!focused!around!fish!or!chicken.!Knowing!he!also!had!to!open!up!his!menu!to!people!who!prefer!to!have!their!food!grilled!instead!of!fried,!he!created!the!following!menu!board:!
!
!
!
!
!
!
! Chocolate! Vanilla! Total!
Female! 23! 10! 33!
Male! 6! 8! 14!
Total! 29! 18! 47!
Choose dish: Chicken or Fish
Choose cooking preference: Grilled or Fried
! ©20
13%www.flickr.com
/pho
tos/mesoh
ungry/%

After!being!open!for!six!months,!Freddy!realized!he!was!having!more!food!waste!than!he!should!because!he!was!not!predicting!how!much!of!each!he!should!prepare!in!advance.!His!business!friend,!Tyrell,!said!he!could!help.!!
2. What!information!do!you!think!Tyrell!would!need?!
!
!
Luckily,!Freddy!uses!a!computer!to!take!orders!each!day!so!Tyrell!had!lots!of!data!to!pull!from.!After!determining!the!average!number!of!customers!Freddy!serves!each!day,!Tyrell!created!the!following!Venn!diagram!to!show!Freddy!the!food!preference!of!his!customers:!
!!
!
To!make!sense!of!the!diagram,!Freddy!computed!the!following!probability!statements:!
3. What!is!the!probability!that!a!randomly!selected!customer!would!order!fish? !P(fish)!=!Shade!the!part!of!the!diagram!that!models!this!solution.!!!!
4. What!is!the!probability!that!a!randomly!selected!customer!would!order!fried!fish?!P(fried!∩!fish)!=!P(fried!and!fish)!=!!Shade!the!part!of!the!diagram!that!models!this!solution.!!!!
5. What!is!the!probability!that!a!person!prefers!fried!chicken?!!P(fried∩chicken)!=!P(fried!and!chicken)!=!Shade!the!part!of!the!diagram!that!models!this!solution.!!!
30%%15%%20%%
Fried% Fish%

6. What is the estimated probability that a randomly selected customer would want their fish grilled? P(grilled and fish) = P(____________________) = Shade the part of the diagram that models this solution.
7. If Freddy serves 100 meals at lunch on a particular day, how many orders of fish should he prepare with his famous fried recipe?
8. What is the probability that a randomly selected person would choose fish or fried? P(friedfish) = P(fried or fish) = Shade the part of the diagram that models this solution.
9. What is the probability that a randomly selected person would NOT choose fish or fried? Shade the part of the diagram that models this solution.
14

Fried Freddy’s – Teacher Notes A Solidify Understanding Task
Purpose: A purpose of this task is for students to gain a stronger understanding the law of large numbers and how this helps to estimate probable outcomes. Another purpose is for students to solidify their understanding around the following ideas:
Ɣ Whether or not there is enough data to estimate outcomes. Ɣ Distinguish between a general probability, a conditional probability, and the addition rule. Ɣ Use a Venn diagram to analyze data and to write various probability statements (unions,
intersections, complements). Ɣ Apply the Addition Rule and interpret the answer in terms of the model. Ɣ Use estimated outcomes to make recommendations and decisions.
Core Standards Focus:
S.CP.1: Describe events as subsets of a sample space (the set of outcomes) using characteristics (or categories) of the outcomes, or as unions, intersections, or complements of other events (“or”, “and”, “not”).
S.CP.4: Construct and interpret two-way frequency tables of data when two categories are associated with each object being classified. Use the two-way table as a sample space to decide if events are independent and to approximate conditional probabilities.
S.CP.6: Find the conditional probability of A given B as the fraction of B’s outcomes that also belong to A, and interpret the answer in terms of the model.
S.CP.7: Apply the Addition Rule and interpret the answer in terms of the model.
Related Standards: S.CP.3, S.CP.5
Launch (Whole Class):
Have students answer the first question about the validity of data individually, then discuss as a group how important sample is when estimating outcomes.
Read the context of Fried Freddy, then have students answer the question about what information Tyrell would need to pull together data. Depending on your class, you may also wish to have students label each section of the Venn diagram and make sure everyone understands this prior to having students answer the questions related to the diagram.
Explore (Small Group):

As you monitor, listen for students to make sense of the probability statements they are answering and look for the solution area to be shaded on their models. Help students who are struggling by suggesting they create a different representation (such as a two-way table- see below).
Since the purpose of this task is for students to recognize and use probability statements to interpret data, plan to have the whole group discussion focus on questions that relate to standards S.CP.1 and S.CP. 7.
Discuss (Whole Class):
Choose students to answer questions relating to the data from the Venn diagram. Spend most time on questions relating to unions, intersections, complements, and the Addition Rule. Be sure to use this vocabulary and have student’s record unfamiliar vocabulary in their journal. The most time may be spent on questions six through nine. At the end of the lesson, review probability notation and discuss the similarities and differences between the rules of probability (unions, intersections, complements, Addition Rule, conditional probability) and other vocabulary (mutually exclusive, joint, disjoint).
Aligned Ready, Set, Go: Probability RSG 9.3
Fish Chicken total Fried 15% 20% 35% Grilled 30% 35% 65% Total 45% 55% 100%

Probability* 9.3*!
!
©"2013"MATHEMATICS"VISION"PROJECT"|"MVP"In"partnership"with"the"Utah"State"Office"of"Education"""
Licensed!under!the!Creative!Commons!Attribution4NonCommercial4ShareAlike!3.0!Unported!license"
!
!
"
!
!
!
Ready,'Set,'Go!''
'
Ready'Topic:!!Independent!and!Dependent!events! !
!
In'some'of'the'situations'described'below'the'first'event'effects'the'subsequent'event'(dependent'events).'In'others'each'of'the'events'is'completely'independent'of'the'others'(independent'events).'Determine'which'situations'are'dependent'and'which'are'independent.'1. A!coin!is!flipped!twice.!The!first!event!is!the!first!flip!and!the!second!event!is!the!next!flip.!
!
!
2. A!bag!of!marbles!contains!3!blue!marbles,!6!red!marbles!and!2!yellow!marbles.!Two!of!the!
marbles!are!drawn!out!of!the!bag.!The!first!even!is!the!first!marble!taken!out!the!second!event!is!
the!second!marble!taken!out.!
!
3. An!attempt!to!find!the!probability!of!there!being!a!right4handed!or!a!left4handed!batter!a!the!
plate!in!a!baseball!game.!The!first!event!is!the!1st!batter!to!come!to!the!plate.!The!second!event!is!
the!second!player!to!come!up!to!the!plate.!
!
4. A!standard!die!is!rolled!twice.!The!first!event!is!the!first!roll!and!the!second!event!is!the!second!
roll.!
!
5. Two!cards!are!drawn!from!a!standard!deck!of!cards.!The!first!event!is!the!first!card!that!is!
drawn!the!second!event!is!the!second!card!that!is!drawn.!
!
!
Set'Topic:!Addition!Rule,!interpreting!a!Venn!Diagram!
!
6.!Sally!was!assigned!to!create!a!Venn!diagram!to!represent!!(!!or!!).!!Sally!first!writes!!!!!!!!(!!or!!) != !!(!) !+ !!(!) !− !!(!!and!!),!what!does!this!mean?!Explain!each!part.!!
!
7.!Sally!then!creates!the!following!diagram.!!
!!!!Sally’s!Venn!diagram!is!incorrect.!Why?!
'''!
!
Name:!
2013!www.flickr.com/photos/mesohungry/!
!
15

Probability* 9.3*!
!
©"2013"MATHEMATICS"VISION"PROJECT"|"MVP"In"partnership"with"the"Utah"State"Office"of"Education"""
Licensed!under!the!Creative!Commons!Attribution4NonCommercial4ShareAlike!3.0!Unported!license"
!
!
"
!
!
!
The!Venn!diagram!to!the!right!shows!the!data!
collected!at!a!sandwich!shop!for!the!last!six!months!
with!respect!to!the!type!of!bread!people!ordered!
(sourdough!or!wheat)!and!whether!or!not!they!got!
cheese!on!their!sandwich.!Use!this!data!to!create!a!
two4way!frequency!table!and!answer!the!questions.!
!
!
!
8.!Two4way!frequency!table!
! ! ! !
! ! ! !
! ! ! !
! ! ! !
!
9. What!is!the!probability!that!a!randomly!selected!customer!would!order!sourdough!bread?!!!!
P(sourdough!bread)!=!
!
10. What!is!the!probability!that!a!randomly!selected!customer!would!order!sourdough!bread!without!cheese?!
P(sourdough!∩!no!cheese)!=!P(sourdough!and!no!cheese)!=!!
!
11. What!is!the!probability!that!a!person!prefers!wheat!bread!without!cheese?!!P(wheat!∩!no!cheese)!=!P(wheat!and!no!cheese)!=!
!
12. What!is!the!estimated!probability!that!a!randomly!selected!customer!would!want!their!sandwich!with!cheese?!
P(sourdough!cheese!and!wheat!cheese)!=!P(____________________)!=!!
!
13. If!they!serve!100!sandwiches!at!lunch!on!a!particular!day,!how!many!orders!with!sourdough!should!be!prepared!without!cheese?!
!
14. What!is!the!probability!that!a!randomly!selected!person!would!choose!sourdough!or!without!cheese?!
P(sourdough!∪!no!cheese)!=!P(sourdough!or!no!cheese)!=!
!
15. What!is!the!probability!that!a!randomly!selected!person!would!NOT!choose!sourdourgh!or!no!cheese?!
!
20%!!

Probability* 9.3*!
!
©"2013"MATHEMATICS"VISION"PROJECT"|"MVP"In"partnership"with"the"Utah"State"Office"of"Education"""
Licensed!under!the!Creative!Commons!Attribution4NonCommercial4ShareAlike!3.0!Unported!license"
!
!"
!
!!
Go' 'Topic:!Equivalent!ratios!and!proportions!!Use'the'given'ratio'to'set'up'a'proportion'and'find'the'desired'value.'!16. If!3!out!of!5!students!eat!school!lunch!then!how!many!students!would!be!expected!to!eat!school!
lunch!at!a!school!with!750!students?!
!
!
17. In!a!well!developed!and!carried!out!survey!it!was!found!that!4!out!of!10!students!have!a!pair!of!
sunglasses.!How!many!students!would!you!expect!to!have!a!pair!of!sunglasses!out!of!a!group!of!
45!students?!
!
!
18. Data!collected!at!a!local!mall!indicted!that!7!out!of!20!men!observed!were!wearing!a!hat.!How!!!!
many!would!you!expect!to!have!been!wearing!hats!if!7500!men!were!to!be!at!the!mall!on!a!
similar!day?!
*
17

9.4 Visualizing with Venn A Solidify Understanding Task One of the attributes of Venn diagram’s is that it can be easy to see the relationships within the data. In this task, we will create multiple Venn diagrams using data and determine the events that create diagrams to either have an intersection or for them to be mutually exclusive.
1. The following data represents the number of men and women passengers aboard the titanic and whether or not they survived.
Survived Did not survive Total Men 146 659 805 Women 296 106 402 Total 442 765 1207
2. Create three Venn diagrams with this data. a. Men vs Women b. Women vs Survived c. You choose the conditions
3. Create two probability statements using each of your Venn diagrams from question 2.
4. Create and label three different Venn diagrams using this data. Create at least one that is mutually exclusive and at least one that has an intersection.
Sample size: 100 P(girl) = ସଶଵ
P(girl or art) = ( ସଶଵ + ଷଵ) െ ଵଶଵ
P(art) = ଷଵ P(not art) = P(boy) =
5. Describe the conditions that create mutually exclusive Venn diagrams and those that create
intersections. 6. What conjecture can you make regarding the best way to create a Venn diagram from data to
highlight probabilities?
¤20
13 w
ww
.flic
kr.c
om/p
hoto
s/ke
vand
otor
g/
18

9.4 Visualizing with Venn – Teacher Notes A Solidify Understanding Task
Purpose: The purpose of this task is to have students create and analyze attributes of Venn
diagrams, then make sense of the data. Students will add academic vocabulary (mutually exclusive,
joint, disjoint) and will distinguish between conditional probability and using the addition rule. At
the end of the task, students will be able to:
Ɣ Create Venn Diagrams that highlight specific data.
Ɣ Understand mutually exclusive, joint (intersection), and the Addition Rule using Venn
diagrams.
Ɣ Distinguish between conditional probability and the Addition Rule.
Ɣ Get out vocabulary such as joint, disjoint, mutually exclusive, Addition Rule, and conditional
probability.
Ɣ Analyzing data from a two way table and from probability notation to create various Venn
Diagrams
Core Standards Focus:
S.CP.6: Find the conditional probability of A given B as the fraction of B’s outcomes that also belong
to A, and interpret the answer in terms of the model.
S.CP.7: Apply the Addition Rule, P(A or B) = P(A) + P(B) – P(A and B), and interpret the answer in
terms of the model.
Related Standards: S.CP.3, S.CP. 4, S.CP.5
Launch (Whole Class):
Have students share what they know about Venn diagrams to access background knowledge, then
have them begin working on the task in small groups.
Explore (Small Group):
As you monitor, check for student understanding of how to write a Venn diagram when given the
constraints (questions two and three). These questions scaffold students by telling them which
categories to use when creating the diagram, then having them interpret what kind of information
they can see from each. The intention of these models is for students to recognize that when they
are choosing categories for a Venn diagram, that the data is more meaningful when they select from
different category types. Listen for students to make the following conjectures regarding creating
Venn diagrams: If two events are related and have overlapping data, the intersection is easy to see
and several probability statements can be made. Likewise, if the two events being compared do not

have overlap, then those two events are mutually exclusive. Also listen for students to become clear as to the probabilities that are easier to see in a Venn diagram than in other models.
Discuss (Whole Class):
For the whole group discussion, have students share what they have learned about creating Venn diagrams. Chart this information, and then press students to explain how they would use data in the future to create a Venn diagram that would produce the data they were seeking. Ask students to share some probability statements they created and have them explain how the Venn diagram was helpful in seeing the probability. Focus on conditional probability statements, the Addition Rule, and data that highlights intersections and complements. Aligned Ready, Set, Go: Probability RSG 9.4

Probability* 9.4*!
!
©"2013"MATHEMATICS"VISION"PROJECT"|"MVP"In"partnership"with"the"Utah"State"Office"of"Education"""
Licensed!under!the!Creative!Commons!Attribution4NonCommercial4ShareAlike!3.0!Unported!license"
!
!"
!
!!
Ready,'Set,'Go!''
'
Ready'Topic:!!Products!of!probabilities,!multiplying!and!dividing!fractions!!Find'the'products'or'quotients'below.''1.!! 1
2 ∙23!
2.! 35 ∙13!
3.! 710 ∙
25!
4.! 87 ∙34!
5.! 1312!
6.! 25 ÷
23!
'7.! P(A)!=!!!!!!!!!!!P(B)=!
!!!
!P(A)!∗!P(B)=!
8.! P(A)!=!!!!!!!!!!!P(B)=!!!!
!P(A)!∗!P(B)=!!
!Set'For'each'situation,'one'of'the'representations'(two=way'table,'Venn'diagram,'tree'diagram,'context'or'probability'notation)'is'provided.'Use'the'provided'information'to'complete'the'remaining'representations.'''9.!Are!you!Blue?!!
Notation! 24way!Table!Key:!!Male!=!M!!!!!!!!!!!!!!!!Female!=!F!Blue!=!B!!!!!!!!!!!!!!!!!!!Not!Blue!=!N!!Sample!size!=!200!!P(B)!=!!84/200!!!!!!!!!!P(M)!=!64/200!!P(F|B)!=!48/84!!!!!!!!!!P(B|F)!=!!!P(M∩B)!=!!!!!!!!!!!!!!!!P(M∪B)!=!!!!!
!!
! Blue! Not!Blue! Total!
Male!! ! !
Female! ! ! !
Total! ! ! !!
(Continued!on!the!next!page)!
Name:!
2013!www.flickr.com/photos/kevandotorg/!!
19

Probability* 9.4*!
!
©"2013"MATHEMATICS"VISION"PROJECT"|"MVP"In"partnership"with"the"Utah"State"Office"of"Education"""
Licensed!under!the!Creative!Commons!Attribution4NonCommercial4ShareAlike!3.0!Unported!license"
!
!"
!
!!
(Continued!from!the!last!page)!Venn!Diagram! Tree!Diagram!
!
!!
!
Write!three!observations!you!can!make!about!this!data.!!!!
10.!Right!and!left!handedness!of!a!group.!Notation! 24way!Table!
Key:!!Male!=!M!!!!!!!!!!!!!!!!!Female!=!F!Lefty!=!L!!!!!!!!!!!!!!!!!!Righty!=!R!!Sample!size!=!100!people!!P(L)!=!!!!!!!!!!!!!!!!!!!!!!!P(M)!=!!P(F)!=!!!!!!!!!!!!!!!!!!!!!!!!P(L|F)!=!!!P(L|M)!=!!
!!
! Lefty! Righty! Total!
Male! ! ! !
Female! ! ! !
Total! ! ! !!
Venn!Diagram! Tree!Diagram!
!
!!
!
Write!three!conditional!statements!regarding!this!data.!!!!
20

Probability* 9.4*!
!©"2013"MATHEMATICS"VISION"PROJECT"|"MVP"In"partnership"with"the"Utah"State"Office"of"Education"""
Licensed!under!the!Creative!Commons!Attribution4NonCommercial4ShareAlike!3.0!Unported!license"
!
!"
!
!!
11.!The!most!important!meal!of!the!day.!Notation! 24way!Table!
Key:!!Male!=!M!!!!!!!!!!!!!!!!!!!Female!=!F!!Eats!Breakfast!=!E!!!!!Doesn’t!Eat!Breakfast!=!D!!Sample!size!=!!P(E)!=!!!!!!!!!!!!!!!!!!!!!!!!!P(E|M)!=!!P(E∩M)=!!!!!!!!!!!!!!!!!!!P(E|F)!=!!!P(E∩F)!=!
!!
! Eats! Doesn’t!! Total!
Male! ! ! !
Female! ! ! !
Total! ! ! 685!!
Venn!Diagram! Tree!Diagram!
!
!
!
Does!this!data!surprise!you?!Why!or!why!not.!
!Go' 'Topic:!Writing!conditional!statements!from!a!two4way!table.!!12.!Complete!the!table!and!write!three!conditional!statements.!
! Biking! Swimming! Total!Male! ! 50! !Female! 35! ! 76!Total! 85! ! !
!
13.!Complete!the!table!about!preferred!genre!of!reading!and!write!three!conditional!statements.!
! Ice!Cream!! Cake! Total!Male! ! 20! !Female! 10! ! 60!Total! 85! ! !
!
14.!Complete!the!table!about!eye!color!and!write!three!conditional!statements.!! Blue!! Green! Brown! Other! Total!
Male! 55! 20! 15! ! 100!Female! ! 20! ! 10! !Total! ! ! 75! ! 230!
!
!
= ______
= ______
= ______
= ______
D (60%)
E (40%)
D (42%)
E (58)
F (38%)
M (62%)
21
9.5 Freddy Revisited A Solidify Understanding Task
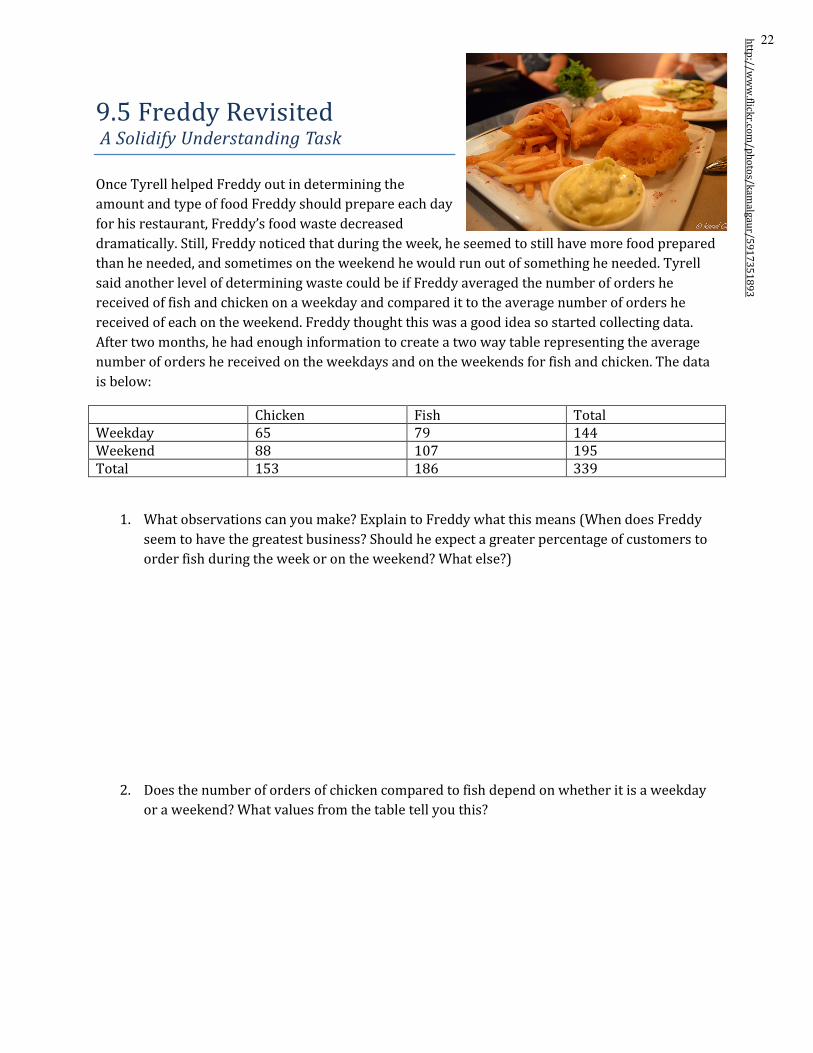
Once Tyrell helped Freddy out in determining the amount and type of food Freddy should prepare each day for his restaurant, Freddy’s food waste decreased dramatically. Still, Freddy noticed that during the week, he seemed to still have more food prepared than he needed, and sometimes on the weekend he would run out of something he needed. Tyrell said another level of determining waste could be if Freddy averaged the number of orders he received of fish and chicken on a weekday and compared it to the average number of orders he received of each on the weekend. Freddy thought this was a good idea so started collecting data. After two months, he had enough information to create a two way table representing the average number of orders he received on the weekdays and on the weekends for fish and chicken. The data is below:
Chicken Fish Total Weekday 65 79 144 Weekend 88 107 195 Total 153 186 339
1. What observations can you make? Explain to Freddy what this means (When does Freddy seem to have the greatest business? Should he expect a greater percentage of customers to order fish during the week or on the weekend? What else?)
2. Does the number of orders of chicken compared to fish depend on whether it is a weekday or a weekend? What values from the table tell you this?
http://ww
w.flickr.com
/photos/kamalgaur/5917351893
22

Freddy Revisited – Teacher Notes A Solidify Understanding Task
Purpose: The purpose of this task is for students to determine whether or not an event is independent. In this task, students are asked to interpret the amount of chicken and fish Freddy should prepare on any given day. The goal is for students to recognize that Freddy sales more food on a weekend day than he does on a weekday, however, the percentage of each food type stays the same. In other words, the likelihood that a randomly selected customer would order fish is independent as to whether or not it is a weekday or a weekend. Core Standards Focus:
S.CP.2: Understand that two events A and B are independent if the probability of A and B occurring together is the product of their probabilities, and use this characterization to determine if they are independent. S.CP.3: Understand the conditional probability of A given B as P(A and B)/P(B), and interpret independence of A and B as saying that the conditional probability of A given B is the same as the probability of A, and the conditional probability of B given A is the same as the probability of B. S.CP.4: Construct and interpret two-way frequency tables of data when two categories are associated with each object being classified. Use the two-way table as a sample space to decide if events are independent and to approximate conditional probabilities. For example, collect
data from a random sample of students in your school on their favorite subject among math, science,
and English. Estimate the probability that a randomly selected student from your school will favor
science given that the student is in tenth grade. Do the same for other subjects and compare the
results.
S.CP.5: Recognize and explain the concepts of conditional probability and independence in everyday language and everyday situations. For example, compare the chance of having lung cancer
if you are a smoker with the chance of being a smoker if you have lung cancer.
Related Standards: S.CP.6, S.MD.7+
Launch (Whole Class):
Remind students about the task Fried Freddy’s and how Tyrell helped him determine the amount of fish and chicken he should prepare each day. Read this task, and have students make observations based on the table.
Explore (Small Group):

In small groups, have students make as many observations as possible as to the amount of food Freddy should prepare. Students should make the following observations (not all groups will make all observations and some groups may make observations beyond what is written below):
x Freddy serves more fish than chicken x 45% of Freddy’s business orders chicken, regardless of whether or not it is a weekday or a
weekend. x 55% of Freddy’s business orders fish, regardless of whether or not it is a weekday or a
weekend. x Other multiplicative relationships that show that the food preference is independent of the
time of week it is ordered. x A common misconception is for students to make observations that are ‘additive’ in nature
(such as 14 more customers order fish each weekday) instead of multiplicative (42.4% of the chicken orders occur on a weekday, which is the same percent as the number of fish orders that occur on a weekday, compared to 57.6% on a weekend). If this occurs, ask students how this data helps them compare the percent of customers who order one food over another.
As the explore phase comes to an end, look for ways to choose students who have discovered different independence scenarios you can use during the discuss phase of the task.
Discuss (Whole Class):
Begin the discussion phase by asking the whole group “When does Freddy seem to have the greatest business?” Then ask “Should he expect a greater percentage of customers to order fish during the week or on the weekend? How do you know? What does this information tell us?” The goal is to have students share that while he has more fish orders each day, the percentage of fish to all orders is the same during the week as it is on the weekend, so the percent of fish to prepare is independent of whether it is a weekday or a weekend. Use notation to show this relationship. Do the same with chicken compared to fish given that it is a weekday. Create a this data using a tree diagram and a Venn diagram. What do students notice regarding independence when data is presented in a particular representation? Again, use notation to show independence and then connect this to each representation you have drawn. Conclude the task by writing independence statements, drawing a representation model that matches and connecting to standards S.CP.2, S.CP.3, S.CP.4, and S.CP.5.
Aligned Ready, Set, Go: Probability RSG 9.5

Probability* 9.5*!
!
©"2013"MATHEMATICS"VISION"PROJECT"|"MVP"In"partnership"with"the"Utah"State"Office"of"Education"""
Licensed!under!the!Creative!Commons!Attribution4NonCommercial4ShareAlike!3.0!Unported!license"
!
!
"
!
!!
Ready,'Set,'Go!''
Ready'Topic:!!Quadratic!Function!Review!!
Find'the'x2intercepts,'y2intercept,'line'of'symmetry'and'vertex'for'the'quadratic'functions.'1.!!(!) != !!! + 8!– 9!"!
2.!!! ! = !!!– 3!!– 5!!! 3.!ℎ ! = !2!! + 5! − 3"!
!
!
!!
! !
4.!!!!(!) != !!! !+ !6!!– !9! 5.!!!!(!) != ! (!! + !5)!– !2! 6.!!!!(!) != ! (!! + !7)(!!– !5)"!
!!
!!
!
! !
!
Set'Topic:!!Independence!
!Determining!the!independence!of!events!can!sometimes!be!done!by!becoming!familiar!with!the!context!in!which!the!events!occur!and!the!nature!of!the!events.!There!are!also!some!ways!of!determining!independence!of!events!based!on!equivalent!probabilities.!!!!
• Two!events,!A!and!B,!are!independent!if!!P!(A!and!B)!=!P!(A)!∙!P(B)!!!• Additionally,!two!events,!A!and!B,!are!independent!if!!P(A|B)!=!!(!!!"#!!)!(!) !=!P(A)!
!
Use'these'two'ways'of'determining'independent'events'to'determine'independence'in'the'problems'below'and'answer'the'questions.'!
7.!P!(A!and!B)!=!!!!
!!!!!P!(A)!=!!!!
!
!!!!!!P!(B)!=!!!"!
!
!
8.!P!(A)!=!!!!
!!!!!P!(A!and!B)!=!!!!
!!!!!P!(B)!=!!!!
Name:!
http://www.flickr.com/photos/kamalgaur/5917351893*
!
23
Probability* 9.5*!
!
©"2013"MATHEMATICS"VISION"PROJECT"|"MVP"In"partnership"with"the"Utah"State"Office"of"Education"""
Licensed!under!the!Creative!Commons!Attribution4NonCommercial4ShareAlike!3.0!Unported!license"
!
!"
!
!!
9.!!!P!(A)!=!!!!!!!!!!P!(A!and!B)!=!!!!
!!!!!!P!(B)!=!!!!!
10.!!!P!(A!and!B)!=!!!!!!!!!!!!!P!(A)!=!!!!!!!!!!!!!!P!(B)!=!!!!
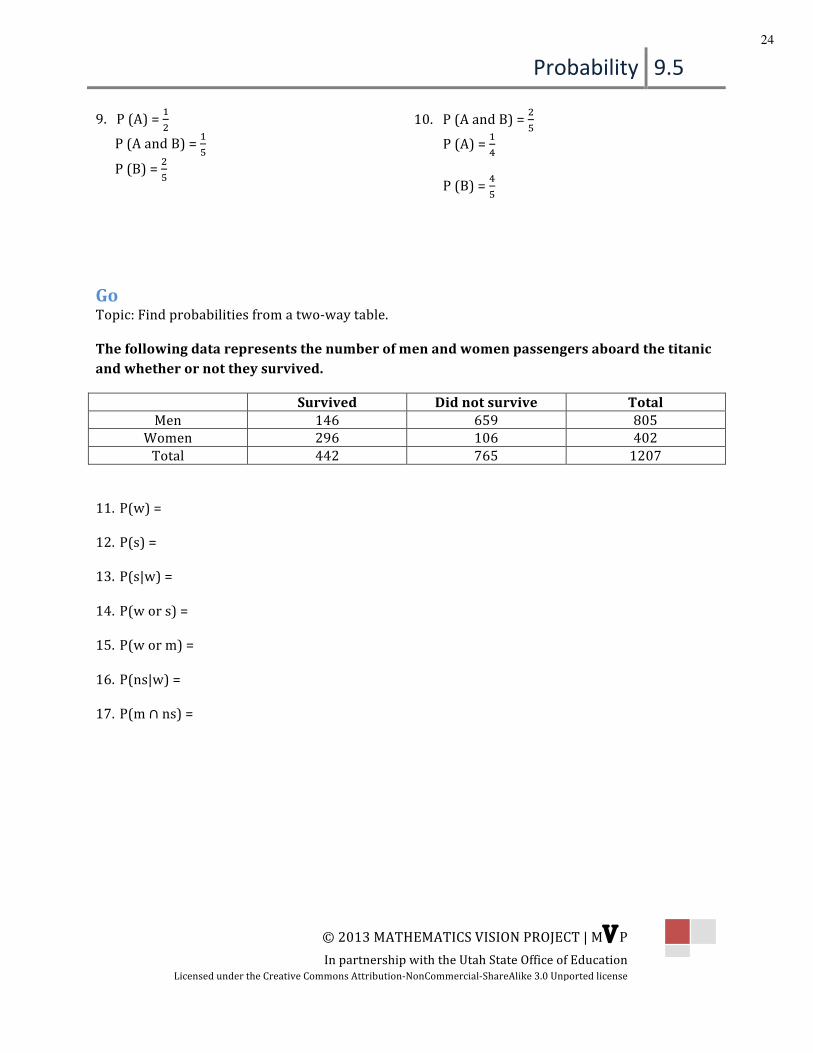
! !!!!!Go' 'Topic:!Find!probabilities!from!a!two4way!table.!!The'following'data'represents'the'number'of'men'and'women'passengers'aboard'the'titanic'and'whether'or'not'they'survived.''
! Survived' Did'not'survive' Total'Men! 146! 659! 805!
Women! 296! 106! 402!Total! 442! 765! 1207!
!!11. P(w)!=!
12. P(s)!=!
13. P(s|w)!=!
14. P(w!or!s)!=!
15. P(w!or!m)!=!
16. P(ns|w)!=!
17. P(m!∩!ns)!=!
24

9.6 Striving for Independence A Practice Understanding Task
Use your knowledge of conditional probability (the probability of A given B as P(A and B)/P(B) ) as well as the definition of independence (two events (A and B)) are said to be independent if ܲ(ܤ|ܣ) = (ܣ|ܤ)ܲ ݀݊ܽ (ܣ)ܲ = .to answer the following questions ( (ܤ)ܲKeep track of how you are determining independence for each type of representation.
1. Out of the 2000 students who attend a certain high school, 1400 students own cell phones, 1000 own a tablet, and 800 have both. Suppose a student is randomly selected. Create a Venn diagram model and use notation to answer the following questions.
a) What is the probability that a randomly selected student owns a cell phone?
b) What is the probability that a randomly selected students owns both a cell phone and a tablet?
c) If a randomly selected student owns a cell phone (was one of the 1400 with a phone), what is the probability that this student also owns a tablet?
d) How are questions c and d different?
e) Are the outcomes owns a cell phone and owns a tablet independent? Explain.
f) If question e is not independent, what number of students would own a tablet to create independence?
2. Below is a partially completed tree diagram from the task Chocolate vs Vanilla. a) Circle the parts of the diagram you would use to determine if choosing chocolate is
independent of being a male or female.
b) Complete the diagram so that choosing chocolate is independent of being male or female.
http
://w
ww
.flic
kr.co
m/p
hoto
s/ro
nwls
/
25

3. Use the titanic data below to answer the following questions.
Survived Did not survive Total Men 146 659 805 Women 296 106 402 Total 442 765 1207
a. Determine if survival was independent of gender. Explain. b. If gender would not have mattered, what would have been the number of males that would
have survived, given the data for the number of females who survived and the total number of passengers on the ship.
4. Determine whether the second scenario would be dependent or independent of the first scenario. Explain.
a) Rolling a six-sided die, then drawing a card from a deck of 52 cards. b) Drawing a card from a deck of 52 cards, then drawing another card from the same deck. c) Rolling a six-sided die, then rolling it again. d) Pulling a marble out of a bag, replacing it, then pulling a marble out of the same bag. e) Having 20 treats in five different flavors for a soccer team, with each player taking a
treat. 5. The definition of independence is that two events (A and B) are said to be independent if
(ܤ|ܣ)ܲ = (ܣ|ܤ)ܲ ݀݊ܽ (ܣ)ܲ = (ܤ)ܲ
Explain what this looks like in a Venn diagram, a tree diagram, and a two-way table.
26

Striving for Independence – Teacher Notes A Practice Understanding Task
Purpose: The purpose of this task is for students to practice determining whether one event is independent of another event. Students will use data from different representations, plus make sense of whether or not one scenario would be independent of another. In the end, students will explain how to quickly determine independence from a Venn diagram, a tree diagram, and a two-way table. Core Standards Focus:
S.CP.2: Understand that two events A and B are independent if the probability of A and B occurring together is the product of their probabilities, and use this characterization to determine if they are independent. S.CP.3 Understand the conditional probability of A given B as P(A and B)/P(B), and interpret independence of A and B as saying that the conditional probability of A given B is the same as the probability of A, and the conditional probability of B given A is the same as the probability of B. S.CP.4 Construct and interpret two-way frequency tables of data when two categories are associated with each object being classified. Use the two-way table as a sample space to decide if events are independent and to approximate conditional probabilities. For example, collect data from a random sample of students in your school on their favorite subject among math, science, and English. Estimate the probability that a randomly selected student from your school will favor science given that the student is in tenth grade. Do the same for other subjects and compare the results. S.CP.5 Recognize and explain the concepts of conditional probability and independence in everyday language and everyday situations. For example, compare the chance of having lung cancer if you are a smoker with the chance of being a smoker if you have lung cancer. S.CP.6: Find the conditional probability of A given B as the fraction of B’s outcomes that also belong to A, and interpret the answer in terms of the model.
Related Standards: S.CP.1, S.CP.7
Launch (Whole Class):
Start this task by reviewing the definition of independence, then have students work in pairs to practice determining if two events are independent using data from different representations.
Explore (Small Group):
As you monitor, look for students to use their knowledge of conditional probability and the formula for independence to determine independence for each situation. Select different groups to create a poster showing how you would use a particular model to say whether two events are independent.

Discuss (Whole Class):
The goal of the whole group discussion is for students to be able to fluently write conditional probability statements, to make sense of conditional probability using the different representations they have been using throughout this module, and to determine independence of events. Using the groups you selected during the explore phase, sequence the order of how they share their problem to get out the goals of the task. For each situation, connect the formula for independence to the representation being used.
Aligned Ready, Set, Go: Probability RSG 9.6
Probability* 9.6*!
!
©"2013"MATHEMATICS"VISION"PROJECT"|"MVP"In"partnership"with"the"Utah"State"Office"of"Education"""
Licensed!under!the!Creative!Commons!Attribution4NonCommercial4ShareAlike!3.0!Unported!license"
!
!"
!
!!
Ready,'Set,'Go!'''
Ready'Topic:!End!of!year!Review!!Solve'each'of'the'quadratics'below'using'an'appropriate'method.''1.!!!!m2!+!15m!+!56!=!0! 2.!!!!5x2!–!3x!+!7!=!0!
!
3.!!!!!x2!−!10x!+!21!=!0! 4.!!!!6x2!+!7x!–!5!=!0!!
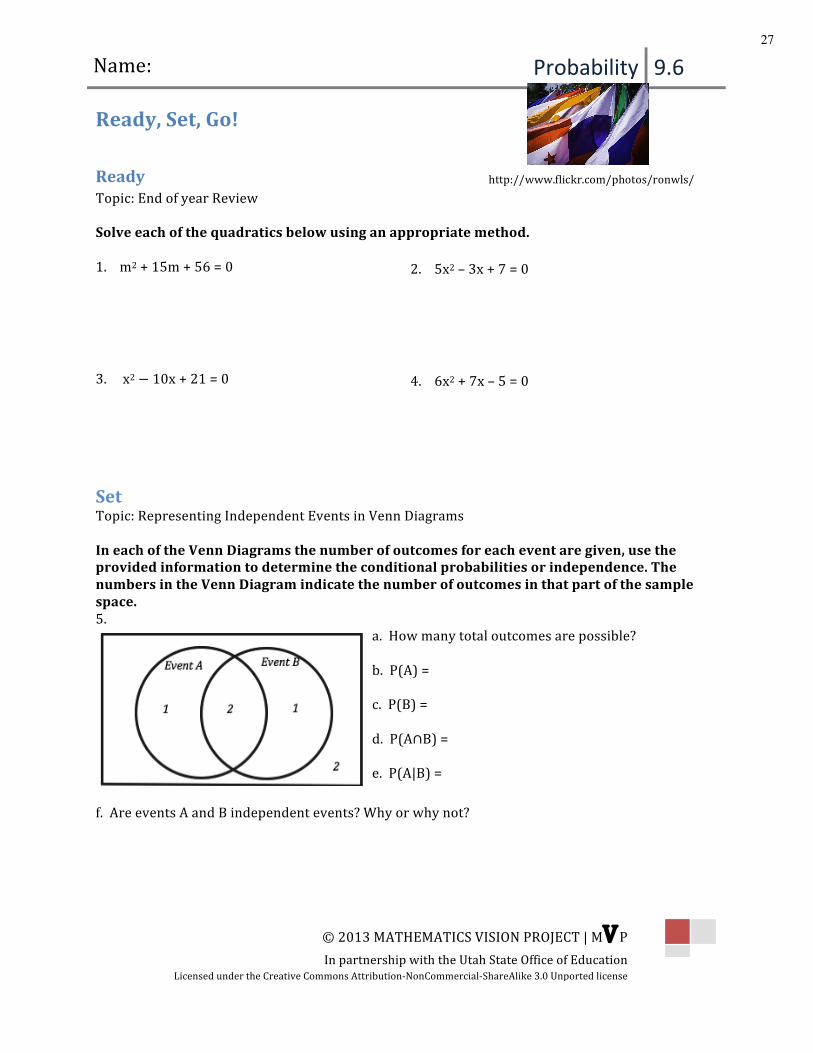
Set'Topic:!Representing!Independent!Events!in!Venn!Diagrams!!In'each'of'the'Venn'Diagrams'the'number'of'outcomes'for'each'event'are'given,'use'the'provided'information'to'determine'the'conditional'probabilities'or'independence.'The'numbers'in'the'Venn'Diagram'indicate'the'number'of'outcomes'in'that'part'of'the'sample'space.'5.!!
!!
a.!!How!many!total!outcomes!are!possible?!!b.!!P(A)!=!!c.!!P(B)!=!!d.!!P(A∩B)!=!!e.!!P(A|B)!=!!
f.!!Are!events!A!and!B!independent!events?!Why!or!why!not?!!!!!
http://www.flickr.com/photos/ronwls/!
Name:!27

Probability* 9.6*!
!
©"2013"MATHEMATICS"VISION"PROJECT"|"MVP"In"partnership"with"the"Utah"State"Office"of"Education"""
Licensed!under!the!Creative!Commons!Attribution4NonCommercial4ShareAlike!3.0!Unported!license"
!
!"
!
!!
6.!
!
a.!!How!many!total!outcomes!are!possible?!!b.!!P(E)!=!!c.!!P(F)!=!!d.!!P(E∩F)!=!!e.!!P(E|F)!=!!!
f.!!Are!events!E!and!F!independent!events?!Why!or!why!not?!!!7.!!
!
a.!!How!many!total!outcomes!are!possible?!!b.!!P(X)!=!!c.!!P(Y)!=!!d.!!P(X∩Y)!=!!e.!!P(X|Y)!=!!!
f.!!Are!events!X!and!Y!independent!events?!Why!or!why!not?!!!8.!
!
a.!!How!many!total!outcomes!are!possible?!!b.!!P(K)!=!!c.!!P(L)!=!!d.!!P(K∩L)!=!!e.!P(K|L)!=!!!
f.!!Are!events!K!and!L!independent!events?!Why!or!why!not?!!!!
28

Probability* 9.6*!
!©"2013"MATHEMATICS"VISION"PROJECT"|"MVP"In"partnership"with"the"Utah"State"Office"of"Education"""
Licensed!under!the!Creative!Commons!Attribution4NonCommercial4ShareAlike!3.0!Unported!license"
!
!"
!
!!
Go' 'Topic:!Conditional!Probability!and!Independence!!Data$gathered$on$the$shopping$patterns$during$the$months$of$April$and$May$of$high$school$students$from$Peanut$Village$revealed$the$following.$38%$of$students$purchased$a$new$pair$of$shorts$(call$this$event$H),$15%$of$students$purchased$a$new$pair$of$sunglasses$(call$this$event$G)$and$6%$of$students$purchased$both$a$pair$of$short$and$a$pair$of$sunglasses.$!9.!Find!the!probability!that!a!student!purchased!a!pair!of!sunglasses!given!that!you!know!they!purchased!a!pair!of!shorts.!P!(G|H)!=!!!10.!Find!the!probability!that!a!student!purchased!a!pair!of!shorts!or!purchased!a!new!pair!of!sunglasses.!P!(H!∪!G)!=!!!11.!Given!the!condition!that!you!know!a!student!has!purchased!at!least!on!of!the!items.!What!is!the!probability!that!they!purchased!only!one!of!the!items?!!!12.!!Are!the!two!events!H!and!G!independent!of!one!another?!Why!or!Why!not?!!!Given'the'data'collected'from'200'individuals'concerning'whether'or'not'to'extend'the'length'of'the'school'year'in'the'table'below'answer'the'questions.'!
! For' Against' No'Opinion' !Youth!(5!to!19)! 7! 35! 12! !Adults!(20!to!55)! 30! 27! 20! !Seniors!(55!+)! 25! 16! 28! !
! ! ! ! 200!!13.!Given!that!condition!that!a!person!is!an!adult!what!is!the!probability!that!they!are!in!favor!of!extending!the!school!year?!!P(For|Adult)!=!!!14.!Given!the!condition!that!a!person!is!against!extending!the!school!year!what!is!the!probability!they!are!a!Senior?!P!(Senior|Against)!=!!!15.!What!is!the!probability!that!a!person!has!no!opinion!given!that!they!are!a!youth?!!P!(no!opinion|!youth)!=!!!Need!Assistance?!Check!out!these!additional!resources:!!http://www.youtube.com/watch?v=t6G8mL0w4xM!
29