secretary brown's presentation
TRANSCRIPT
Virginia’s Budget Process, Fiscal Trends,
and Future Issues
Richard D. BrownSecretary of FinanceApril 10, 2010
2
Virginia’s Budget Process
Overview of Virginia’s Budget Process
Composition of Budget: Resources, Spending, and Budget Drivers
The Budget Shortfall and 2010 General Assembly Actions
Issues Affecting the Future – Looking Ahead

3
Overview of Virginia’s Budget

4
The Code of Virginia calls for the development of two budget documents: Executive Budget Document Budget Bill
Statute requires submission of these documents to the General Assembly by December 20
Both documents have operating and capital sections
The Budget Bill also specifically covers: Transfers General Provisions – These are conditions and
stipulations governing appropriations
Legal Requirements for the Virginia Budget

5
Each agency must have an appropriation from the General Assembly to spend money from the state treasury (State Constitution)
Individual agency heads may be held personally liable for (deficit) spending in excess of their appropriation (Appropriation Act)
The Governor must take all steps to see that spending is within revenue collections during the course of the biennium (two-year) budgetary period (State Constitution and Appropriation Act)
Legal Requirements for the Virginia Budget

6
Unique Features of the Virginia Budget
Two-year budget Year-by-year operating appropriations Movement between years
Deficits not allowed Governor’s responsibility in execution Personal liability of officials
Planning and evaluation Strategic planning initiatives Six-year capital outlay plan Consensus revenue forecasting Debt capacity model

7
Governor’s Role
As the chief planning and budget officer, the Governor prepares the biennial budget and executes it once the legislature completes its actions.
The Governor’s proposed budget bill is presented to a Joint Session of the House Appropriations and Senate Finance Committees in mid-December.
Governor gets the first “bite-at-the-apple” when allocating projected revenues. Also must propose reductions when deficits are projected.

8
Executive Agencies Involved in Budget Process
Department of Planning and Budget (DPB) analyzes agency budget requests and recommends resource needs.
Assist in developing funding strategies consistent with agency strategy plans and administration priorities.
Executes budget approved by the General Assembly.
Department of Taxation produces the revenue forecast on which the appropriations are based.
Department of Treasury develops and maintains the debt capacity model used to guide the use of debt for maintenance and construction projects.
Department of Accounts (State Comptroller) monitors spending against appropriation allotments.
9
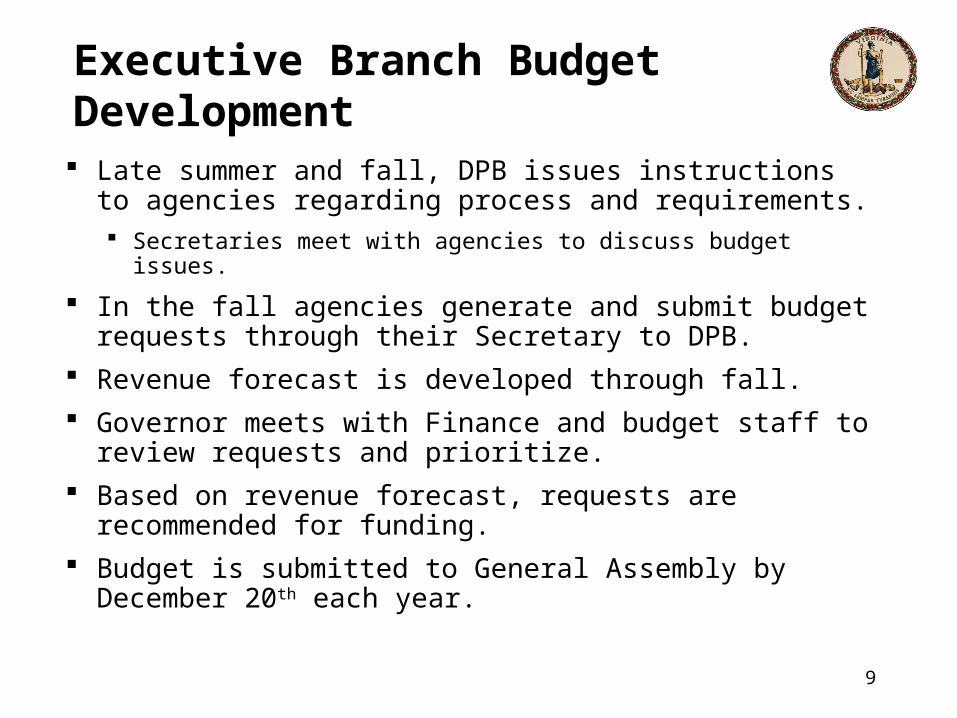
Executive Branch Budget Development Late summer and fall, DPB issues instructions to
agencies regarding process and requirements. Secretaries meet with agencies to discuss budget
issues.
In the fall agencies generate and submit budget requests through their Secretary to DPB.
Revenue forecast is developed through fall. Governor meets with Finance and budget staff to
review requests and prioritize. Based on revenue forecast, requests are
recommended for funding. Budget is submitted to General Assembly by
December 20th each year.

Many Factors and Perspectives Influence Executive Budget Development
Agencies usually have requests that exceed available resources
• Changes in regulations and laws• Automation• Increase in number of clients• Demand for services• Increases/decreases in federal funds• Traditional practices• Public sentiment• Priorities of the Governor and General Assembly The Governor must view budget as zero-sum game
and balance competing demands• Increases/decreases in available revenues• Efficiency, effectiveness and economy• Continuing need for programs and agencies• Reconcile agency requests with Governor’s priorities

11
Governor’s Campaign Promises and Budget Issues
Robb - K-12 funding/teacher salaries
Baliles - Transportation
Wilder - Fiscal Crisis
Allen - Parole Abolition and Economic Development
Gilmore - Eliminating the Car Tax
Warner - Fiscal Crisis and Tax Reform
Kaine – Preschool, Virginia Tech, and Fiscal Crisis
McDonnell – Economic Development/Job Creation and Government Reform
Governors’ initiatives are generally tied to campaign promises, the state’s economic conditions, or unforeseen events.

12
General Assembly’s Role
Like the Governor, one of the primary responsibilities of the General Assembly is to craft a budget.
The House and Senate budgets are actually amendments to the Governor’s introduced budget.
The General Assembly adds, modifies, endorses or deletes items in the Governor’s proposed budget.
The General Assembly also increases or decreases proposed funding levels.
In even-numbered years, the General Assembly enacts a two-year or biennial budget. In odd years, the House and Senate tend to address unexpected increases or decreases.

13
Legislative Budget Process
The House Appropriations, House Finance and Senate Finance Committees comprise the General Assembly’s “money committees”
Through legislation and the budget process, these committees establish the Commonwealth’s fiscal policies
House of Delegates: Duties are split between the Finance Committee (tax policy) and the Appropriations Committee (spending decisions)
Senate: Duties are combined under the Finance Committee

14
House Appropriations and Senate Finance Committees
The House Appropriations and Senate Finance Committees have full-time legislative staff assigned to them.
These non-partisan staff provide the Committees:
Independent sources of information;
Professional expertise in various budget disciplines;
Recommendations on emerging funding issues; and
Guidance on spending and revenue trends.

15
Legislative Budget ProcessBudget Deliberation
House Appropriations and Senate Finance Committees begin budget deliberations in October and November
o Hold Committee “retreats” to examine fiscal outlook and issues driving budget decisions
After receiving Governor’s introduced budget, Committees hold 4-5 regional public hearings on budget in early January
Budget amendment requests by General Assembly members made to Committees usually by second full week of Session
Subcommittees review agency budgets and amendment requests.
Committees act on Subcommittee Reports
Committees send budget bill with amendments to the House and Senate Floors for adoption

16
Legislative Budget ProcessFinalizing the Budget Once each House adopts its version of the budget,
bills are sent to opposite house Committee of conference is appointed
Provides opportunities to correct mistakes and get additional input
Budget conferees resolve differences between House and Senate budgets
Conference committee report is sent back to House and Senate floors for final approval – up or down vote
Adopted budget sent to Governor for signature Governor’s amendments or vetoes considered during
Reconvened (Veto) Session

17
Virginia’s Budget ProcessTimeline of Important Dates
NovemberGovernor, DPB,Cabinet review
Develop revenue forecast
SeptemberAgencies
generate &submit requests
AugustDPB issues
instructions toagencies
DecemberGovernor submits
document &bill to GA
AprilGovernor signs/vetoes/
or returns items toGA with amendments
MarchConference Committeereports budget bill(s)/GA approves budget
FebruarySenate & Houseproduce separatebudget proposals
JanuaryBudget billsreferred to
money committees
Budget Development
Agency Budget Preparation Review & Recommendation
Budget Deliberation
Legislative Action Gov’s Review

18
State agencies
Legislative commissions
Legislators
Interest groups
Other studies/ events
Governor (Introduced
budget)
Conference Committee
(Final agreement)
House
Senate
Virginia’s Budget ProcessWhen and How to Influence the Process?
January
Testify at public hearings
on budget
Budget Development
Budget Deliberation
January - February
Attend committee hearings/request
budget amendments
Budget Decisions
April - December
Discuss issues and concerns/develop and communicate message
February - March
Make phone calls, send letters, and schedule
visits
Budget Demands

19
Conclusion: Budget Process
• Virginia’s budget process begins in the fall not in January
• Introduced budget is the starting point for discussion
• Based on its priorities, General Assembly makes any changes to the introduced budget in January and February (incremental process)
• Mandatory spending and short sessions tend to confine budgetary changes to the margin

20
Composition of Budget:Resources, Spending
& Budget Drivers

21
2008-2010 Budget:General Fund vs. Nongeneral Fund
Data from 2009 Appropriation Act (Chapter 780 )
General Fund
41.2%
Nongeneral Fund
58.8%

22
General Fund Revenues for 2008-2010
Economic trends are important because employment, wage gains, and consumer spending account for about 91 percent of all general fund revenues.
2008-2010 general fund revenues = $29.9 billion
Data does not include transfers or balances. Data from 2009 Appropriation Act
Individual income tax66.0%
Other taxes & revenue8.8%
Corporate income tax4.7%
Sales & use taxes20.5%

23
Nongeneral Fund Revenues for 2008-2010
Federal grants account for almost 40% of all nongeneral funds revenue
“Transportation” includes fuel tax, sales tax, motor vehicle sales tax, and motor vehicle licenses.Data does not include balances or bond proceeds. Data from Chapter 780, 2009 Appropriation Act.
2008-2010 nongeneral fund revenues = $41.4 billion
Transportation 10.3%Institutional revenue from higher education
tuition & fees and hospitals 21.7%
Other revenue 29.4%Federal grants
& contracts 38.6%

24
Where the Money Goes 2008-2010 (All Funds) = $74.9 Billion
Commerce and Trade2.7%
General Government
7.2%
Health and Human
Resources27.7%
Public Safety7.0%
Transporation12.1%
Other4.0%
Education39.4%
79.2% of the budget (all funds) goes to education, health and human resources, and transportation
“Other” includes legislative and judicial branches, technology, natural resources, independent agencies, and non-state agencies.
Source: Department of Planning and Budget April 2009. Data from 2009 Appropriation Act (Chapter 780) (operating only).
25
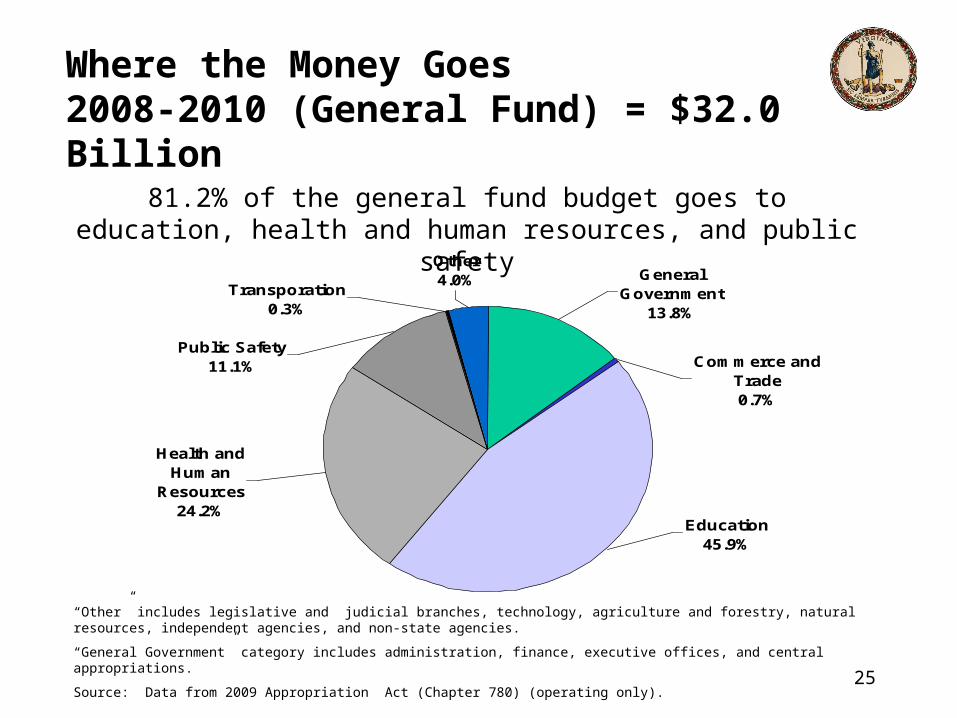
Where the Money Goes 2008-2010 (General Fund) = $32.0 Billion
Education45.9%
Other4.0%
Transporation0.3%
Public Safety11.1%
Health and Human
Resources24.2%
General Government
13.8%
Commerce and Trade0.7%
81.2% of the general fund budget goes to education, health and human resources, and public safety
“Other” includes legislative and judicial branches, technology, agriculture and forestry, natural resources, independent agencies, and non-state agencies.
“General Government” category includes administration, finance, executive offices, and central appropriations.
Source: Data from 2009 Appropriation Act (Chapter 780) (operating only).

26
Almost Half of the General FundOperating Budget Goes to Localities
Local Sheriffs$955.96.1%
Other Aid to Localities$1,964.312.5%
Car Tax$1,900.012.7%
Public Education$10,949.3
69.4%
State Programs$8,907.927.2%
Debt Service$957.32.9%
Aid to individuals$7,125.021.7%
Aid to Localities$15,769.6
48.1%
*Total GF Operating $32,759.7 million; HB1600 Introduced.
27
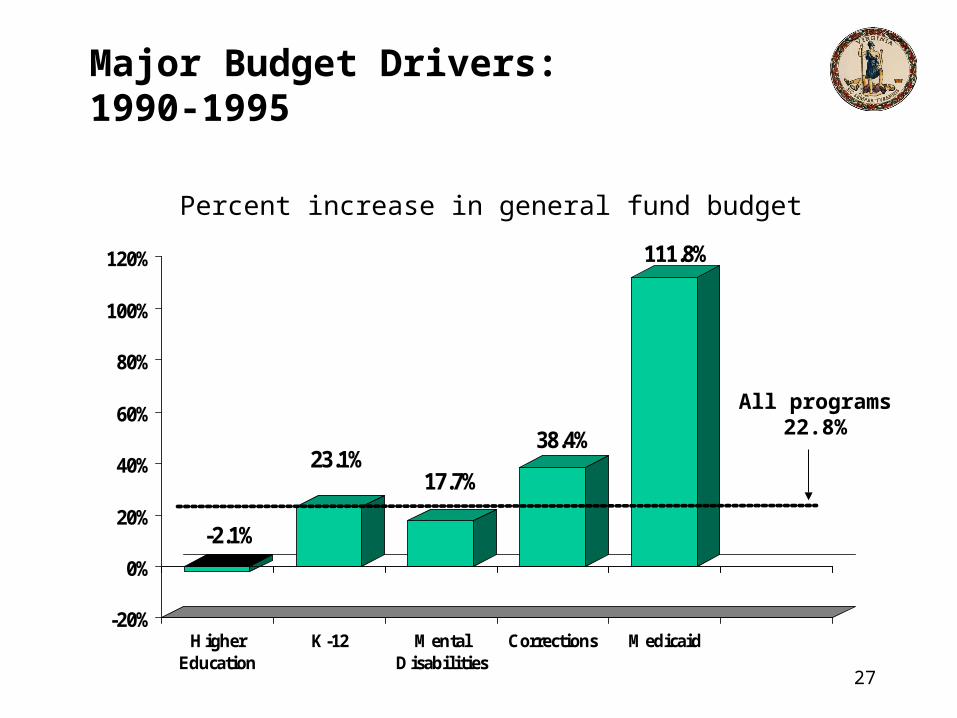
Major Budget Drivers: 1990-1995
-2.1%
23.1%17.7%
38.4%
111.8%
-20%
0%
20%
40%
60%
80%
100%
120%
HigherEducation
K-12 MentalDisabilities
Corrections Medicaid
All programs 22.8%
Percent increase in general fund budget

28
Major Budget Drivers: 1995-2000
54.9%
40.7% 40.1% 40.2%
27.7%
0%
10%
20%
30%
40%
50%
60%
HigherEducation
K-12 MentalDisabilities
Corrections Medicaid
All programs 50.8%
Percent increase in general fund budget

29
Major Budget Drivers: 2000-2005
-1.6%
28.7% 28.3%
20.1%
37.5%
-5%
0%
5%
10%
15%
20%
25%
30%
35%
40%
HigherEducation
K-12 MentalDisabilities
Corrections Medicaid
All programs 24.2%
Percent increase in general fund budget

30
Major Budget Drivers: 2005 - 2010
14.1%
38.4%
6.5%11.1%
22.1%
0%
5%
10%
15%
20%
25%
30%
35%
40%
HigherEducation
K-12 MentalDisabilities
Corrections Medicaid
All programs 15.0%
Percent increase in general fund budget
* For purposes of this slide, the FY 2010 appropriation base is CH 781, 2009 Acts of the Assembly.

31
Major Budget Drivers: 2010 - 2012
-14.0%
-2.1%
-29.5%-5.8%
64.3%
-30%
-20%
-10%
0%
10%
20%
30%
40%
50%
60%
70%
HigherEducation
K-12 MentalDisabilities
Corrections Medicaid
All programs (1.4%)
Percent increase in general fund budget
* For purposes of this slide, the FY 2010 appropriation base is CH 781, 2009 Acts of the Assembly. The FY 2012 appropriation base is from HB/SB 30 as introduced.

32
Major Budget Drivers: 2005 - 2012
3.7%11.7%
-17.2%
14.0%
111.8%
129.9%
-20%
0%
20%
40%
60%
80%
100%
120%
140%
HigherEducation
K-12 MentalDisabilities
Corrections Medicaid All Other
All programs 13.3%
Percent increase in general fund budget

33
Budget DriversFY 1985
K-12 $1,355,514,703
36.1%
All Other $1,078,603,451
28.7%
Medicaid $202,916,420
5.4%
Corrections $276,877,715
7.4%
HiED $627,012,547
16.7%Mental Disabilities $212,605,320
5.7%
Per CH 221

34
HiED $1,462,058,381
9.4%
K-12 $5,270,628,823
33.8%
All Other $3,676,731,092
23.5%
Medicaid $3,333,818,121
21.3%
Corrections $1,236,383,992
7.9%
Mental Disabilities $636,432,558
4.1%
Budget DriversFY 2012
Per HB 30 as introduced

35
Medicaid Enrollment & Expenditures, FY 2008
Children
Children
Adults
Adults
Blind & Disabled
Blind & Disabled
AgedAged
Recipients Expenditures
9%
20%
16%
55%
20%
47%
10%
23%
Budget Driver: Medicaid
Department of Planning and Budget, 2008.

36
The Budget Shortfalland
2010 General Assembly Actions

37
Total General Fund Revenue Collections Collapsed in the Second Half of Fiscal Year 2009
• Collections declined an unprecedented eleven consecutive months in fiscal year 2009.
• For the second half of fiscal year 2009:– Payroll withholding tax collections fell 1.0 percent;– Individual nonwithholding declined 24.8 percent;– Individual refunds increased 17.0 percent;– Sales tax collections declined 5.9 percent;– Corporate income tax receipts fell 19.0 percent, and;– Recordation taxes declined 16.8 percent.
Growth in Total General Fund Revenue CollectionsFY09 Monthly and Year-to-Date
2.9%
-4.2%-3.5% -3.7% -3.5%
-5.5%-6.8%
-8.6%-9.3% -9.2%
-6.1%
-1.9%
-24%
-20%
-16%
-12%
-8%
-4%
0%
4%
8%
Jul Aug Sep Oct Nov Dec Jan Feb Mar Apr May Jun
Monthly Year-to-Date
Forecast: -7.3%
Monthly Growth: 2.9% -6.6% -7.4% -1.0% -4.6% -2.6% -15.0% -13.6% -13.9% -19.7% -15.6% -8.0%

38
Fiscal Year 2009 Revenue and Transfer Collections Finished $299.2 Million - (2.0 Percent) Below Forecast
• The major driver of the fiscal year 2009 revenue shortfall was unexpected growth in individual refunds.
– Compared to fiscal year 2008, TAX issued 28.8 percent more refunds between April and June, with June’s total 110.2 percent above the prior year.
• Withholding and sales tax collections (83 percent of total revenues) finished a combined 0.6 percent below forecast.
• The three most volatile sources – individual nonwithholding, corporate income tax, and wills – finished 1.8 percent below the official forecast for the three sources.
Summary of Fiscal Year 2009 Revenue Collections(millions of dollars)
Major Source
Withholding $ 9,154.0 $ 9,138.1 $ (15.9) (0.2) % 2.3 %Nonwithholding 2,348.3 2,310.4 (37.9) (1.6) (19.2)Refunds (1,805.0) (1,967.4) (162.4) 9.0 17.1 Net Individual 9,697.3 9,481.1 (216.2) (2.2) (6.3)
Sales 2,960.9 2,903.4 (57.5) (1.9) (5.6)Corporate 685.0 648.0 (37.0) (5.4) (19.8)Wills (Recordation) 298.1 314.3 16.2 5.4 (31.1)Insurance 257.5 255.0 (2.5) (1.0) (35.7)All Other Revenue 715.1 713.2 (1.9) (0.3) (22.1)
Total Revenues $ 14,613.9 $ 14,315.1 $ (298.8) (2.0) % (9.2) %
ABC Profits 36.6 44.1 7.5 20.5 22.2Sales Tax (0.25%) 222.1 213.4 (8.7) (3.9) (5.8)Transfers 148.2 149.0 0.8 0.5 62.7
Total Transfers $ 406.9 $ 406.5 $ (0.4) (0.1) % (50.0) %
Total General Fund $ 15,020.8 $ 14,721.6 $ (299.2) (2.0) % (11.2) %
VarianceForecast Actual Dollars Percent Growth
Annual

39
The Governor Ordered the Secretary of Finance in Mid-June to Conduct a Reforecast of Revenues
• As part of the reestimation process, the Governor’s Advisory Board of Economists (GABE) met July 14th to discuss the economic outlook for fiscal year 2010 and the next biennium.– Recommendations from the Board, primarily downward adjustments to
employment and income growth over the next three fiscal years, were incorporated into the Global Insight June 2009 standard economic outlook.
• The June 2009 GABE economic forecast and associated revenue forecast were presented to the Governor’s Advisory Council on Revenue Estimates (GACRE) on August 5th.– The GACRE was more pessimistic than the baseline scenario. As a result,
the interim revenue forecast relied on a blend of the standard and pessimistic outlooks.
• However, over 80% of general fund revenues (withholding, sales, and corporate income tax) were based on the pessimistic alternative scenario.
• Governor Kaine released the interim revenue forecast on August 19, 2009, reducing revenues by $1.2 billion for fiscal year 2010.

40
Global Insight’s October Forecast for the National Economy Says – “Growth Is Back – Jobs Are Not”
• Global Insight expects a prolonged U-shaped recovery.
• Lackluster consumer demand prevents a V-shaped recovery.
• Employment is expected to bottom out in the first half of calendar year 2010.
Key U.S. Economic Indicators Interim and October Forecasts
Annual Percent Change
08 09 10 11 12Real GDP
Interim (Jun '09) 2.4 (1.7) (3.0) 1.0 2.9Oct Standard 2.2 (2.2) 0.4 2.3 3.5Oct Pessimistic (0.7) 0.3 2.6
Consumer SpendingInterim (Jun '09) 1.9 (1.3) (0.7) 0.8 0.5Oct Standard 1.5 (1.4) 0.7 2.2 2.4Oct Pessimistic 0.2 0.5 0.7
EmploymentInterim (Jun '09) 0.6 (2.3) (3.5) (0.6) 1.6Oct Standard (2.3) (2.9) 1.0 2.3Oct Pessimistic (3.3) (0.3) 1.5
Personal IncomeInterim (Jun '09) 5.3 1.6 (0.9) 1.3 4.4Oct Standard 4.5 (0.1) (0.2) 3.8 4.6Oct Pessimistic (0.8) 2.0 4.0
Fiscal Year

41
In the October Standard Economic Outlook for Virginia, the Economy Begins Recovery Earlier and Grows A Bit Faster Than in the Interim Forecast
• The U-shaped growth path for Virginia is slightly deeper with a mildly stronger recovery.
• Revenue model drivers – employment and income – are similar to interim estimates for FY 2010.
Key Virginia Economic Indicators Interim and October Forecasts
Annual Percent Change
08 09 10 11 12Employment
Interim (Jun '09) 0.6 (1.4) (2.1) (0.4) 0.9Oct Standard 0.5 (1.3) (2.3) 1.1 2.1Oct Pessimistic (2.6) (0.0) 1.2
Personal IncomeInterim (Jun '09) 4.5 2.6 0.5 1.4 4.0Oct Standard 4.5 1.1 1.6 3.0 3.7Oct Pessimistic 1.3 2.0 3.4
Wages & SalariesInterim (Jun '09) 4.4 2.8 1.0 1.5 3.4Oct Standard 3.9 0.7 0.4 3.0 3.7Oct Pessimistic 0.1 2.0 2.9
Average WageInterim (Jun '09) 3.8 4.3 3.2 1.9 2.5Oct Standard 3.4 2.0 2.7 1.9 1.6Oct Pessimistic 2.8 2.0 1.6
Fiscal Year

42
Pending Home Sales
Seasonally-adjusted 2-quarter moving average
0
2,000
4,000
6,000
8,000
10,000
12,000
14,000
16,000
99q1 99q3 00q1 00q3 01q1 01q3 02q1 02q3 03q1 03q3 04q1 04q3 05q1 05q3 06q1 06q3 07q1 07q3 08q1 08q3 09q1 09q3
0
2,000
4,000
6,000
8,000
10,000
12,000
14,000
16,000
Northern Virginia Hampton Roads Richmond38% 21% 11%
Northern Virginia
Hampton Roads
Richmond
(% share of total home sales in Virginia)
Average Sale Price2008 Q4 2009 Q4 % Growth
Northern Virginia $340,757 $381,908 12%Hampton Roads 258,227 240,680 -7%Richmond 251,586 230,064 -9%

43
Payroll Withholding andEmployment Growth
-15.0
-10.0
-5.0
0.0
5.0
10.0
15.0
20.0
Jan-92 Jan-93 Jan-94 Jan-95 Jan-96 Jan-97 Jan-98 Jan-99 Jan-00 'Jan-01 'Jan-02 'Jan-03 'Jan-04 'Jan-05 'Jan-06 'Jan-07 'Jan-08 'Jan-09 'Jan-10-6.0
-4.0
-2.0
0.0
2.0
4.0
6.0
8.0
Withholding (L) Original Revised
3-month Moving Average

44
Sales Tax and Employment Growth
-15.0
-10.0
-5.0
0.0
5.0
10.0
15.0
20.0
Jan-92 Jan-93 Jan-94 Jan-95 Jan-96 Jan-97 Jan-98 Jan-99 Jan-00 'Jan-01 'Jan-02 'Jan-03 'Jan-04 'Jan-05 'Jan-06 'Jan-07 'Jan-08 'Jan-09 'Jan-10-6.0
-4.0
-2.0
0.0
2.0
4.0
6.0
8.0
Sales Tax (L) Original Revised
3-month Moving Average

45
Economists and Business Leaders Were Mixed on the Most Probable Path for the Economy and General Fund Revenues
• The Governor’s Advisory Board of Economists (GABE) met October 14th to review Global Insight’s standard and pessimistic alternative forecasts.– The members were about evenly split, with five choosing the Global
Insight standard, five choosing the pessimistic alternative scenario, and one choosing an economic path somewhere in between the two.
• The Governor’s Advisory Council on Revenue Estimates (GACRE) met November 23rd to review revenue projections based on the standard and pessimistic alternative forecasts.– The business leaders were split on the forecasts, with six supporting
the October standard forecast, three supporting the pessimistic alternative scenario, and four choosing “standard minus.”
– Members of the General Assembly who attended the meeting expressed pessimism; however, most supported projections from their respective staffs which were consistent with the standard forecast presented to the GACRE.
46
The December General Fund Revenue Forecast Reflects the Sentiment of the Advisory Boards
• The standard forecast presented to the GACRE included downward adjustments from the August interim forecast totaling $229.8 million for fiscal year 2010.– The reduction included downward revision to withholding and
increased projections for individual refunds, consistent with the revised economic forecast and year-to-date collections.
• Based on members’ comments and near-term pessimism, the outlook for fiscal year 2010 was reduced further to a level consistent with the pessimistic alternative forecast.– In addition to reductions to withholding and increased projections for
individual refunds, the December forecast includes a reduction in nonwithholding.
• The total general fund revenue reduction for fiscal year 2010 is $340.0 million.
• The outlook for the 2010-12 biennium is based on the standard economic outlook.
47
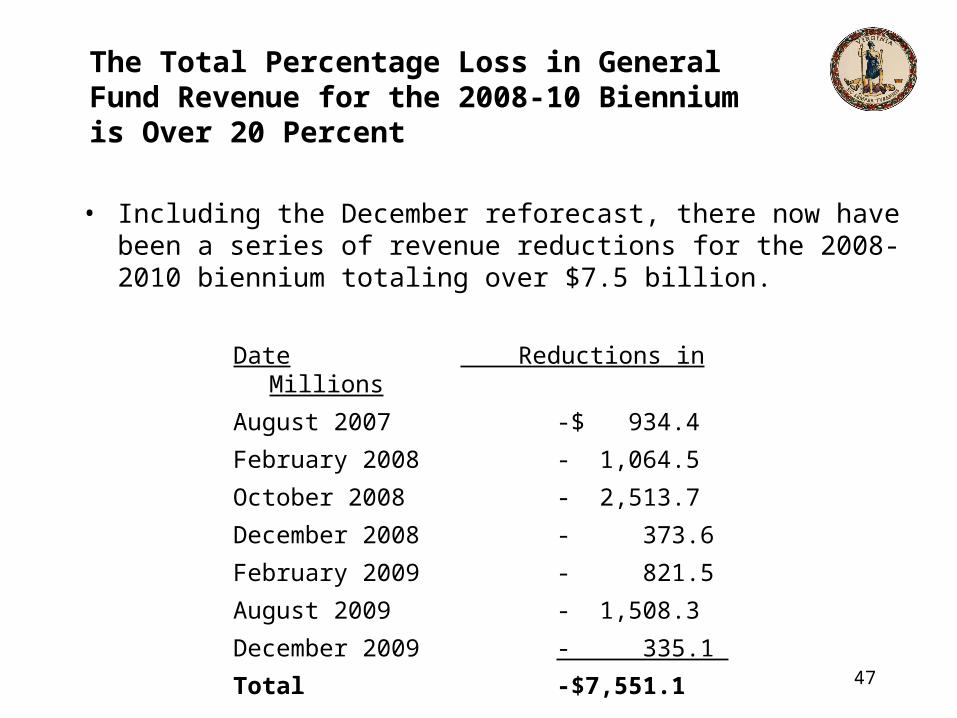
The Total Percentage Loss in General Fund Revenue for the 2008-10 Biennium is Over 20 Percent
• Including the December reforecast, there now have been a series of revenue reductions for the 2008-2010 biennium totaling over $7.5 billion.
Date Reductions in Millions
August 2007 -$ 934.4
February 2008 - 1,064.5
October 2008 - 2,513.7
December 2008 - 373.6
February 2009 - 821.5
August 2009 - 1,508.3
December 2009 - 335.1
Total -$7,551.1
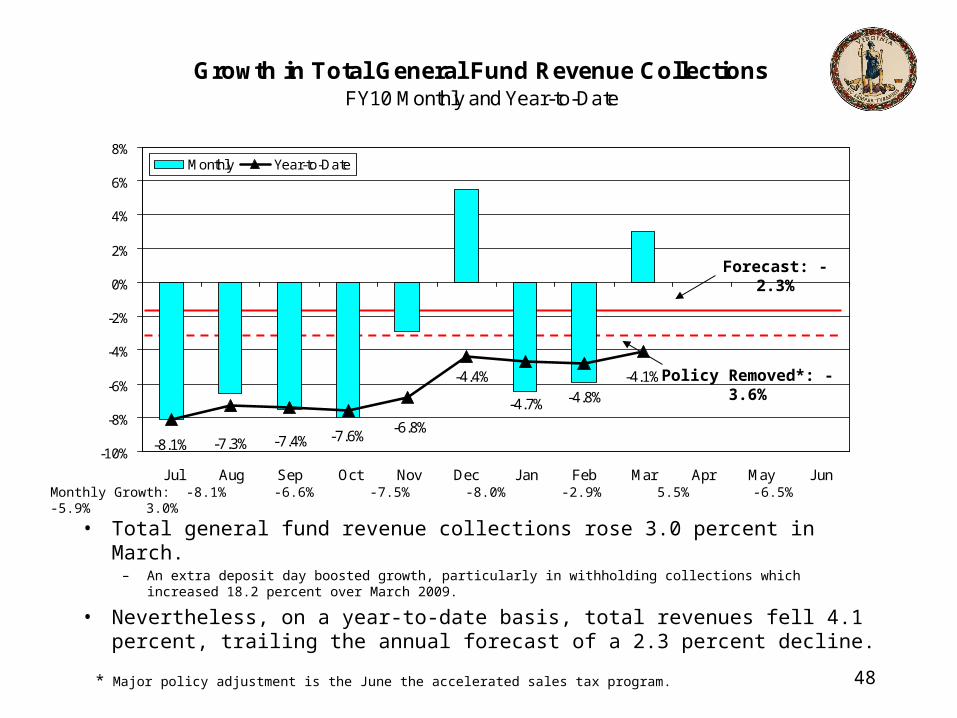
• Total general fund revenue collections rose 3.0 percent in March.
– An extra deposit day boosted growth, particularly in withholding collections which increased 18.2 percent over March 2009.
• Nevertheless, on a year-to-date basis, total revenues fell 4.1 percent, trailing the annual forecast of a 2.3 percent decline.
Growth in Total General Fund Revenue CollectionsFY10 Monthly and Year-to-Date
-8.1%-7.6%
-4.1%
-4.7%
-6.8%
-4.4%
-7.4%
-4.8%
-7.3%-10%
-8%
-6%
-4%
-2%
0%
2%
4%
6%
8%
Jul Aug Sep Oct Nov Dec Jan Feb Mar Apr May Jun
Monthly Year-to-Date
Forecast: -2.3%
Monthly Growth: -8.1% -6.6% -7.5% -8.0% -2.9% 5.5% -6.5% -5.9% 3.0%
Policy Removed*: -3.6%
* Major policy adjustment is the June the accelerated sales tax program. 48

49
Growth in Total General Fund Revenues
Fiscal Year 1961 - Fiscal Year 2012
(Nominal - Actual Dollars)
FY Total Revenues Growth FY Total Revenues Growth
61 230,998,887 - 87 4,590,434,000 11.1%
62 242,144,567 4.8% 88 5,054,382,000 10.1%
63 286,304,265 18.2% 89 5,478,912,000 8.4%
64 298,033,919 4.1% 90 5,494,884,000 0.3%
65 323,213,412 8.4% 91 5,471,879,000 -0.4%
66 365,129,776 13.0% 92 5,623,213,000 2.8%
67 414,755,644 13.6% 93 6,133,637,000 9.1%
68 533,597,744 28.7% 94 6,503,368,000 6.0%
69 706,254,374 32.4% 95 6,881,145,000 5.8%
70 743,721,322 5.3% 96 7,356,110,000 6.9%
71 807,954,651 8.6% 97 7,949,327,000 8.1%
72 922,653,686 14.2% 98 8,773,520,000 10.4%
73 1,054,469,443 14.3% 99 9,702,747,000 10.6%
74 1,168,562,871 10.8% 00 10,788,482,000 11.2%
75 1,303,178,893 11.5% 01 11,105,275,000 2.9%
76 1,428,421,157 9.6% 02 10,678,954,000 -3.8%
77 1,636,301,819 14.6% 03 10,867,149,000 1.8%
78 1,923,085,084 17.5% 04 11,917,867,000 9.7%
79 2,115,211,522 10.0% 05 13,687,252,000 14.8%
80 2,344,928,934 10.9% 06 14,834,298,000 8.4%
81 2,579,663,941 10.0% 07 15,565,827,000 4.9%
82 2,796,458,741 8.4% 08 15,766,951,000 1.3%
83 2,975,687,935 6.4% 09 14,315,060,000 -9.2%
84 3,397,710,261 14.2% 10* 13,987,600,000 -2.3%
85 3,790,816,000 11.6% 11* 14,582,300,000 4.3%
86 4,131,778,000 9.0% 12* 15,313,300,000 5.0%
* March 14, 2010 Post-GA Forecast (Excludes Transfers)

50
• When new spending requirements are added, the total general fund shortfall increases to $1.8 billion in FY 2010 and to $4.5 billion in the 2010-2012 biennium
*Amounts shown in millions
FY 2010 FY 2011 FY 2012GF Resource base per CH 781 15,755.4$ 15,755.4$ 15,755.4$ Adjust - August Interim Forecast (1,209.1) (809.4) (30.7) Adjust - December Forecast (335.1) (278.6) (308.1) Available GF Resources 14,211.2 14,667.4 15,416.6
Less:Spending Base per CH 781 (15,844.0) (15,845.4) (15,845.4) New Spending - Operating (154.9) (989.2) (1,850.2) New Spending - Capital - (39.2) - GF Spending Requirements (15,998.9) (16,873.8) (17,695.6)
Net Shortfall (1,787.7)$ (2,206.4)$ (2,279.0)$
Budget Shortfall 2010-2012 Biennium

51
Medicaid and Public Education Continue to Dominate the Majority of New GF Spending Requirements in the 2010-2012 Biennium
*Amounts shown in millions
Description of Action
Backfill Medicaid program due to loss of federal stimulus matching funds $ 1,191.49
Fund Medicaid utilization and inflation 777.7
Fund debt service requirements 165.7
Rebenchmark Standards of Quality (SOQ) costs (includes enrollment update) 143.8
Eliminate aid to locality reductions 100.0
Adjust support for Virginia Retirement System payments 89.5
Provide funding for the state employee health insurance program 84.6 Reserve funding for an anticipated mandatory deposit to the Revenue Stabilization Fund in FY 2013 40.0
Delay the update of the composite index for direct aid programs until FY 2012 39.0
Adjust funding for the Health Care Fund 32.6 Provide additional funding for state mental health and mental retardation facility Medicaid costs 31.9
Fund medical assistance services for low-income children utilization and inflation 26.6 2,723.0 94.6%
Other General Fund Spending 151.3 5.3%
Base and technical spending 5.0 0.2%
Total of All General Fund Spending $ 2,879.3
Biennial Spending

52
• 83 Percent of the Additional GF Savings Actions Recommended in the 2010-2012 Biennium Appear in the Top Ten Strategies
*Amounts shown in millions
Description of Action
Eliminate reimbursements for personal property tax relief $ 1,900.0
Fund health care costs in Standards of Quality based on actual plan participation 269.2
Implement policy changes to the Standards of Quality model 174.2
Utilize State Fiscal Stabilization Funds for general fund supported programs in K-12 126.4
Reduce HB599 funding 88.4
Withhold inflation adjustments from hospital operating rates 76.0
Eliminate state support for retirement and life insurance premiums to constitutional offices 61.6
Require state employees to pay a portion of retirement contributions 55.7
Reduce income limits for optional 300 percent Supplemental Security Income eligibility group 53.3
Postpone mandated increase in annual Mental Retardation and Developmental Disability waiver slots 39.2 2,844.0 82.9%
All Other Reduction Strategies 587.6 17.1%
Total of Additional Savings Actions Since September $ 3,431.6
Biennial Savings
Introduced Budget Bill

Savings Items in Enrolled Budget Bill
53
Item DescriptionGeneral Fund
FY 2011 FY 2012 Total132 Misc. K-12 Savings - See Below for Breakout ($249,585,541) ($230,501,503) ($480,087,044)132 #19c K-12 VRS Rates - Note 1 ($188,992,393) ($156,822,961) ($345,815,354)
297 Medicaid Reductions ($60,475,451) ($163,362,724) ($223,838,175)473.10 #1c Aid to locality reversion clearing account ($60,000,000) ($60,000,000) ($120,000,000)
297 #5c Reduce GF Share of Medicare Part D "Clawback" Payment ($85,736,111) $0 ($85,736,111)469 #7c Eliminate Funding for Second Year Health Insurance Premiums $0 ($37,231,433) ($37,231,433)297 #13c Adjust Funding for Virginia Health Care Fund (Tobacco Taxes) ($9,000,000) ($9,000,000) ($18,000,000)C-84 #1c Maintenance Reserve ($15,000,000) $0 ($15,000,000)271 #1c Treasury Board OS Fee ($7,221,523) ($7,221,523) ($14,443,046)297 #7c FMAP-Indigent Care Funding at State Teaching Hospitals ($7,100,000) ($7,100,000) ($14,200,000)379 #4c Potential Correctional Facility Closure ($1,307,733) ($10,954,446) ($12,262,179)137 #2c Reduction to the Tuition Assistance Grant (TAG) Program ($5,000,000) ($5,000,000) ($10,000,000)351 #3c Reduce Funding for Agricultural Best Management Practices ($5,000,000) ($5,000,000) ($10,000,000)
473.10 #2c Higher Education Reversion Clearing Account $0 ($10,000,000) ($10,000,000)271 #2c Higher Education Equipment Trust Fund Debt $0 ($8,334,167) ($8,334,167)
SUBTOTAL - TOP 15 GENERAL FUND SAVINGS (87% of total savings) ($694,418,752) ($710,528,757) ($1,404,947,509)
ALL OTHER - GENERAL FUND SAVINGS ($99,470,986) ($112,770,114) ($212,241,100)
TOTAL - GENERAL FUND SAVINGS (Less Comp Board related net zero) ($793,889,738) ($823,298,871) ($1,617,188,609)
Note 1 Does not include $504M in NGF Revenues (State Employee Retirement and other VRS administered savings) over the biennium.
K-12 Savings include the following:
Item DescriptionGeneral Fund
FY 2011 FY 2012 Total132 #20c K-12: Lottery ($87,256,683) ($77,514,188) ($164,770,871)132 #12c K-12: Include Zero Values for Non-personnal & Transportation for LWA in Support Costs ($39,197,951) ($39,525,220) ($78,723,171)132 #3c K-12: Technical - Use Fiscal & Contractual Div ADM for combined divisions ($24,458,371) ($24,712,726) ($49,171,097)132 #14c K-12: Eliminate Leases, Rental & Facility Costs ($20,221,733) ($20,206,203) ($40,427,936)132 #21c K-12: Textbooks ($15,572,268) ($18,487,237) ($34,059,505)132 #10c K-12: Modify Federal Deduct for Percent Funded Support Costs ($16,980,132) ($17,028,693) ($34,008,825)132 #13c K-12: Eliminate Staff Travel Costs ($14,439,393) ($14,617,019) ($29,056,412)132 #17c K-12: Update School Bus Replacement ($9,758,835) ($9,619,372) ($19,378,207)132 #1c K-12: Technical - Correct SOQ Model for Regional Centers ($8,700,175) ($8,790,845) ($17,491,020)132 #11c K-12: Program Additional Literary Funds for VRS Payments ($13,000,000) $0 ($13,000,000)
TOTAL K-12 SAVINGS $ (249,585,541) $ (230,501,503) $ (480,087,044)
General Assembly Actions
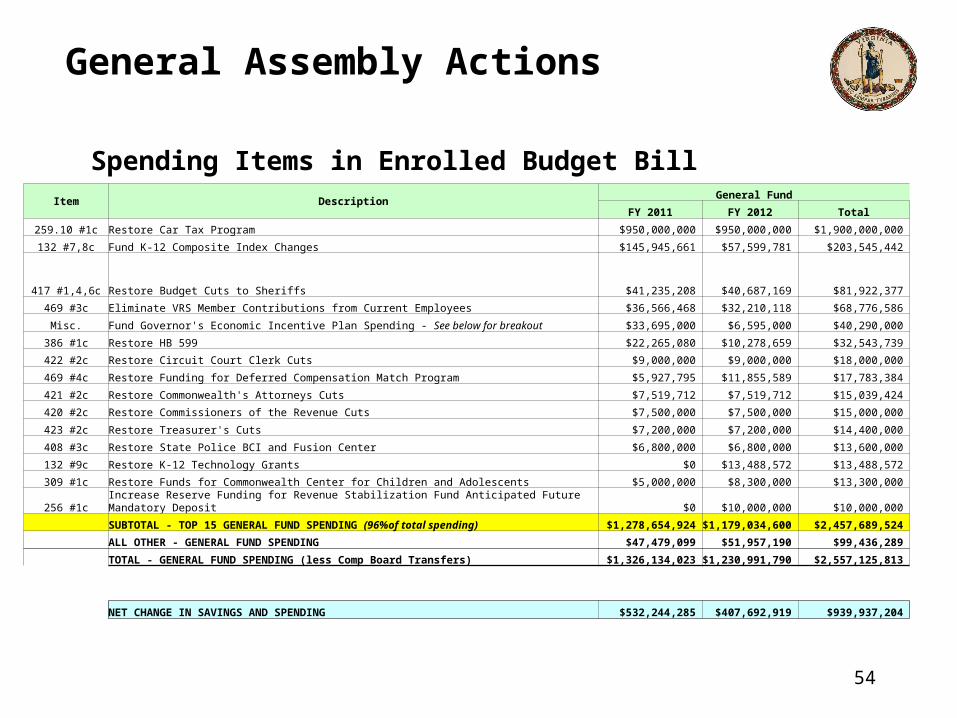
Spending Items in Enrolled Budget Bill
54
Item DescriptionGeneral Fund
FY 2011 FY 2012 Total
259.10 #1c Restore Car Tax Program $950,000,000 $950,000,000 $1,900,000,000
132 #7,8c Fund K-12 Composite Index Changes $145,945,661 $57,599,781 $203,545,442
417 #1,4,6c Restore Budget Cuts to Sheriffs $41,235,208 $40,687,169 $81,922,377
469 #3c Eliminate VRS Member Contributions from Current Employees $36,566,468 $32,210,118 $68,776,586
Misc. Fund Governor's Economic Incentive Plan Spending - See below for breakout $33,695,000 $6,595,000 $40,290,000
386 #1c Restore HB 599 $22,265,080 $10,278,659 $32,543,739
422 #2c Restore Circuit Court Clerk Cuts $9,000,000 $9,000,000 $18,000,000
469 #4c Restore Funding for Deferred Compensation Match Program $5,927,795 $11,855,589 $17,783,384
421 #2c Restore Commonwealth's Attorneys Cuts $7,519,712 $7,519,712 $15,039,424
420 #2c Restore Commissioners of the Revenue Cuts $7,500,000 $7,500,000 $15,000,000
423 #2c Restore Treasurer's Cuts $7,200,000 $7,200,000 $14,400,000
408 #3c Restore State Police BCI and Fusion Center $6,800,000 $6,800,000 $13,600,000
132 #9c Restore K-12 Technology Grants $0 $13,488,572 $13,488,572
309 #1c Restore Funds for Commonwealth Center for Children and Adolescents $5,000,000 $8,300,000 $13,300,000
256 #1c Increase Reserve Funding for Revenue Stabilization Fund Anticipated Future Mandatory Deposit $0 $10,000,000 $10,000,000
SUBTOTAL - TOP 15 GENERAL FUND SPENDING (96%of total spending) $1,278,654,924 $1,179,034,600 $2,457,689,524
ALL OTHER - GENERAL FUND SPENDING $47,479,099 $51,957,190 $99,436,289
TOTAL - GENERAL FUND SPENDING (less Comp Board Transfers) $1,326,134,023 $1,230,991,790 $2,557,125,813
NET CHANGE IN SAVINGS AND SPENDING $532,244,285 $407,692,919 $939,937,204
General Assembly Actions

55
Issues Affecting the Future
Looking Ahead

Application of Federal Medical Assistance Percentage (FMAP)
• The Medicaid Program is a state/federal health insurance program for the indigent
• Costs are shared based on FMAP• The normal split for Virginia is 50% state, 50% federal• The Federal Stimulus Program raised the federal percentage for all
states for the period October 1, 2008 to December 31, 2010 (Virginia’s matching rate is now 39% state, 61% federal)
• Different pieces of legislation, passed by US House/US Senate have proposed extending the more generous FMAP federal rate for another 6 months (through June 30, 2011)
• States are now budgeting for this change even though no single bill has passed both US House/US Senate.
• Virginia has a $417 million contingent appropriation to distribute additional FMAP savings, if enacted. The contingent appropriation would seem to play it safe.
• But,
56

Federal Health Care Reform• The Federal Health Care Reform Program contains a permanent
“Maintenance of Eligibility (MOE)” provision for basic Medicaid services and the Children’s Health Insurance Program (CHIP).
• Because of budget reductions, Virginia will only meet the MOE if the FMAP extension is enacted. (The contingent appropriation will restore enough to satisfy the requirements of the MOE if FMAP is extended).
• Without the FMAP extension, Virginia has a hole of $165.3 million in the recently enacted budget now before the Governor.
• The news on the FMAP extension is that there will be no action by Congress until late April or early May.
• A very uncertain situation for the near future with potential consequences after Virginia’s budget is enacted.
57

Restorations Contingent on FMAP Extension and Required for Health Care Reform
58
Restorations or Spending Items (Introduced Budget Items Shaded) FY 2011 FY 2012 FY 2011 FY 2012Freeze enrollment in Medicaid community-based waivers in CY 2011 $3,745,802 $0 $3,745,802 $0Reduce income limits for SSI from 300 to 275% of SSI $16,870,746 $0 $16,870,746 $0Implement a provider tax on ICF-MR facilities $4,168,066 $0 $0 $0Adjust for Impact of Introduced Budget Reductions on GF $14,452,315 $0 $0 $0Adjust for Impact of Conference Amendments on GF $6,522,348 $0 $0 $0FAMIS eligibility restored to 200 percent of poverty (296#2c) $0 $19,295,228 $0 $19,295,228Inflation increase of medically needy income limits (297#4c) $0 $563,081 $0 $0Environmental Modifications / Assistive Technology Limits (297#6c) $276,385 $0 $0 $0Indigent care funding for teaching hospitals (297#7c) $7,100,000 $7,100,000 $0 $0Long-stay hospital rates (297#11c) $449,298 $522,102 $0 $0Podiatry services (297#12c) $0 $487,500 $0 $0Out-of-state inpatient hospital reimbursement (297#14c) $2,253,621 $0 $0 $0Inpatient hospital reduction (297#18c) $14,609,580 $24,164,264 $0 $0Outpatient hospital reduction (297#19c) $6,928,731 $10,802,339 $0 $0Nursing facility operating and capital rates (297#20c) $12,935,953 $16,334,061 $0 $0Physician rates (297#21c) $8,777,395 $14,714,275 $0 $0Dental rates (297#22c) $1,473,404 $2,334,840 $0 $0Pharmacy dispensing fee (279#23c) $0 $523,579 $0 $0Eligibility reduction for Aged, Blind and Disabled (297#24c) $0 $36,167,138 $0 $36,167,138Auxiliary grant rate - Medicaid impact (297#26c) $0 $623,520 $0 $623,520Eligibility reduction of SSI Group from 300 to 250% (297#26c) $0 $72,881,622 $0 $72,881,622Medicaid waiver rates, freeze and limit on respite care (297#27c) * $23,349,291 $52,510,241 $0 $13,310,010Pharmacy reimbursement (297#28c) $819,468 $927,000 $0 $0Optometry services (297#29c) $344,954 $418,500 $0 $0Residential psychiatric treatment services (297#30c) $1,321,092 $0 $0 $0Add 250 new Intellectual Disability wavier slots (297#31c) $5,407,821 $7,779,375 $0 $0Hospital capital rates (297#32c) $1,609,968 $2,649,535 $0 $0School revenue maximization (297#33c) $0 $592,869 $0 $0Mental health therapeutic day treatment rates (297#35c) $1,494,140 $0 $0 $0Community mental health services for children (304#4c) $2,100,000 $2,100,000 $0 $0Centers for Independent Living (320#2c) $469,454 $0 $0 $0Local departments of social services (328#1c) $1,641,894 $4,642,133 $0 $0Auxiliary grant reduction (330#1c) $0 $2,413,152 $0 $2,413,152Child Welfare Services (331#3c) $3,000,000 $0 $0 $0Chore and companion services (330#2c and 331#2c) $1,000,000 $0 $0 $0
Other purchased services for local departments of social services (330#3c) $1,000,000 $0 $0 $0General relief (332#1c) $2,400,000 $2,400,000 $0 $0Healthy Families (333#1c) $1,368,195 $0 $0 $0
Total $147,889,921 $282,946,354 $20,616,548 $144,690,670
Biennial Total $430,836,275 $165,307,218
FMAP Resources Potentially Available DMAS FMAP 2 Qtr. Extension $ 376,817,847 DMAS FMAP 2 Qtr. Extension - Part D $ 20,400,000 Medicaid Match for DBHDS State Facilities $ 13,075,011 Medicaid Match for CSA $ 3,773,039 FMAP Available to IV-E Foster Care $ 3,000,000
$ 417,065,897
Remaining FMAP Available / (Overspent) (13,770,378)
* Details of Medicaid Waiver Item: Reduced limit on hours for respite care $5,195,132 $21,238,946 $0 $0Waiver freeze $0 $13,310,010 $0 $13,310,010Waiver rates $18,154,159 $17,961,285 $0 $0Subtotal $23,349,291 $52,510,241 $0 $13,310,010

59
The Projected Balance in the Revenue Stabilization Fund Will Be $361.2 Million After the Proposed FY 2010 Withdrawal of $292.9 Million and the Proposed $50 Million Deposit in FY 2012
Revenue Stabilization Fund -- June 30 BalanceFY 1995-09 Actual and FY 2010-2012 Forecast
(millions of dollars)
$0
$200
$400
$600
$800
$1,000
$1,200
$80.1 $85.0
$156.6
$224.3
$361.5
$574.6
$715.6
$472.4
$247.5
$340.1
$482.3
$1,064.7
$1,189.8
$1,014.9
$575.1
$293.8 $300.9$361.2
Mil
lio
ns

60
VRS Funded Status: State Employees
78.0% 81
.7% 89.3%
95.3%
105.5
%10
6.8%
104.1
%
100.4
%
94.6%
85.8%
83.3% 85
.1% 88.0%
84.0%
78.5%
72.9%
65.7%
61.7%
0%
20%
40%
60%
80%
100%
120%
1994 1998 2000 2002 2004 2006 2008 2010 2012
Assumptions: • FY 2009 investment return is -21.1%.• All projected years investment return is 7.5% and 2.5% inflation rate.• Employer contribution rates for fiscal year 2009 is fixed at 6.23% and for 2010 at 6.26% for state employees.• Actual value of assets subject to 5-year smoothing with no corridor.

61
VRS Funded Status: Teachers
0%
20%
40%
60%
80%
100%
120%
1994 1998 2000 2002 2004 2006 2008 2010 2012
Assumptions: • FY 2009 investment return is -21.1%•All projected years investment return is 7.5% and 2.5% inflation rate with 20-year amortization period.•Employer contribution rates for FY 2009 and FY 2010 are fixed at 8.81%•Actual value of assets subject to 5-year smoothing with no corridor.

Components of General Fund Revenues
In FY09, individual nonwithholding, corporate income, and recordation tax payments accounted for $3.3 billion of GF revenues, up from FY02’s $2.0 billion, but down significantly from FY08’s $4.1 billion (-21%).
In FY09, 84% of GF revenues were from ongoing economic activity via withholding and sales tax collections, similar to the FY02 recession rate of 83%, but up significantly from the 75% average share over the four previous fiscal years. Sales
23%Withholding
60%
Corporate3%
Nonwithholding14%
Recordation2%
Note: The percentages below each source reflect the percent share of total general fund revenues. The sum of the components exceeds 100 due to the exclusion of individual refunds and other revenue sources.
Sales20%
Withholding64%
Corporate5%
Nonwithholding16%
Recordation2%
Withholding Sales Nonwithholding Corporate Recordation
FY 2009
FY 2002
62

63
Growth in Total General Fund Revenues
Fiscal Year 1961 - Fiscal Year 2012
(Nominal - Actual Dollars)
FY Total Revenues Growth FY Total Revenues Growth
61 230,998,887 - 87 4,590,434,000 11.1%
62 242,144,567 4.8% 88 5,054,382,000 10.1%
63 286,304,265 18.2% 89 5,478,912,000 8.4%
64 298,033,919 4.1% 90 5,494,884,000 0.3%
65 323,213,412 8.4% 91 5,471,879,000 -0.4%
66 365,129,776 13.0% 92 5,623,213,000 2.8%
67 414,755,644 13.6% 93 6,133,637,000 9.1%
68 533,597,744 28.7% 94 6,503,368,000 6.0%
69 706,254,374 32.4% 95 6,881,145,000 5.8%
70 743,721,322 5.3% 96 7,356,110,000 6.9%
71 807,954,651 8.6% 97 7,949,327,000 8.1%
72 922,653,686 14.2% 98 8,773,520,000 10.4%
73 1,054,469,443 14.3% 99 9,702,747,000 10.6%
74 1,168,562,871 10.8% 00 10,788,482,000 11.2%
75 1,303,178,893 11.5% 01 11,105,275,000 2.9%
76 1,428,421,157 9.6% 02 10,678,954,000 -3.8%
77 1,636,301,819 14.6% 03 10,867,149,000 1.8%
78 1,923,085,084 17.5% 04 11,917,867,000 9.7%
79 2,115,211,522 10.0% 05 13,687,252,000 14.8%
80 2,344,928,934 10.9% 06 14,834,298,000 8.4%
81 2,579,663,941 10.0% 07 15,565,827,000 4.9%
82 2,796,458,741 8.4% 08 15,766,951,000 1.3%
83 2,975,687,935 6.4% 09 14,315,060,000 -9.2%
84 3,397,710,261 14.2% 10* 13,987,600,000 -2.3%
85 3,790,816,000 11.6% 11* 14,582,300,000 4.3%
86 4,131,778,000 9.0% 12* 15,313,300,000 5.0%
* March 14, 2010 Post-GA Forecast (Excludes Transfers)

• In 2007, the top 0.1% paid 20%.
• In 2007, the top 1% of filers paid 40% of total revenues
– Up from 25% in 1991
• The top 5% paid 60%
• The top 10% paid 71%
Top 0.1%
Top 0.1%Top 0.1%
Top 1% Top 1%
Top 1%
Top 5%Top 5%
Top 5%Top 10%
Top 10%Top 10%
0%
10%
20%
30%
40%
50%
60%
70%
80%
1997 2002 2007
High-End Filers Determine Personal Income Tax Revenues
Source: IRS data and Tax Foundation

65
Trends in Withholding Compared to Individual Nonwithholding
Percent Growth Over the Prior Year
-40
-30
-20
-10
0
10
20
30
40
50
81 82 83 84 85 86 87 88 89 90 91 92 93 94 95 96 97 98 99 '00 '01 '02 '03 '04 '05 '06 '07 '08 '09'10*'11*'12*
Percent Change
Withholding Nonwithholding* Forecast
66
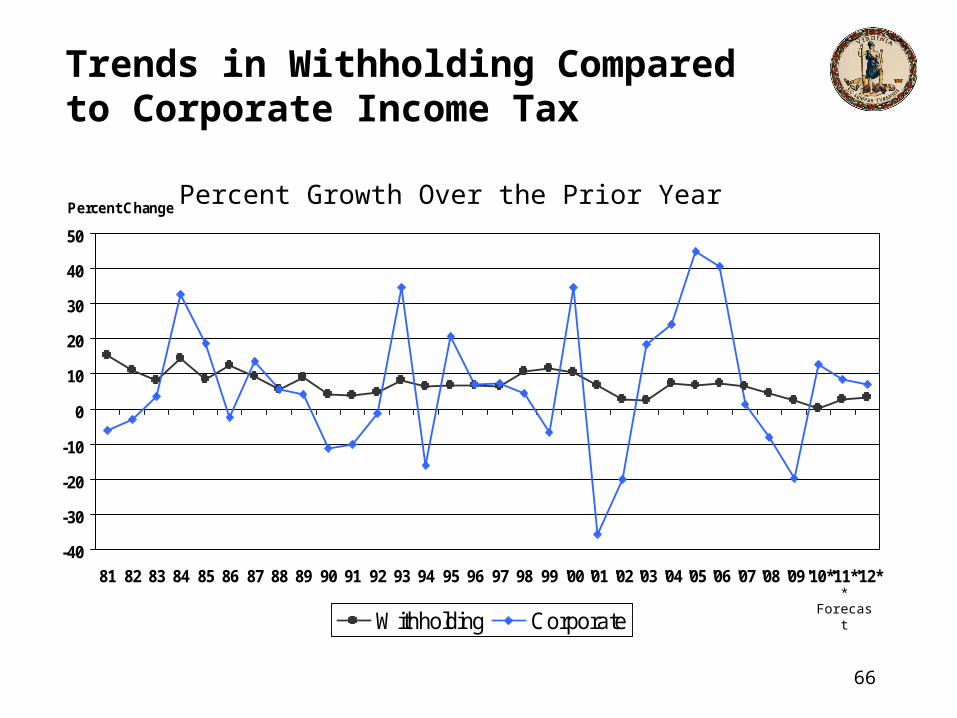
Trends in Withholding Compared to Corporate Income Tax
Percent Growth Over the Prior Year
-40
-30
-20
-10
0
10
20
30
40
50
81 82 83 84 85 86 87 88 89 90 91 92 93 94 95 96 97 98 99 '00 '01 '02 '03 '04 '05 '06 '07 '08 '09'10*'11*'12*
Percent Change
Withholding Corporate* Forecast

67
Trends in Withholding Compared to Recordation Tax
Percent Growth Over the Prior Year
-40
-30
-20
-10
0
10
20
30
40
50
81 82 83 84 85 86 87 88 89 90 91 92 93 94 95 96 97 98 99 '00 '01 '02 '03 '04 '05 '06 '07 '08 '09'10*'11*'12*
Percent Change
Withholding Wills (Recordation)* Forecast
Note: Recordation growth rate is adjusted to remove the rate increase and for transfers per HB 3202.

Growth in Total General Fund Revenues FY 1962 - FY 2012
-15
-10
-5
0
5
10
15
20
25
30
35
62 64 66 68 70 72 74 76 78 80 82 84 86 88 90 92 94 96 98 '00 '02 '04 '06 '08 10* 12*
Annual Percent Change
Fiscal Year * March 14, 2010 Post-GA Forecast
68

69
General Fund Revenue Growth% Increase Year-Over-Year
-15
-10
-5
0
5
10
15
20
2004 2005 2006 2007 2008 2009 2010 2011 2012 2013 2014 2015 2016
Percent Change
Fiscal Year
FY10-12 = Conference, FY13-16 = December Introduced

70
Looking Ahead: Slower Revenue Growth
Average Annual Growth
5 years (FY03 to FY08) +7.6%10 years (FY98 to FY08) +6.0%15 years (FY93 to FY08) +6.5%20 years (FY88 to FY08) +5.9%25 years (FY83 to FY08) +6.9%30 years (FY78 to FY08) +7.3%35 years (FY73 to FY08) +8.0%40 years (FY68 to FY08) +7.8%
• How have general fund revenues grown?
• The forecast of general fund revenues projects much slower growth in the future.
Average Annual Growth
FY2010 -2.3%FY2011 +4.3%FY2012 +5.0%