section 1 - ashlar-vellum™ · pdf filechoosing an undefined view ... like the pull down...
TRANSCRIPT

v7

Cobalt Share™
July 2006
Ashlar, Vellum and the slogans “Software that Thinks” and “Software that Works the way You Think” are registered trademarks of Ashlar Incorpo-rated. Other brand and product names are trademarks and registered trademarks of their respective holders.
Copyright © 2006 Ashlar Incorporated.
All rights reserved. No part of this document may be reproduced, photo-copied or transmitted in any form without the expressed permission of Ashlar Incorporated. The software described in this document is provided under a license and may be used or copied only in accordance with the terms of such license.
Limit of Liability/Disclaimer of Warranty: The information provided in the document is distributed, as is, without warranty. While every precaution has been taken in the preparation of this document, Ashlar Incorporated, Ashlar employees and the software developers shall have no liability to any person or entity with respect to liability, loss or damage caused directly or indirectly by the instructions contained in this document or by the soft-ware described herein.
Ashlar Incorporated1-800-877-2745www.ashlar-vellum.com

Table of ContentsTable of Contents ...................................................................................T-1User Guide Documentation ...................................................................1-1
Installing Ashlar-Vellum Modeling Products ...........................................1-1System Requirements ............................................................................1-2
Windows..............................................................................................1-2Macintosh ............................................................................................1-2
Menus and Submenus ...........................................................................1-3Choosing Commands..........................................................................1-3Margin Notes .......................................................................................1-3Style Conventions ...............................................................................1-4Terminology.........................................................................................1-4
Using the Mouse ....................................................................................1-5Chapter Breakdown ...............................................................................1-6
Sections...............................................................................................1-6Other ...................................................................................................1-6Graphics ..............................................................................................1-6
Selecting Objects ....................................................................................2-1Objects ...................................................................................................2-1Indicating Selection & Preferences ........................................................2-2
Pick Box ..............................................................................................2-3Selection Fence...................................................................................2-3Selection Color ....................................................................................2-4
Selection Process ..................................................................................2-6Selecting Objects with the Selection Tool ...........................................2-6Selecting Points...................................................................................2-9Selecting Objects with Commands....................................................2-13Deselecting........................................................................................2-15
Preference Settings ................................................................................3-1Preferences ............................................................................................3-2
Colors ..................................................................................................3-4Display.................................................................................................3-5Drafting Assistant ................................................................................3-8General..............................................................................................3-10Localization .......................................................................................3-12Select ................................................................................................3-13Units ..................................................................................................3-15
T-1
Table of Contents
T-2
Changing the Preference Settings with the Preferences Command.3-16Drawing Manipulation Tools .................................................................. 4-1
Status Line ............................................................................................. 4-1Coordinate System Axis ........................................................................ 4-2
Choosing a Coordinate System .......................................................... 4-2Message Line ........................................................................................ 4-2Trackball ................................................................................................ 4-3
Sphere Trackball ................................................................................. 4-3Step Trackball ..................................................................................... 4-5Trackball View Menu........................................................................... 4-8View Rotation Short Cut ...................................................................... 4-8
Drawing Display Commands ................................................................. 4-9Show Axis ........................................................................................... 4-9Show/Hide Work Plane ....................................................................... 4-9Show/Hide Points................................................................................ 4-9
Default versus Selected Object Settings ............................................... 4-9Escape Key ............................................................................................ 4-9Progress Bar ........................................................................................ 4-10Right Mouse Button ............................................................................. 4-10
Over No Object ................................................................................. 4-10Over An Object.................................................................................. 4-12Selected Drawing View ..................................................................... 4-14
Verifying Models and Evaluating Surfaces .......................................... 5-1Verify Menu ............................................................................................ 5-1
X, Y, Z Command................................................................................ 5-1Angle 3 Pts Command ........................................................................ 5-2Distance Pt-Pt Command.................................................................... 5-2Minimum Distance Command ............................................................. 5-2Length Command................................................................................ 5-3Area Command ................................................................................... 5-3Volume Command .............................................................................. 5-4Properties Command .......................................................................... 5-4Interference Command ....................................................................... 5-6Show Direction Command .................................................................. 5-9Show Curvature Command............................................................... 5-10Curvature Settings Command........................................................... 5-11Object Counts Command.................................................................. 5-13Check Object Command ................................................................... 5-13

Surface Evaluation ...............................................................................5-16Evaluation Through the Verify Menu .................................................5-17
Viewing Geometry ..................................................................................6-1Zooming .................................................................................................6-2
Zoom Commands................................................................................6-2Zoom Tools .........................................................................................6-3Using the Dynamic Pan Tool ...............................................................6-4Dynamic Zoom Tool ...........................................................................6-5Stroke Zoom........................................................................................6-5Zooming and Views.............................................................................6-6
Panning a View ......................................................................................6-7Pre-defined Views ...............................................................................6-7User-defined Views .............................................................................6-9Modifying a View ...............................................................................6-13Deleting a View .................................................................................6-14
View Rotation .......................................................................................6-14Choosing a User-defined View..........................................................6-15Choosing an Undefined View ............................................................6-15Dynamic Rotate Tool .........................................................................6-16Using the Shift and Arrow Keys.........................................................6-16
View Commands ..................................................................................6-17Redraw Screen..................................................................................6-17
View the Plane .....................................................................................6-18Show/Hide .........................................................................................6-18Tile (Windows Only) ..........................................................................6-19Arrange Icons (Windows only) ..........................................................6-21Open File Windows ...........................................................................6-21
Views and Zoom Scale ........................................................................6-22Layers ......................................................................................................7-1
Layer Manager .......................................................................................7-2Default Layers .....................................................................................7-3
Hiding Layers .........................................................................................7-4Hiding One Layer ................................................................................7-4Hiding all Layers..................................................................................7-4
Showing Layers .....................................................................................7-5Showing One Layer.............................................................................7-5Showing all Layers ..............................................................................7-5
Making a Layer the Active Work Layer ..................................................7-5
T-3

Table of Contents
T-4
Using the Layer Manager.................................................................... 7-5Using the Work Layer Indicator ........................................................... 7-5Using the Isolate Layer Command...................................................... 7-6Increment Layer .................................................................................. 7-6Decrement Layer................................................................................. 7-6
File Management .................................................................................... 8-1File Menu Commands ............................................................................ 8-1
Open ................................................................................................... 8-1Recent File List ................................................................................... 8-2
Uninstalling Cobalt Share on Windows .................................................. 8-3Uninstalling Cobalt Share on Macintosh ................................................ 8-3
Exporting ................................................................................................. 9-1Before You Begin ................................................................................... 9-1
3D Solid & Surface Translation Effectiveness..................................... 9-2Supported Export Formats in Cobalt Share v7 ................................... 9-4Export Command .............................................................................. 9-14Exporting Tips and Notations ............................................................ 9-15
Page Setup and Printing ...................................................................... 10-1Print/Page Layout Command ............................................................... 10-1
Setup Mode Section.......................................................................... 10-3Drawing Size Section ........................................................................ 10-7
Printing a Drawing ............................................................................. 10-16Print Setup/Page Setup................................................................... 10-16Print Command ............................................................................... 10-17Printing/Plotting Region................................................................... 10-18Moving the Print Boundaries ........................................................... 10-19
Print Window ...................................................................................... 10-20Glossary ................................................................................................. G-1Index ......................................................................................................... I-1

User Guide Documentation
User Guide DocumentationThis User Guide is written for Windows 2000/XP and Power Macintosh platforms. Before using this User Guide, however, you will need to install CobaltTM Share. This User Guide is divided into sections which group chapters according to the topic. Each chapter provides information about tools, commands and other features.
Installing Ashlar-Vellum Modeling ProductsInstructions for quick and easy installation are on the CD-ROM that is included with your product or, if you downloaded an Ashlar-Vellum Modeling product from our web site, running the installer will place an informational Read Me on your hard drive.
1-1
User Guide Documentation Ashlar-Vellum
1-2
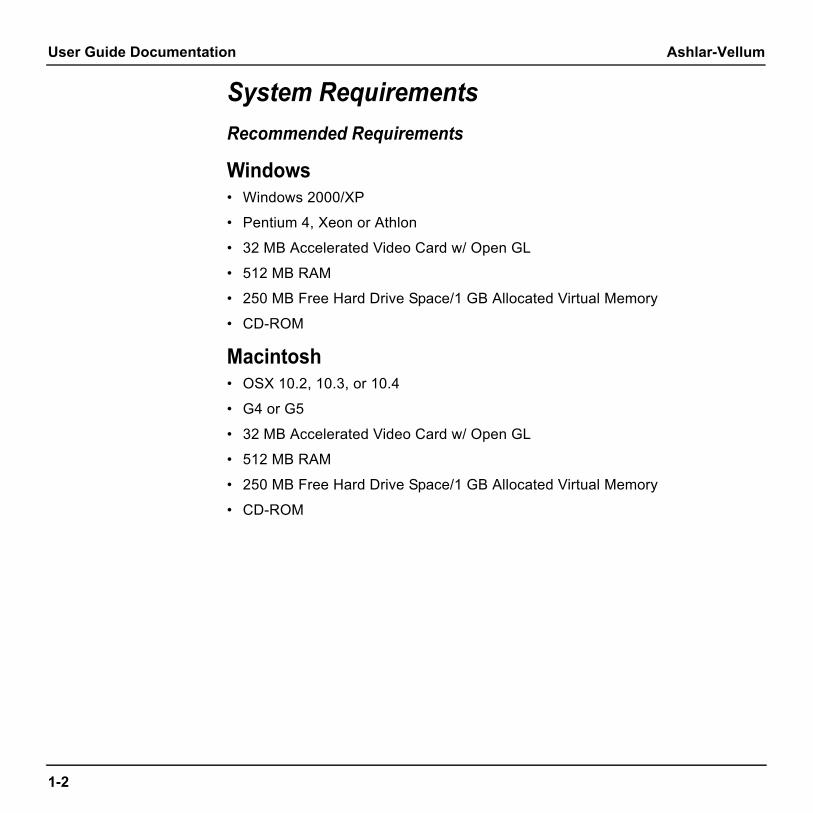
System RequirementsRecommended Requirements
Windows• Windows 2000/XP
• Pentium 4, Xeon or Athlon
• 32 MB Accelerated Video Card w/ Open GL
• 512 MB RAM
• 250 MB Free Hard Drive Space/1 GB Allocated Virtual Memory
• CD-ROM
Macintosh• OSX 10.2, 10.3, or 10.4
• G4 or G5
• 32 MB Accelerated Video Card w/ Open GL
• 512 MB RAM
• 250 MB Free Hard Drive Space/1 GB Allocated Virtual Memory
• CD-ROM

Cobalt Share v7 Menus and Submenus
Menus and SubmenusAs is standard for all programs, Ashlar-Vellum’s Designer Elements 3D modeling programs provide menus and submenus for choosing commands and performing other operations.
Choosing CommandsAs you proceed through the manual, you are directed to choose commands contained in submenus of other menus, like the pull down menu. For example, you might be asked to select Colors in the Preferences submenu of the File menu. That appears in this manual as File>Preferences>Colors.
Margin NotesYour Designer Elements 3D program includes margin notes that provide information to help you use this program. There are three types of margin notes: Tip, Tech Note and Referral. These notes are given special treatment so that you can instantly recognize their significance and locate them for future reference.
TipA tip provides instructions for getting the most out of Cobalt Share. Tips may show how to speed up an operation or how to perform some timesaving technique.
Tech NoteA technical note provides additional technical information that may help when using a tool.
ReferralA referral indicates related information contained somewhere else in the manual for the particular topic being addressed.
1-3

User Guide Documentation Ashlar-Vellum
1-4
Style ConventionsThis manual uses various style conventions which highlight certain terms or phrases. The list below includes an explanation and an example in parentheses. The conventions are as follows:Bold Tool palette names (Light palette); Tool
names (Single Line tool); Keyboard-entered text; Definition terms (as shown in these style conventions).
Italic Terms used for the first time in a chapter; (Iso Lines); Drafting Assistant notations (midpoint); tool and dialog box options (Angle box); book references (User Guide); Message Line directions (Single Line: Pick the beginning point.); margin note headings (Tip); menu commands (Zoom Previous); filenames (prefs.ini); stand alone extensions (.dwg); directory names; drawing names.
Bold and Italic Command series (Layout>Group>Lock).
ALL CAPITALS Key names on the keyboard (ENTER, RETURN).
Title Capitalization Dialog box names (Edit Objects); menu names (Pen menu); special Vellum phrases (the Drafting Assistant).
all lower case File names (prefs.ini); stand-alone file extensions (.dwg).
TerminologyFor those new to surface and solid modeling, there are many terms or phrases that might be unfamiliar. These terms are defined the first time they are used in the manual as well as in the Glossary.

Cobalt Share v7 Using the Mouse
Using the MouseThe mouse is your communication device. Use the mouse to indicate locations, choose commands, select tools and construct objects.This manual uses the following terms for mouse activities:Pointer An arrow or any other graphic symbol that
allows selection or creation of an object. Move the pointer to point to a command or an object on the screen. Depending on its location, the pointer is an arrow or may look like the current tool.
To move the pointer, move the mouse on the mouse pad.
Point Move the mouse until the pointer is over the desired item.
Press Press and hold down the mouse button.
Click Quickly press and release the mouse button once.
Double-click Click the mouse button twice, in quick succession.
Drag Press and hold down the mouse button, move the mouse, then release the mouse button.
Arrow Pointer Selection Arrow Center-Point Circle
1-5

Referral:Specific page information on a particular tool or command is found in the index.
1-6
Chapter Breakdown
Ashlar-Vellum
Chapter BreakdownThe chapters are grouped into sections dealing with specific areas.
SectionsOverview Introduces some basic features of the
Designer Elements 3D modeling program, including the program Window and information on selecting objects.
Setting the Environment Contains information on preference settings.
Drawing Display Contains information on viewing the geometry, layers, planes and rendering.
Documents Contains information on file management, exporting, page setup.
OtherGlossary Defines terminology used in CAD drafting
and in Cobalt Share.
Index List of Cobalt Share tools, features and actions, and their page location.
GraphicsMost of the graphics in the manual apply to both Macintosh and Windows platforms. For illustrations, usually a Windows graphic is used. When necessary, both Windows and Macintosh graphics are included.

Selecting Objects
Selecting ObjectsThis chapter describes a number of convenient ways to select objects and points, including the use of the selection mask.
Objects
A single piece of geometry is an object. Several objects that have been grouped with the Group command are also an object and are selected when any member in that group is clicked.
A point is an object, too. Every type of geometry contains one or more points, sometimes called control points. A line has two control points, one
A line is an object
SingleObject
2-1

Selecting Objects Ashlar-Vellum
2-2
Referral:Selecting points is described later in this chapter.
at the beginning and one at the end of the line. If you select an object and choose Edit>Show Points, the points are visible on the selected object. If you select a point without selecting the geometry it defines, Cobalt Share treats the point as an object.
Indicating Selection & Preferences When an object is selected, it appeares on the screen in a specific color. The default color chosen is red for Cobalt Share. Choose your own color, as well as other settings for selecting objects, by choosing File>Preferences>Select. The following selection page is displayed.

Cobalt Share v7 Indicating Selection & Preferences
Pick BoxThe pick box is an invisible box centered about the pointer tip. The default size of the box is 8 x 8 pixels. The pick box requires you to move the pointer over the desired object and click the mouse button. Objects that are within the bounds of the pick box are selected. See the graphic on the right.
Selection FenceThe selection fence is a rubber banding selection window. Choose between one of two settings, Entire Object Extents or Partial Object Extents.Entire Object Extents Only objects that lie completely within the
pick window are selected. In the graphic below, only the circle is selected.
Invisible Pick Box
Drag the mouse from one point...
...to another and release.
2-3

Selecting Objects Ashlar-Vellum
2-4
Partial Object Extents Any object that lies partially within the selection fence window is selected. In the graphic above, both the circle and the spline are selected.
Selection ColorChoose any color, except black, for the selection color. In the Selected Entities Color section, click New and the standard color display appears. Choose the color, click OK and you are returned to the Select page of the Preferences display. Once the selection color changes, all current and future selected items appear in the new color. Do not use black for indicating selection because black is the default color for all curves.
Wire WeightWhen selecting a curve, the line weight of the curve is increased in accordance to the setting in the drop down box. The weight specified relates to the pixel weight of the curve. Choose from 0 to not increase the weight of the selected curve, to 4 to increase the weight of the selected object to four pixels.

Cobalt Share v7 Indicating Selection & Preferences
TransparencyWhen a surface or solid object is selected, the surface or solid becomes transparent. The Transparency sliding bar controls how transparent the object becomes. A value of 0 means no transparency will be added to the selected object. A value of 100 means the object will be fully transparent such that only the edges of the object are seen.
2-5

Selecting Objects Ashlar-Vellum
2-6
Tip:Having trouble selecting objects when displaying many objects? Try using the Selection Mask, a selection fence, or rotate the view slightly and try again.
Selection ProcessSelecting an object does not affect the properties of the object. A selected object highlights, but this highlighting goes away once the object is deselected. Select an object by using either the Selection tool or by the hollow selection tool that appears temporarily when using one of the editing tools.Use the Selection tool to select both objects and points. While the selection processes for objects and points are quite similar, there is enough difference to merit separate attention.
Selecting Objects with the Selection ToolTo select an object, begin by clicking the Selection tool in the main tool palette. Select one object, SHIFT-click more than one object, or drag a selection fence around a group of objects.
Selection Tool
The Selection tool in the main tool palette selects one or more objects (curves, solid edges, faces, etc.) or points in the drawing area. The graphic here shows the selection of a solid face.Use the Selection tool to activate previously created geometry.

Cobalt Share v7 Selection Process
Selecting a Single Object1. Click the Selection tool in the tool palette. The Message
Line reads: Selection: Select [Shift=Extend, Ctrl (Windows) or Option (Macintosh) = Copy].
2. Move the pointer to an object and click. The object is selected, and any previously selected objects are deselected.
Selecting Multiple Objects by SHIFT-clicking1. Choose the Selection tool in the tool palette.2. Move the pointer to an object and click.3. Press and hold the SHIFT key.4. While holding down the SHIFT key, click other objects to be selected.
The objects clicked are selected. Then click one of the selected objects to deselect it.
5. Release the SHIFT key.Selecting Multiple Objects by DraggingTo select more than one object, drag a selection fence around the objects.1. Click the Selection tool in the tool palette.2. Drag a selection fence around the objects to select.To select most of the objects within an area, drag a selection fence to select all the objects, and then deselect the objects you do not want by holding down the SHIFT key and clicking them.
2-7

Selecting Objects Ashlar-Vellum
2-8
Tip:Specify that only certain objects, layers, or colors are selected by setting a selection mask with the Select Mask command. Select All is useful to make a global change in a drawing, such as changing the width of all lines.
Selecting One or More Objects when they Overlap (Ambiguity Popup Box)Often with more complex drawings, geometry overlaps making it difficult to select one object without zooming very close to it. This program has made this easier with the Ambiguity Popup box. When you attempt to select one object among many objects close together, the popup menu appears.
As you move the pointer over an object name in the popup, the object it represents highlights in the selection color but is not yet selected. Click on the object name in the popup to accept that choice.The Ambiguity Popup box lists faces for such tools that require the selection of a face (draft, shell, fillet and extrude).You can select only one object at a time in the popup box.To close the Ambiguity box without selecting an object either:• Click the Close button or box in the title bar.• Click outside the popup box.

Cobalt Share v7 Selection Process
Selecting All ObjectsThere are two ways to select everything in a Cobalt Share document.• Select the Selection tool and choose Edit>Select All (CTRL+A
(Windows) or +A (Macintosh).• Double-click the Selection tool.
Selecting Points Selecting points differs from selecting objects because points are not always visible.
Show/Hide Points CommandThis command in the Edit menu toggles the display of the control points (endpoints, midpoints, center points and vertex points) for selected objects. When points are displayed, select a point by clicking it. If points are not displayed, select a point by dragging a selection fence around the location of the point. To show points for an individual selection, choose Window>Edit Objects and change the control points setting from Hidden to Visible.
The appearance of a selected point is not affected by the zoom scale or the line width of your geometry.
A line without points displayed A line with points displayed
Unselected point Selected point
2-9
Selecting Objects Ashlar-Vellum
2-10
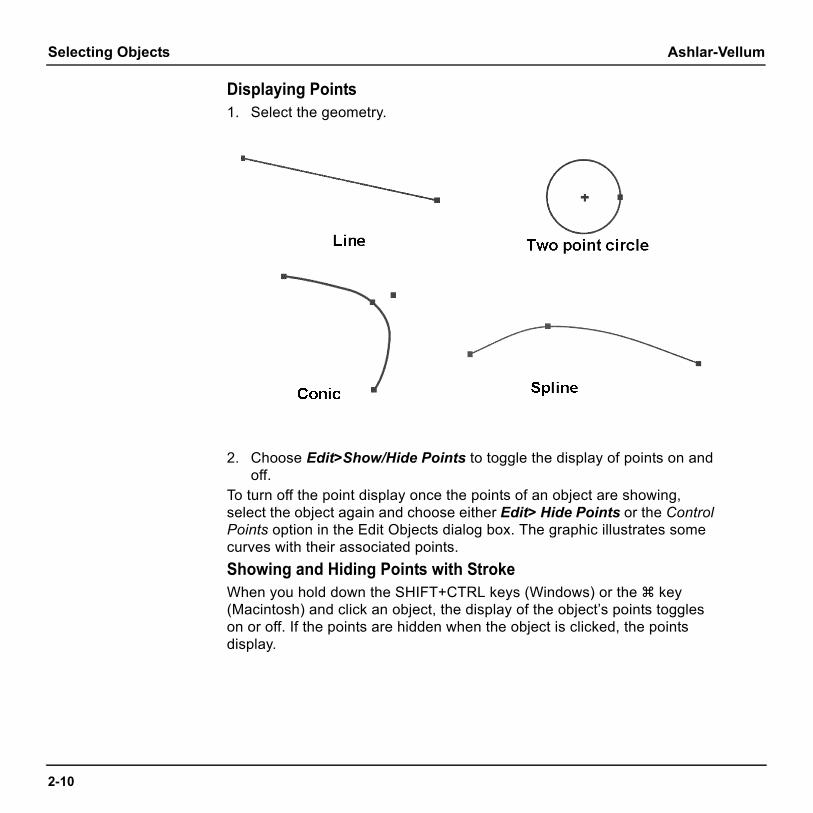
Displaying Points1. Select the geometry.
2. Choose Edit>Show/Hide Points to toggle the display of points on and off.
To turn off the point display once the points of an object are showing, select the object again and choose either Edit> Hide Points or the Control Points option in the Edit Objects dialog box. The graphic illustrates some curves with their associated points.Showing and Hiding Points with StrokeWhen you hold down the SHIFT+CTRL keys (Windows) or the key (Macintosh) and click an object, the display of the object’s points toggles on or off. If the points are hidden when the object is clicked, the points display.

Cobalt Share v7 Selection Process
Selecting PointsA control point can be selected whether the points are visible or not. To select points:1. Choose the Selection tool.2. Drag a selection fence around
the location of the point.The selected point displays as a square.When a point is selected the entire curve highlights, however, edits will only affect the selected point.
UnselectedPoint
SelectedPoint
2-11

Selecting Objects Ashlar-Vellum
2-12
Selectable Points CommandThis command in the Edit menu allows the selection of points that aren't displayed. When Selectable Points are not set, points cannot be selected by dragging a fence.If points are displayed, click the point to select it. If points are not displayed, select a point by dragging a selection fence around it. The following example illustrates the use of Selectable Points.
The line’scontrol pointis selected with the rectangle.
The line’scontrol pointis not selected with the rectangle.
With Selectable Pointsturned on, the Move toolmoves the lower rectangleand the line endpoint.
With Selectable Points turned off, the Move tool
but not the line endpoint.moves the lower rectangle

Cobalt Share v7 Selection Process
Selecting Objects with CommandsCobalt Share provides three selection commands, Select All, Select Mask and Select Chain.
Select All CTRL+A (Windows); +A (Macintosh)When the Selection tool is chosen, this command in the Edit menu selects all objects except those on a hidden layer or excluded by the Selection Mask. Double-clicking the Selection tool is another way to select all objects.
Select Mask CommandThis command in the Window menu limits selection by object type, layer and color. Only objects that are highlighted in the dialog box can be selected. The object type list includes such things as points, lines, splines, mesh, surfaces, solids, text, dimensions, images, symbols, groups, lights, decals, draw view, cross hatch, etc.For example, if circles are not highlighted, when Select All is chosen, everything but the circles is selected. In this way, you can select such combinations as only blue splines or only red objects on a particular layer.
2-13

Selecting Objects Ashlar-Vellum
2-14
Using the Select Mask1. Choose Window>Select Mask.
The Select Mask dialog box appears.
The highlighted items respond to all selection methods and are detected by the Drafting Assistant.
2. Click the items to select so they are highlighted. While the dialog box is visible, select, and edit geometry. Move the dialog box if it covers necessary geometry. When an item in the dialog box is not highlighted, the Drafting Assistant and all the tools cannot detect it, even though it is visible on the screen.The Selection Mask is useful to select particular groups of objects in complex drawings.

Cobalt Share v7 Selection Process
Selecting or Deselecting Listed Items• To select just one item, with all items selected, click on the item and the
rest of the list is deselected. • To deselect a list quickly, press the Clear All button.• To select a contiguous group of items, click on the item at the top or
bottom of the desired group list and drag up or down to select the other items in the group.
• To select or deselect non-contiguous items, hold down the CTRL (Windows) or the key (Macintosh) and click on the items.
Select Chain CommandThis command selects curves that are connected to the selected object. To use the Select Chain command:1. Select the beginning of a curve as shown by the arrow in the left
graphic below.2. Choose Edit>Select Chain.3. All objects connected to the start or end are selected, as in the right
graphic below.
DeselectingTo deselect an object, click anywhere in the drawing area where there is no object, or click any of the creation tools in the tool palette.To deselect an object that was selected in a multiple selection operation, while the objects are still selected, hold down the SHIFT key and click the objects to deselect.
2-15

Selecting Objects Ashlar-Vellum
2-16

Preference Settings
Preference SettingsAll designers develop a particular style when creating their models and parts. This style includes specific standards that unify their work and may include such things as measurement units, line color, drawing layout, short cut keys and more. It also unifies work within companies and industries. Preferences set in the Preferences dialog box relating to object display and creation affect only the entities created after the preference is set.
Default versus Selected Object SettingsWhen no object is selected, any setting changes made to Selectable Points, Axis, Triad, Show Points, and tool palettes become the default for all open files and the current Cobalt Share session. When an object is selected, any change made will only affect the object.
This chapter covers preferences and how they are set.
3-1
3-2
Preference Settings Ashlar-Vellum
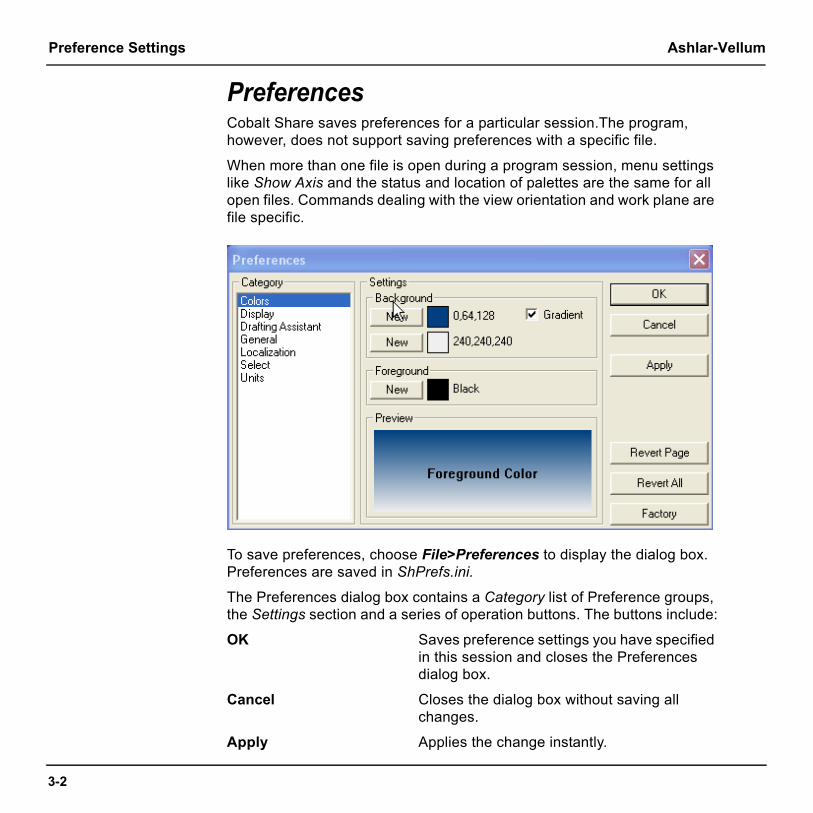
PreferencesCobalt Share saves preferences for a particular session.The program, however, does not support saving preferences with a specific file.
When more than one file is open during a program session, menu settings like Show Axis and the status and location of palettes are the same for all open files. Commands dealing with the view orientation and work plane are file specific.
To save preferences, choose File>Preferences to display the dialog box. Preferences are saved in ShPrefs.ini.
The Preferences dialog box contains a Category list of Preference groups, the Settings section and a series of operation buttons. The buttons include:
OK Saves preference settings you have specified in this session and closes the Preferences dialog box.
Cancel Closes the dialog box without saving all changes.
Apply Applies the change instantly.

Cobalt Share v7 Preferences
Revert Page Undoes changes made to the current preference group.
Revert All Undoes changes made to any preference group.
Factory Resets all preference groups to the factory settings.
The Category list includes:
• Colors
• Display
• Drafting Assistant
• General
• Localization
• Select
• Units
Selecting an item from the Category list displays its preference options in the Settings section.
3-3

3-4
Preference Settings Ashlar-Vellum
ColorsChoosing the Color category displays the Color preferences page. This page controls the foreground and background color of the drawing area. The current (or proposed) settings are indicated by the color rectangle, color name and the Preview section. Press the appropriate New button to display the color selection dialog box and change the color.
BackgroundThis setting sets the background color for the drawing area. The current color is displayed in the window.
1. Click New. The color palette is displayed.
2. Choose the background color.3. If the Gradient box is checked, two background colors are selected and
the background appears as a shaded gradient from one to the other. By unchecking the Gradient box, only the top color appears as a solid background.
4. Click OK. The new background displays in the view window with the color name. For colors other than the standard colors, the color values display to the right of the view window.

Cobalt Share v7 Preferences
ForegroundThis setting sets the foreground color for the drawing area (specifically the location indicator and the indicator separator lines). The current color is displayed in the window.
1. Click New. The color palette is displayed.
2. Choose the foreground color.3. Click OK. The new foreground displays in the view window with the
color name. For those other than the standard colors, the values display to the right of the view window.
PreviewThe Preview window displays your background and foreground choices.
DisplayThis option controls the individual default display parameters for curve, surface and solid object types.
3-5

3-6
Preference Settings Ashlar-Vellum
Tech Note:Parameter space is where objects are defined in a 2D coordinate system. Typically, a surface is mathematically defined in parameter space. Each surface has a mathematical function that maps 2D parameter space into 3D model space. A U/V coordinate of U=0.5 and V=0.25 in parameter space maps to X=100, Y=300, Z=255 in 3D model space.
Object TypeThis sets the appearance of Curves, Surfaces and Solids. Each object type offers different display options.
DisplayFor each object type (curve, surface and solid), choose a display option. Display options vary according to the object type and may include: Resolution, Iso Lines, Silhouette and Edge Color.
Resolution (Available for all object types.) Controls how accurately an object’s curves appear. Set the curve resolution to: Coarse, Medium, Fine, Very Fine or Super Fine. An object with a Coarse resolution draws quickly but may be visually less appealing. An object with a Fine resolution draws more slowly but may be visually more appealing.
Iso Lines (Available for Surface and Solid object types.) Iso (isopram) Lines control the number of U and V lines displayed for a surface or solid object. Iso Lines are constant parameter curves that lie on an object. U and V are letters used to define these lines (and their coordinates) in parameter space where U is for horizontal and V is for vertical. These are standard for the industry. A zero (0) in both fields turns off Iso Lines. U/V values

Cobalt Share v7 Preferences
may enhance the visual appearance of a surface or solid at the expense of drawing speed.
The left graphic below shows a surface with both U and V Iso lines set to five (5).
Silhouette (Available for Surface and Solid object types.) Controls the silhouette edge draw mode. There are three options: Off, On and Smart. Silhouette edges are view-dependent and can cause a significant reduction in drawing speed. If the Smart mode is selected, silhouettes will be dynamically drawn based on performance considerations.
Edge Color (Available for Surface and Solid object types.) Sets the edge color of rendered mesh objects separate from the entity itself.
3-7

3-8
Preference Settings Ashlar-Vellum
Select one of four options from the pull-down menu: Foreground, Background, Entity or User Defined. To specify a User Defined color, click on New, choose a color in the palette and click OK. The new color is displayed in the Edge Color window with its RGB values.
Drafting AssistantThis category controls the low level snapping behavior of the Drafting Assistant. The settings include the Hit Radius, Alignment Angles, Creation Angles and % Point.
Hit Radius Determines the detection distance in pixels. When the pointer is within the specified Hit Radius, the Drafting Assistant notations display and the object is selected when you click the mouse.
Alignment Angles Define angles for the Drafting Assistant's dynamic construction lines. To change the orientation of the drawing, change these

Cobalt Share v7 Preferences
specifications. For example, in a 2D drawing, you could set these angles to 30°, 90° and 15° for isometric drawing. The defaults are 0° (horizontal) and 90° (vertical). Values should be separated by semicolons.
To display a dynamic construction line through a point, move the pointer to the point to activate it (a diamond appears); construction lines automatically display through the active point. Up to eight active points are available. When the ninth point is activated, the first one in the series deactivates.
Creation Angles Define angles for the Drafting Assistant’s dynamic construction lines. (These lines are not part of the list of lines generated from the eight active points.) The defaults are +45° and -45°. Values should be separated by semicolons.
% Point Controls the Drafting Assistant's notations for divisions of a curve. For example, entering 25 instructs the Drafting Assistant to indicate when the pointer is 25% of the distance along a line.
3-9
3-10
Preference Settings Ashlar-Vellum
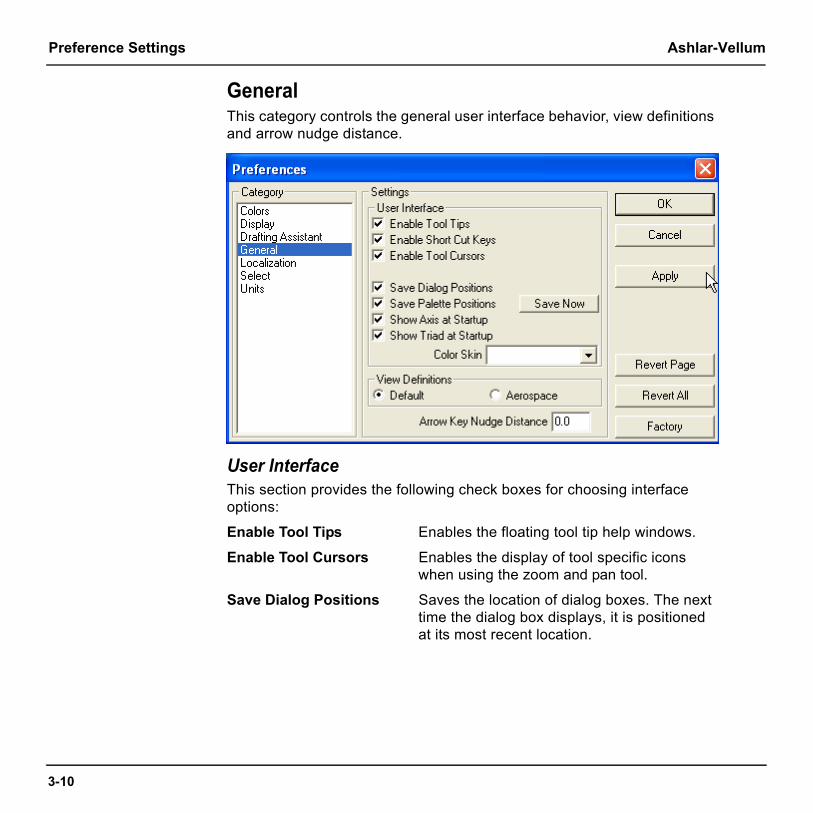
GeneralThis category controls the general user interface behavior, view definitions and arrow nudge distance.
User InterfaceThis section provides the following check boxes for choosing interface options:
Enable Tool Tips Enables the floating tool tip help windows.
Enable Tool Cursors Enables the display of tool specific icons when using the zoom and pan tool.
Save Dialog Positions Saves the location of dialog boxes. The next time the dialog box displays, it is positioned at its most recent location.

Cobalt Share v7 Preferences
Save Palette Positions Saves the tool palette positions and displays its status when exiting. The next time this program launches, the palettes display in their previous positions. Click the Save Now button to immediately save tool palette positions, pen color, fill color, dialog box locations and display status.
Show Axis at Startup Shows the coordinate axis when the program launches.
Show Triad at Startup Shows the coordinate triad when the program launches.
View DefinitionsCobalt Share supports two different common view definitions, Default and Aerospace. Select the Default option to use view definitions commonly used for mechanical drafting. Select the Aerospace option to use view definitions commonly used for aerospace lofting.
Arrow Key Nudge DistanceThe Arrow Key Nudge distance specifies how far the drawing scrolls when a keyboard arrow key is pressed in the Selection tool. The units for this option are based on the units chosen on the Units page of this dialog box.
3-11

3-12
Preference Settings Ashlar-Vellum
LocalizationThis category controls the use of decimals versus commas in Cobalt Share.
Use Commas as DecimalChecking the Use Comma as Decimal option allows international users to display numbers according to their numerical standards.

Cobalt Share v7 Preferences
SelectThis category controls object selection behavior, including Pick Box Size, Ambiguity Popup, Selection Color and the Selection Fence mode.
Pick Box SizeTo select an object, place the cursor on the object and click the mouse. The Pick Box is the area around the cursor in which an object must be located to be selected. Specify the area using the pull-down menu (ranges from 2 through 16, even numbers only). The Pick Box does not display.
Ambiguity Popup The Ambiguity Popup displays when there are multiple objects near the selection and offers a choice of which object to choose.
A check mark in the box enables the popup. This is the default setting.
3-13
3-14
Preference Settings Ashlar-Vellum
Selected Entities ColorThis option sets the selection color. The current color displays in the window. To change the color:
1. Click New to display the color palette.
2. Select a color from the palette.3. Click OK to accept the color and be returned to the Select page. The
new color now displays in the view window with the color name. For colors other than the standard colors, the color values display to the right of the view window.
Wire WeightWhen a curve is selected, the line weight of the curve is increased in accordance to the setting in the drop down box. The weight specified relates to the pixel weight of the curve. Choose between 0 to not increase the weight of the selected curve and 4 to increase the weight of the selected object to four pixels.
TransparencyWhen a surface or solid object is selected, the surface or solid becomes transparent. The Transparency sliding bar controls how transparent the object becomes. A value of zero means no transparency is added to the selected object. A value of 100 means the selected object is fully transparent so that only the edges of the object are seen.
Selected PointsWhen a point is selected the entire curve highlights, however, edits will only affect the selected point.
Select Fence ModeCobalt Share supports two modes when dragging to select one or more objects, Entire Object Extents or Partial Object Extents. Selecting the Entire Object Extents option allows only the selection of objects that fall completely within the selection fence. Selecting the Partial Object Extents option allows the selection of any object that has a portion within the selection fence.

Cobalt Share v7 Preferences
Tech Note:The decimal places entered here only affect the Status Line and Location Indicator. They do not affect the decimal places used for dimensions.
Note: Be aware that control points will affect what is selected when using the Partial Objects Extents option. For example, with this option selected, if the selection fence covers a control point for a circle, only the center point is selected rather than the entire circle.
UnitsThis category controls the units and the number of decimal points displayed for the geometry.
Units can be set to inches, feet, feet/inches, millimeters, centimeters or meters.
In the Display Decimal Digits data field, enter the number of decimal places (between 1 and 8) to display. Three decimal places is the default.
3-15
3-16
Preference Settings Ashlar-Vellum
Changing the Preference Settings with the Preferences Command1. Choose File>Preferences.
2. Select the category to set.3. Make the desired changes.4. Select another category or click OK to close the dialog box.

Drawing Manipulation Tools
Drawing Manipulation ToolsThis chapter provides techniques for manipulating the drawing area. The following topics are covered:• Status Line
• Coordinate System Axis
• Message Line
• Trackball
• Drawing Display Commands
• Default versus Selected Object Settings
• Escape Key
• Progress Bar
• Right Mouse Button
Status LineThe Status Line appears at the bottom of the window. It displays the current position of the pointer in x, y and z coordinates.
4-1

4-2
Drawing Manipulation Tools Ashlar-Vellum
Coordinate System AxisThe Coordinate System Axis, at the left of the Status Line, displays the coordinate system currently set for the file. Choose either the Global (world coordinate system) or a user-defined coordinate system. The graphic below represents the Global coordinate system which is the default.
The Global System aligns with the x, y and z axes (x = 1, 0, 0; y= 0, 1, 0; z= 0, 0, 1). The user-defined coordinate system is set by the designer.
Choosing a Coordinate System1. Choose the coordinate system by clicking on the Coordinate System
Axis icon at the far left of the Status Line.
A menu displays.2. Choose the GlobalWorkPlane or any user-
defined work plane.The work plane and coordinate system are now set.
3. Continue working.
Message LineThe Message Line is an important feature when drawing. After selecting a tool, the line displays the tool name and the first step in its use.The Message Line may also display additional commands with the tool.

Cobalt Share v7 Trackball
Tip:Axis locking applies to geometry also. Hold down the X,Y or Z key while creating geometry and it will be locked to that axis.
TrackballThe Trackball rotates the view orientation of the geometry in the drawing area.The view is also rotated around an object by selecting it before using the Trackball. To display the Trackball, choose Window>Trackball. When the Trackball displays, a check mark appears in front of the command in the Windows menu. Drag the Trackball to any location in the drawing area.Toggle the Trackball between the sphere display and the step display. Both displays include a pull-down menu.
Axis LockingThe Trackball locks rotations to an x, y or z axis. Hold down the X, Y or Z key on the keyboard while using the mouse in the Trackball window and the Trackball rotates only in the direction of the key being pressed.
Sphere TrackballThe Sphere Trackball drags your view to the desired rotation. Drag beyond the boundary of the trackball to continue the rotation. The sphere trackball is the default display.
Using the Sphere Trackball1. Choose Window>Trackball.
2. Drag the pointer on the Trackball to rotate the view.The model rotates as the mouse is dragged. See the section below for setting view rotation options. The model continues rotating if the pointer is dragged past the edge of the trackball display until the mouse button is released.
4-3

4-4
Drawing Manipulation Tools Ashlar-Vellum
Setting View Rotation OptionsSet view rotation options for the Sphere Trackball in the View Rotation Options dialog box.To display the dialog box, double-click on the gray area of the Sphere Trackball.The View Rotation Options dialog box appears containing the following:Type Sets the rotation type, Model or Screen.
The Model option rotates the view around the x, y and z axis as displayed by the Axis icon.
The Screen option rotates the view around the screen axis with the x axis oriented horizontally, the y axis oriented vertically and the z axis oriented normal to the screen.
Origin Sets the origin at either the Model Point or the Object Center.
The Model Point option determines the rotational point. Enter either the values in the x, y and z data fields or click on the geometry to set the location (values are entered automatically).
The Object Center option rotates the geometry around the center of the objects in the drawing. This center is calculated by the Desiger Elements program. When this option is selected, the x, y, and z data fields are unavailable.
Choose only one of the four rotational options: Model Type, Screen Type, Model Point Origin or Object Center Origin.Click OK to accept the settings and close the dialog box or Cancel to close the dialog box without accepting the changes.

Cobalt Share v7 Trackball
Step TrackballThe Step Trackball rotates the view in regular angle increments or in a continuous movement and provides additional options in the View Rotation Options dialog box.Change the Sphere Trackball to the Step Trackball by clicking the arrow button on the right side of the Trackball title bar.The Step Trackball includes the following icons:Directional Arrows These arrows rotate the view in a specific
direction. Clicking the vertical arrows rotates the geometry around the x axis. Clicking the horizontal arrows rotates the geometry around the y axis. Clicking the angled arrows rotates the geometry around the z axis. (In the View Rotation Options dialog box, choose either the model or screen axis to reference the rotation when using these arrows. See “Setting View Options” for more information.)
Step Rotation This display, represented by the stair icon, toggles with Continuous Rotation. With the step icon displayed, rotation moves through stepped increments in the selected direction.
Set the degree increment for the steps in the View Rotation Options dialog box. See “Setting View Options” for more information.
4-5

4-6
Drawing Manipulation Tools Ashlar-Vellum
Continuous Rotation This display, represented by the circular arrow, toggles with Step Rotation. With this icon displayed, rotation is a continuous motion in the direction selected.
Temporarily halt the rotation by placing the cursor over the arrow and pressing. When the mouse is released, the rotation continues. To stop the continuous rotation, click the circular arrow icon.
Using the Step Trackball1. Choose Window>Trackball.
2. Click on the arrow button on the right side of the Trackball title bar to change the display to the Step Trackball.
3. Click one of the directional arrows. The model rotates a specified number of degrees. Or...Click on the Step Rotation icon to toggle the display to the Continuous Rotation icon and click one of the directional arrows. Click on the circular arrow icon to stop the rotation.
Setting View Rotation OptionsCobalt Share sets view rotation options for the Step Trackball in the View Rotation Options dialog box.To display the dialog box, double-click on the black area of the Step Trackball. View Rotation Options containing these options:

Cobalt Share v7 Trackball
Type Sets the rotation type, Model or Screen.
The Model option rotates the view around the x, y and z axis as displayed by the Axis icon. The option rotates the model around one stationary axis. See the graphic here.
The Screen option rotates the view around the screen axis with the x axis oriented horizontally, the y axis oriented vertically and the z axis oriented normal to the screen.
Step Angle Sets the rotation angle for the Step Trackball.
Origin Sets the origin at either the Model Point or the Object Center.
The Model Point option determines the rotational point. Enter either the values in the x, y and z data fields or click on the geometry to set the location (values are entered automatically).
The Object Center option rotates geometry around the center of the objects in the drawing. This center is calculated by Cobalt Share. When selected, the x, y, and z data fields are grayed out.
4-7

4-8
Drawing Manipulation Tools Ashlar-Vellum
Choose only one of the four rotational options: Model Type, Screen Type, Model Point Origin or Object Center Origin.Click OK to accept the settings and close the dialog box or Cancel to close the dialog box without accepting the changes.
Trackball View MenuThe Trackball has a pull-down menu for specifying the view or saving the current view. The views available in this menu include the default views and any user-defined views.
Using the Trackball View Menu1. Move the pointer to the current view
name displayed at the bottom of the Trackball window.
2. Press the mouse button.The Trackball views menu displays.
3. Choose the view orientation to display in the current window.The view orientation changes in the view window. A check mark appears next to the selected view, as shown here.
View Rotation Short CutRotate the view by holding down the SHIFT key and pressing one of the keyboard arrows. This rotates the view a specified number of degrees.The view can also be changed with the following keyboard short cuts: a - Side View, s - Front View, d - Top View, f- Isometric View, and g - Trimetric View.

Cobalt Share v7 Drawing Display Commands
Drawing Display CommandsThere are three commands that assist in displaying geometry. These are Show Axis, Show/Hide Work Plane, and Show Points.
Show AxisThis command in the View menu toggles the display of the Axis symbol at the drawing origin. The axis establishes the direction of the x, y and z axes. The axis can clarify the geometry location when rotating the view.
Show/Hide Work PlaneToggles the display of the Work Plane icon on the geometry using the icon in the lower left corner of the window frame. The graphic shows the work plane set to the Top plane.
Show/Hide PointsThis command in the Edit menu toggles the display of the control points for selected objects. See Chapter 2, “Selecting Objects,” for more information.
Default versus Selected Object SettingsWhen no object is selected, any setting changes made with respect to Selectable Points, including Axis, Triad, and Show Points become the default for all open files and the current program session. When an object is selected, any change made will only affect the object.
Escape KeyWith complex geometry, the time required for operations to complete lengthens. Interrupt the command by pressing the ESC key.
y
z
x
4-9

4-10
Drawing Manipulation Tools
Progress BarThe Progress Bar provides feedback when opening files or exporting files. The bar shows the status of the operation.
Right Mouse ButtonCobalt Share accesses commands through the right mouse button. If you are a Macintosh user and do not have a right mouse button, these commands are available by holding down the CTRL key and pressing the mouse button.Different sets of commands display depending on whether the button is pressed while on or off an object or when a drawing view is activated.
Over No ObjectWhen the right mouse button (Windows) or Control + mouse button (Macintosh) is clicked in the white space of the drawing, the popup menu on the right appears.The menu includes the following commands:All Zoom Commands Duplicate the commands
in the View menu.
All Dynamic Commands Perform the same functions as those in the View menu. When one of these commands is selected, the pointer icon becomes that of the tool. Perform the operation once and then the icon reverts back to the selected tool.

Cobalt Share v7 Right Mouse Button
To perform multiple operations, hold down the SHIFT key before selecting the command. When the SHIFT key is released, the icon reverts back to the selected tool.
View Displays all default views and any user-defined views.
Planes Displays the same commands as those in the Planes menu, with the exception of the Show Work Pln command.
Select All Specifies which object types to select.
4-11

4-12
Drawing Manipulation Tools Ashlar-Vellum
DeSelect Deselects any selected objects.
Show All Specifies which hidden object types to show.
Hide All Specifies which object types to hide.
Over An ObjectWhen an object is selected, place the pointer over the selected object and click the right mouse button (Windows) or Ctrl + mouse button (Macintosh). A popup menu appears.The menu includes the following: Hide, Show Only Duplicate the
commands in the Show-Hide dialog box to hide or show the object.
Resolution Displays a menu allowing the object’s resolution to be changed to Super Fine, Very Fine, Fine, Medium or Coarse.
Color Displays the color menu to change the color or the object. The More option displays the color palette.

Cobalt Share v7 Right Mouse Button
Object Name Identifies the object. Change the object’s name by clicking on the name. The following dialog box appears:
Type a new name and click OK to change.
Transparency Allows the part to be seen through. Adjust the amount of transparency applied to the part by selecting View>Shade Options... and moving the transparency slider.
Object Characteristics For a wireframe object, the menu also provides its geometric characteristics. For example, an ellipse displays the major radius, the minor radius and circumference.
4-13

4-14
Drawing Manipulation Tools Ashlar-Vellum
Selected Drawing ViewWith a drawing view selected, click the right mouse button (Windows) or Control + mouse button (Macintosh), and the popup menu on the right appears.These commands are identical to those in the Drawing View pull-down menu.

Verifying Models and Evaluating Surfaces
Verifying Models and Evaluating SurfacesThis chapter provides tools to take measurements and find the properties of objects, to check for geometric validity and to evaluate the surface quality of models.
Verify MenuThe Verify menu accessess several commands that provide information about the file or about specific objects.
X, Y, Z CommandThe X,Y,Z command displays the model coordinate values of the selected point. Edit a selected value as desired.
5-1

5-2
Verifying Models and Evaluating Surfaces Ashlar-Vellum
Angle 3 Pts CommandThe Angle 3 Pts command calculates the angle formed by three chosen points.
Distance Pt-Pt CommandThe Distance Pt-Pt command calculates the distance between two points taken from the Drafting Assistant.
Minimum Distance CommandThe Minimum Distance command calculates the smallest distance between two selected objects.
This command is useful for checking if two objects interfere with each other. It will calculate the minimum distance among any combination of curves, surfaces or solids.

Cobalt Share v7 Verify Menu
Length CommandThe Length command calculates the length of a line, spline, arc, circle, conic, surface or solid. In the case of surfaces and solids, the command adds all edge lengths, providing a perimeter length value as shown in the graphic here.
Area CommandThe Area command calculates the area of closed curves or a surface. These curves include basic objects such as circles and ellipses but also splines connected to create an enclosed area.
5-3
5-4
Verifying Models and Evaluating Surfaces Ashlar-Vellum
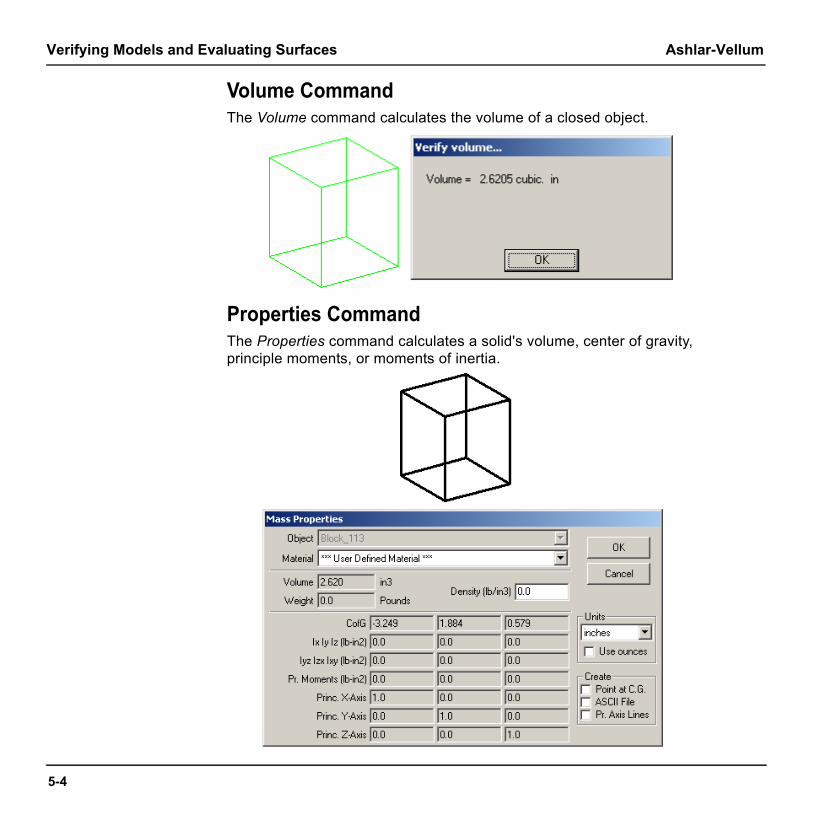
Volume CommandThe Volume command calculates the volume of a closed object.
Properties CommandThe Properties command calculates a solid's volume, center of gravity, principle moments, or moments of inertia.

Cobalt Share v7 Verify Menu
Tech Note:The material selected here is set separately from material hatching used for geometry in a section view.
The Properties dialog box includes the following sections:
Material This pull-down menu specifies a material type.
The menu includes over 60 different materials including various metals, woods, plastics, ceramics, aggregate and liquids.
Select one of these materials and the associated density displays in the Density field. For the User-defined Material enter your own value.
Basic The middle section of the menu includes the volume, weight and density of the selected object. The density is based on the selected material.
Advanced The bottom half of the menu includes the center of gravity, moments of inertia and axis information.
Create This section includes three check boxes: Point at C.G., ASCII file, and Pr. Axis Lines.
Point at C.G. - Clicking this check box places a point at the Center of Gravity for the selected object. Click OK to close the dialog box and a C. G. point appears. The style of the point is based on the selected style for the Point tool.
ASCII File - Clicking in the check box exports the information contained in this dialog box to an ASCII file. When you click OK to close the Properties dialog box, the Save document as window appears asking for a name and location for the ASCII file.
Pr. Axis Lines - Clicking this check box gives the axis direction vectors for the coordinate system where the products of inertia vanish.
5-5

5-6
Verifying Models and Evaluating Surfaces Ashlar-Vellum
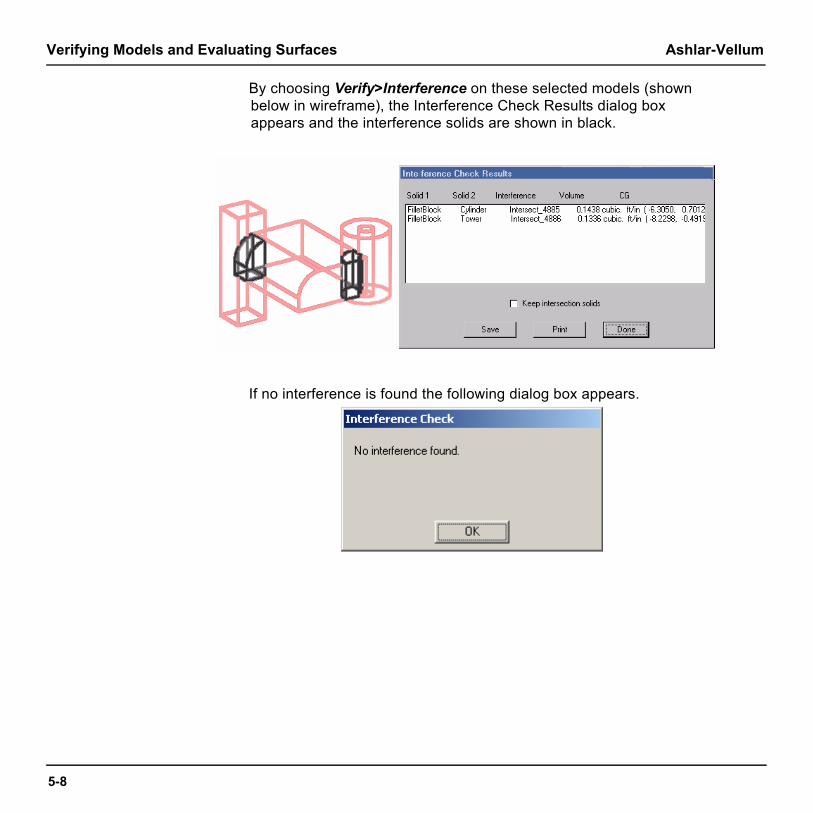
Interference CommandThis command in the Verify menu checks the interface volume of two or more solids to determine an intersection or interference. If an interference is found the Interference Check Results dialog box appears:
The dialog box contains the interference list window including the Keep intersection solids check box, and the Save, Print and Done buttons.
Interference window This window lists the interference between the selected solids and includes Solid 1 and Solid 2 (the solid names), Interference (the interference solid name), Volume (the volume of the interference solid), and the CG (the center of gravity for the interference solid at the x, y and z location).
Keep intersection solids When checked this option retains the intersection solids in the drawing.
Save Click this button to save the interference data to a log file which can be opened in any text editor.
Print Click this button to print the interference data.
Done Click this button to close the dialog box.

Cobalt Share v7 Verify Menu
Using the Interference Command1. Display the model as a wireframe.
2. Select the solids on which to perform the check.3. Choose Verify>Interference.
If an interference is encountered the Interference Check Results dialog box appears listing the interference and displaying the interference solids in black on the model.
4. To retain these interference solids in the model, check the Keep intersection solids box.
5. Click Save or Print to save or print the log of the interference solids.6. Click Done to close the dialog box.
If Keep intersection solids box is checked the model displays the intersection solids.Example:The model here displays three intersecting solids.
5-7
5-8
Verifying Models and Evaluating Surfaces Ashlar-Vellum
By choosing Verify>Interference on these selected models (shown below in wireframe), the Interference Check Results dialog box appears and the interference solids are shown in black.
If no interference is found the following dialog box appears.

Cobalt Share v7 Verify Menu
Show Direction CommandChoosing this command in the Verify menu displays the curve or surface direction arrows in the drawing.
Using the Show Direction Tool1. Select the object(s) to be verified. 2. Choose Verify>Show Direction command.3. The object direction arrows display.
If a curve is selected, arrows appear on the curve showing the curve direction.
If a surface is selected, arrows appear showing the surface normal direction.
5-9

5-10
Verifying Models and Evaluating Surfaces Ashlar-Vellum
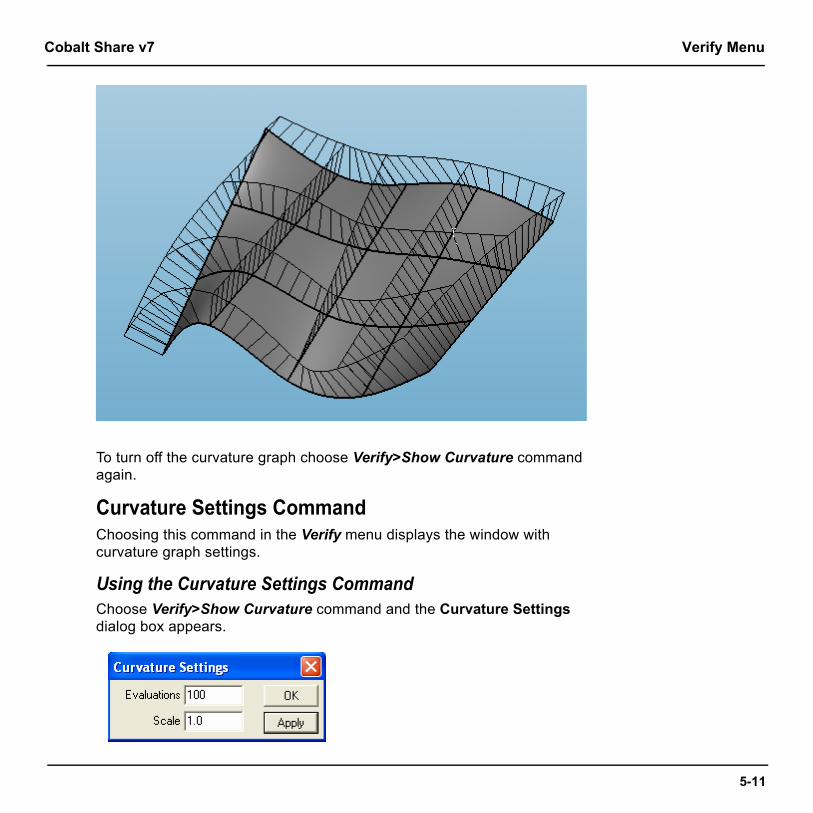
Show Curvature CommandChoosing this command in the Verify menu displays the curve or surface curvature graph in the drawing.
Using the Show Curvature Tool1. Select the object(s) to be verified. 2. Choose Verify>Show Curvature command.3. An object curvature graph displays.
Using the Show Curvature command on the surfaces displays curvature hairs in isoparametric lines only. If the iso line number is 0, the curvature graph displays only at the surface boundary.
Cobalt Share v7 Verify Menu
To turn off the curvature graph choose Verify>Show Curvature command again.
Curvature Settings CommandChoosing this command in the Verify menu displays the window with curvature graph settings.
Using the Curvature Settings CommandChoose Verify>Show Curvature command and the Curvature Settings dialog box appears.
5-11

5-12
Verifying Models and Evaluating Surfaces Ashlar-Vellum
Adjust the length and frequency of the curvature indicators using the controls in the Curvature Settings dialog box.
Compare these two curvature graphs.Evaluations = 150, Scale = 0.5
Evaluations = 25, Scale = 1

Cobalt Share v7 Verify Menu
Object Counts CommandThis command counts the number of objects in the current drawing.
For grouped objects, each individual object is counted as well as the group itself.
Check Object Command
The Check Object command examines an object for proper data structure, topology and issues geometric warnings associated with ACIS data. This includes checks for curves, surfaces, and solids. The tool is frequently used in conjunction with imported data created from non-ACIS kernels. Some of the many items checked include:
5-13

5-14
Verifying Models and Evaluating Surfaces Ashlar-Vellum
Data Structure Checks
• Entity has appropriate child-level entities within; e.g.: body has lump, face has edges, etc.
• Presence (non-NULL) and closure of back pointer from child to parent; e.g.: body's lump points to body.
• The coedge on spline surface has pcurve.
• Pcurve indexing (0/+-1/+-2) is appropriate.
• The pcurve has non-NULL 2D B-spline curve.
• If edge has non-NULL curve, then curve must have equation.
Topological Checks • Loops must be closed in both the next and previous directions.
• Apex edge loops are correct.
• Coedge has a partner, except apex coedge.
• All coedge partners point to same edge.
• Sequential coedges share a vertex.
• Edge is in exactly one of start or end vertex edge groups. For example, edge can be reached for 1 value of i using start()->edge(i)->coedge() and partner and next (or previous) pointers.
Geometric Checks • Face gaps along shared edges and vertices.
• Entities with geometry must have non-NULL geometry. For example, a face points to a surface.
• Analyzes a curve or surface for C1/G1 discontinuties.
• Self intersecting surfaces.
• Analytic surfaces have valid definitions.
• Pcurve surface matches face surface (warning only if not equal since surface could be trimmed).
• Pcurve form agrees with curve form, e.g. closed, open, periodic.
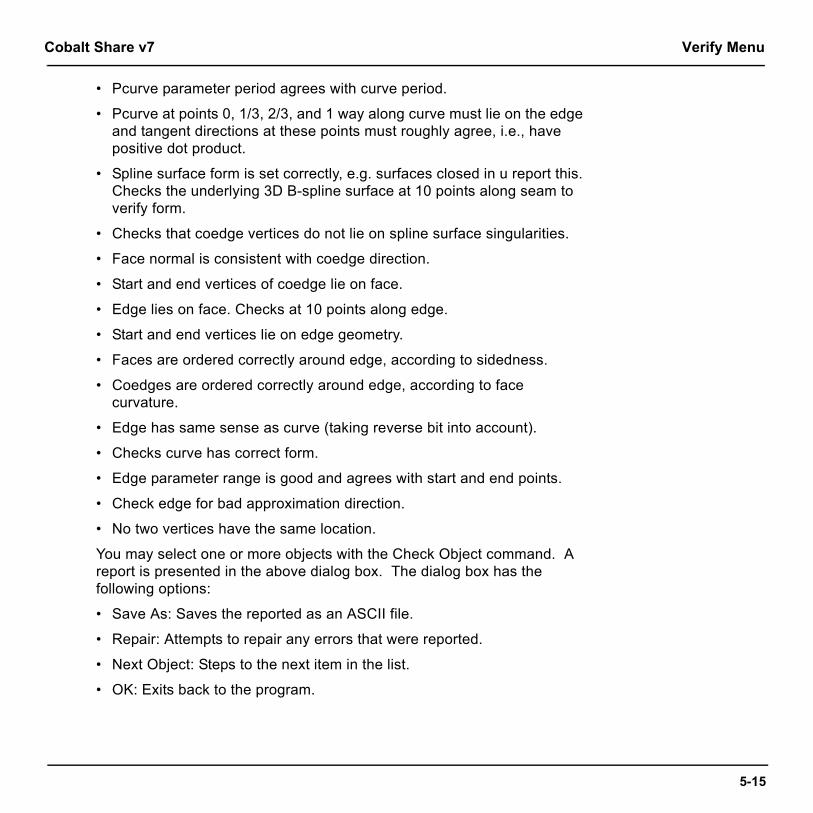
Cobalt Share v7 Verify Menu
• Pcurve parameter period agrees with curve period.
• Pcurve at points 0, 1/3, 2/3, and 1 way along curve must lie on the edge and tangent directions at these points must roughly agree, i.e., have positive dot product.
• Spline surface form is set correctly, e.g. surfaces closed in u report this. Checks the underlying 3D B-spline surface at 10 points along seam to verify form.
• Checks that coedge vertices do not lie on spline surface singularities.
• Face normal is consistent with coedge direction.
• Start and end vertices of coedge lie on face.
• Edge lies on face. Checks at 10 points along edge.
• Start and end vertices lie on edge geometry.
• Faces are ordered correctly around edge, according to sidedness.
• Coedges are ordered correctly around edge, according to face curvature.
• Edge has same sense as curve (taking reverse bit into account).
• Checks curve has correct form.
• Edge parameter range is good and agrees with start and end points.
• Check edge for bad approximation direction.
• No two vertices have the same location.
You may select one or more objects with the Check Object command. A report is presented in the above dialog box. The dialog box has the following options:
• Save As: Saves the reported as an ASCII file.
• Repair: Attempts to repair any errors that were reported.
• Next Object: Steps to the next item in the list.
• OK: Exits back to the program.
5-15

5-16
Verifying Models and Evaluating Surfaces Ashlar-Vellum
Surface EvaluationCobalt Share has the ability to evaluate the smoothness of surfaces. This is useful for identifying surface irregularities. The curvature evaluation is accomplished by placing the surface inside a brightly lit imaginary cylinder with longitudinal stripes. The cylinder stripes are reflected onto the surface to convey the surface smoothness. This is especially important when matching surfaces using the Match Surface tool. The graphics here show the surface evaluation for two matched surfaces using no surface matching (G0), and G1 and G2 surface matching.
Notice how the bands of black differ from graphic to graphic. In the G0 Matched Surfaces graphic (no surface match), the right surface bands are parallel. In the G1 Matched Surfaces graphic, the right surface bands are not as parallel, showing that the right surface was adjusted to match the left surface. In the G2 Matched Surface graphic, the right surface bands show how the surface was even further adjusted to match the left surface.
Evaluate surfaces through the Verify menu using the Surface Analysis commands.
G0 Matched Surfaces G1 Matched Surfaces G2 Matched Surfaces

Cobalt Share v7 Surface Evaluation
Evaluation Through the Verify MenuThe Surface Analysis commands quickly evaluate the smoothness of one or more surfaces. All analysis colors are preset with these commands.
There are four surface analysis commands, Curvature, Draft Angle, Normals and Zebra. When choosing Verify>Surface Analysis, a submenu appears containing the commands.
5-17

5-18
Verifying Models and Evaluating Surfaces Ashlar-Vellum
Curvature CommandThis command creates a curvature plot of the surface. When selecting the command the Curvature Plot dialog box appears containing: analysis styles, histogram, color spectrum and histogram data fields.
The dialog box contains the following elements:
Plot Style This section contains the styles for the analysis and includes: Gaussian, Mean, Min Radius and Max Radius. A description and illustration of each style is provided in the next section.
Histogram Located to the left of the color spectrum in the dialog box, these horizontal bars represent the frequency of a curvature smoothness (change in a curve over the change in curvature) using the color spectrum. The length of the bar represents the frequency. The program calculates this histogram and displays it so that the entire graph fits into the dialog box area.
Color spectrum bar The section displays the color spectrum used to create the histogram.
Histogram data fields The data fields display the maximum and minimum values used to calculate the histogram. When the command is initially selected, the program scans the surface(s) and sets the min and max fields for curvature. If you enter different values in the fields such that a large number of curvature values fall outside of the specified range, a red line appears at the end(s) where the values fall.

Cobalt Share v7 Surface Evaluation
All values are still calculated even though they are not displayed due to the specified range. In the graphic here the large number of values fall outside the maximum value of 0.006.
If you make changes to the values Cobalt Share waits for two seconds of non-action before recalculating the histogram, giving you time to change the values before the image is rendered again.
Return to the initial range by clicking on the selected option again. (The option does not deselect when you do this.) Windows users can also reset the maximum and minimum values by right mouse clicking near the respective end of the spectrum.
5-19
5-20
Verifying Models and Evaluating Surfaces Ashlar-Vellum
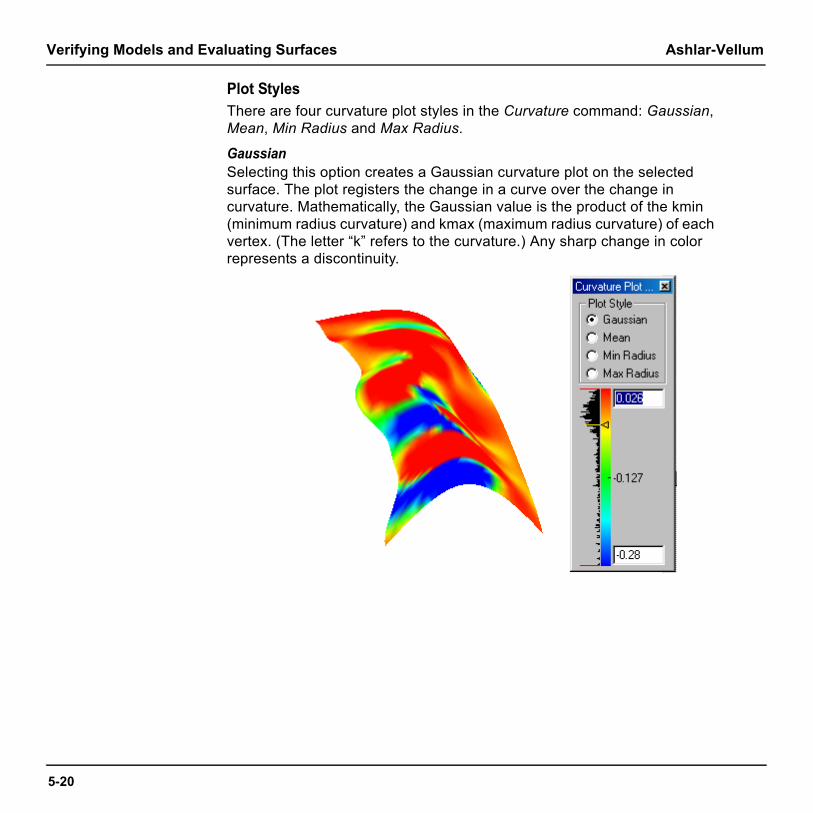
Plot StylesThere are four curvature plot styles in the Curvature command: Gaussian, Mean, Min Radius and Max Radius.
GaussianSelecting this option creates a Gaussian curvature plot on the selected surface. The plot registers the change in a curve over the change in curvature. Mathematically, the Gaussian value is the product of the kmin (minimum radius curvature) and kmax (maximum radius curvature) of each vertex. (The letter “k” refers to the curvature.) Any sharp change in color represents a discontinuity.
Cobalt Share v7 Surface Evaluation
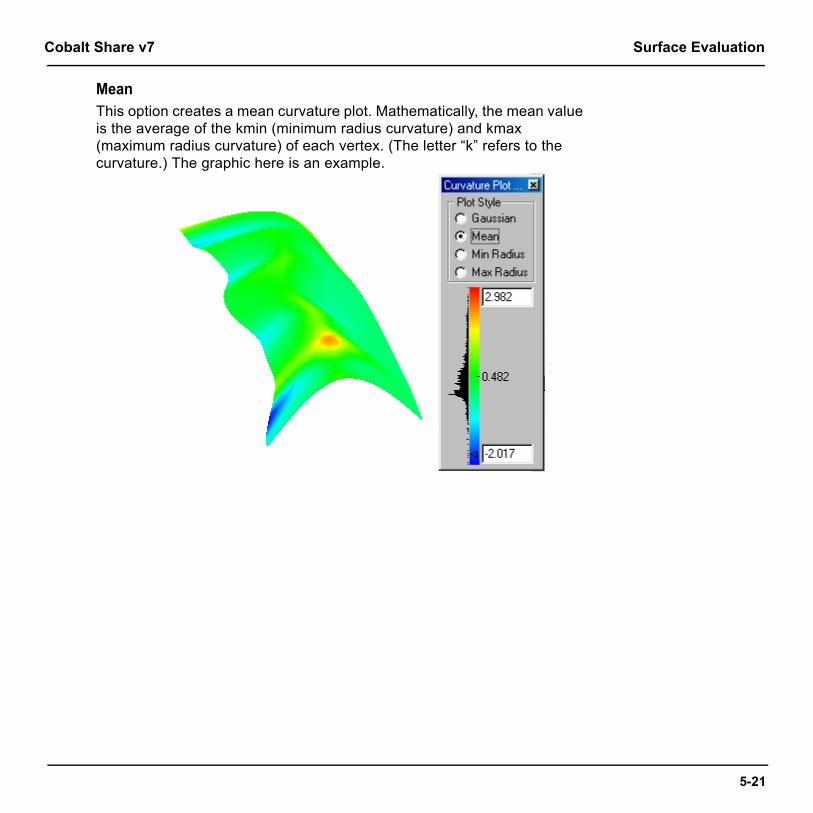
MeanThis option creates a mean curvature plot. Mathematically, the mean value is the average of the kmin (minimum radius curvature) and kmax (maximum radius curvature) of each vertex. (The letter “k” refers to the curvature.) The graphic here is an example.
5-21

5-22
Verifying Models and Evaluating Surfaces Ashlar-Vellum
Min RadiusThis option creates minimum radius curvature plot. Mathematically, the plot is the kmin values (minimum radius curvature) of each vertex. (The letter “k” refers to the curvature.) The graphic here is an example.
Cobalt Share v7 Surface Evaluation
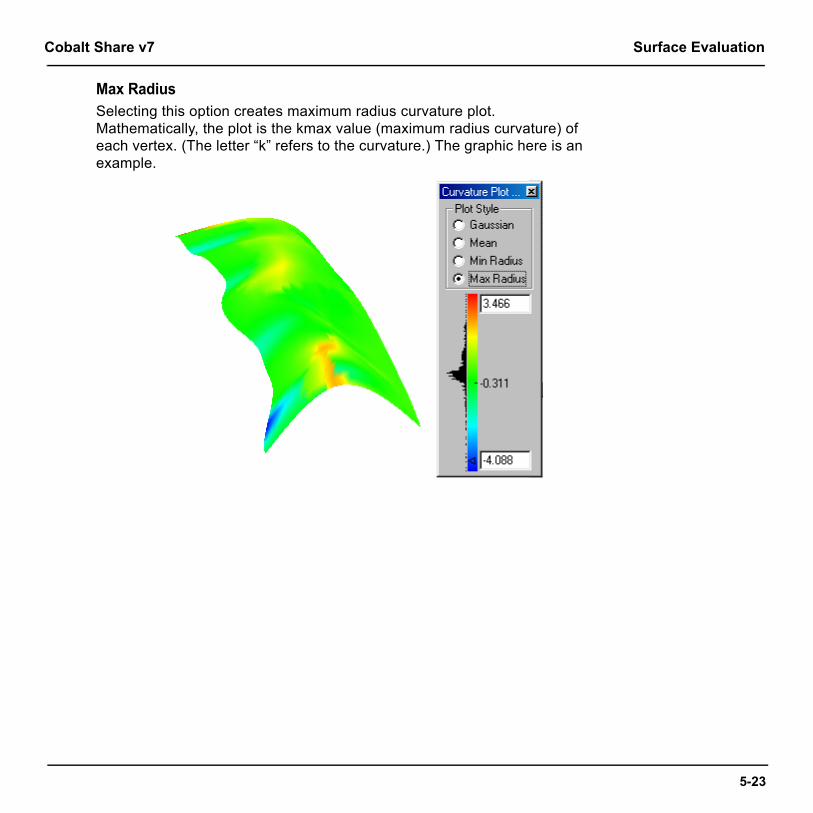
Max RadiusSelecting this option creates maximum radius curvature plot. Mathematically, the plot is the kmax value (maximum radius curvature) of each vertex. (The letter “k” refers to the curvature.) The graphic here is an example.
5-23

5-24
Verifying Models and Evaluating Surfaces Ashlar-Vellum
Using a Curvature Surface Analysis Command1. Select the surface.
2. Choose Verify>Surface Analysis>Curvature.The dialog box displays with the analysis. The geometry also displays the analysis.
3. Select a Plot style, if the desired style is not already selected.A new curvature analysis appears.
4. To display a certain analysis/color area, place the pointer at the location over the color spectrum and click the mouse.
Notice that a triangular indicator appears at the selected location and the related color highlights in the histogram. The same color highlights in black on your surface.
5. To remove the triangular indicator click in the dialog box outside of the color spectrum bar.
6. Change the histogram values in the data fields and the histogram and analysis automatically recalculates.

Cobalt Share v7 Surface Evaluation
Draft AngleThis command evaluates the drafts of an object for molding purposes. When selecting this command the Draft Angle dialog box appears with the draft angle analysis containing the histogram with the analysis, the color spectrum and histogram data fields.
The dialog box contains the following elements:
Histogram Located to the left of the color spectrum in the dialog box, these horizontal bars represent the frequency of a draft angle using the color spectrum. The length of the bar represents the frequency.
Cobalt Share calculates this histogram and displays it so that the entire graph fits into the dialog box area.
Color spectrum bar The section displays the color spectrum used to create the histogram.
Histogram data fields The data fields display the maximum and minimum values used to calculate the histogram. When the command is initially selected Cobalt Share scans the surface(s) and sets the min and max fields for the draft angle analysis.
If you enter different values in the fields so that a large number of values fall outside of the specified range, a red line appears at the end(s) where the values fall. All values are still calculated even though they are not displayed due to the specified range.
If you make changes to the values the program waits for two seconds of non-action
5-25

5-26
Verifying Models and Evaluating Surfaces Ashlar-Vellum
before recalculating the histogram, giving you time to change the values before the image is rendered again.
Return to the initial range by clicking on the selected option again. (The option does not deselect when you do this.) Windows users can also reset the maximum and minimum values by right mouse clicking near the respective end of the spectrum.
Using the Draft Angle Command1. Select the object.
2. Choose Verify>Surface Analysis>Draft Angle.The dialog box displays with the analysis. The geometry also displays the analysis.
3. To display a certain analysis/color area, place the pointer at the location over the color spectrum and click the mouse. A triangular indicator appears at the selected location and the related color highlights in the histogram. The same color highlights in black on your surface.
4. To remove the triangular indicator click in the dialog box outside of the color spectrum bar.
5. Change the histogram values in the data fields and the histogram and analysis automatically recalculates.

Cobalt Share v7 Surface Evaluation
NormalsThis command creates a normals plot of the surface. When selected the Normal Plot Settings dialog box appears.
The dialog box contains the following elements:
Number of Stripes This data field contains the number of stripes that appear on the surface.
Stripe Direction There are three direction options: X-Axis, Y-Axis and Z-Axis.
Colors This sections controls the Stripe Color, Background Color, the color pull-down menu and RGB data fields and sliders.
Stripe Color option: sets the stripe color from the color pull-down menu or the RGB fields.
Background Color option: sets the surface background color from the color pull-down menu or the RGB fields.
5-27

5-28
Verifying Models and Evaluating Surfaces Ashlar-Vellum
This graphic shows an example of a normal surface analysis.
Using the Normal Command1. Select the surface.
2. Choose Verify>Surface Analysis>Normals.The dialog box displays with the analysis. The geometry also displays the analysis.
ZebraThis command creates a zebra plot of the surface. When selected, the Zebra Plot Settings dialog box appears.
The dialog box contains the following elements:

Cobalt Share v7 Surface Evaluation
Number of Stripes This data field contains the number of stripes that appear on the surface.
Stripe Direction This section provides three direction options: X-Axis, Y-Axis and Z-Axis.
Colors This sections contains the Stripe Color, Background Color, the color pull-down menu and RGB data fields and sliders.
Stripe Color option: sets the stripe color from the color pull-down menu or the RGB fields.
Background Color option: sets the surface background color from the color pull-down menu or the RGB fields.
This graphic shows an example of a zebra surface analysis.
Using the Zebra Command1. Select the surface.
2. Choose Verify>Surface Analysis>Zebra.The dialog box displays with the analysis. The geometry also displays the analysis.
5-29

5-30
Verifying Models and Evaluating Surfaces Ashlar-Vellum
Viewing Geometry
Viewing GeometryIn Cobalt Share geometry is viewed from many different angles and scales. A view describes the orientation of your eye position and direction toward the geometry. A number of tools and commands help you view the geometry. The following topics are covered:
• Zooming
• Panning
• View Displays
• View Rotation
• View Commands
• Views and Planes
• Views and Zoom Scale
6-1

6-2
Viewing Geometry Ashlar-Vellum
Zooming Cobalt Share provides several ways to change the magnification of the drawing by zooming in and out using commands, zoom tools, and strokes.
Zoom CommandsZoom In, Zoom Out, Zoom All, Zoom Previous, Zoom Window, Zoom Home and Zoom Ratio from the View menu change the view magnification of the geometry depending upon the selection and input. To zoom a particular area, use the Stroke feature or the Zoom tool, described later in this chapter.
Zoom All CTRL+F (Windows) Zooms in or out to make all objects on the
drawing fill the screen, regardless of the size of the objects.
Zoom In CTRL+] (Windows) Zooms in to the screen center by a factor of
two.
Zoom Out CTRL+[ (Windows) Zooms out from the screen center by a factor
of two.
Zoom Previous
Zoom Window ALT+4 (Windows) Drags a selection fence around the desired
view window (from the upper left to the lower right) and zooms to that selection.
Zoom Home ALT+6 (Windows) Adjusts the view scale so the origin of the
drawing (0, 0, 0) is centered on the screen.
+F (Macintosh)
+] (Macintosh)
+[ (Macintosh)
Zooms to the previous magnification.
+4 (Macintosh)
+6 (Macintosh)

Cobalt Share v7 Zooming
Zoom Ratio CommandThis command in the View menu displays an Input String dialog box.
Enter a ratio in the data field. A value of .5 zooms out by a factor of two. A value of 2 zooms in by a factor of two. Click OK to close the dialog box and save the value. The drawing scales to the value.
Zoom Tools
The Zoom tools are located in the View tool palette.
Using the Magnifying Glass ToolWith the Zoom tools drag a selection fence around an area on the screen, so only that area is displayed.
1. Select the Zoom tool from the tool palette.
2. Drag a box around the area on the screen to magnify or reduce. 3. Release the mouse button. The content of the dragged box is
displayed.
6-3

6-4
Viewing Geometry Ashlar-Vellum
Tip:Use the CTRL (Win-dows) or the OPTION (Macintosh) key to tog-gle between the Zoom In and Zoom Out tool.
Zoom Tool
This tool zooms in by the specified factor. The default factor is two. Specify a zoom scale (1 = full scale) in the Scale field of the Status Line. Zooming causes a visual rather than a physical change.
1. Choose the Zoom In tool. The Message Line reads: Zoom In: Pick area to enlarge [Ctrl (Windows) or Option (Macintosh) = Zoom Out].
To specify a zoom scale, enter the value in the Scale data field.2. Click in the drawing area. That position is displayed in the center of the
screen and the drawing is enlarged by a factor of two. Alternatively, drag a selection fence around an area so only that area is displayed.
The Status Line contains the Scale data field.
Pressing the CTRL (Windows) or the OPTION (Macintosh) key while using this tool causes it to change to the Zoom Out tool.
Using the Dynamic Pan Tool
The Dynamic Pan tool moves the geometry across the screen at the same zoom level. The tools are located in the View pallet.
1. Select the Dynamic Pan tool. The Mes-sage Line reads: Dynamic Pan: Drag mouse to translate view.
The pointer becomes a hand icon.
2. Place the pointer over the section of the screen to move and drag the mouse.When the mouse is released, the view has been repositioned. Notice that the scroll bars have adjusted accordingly.

Cobalt Share v7 Zooming
Tech Note:Windows users: The Stroke Zoom function is not accessible for tools that already use the SHIFT and CTRL keys.
Dynamic Zoom Tool
This tool zooms in or out by the amount specified by your stroke in the drawing area.
1. Choose the Dynamic Zoom tool. The Message Line reads: Dynamic Zoom: Drag mouse to zoom view, move right zooms out.
2. Move the cursor to the drawing area. The cursor becomes the dynamic zoom icon.
3. Drag the mouse to the right to zoom out or to the left to zoom in. The view scale changes according to your stroke.
Stroke Zoom Use stroke commands to zoom, magnifying or reducing the view of the drawing. Stroke commands are useful because they don’t require leaving the current tool in use in order to zoom. Hold down the SHIFT+CTRL keys (Windows) or the key (Macintosh) and drag diagonally across the screen as described below. The pointer takes on the shape when holding down the SHIFT+CTRL keys (Windows) or the key (Macintosh).
Cobalt Share remembers up to eight zoom strokes, enabling you to return to previous zoom magnifications.
Using Stroke Zoom
6-5

6-6
Viewing Geometry Ashlar-Vellum
Drag Diagonally Result
Upper left to lower right Zoom-In: the enlarged image is centered over the stroked area.
Lower right to upper left Zoom Previous: reverses Zoom In stroke to the previous magnification.
Upper right to lower left Zoom-Out: the current screen reduces to the size of the area defined by the stroke.
Lower left to upper right Zoom Previous: reverses Zoom Out stroke to the previous magnification.
Note: For Zoom In and Zoom Out, the size and location of the stroke rectangle is important for determining the result of the zoom operation. For Zoom Previous, the size and location of the stroke rectangle is irrelevant. All cases just give the previous magnification.
Zooming and ViewsCobalt Share retains the last zoom scale set in a particular view. When you zoom in a particular view, change views and zoom in the new view, the view scale in the previous view is not affected.

Cobalt Share v7 Panning a View
Tech Note:An azimuth is an angle measured clockwise from the selected point to the vertical.
Panning a View Cobalt Share provides the Dynamic Pan tool that moves the view of the geometry without using the scroll bars. Hold down the space bar, click on the geometry and drag to the desired location. The view displays at the new position.
There are two view types in Cobalt Share: predefined and user-defined. Use these to set the view orientation of the geometry.
Pre-defined ViewsCobalt Share provides five standard views: side, front, top, isometric and trimetric. Each view is defined by eye point locations on the x, y and z axes or the azimuth and elevation. Changing the values in either eye point or azimuth/elevation automatically changes the other fields.
Change these values as desired. In File>Preferences>General, set the view definitions to Default or Aerospace. Included with each view is a description based on the view definition and its associated values.
Side Default: the view of the y, z plane. The eye point values are: x = 500, y = 0.0, z = 0.0. The azimuth value is 0.0. The elevation is 90.0.
Aerospace: the view of the x, z plane. The eye point values are: x = 0.0, y = -500.0, z = 0.0. The azimuth value is 0.0. The elevation is 90.0.
Front Default: the view of the x, z plane. The eye point values are: x = 0.0, y = -500.0, z = 0.0. The azimuth value is 0.0. The elevation is 90.0.
Aerospace: the view of the y, z plane. The eye point values are: x = -500.0, z = 0.0, z = 0.0. The azimuth value is 0.0. The elevation is 90.0.
6-7

6-8
Viewing Geometry Ashlar-Vellum
Top Default & Aerospace: the view of the x, y plane. The eye point values are: x = 0.0, y = 0.0, z = 500.0. The azimuth value is 0.0. The elevation is 0.0.
Isometric The view of the axes is rotated as shown.
Default: the eye point values are: x = 500.0, y = -500.0, z = 500.0. The azimuth value is -45.0. The elevation is 54.736.
Aerospace: the eye point values are: x = -500.0, y = -500.0, z = 500.0. The azimuth value is -45.0. The elevation is 54.736.
Trimetric The view of the axes is rotated as shown.
Default: the eye point values are: x = 382.176, y = -256.20, z = 195.712. The azimuth value is -33.837. The elevation is 66.957.
Aerospace: the eye point values are: X = -382.176, Y = -256.20, Z = 195.712. The azimuth value is 33.837. The elevation is 66.957.
z
y
x
Isometric
Trackball
z
y
x
Trimetric
Trackball

Cobalt Share v7 Panning a View
User-defined Views Define any new view using the New View command or the Trackball, or modify these views using the Modify View command.
User-defined Views are saved with the current file. They are not saved as defaults for the program.
New View Command The New View command, located in the View menu, specifies a new view based on a current view or entirely independent of any of the available views.
Choosing the New View command brings up the dialog box and contains the following options:
View Name Contains the name of the current view.
Create By Includes a pull-down menu to specify the new view including Eye Pt/Reference Pt, Azimuth/Elevation and Rotate Current View.
Eye Pt/Reference Pt: creates a view based on two sets of values. The Eye Pt refers to the location of the viewer's eye. The Reference Pt refers to an existing point on a model. An asterisk next to the fields denotes
6-9

6-10
Viewing Geometry Ashlar-Vellum
the ability to click the location in the drawing area and have the values automatically entered in the fields.
Azimuth/Elevation: specifies angle of the azimuth and the elevation of your eye with respect to the view.
Rotate Current View: rotates the current view by a specified amount. The values entered in these fields affect the related fields in the other Create By options.
OK Saves the new view and closes the dialog box.
Cancel Closes the dialog box without saving the view.

Cobalt Share v7 Panning a View
Specifying a View with the New View Command1. Choose
View>New View.
The New View dialog box displays the name and location of the current view with its corresponding values. The View Name is highlighted.
2. Enter the new name for the view.
3. Select one of the Create By methods for defining your view.
4. Enter the appropriate values according to the Create By option choosen. For the Eye Pt/Reference Pt method, it is also possible to click the appropriate points in the drawing for the values to be entered automatically into the data fields.
5. Click OK. The dialog box closes and the new view is defined. (Click Cancel to close the dialog box without saving the view.)
Once a new view is created, select it by choosing View>User View and the view name, or by choosing the view in the Trackball pull-down menu.
Be aware that simply rotating the view does not alter the orientation of the work plane in 3D space (except for the side, front and top views).
6-11

6-12
Viewing Geometry Ashlar-Vellum
Trackball—Save Current View Another way to define a view is by using the Trackball command Save Current View at the bottom of the Trackball pull-down menu.
1. Display the Trackball.
2. Rotate your view as desired. 3. Click the view name on the
Trackball to display the pull-down menu.
4. Select Save Current View and release the mouse. The new view saves. When the pull-down menu is displayed again, your new view is listed as User View1. You will also see the addition of a DynView, which is the current non-standard view.
All views defined in this way are numbered sequentially. Rename these views by choosing View>Modify View.

Cobalt Share v7 Panning a View
Modifying a ViewOnly user-defined views may be modified. Standard views cannot be modified. Any attempt to do so creates a duplicate of the view except for the changes you made. This new view becomes a user-defined view which can be renamed. Choose View>User View, for the modified view to be displayed.
To change the name or any coordinate locations for user-defined views, use the View Properties command in the View menu
Using the Modify View Command 1. Choose View>View Properties and select the view to change. The
Modify View dialog box displays.
This dialog box is identical to the New View dialog box except for its title. 2. Make all of the desired changes in the appropriate fields. (See the New
View section earlier in this chapter for an explanation of the data fields.)
3. Click OK. The dialog box closes and the new view is defined. (Click Cancel to close the dialog box without saving the view.)
6-13
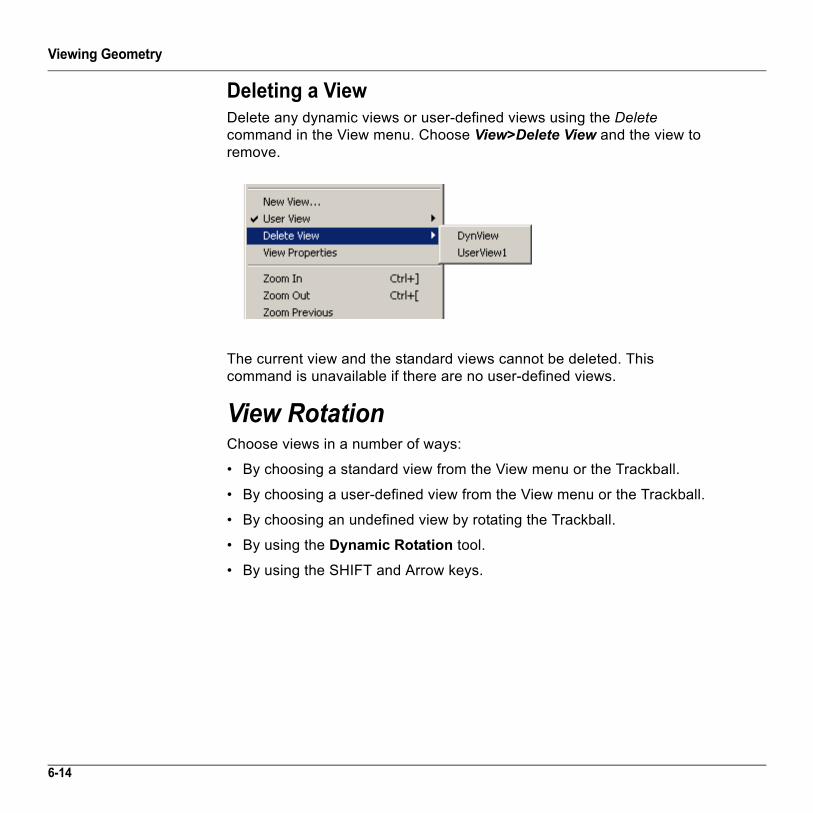
Viewing Geometry
6-14
Deleting a ViewDelete any dynamic views or user-defined views using the Delete command in the View menu. Choose View>Delete View and the view to remove.
The current view and the standard views cannot be deleted. This command is unavailable if there are no user-defined views.
View RotationChoose views in a number of ways:
• By choosing a standard view from the View menu or the Trackball.
• By choosing a user-defined view from the View menu or the Trackball.
• By choosing an undefined view by rotating the Trackball.
• By using the Dynamic Rotation tool.
• By using the SHIFT and Arrow keys.
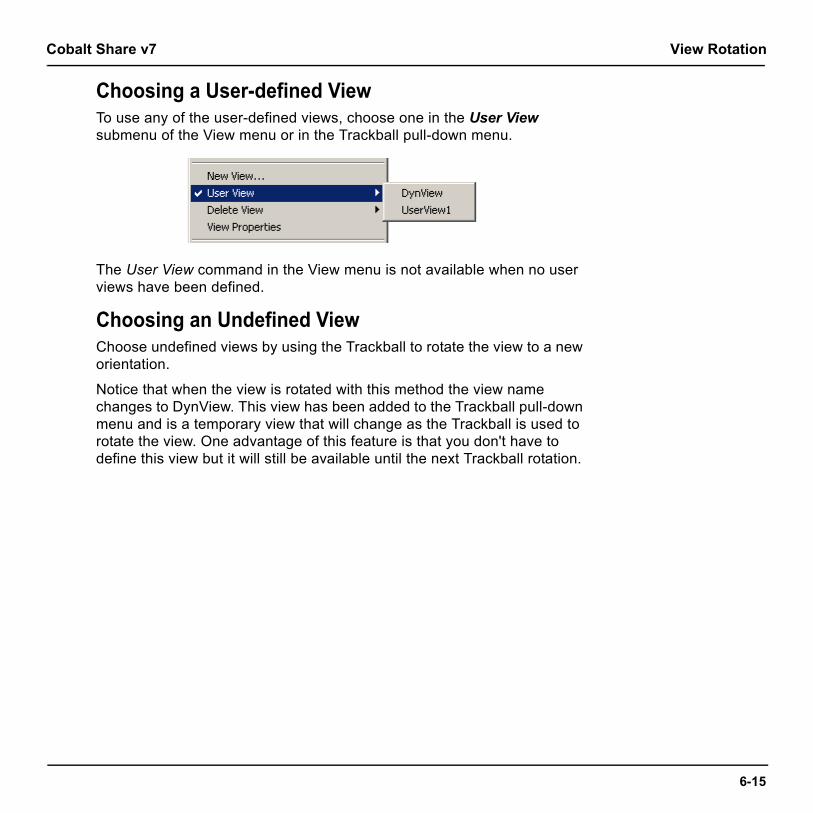
Cobalt Share v7 View Rotation
Choosing a User-defined View To use any of the user-defined views, choose one in the User View submenu of the View menu or in the Trackball pull-down menu.
The User View command in the View menu is not available when no user views have been defined.
Choosing an Undefined View Choose undefined views by using the Trackball to rotate the view to a new orientation.
Notice that when the view is rotated with this method the view name changes to DynView. This view has been added to the Trackball pull-down menu and is a temporary view that will change as the Trackball is used to rotate the view. One advantage of this feature is that you don't have to define this view but it will still be available until the next Trackball rotation.
6-15

6-16
Viewing Geometry Ashlar-Vellum
Dynamic Rotate Tool The Dynamic Rotate tool, located in the View tool palette, rotates the view dynamically around any axis.
1. Select the Dynamic Rotate tool. The Message Line reads: Dynamic Rotate: Drag mouse to rotate view.
The cursor becomes a plus (+) sign. 2. Drag the cursor to change the view, or enter values in the
Status Line to rotate to a specified angle.
Press ENTER (Windows) or RETURN (Macintosh) and the view changes.
Using the Shift and Arrow Keys By holding down the SHIFT key in any view, the arrow keys can be used to rotate the view.
Cobalt Share v7 View Commands
View Commands Redraw Screen CTRL+R (Windows); +R (Macintosh)This command in the View menu refreshes the screen when occasionally the geometry may not be redrawn cleanly.
Redrawing the Screen To redraw all of the geometry and remove extraneous geometry, choose the Redraw Screen command from the View menu.
Stopping a Screen RefreshWindows: press the ESC or BREAK key to stop the redraw. For interrupting long operations such as redraw or linear and polar duplicate, use the BREAK key. If the operation was initiated by a Control key command (such as CTRL+R for redraw) the ESC key is read by MS-Windows and it brings up a task list at the end of the operation.
Macintosh: press ESC or the (Command) key to stop the redrawing of the screen.
6-17
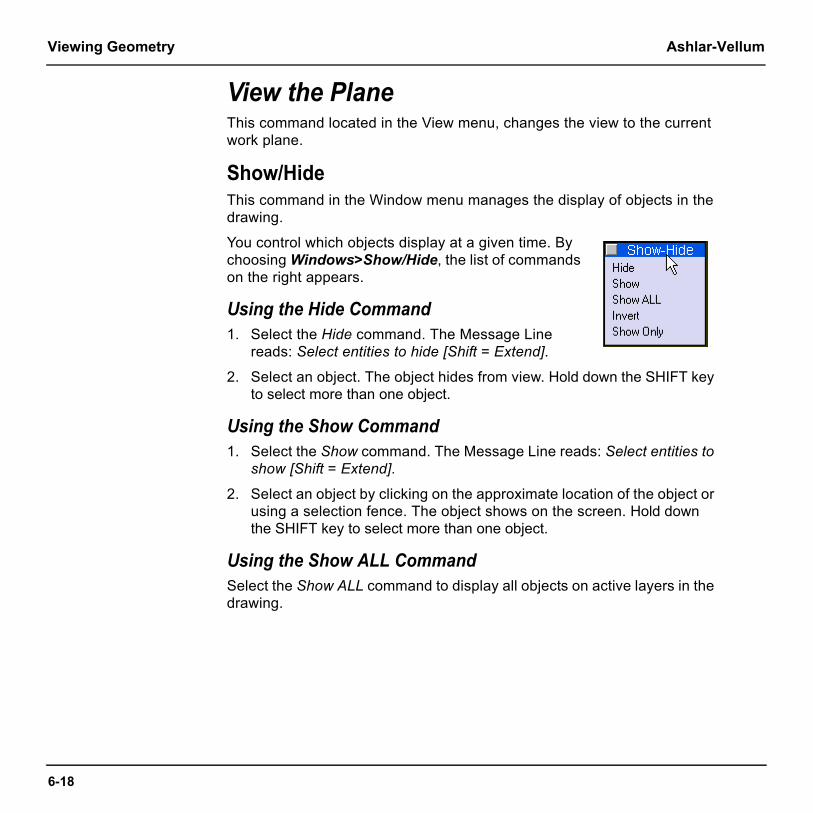
6-18
Viewing Geometry Ashlar-Vellum
View the PlaneThis command located in the View menu, changes the view to the current work plane.
Show/Hide This command in the Window menu manages the display of objects in the drawing.
You control which objects display at a given time. By choosing Windows>Show/Hide, the list of commands on the right appears.
Using the Hide Command 1. Select the Hide command. The Message Line
reads: Select entities to hide [Shift = Extend].
2. Select an object. The object hides from view. Hold down the SHIFT key to select more than one object.
Using the Show Command 1. Select the Show command. The Message Line reads: Select entities to
show [Shift = Extend].
2. Select an object by clicking on the approximate location of the object or using a selection fence. The object shows on the screen. Hold down the SHIFT key to select more than one object.
Using the Show ALL Command Select the Show ALL command to display all objects on active layers in the drawing.

Cobalt Share v7 View the Plane
Using the Invert Command Select the Invert command to display all objects currently hidden and hide all objects currently displayed.
Using the Show Only Command 1. Select the Show Only command. The Message Line reads: Select enti-
ties to show only [Shift = Extend].
2. Select the object to display. Hold down the SHIFT key to select more than one object. All other objects in the drawing are hidden.
Tile (Windows Only)When multiple files are open at the same time, rather than switching back and forth between them, display them all at once using the Horizontal and Vertical Tile commands from the Windows menu.
Tile Vertically This command resizes each file window equally and arranges them vertically across the screen. The files are arranged left to right starting with the file most recently active. The view scale is changed to display all geometry in each file.
6-19

6-20
Viewing Geometry Ashlar-Vellum
Tile Horizontally This command resizes each file window equally and arranges them horizontally down the screen. The files are arranged top to bottom starting with the file most recently active. The view scale is changed to display all geometry in each file.
Clicking on the Maximize button at the top right of the screen resizes the selected file to full screen.

Cobalt Share v7 View the Plane
Arrange Icons (Windows only)
On occasion you may have many open files reduced to their title bars but arranged haphazardly around the screen.
Choose Window>Arrange Icons and the files will be neatly arranged in the lower left corner of the screen.
Open File Windows The bottom of the Window menu shows the names of all the open files in Cobalt Share. To bring a different document to the top choose it from the list.
6-21

6-22
Viewing Geometry Ashlar-Vellum
Views and Zoom Scale Cobalt Share has the view linked to the zoom scale. Each view remembers the last zoom scale set in that view. Change the view and alter the zoom scale, and it won't affect the zoom scale of any other view.
Example: in the top view set the zoom scale to 1:2. Choose the isometric view and change the scale to 1:4. Return to the top view and the scale returns to 1:2.

Layers
LayersThink of visible layers as transparent pages, and hidden layers as invisible pages. Use layers to show and hide various components of a drawing. They are particularly useful in viewing and printing complex drawings. For example, when a part is dimensioned, the dimensions can be placed on a separate layer which is displayed or not, as needed. Layers allow you to print different versions of the same document. For example:• Hide the dimension layer to present a design to a planning team and
show the dimensions when presenting the drawing to engineers.
• Hide some drawing components when printing or plotting. Hide the construction layer so that construction lines and geometry don’t print but remain in the drawing ready for use when you want to alter them.
Cobalt Share provides up to 65,000 layers in a drawing. Layers must be visible to select objects on them. Layers do not have an orientation or origin in the program. The topics explained in this chapter include:• Layer Manager
• Hiding Layers
• Showing Layers
• Displaying Layers
7-1

7-2
Layers Ashlar-Vellum
• Making a Layer the Active Work Layer
Layer ManagerCTRL+L (Windows); +L (Macintosh)The Layer Manager hides and displays layers. The work layer is the active layer on which geometry is created. There are two ways to open the Layer Manager:1. Choose Layout>Layer Manager.2. Click on the Work Layer Indicator
in the lower left corner of the screen to display the pop-up menu and choose the Layer Manager command.
The Layer Manager dialog box appears.
The Layer Manager contains the following elements:Layer list The Layer list displays all layers in the file.

Cobalt Share v7 Layer Manager
Show/Hide Layer This column shows whether a layer is visible or hidden. You cannot hide the active work layer.The eye icon indicates that a layer is visible.
Active Work Layer This column sets the active work layer. To change the active work layer, move the pencil icon to the desired layer.Object CountThis column displays the number of objects on the layer.
Lock Layer This is not supported in Cobalt Share.Layer Color This is not supported in Cobalt Share.By right clicking on a layer the following menu box pops up:
Show All Choosing this option shows all layers.Hide All Choosing this option hides all layers except
the active work layer.
Default LayersAll drawings contain at least three layers. The default layers include: Construction, Dimension and Layer 1.Construction This layer contains all construction lines.Dimension This layer should be reserved for dimensions.Layer 1 This layer is the current work layer for new
files. If the file only contains the default layers all geometry is on Layer 1.
7-3

7-4
Layers Ashlar-Vellum
Hiding LayersYou can hide one layer at a time or all layers but the active work layer.
Hiding One Layer1. Display the Layer Manager dialog box.
2. Click on the eye icon to the left of the layer name to hide.
The eye icon disappears and the layer is now hidden.
Hiding all Layers1. Display the Layer Manager dialog box.
2. Right click on a layer name and choose Hide All.3. Close the Layer Manager dialog box.Notes:• The active work layer cannot be hidden.
• If a layer is hidden and you choose Select All and delete, the objects on the hidden layer are not deleted.

Cobalt Share v7 Showing Layers
Showing LayersIt is possible to turn on one or all layers in the drawing.
Showing One Layer1. Display the Layer Manager dialog box.
2. Click the box to the left of the layer name to show.The eye icon appears next to the layer’s name in the list.
Showing all Layers1. Display the Layer Manager dialog box.2. Right click on a layer name and choose Show All.
Making a Layer the Active Work LayerThere are a number of ways to make a layer the active work layer. These include using the Layer Manager, the Work Layer Indicator, the Isolate Layer command, the Increment Layer command or the Decrement Layer command.
Using the Layer Manager1. Display the Layer Manager dialog box if it is not already displayed.
2. Click in the Work Layer column to the left of the desired layer.The selected layer becomes the work layer as shown by the pencil icon.
3. Close the dialog box.
Using the Work Layer Indicator1. Click on the Work Layer Indicator
in the bottom left corner of the screen to display the menu.
2. Select the layer to make it active.
7-5

7-6
Layers Ashlar-Vellum
Using the Isolate Layer Command Alt+7 (Windows); +7(Macintosh)1. Choose Layout>Isolate Layer.
The Isolate Layer dialog box appears.2. Click on the arrow in the Layer entry
field to display all available layers.3. Select the desired layer.4. Click OK to save this layer as the
active layer and close the dialog box. All other layers are hidden.
Increment Layer ALT+0 (Windows); +0 (Macintosh)Choosing this command in the Layout menu makes the next layer in the Layer Manager dialog box the active work layer and hides all other layers. This command cannot be used if the active layer is the last layer in the list.
Decrement Layer ALT+9 (Windows); +9 (MacintoshChoosing this command in the Layout menu makes the previous layer in the Layer Manager dialog box the active work layer and hides all other layers. This command cannot be used if the active layer is the first layer in the list.

File Management
File ManagementThe following topics are covered in this chapter:
• Files Menu Commands
• Uninstalling Cobalt Share on Windows
File Menu CommandsThe File menu contains commands to manipulate documents.
Open CTRL+O (Windows); +O (Macintosh)
This command in the File menu opens an existing Cobalt Share document. We do not recommend opening Graphite files in Cobalt Share. Use Graphite Share instead. A progress bar appears as the file is opening. This is especially helpful for large files.
The document appears in the drawing area maintaining the same settings as the last time it was saved by the creator.
Use the dialog box to specify the desired document or change folders as necessary.
8-1

8-2
File Management Ashlar-Vellum
Opening a Document
1. Choose File>Open.
The dialog box appears.The current folder displays with the files and/or folders it contains.
2. Choose the appropriate folder containing the document to open.3. Click the File name to open in the list box.4. Click OK.
Recent File ListAnother way to access files opened recently is through the Recent File List that appears in the File menu after the Exit command (Windows) or Quit command (Macintosh). This list contains the names and paths of five the most recent files opened in Cobalt Share.
To open a file from the Recent File List, select the file name from the File menu. If the file has been moved since it was last used and the path has changed, the program provides the Open dialog box to locate the file.

Cobalt Share v7 Uninstalling Cobalt Share on Windows
Close CTRL+F4 (Windows); +F4 (Macintosh)
This command in the File menu closes the current Cobalt Share document. If other Cobalt Share documents are open, they remain open when the current document is closed.
For Windows, the document can also be closed by double-clicking the Control menu at the upper left corner of the title bar. For Macintosh, click the Close button in the upper left corner.
Exit / QuitCTRL+Q (Windows); +Q (Macintosh)
This command in the File menu closes this program.
Uninstalling Cobalt Share on WindowsTo uninstall Cobalt Share on Windows, click the Start button and go to All Programs. Within the Ashlar-Vellum folder will be an Uninstall Cobalt Share Link. Clicking this starts the uninstall procedure. Follow the prompts during the uninstall process.
Uninstalling Cobalt Share on MacintoshTo uninstall Cobalt Share on the Macintosh, locate Cobalt Share folder in the Applications folder on your hard drive and drag it to the trash.
8-3

8-4
File Management Ashlar-Vellum

Exporting
ExportingBefore You BeginAshlar-Vellum is committed to providing the greatest file translation compatibility, allowing you to collaborate with others in the industry. It is important to remember, however, that a file translation is just that—a translation—and just as in translating between foreign languages, slight subtleties may be lost in the process.
Before beginning, establish a clear purpose for any particular translation. When trying to accomplish more than one goal, consider two or more translations.
Always avoid generic options such as DXF or IGES whenever possible. Consider all of the options. Often a better choice is available.
The most important advice we can give is to always stay within the native kernel whenever possible. For Cobalt, Xenon, Argon and Cobalt Share, this means the ACIS kernel, which has been used by a number of other industry leaders. Many other products, which are not ACIS kernel-based, such as PTC's Pro/E and Dassault's SolidWorks, provide an SAT translator module for good results.
9-1

9-2
Exporting Ashlar-Vellum
3D Solid & Surface Translation Effectiveness
If you can't stay within the same kernel, then it's best to go kernel-to-kernel with the Parasolid .X_T or .X_B. This provides the exact solid and surface modeling data embedded in the file for reliable results.
Further down the ladder of choices would be a solids-aware neutral file format such as STEP. While it's more reliable than using IGES, it's less so than any kernel-based translator.
Finally, the last choice to use is a surface-aware neutral file format like IGES. IGES has a whole set of idiosyncrasies and is best left alone as much as possible.
Before exporting, make sure that the target application can handle multiple bodies in one file. If not, use the "Selected Only" option to export an isolated part in a file.
Use Zip or Stuff-it to compress files before emailing. Using an email program's built-in compression has unreliable results on graphics, often converting them to text files.

Cobalt Share v7 Exporting
Cobalt Share exports to many different kinds of file formats. Some types include export options specific to the format. When the Export command is chosen, the dialog box appears.
The dialog box contains these elements:
Export Type Lists the file formats that Cobalt Share exports.
Export Options Includes the options that are available for the selected format.
Selected Only With this option checked, only the selected geometry is exported.
MultiFile This option is useful when exporting files to products that do not have the ability to handle multiple objects within one file, such as Pro/E and SolidWorks. This option creates a file for each object in the drawing, using the same name as in the Design Explorer.
9-3

9-4
Exporting Ashlar-Vellum
End of Line This menu defines an end of line structure for the exported file. There are three options: Mac (LF), PC (CR/LF) and Unix (CR).
OK Click this button to close the Export dialog box and display the standard Save as dialog box.
Cancel Click this button to close the dialog box and end the operation without exporting a file.
Supported Export Formats in Cobalt Share v7This program exports these file formats: Graphite, DWG, DXF, IGES, STEP, ACIS SAT, Parasolid, EPS, CGM, Facet, VRML, RAW, STL, Adobe Illustrator, Catia v4, PICT (Macintosh only), Text, and Macromedia.
GraphiteSelecting this type exports files as a Graphite file. This translator exports text and horizontal, vertical, diameter and radial dimensions in addition to geometry. Angle center mark, ordinate and balloon dimensions are exploded into lines and text. There are no options for this type.
DWGSelecting this type exports DWG files compatible with AutoCAD and other programs that support the DWG file format. (DWG is the binary version of DXF.) DWG includes four format options, Release 12, Release 13, Release 14 and 2000.
Please remember that DWG is not a published standard. It is a file format invented and encoded by Autodesk.
Translating fonts, line weights and patterns, dimensioning styles, hatch patterns and custom symbols are difficult because of system customization at the user level.
When exporting 3D solids and surfaces we recommend using ACIS .SAT rather than DWG whenever possible. For 2D data, DWG works very well.

Cobalt Share v7 Exporting
This translator exports all dimension types: horizontal, vertical, diameter, radial, ordinate, angled, center mark and balloon dimensions. It exports groups, bezier and vector splines. Hatching is converted to lines.
Warning: Layer names are limited to the following character set: a through z A through Z0 through 9 - (dash)_ (underscore)
All other characters in a layer name convert into an underscore.
ACIS data cannot be exported using the DWG translator. If you attempt to use this translator on a file containing ACIS data, a warning dialog box appears asking if you want to export the file using the DXF translator.
Click Yes to create a DXF file or No to end the operation.
Release 12 Exports the file as an R12 file. This does not support ACIS data. Ellipses, conics, splines are converted into polylines. ACIS curves are converted into b-splines. Surfaces and solids are converted into facets (Face3D).
Release 13 Exports the file as an R13 file. Ellipses, splines and ACIS curves are supported. Conics are converted into polylines.
Release 14 Exports the file as an R14 file. Ellipses, splines and ACIS curves are supported. Conics are converted into polylines.
2000 Exports the file as an AutoCAD 2000 file.
Choose the DWG option based on the translator version supported by the target application that will import this file.
9-5

9-6
Exporting Ashlar-Vellum
DXFSelecting this type exports DXF files compatible with AutoCAD. DXF includes four format options: Release 12, Release 13, Release 14 and 2000.
DXF is not a published standard. It is a file format invented and encoded by Autodesk.
Translating fonts, line weights and patterns, dimensioning styles, hatch patterns and custom symbols are difficult because of system customization at the user level.
When exporting 3D solids and surfaces we recommend using ACIS .SAT rather than DXF whenever possible. For 2D data, DXF works very well.
Choose the end of line structure (Mac (LF), PC (CR/LF) or Unix (CR)) from the End of Line pull-down menu.
This translator exports all dimension types: horizontal, vertical, diameter, radial, ordinate, angled, center mark and balloon dimensions. It exports groups, bezier and vector splines. Hatching is converted to lines.
Warning: Layer names are limited to the following character set: a through zA through Z0 through 9- (dash)_ (underscore)
All other characters in a layer name convert into an underscore.
Release 12 Exports the file as an R12 file. This option does not support ACIS data. Ellipses, conics, splines are converted into polylines. ACIS curves are converted into b-splines. Surfaces and solids are converted into facets (Face3D).
Release 13 Exports the file as an R13 file. Ellipses, splines and ACIS curves are supported. Conics are converted into polylines.

Cobalt Share v7 Exporting
ACIS data for surfaces and solids are written as SAT data (Spatial Technologies format). A program that supports DXF R13 does not automatically support SAT data. Check the program manual or with the manufacturer to determine whether it can read SAT data. Geometry exported using this option is considered more accurate than facet representation.
Release 14 Exports the file as an R14 file. Ellipses, splines and ACIS curves are supported. Conics are converted into polylines.
ACIS data for surfaces and solids are written out as SAT data (Spatial Technologies format). A program that supports DXF R14 does not automatically support SAT data. Check your program manual or with the manufacturer to determine whether it can read SAT data. Geometry exported using this option is considered more accurate than facet representation.
2000 This option exports the file as an AutoCAD 2000 file.
Choose the DXF option based on the translator version supported by the target application that will import this file and the end of line setting.
9-7

9-8
Exporting Ashlar-Vellum
IGESSelecting this type exports various versions of IGES files. IGES is a very old standard that is best used only as a last resort. It is highly recommended to find another format, preferably at the kernel-level. IGES includes four format options: Flavor, Write MSBO #186, Write Nurbs #128 and Trimming Curve Prefs.
Choose the end of line structure (Mac (LF), PC (CR/LF) or Unix (CR)) from the End of Line pull-down menu.
This format also exports groups.
Flavor This section includes a pull-down menu allowing you to export different IGES flavors: Generic, AutoCAD, SolidWorks, Vellum v3.0, Vellum v2.7, Pro/E or Alias.
AutoCAD, R13: Certain MSBOs are not supported by AutoCAD. This flavor converts the MSBOs so they can be read in AutoCAD.
SolidWorks: This flavor does not support IGES Conic Arc (#104) which Cobalt Share uses to write an ellipse. Ellipses convert into nurb splines.
Vellum v3.0: All solids convert into surfaces.
Vellum v2.7: All solids and surfaces convert into curves.
Pro/E: Does not include the Trimming Curve Prefs options.
Alias: Includes all the options listed for the Generic flavor.
Use Generic if your specific IGES flavor is not listed.

Cobalt Share v7 Exporting
Write MSBO #186 Check this box to export solids using this IGES5 solid object type. (MSBO #186 is a Manifold Solid B-Rep entity.) If this box is not checked, only 3D parametric trimming curves for analytic surfaces are exported.
Write Nurbs #128 Check this box to export solids using this NURBS surface type.
Trimming Curve Prefs This section includes two check boxes: 2D Parametric and 3D Model Space. Choose one option.
2D Parametric: Exports 2D parametric trimming curves for analytic surfaces. This option is valuable to programs that can read only 2D data and need the 3D data mapped to a 2D parametric.
3D Model Space: Export the actual 3D trim curve in the model space.
See Appendix B for the supported IGES entities.
STEPSelecting this type exports a STEP file. This is the ISO standard acronym for STandard for the Exchange of Product Data. It was designed to replace the IGES format and carry more data. Again, we would advise using a kernel-level translator if it is available before trying STEP. STEP is a neutral file format used to export models among CAD, CAM and CAE applications.
Choose the end of line structure (Mac (LF), PC (CR/LF) or Unix (CR)) for the file from the End of Line pull-down menu. There are no other options for this export type.
9-9

9-10
Exporting Ashlar-Vellum
ACIS SATThis selection exports SAT files compatible with various versions of ACIS. The Designer Elements 3D modeling programs are based on the ACIS kernel from Spatial. If the target application is also ACIS-based or has a historical tie to ACIS, such as Autodesk Inventor, use the SAT file format for the very best possible result. SolidWorks also has a built-in SAT translator. This is the BEST way of translating from Cobalt, Xenon, Argon or Cobalt Share. This format’s only option is Version.
Version The option sets the ACIS export version. The pull-down menu includes: 1.5, 1.6, 1.7, 2.0, 2.1, 3.0, 4.0, 5.0, 6.0, 7.0, 8.0, 9.0, 10.0, 11.0 and 12.0.
This translator exports curves, surfaces, solids and grouped objects. It does not export layers.
EPSSelecting this exports an EPS (encapsulated postscript) file. There are no options for this type.
Usually a better solution is to use the PDF format. While support for PDF is not built into this program, it is readily available. Use Adobe Acrobat or Distiller for the best quality PDFs. PDF files made through the operating system are often less accurate.
CGMThis type exports a computer graphics metafile. This format is a 2D data exchange format which allows graphical data to be stored and exchanged among graphics devices, applications and computer systems. This metafile is not a picture but a description of a picture. There are no options for this translator.

Cobalt Share v7 Exporting
FacetThis selection exports an ASCII Facet file. There are no options for this type.
STLThis selection exports a model ready for stereolithography. There are two STL format options: ASCii and Binary. Unless specifically required by your service bureau, always use ASCii. The precise, mathematical representation of a solid or surface must often be converted into a collection of imprecise planar facets. These facets may be used to export a model to the STL format and when changing a solid or surface to a mesh. The amount of error that results from this conversion is controlled by the settings in the mesh parameters dialog box, which appears after you click OK in the Export box and Save in the Save dialog box.
During the conversion, vertex points are distributed on the surface or solid. These vertices are then grouped into three-sided and four-sided facets. The conversion is deemed acceptable when the generated vertices and facets satisfy the settings. The five available settings are Surface Deviation, Normal Deviation, Edge Length, Aspect Ratio, and STL Facets. These settings are defined in the sections below.
Change the facet settings as needed in the dialog box and then click the Update button to see the number of facets and vertices generated.
9-11

9-12
Exporting Ashlar-Vellum
Determining the combination of settings that will work for a given situation can be a little bit of an art. If one setting becomes too tight, the other settings will have no effect. If one setting becomes too loose, it will have no effect.
Keep in mind that the settings are used by the faceting algorithms if possible. It is often not possible to satisfy all settings simultaneously. In this situation, the algorithm decides which settings to loosen.
The Mesh Parameters dialog box contains the following options:
Surface Deviation Controls the maximum allowed distance between any point on the actual surface or solid and the facet representing that point. The exaggerated figure below shows the largest distance between a patch on the actual surface (yellow) and the corresponding planar facet (brown).
Normal Deviation Controls the maximum allowed angular difference between any normal on the actual surface or solid and the corresponding interpolated normal on the facet.

Cobalt Share v7 Exporting
Edge Length Controls the maximum allowed edge length of any given facet.
Aspect Ratio Controls the maximum allowed aspect ratio of any given facet.
STL Facets Forces the facets generated to be suitable for stereolithography usage. This setting is usually used when exporting STL files.
VRMLThis selection exports virtual reality modeling language files. There are two options for VRML: Version 1.0 and Version 2.0.
RAWSelecting this exports a raw file consisting of triangular vertices. These vertices define the x, y and z locations of the 3D faces which make up the model. There are no options for this type.
After exporting, a dialog box appears displaying the number of entities and vertices in the exported model.
View the raw file by opening it in any text editor.
Adobe IllustratorThis exports an Illustrator file. This Illustrator file is compatible with Adobe Illustrator versions 5.0 through 8.0. Illustrator is a 2D program, so any 3D information will be flattened to the view used during export.
When exporting to Illustrator, always set the zoom level to 1 for a 1:1 export scale before exporting. To do this, select the Zoom tool, type 1 in the Scale field in the lower left corner of the screen and press enter, then continue with the export.
This supports exporting the Hidden and Hidden w/dimmed shade options. All dimensions are converted into lines and text. There are no options for this type.
9-13
9-14
Exporting Ashlar-Vellum
Macintosh only: When exporting an Illustrator file, Cobalt Share automatically displays it with an Illustrator icon. Double-click the file to launch Adobe Illustrator.
TextThis option exports the text contained in the file along with a list of objects contained in the file.
Catia v4This exports a CATIA v4 file. Choose to export only the selected items and have each item export into its own file with the MultiFile option checked.
PICT (Macintosh only)Selecting this type exports Pict files, the Macintosh native file format. There are no options for this type.
MacromediaSelecting this type exports a Macromedia file. Choose the Geometry Quality and the option of creating a log file.
Export CommandThis command in the File menu saves a document in the format specified.
1. Choose File>Export.
The Export dialog box appears.2. Select the export type and its options. If you wish to export only
selected objects on the screen, rather than the entire document, click Selected Only.
3. Click OK. The standard Save document as dialog box appears prompting you for a name and location for the exported file.Windows: The type of file you are exporting is indicated with the appropriate filename extension.
4. Enter the file name and click Save. The exported file is saved with the name and location entered.

Cobalt Share v7 Exporting
Exporting Tips and NotationsThese tips and notations will help you successfully export files.
• Windows - Cobalt Share does not support exporting bitmaps.
• When exporting files from this program for import into another program, determine what version of the translator is used by the other program. Choose the appropriate translator.
• In general, it is best to show all layers before exporting from Cobalt Share, so that you know what is being output.
• AutoCAD does not like the & symbol in the layers table of the DXF file. Remove the symbol from the layer name in Cobalt Share or AutoCAD will generate an error reading in the file.
• If line patterns do not import into AutoCAD accurately from a program DXF or DWG file translation, change the AutoCAD variable LTSCALE to display the patterns at an appropriate scale.
Tips for Exporting to Specific ProductsAutoCAD For best results use ACIS .SAT for 3D data.
Use DXF 2000for 2D data.
Pro/E For best results use ACIS .SAT for 3D data. Use DXF 2000 for 2D data.
SolidWorks Use the ACIS .SAT translator built into SolidWorks for the best results with 3D shapes to Solidworks 2004/5/6. Use the Parasolid translator for Solidworks 2003 and earlier. Do not use IGES to communicate 3D shapes between Ashlar-Vellum 3D modeling programs and SolidWorks. For 2D drawings, use PDF or eDrawings for printing, viewing and visual collaboration. To use the 2D drawing as the basis for a 3D model or further 2D work, use the DXF 2000 export.
9-15

Exporting
9-16
Ashlar-Vellum

Page Setup and Printing
Page Setup and PrintingCobalt Share prints and plots on most printers and plotters supported by your computer. Follow the manufacturer’s instructions for installing and setting up the printer or plotter, then set up the page size as needed.
The following topics are covered:
• Drawing Size
• Printing a Drawing
• Print Window
Print/Page Layout CommandThe Print Layout (Windows) or Page Layout (Mac) command, located in the File menu, displays the dialog box to set the page size, scale and other options.
10-1

10-2
Page Setup and Printing Ashlar-Vellum
Select the command and the Print/Page Layout dialog box appears. The graphic here shows the Advanced Setup mode.
The Print/Page Layout dialog box includes several controls on the right side.
OK Accepts all changes and closes the dialog box.
Close or Cancel Ignores any changes and closes the dialog box.
Fit to Scale Automatically fits the paper size to the model. (Advanced mode only.)
Fit to Area Automatically computes the scale of the model to fit the printable area of the paper.
Align Center Places the drawing in the middle of the paper.
Fit Selected Fits the selected objects into the designated page size.
Print/Page Setup... Goes directly to Print Setup for the Windows operating system or Page Setup for the Mac.
The Print/Page Layout dialog box includes the following sections: Setup Mode, Drawing Size, Scale, Preview and Utility Controls.

Cobalt Share v7 Print/Page Layout Command
Setup Mode SectionThe Drawing Size dialog box supports four setup modes; Single Page, Height and Width, Rows and Columns and Advanced.
For all setup modes, a drawing frame displays in the Preview window. The outer drawing frame represents the physical page size. The inner drawing frame represents the printable page area. The page settings are obtained from the current printer settings. Change the printer settings by clicking the Print Setup (Windows) or Page Setup (Macintosh) buttons on the bottom right of the dialog box. Each mode is overviewed here followed by a more detailed description of the individual settings.
Single Page ModeThe Single Page mode is the simplest printing mode. It is the best mode to use when printing to a large format plotter or for a quick single page plot. As the printer settings are changed, the drawing frame updates to conform to the new settings. Selecting this mode displays the most basic Print/Page Layout dialog box.
Set the plot scale by making a selection from the Scale drop down list or by changing the value in the Scale data field.
10-3

10-4
Page Setup and Printing Ashlar-Vellum
Height and Width ModeThe Height and Width mode is used to generate large standard or user defined plot sizes when using small format print devices (e.g. 8.5 x 11 laser or inkjet printer). Selecting this mode displays the format area of the Drawing Size section.
For drawing sizes larger than what your printing device allows, the drawing is tiled and can later be assembled into the large format plot. The Preview window displays the page tile edges within the drawing frame automatically.
Specify a standard drawing size or a custom drawing size. Set the scale in the Scale section or automatically compute the scale of the model to fit the printable area of the paper using the Fit to Area button.

Cobalt Share v7 Print/Page Layout Command
Rows and Columns ModeThe Rows and Columns mode is used to force whole pages to be used for tiled plots. Unlike the Height and Width mode, this mode will use all the printable area available for the plot, however, the plot will not be a standard size. Selecting this mode displays the Tile area of the Drawing Size section.
Specify the tile rows and columns by changing the values in the Rows and Cols data fields. The Overlap data field controls how tiled pages overlap. The overlap region helps align the pages when assembling the final plot.
10-5

10-6
Page Setup and Printing Ashlar-Vellum
Advanced ModeThe Advanced mode provides access to all height, width, rows and columns plot settings. This mode permits complete control over all aspects of tiling. Selecting this mode displays all options for the Print/Page Layout function.
Specify any of the listed elements as necessary.

Cobalt Share v7 Print/Page Layout Command
Tech Note:When a drawing format size is chosen, be sure to set the page orientation for your printer to the same orientation selected in the Drawing Size dialog box. Choose File>Print Setup or Page Setup to display the Printer dialog box to check your current page orientation.
Drawing Size SectionThis section contains the drawing format sizes available and the height and width of the selected format size.
The format size field includes a pull-down menu listing all of the formats and their sizes.
Choose any of the predefined sizes, A, B, C, D, E, F, G, H, J and K. Each format size includes a listing for portrait and landscape orientation.
The units (inches or mm) are determined by the preference setting. When one of these predefined formats is selected, the size is displayed in the Width and Height fields.
A custom drawing size can be set by selecting the User Defined option in the list, then entering the size in the Width and Height fields.
The drawing sizes displayed in the pull-down list are contained in the DrawSize.ini file in the Environ folder within Cobalt Share folder. This file can be edited, but keep in mind that it may change or be overwritten by future Cobalt Share installations. If you choose to edit the file, save the original version under another name before doing so. Then you will have a copy with which to return to the default sizes.
If the page size is larger than the size supported by your printer, values are automatically entered in the Tile area to accommodate the drawing and appear as such in the Preview window. (Choosing the Advanced mode shows the tiling specifics.) See the next section for more information on tiling.
Before choosing the size, determine what size format your printer or plotter supports.
10-7
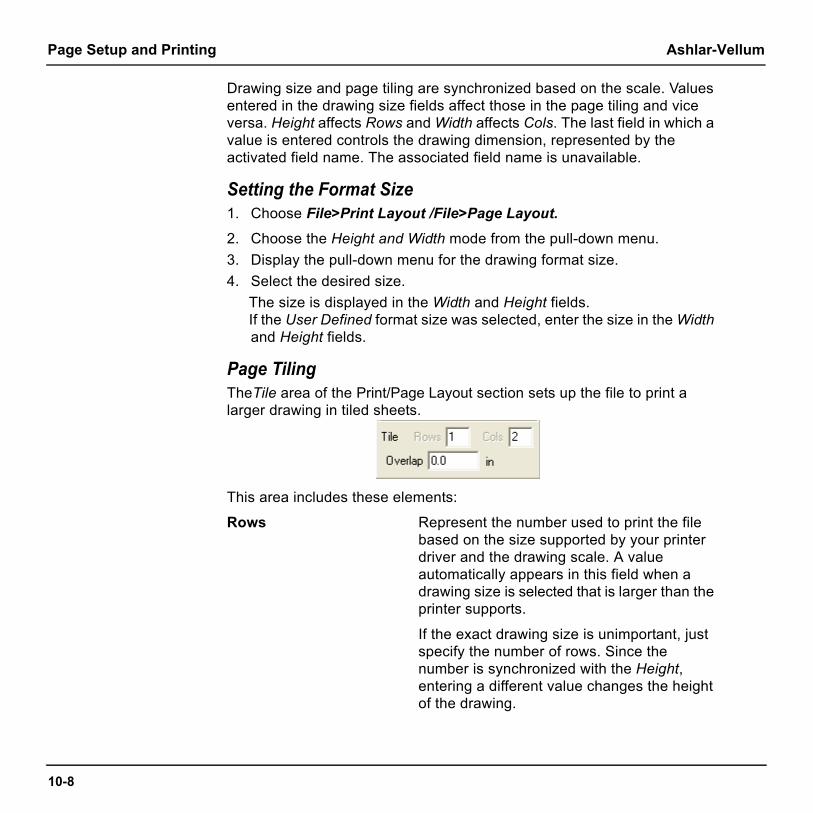
10-8
Page Setup and Printing Ashlar-Vellum
Drawing size and page tiling are synchronized based on the scale. Values entered in the drawing size fields affect those in the page tiling and vice versa. Height affects Rows and Width affects Cols. The last field in which a value is entered controls the drawing dimension, represented by the activated field name. The associated field name is unavailable.
Setting the Format Size1. Choose File>Print Layout /File>Page Layout.
2. Choose the Height and Width mode from the pull-down menu.3. Display the pull-down menu for the drawing format size.4. Select the desired size.
The size is displayed in the Width and Height fields. If the User Defined format size was selected, enter the size in the Width and Height fields.
Page TilingTheTile area of the Print/Page Layout section sets up the file to print a larger drawing in tiled sheets.
This area includes these elements:
Rows Represent the number used to print the file based on the size supported by your printer driver and the drawing scale. A value automatically appears in this field when a drawing size is selected that is larger than the printer supports.
If the exact drawing size is unimportant, just specify the number of rows. Since the number is synchronized with the Height, entering a different value changes the height of the drawing.

Cobalt Share v7 Print/Page Layout Command
Cols Represent the number of columns used to print the file based on the size supported by the printer driver and the height of the drawing. A value automatically enters in this field when a drawing size is selected.
If the exact drawing size is unimportant, just specify a number of columns. Since the number of columns is synchronized with the Width, entering a different value changes the width of the drawing.
Overlap When tiling, specify a page overlap (between 0 and .75 inch or 20 mm). The overlap determines how much of the geometry repeats on the right and top area of each tile page. The overlap region is used to align the tiles when joining the pages.
This graphic shows an example of tiling with three rows and four columns.
Tiling operates independently of the page orientation.
10-9

10-10
Page Setup and Printing Ashlar-Vellum
Setting the Page Tiling1. Choose File>Print/Page Layout.
2. Choose the Rows and Columns mode from the pull-down menu.3. Enter the desired values in the Rows and Cols fields. The drawing size
fields adjust accordingly.4. Specify the overlap for the tiled pages. The units are determined by the
preference setting.
ScaleThis section specifies the scale of the drawing. Select a standard scale from the pull-down list or set a custom scale in the data field.
Scale OptionsThe pull-down list provides these scaling options: User Defined, 5:1, 4:1, 3:1, 2:1, 1:1, 1:2, 1:3, 1:4 and 1:5.
Choosing one of the standard scales enters a value in the data field. A 5:1 scale, enters 5.0 in the field. A 1:5 scale enters a 0.20 in the field.
To specify a custom scale, enter the value in the data field. The scale name changes to User Defined, regardless of the scale entered.
The drawing scales displayed in the pull-down list are contained in the DrawSize.ini file in the Environ folder within Cobalt Share folder. This file can be edited, but keep in mind that it may change or be overwritten by future Cobalt Share installations. If you do choose to edit the file, save the original version under another name before doing so. Then you will have a copy with which to return to the default scales.
Setting the Scale1. Choose File>Print/Page Layout.
2. Display the pull-down list for the scale.3. Select the desired scale. The scale appears in the edit field.
For the User Defined scale option, enter the scale in the data field.The next graphic shows the Preview window of a rectangle at a scale of

Cobalt Share v7 Print/Page Layout Command
2:1. The right graphic shows the Preview window of a rectangle at a scale of 1:2.
Scaling does not change the actual dimensions of the part.
Preview SectionTo assist in choosing the correct format size for the drawing, Cobalt Share includes the Preview window and the Overlay Drawing check box.
Preview WindowA preview of the drawing appears in this section of the dialog box.
The outer drawing frame represents the physical page size. The inner drawing frame represents the printable page area. The page settings are obtained from the current printer settings.
Only objects or part of objects that lie within the page bounds are printed.
10-11

10-12
Page Setup and Printing Ashlar-Vellum
The Preview window displays a rectangle, representing the drawing or the actual geometry. This display is determined by the Overlay Drawing setting. See the next section for more details.
The axis displays in the Preview window only if it's displayed in the drawing area. The axis does not print.
Overlay DrawingThis check box determines how the geometry appears in the Preview window. When the box is not checked, a red rectangle displays, representing the drawing area used by the objects (the graphic on the left below). When the box is checked, the actual geometry displays (the right graphic).
Utility ControlsThe Print/Page Layout dialog box contains utility controls for setting up the drawing. These include the Show Page Breaks in Drawing Window check box, the Fit to Scale button, the Fit to Area button and the Align Center button.
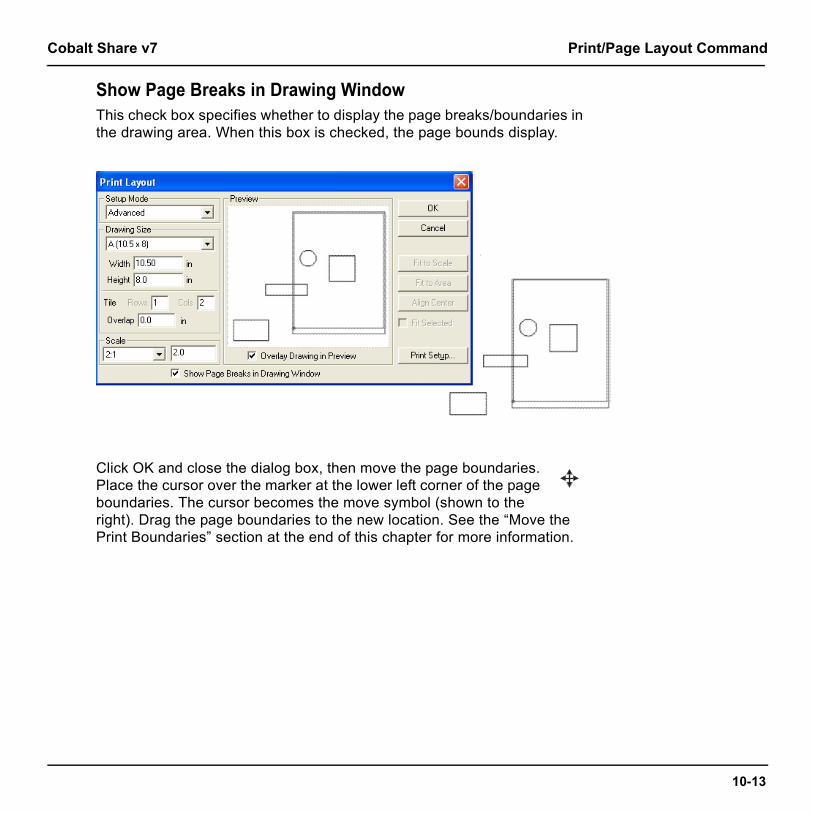
Cobalt Share v7 Print/Page Layout Command
Show Page Breaks in Drawing WindowThis check box specifies whether to display the page breaks/boundaries in the drawing area. When this box is checked, the page bounds display.
Click OK and close the dialog box, then move the page boundaries. Place the cursor over the marker at the lower left corner of the page boundaries. The cursor becomes the move symbol (shown to the right). Drag the page boundaries to the new location. See the “Move the Print Boundaries” section at the end of this chapter for more information.
10-13

10-14
Page Setup and Printing Ashlar-Vellum
Fit to ScaleChecking this box uses the current scale value and automatically changes the height, width and page boundaries to fit the geometry.
This function is only available in the Advanced mode.

Cobalt Share v7 Print/Page Layout Command
Fit to AreaClicking this button automatically computes the scale of the model to fit into the printable area of the page.
For a single page to print, set both Rows and Cols to 1 and press the Fit to Area button.
10-15

10-16
Page Setup and Printing Ashlar-Vellum
Printing a DrawingAfter setting up the page it is ready to print. Choose File>Print Setup (Windows) or File>Page Setup (Macintosh).
Print Setup/Page Setup Choosing this command in the File menu displays the printer setup window.
Choose the necessary settings for paper size and page orientation to agree with the settings in the Print/Page Layout dialog box. Click OK to save settings. See your printer manual for information about setting your printer options.

Cobalt Share v7 Printing a Drawing
Print Command CTRL+P (Windows); +P (Macintosh)This command in the File menu prints or plots the current document as specified in the Drawing Size dialog box.
The area printed or plotted is the portion that fits on the page size specified in the Print/Page Layout dialog box. Choose File>Print Layout to scale the drawing to the appropriate size and reposition the print/plot region.
Specify tiling (printing on several pages to be pasted together) by choosing File>Print Layout>Advanced.
Print to a FileIt is possible to print to a file rather than to a plotter or printer. If you don’t have a plotter attached to your computer, someone else can plot the drawing without having Cobalt Share on the plotter’s computer. The type of plotter choosen when setting up the page determines the format of the plot file.
For a PostScript printer, the file format is Encapsulated PostScript. Use the HPGL language for Hewlett Packard plotters. The computer that finally plots the file must have an application compatible with the file format of your printer or plotter.
10-17

10-18
Page Setup and Printing Ashlar-Vellum
Printing/Plotting RegionBy choosing File>Print only the geometry within the page boundaries prints. To view those boundaries choose File>Print/Page Layout. If your printer does not support the size, gray boundary lines are displayed in the window representing the boundaries, and the tiling feature activates. For all printers and plotters, the plotting region is smaller than the actual page size because most printers and plotters cannot plot to the edge of the paper, allowing room for the margins.
The size of this region is based on the paper size and the printer or plotter driver currently selected.

Cobalt Share v7 Printing a Drawing
Moving the Print BoundariesIf the geometry you want to print is not contained within the page boundaries, move the page boundaries.
1. Choose File>Print Layout.
2. Select the Show Page Breaks in Drawing Window check box.3. Click OK. The dialog box closes and the page boundaries are
displayed in the drawing.4. Place the cursor over the marker at the lower left corner. It becomes
the Move symbol.5. Drag the boundaries to the new location.
10-19
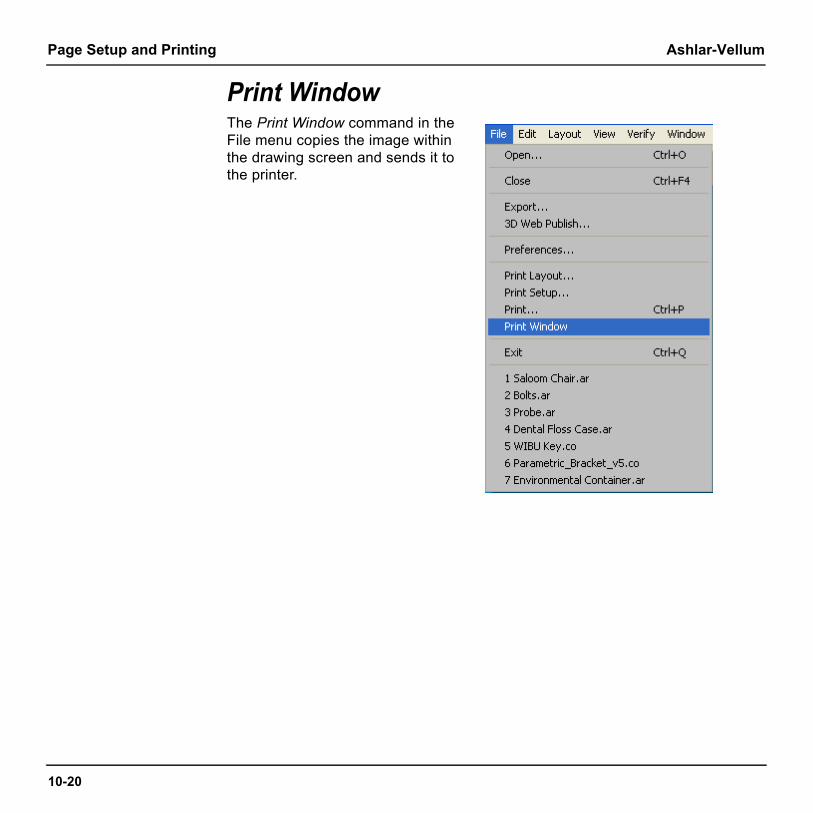
10-20
Page Setup and Printing Ashlar-Vellum
Print WindowThe Print Window command in the File menu copies the image within the drawing screen and sends it to the printer.
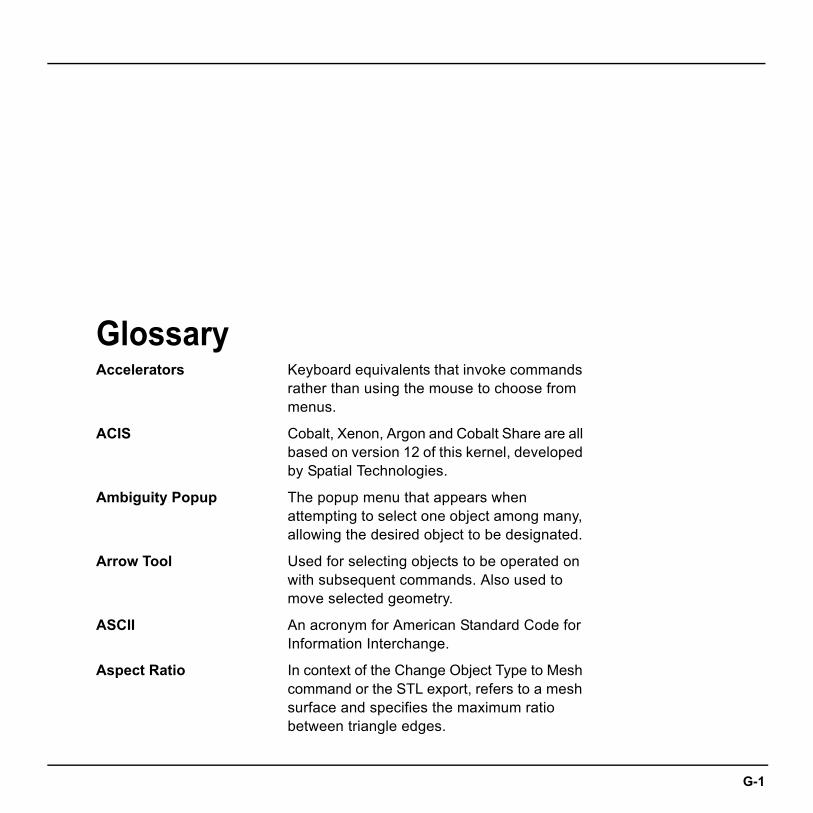
GlossaryAccelerators Keyboard equivalents that invoke commands
rather than using the mouse to choose from menus.
ACIS Cobalt, Xenon, Argon and Cobalt Share are all based on version 12 of this kernel, developed by Spatial Technologies.
Ambiguity Popup The popup menu that appears when attempting to select one object among many, allowing the desired object to be designated.
Arrow Tool Used for selecting objects to be operated on with subsequent commands. Also used to move selected geometry.
ASCII An acronym for American Standard Code for Information Interchange.
Aspect Ratio In context of the Change Object Type to Mesh command or the STL export, refers to a mesh surface and specifies the maximum ratio between triangle edges.
G-1

Glossary
G-2
Attributes The data fields associated with a particular object that define that object. This includes Layer Name, Pen Style, Color, X-Y-Z Coordinates. This is also a page in the Edit Objects dialog box.
Axis Displays the current view orientation of the x, y and z axis in the center of your screen.
Bezier Curve A free form curve. NURB splines are a superset of Bezier curves.
Border A frame showing the boundary of a view.
Boss A cylinder extending from a solid and filleted at the intersection of the two.
Boundary The geometry that defines the limits for operations such as trimming and relimiting.
CAD An acronym for Computer-Aided Design.
CADD An acronym for Computer-Aided Design and Drafting.
CAE An acronym for Computer-Aided Engineering.
CAM An acronym for Computer-Aided Manufacturing.
Case Refers to the capitalization of text and includes lower case, UPPER CASE and Title Caps.
Center Mark A center-line dimension for circles and arcs.
Chamfer A beveled or sloping edge or face between two objects.
Characteristics See Attributes.
Circumference The distance around a circle along its edge: =2 Pi r

Circumscribed Enclosing a circle. In circumscribed polygons, the midpoint of each side of the polygon touches an imaginary circle (i.e. the polygon exactly surrounds the circle).
Click To press and release the mouse button. To click an object, move the pointer to the object, then press and release the button.
Clipboard The memory buffer where selections are stored when the Cut or Copy command is used.
Conic Used in aerospace design field, these objects create curves defined by start point, end point, shoulder and slope control points.
Construction Lines Lines, displayed as dotted or gray lines, used for exact alignment. The Drafting Assistant creates dynamic, temporary construction lines. Permanent construction lines can be created, which are used in the geometry or for alignment, and then deleted.
Control Point The endpoint or midpoint of an object or “knot” point defining a spline. The Drafting Assistant indicates these positions when the pointer is moved near them.
Coons Patch A NURB surface with three or four sides.
Coordinates Positions on axes that specify the point locations. Two-dimensional objects have x,y coordinates; three-dimensional objects have x,y,z coordinates.
Coplanar Refers to objects that lie in the same two dimensional plane.
Cover Surface A surface created from a closed collection of 3D curves.
G-3

Glossary
G-4
Counter Bore A hole created from a hole and a bore where the bore is a straight sided cylinder with a diameter larger than the hole. The hole extends from the end of the bore into the solid to complete the counter bore.
Counter Sink A hole created from a hole and a sink. The sink is an angled hole with a diameter larger than the straight sided hole. The hole extends from the end of the sink into the solid to complete the counter sink.
Crayon Picker A Macintosh color display to chose a color from the crayon box.
Custom Colors (Windows only) This button in the color display customizes up to 16 additional colors in the partial color display.
Cursor The I-beam position indicator in the text tool and boxes which use text. Elsewhere, the position indicator is called a pointer.
Curvature This command in the Verify menu displays a porcupine plot of selected curves or surfaces representing the direction and order of magnitude of the curvature.
Curve A line, circle, arc, ellipse, or spline.
Cutout A profile that has been extruded through a solid and removes all intersecting material.
CYMK Picker A standard color wheel for the Macintosh with the option to specify CYMK values.
Default Built-in settings that are used by the system if a value or choice is not specified by the user.
Defining Points The x, y and z coordinates for the specified points of splines, mesh and slab primitives.

Degenerative An object such as a surface or chamfer where its length at the beginning and/or ending is equal to zero.
Delta A change, usually in position.
Detail View An enlarged view of a specific area of the geometry displayed in a drawing view.
Dialog Box A specification box that appears in response to certain commands. A dialog box provides information that qualifies the execution of those commands.
Dimension A graphic object that displays the distance between two points. A measurement of an object.
Direction The command in the Verify menu that displays the direction of the normals of an object.
Double-click To press and release the mouse button twice in rapid succession.
Drafting Assistant A unique feature which displays feedback notations and construction lines to aid with snap, alignment and constraint operations. The Drafting Assistant facilitates exact construction without requiring you to be exact. When the pointer is close enough to display feedback, the Drafting Assistant locks onto the exact location for you.
Drag To press and hold the mouse button, move the pointer to a new location, and release the button.
DXF An acronym for Data Exchange Format, a format of AutoCAD files.
G-5

Glossary
G-6
Drawing A 2-dimensional line art representation, usually including an orthogonal view and dimensions.
Drawing View A view containing 2D geometry created from a 3D model after choosing the Model to Sheet command.
Dynamic Shading The feature that displays the geometry in the selected shade mode as the geometry is rotated.
DWG AutoCAD's native file format.
Endpoint The first or last point of a line or curve.
EPS Encapsulated PostScript format for printing to a PostScript printer and for importing into compatible applications.
Export To save a document in a file format that can be used by a different application program.
Extrude Creates a 3D object out of a 2D profile.
Face A surface of a solid.
Facet A way of representing surfaces in DXF and DWG files prior to release 13.
Feature A set of operations that may add material to or subtract material from a solid including blending, chamfering, creating holes, bosses, cutout and protrusions.
Field of View The view angle for a perspective.
File An individual document.
Fill Color The color applied to a selected pattern for a smart polygon.
Fill Pattern The pattern applied to a smart polygon.
Fillet An arc of a specified radius tangent to entities.
Flat Shading Shades the object with a painter's algorithm using constant shading techniques.
Flavor The types of IGES files Cobalt, Xenon and Argon can import and export, and the types of IGES files Cobalt Share can export.
Flip Normal When this option is checked in the Shade Options dialog box, the normals of an object are flipped. If light normals are pointed away from the view when rendered, the object will appear dark.
Font The assortment of type used in text.
Geometric Characteristics Characteristics that make up the geometry of an object like length, radius, defining points and Rho value.
Gouraud Shading Shades the geometry based on calculated light intensities at each vertex. It shades more quickly but with a lower quality than Phong shading. This rendering method uses Open GL (Windows) or QuickDraw 3D (Macintosh).
Gouraud w/Edges Shading Shades the geometry based on calculated light intensities at each vertex and displays the face edge boundaries in a specific color.
Gregory Surface A NURB surface with more than four sides.
Group To specify several entities as one unit that will be treated as a single object.
Helix A spiral curve.
Hidden Shading Shades the geometry such that only visible edges are displayed.
G-7

Glossary
G-8
Hidden w/Dimmed Shades the geometry such that the visible edges are displayed and the hidden edges are dimmed.
Histogram A bar graph representing the frequency of a curvature smoothness (change in a curve over the change in curvature) using the color spectrum. The length of the bar represents the frequency.
Hit Radius The distance, in pixels, detectable by the Drafting Assistant between the object and the pointer.
HSL Picker A standard color wheel for the Macintosh to specify Hue, Saturation and Lightness.
HSV Picker A standard color display for the Macintosh to specify Hue, Saturation and Value.
IGES An acronym for Initial Graphics Exchange Specification. The U.S. Department of Commerce, National Bureau of Standards issues IGES as the industry standard among CAD/CAM systems for data exchange in a neutral file format.
Import To load or read a non-Cobalt, Xenon and Argon program file.
Infinite Plane A two dimensional surface with no defining boundaries.
Intensity The lighting level for a light source.
Interference The shared volume created by two or more intersecting objects.
Intersection The position where two lines or curves meet. The curves may actually touch or only intersect when they are extended.

ISO Lines These control the isopram lines drawn for a surface. The Iso (isopram) lines are constant parameter curves that lie on a surface, typically defined in parameter space. The parameter space coordinate system uses U and V coordinates. A 0 (zero) in both fields turns off Iso lines. The appropriate U/V values may enhance the visual appearance of the surface at the expense of drawing speed. The letters, U and V are industry standard space coordinate identifiers (U = horizontal, V = vertical).
Isopram The full name for ISO Lines.
Knot Points The points defining a spline, indicated as vertex points by the Drafting Assistant.
Layer Analogous to transparent media used in conventional manual drafting. Parts can be constructed on several layers which can be made visible or invisible.
Mask To select entities as a group, masking out all others.
Max Edge Refers to a conversion of an object type to mesh. This sets the maximum acceptable length of facets.
Mesh Counts Refers to a button in the Mesh Parameter dialog box which calculates the approximate number of facets based on specified parameters. The dialog box appears when using the Change Object Type command to convert a surface or solid to mesh.
Message Line The top line of the drawing area. It names the current tool and provides instructions for using it.
G-9

Glossary
G-10
Memory Indicator (Windows only) The indicator at the bottom left corner of the Design Elements program window that displays how much RAM is allocated to the program.
Mesh Planar elements defined by nodes or 3D vertices that can be used to represent surfaces but are not surfaces themselves.
META The file format used by the Windows Clipboard.
Mnemonics The key sequence which invokes a command from a menu.
Model The model is the geometry.
Model Point The point specified in the View Rotation Options dialog box about which to rotate a view.
Net Surface A surface defined by M (number of rows) and N (number of columns).
Non-planar Surfaces or points that do not lie in a two dimensional plane.
Normal A perpendicular to a tangent of a curve, surface or solid face.
Normal Deviation Refers to a conversion of an object type to mesh. This sets the maximum angular deviation between adjacent facets.
NURB (or NURBS) Non-uniform Rational B-splines, the type of splines Cobalt, Xenon and Argon create. NURB splines are a superset of Bezier curves. NURB splines provide designers with two interrelated functions.
First, curvature continuity remains intact even when the curve is changed, so kinks won’t

develop as the spline is altered. Second, localized control of a complex curve is provided.
Object An individual piece of geometry, such as a line, arc, circle, surface or solid.
Object Type This refers to a specific kind of geometry and includes curves, surfaces and solids.
Origin The 0,0,0 location on the drawing area. When a new document is opened, 0,0,0 is located in the middle of the screen. The coordinate symbol displays at the origin when the grid is turned on. The origin can be changed at any time.
Pan A horizontal camera movement used when creating movies.
Palette A group of tools. The general tool palette is always displayed to the left of the drawing area.
Parent An object from which other objects are created or operations are performed.
Part A solid with or without associative history.
Paste To place the contents of the Clipboard in the current document.
Perpendicular At a 90° angle.
Perspective Viewing 3D geometry on a two dimensional surface as seen by normal binocular vision.
Phong Shading Shades the geometry based on calculated light intensities at each pixel location.
Phong w/Edges Shading Shades the geometry based on calculated light intensities at each pixel location and
G-11

Glossary
G-12
displays the face edge boundaries in a specific color.
Photorealistic Images resembling photography in the rendering quality.
Photorender The command that renders geomentry in a specified photorealistic mode.
Pick Box The pixel area defined in Preferences that allows an object to be selected.
Pick Objects This is the dialog box with the Ambiguity Popup menu.
PICT The Macintosh graphics file format which uses object-oriented bitmaps or resolution-independent graphics.
Pick To select a location or object by clicking it.
Planar Surfaces or points that lie in a two dimensional plane.
Plot To print on paper using a plotter.
Plotter A vector drawing device for hardcopy output.
Point A location for constructing geometry.
Pointer The position locator similar to a cursor. When a tool is in effect, the pointer takes on a representative shape while in the drawing area.
Polar Duplicate A feature that duplicates an object and rotates the copies around a reference point.
Press To press and hold down the mouse button. This action is most commonly used to view the contents of a menu.

Primitive A basic solid shape defined by linear or quadratic geometry like: block, cylinder, cone, etc.
Profile A closed curve or collection of curves connected end to end.
Pull-direction The direction a part ejects from a mold.
RAW A translator that creates a file containing triangular vertices that define the x, y and z locations of the 3D faces.
Raytrace The function that determines the visibility of objects in a scene by tracing rays from the eye to the objects. The raytrace function calculates the visibility by breaking the scene into smaller pixel areas, producing a photorealistic rendered images.
Redo The command that restores a previous operation. Redo an infinite number of actions in a specific Cobalt Share session.
Redraw To refresh the screen, recreating all objects.
Relative Position A location specified as a certain distance from another location. It is often called the delta position.
Render See Photorender and Shade.
Resolution The appearance of curves, surfaces and solids when displayed, shaded or rendered.
SAT A file format for ACIS-based programs.
Section View A view created by making a section cut through the geometry displayed in a drawing view.
G-13

Glossary
G-14
Selection Fence A bounding box that temporarily appears as the Selection tool cursor is dragged around an area in the drawing.
Setback The distance that a blend extends from three or more intersecting edges.
Shade The command that shades geometry in a specified mode.
Shader Now The shade option activated when the Shade command is selected. Set the mode in the Shade Options dialog box.
Shader Options The dialog box sets the shading mode for the geometry.
Short Cuts Key combinations for performing Cobalt, Xenon, Argon and Cobalt Share operations, allowing customization of the program.
Silhouette The outer most edge of an object from a specific point of view. Silhouette edges are view dependent and cause a significant reduction in drawing speed when changing views.
Solid A container for a collection of 3D surfaces. For example, in a cube, these solids could be defined by 25 individual edges or by 12 shared edges. Solids built with shared edge.
Sphere Trackball The standard trackball that rotates the view by dragging the cursor on the sphere.
Spline A smooth, free-form curve passing through specified points.
Step Trackball The trackball that rotates the view by clicking on a directional arrow.

STL The file format that creates stereolithography files.
Surface Deviation Referring to the conversion of a surface or solid to a mesh, this sets the maximum acceptable distance between the facet and the surface represented by the mesh.
Tangent The point where a line or curve touches a curve without intersecting it. The Drafting Assistant displays the tangent notation of a curve when the pointer nears it.
Tiling Breaks up a drawing into multiple pages to print large drawings.
Torus A solid primitive generated by the revolution of a conic section, like a circle.
Transparency The amount that light can pass through a material.
Triad To illustrate the orientation of the x, y and z axis and the current work plane.
Toggle To switch between two conditions, for example, Show Axis/Hide Axis.
Undo The command that reverses the last editing or creation action. An infinite number of actions can be undone in a specific Cobalt, Xenon, Argon or Cobalt Share session.
Units Measures used for display of geometry.
Vector Splines The slope, shape, control points and control point influence can be modified for splines of this type.
Verify A menu listing commands for determining properties of selected objects.
G-15

Glossary
G-16
Vertex The point at which the sides of an angle intersect or a knot point of a spline.
View Rotation Options The dialog box that specifies trackball rotation parameters.
VRML A file format for exporting virtual reality modeling language files.
Wireframe A 3-dimensional representation showing boundary lines, edges and intersections, but not surfaces.
World Plane The work plane used at the beginning of the construction of a model. Also known as the world coordinate system.
Work Plane The x,y plane used for 2D objects which has an origin of 0,0,0 for all data input. Sometimes referred to as the user or work coordinate system.
Zoom The tool or command that magnifies or reduces an image.

Index
IndexSymbols% point 3-8AACIS SAT
export 9-10Adobe Illustrator
export 9-13alignment angles 3-7ambiguity popup 2-8, 3-11analysis (surface) 5-18Angle 3 Pts command 5-2Area command 5-3arrange
icons 6-21arrow key (nudge distance) 3-10axis
show/hide 4-9azimuth (view) 6-10Bbackgrounds
drawing window color 3-3CCatia v4
export 9-14center of gravity 5-5CGM 9-10chain (selection) 2-15change
preferences 3-13Check Object command 5-14close file 8-3
colorbackground 3-3foreground 3-4preferences 3-3selection 2-4
control pointsselecting 2-11show 2-9
coordinate systemchoosing 4-2global 4-2user-defined 4-2
count (layer objects) 7-3curvature plot 5-18Ddecrement layer 7-7default layers 7-4definitions I-1delete
layer 7-5view 6-14
deselecting 2-15Designer Elements window
Message Line 4-2Status Line 4-1
displayisolines 3-5preferences 3-4resolution 3-5silhouette 3-6
Distance Pt-Pt command 5-2documentation 1-1
margin notes 1-3style conventions 1-4
draft angle analysis 5-26
I-1

Index
I-2
Drafting Assistant% point 3-8alignment angles 3-7creation angles 3-8hit radius 3-7preferences 3-7
drawingobject creation methods 4-1Status Line 4-1
drawing sizeformat 10-9page breaks 10-14page tiling 10-9scale 10-11
drawing viewright mouse button 4-14
DWGentities 1-1export 9-4
DXFentities 1-1export 9-6
dynamicPan tool 6-4Rotate tool 6-16Zoom tool 6-5
Eedge
color 3-6elevation (view) 6-10entire object extents (selection) 2-3Entity Color 3-11EPS export 9-10escape key 4-9evaluation
surface 5-18exit 8-3
exportACIS SAT 9-10Adobe Illustrator 9-13Catia v4 9-14CGM 9-10command 9-14DWG 9-4DXF 9-6end of line 9-4EPS 9-10Facet 9-11Graphite/Vellum 3D 9-4IGES 9-10Macromedia 9-14options 9-3Raw 9-13STL 9-11tips 9-15type 9-3Vellum Draft 9-4Vellum Solids 9-4ViewPoint Media 9-14VRML 9-13
Ffacet
export 9-11file
auto save 8-3close 8-3exit 8-3management 8-1name 8-2new 8-1open 8-1progress bar 4-10recent list 8-2
fontplotter 10-18

Index
foregroundscolor 3-4
formatdrawing size 10-9
front view 6-7GGaussian plot 5-21global
coordinate system 4-2work plane 4-2
Glossary I-1Graphite/Vellum 3D
export 9-4Hhide
axis 4-9command 6-18layer 7-5points 4-9Triad 4-9work plane 4-9
histogram 5-19hit radius 3-7HPGL 10-17IIGES
entities 1-1export 9-10
increment layer 7-7inertia (moment of) 5-5Interference command 5-6Invert command 6-19isolines 3-5isometric view 6-8isopram lines 3-5
Kkey
arrow nudge distance 3-10escape 4-9
Llayer 7-1
decrement 7-7default 7-4delete 7-5hide 7-5increment 7-7isolate 7-7lock 7-3manager 7-2rename 7-4, 7-5show 7-6work 7-3, 7-6
Length command 5-3localization (preferences) 3-10lock
layer 7-3MMacintosh
page setup 10-16Macromedia
export 9-14margin notes 1-3material
Properties command 5-5menu 1-3
choosing commands 1-3Trackball 4-8
Message Line 4-2Minimum Distance command 5-2modifying
view 6-13moment of inertia 5-5
I-3

Index
I-4
mouse 1-5arrow pointer 1-5click 1-5double-click 1-5drag 1-5pointer 1-5right button 4-10selection arrow 1-5
Nnormals plot 5-28OObject Counts command 5-14object type (preferences) 3-5objects 6-19
area 5-3check 5-14count 5-14, 7-3hide 6-18interference 5-6length 5-3properties 5-4selecting 2-1show 6-18show All 6-18volume 5-4
open file 8-1Ppage breaks (drawing) 10-14page setup 10-1page tiling 10-9pan
view 6-7partial objects extents (selection) 2-4pick box 2-3, 3-11plane (work) 4-2Plotter fonts 10-18
point operationsselectable points 2-12selecting 2-9show/hide 2-9, 4-9
pointer 1-5PostScript 10-17pre-defined views 6-7preferences 3-2
changing settings 3-13color 3-3command 3-13display 3-4Drafting Assistant 3-7general 3-9localization 3-10object type 3-5resolution 3-5selection 2-2, 3-11units 3-13user interface 3-9view definitions 3-10
print 10-1boundaries 10-19command 10-17region 10-18render 10-20setup 10-16to file 10-17Window command 10-20
Print Layout Command 10-2Properties command 5-4
center of gravity 5-5density 5-5material 5-5moment of inertia 5-5volume 5-5weight 5-5

Index
RRaw export 9-13recent file list 8-2redraw screen 6-17render
print 10-20resolution
preferences 3-5right mouse button 4-10
color 4-13drawing view 4-14hide all 4-12hide/show only 4-13object characteristics 4-14object name 4-13over an object 4-13over no object 4-10planes 4-11resolution 4-13select all 4-12show all 4-12transparency 4-13view 4-11
rotatedynamic (view) 6-16view 6-10, 6-14
SSAT
export 9-10save
auto 8-3save as 8-3
scaledrawing size 10-11
selected points 3-12
selectionambiguity popup 2-8, 3-11chain 2-15color 2-4control point 2-11deselecting 2-15entity color 3-11fence 2-3, 3-12objects 2-1, 2-6pick box 2-3points 2-9preferences 2-2, 3-11select all 2-13selected points 3-12selection mask 2-13tool 2-6transparency 2-5, 3-12wire weight 2-4, 3-12
selection transparency 3-12short cut
view rotation 4-8show
axis 4-9command 6-18control point 2-9layers 7-6points 4-9Show All command 6-18Show Only command 6-19Triad 4-9work plane 4-9
side view 6-7silhouettes 3-6Status Line 4-1STL export 9-11stroke zoom 6-5submenu 1-3
I-5

Index
I-6
surface analysiscurvature plot 5-19draft angle 5-26Gaussian 5-21histogram 5-19normals plot 5-28Verify menu 5-18zebra plot 5-29
Ttile
files horizontally 6-20files vertically 6-19page 10-9
tipsexporting 9-15
toolsSelection 2-6
top view 6-8Trackball 4-3
Axis Locking 4-3rotation options 4-4, 4-6save view 6-12Sphere 4-3Step 4-5view menu 4-8
transparencyselection 2-5
Triadshow/hide 4-9
trimetric view 6-8Uu/v lines 3-5uninstalling 8-3units
preferences 3-13user interface 3-9
user-definedcoordinate system 4-2
user-defined views 6-9VVellum Draft export 9-4Vellum Solids
export 9-4Verify commands
Angle 3 Pts 5-2Area 5-3Check Object 5-14Distance Pt-Pt 5-2Interference 5-6Length 5-3Minimum Distance 5-2Object Counts 5-14Properties 5-4Volume 5-4X,Y,Z 5-1
viewazimuth 6-10delete 6-14dynamic rotate 6-16elevation 6-10Modify command 6-13New View command 6-9pan 6-7pre-defined 6-7preferences 3-10redraw screen 6-17rotate 6-10, 6-14rotation short cut 4-8show/hide 6-18Trackball 6-12Trackball rotation 4-4, 4-6user-defined 6-9view the plane 6-17zoom 6-6, 6-21
Index
ViewPoint Mediaexport 9-14
Views pop-up menu 4-8Volume command 5-4VRML export 9-13WWindows
print setup 10-16uninstalling 8-3
wire weight 3-12selection 2-4
work layer 7-3, 7-6indicator 7-6
work planeglobal 4-2show/hide 4-9
XX,Y,Z command 5-1Zzebra plot 5-29zoom
all 6-2commands 6-2dynamic 6-5home 6-3in 6-2
out 6-4out 6-2previous 6-2ratio 6-3stroke 6-5tools 6-3views 6-6, 6-22window 6-2
I-7

Index
I-8