section 10 national security and veterans … 10 national security and veterans affairs ......
TRANSCRIPT

Section 10
National Security and Veterans Affairs
This section displays data for nationalsecurity (national defense and homelandsecurity) and benefits for veterans. Dataare presented on national defense and itshuman and financial costs; active andreserve military personnel; and federallysponsored programs and benefits for vet-erans, and funding, budget and selectedagencies for homeland security. The prin-cipal sources of these data are the annualSelected Manpower Statistics and theAtlas/Data Abstract for the United Statesand Selected Areas issued by the Office ofthe Secretary of Defense; Annual Reportof Secretary of Veterans Affairs, Depart-ment of Veterans Affairs, Budget in Brief,Department of Homeland Security; andThe Budget of the United States Govern-ment, Office of Management and Budget.For more data on expenditures and per-sonnel, see Section 30.
Department of Defense (DoD)—TheDepartment of Defense is responsible forproviding the military forces of the UnitedStates. It includes the Office of the Secre-tary of Defense, the Joint Chiefs of Staff,the Army, the Navy, the Air Force, and thedefense agencies. The President serves asCommander-in-Chief of the Armed Forces;from him, the authority flows to the Sec-retary of Defense and through the JointChiefs of Staff to the commanders of uni-fied and specified commands (e.g., U.S.Strategic Command).
Reserve components—The ReserveComponents of the Armed Forces consistof the Army National Guard of the UnitedStates, Army Reserve, Naval Reserve,Marine Corps Reserve, Air National Guard,Air Force Reserve, and Coast GuardReserve. They provide trained personneland units available for active duty in theArmed Forces during times of war ornational emergency, and at such othertimes as national security may require.The National Guard has dual federal/stateresponsibilities and uses jointly providedequipment, facilities, and budget support.The President is empowered to mobilizethe National Guard and to use such of the
Armed Forces as he considers necessaryto enforce federal authority in any state.There is in each Armed Force a readyreserve, a standby reserve, and a retiredreserve. The Ready Reserve includes theSelected Reserve, which provides trainedand ready units and individuals to aug-ment the active forces during times ofwar or national emergency, or at othertimes when required; and the IndividualReady Reserve, which is a manpower poolthat can be called to active duty duringtimes of war or national emergency andwould normally be used as individual fill-ers for active, guard and reserve units,and as a source of combat replacements.Most of the Ready Reserve serves in anactive status. See Table 504 for StandbyReserve and Retired Reserve detail.
Department of Veterans Affairs(VA)—A veteran is someone 18 and older(there are a few 17-year-old veterans) whois not currently on active duty, but whoonce served on active duty in the UnitedStates Army, Navy, Air Force, MarineCorps, or Coast Guard, or who served inthe Merchant Marine during World War II.There are many groups whose active serv-ice makes them veterans including: thosewho incurred a service-connected disabil-ity during active duty for training in theReserves or National Guard, even thoughthat service would not otherwise havecounted for veteran status; members of anational guard or reserve component whohave been ordered to active duty by orderof the President or who have a full-timemilitary job. The latter are called AGRs(Active Guard and Reserve). No one whohas received a dishonorable discharge is aveteran.
The Department of Veterans Affairsadministers laws authorizing benefits foreligible former and present members ofthe Armed Forces and for the beneficia-ries of deceased members. Veterans’ ben-efits available under various acts of Con-gress include compensation for service-connected disability or death; pensions
National Security and Veterans Affairs 325
U.S. Census Bureau, Statistical Abstract of the United States: 2007

for non-service-connected disability ordeath; vocational rehabilitation, educationand training; home loan insurance; lifeinsurance; health care; special housingand automobiles or other conveyances forcertain disabled veterans; burial and plotallowances; and educational assistance tofamilies of deceased or totally disabledveterans, servicemen missing in action, orprisoners of war. Since these benefits arelegislated by Congress, the dates theywere enacted and the dates they apply toveterans may be different from the actualdates the conflicts occurred. VA estimatesof veterans cover all persons dischargedfrom active U.S. military service underconditions other than dishonorable.
Homeland Security—In an effort toincrease homeland security following theSeptember 11, 2001, terrorist attacks onthe United States, President George W.Bush issued the National Strategy forHomeland Security in July 2002 andsigned legislation creating the Depart-ment of Homeland Security (DHS) inNovember 2002.
The National Strategy sets forth a plan toimprove homeland security through 43initiatives that fall within six critical mis-sion areas. These mission areas are intelli-gence and warning, border and transpor-tation security, domestic counter-terrorism, protection of critical infrastruc-ture, defense against catastrophic terror-ism, and emergency preparedness andresponse.
The funding and activities of homelandsecurity are not only carried out by DHS,but also by other federal agencies, state,and local entities. In addition to DHS,there are 32 other federal agencies thatcomprise federal homeland security fund-ing. DHS, along with four otheragencies—Department of Defense (DoD),Energy (DoE), Health and Human Services(HHS), and Justice (DoJ)—account for mostof the federal spending for homelandsecurity.
Department of Homeland Security(DHS)—The mission of DHS is to lead aunified effort to secure the United States.This effort is to prevent and deter terror-ist attacks and to protect against andrespond to threats and hazards to thenation. This effort is to ensure safe and
secure borders, to welcome lawful immi-grants and visitors, and to promote thefree flow of commerce.
The creation of the Department of Home-land Security, which began operations inMarch 2003, represents a fusion of 22federal agencies (legacy agencies) to coor-dinate and centralize the leadership ofmany homeland security activities under asingle department. Out of these agencies,the Secret Service and Coast Guard remainintact and report directly to the Secretary.Immigration and Naturalization Services(INS) adjudications and benefits programsreport directly to the Deputy Secretary asthe U.S. Citizenship and Immigration Ser-vices (USCIS).
The Customs and Border Protection (CBP)is responsible for managing, securing,and controlling U.S. borders. This includescarrying out traditional border-relatedresponsibilities, such as stemming thetide of illegal drugs and illegal aliens;securing and facilitating legitimate globaltrade and travel; and protecting the foodsupply and agriculture industry frompests and disease. CBP is composed ofthe Border Patrol and Inspections (bothmoved from INS) along with Customs(absorbed from the Department of Trea-sury) and Animal and Plant Health Inspec-tions Services (absorbed from the Depart-ment of Agriculture).
Immigration and Customs Enforcement(ICE) is the largest investigation arm ofDHS. ICE is composed of four law enforce-ment divisions: Investigations, Intelli-gence, Federal Protective Service, andApprehension, Detention, and Removal.ICE investigates a wide range of nationalsecurity, financial and smuggling viola-tions including drug smuggling, humantrafficking, illegal arms exports, financialcrimes, commercial fraud, human smug-gling, document fraud, money laundering,child pornography/exploitation, andimmigration fraud.
The Transportation Security Administra-tion (TSA) was created as part of the Avia-tion and Transportation Security Act onNovember 19, 2001. TSA was originallypart of the Department of Transportation,but was moved to Department of Home-land Security. TSA’s mission is to providesecurity to our nation’s transportation sys-tems with a primary focus on aviationsecurity.
326 National Security and Veterans Affairs
U.S. Census Bureau, Statistical Abstract of the United States: 2007

Figure 10.2Living Veterans by Age: 2005
55–59 years old3,484
50–54 years old2,034
35–39 years old1,317
40–44 years old1,679
45–49 years old1,886
Under 35 years old1,966
Source: Chart prepared by U.S. Census Bureau. For data, see Table 508.
Total = 24,387
60-64 years old2,673
65 years old and over9,348
(In thousands)
Figure 10.1Department of Defense Manpower: 2005
Navy363
Army493
1Includes National Guard, Reserve, and retired regular personnel on extended or continuous active duty. Excludes Coast Guard.
Source: Chart prepared by U.S. Census Bureau. For data, see Table 500.
Total1 = 1,389
Marines180
Air Force354
(In thousands)
National Security and Veterans Affairs 327
U.S. Census Bureau, Statistical Abstract of the United States: 2007

Table 490. National Defense Outlays and Veterans Benefits: 1960 to 2007
[In billions of dollars (53.5 represents $53,500,000,000) except percent. For fiscal year ending in year shown, see text, sec-tion 8. Includes outlays of Department of Defense, Department of Veterans Affairs, and other agencies for activities primarily relatedto national defense and veterans programs. For explanation of average annual percent change, see Guide to Tabular Presenta-tion. Minus sign (−) indicates decrease]
Year
National defense and veterans outlays(bil. dol.) Annual percent change 1 Defense outlays
percent of—
Totaloutlays
Defense outlays
Veteransoutlays
Totaloutlays
Defenseoutlays
Veteransoutlays
Federaloutlays
Grossdomesticproduct 2
Currentdollars
Constant(FY2000)
dollars
1960 . . . . . . . . 53.5 48.1 300.2 5.4 2.5 2.4 3.1 52.2 9.31970 . . . . . . . . 90.4 81.7 375.1 8.7 0.3 −1.0 13.6 41.8 8.11980 . . . . . . . . 155.1 134.0 267.1 21.1 13.9 15.2 6.3 22.7 4.91985 . . . . . . . . 279.0 252.7 356.5 26.3 10.3 11.1 2.7 26.7 6.1
1990 . . . . . . . . 328.4 299.3 382.7 29.1 −1.6 −1.4 −3.2 23.9 5.21994 . . . . . . . . 319.2 281.6 322.8 37.6 −2.3 −3.2 5.4 19.3 4.1
1995 . . . . . . . . 310.0 272.1 305.9 37.9 −2.9 −3.4 0.8 17.9 3.71996 . . . . . . . . 302.7 265.8 289.2 37.0 −2.3 −2.3 −2.4 17.0 3.51997 . . . . . . . . 309.8 270.5 288.4 39.3 2.3 1.8 6.3 16.9 3.31998 . . . . . . . . 310.2 268.5 282.6 41.8 0.1 −0.8 6.3 16.2 3.11999 . . . . . . . . 320.2 274.9 283.7 43.2 3.2 2.4 3.4 16.1 3.0
2000 . . . . . . . . 341.6 294.5 294.5 47.1 6.7 7.1 9.0 16.5 3.02001 . . . . . . . . 350.5 305.5 297.2 45.0 2.6 3.7 −4.3 16.4 3.02002 . . . . . . . . 399.5 348.6 329.4 51.0 14.0 14.1 13.2 17.3 3.42003 . . . . . . . . 461.9 404.9 365.3 57.0 15.6 16.2 11.8 18.7 3.72004 . . . . . . . . 515.7 455.9 397.3 59.8 11.6 12.6 4.8 19.9 3.9
2005 . . . . . . . . 565.5 495.3 419.8 70.2 9.7 8.6 17.4 20.0 4.02006, est . . . . . 606.4 535.9 443.1 70.4 7.2 8.2 0.4 19.8 4.12007, est . . . . . 601.4 527.4 427.4 73.5 −0.8 −1.6 4.4 19.0 3.8
1 Change from immediate prior year; for 1960, change from 1955. 2 Represents fiscal year GDP; for definition, see text,Section 13.
Source: U.S. Office of Management and Budget, Budget of the United States Government, Historical Tables, annual. See also<http://www.whitehouse.gov/omb>.
Table 491. National Defense Budget Authority and Outlays for DefenseFunctions: 1990 to 2006
[In billions of dollars (303.3 represents $303,300,000,000), except percent. For year ending September 30. Minus sign(−) indicates decrease]
Function 1990 1995 1998 1999 2000 2001 2002 2003 2004 20052006,
est.
Total budget authority 1 . . . . 303.3 266.4 271.3 292.3 304.1 335.5 362.1 456.2 490.6 505.8 561.8Department of Defense-Military . . . . 293.0 255.7 258.5 278.5 290.4 319.4 345.0 437.9 471.0 483.9 538.2
Military Personnel . . . . . . . . . . . 78.9 71.6 69.8 70.6 73.8 76.9 87.0 109.1 116.1 121.3 115.8Operation and Maintenance . . . . 88.4 93.7 97.2 104.9 108.7 115.7 133.2 178.3 189.8 179.2 178.3Procurement . . . . . . . . . . . . . . 81.4 43.6 44.8 51.1 55.0 62.6 62.7 78.5 83.1 96.6 86.2Research, Development, Test,and Evaluation . . . . . . . . . . . . 36.5 34.5 37.1 38.3 38.7 41.6 48.7 58.1 64.6 68.8 71.0
Military Construction . . . . . . . . . 5.1 5.4 5.5 5.4 5.1 5.4 6.6 6.7 6.1 7.3 8.9Family Housing. . . . . . . . . . . . . 3.1 3.4 3.8 3.6 3.5 3.7 4.0 4.2 3.8 4.1 4.4Other . . . . . . . . . . . . . . . . . . . −0.4 3.4 0.3 4.6 5.6 13.5 2.7 3.0 7.5 6.6 3.4
Atomic energy defense activities . . . 9.7 10.1 11.7 12.4 12.4 14.3 15.2 16.6 16.8 17.9 18.1Defense-related activities . . . . . . . . 0.7 1.0 1.1 1.4 1.3 1.7 1.9 2.0 2.8 4.0 5.6
Total outlays 1 . . . . . . . . . . . 299.3 272.1 268.5 274.9 294.5 305.5 348.6 404.9 455.9 495.3 535.9Department of Defense-Military . . . . 289.8 259.4 256.1 261.3 281.2 291.0 332.0 387.3 436.5 474.2 512.1
Military personnel . . . . . . . . . . . 75.6 70.8 69.0 69.5 76.0 74.0 86.8 106.7 113.6 127.5 116.3Operation, maintenance . . . . . . . 88.3 91.0 93.4 96.3 105.9 112.0 130.0 151.4 174.0 188.1 192.6Procurement . . . . . . . . . . . . . . 81.0 55.0 48.2 48.8 51.7 55.0 62.5 67.9 76.2 82.3 88.8Research, Development, Test,and Evaluation . . . . . . . . . . . . 37.5 34.6 37.4 37.4 37.6 40.5 44.4 53.1 60.8 65.7 70.8
Military construction. . . . . . . . . . 5.1 6.8 6.0 5.5 5.1 5.0 5.1 5.9 6.3 5.3 7.3Family housing . . . . . . . . . . . . . 3.5 3.6 3.9 3.7 3.4 3.5 3.7 3.8 3.9 3.7 3.8Anticipated funding for Global . . .War on Terror . . . . . . . . . . . . . (X) (X) (X) (X) (X) (X) (X) (X) (X) (X) 30.1
Other . . . . . . . . . . . . . . . . . . . −1.2 −2.4 −1.9 0.1 1.6 1.1 −0.5 −1.5 1.7 1.5 2.4Atomic energy activities . . . . . . . . . 9.0 11.8 11.3 12.2 12.1 12.9 14.8 16.0 16.6 18.0 18.7Defense-related activities . . . . . . . . 0.6 0.9 1.1 1.4 1.2 1.6 1.8 1.6 2.8 3.1 5.1
X Not Applicable. 1 Includes defense budget authority, balances, and outlays by other departments.
Source: U.S. Office of Management and Budget, Budget of the United States Government, Historical Tables, Budget Authorityby Function and Subfunction, Outlay by Function and Subfunction, annual. See also <http://www.whitehouse.gov/omb/budget>.
328 National Security and Veterans Affairs
U.S. Census Bureau, Statistical Abstract of the United States: 2007
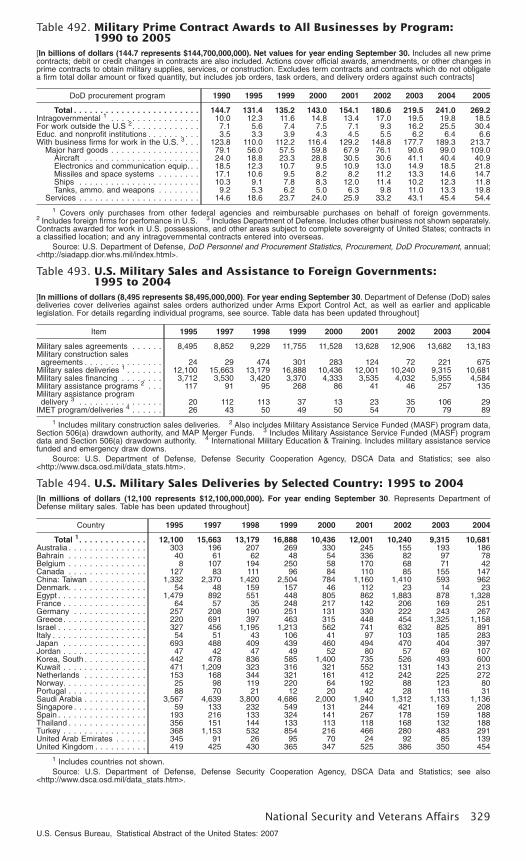
Table 492. Military Prime Contract Awards to All Businesses by Program:1990 to 2005
[In billions of dollars (144.7 represents $144,700,000,000). Net values for year ending September 30. Includes all new primecontracts; debit or credit changes in contracts are also included. Actions cover official awards, amendments, or other changes inprime contracts to obtain military supplies, services, or construction. Excludes term contracts and contracts which do not obligatea firm total dollar amount or fixed quantity, but includes job orders, task orders, and delivery orders against such contracts]
DoD procurement program 1990 1995 1999 2000 2001 2002 2003 2004 2005
Total . . . . . . . . . . . . . . . . . . . . . . . . 144.7 131.4 135.2 143.0 154.1 180.6 219.5 241.0 269.2Intragovernmental 1 . . . . . . . . . . . . . . . . . 10.0 12.3 11.6 14.8 13.4 17.0 19.5 19.8 18.5For work outside the U.S 2. . . . . . . . . . . . . 7.1 5.6 7.4 7.5 7.1 9.3 16.2 25.5 30.4Educ. and nonprofit institutions . . . . . . . . . . 3.5 3.3 3.9 4.3 4.5 5.5 6.2 6.4 6.6With business firms for work in the U.S. 3 . . . 123.8 110.0 112.2 116.4 129.2 148.8 177.7 189.3 213.7
Major hard goods . . . . . . . . . . . . . . . . . 79.1 56.0 57.5 59.8 67.9 76.1 90.6 99.0 109.0Aircraft . . . . . . . . . . . . . . . . . . . . . . 24.0 18.8 23.3 28.8 30.5 30.6 41.1 40.4 40.9Electronics and communication equip. . . 18.5 12.3 10.7 9.5 10.9 13.0 14.9 18.5 21.8Missiles and space systems . . . . . . . . 17.1 10.6 9.5 8.2 8.2 11.2 13.3 14.6 14.7Ships . . . . . . . . . . . . . . . . . . . . . . . 10.3 9.1 7.8 8.3 12.0 11.4 10.2 12.3 11.8Tanks, ammo. and weapons . . . . . . . . 9.2 5.3 6.2 5.0 6.3 9.8 11.0 13.3 19.8
Services . . . . . . . . . . . . . . . . . . . . . . . 14.6 18.6 23.7 24.0 25.9 33.2 43.1 45.4 54.4
1 Covers only purchases from other federal agencies and reimbursable purchases on behalf of foreign governments.2 Includes foreign firms for perfomance in U.S. 3 Includes Department of Defense. Includes other business not shown separately.Contracts awarded for work in U.S. possessions, and other areas subject to complete sovereignty of United States; contracts ina classified location; and any intragovernmental contracts entered into overseas.
Source: U.S. Department of Defense, DoD Personnel and Procurement Statistics, Procurement, DoD Procurement, annual;<http://siadapp.dior.whs.mil/index.html>.
Table 493. U.S. Military Sales and Assistance to Foreign Governments:1995 to 2004
[In millions of dollars (8,495 represents $8,495,000,000). For year ending September 30. Department of Defense (DoD) salesdeliveries cover deliveries against sales orders authorized under Arms Export Control Act, as well as earlier and applicablelegislation. For details regarding individual programs, see source. Table data has been updated throughout]
Item 1995 1997 1998 1999 2000 2001 2002 2003 2004
Military sales agreements . . . . . . 8,495 8,852 9,229 11,755 11,528 13,628 12,906 13,682 13,183Military construction salesagreements . . . . . . . . . . . . . . . 24 29 474 301 283 124 72 221 675
Military sales deliveries 1 . . . . . . . 12,100 15,663 13,179 16,888 10,436 12,001 10,240 9,315 10,681Military sales financing . . . . . . . . 3,712 3,530 3,420 3,370 4,333 3,535 4,032 5,955 4,584Military assistance programs 2 . . . 117 91 95 268 86 41 46 257 135Military assistance programdelivery 3 . . . . . . . . . . . . . . . . 20 112 113 37 13 23 35 106 29
IMET program/deliveries 4 . . . . . . 26 43 50 49 50 54 70 79 89
1 Includes military construction sales deliveries. 2 Also includes Military Assistance Service Funded (MASF) program data,Section 506(a) drawdown authority, and MAP Merger Funds. 3 Includes Military Assistance Service Funded (MASF) programdata and Section 506(a) drawdown authority. 4 International Military Education & Training. Includes military assistance servicefunded and emergency draw downs.
Source: U.S. Department of Defense, Defense Security Cooperation Agency, DSCA Data and Statistics; see also<http://www.dsca.osd.mil/data_stats.htm>.
Table 494. U.S. Military Sales Deliveries by Selected Country: 1995 to 2004[In millions of dollars (12,100 represents $12,100,000,000). For year ending September 30. Represents Department ofDefense military sales. Table has been updated throughout]
Country 1995 1997 1998 1999 2000 2001 2002 2003 2004
Total 1. . . . . . . . . . . . . 12,100 15,663 13,179 16,888 10,436 12,001 10,240 9,315 10,681Australia . . . . . . . . . . . . . . . 303 196 207 269 330 245 155 193 186Bahrain . . . . . . . . . . . . . . . 40 61 62 48 54 336 82 97 78Belgium . . . . . . . . . . . . . . . 8 107 194 250 58 170 68 71 42Canada . . . . . . . . . . . . . . . 127 83 111 96 84 110 85 155 147China: Taiwan . . . . . . . . . . . 1,332 2,370 1,420 2,504 784 1,160 1,410 593 962Denmark. . . . . . . . . . . . . . . 54 48 159 157 46 112 23 14 23Egypt . . . . . . . . . . . . . . . . . 1,479 892 551 448 805 862 1,883 878 1,328France . . . . . . . . . . . . . . . . 64 57 35 248 217 142 206 169 251Germany . . . . . . . . . . . . . . 257 208 190 251 131 330 222 243 267Greece. . . . . . . . . . . . . . . . 220 691 397 463 315 448 454 1,325 1,158Israel . . . . . . . . . . . . . . . . . 327 456 1,195 1,213 562 741 632 825 891Italy . . . . . . . . . . . . . . . . . . 54 51 43 106 41 97 103 185 283Japan . . . . . . . . . . . . . . . . 693 488 409 439 460 494 470 404 397Jordan . . . . . . . . . . . . . . . . 47 42 47 49 52 80 57 69 107Korea, South . . . . . . . . . . . . 442 478 836 585 1,400 735 526 493 600Kuwait . . . . . . . . . . . . . . . . 471 1,209 323 316 321 552 131 143 213Netherlands . . . . . . . . . . . . 153 168 344 321 161 412 242 225 272Norway. . . . . . . . . . . . . . . . 25 98 119 220 64 192 88 123 80Portugal . . . . . . . . . . . . . . . 88 70 21 12 20 42 28 116 31Saudi Arabia . . . . . . . . . . . . 3,567 4,639 3,800 4,686 2,000 1,940 1,312 1,133 1,136Singapore . . . . . . . . . . . . . . 59 133 232 549 131 244 421 169 208Spain . . . . . . . . . . . . . . . . . 193 216 133 324 141 267 178 159 188Thailand . . . . . . . . . . . . . . . 356 151 144 133 113 118 168 132 188Turkey . . . . . . . . . . . . . . . . 368 1,153 532 854 216 466 280 483 291United Arab Emirates . . . . . . 345 91 26 95 70 24 92 85 139United Kingdom . . . . . . . . . . 419 425 430 365 347 525 386 350 454
1 Includes countries not shown.Source: U.S. Department of Defense, Defense Security Cooperation Agency, DSCA Data and Statistics; see also
<http://www.dsca.osd.mil/data_stats.htm>.
National Security and Veterans Affairs 329
U.S. Census Bureau, Statistical Abstract of the United States: 2007

Table 495. Military and Civilian Personnel and Expenditures: 1990 to 2004[Personnel in thousands (3,693 represents 3,693,000); expenditures in millions of dollars (209,904 represents 209,904,000,000).For year ending September 30. For definitions, see headnote, tables 496 and 498]
Item 1990 1995 2000 2001 2002 2003 2004
Personnel, total 1 (1,000). . . . . . 3,693 3,391 2,791 2,781 2,811 2,806 2,764Active duty military . . . . . . . . . . . . . . 1,185 1,085 984 991 1,045 1,071 1,055Civilian . . . . . . . . . . . . . . . . . . . . . . 931 768 634 628 628 631 634Reserve and National Guard . . . . . . . 1,577 1,538 1,173 1,163 1,138 1,105 1,074
Expenditures, total 2. . . . . . . . . 209,904 209,695 229,072 243,778 276,281 316,648 345,891Payroll outlays . . . . . . . . . . . . . . . . . 88,650 98,396 103,447 106,013 114,950 122,270 139,490
Active duty military pay . . . . . . . . . 33,705 35,188 36,872 37,873 40,945 46,614 50,489Civilian pay . . . . . . . . . . . . . . . . . 28,230 29,932 29,935 29,879 32,805 35,041 36,234Reserve and National Guard pay . . . 5,556 5,681 4,646 5,066 7,523 7,306 10,303Retired military pay . . . . . . . . . . . . 21,159 27,595 31,994 33,196 33,677 33,309 42,465
Prime contract awards 3 . . . . . . . . . . 121,254 109,005 123,295 135,225 158,737 191,222 203,389Grants . . . . . . . . . . . . . . . . . . . . . . 6,329 7,543 2,330 2,540 2,594 3,156 3,012
1 Includes those based ashore and excludes those temporarily shore-based, in a transient status, or afloat. 2 Includesexpenditures not shown separately. 3 Represents contract awards over $25,000.
Source: U.S. Department of Defense, DoD Personnel and Procurement Statistics, Personnel, Publications, Atlas/DataAbstract for the United States and Selected Areas, annual; <http://siadapp.dior.whs.mil/index.html>.
Table 496. Department of Defense Payroll and Contract Awards—States: 2004[In millions of dollars ($139,490 represents $139,490,000,000); For year ending September 30. Payroll outlays include the grossearnings of civilian and active duty military personnel for services rendered to the government and for cash allowances for ben-efits. Excludes employer’s share of employee benefits, accrued military retirement benefits and most permanent change of stationcosts. Contracts refers to awards made in year specified; expenditures relating to awards may extend over several years]
StatePayroll
Contractawards 1 GrantsTotal
Retiredmilitary
U.S. . . . 139,490 42,465 203,389 3,012AL . . . . . . 3,284 1,109 5,849 39AK . . . . . . 1,282 174 1,262 38AZ . . . . . . 2,678 1,205 8,430 91AR . . . . . . 1,128 492 494 37CA . . . . . . 15,017 4,347 27,875 384CO. . . . . . 3,025 1,183 3,151 49CT . . . . . . 717 218 8,959 43DE . . . . . . 417 153 194 17DC. . . . . . 1,983 69 3,515 36FL . . . . . . 9,334 4,511 8,386 83GA. . . . . . 6,633 1,780 3,905 48HI . . . . . . 3,374 358 1,714 47ID . . . . . . 535 240 187 29IL. . . . . . . 3,025 677 3,004 69IN . . . . . . 1,299 404 3,173 49IA . . . . . . 481 185 734 31KS . . . . . . 1,529 426 1,412 26KY . . . . . . 2,432 474 4,119 18LA . . . . . . 1,871 541 2,544 82ME. . . . . . 805 229 1,556 32MD. . . . . . 4,999 1,170 9,206 162MA. . . . . . 1,103 375 6,961 144MI . . . . . . 1,241 461 2,612 120MN. . . . . . 708 285 1,337 63MS. . . . . . 1,828 508 1,867 45
StatePayroll
Contractawards 1 GrantsTotal
Retiredmilitary
MO . . . . . 2,112 678 6,502 48MT. . . . . . 404 153 207 34NE . . . . . . 925 285 401 23NV . . . . . . 1,168 617 439 14NH. . . . . . 384 215 716 23NJ . . . . . . 1,860 397 4,196 61NM. . . . . . 1,447 485 1,071 33NY . . . . . . 2,443 601 5,244 139NC. . . . . . 6,569 1,654 2,213 82ND. . . . . . 498 73 310 33OH. . . . . . 2,894 828 4,637 69OK. . . . . . 2,976 652 1,524 33OR. . . . . . 805 434 530 11PA . . . . . . 2,912 912 6,203 154RI . . . . . . 621 130 418 13SC . . . . . . 3,306 1,125 1,599 45SD . . . . . . 397 119 236 17TN . . . . . . 1,614 943 2,116 35TX . . . . . . 11,082 4,113 21,044 127UT . . . . . . 1,548 281 1,878 25VT . . . . . . 140 65 452 11VA . . . . . . 15,992 4,017 23,543 69WA . . . . . 5,301 1,540 3,325 51WV . . . . . 411 178 280 38WI . . . . . . 648 304 1,746 41WY . . . . . 302 92 115 1
1 Military awards for supplies, services, and construction. Net value of contracts of over $25,000 for work in each state andDC. Figures reflect impact of prime contracting on state distribution of defense work. Often the state in which a prime contractoris located is not the state where the subcontracted work is done. See also headnote, Table 492. Undistributed civilians and militarypersonnel, their payrolls, and prime contract awards for performance in classified locations are excluded.
Source: U.S. Department of Defense, DoD Personnel and Procurement Statistics, Personnel, Publications, Atlas/DataAbstract for the United States and Selected Areas, annual; <http://siadapp.dior.whs.mil/index.html>.
Table 497. Expenditures and Personnel by Selected Major Locations: 2004[In thousands of dollars (9,187,656 represents $9,187,656,000), except for personnel. For year ending September 30. Seeheadnote, Table 496]
Major locationsExpenditures
Major locationsMilitary and civilian personnel
TotalPayrolloutlays
Grants/contracts Total
Active dutymilitary Civilian
Fort Worth, TX. . . . . 9,187,656 278,516 8,909,140 Fort Bragg, NC . . . . . . . 48,386 42,768 5,618San Diego, CA. . . . . 7,354,895 3,456,175 3,898,720 Fort Hood, TX. . . . . . . . 47,095 42,742 4,353Washington, DC. . . . 5,227,865 1,676,618 3,551,247 Camp Pendleton, CA . . . 39,515 37,443 2,072St. Louis, MO . . . . . 5,101,117 200,776 4,900,341 Camp Lejeune, NC . . . . 34,764 31,948 2,816Huntsville, AL . . . . . 4,633,003 270,866 4,362,137 San Diego, CA . . . . . . . 30,735 17,801 12,934Norfolk, VA . . . . . . . 4,546,509 3,241,181 1,305,328 Fort Campbell, KY. . . . . 28,585 26,306 2,279Arlington, VA . . . . . . 4,517,336 2,227,846 2,289,490 Arlington, VA . . . . . . . . 26,865 11,742 15,123Long Beach, CA . . . 3,954,051 68,299 3,885,752 Norfolk, VA. . . . . . . . . . 24,197 15,382 8,815Groton, CT . . . . . . . 3,590,117 298,806 3,291,311 Fort Benning, GA . . . . . 23,520 20,493 3,027Tucson, AZ . . . . . . . 3,333,045 366,551 2,966,494 Washington, DC . . . . . . 23,289 9,625 13,664
Source: U.S. Department of Defense, DoD Personnel and Procurement Statistics, Personnel, Publications, Atlas/DataAbstract for the United States and Selected Areas, annual; <http://siadapp.dior.whs.mil/index.html.>
330 National Security and Veterans Affairs
U.S. Census Bureau, Statistical Abstract of the United States: 2007

Table 498. Military and Civilian Personnel in Installations: 2004
[As of September 30. Civilian personnel includes United States citizens and foreign national direct-hire civilians subject to Officeof Management and Budget (OMB) ceiling controls and civilian personnel involved in civil functions in the United States. Excludesindirect-hire civilians and those direct-hire civilians not subject to OMB ceiling controls. Military personnel include active duty per-sonnel based ashore, excludes personnel temporarily shore-based in a transient status, or afloat]
State
Active military personnel Reserveand
NationalGuard,
total
Civilian personnel
Total 1 Army
Navy/MarineCorps Air Force Total 1 Army
Navy/MarineCorps Air Force
United States. . . . . 1,055,314 395,842 346,970 312,502 1,074,324 634,185 220,558 175,696 154,151Alabama . . . . . . . . . . 10,276 5,843 618 3,815 31,912 21,155 17,348 48 2,332Alaska . . . . . . . . . . . 17,385 7,604 112 9,669 5,681 4,536 2,527 17 1,637Arizona . . . . . . . . . . . 22,793 5,371 4,826 12,596 17,654 9,002 3,898 474 3,552Arkansas. . . . . . . . . . 5,257 243 43 4,971 15,460 3,933 2,877 6 903California. . . . . . . . . . 128,277 7,828 99,536 20,913 88,885 58,062 7,333 33,167 10,125
Colorado . . . . . . . . . . 29,790 14,904 859 14,027 19,630 10,345 2,767 40 5,240Connecticut . . . . . . . . 3,467 30 3,403 34 9,034 2,452 478 1,030 262Delaware. . . . . . . . . . 3,949 7 17 3,925 5,748 1,448 254 1 1,117District of Columbia . . . 12,266 5,830 3,299 3,137 8,674 15,174 4,468 9,496 928Florida . . . . . . . . . . . 52,300 3,101 22,880 26,319 47,270 27,076 3,260 11,947 8,982Georgia . . . . . . . . . . 67,642 52,639 4,292 10,711 35,995 30,623 10,802 3,997 13,640
Hawaii . . . . . . . . . . . 35,061 17,068 13,235 4,758 11,335 16,576 4,302 9,230 1,966Idaho . . . . . . . . . . . . 4,619 37 87 4,495 6,756 1,532 740 46 686Illinois . . . . . . . . . . . . 26,650 614 20,291 5,745 34,214 13,111 6,626 1,870 3,235Indiana . . . . . . . . . . . 988 478 394 116 23,141 9,088 1,952 3,225 1,062Iowa. . . . . . . . . . . . . 364 183 130 51 15,346 1,522 960 5 510
Kansas . . . . . . . . . . . 16,294 13,041 156 3,097 14,701 6,048 4,570 1 1,123Kentucky. . . . . . . . . . 35,162 34,714 231 217 15,763 8,314 6,811 206 254Louisiana . . . . . . . . . 17,380 9,556 1,401 6,423 25,452 7,093 3,762 1,170 1,765Maine . . . . . . . . . . . . 2,350 192 2,133 25 6,323 6,290 314 5,289 278Maryland. . . . . . . . . . 29,531 7,072 14,711 7,748 22,864 31,611 12,125 15,377 2,255
Massachusetts . . . . . . 2,468 255 576 1,637 19,359 6,707 2,350 228 2,980Michigan . . . . . . . . . . 1,140 448 561 131 24,308 8,110 5,164 24 1,146Minnesota . . . . . . . . . 667 261 311 95 22,765 2,544 1,467 17 838Mississippi. . . . . . . . . 14,483 392 5,623 8,468 19,446 9,088 3,525 2,396 2,878Missouri . . . . . . . . . . 15,302 9,297 1,830 4,175 27,029 9,208 5,999 255 1,207
Montana . . . . . . . . . . 3,789 27 16 3,746 5,775 1,274 512 − 713Nebraska . . . . . . . . . 7,332 152 583 6,597 8,931 3,769 1,413 16 1,996Nevada. . . . . . . . . . . 9,251 97 1,000 8,154 6,376 2,089 343 298 1,250New Hampshire . . . . . 218 8 152 58 5,028 1,059 545 46 303New Jersey . . . . . . . . 6,392 928 493 4,971 21,745 13,628 9,270 2,032 1,526
New Mexico. . . . . . . . 11,994 259 187 11,548 7,388 6,805 2,935 39 3,327New York . . . . . . . . . 22,714 19,873 2,416 425 43,474 11,409 7,178 146 2,547North Carolina . . . . . . 101,033 42,860 47,757 10,416 29,070 16,942 6,225 7,418 1,296North Dakota . . . . . . . 7,840 22 10 7,808 5,368 1,706 491 2 1,125Ohio. . . . . . . . . . . . . 7,211 450 642 6,119 37,829 21,704 1,336 73 12,357
Oklahoma . . . . . . . . . 23,476 12,475 1,506 9,495 19,194 21,860 4,544 84 15,887Oregon . . . . . . . . . . . 667 212 398 57 13,566 3,276 2,324 20 899Pennsylvania . . . . . . . 2,837 1,088 1,493 256 45,257 25,079 8,529 7,302 1,605Rhode Island . . . . . . . 2,336 103 2,154 79 5,887 4,370 303 3,744 230South Carolina . . . . . . 38,213 10,705 17,512 9,996 22,489 9,382 2,839 3,582 1,804
South Dakota. . . . . . . 3,698 43 15 3,640 5,762 1,161 471 1 637Tennessee. . . . . . . . . 2,430 321 1,875 234 23,953 5,390 2,654 928 974Texas . . . . . . . . . . . . 109,760 62,473 6,877 40,410 76,101 39,385 19,588 1,434 14,431Utah. . . . . . . . . . . . . 5,756 296 156 5,304 13,404 14,715 2,323 26 11,564Vermont . . . . . . . . . . 60 20 28 12 4,487 613 312 1 263
Virginia . . . . . . . . . . . 90,088 25,908 49,538 14,642 36,722 78,792 20,388 34,482 4,452Washington . . . . . . . . 37,906 20,100 10,143 7,663 26,973 23,433 6,013 14,354 1,985West Virginia . . . . . . . 503 168 288 47 10,585 1,810 1,249 95 445Wisconsin . . . . . . . . . 502 242 175 85 20,788 2,847 1,859 11 873Wyoming. . . . . . . . . . 3,447 4 1 3,442 3,427 1,039 235 − 761
− Represents zero. 1 Includes Other Defense Activities (ODA) not shown separately.
Source: U.S. Department of Defense, Directorate for Information Operations and Reports, Atlas/Data Abstract for the UnitedStates and Selected Areas, annual. <http://www.siadapp.dior.whs.mil/index.htm>.
Table 499. Military Personnel on Active Duty by Location: 1980 to 2005[In thousands (2,051 represents 2,051,000). As of September 30]
Location 1980 1985 1990 1995 2000 2001 2002 2003 2004 2005
Total . . . . . . . . . . . 2,051 2,151 2,046 1,518 1,384 1,385 1,412 1,434 1,427 1,389
Shore-based 1 . . . . . . . . 1,840 1,920 1,794 1,351 1,237 1,244 1,262 1,287 1,291 1,262Afloat 2. . . . . . . . . . . . . 211 231 252 167 147 141 150 148 136 127United States 3 . . . . . . . 1,562 1,636 1,437 1,280 1,127 1,130 1,181 1,182 1,139 1,098Foreign countries . . . . . . 489 515 609 238 258 255 230 253 288 291
1 Includes Navy personnel temporarily on shore. 2 Includes Marine Corps. 3 Includes Puerto Rico and Island areas.
Source: U.S. Department of Defense, DoD Personnel and Procurement Statistics, Personnel, Military, Military PersonnelStatistics, annual; <http://siadapp.dior.whs.mil/index.htm>.
National Security and Veterans Affairs 331
U.S. Census Bureau, Statistical Abstract of the United States: 2007

Table 500. Department of Defense Personnel: 1960 to 2005
[In thousands (2,475 represents 2,475,000.) As of end of fiscal year, see text, section 8. Includes National Guard, Reserve, and retired regular personnel on extended or continuous active duty. Excludes CoastGuard. Other officer candidates are included under enlisted personnel]
Year
Total 1, 2
Army Navy 2 Marine Corps Air Force
Total 1
Male Female
Total 1
Male Female
Total 1
Male Female
Total 1
Male Female
Officers Enlisted Officers Enlisted Officers Enlisted Officers Enlisted Officers Enlisted Officers Enlisted Officers Enlisted Officers Enlisted
1960 . . . . . 2,475 873 97 762 4.3 8.3 617 67 540 2.7 5.4 171 16 153 0.1 1.5 815 126 677 3.7 5.71965 . . . . . 2,654 969 108 846 3.8 8.5 670 75 583 2.6 5.3 190 17 172 0.1 1.4 825 128 685 4.1 4.7
1970 . . . . . 3,065 1,323 162 1,142 5.2 11.5 691 78 600 2.9 5.8 260 25 233 0.3 2.1 791 125 648 4.7 9.01975 . . . . . 2,128 784 98 640 4.6 37.7 535 62 449 3.7 17.5 196 19 174 0.3 2.8 613 100 478 5.0 25.21976 . . . . . 2,082 779 94 634 4.8 43.8 525 60 439 3.5 19.3 192 19 171 0.4 3.1 585 95 452 5.0 29.21977 . . . . . 2,075 782 92 634 5.7 46.1 530 59 443 3.8 19.5 192 19 169 0.4 3.5 571 91 435 5.4 34.61978 . . . . . 2,062 772 92 619 6.3 50.5 530 59 442 4.0 21.3 191 18 167 0.4 4.7 570 89 429 6.0 41.11979 . . . . . 2,027 759 90 602 6.9 55.2 523 58 432 4.4 25.0 185 18 161 0.5 5.5 560 89 413 7.3 46.4
1980 . . . . . 2,051 777 91 612 7.6 61.7 527 58 430 4.9 30.1 189 18 164 0.5 6.2 558 90 404 8.5 51.91981 . . . . . 2,083 781 94 610 8.3 65.3 540 60 435 5.3 34.6 191 17 165 0.5 7.1 570 90 413 9.1 54.41982 . . . . . 2,109 780 94 609 9.0 64.1 553 61 444 5.7 37.3 192 18 165 0.6 7.9 583 92 421 9.9 54.51983 . . . . . 2,123 780 97 602 9.5 66.5 558 62 444 6.3 40.8 194 19 166 0.6 8.3 592 94 428 10.6 55.31984 . . . . . 2,138 780 98 601 10.2 67.1 565 62 448 6.6 42.6 196 19 167 0.6 8.6 597 95 430 11.2 55.9
1985 . . . . . 2,151 781 99 599 10.8 68.4 571 64 449 6.9 45.7 198 19 169 0.7 9.0 602 96 431 11.9 58.11986 . . . . . 2,169 781 99 597 11.3 69.7 581 65 457 7.3 47.2 200 19 170 0.6 9.2 608 97 434 12.4 61.21987 . . . . . 2,174 781 96 596 11.6 71.6 587 65 462 7.2 47.7 200 19 170 0.6 9.1 607 94 432 12.6 63.21988 . . . . . 2,138 772 95 588 11.8 72.0 593 65 466 7.3 49.7 197 19 168 0.7 9.0 576 92 405 12.9 61.51989 . . . . . 2,130 770 95 584 12.2 74.3 593 65 464 7.5 52.1 197 19 168 0.7 9.0 571 91 399 13.4 63.7
1990 . . . . . 2,044 732 92 553 12.4 71.2 579 64 451 7.8 52.1 197 19 168 0.7 8.7 535 87 370 13.3 60.81991 . . . . . 1,986 711 91 535 12.5 67.8 570 63 444 8.0 51.4 194 19 166 0.7 8.3 510 84 350 13.3 59.11992 . . . . . 1,807 610 83 449 11.7 61.7 542 61 417 8.3 51.0 185 18 157 0.6 7.9 470 77 320 12.7 56.11993 . . . . . 1,705 572 77 420 11.1 60.2 510 58 390 8.3 49.3 178 17 153 0.6 7.2 444 72 302 12.3 54.51994 . . . . . 1,610 541 74 394 10.9 59.0 469 54 355 8.0 47.9 174 17 149 0.6 7.0 426 69 287 12.3 54.0
1995 . . . . . 1,518 509 72 365 10.8 57.3 435 51 324 7.9 47.9 175 17 150 0.7 7.4 400 66 266 12.1 52.11996 . . . . . 1,472 491 70 347 10.6 59.0 417 50 308 7.8 46.9 175 17 149 0.8 7.8 389 64 256 12.0 52.81997 . . . . . 1,439 492 69 346 10.4 62.4 396 48 290 7.8 44.8 174 17 148 0.8 8.5 377 62 246 12.0 53.81998 . . . . . 1,407 484 68 340 10.4 61.4 382 47 280 7.8 42.9 173 17 146 0.9 8.9 368 60 237 12.0 54.21999 . . . . . 1,386 479 67 337 10.5 61.5 373 46 271 7.7 43.9 173 17 145 0.9 9.3 361 58 232 11.8 54.6
2000 . . . . . 1,384 482 66 339 10.8 62.9 373 46 272 7.8 43.8 173 17 146 0.9 9.5 356 57 227 11.8 55.02001 . . . . . 1,385 481 65 337 11.0 63.4 378 46 273 8.0 46.6 173 17 145 1.0 9.6 354 57 224 12.0 55.62002 . . . . . 1,414 487 66 341 11.5 63.2 385 47 279 8.2 47.3 174 17 146 1.0 9.5 368 59 233 12.9 58.62003 . . . . . 1,434 499 68 352 12.0 63.5 382 47 276 8.2 47.3 178 18 149 1.1 9.6 375 61 237 13.5 60.02004 . . . . . 1,427 500 69 358 12.3 61.0 373 46 273 8.1 46.1 178 18 149 1.1 9.7 377 61 242 13.6 60.22005 . . . . . 1,389 493 69 353 12.4 57.9 363 45 266 7.8 44.5 180 18 151 1.0 9.8 354 60 225 13.4 55.6
1 Includes cadets, midshipmen, and others not shown separately. 2 Beginning 1980, excludes Navy Reserve personnel on active duty for Training and Administration of Reserves (TARS).
Source: U.S. Department of Defense, Personnel, Publications, Selected Manpower Statistics, annual. See also <http://siadapp.dior.whs.mil/personnel/Pubs.htm>.
33
2N
ational
Security
and
Veteran
sA
ffairs
U.S
.C
ensusB
ureau,S
tatisticalAbstract
ofthe
United
States:
2007

Table 501. U.S. Military Personnel on Active Duty in Selected ForeignCountries: 1995 to 2005
[As of September 30]
Country 1995 1999 2000 2001 2002 2003 2004 2005
In foreign countries 1 . . . 238,064 252,763 257,817 254,788 230,484 252,764 287,802 290,997
Ashore . . . . . . . . . . . . . . . 208,836 207,131 212,858 211,947 208,479 226,570 265,594 268,214Afloat . . . . . . . . . . . . . . . . 29,228 45,632 44,959 42,841 22,005 26,194 20,208 22,783
Argentina . . . . . . . . . . . . . . . 26 24 26 22 28 28 29 28Australia . . . . . . . . . . . . . . . . 314 323 175 803 171 574 196 196Austria . . . . . . . . . . . . . . . . . 35 31 18 24 20 24 21 23Bahamas, The . . . . . . . . . . . . 36 23 24 64 22 25 41 41Bahrain . . . . . . . . . . . . . . . . . 618 1,511 949 2,065 1,560 1,514 1,712 1,641Belgium . . . . . . . . . . . . . . . . 1,689 1,649 1,554 1,578 1,458 1,526 1,474 1,366Bosnia and Herzegovina . . . . . 1 5,800 5,708 3,116 3,082 3,041 951 263Brazil . . . . . . . . . . . . . . . . . . 50 43 38 39 27 34 37 39Canada. . . . . . . . . . . . . . . . . 214 150 156 163 148 141 156 150Chile . . . . . . . . . . . . . . . . . . 28 30 26 337 28 25 23 29
China (includes Hong Kong) . . . 30 57 74 57 61 53 63 67Colombia. . . . . . . . . . . . . . . . 44 41 224 63 39 54 55 52Cuba (Guantanamo) . . . . . . . . 5,129 1,030 688 557 549 697 682 950Cyprus . . . . . . . . . . . . . . . . . 24 38 41 30 28 34 20 43Denmark . . . . . . . . . . . . . . . . 37 32 26 28 22 21 22 19Diego Garcia 2 . . . . . . . . . . . . 897 670 625 590 548 528 816 683Dominican Republic . . . . . . . . 13 11 12 14 55 14 14 11Ecuador . . . . . . . . . . . . . . . . 86 21 20 22 35 33 32 32Egypt . . . . . . . . . . . . . . . . . . 1,123 892 499 500 433 385 348 410El Salvador . . . . . . . . . . . . . . 25 30 27 26 23 21 23 22
France . . . . . . . . . . . . . . . . . 67 73 67 71 74 93 77 58Germany. . . . . . . . . . . . . . . . 73,280 65,538 69,203 70,998 68,701 74,796 76,058 66,418Greece . . . . . . . . . . . . . . . . . 489 652 678 506 593 583 473 428Greenland . . . . . . . . . . . . . . . 131 129 125 153 88 139 133 146Haiti . . . . . . . . . . . . . . . . . . . 1,616 59 21 13 15 13 26 14Honduras . . . . . . . . . . . . . . . 193 513 351 394 402 414 448 438Hungary . . . . . . . . . . . . . . . . 16 87 375 29 19 15 18 16Iceland . . . . . . . . . . . . . . . . . 1,982 1,681 1,636 1,743 1,665 1,747 1,491 1,270India. . . . . . . . . . . . . . . . . . . 27 25 20 18 19 26 30 31Indonesia (includes Timor) . . . . 46 50 51 43 28 21 24 23Israel . . . . . . . . . . . . . . . . . . 46 35 36 35 36 36 34 42
Italy . . . . . . . . . . . . . . . . . . . 12,007 11,530 11,190 11,704 12,466 13,152 12,606 11,841Japan . . . . . . . . . . . . . . . . . . 39,134 40,338 40,159 40,217 41,848 40,519 36,365 35,571Jordan . . . . . . . . . . . . . . . . . 24 27 29 18 32 24 25 25Kenya. . . . . . . . . . . . . . . . . . 40 95 21 62 43 33 33 32Korea, South . . . . . . . . . . . . . 36,016 35,913 36,565 37,605 37,743 41,145 40,840 30,983Kuwait . . . . . . . . . . . . . . . . . 771 4,011 4,602 4,208 567 (4) (4) (4)Macedonia . . . . . . . . . . . . . . 591 1,100 347 351 146 41 40 37Mexico . . . . . . . . . . . . . . . . . 36 33 29 27 31 30 32 30Netherlands . . . . . . . . . . . . . . 687 673 659 676 629 703 701 583
Norway . . . . . . . . . . . . . . . . . 57 95 81 83 123 86 84 77Oman . . . . . . . . . . . . . . . . . . 27 101 251 673 31 32 34 36Pakistan . . . . . . . . . . . . . . . . 28 26 22 21 31 33 33 35Peru. . . . . . . . . . . . . . . . . . . 26 50 425 43 41 33 35 37Philippines. . . . . . . . . . . . . . . 126 84 79 35 86 107 47 55Portugal . . . . . . . . . . . . . . . . 1,066 1,024 1,005 1,005 992 1,094 1,006 970Qatar . . . . . . . . . . . . . . . . . . 2 39 52 116 71 2,997 273 463Russia . . . . . . . . . . . . . . . . . 60 88 101 20 78 78 84 44Saudi Arabia . . . . . . . . . . . . . 1,077 5,552 7,053 4,805 776 953 235 258Serbia (includes Kosovo) . . . . . 13 6,410 5,427 5,679 2,804 319 1,814 1,801
Singapore . . . . . . . . . . . . . . . 166 167 411 160 167 171 237 169South Africa. . . . . . . . . . . . . . 24 32 34 31 32 31 31 33Spain . . . . . . . . . . . . . . . . . . 2,799 2,127 2,007 1,990 2,621 1,893 2,012 1,660Switzerland . . . . . . . . . . . . . . 26 18 19 18 19 18 18 17Thailand . . . . . . . . . . . . . . . . 99 120 526 113 125 132 122 114Tunisia . . . . . . . . . . . . . . . . . 20 13 12 15 17 15 15 14Turkey . . . . . . . . . . . . . . . . . 3,111 2,312 2,006 2,153 1,587 2,021 1,762 1,780Ukraine. . . . . . . . . . . . . . . . . 5 18 16 10 13 13 14 11United Arab Emirates. . . . . . . . 30 679 402 204 21 73 149 71United Kingdom . . . . . . . . . . . 12,131 11,311 11,207 11,318 10,258 11,616 11,469 10,752Venezuela . . . . . . . . . . . . . . . 35 30 28 31 27 21 28 21
DEPLOYMENTS
Operation Enduring Freedom(OEF)3 . . . . . . . . . . . . . . . (X) (X) (X) (X) (X) (NA) (NA) 19,500
Operation Iraqi Freedom(OIF)4 . . . . . . . . . . . . . . . . (X) (X) (X) (X) (X) 183,002 170,647 192,600
NA Not available. X Not applicable. 1 Includes areas not shown separately. 2 British Indian Ocean Territory. 3 Total(in/around Afghanistan as of September 30)—includes deployed Reserve/National Guard. 4 Total (in/around Iraq as of September30)—includes deployed Reserve/National Guard.
Source: U.S. Department of Defense, DoD Personnel and Procurement Statistics, Personnel, Military, Military PersonnelStatistics, annual; <http://siadapp.dior.whs.mil/index.html>
National Security and Veterans Affairs 333
U.S. Census Bureau, Statistical Abstract of the United States: 2007

Table 502. U.S. Active Duty Military Deaths by Manner of Death: 1980 to 2005
[As of December 31. Table reflects addition of calendar year 2005 data and updates to death figures throughout]
Manner of death 1980−2005 1980 1990 1995 1998 1999 2000 2001 2002 2003 2004 2005
Deaths, total. . . . . . . 40,282 2,392 1,507 1,040 827 796 758 891 999 1,228 1,897 1,951
Accident . . . . . . . . . . . . 22,318 1,556 880 538 445 436 398 437 547 440 617 629Hostile action . . . . . . . . . 2,071 − − − − − − 3 18 344 739 738Homicide . . . . . . . . . . . . 2,042 174 74 67 26 37 34 49 51 36 47 45Illness . . . . . . . . . . . . . . 7,229 419 277 174 168 150 138 185 190 207 270 280Pending. . . . . . . . . . . . . 166 − − − 10 13 − 1 6 16 25 95Self-inflicted . . . . . . . . . . 5,536 231 232 250 161 145 151 140 160 167 192 147Terrorist attack . . . . . . . . 426 1 1 7 3 − 17 55 − − − −Undetermined. . . . . . . . . 494 11 43 4 14 15 20 21 27 18 7 17
Deaths per 100,000 ofpersonnel strength
Accident . . . . . . . . . . . . (X) 72.0 39.0 32.4 28.9 28.6 26.0 28.2 33.6 25.4 36.0 37.8Hostile action . . . . . . . . . (X) − − − − − − 0.2 1.1 19.9 43.2 44.4Homicide . . . . . . . . . . . . (X) 8.1 3.3 4.0 1.7 2.4 2.2 3.2 3.1 2.1 2.7 2.7Illness . . . . . . . . . . . . . . (X) 19.4 12.3 10.5 10.9 9.8 9.0 11.9 11.7 11.9 15.8 16.8Pending. . . . . . . . . . . . . (X) − − − 0.6 0.9 − 0.1 0.4 0.9 1.5 5.7Self-inflicted . . . . . . . . . . (X) 10.7 10.3 15.0 10.5 9.5 9.9 9.0 9.8 9.6 11.2 8.8Terrorist attack . . . . . . . . (X) − − 0.4 0.2 − 1.1 3.5 − − − −Undetermined. . . . . . . . . (X) 0.5 1.9 0.2 0.9 1.0 1.3 1.4 1.7 1.0 0.4 1.0
− Represents zero. X Not applicable.
Source: U.S. Department of Defense, Directorate for Information Operations and Reports, Statistical Information AnalysisDivision, Personnel; <http://www.dior.whs.mil/mmid/casualty/castop.htm>.
Table 503. Military Personnel on Active Duty by Rank or Grade: 1990 to 2005
[In thousands (2,043.7 represents 2,043,700). As of Sept. 30]
Rank/grade 1990 1995 2000 2002 2003 2004 2005
Total . . . . . . . . . . . . . . . . . . . . 2,043.7 1,518.2 1,384.3 1,411.6 1,434.4 1,426.8 1,389.4
General-Admiral . . . . . . . . . . . . . . . . (Z) (Z) (Z) (Z) (Z) (Z) (Z)Lieutenant General-Vice Admiral . . . . . 0.1 0.1 0.1 0.1 0.1 0.1 0.1Major General-Rear Admiral (U) . . . . . 0.4 0.3 0.3 0.3 0.3 0.3 0.3Brigadier General-Rear Admiral (L) . . . 0.5 0.4 0.4 0.4 0.4 0.4 0.4Colonel-Captain . . . . . . . . . . . . . . . . 14.0 11.7 11.3 11.4 11.6 11.5 11.4Lieutenant Colonel-Commander . . . . . 32.3 28.7 27.5 28.2 28.5 28.4 28.1Major-Lt Commander . . . . . . . . . . . . 53.2 43.9 43.2 43.6 44.1 44.0 44.4Captain-Lieutenant . . . . . . . . . . . . . . 106.6 84.3 68.1 66.5 68.1 69.5 72.51st Lieutenant-Lieutenant (JG) . . . . . . 37.9 26.1 24.7 28.1 29.9 31.1 27.52nd Lieutenant-Ensign . . . . . . . . . . . 31.9 25.6 26.4 29.0 29.1 26.9 25.9Chief Warrant Officer W-5 . . . . . . . . . (Z) (Z) 0.1 0.1 0.1 0.1 0.5Chief Warrant Officer W-4 . . . . . . . . . 3.0 2.2 2.0 2.0 2.1 1.9 2.2Chief Warrant Officer W-3 . . . . . . . . . 5.0 4.5 3.8 4.3 4.6 4.1 4.6Chief Warrant Officer W-2 . . . . . . . . . 8.4 7.4 6.7 6.2 6.2 6.0 6.2Warrant Officer W-1 . . . . . . . . . . . . . 3.2 2.0 2.1 2.3 2.4 3.1 2.5Total Officers . . . . . . . . . . . . . . . . . 296.6 237.6 217.2 223.0 227.9 226.7 226.6
E-9 . . . . . . . . . . . . . . . . . . . . . . . . 15.3 11.1 10.2 10.6 10.8 10.7 10.5E-8 . . . . . . . . . . . . . . . . . . . . . . . . 38.0 28.8 26.0 27.0 27.7 27.1 27.1E-7 . . . . . . . . . . . . . . . . . . . . . . . . 134.1 109.3 97.7 101.9 101.4 99.6 97.8E-6 . . . . . . . . . . . . . . . . . . . . . . . . 239.1 180.5 164.9 170.0 172.4 173.1 172.4E-5 . . . . . . . . . . . . . . . . . . . . . . . . 361.5 261.4 229.5 242.5 250.7 251.1 248.5E-4 . . . . . . . . . . . . . . . . . . . . . . . . 427.8 317.2 251.0 248.1 264.5 264.1 261.7E-3 . . . . . . . . . . . . . . . . . . . . . . . . 280.1 197.1 196.3 219.6 222.1 220.1 201.7E-2 . . . . . . . . . . . . . . . . . . . . . . . . 140.3 99.7 99.0 91.8 85.1 84.3 70.8E-1 . . . . . . . . . . . . . . . . . . . . . . . . 97.6 63.4 80.0 64.7 59.2 55.8 59.5Total Enlisted . . . . . . . . . . . . . . . . . 1,733.8 1,268.5 1,154.6 1,176.2 1,193.9 1,172.0 1,149.9Cadets and Midshipmen . . . . . . . . . . 13.3 12.1 12.5 12.5 12.6 12.6 12.9
Z Fewer than 50.
Source: U.S. Department of Defense, DoD Personnel and Procurement Statistics, Personnel, Military, Military PersonnelStatistics, annual; <http://siadapp.dior.whs.mil/index.htm>.
334 National Security and Veterans Affairs
U.S. Census Bureau, Statistical Abstract of the United States: 2007

Table 504. Military Reserve Personnel: 1990 to 2005[As of September 30. The Ready Reserve includes the Selected Reserve which is scheduled to augment active forces during timesof war or national emergency, and the Individual Ready Reserve which, during times of war or national emergency, would be usedto fill out Active, Guard, and Reserve units, and which would also be a source for casualty replacements; Ready Reservists servein an active status (except for the Inactive National Guard—a very small pool within the Army National Guard). The Standby Reservecannot be called to active duty, other than for training, unless authorized by Congress under ‘‘full mobilization,’’ and a determina-tion is made that there are not enough qualified members in the Ready Reserve in the required categories who are readily avail-able. The Retired Reserve represents a lower potential for involuntary mobilization]
Reserve status andbranch of service 1990 1995 2000 2002 2003 2004 2005
Total reserves 1 . . . . 1,688,674 1,674,164 1,276,843 1,222,337 1,188,851 1,166,937 1,136,200
Ready reserve . . . . . . . 1,658,707 1,648,388 1,251,452 1,199,321 1,167,101 1,145,035 1,113,427Army 2 . . . . . . . . . . . . . . 1,049,579 999,462 725,771 699,548 682,522 663,209 636,355Navy . . . . . . . . . . . . . . . 240,228 267,356 184,080 159,098 152,855 148,643 140,821Marine Corps . . . . . . . . . . 81,355 103,668 99,855 97,944 98,868 101,443 99,820Air Force 3. . . . . . . . . . . . 270,313 263,011 229,009 229,798 219,895 219,159 223,551Coast Guard . . . . . . . . . . 17,232 14,891 12,737 12,933 12,961 12,581 12,880
Standby reserve . . . . . . 29,967 25,776 25,391 23,016 21,750 21,902 22,773Army . . . . . . . . . . . . . . . 788 1,128 701 726 744 715 1,668Navy . . . . . . . . . . . . . . . 11,791 12,707 7,213 4,051 2,520 2,502 4,038Marine Corps . . . . . . . . . . 1,424 216 895 605 685 992 1,129Air Force. . . . . . . . . . . . . 15,369 11,453 16,429 17,430 17,578 17,340 15,897Coast Guard . . . . . . . . . . 595 272 153 204 223 353 41
Retired reserve . . . . . . . 462,371 505,905 573,305 590,018 601,611 614,904 627,424Army . . . . . . . . . . . . . . . 223,919 259,553 296,004 304,524 308,820 315,477 321,312Navy . . . . . . . . . . . . . . . 111,961 97,532 109,531 112,374 113,485 115,210 117,093Marine Corps . . . . . . . . . . 9,101 11,319 12,937 13,672 13,926 14,319 14,693Air Force. . . . . . . . . . . . . 117,390 137,501 154,833 159,448 165,380 169,898 174,326
1 Less retired reserves. 2 Includes Army National Guard and Army Reserve. 3 Includes Air National Guard and Air ForceReserve.
Source: U.S. Department of Defense, Official Guard and Reserve Manpower Strengths and Statistics, quarterly. See also<http://siadapp.dior.whs.mil/index.html>.
Table 505. Ready Reserve Personnel Profile—Race and Sex: 1990 to 2005[In thousands (1,658.7 represents 1,658,700). As of September 30]
Year
Race
Hispanic 2
Sex
Total 1 White Black AsianAmerican
Indian
Officer Enlisted
Male Female Male Female
1990 . . . 1,658.7 1,304.6 272.3 14.9 7.8 83.1 226.8 40.5 1,204.7 186.71993 . . . 1,858.1 1,440.7 310.5 21.3 9.2 98.2 232.5 46.3 1,365.6 213.71994 . . . 1,795.8 1,380.9 298.3 22.4 9.0 99.1 223.9 46.2 1,315.8 210.0
1995 . . . 1,648.4 1,267.7 274.5 22.0 8.8 96.2 209.9 44.7 1,196.8 196.91996 . . . 1,536.6 1,179.0 249.8 21.5 8.6 93.1 196.9 43.6 1,108.8 187.41997 . . . 1,451.0 1,113.7 230.6 21.7 8.4 91.5 188.7 43.2 1,037.6 181.51998 . . . 1,353.4 1,033.9 210.4 21.7 7.8 88.2 175.9 40.3 964.1 173.11999 . . . 1,288.8 980.0 202.6 22.6 7.6 88.9 166.2 38.4 911.2 173.1
2000 . . . 1,251.5 942.2 199.6 26.7 8.4 91.8 159.4 36.9 879.9 175.32001 . . . 1,224.1 912.7 198.4 27.9 8.5 94.3 158.0 36.6 852.2 177.32002 . . . 1,199.3 891.3 193.2 27.9 8.8 96.0 152.1 35.6 835.2 176.42003 . . . 1,167.1 865.7 187.5 25.4 8.5 98.0 145.1 34.0 813.7 174.32004 . . . 1,145.0 845.3 181.3 26.2 9.1 100.2 141.9 33.6 799.7 169.8
2005 . . . 1,113.4 825.4 169.9 26.9 9.5 99.8 139.2 33.3 778.0 162.9
1 Race subgroups do not sum to equal the total. ‘‘Pacific Islanders, Other, and Unknowns’’ are not listed. 2 Persons ofHispanic origin may be any race.
Source: U.S. Department of Defense, Official Guard and Reserve Manpower Strengths and Statistics, annual. See also<http://siadapp.dior.whs.mil/index.html>.
Table 506. National Guard—Summary: 1980 to 2005[In thousands (368 represents 368,000). As of September 30]
Item Unit 1980 1990 1995 2000 2001 2002 2003 2004 2005
Army National Guard:Units . . . . . . . . . . . . . . . . . . . Number . . . 3,379 4,055 5,872 5,300 5,200 5,150 5,100 15,100 15,000
Personnel 2 . . . . . . . . . . . . . 1,000 . . . . 368 444 375 353 352 352 351 343 334Females . . . . . . . . . . . . . 1,000 . . . . 17 31 31 38 42 43 44 44 43
Funds obligated 3 . . . . . . . . . Bil. dol. . . . 1.8 5.2 6.0 6.9 7.7 8.0 10.0 48.3 10.6Value of equipment . . . . . . . . Bil. dol. . . . 7.6 29.0 33.0 35.0 35.0 35.0 36.0 526.0 525.0
Air National Guard:Units . . . . . . . . . . . . . . . . . . . Number . . . 1,054 1,339 1,604 1,550 1,500 1,500 1,500 11,500 11,400
Personnel 2 . . . . . . . . . . . . . 1,000 . . . . 96 118 110 106 109 112 108 108 106Funds obligated 3 . . . . . . . . . Bil. dol. . . . 1.7 3.2 4.2 5.6 5.8 6.8 6.4 7.6 7.9
NA Not available. 1 Includes units on active duty. 2 Officers and enlisted personnel. 3 Federal funds; includes personnel,operations, maintenance, and military construction. 4 Dollar amounts allocated to the National Guard in the states and territorieshas declined due to large numbers of Army National Guard personnel on active federal service for the war in Iraq andAfghanistan. 5 Decreased due to equipment left overseas by mobilized units.
Source: National Guard Bureau, Annual Review of the Chief, National Guard Bureau; and unpublished data. See also<http://www.ang.af.mil> and <http://www.arng.army.mil>.
National Security and Veterans Affairs 335
U.S. Census Bureau, Statistical Abstract of the United States: 2007

Table 507. Veterans by Sex, Period of Service, and State: 2005[In thousands (24,128 represents 24,128,000). As of September 30. VetPop 2004 Version 1.0 is the Department of VeteransAffairs (VA) latest official estimate and projection of the veteran population. It is based on published Census 2000 data supplementedby special extracts prepared for VA Office of the Actuary by the Census Bureau. This estimate and projection also uses adminis-trative data and projections of service member separations from active duty provided by the Department of Defense (the DefenseManpower Data Center and the Office of the Actuary), as well as VA administrative data on veterans benefits]
StateTotal veterans 1, 2
GulfWar 3
Vietnamera
Koreanconflict
WorldWar II
Peace-timeTotal Male Female
United States 4 . . . 24,128 22,434 1,695 4,336 7,975 3,212 3,492 6,162Alabama . . . . . . . . . . . 422 391 31 86 142 59 53 107Alaska . . . . . . . . . . . . 67 60 7 19 26 5 4 17Arizona . . . . . . . . . . . . 553 510 43 99 177 84 89 135Arkansas. . . . . . . . . . . 266 248 18 49 89 36 38 68California. . . . . . . . . . . 2,257 2,092 165 382 761 313 344 568Colorado . . . . . . . . . . . 424 388 36 94 153 48 45 107Connecticut . . . . . . . . . 260 246 15 30 84 38 47 68Delaware. . . . . . . . . . . 80 74 6 14 26 11 11 21District of Columbia. . . . 36 33 3 6 11 5 6 9Florida . . . . . . . . . . . . 1,768 1,637 131 296 530 283 338 433Georgia . . . . . . . . . . . 759 691 68 190 256 80 70 201Hawaii . . . . . . . . . . . . 105 96 8 20 38 14 14 25Idaho . . . . . . . . . . . . . 133 123 9 30 43 16 17 32Illinois . . . . . . . . . . . . . 874 821 53 143 278 116 135 223Indiana . . . . . . . . . . . . 543 510 32 90 176 67 72 150Iowa. . . . . . . . . . . . . . 260 247 14 39 87 38 40 63Kansas . . . . . . . . . . . . 242 226 16 45 83 31 35 58Kentucky. . . . . . . . . . . 356 334 22 66 120 45 46 91Louisiana . . . . . . . . . . 362 335 27 77 119 45 49 88Maine . . . . . . . . . . . . . 141 132 9 21 49 20 20 38Maryland. . . . . . . . . . . 479 435 44 101 156 56 59 130Massachusetts . . . . . . . 476 448 28 58 148 72 88 124Michigan . . . . . . . . . . . 820 773 48 124 271 104 118 220Minnesota . . . . . . . . . . 418 396 23 59 145 55 57 112Mississippi. . . . . . . . . . 238 220 18 53 76 33 31 60Missouri . . . . . . . . . . . 546 512 35 92 180 74 77 143Montana . . . . . . . . . . . 101 94 7 17 36 13 14 25Nebraska . . . . . . . . . . 157 146 11 30 53 22 22 36Nevada. . . . . . . . . . . . 244 225 19 45 87 34 30 64New Hampshire . . . . . . 129 121 8 20 45 17 17 36New Jersey . . . . . . . . . 564 533 30 66 172 86 106 148New Mexico. . . . . . . . . 178 163 15 34 64 24 23 43New York . . . . . . . . . . 1,133 1,066 67 146 343 166 200 302North Carolina . . . . . . . 762 702 60 164 252 94 92 197North Dakota . . . . . . . . 54 51 4 10 19 7 7 13Ohio. . . . . . . . . . . . . . 1,032 970 62 166 331 131 153 277Oklahoma . . . . . . . . . . 351 327 24 69 125 46 47 82Oregon . . . . . . . . . . . . 362 337 25 57 129 45 52 93Pennsylvania . . . . . . . . 1,117 1,054 63 144 347 162 204 291Rhode Island . . . . . . . . 89 83 5 12 28 13 16 23South Carolina . . . . . . . 412 380 32 91 142 52 48 105South Dakota. . . . . . . . 72 67 5 14 24 11 10 17Tennessee. . . . . . . . . . 537 500 37 103 186 66 63 142Texas . . . . . . . . . . . . . 1,667 1,535 133 377 577 199 203 404Utah. . . . . . . . . . . . . . 149 140 9 31 49 20 22 35Vermont . . . . . . . . . . . 57 53 4 8 19 8 8 16Virginia . . . . . . . . . . . . 744 670 74 206 259 83 77 178Washington . . . . . . . . . 625 575 50 130 228 72 74 158West Virginia . . . . . . . . 185 175 10 29 64 26 27 46Wisconsin . . . . . . . . . . 466 439 27 70 151 62 67 127Wyoming. . . . . . . . . . . 54 51 4 12 20 6 6 12
1 Veterans serving in more than one period of service are counted only once in the total. 2 Current civilians discharged fromactive duty, other than for training only without service-connected disability. 3 Service from August 2, 1990, to the present.4 Totals may not add due to rounding of numbers.
Source: U.S. Department of Veterans Affairs, Office of Policy, Planning & Preparedness; VetPop 2004, Version 1.0, VA Officeof the Actuary <http://www1.va.gov/vetdata>.
Table 508. Veterans Living by Age and Period of Service: 2005[In thousands (24,387 represents 24,387,000). As of September 30. Includes those living outside U.S. See headnote, Table 507]
Age Totalveterans
Wartime veterans
PeacetimeveteransTotal 1
GulfWar 2
Vietnamera
Koreanconflict
WorldWar II
Total . . . . . . . . . . . 24,387 18,156 4,378 8,055 3,257 3,526 6,231Under 35 years old . . . . . 1,966 1,940 1,940 − − − 2735−39 years old . . . . . . . 1,317 886 886 − − − 43140−44 years old . . . . . . . 1,679 573 573 − − − 1,10645−49 years old . . . . . . . 1,886 595 422 191 − − 1,29150−54 years old . . . . . . . 2,034 1,609 294 1,448 − − 42555−59 years old . . . . . . . 3,484 3,360 178 3,309 − − 12460−64 years old . . . . . . . 2,673 2,102 59 2,091 − − 57165 years old and over . . . 9,348 7,091 27 1,015 3,257 3,526 2,257Female, total . . . . . . . . . 1,712 1,153 688 260 77 164 559
− Represents or rounds to zero. 1 Veterans who served in more than one wartime period are counted only once in thetotal. 2 Service from August 2, 1990 to the present.
Source: U.S. Department of Veterans Affairs, Office of Policy, Planning and Preparedness; VetPop 2004, Ver 1.0, VA Officeof the Actuary <http://www1.va.gov/vetdata>.
336 National Security and Veterans Affairs
U.S. Census Bureau, Statistical Abstract of the United States: 2007

Table 509. Veterans by Sex, Race, and Hispanic or Latino Origin: 2004[In thousands (23,756.3 represents 23,756,300). Data are based on the American Community Survey (ACS). The survey universeis limited to the household population and excludes the population living in institutions, college dormitories, and other group quar-ters. Based on a sample and subject to sampling variability; see text of this section and Appendix III]
Characteristics Total number 18 to 64 years 65 years and over
Total . . . . . . . . . . . . . . . . . . . . . . . . . . 23,756.3 14,694.0 9,062.2Sex:
Male . . . . . . . . . . . . . . . . . . . . . . . . . . . . . . . 22,147.0 13,419.2 8,727.8Female . . . . . . . . . . . . . . . . . . . . . . . . . . . . . 1,609.3 1,274.9 334.4
White alone . . . . . . . . . . . . . . . . . . . . . . . . . . . . 20,299.8 11,995.3 8,304.5Male . . . . . . . . . . . . . . . . . . . . . . . . . . . . . . . 19,087.7 11,094.7 7,993.0Female . . . . . . . . . . . . . . . . . . . . . . . . . . . . . 1,212.1 900.7 311.5
Black or African American alone . . . . . . . . . . . . . . 2,381.1 1,870.5 510.6Male . . . . . . . . . . . . . . . . . . . . . . . . . . . . . . . 2,096.5 1,600.2 496.3Female . . . . . . . . . . . . . . . . . . . . . . . . . . . . . 284.6 270.3 14.3
American Indian/Alaska Native alone . . . . . . . . . . . 164.2 129.5 34.7Male . . . . . . . . . . . . . . . . . . . . . . . . . . . . . . . 145.2 111.3 33.8Female . . . . . . . . . . . . . . . . . . . . . . . . . . . . . 19.0 18.2 0.8
Asian alone . . . . . . . . . . . . . . . . . . . . . . . . . . . . 282.2 195.965 86.2Male . . . . . . . . . . . . . . . . . . . . . . . . . . . . . . . 253.8 169.2 84.6Female . . . . . . . . . . . . . . . . . . . . . . . . . . . . . 28.4 26.8 1.6
Native Hawaiian and Other Pacific Islander alone . . . 30.7 24.6 6.1Male . . . . . . . . . . . . . . . . . . . . . . . . . . . . . . . 26.8 22.0 4.9Female . . . . . . . . . . . . . . . . . . . . . . . . . . . . . 3.8 2.6 1.2
Some other race alone . . . . . . . . . . . . . . . . . . . . 329.1 273.1 55.9Male . . . . . . . . . . . . . . . . . . . . . . . . . . . . . . . 296.1 242.6 53.6Female . . . . . . . . . . . . . . . . . . . . . . . . . . . . . 32.9 30.6 2.4
Hispanic or Latino origin 1 . . . . . . . . . . . . . . . . . . 1,086.9 834.6 252.4Male . . . . . . . . . . . . . . . . . . . . . . . . . . . . . . . 988.2 744.7 243.5Female . . . . . . . . . . . . . . . . . . . . . . . . . . . . . 98.7 89.9 8.8
1 Persons of Hispanic or Latino origin may be any race.Source: U.S. Census Bureau, 2000 Census of Population and Housing, Summary File 3, using American FactFinder, tables
B21001, B21001A, B21001B, B21001C, B21001D, B21001E, B21001F, and B21001I; <http://www.census.gov/prod/2003pubs/c2kbr-22.pdf> (accessed 15 May 2006).
Table 510. Veterans Benefits—Expenditures by Program and Compensation forService-Connected Disabilities: 1980 to 2005
[In millions of dollars (23,187 represents $23,187,000,000). For years ending September 30]
Program 1980 1990 1995 2000 2001 2002 2003 2004 2005
Total expenditures . . . . . . . . . . . 23,187 28,998 37,775 47,086 45,037 50,882 56,892 59,555 69,564Medical programs . . . . . . . . . . . . . . . . 6,042 11,582 16,255 19,637 21,330 23,049 25,188 28,158 29,191Construction . . . . . . . . . . . . . . . . . . . 300 661 641 466 421 449 411 318 480General operating expenses . . . . . . . . . 605 811 954 1,016 1,222 1,318 1,399 1,252 1,285Compensation and pension . . . . . . . . . 11,044 14,674 17,765 22,012 23,276 25,573 27,995 29,937 32,131Vocational rehabilitation and education . . 2,350 452 1,317 1,610 1,786 2,170 2,565 2,827 3,033All other 1 . . . . . . . . . . . . . . . . . . . . . 2,846 818 844 2,345 -2,999 -1,676 -666 -2,937 3,445
Compensation for service-connected disabilities 2 . . . . . . . . 6,104 9,284 11,644 15,511 16,593 18,584 20,855 22,387 24,5151 Includes insurance, indemnities and miscellaneous funds and expenditures. (Excludes expenditures from personal funds of
patients.) 2 Represents veterans receiving compensation for service-connected disabilities.Source: U.S. Department of Veterans Affairs, Expenditures and Workload, annual and unpublished data. See also
<http://www1.va.gov./vetdata>.
Table 511. Veterans Compensation and Pension Benefits—Number on Rolls byPeriod of Service and Status: 1980 to 2005
[In thousands (4,646 represents 4,646,000), except as indicated. As of September 30. Living refers to veterans receivingcompensation for disability incurred or aggravated while on active duty and low-income wartime veterans receiving pension whohave permanent and total mostly non-service connected disabilities or are age 65 or older. Deceased refers to deceased veteranswhose dependents were receiving pensions and compensation benefits]
Period of service and veteran status 1980 1990 1995 2000 2002 2003 2004 2005
Total . . . . . . . . . . . . . . . . . . . . . 4,646 3,584 3,330 3,236 3,285 3,369 3,432 3,503Living veterans. . . . . . . . . . . . . . . . . . 3,195 2,746 2,669 2,672 2,745 2,832 2,899 2,973
Service-connected . . . . . . . . . . . . . . 2,273 2,184 2,236 2,308 2,398 2,485 2,556 2,637Nonservice-connected . . . . . . . . . . . 922 562 433 364 347 347 343 336
Deceased veterans . . . . . . . . . . . . . . . 1,451 838 662 564 540 538 533 530Service-connected . . . . . . . . . . . . . . 358 320 307 307 310 314 318 323Nonservice-connected . . . . . . . . . . . 1,093 518 355 257 230 224 215 207
Prior to World War I . . . . . . . . . . . . . . 14 4 2 1 1 1 (Z) (Z)Living . . . . . . . . . . . . . . . . . . . . . . (Z) (Z) (Z) (Z) (Z) (Z) (Z) (Z)
World War I . . . . . . . . . . . . . . . . . . . . 692 198 89 34 23 19 16 13Living . . . . . . . . . . . . . . . . . . . . . . 198 18 3 (Z) (Z) (Z) (Z) (Z)
World War II . . . . . . . . . . . . . . . . . . . 2,520 1,723 1,307 968 856 813 766 718Living . . . . . . . . . . . . . . . . . . . . . . 1,849 1,294 961 676 583 546 506 466
Korean conflict 1 . . . . . . . . . . . . . . . . . 446 390 368 323 308 306 302 295Living . . . . . . . . . . . . . . . . . . . . . . 317 305 290 255 243 241 237 231
Vietnam era 2. . . . . . . . . . . . . . . . . . . 662 774 868 969 1,052 1,120 1,172 1,218Living . . . . . . . . . . . . . . . . . . . . . . 569 685 766 848 922 983 1,028 1,068
Gulf War 3 . . . . . . . . . . . . . . . . . . . . . (X) (X) 138 334 431 490 552 630Living . . . . . . . . . . . . . . . . . . . . . . (X) (X) 134 326 421 479 540 617
Peacetime . . . . . . . . . . . . . . . . . . . . . 312 495 559 607 613 620 624 627Living . . . . . . . . . . . . . . . . . . . . . . 262 444 514 567 575 583 587 591
X Not applicable. Z Fewer than 500. 1 Service during period June 27, 1950, to January 31, 1955. 2 Service from August5, 1964, to May 7, 1975. 3 Service from August 2, 1990, to the present.
Source: U.S. Department of Veterans Affairs, 1980 to 1995, Annual Report of the Secretary of Veterans Affairs; beginning2000, Annual Accountablility Report and unpublished data. See also <http://www1.va.gov/vetdata>.
National Security and Veterans Affairs 337
U.S. Census Bureau, Statistical Abstract of the United States: 2007

Table 512. Homeland Security Funding by Agency: 2004 to 2006
[In millions of dollars (41,307.1 represents $41,307,100,000). For year ending September 30. A total of 32 agencies comprisefederal homeland security funding for 2006. Department of Homeland Security (DHS) is the designated department to coordinateand centralize the leadership of many homeland security activities under a single department. In addition to DHS, the Departmentsof Defense (DoD), Energy (DoE), Health and Human Services (HHS), and Justice (DoJ), account for most of the total government-wide homeland security funding]
Agency 2004 2005 1 2006 1
Total budget authority, excluding BioShield 2, 3, 4 . . . . . . . . . . . 41,307.1 52,657.2 54,852.9
Department of Agriculture . . . . . . . . . . . . . . . . . . . . . . . . . . . . . . 326.6 595.9 563.0Department of Commerce . . . . . . . . . . . . . . . . . . . . . . . . . . . . . . 131.2 166.7 181.1Department of Defense 5 . . . . . . . . . . . . . . . . . . . . . . . . . . . . . . . 7,024.0 16,107.7 16,440.4Department of Education . . . . . . . . . . . . . . . . . . . . . . . . . . . . . . . 8.0 23.9 27.5Department of Energy . . . . . . . . . . . . . . . . . . . . . . . . . . . . . . . . . 1,362.5 1,562.0 1,705.2Department of Health and Human Services. . . . . . . . . . . . . . . . . . . 4,109.0 4,229.4 4,299.1Department of Homeland Security . . . . . . . . . . . . . . . . . . . . . . . . . 23,492.3 23,979.9 25,499.0
Department of Housing and Urban Development . . . . . . . . . . . . . . . 1.8 2.0 1.9Department of the Interior . . . . . . . . . . . . . . . . . . . . . . . . . . . . . . 67.2 65.0 55.6Department of Justice . . . . . . . . . . . . . . . . . . . . . . . . . . . . . . . . . 2,165.8 2,690.8 2,975.4Department of Labor . . . . . . . . . . . . . . . . . . . . . . . . . . . . . . . . . . 52.4 56.1 48.3Department of State . . . . . . . . . . . . . . . . . . . . . . . . . . . . . . . . . . 701.3 824.1 1,107.9Department of Transportation . . . . . . . . . . . . . . . . . . . . . . . . . . . . 283.5 219.3 181.0Department of the Treasury . . . . . . . . . . . . . . . . . . . . . . . . . . . . . 90.4 101.1 115.8
Department of Veterans Affairs . . . . . . . . . . . . . . . . . . . . . . . . . . . 271.3 249.4 308.8Corps of Engineers. . . . . . . . . . . . . . . . . . . . . . . . . . . . . . . . . . . 103.4 89.0 72.0Environmental Protection Agency . . . . . . . . . . . . . . . . . . . . . . . . . 123.3 106.3 129.3Executive Office of the President. . . . . . . . . . . . . . . . . . . . . . . . . . 35.0 29.5 20.8General Services Administration . . . . . . . . . . . . . . . . . . . . . . . . . . 78.9 65.2 98.6National Aeronautics and Space Administration . . . . . . . . . . . . . . . . 191.0 220.5 212.6National Science Foundation . . . . . . . . . . . . . . . . . . . . . . . . . . . . 327.9 342.2 344.2
Office of Personnel Management . . . . . . . . . . . . . . . . . . . . . . . . . 3.0 3.0 2.7Social Security Administration. . . . . . . . . . . . . . . . . . . . . . . . . . . . 143.4 154.7 176.8District of Columbia . . . . . . . . . . . . . . . . . . . . . . . . . . . . . . . . . . 19.0 15.0 13.5Federal Communications Commission . . . . . . . . . . . . . . . . . . . . . . 1.0 1.8 2.3Intelligence Community Management Account . . . . . . . . . . . . . . . . . 1.0 72.4 56.0National Archives and Records Administration . . . . . . . . . . . . . . . . . 12.0 17.1 18.2
Nuclear Regulatory Commission . . . . . . . . . . . . . . . . . . . . . . . . . . 66.8 59.2 79.3Postal Service . . . . . . . . . . . . . . . . . . . . . . . . . . . . . . . . . . . . . . (X) 503.0 (X)Securities and Exchange Commission . . . . . . . . . . . . . . . . . . . . . . 5.0 5.0 5.0Smithsonian Institution . . . . . . . . . . . . . . . . . . . . . . . . . . . . . . . . 78.3 75.0 83.7United States Holocaust Memorial Museum . . . . . . . . . . . . . . . . . . 8.0 8.0 7.8Corporation for National and Community Service . . . . . . . . . . . . . . . 22.8 17.0 20.4
X Not applicable. 1 FY 05 and 06 reflect the adjustments made for the Coast Guard (DHS) and re-estimates for DoD. See‘‘Source’’ for further details. 2 Enacted Budget. 3 The federal spending estimates are for the Executive Branch’s homelandsecurity efforts. These estimates do not include the efforts of the Legislative or Judicial Branches. 4 The Department of HomelandSecurity Appropriations Act, 2004, provided $5.6 billion for Project BioShield, to remain available through 2008. Including thisuneven funding stream can distort year-over-year comparisons. 5 In all tables, classified funds controlled by the Director ofNational Intelligence are combined with the Department of Defense and titled ‘‘Department of Defense.’’
Source: U.S. Office of Management and Budget, Budget of the United States Government Fiscal Year 2007, The BudgetDocuments, Analytical Perspectives, Budget of the United States Government Fiscal Year 2007, Crosscutting Programs,Homeland Security Funding Analysis, <http://www.whitehouse.gov/omb/budget/fy2007/>.
Table 513. Homeland Security Funding by National Strategy Mission Area:2004 to 2006
[In millions of dollars. ($41,307.1 represents 41,307,100,000). For Homeland Security funding analysis by OMB, agenciescategorize their funding data based on the critical mission areas defined in the National Strategy]
Agency 2004 2005 1 2006 1
Total budget authority excluding Bioshield 2, 3 . . . . . . . . . . . . . 41,307.1 52,657.2 54,852.9
Intelligence and warning . . . . . . . . . . . . . . . . . . . . . . . . . . . . . . . 268.7 349.8 428.2Border and transportation security . . . . . . . . . . . . . . . . . . . . . . . . . 15,322.5 16,652.3 18,348.6Domestic counterterrorism . . . . . . . . . . . . . . . . . . . . . . . . . . . . . . 2,994.1 3,974.5 4,548.0Protecting critical infrastructure and key assets . . . . . . . . . . . . . . . . 12,571.0 17,835.9 17,851.7Defending against catastrophic threats . . . . . . . . . . . . . . . . . . . . . . 2,827.2 8,146.4 8,639.8Emergency preparedness and response. . . . . . . . . . . . . . . . . . . . . 7,132.5 5,645.5 4,924.3Other . . . . . . . . . . . . . . . . . . . . . . . . . . . . . . . . . . . . . . . . . . . . 191.1 43.8 112.4
1 FY 05 and 06 reflect the adjustments made for the Coast Guard and re-estimates for DoD. See ‘‘Source’’ for further details.2 Enacted Budget. 3 See footnote 4 in Table 512.
Source: U.S. Office of Management and Budget, Budget of the United States Government Fiscal Year 2007, The BudgetDocuments, Analytical Perspectives, Budget of the United States Government Fiscal Year 2007, Crosscutting Programs,Homeland Security Funding Analysis, <http://www.whitehouse.gov/omb/budget/fy2007/>.
338 National Security and Veterans Affairs
U.S. Census Bureau, Statistical Abstract of the United States: 2007

Table 514. Department of Homeland Security Total Budget Authority andPersonnel by Organization: 2005 and 2006
[Expenditures in thousands of dollars (38,369,517 represents $38,369,517,000). For the fiscal year ending September 30. Notall activities carried out by DHS constitute homeland security funding (e.g., Coast Guard search and rescue activities]
OrganizationExpenditures Full-time employees
2005 1 2006 1 2005 1 2006 1
Adjusted Total Budget Authority 2, 3 . . . . . . . . . . . . . . . . . . . . . 38,369,517 40,345,347 179,646 182,131
U.S.—Visitor Immigrant Status Indicator Technology (US—VISIT) . 340,000 336,600 102 102U.S. Customs & Border Protection. . . . . . . . . . . . . . . . . . . . . . 6,344,398 7,109,875 40,636 41,986U.S. Immigration & Customs Enforcement . . . . . . . . . . . . . . . . 3,127,078 3,866,443 14,600 15,917Transportation Security Administration . . . . . . . . . . . . . . . . . . . 6,068,275 6,167,014 52,615 50,363Preparedness Directorate 4 . . . . . . . . . . . . . . . . . . . . . . . . . . (X) 678,395 (X) 966Preparedness: Office of Grants and Training . . . . . . . . . . . . . . . (X) 3,352,437 (X) 233Analysis and Operations 5 . . . . . . . . . . . . . . . . . . . . . . . . . . . (X) 252,940 (X) 406Federal Law Enforcement Training Center . . . . . . . . . . . . . . . . 226,807 279,534 982 1,001U.S. Coast Guard. . . . . . . . . . . . . . . . . . . . . . . . . . . . . . . . . 7,558,560 8,193,797 46,809 47,121U.S. Secret Service . . . . . . . . . . . . . . . . . . . . . . . . . . . . . . . 1,385,758 1,399,889 6,516 6,564Federal Emergency Management Agency (FEMA) . . . . . . . . . . . 5,038,256 4,834,744 4,735 5,708U.S. Citizenship & Immigration Services . . . . . . . . . . . . . . . . . . 1,775,000 1,887,850 10,052 10,207Science & Technology Directorate (S&T) . . . . . . . . . . . . . . . . . 1,115,450 1,487,075 320 387Office of Screening Coordination and Operation. . . . . . . . . . . . . (X) 3,960 (X) 17Departmental Management and Operations . . . . . . . . . . . . . . . 527,257 559,230 687 846Counter-Terrorism Fund. . . . . . . . . . . . . . . . . . . . . . . . . . . . . 8,000 1,980 (X) (X)Inspector General. . . . . . . . . . . . . . . . . . . . . . . . . . . . . . . . . 82,317 82,187 502 540Legacy DHS Organizations 6
BTS Under Secretary . . . . . . . . . . . . . . . . . . . . . . . . . . . . . . 9,617 (X) 67 (X)IAIP Directorate . . . . . . . . . . . . . . . . . . . . . . . . . . . . . . . . . . 887,108 (X) 803 (X)SLGCP (Formerly ODP) . . . . . . . . . . . . . . . . . . . . . . . . . . . . 3,984,846 (X) 220 (X)
X Not applicable. 1 Revised enacted total. 2 Reflects adjustment for recission of prior year carryover funds. 3 ExcludesBioShield funding, see footnote 4, table 512. 4 The Preparedness Directorate did not exist for FY 2005. Under the Second StageReview (2SR) changes, elements of IAIP, SLGCP, and EP&R were combined to the Preparedness Directorate. 5 The Analysisand Operations did not exist for FY 2005. Under the Second Stage Review (2SR) changes, the appropriation provides resourcesfor the support of the Office of Intelligence and Analysis and the Directorate of Operations. 6 For FY 2006, BTS Under Secretary,IAIP Directorate and SLGCP, have become legacy DHS components.
Source:U.S.DepartmentofHomelandSecurity, ‘‘Budget-in-Brief,FiscalYear2007.’’<http://www.dhs.gov/interweb/assetlibrary/Budget_BIB-FY2007.pdf\> (accessed 7 February 2006)
Table 515. Homeland Security Grants by State/Territories: 2004 and 2005[In thousands of dollars (3,115,550 represents 3,115,550,000). For fiscal years ending September 30. Grants consist of thefollowing programs: Citizen Corps Program (CCP), Law Enforcement Terrorism Prevention Program (LETPP), Emergency Man-agement Performance Grant (EMPG), State Homeland Security Program (SHSP), Metropolitan Medical Response System (MMRS),and Urban Areas Security Initiative (UASI). Urban Areas Security Initiative program includes the Urban Areas Program, Transit Secu-rity Program, Port Security Grant Program and the Intercity Bus Program. 2005 grants include all the programs as in 2004 exceptfor Port Security Grant Program and the Intercity Bus Program. These programs have not yet been awarded as of May 2005]
State/Territory 2004 2005
Total . . 3,115,550 2,518,763
U.S. . . . . 3,050,076 2,475,564
AL . . . . . . . 38,723 28,153AK . . . . . . . 21,218 14,879AZ . . . . . . . 53,371 41,705AR . . . . . . . 28,815 21,561CA . . . . . . . 349,894 282,622CO . . . . . . . 45,583 36,799CT . . . . . . . 46,523 24,080DE . . . . . . . 20,206 14,984DC . . . . . . . 49,231 96,144FL . . . . . . . 142,667 101,285GA . . . . . . . 70,815 54,918HI. . . . . . . . 26,865 23,130ID. . . . . . . . 22,621 16,805IL . . . . . . . . 114,925 102,593IN. . . . . . . . 55,534 38,996IA. . . . . . . . 29,918 22,291KS . . . . . . . 29,064 21,784
State/Territory 2004 2005
KY . . . . . . . 45,537 31,419LA . . . . . . . 76,005 42,670ME . . . . . . . 23,776 16,609MD . . . . . . . 64,014 42,250MA . . . . . . . 69,288 62,436MI . . . . . . . 76,981 64,075MN . . . . . . . 60,236 35,311MS . . . . . . . 31,795 22,081MO. . . . . . . 66,618 46,952MT . . . . . . . 20,689 15,318NE . . . . . . . 24,376 23,656NV . . . . . . . 37,196 28,386NH . . . . . . . 24,110 16,776NJ . . . . . . . 95,795 60,811NM . . . . . . . 24,946 18,499NY . . . . . . . 178,492 298,351NC . . . . . . . 65,392 46,609ND . . . . . . . 19,421 14,376OH . . . . . . . 103,582 77,823OK . . . . . . . 32,824 29,974OR . . . . . . . 41,665 34,820
State/Territory 2004 2005
PA . . . . . . . 109,866 87,671RI. . . . . . . . 23,485 16,074SC . . . . . . . 40,643 26,284SD . . . . . . . 19,996 14,809TN . . . . . . . 54,157 32,605TX . . . . . . . 195,671 138,570UT . . . . . . . 27,033 20,308VT . . . . . . . 19,594 14,326VA . . . . . . . 61,902 38,185WA . . . . . . . 73,593 45,330WV. . . . . . . 25,270 18,289WI . . . . . . . 51,343 37,251WY. . . . . . . 18,809 13,934
PR 1 . . . . 37,864 25,169VI . . . . . . 6,918 4,612AS . . . . . 5,776 4,279GU . . . . . 7,016 4,706NM . . . . . 7,960 4,333RM . . . . . − 50FM . . . . . − 50
− Represents zero. 1 PR—Puerto Rico, VI—Virgin Islands, AS—America Samoa, GU—Guam, NM—Northern MarianaIslands, MH—Marshall Islands, and FM—Micronesia.
Source: U.S. Department of Homeland Security, State and Local Government Coordination and Preparedness, unpublisheddata. See also <http://www.ojp.gov/odp>.
Table 516. Coast Guard Migrant Interdictions by Nationality of Alien:2000 to 2005
[For the year ending September 30]
Year Total HaitiDominican
Republic China Cuba Mexico Ecuador Other
2000 . . . . . . . . 4,210 1,113 499 261 1,000 49 1,244 442001 . . . . . . . . 3,948 1,391 659 53 777 17 1,020 312002 . . . . . . . . 4,104 1,486 177 80 666 32 1,608 552003 . . . . . . . . 6,068 2,013 1,748 15 1,555 − 703 342004 . . . . . . . . 10,899 3,229 5,014 68 1,225 86 1,189 882005 . . . . . . . . 9,455 1,850 3,612 32 2,712 55 1,149 45
− Represents zero.Source: U.S. Department of Homeland Security, United States Coast Guard, ‘‘Fact File, Migrants Statistics, Statistics.’’
<http://www.uscg.mil/hq/g-cp/comrel/factfile/index.htm> (accessed 22 March 2006).
National Security and Veterans Affairs 339
U.S. Census Bureau, Statistical Abstract of the United States: 2007

Table 517. Customs and Border Protection (CBP)—Processed and ClearedPassengers, Planes, Vehicles, and Containers: 2000 to 2005
[In thousands (80,519.3 represents 80,519,300). For year ending September 30]
Characteristic 2000 2001 2002 2003 2004 2005
AirPassenger . . . . . . . . . . . . . . . . 80,519.3 79,675.8 71,607.9 72,959.3 80,866.4 86,123.4Commercial plane 1 . . . . . . . . . . 829.3 839.2 768.9 789.8 823.8 866.3Private plane . . . . . . . . . . . . . . . 145.6 125.7 729.2 132.1 140.0 135.4
LandPassenger 2, 3 . . . . . . . . . . . . . . 397,312.2 381,477.3 333,651.7 329,998.2 326,692.7 317,765.2Auto 2 . . . . . . . . . . . . . . . . . . . 127,094.7 129,603.2 118,306.8 120,376.5 121,418.9 121,654.0Rail containers. . . . . . . . . . . . . . 2,156.5 2,257.1 2,430.1 2,471.9 2,587.6 2,655.4Truck containers 4 . . . . . . . . . . . 10,396.6 11,001.5 11,129.4 11,163.1 11,252.2 11,308.5
SeaPassenger 5 . . . . . . . . . . . . . . . 10,990.1 11,290.9 12,224.4 15,127.5 22,234.2 26,228.2Vessel 6 . . . . . . . . . . . . . . . . . . 211.2 215.4 211.6 203.6 142.2 113.2Vessel containers 7. . . . . . . . . . . 5,813.2 5,944.0 7,247.6 9,092.3 9,796.3 11,340.8
1 A commercial aircraft is any aircraft transporting passengers and/or cargo for some payment or other consideration, includingmoney or services rendered. 2 See Table 1251 for more details. 3 Includes pedestrians. 4 Trucks-containers—number oftrucks entering the U.S. 5 Does not include passengers on ferries. 6 Number of vessels. Includes every description of watercraft or other contrivance used or capable of being used as a means of transportation on water; does not include aircraft.7 Number of vessel containers.
Source: U.S. Department of Homeland Security, Customs and Border Protection, About CBP, Statistics and Accomplishments,National Workload Statistics, 2000−2005. See also <http://www.cbp.gov/xp/cgov/toolbox/about/accomplish/> (Data as of 25 May2006).
Table 518. Deportable Aliens Located by Border Patrol Sector: 2000 to 2004[As of the end of September. Excludes Immigration and Customs Enforcement (ICE) Investigations’ data. Data for this tablecomes from the Performance Analysis System (PAS). This system aggregated data updated once a month by DHS offices]
Border Patrol Sector 2000 2001 2002 2003 2004
Total . . . . . . . . . . . . . . . . . 1,676,438 1,266,214 955,310 931,557 1,160,395
All southwest sectors . . . . . . . . 1,643,679 1,235,718 929,809 905,065 1,139,282San Diego, CA . . . . . . . . . . . . 151,681 110,075 100,681 111,515 138,608El Centro, CA. . . . . . . . . . . . . 238,126 172,852 108,273 92,099 74,467Yuma, AZ . . . . . . . . . . . . . . . 108,747 78,385 42,654 56,638 98,060Tucson, AZ . . . . . . . . . . . . . . 616,346 449,675 333,648 347,263 491,771El Paso, TX . . . . . . . . . . . . . . 115,696 112,857 94,154 88,816 104,399Marfa, TX . . . . . . . . . . . . . . . 13,689 12,087 11,392 10,319 10,530Del Rio, TX . . . . . . . . . . . . . . 157,178 104,875 66,985 50,145 53,794Laredo, TX . . . . . . . . . . . . . . 108,973 87,068 82,095 70,521 74,706McAllen, TX . . . . . . . . . . . . . . 133,243 107,844 89,927 77,749 92,947
All other sectors. . . . . . . . . . . . 32,759 30,496 25,501 26,492 21,113Blaine, WA . . . . . . . . . . . . . . 2,581 2,089 1,732 1,380 1,354Buffalo, NY . . . . . . . . . . . . . . 1,570 1,434 1,102 564 671Detroit, MI . . . . . . . . . . . . . . . 2,057 2,106 1,511 2,345 1,912Grand Forks, ND . . . . . . . . . . 562 921 1,369 1,223 1,225Havre, MT . . . . . . . . . . . . . . . 1,568 1,305 1,463 1,406 986Houlton, ME. . . . . . . . . . . . . . 489 685 432 292 263Livermore, CA 1 . . . . . . . . . . . 6,205 5,211 4,371 3,565 1,850Miami, FL . . . . . . . . . . . . . . . 6,237 5,962 5,143 5,931 4,602New Orleans, LA . . . . . . . . . . 6,478 5,033 4,665 5,151 2,889Ramey, PR . . . . . . . . . . . . . . 1,731 1,952 835 1,688 1,813Spokane, WA . . . . . . . . . . . . . 1,324 1,335 1,142 992 847Swanton, VT . . . . . . . . . . . . . 1,957 2,463 1,736 1,955 2,701
1 Livermore sector closed July 30, 2004.
Source: U.S. Department of Homeland Security, Office of Immigration Statistics, Yearbook of Immigration Statistics, 2004. Seealso <http://uscis.gov/graphics/shared/aboutus/statistics/ybpage.htm>. (accessed 8 May 2006).
Table 519. Border Patrol Enforcement Activities: 2000 to 2004[See headnote Table 518]
Activities 2000 2001 2002 2003 2004
Persons processed by the Border Patrol 1. . . . . . . 1,689,195 1,277,577 967,044 946,684 1,179,296Deportable aliens located by the Border Patrol . . . 1,676,438 1,266,214 955,310 931,557 1,160,395
Mexican aliens . . . . . . . . . . . . . . . . . . . . . . . . . 1,636,883 1,224,046 917,994 882,012 1,085,006Working in agriculture . . . . . . . . . . . . . . . . . . . . 1,330 1,248 1,821 1,908 1,647Working in trades, crafts, industry, and service . . . 2,167 2,678 2,897 3,856 3,634Seeking employment . . . . . . . . . . . . . . . . . . . . 1,525,422 1,107,550 822,161 810,671 997,986
Canadian aliens . . . . . . . . . . . . . . . . . . . . . . . . 2,211 2,539 1,836 1,611 1,497All others . . . . . . . . . . . . . . . . . . . . . . . . . . . . . 37,344 39,629 35,480 47,934 73,892
Smugglers of aliens located . . . . . . . . . . . . . . . . . . 14,406 8,720 8,701 11,128 16,074Aliens located who were smuggledinto the United States . . . . . . . . . . . . . . . . . . . . . 236,782 112,927 68,192 110,575 193,122
Seizures (conveyances) . . . . . . . . . . . . . . . . . . . . . 17,269 5,892 7,250 9,355 18,024Value of seizures (mil. dol.) . . . . . . . . . . . . . . . . . 1,945 1,581 1,564 1,680 1,696
Narcotics . . . . . . . . . . . . . . . . . . . . . . . . . . . . . 1,848 1,519 1,499 1,608 1,620Other . . . . . . . . . . . . . . . . . . . . . . . . . . . . . . . 97 62 65 72 75
1 Includes deportable aliens located and nondeportable (e.g., U.S. citizens).
Source: U.S. Department of Homeland Security, Office of Immigration Statistics, Yearbook of Immigration Statistics, 2004. Seealso <http://uscis.gov/graphics/shared/aboutus/statistics/ybpage.htm>. (accessed 8 May 2006).
340 National Security and Veterans Affairs
U.S. Census Bureau, Statistical Abstract of the United States: 2007

Table 520. Immigration and Customs Enforcement (ICE) InvestigationsActivities: 2004
[Data refer to criminal cases only; administrative cases are not included due to changes in reporting. Data in this table are not com-parable with data reported in this table for previous years]
Activities Casesinitiated
Casesclosed
Crimi-nal
arrests
Crimi-nal
indict-ments
Crimi-nal
con-victions
Num-bersei-
zures
Dollarvalue
seizures
Total, all immigration-related categories . . . . . . . . . . 58,727 46,656 9,455 5,363 4,007 1,782 10,105,566Human trafficking investigations 1. . . . . . . . . . . . . . . . . . 3,017 2,860 250 89 70 102 312,259Criminal alien investigations 2 . . . . . . . . . . . . . . . . . . . . 10,908 6,262 4,851 2,902 2,308 188 2,277,995Employers of unauthorized alien investigations 3 . . . . . . . . 3,258 3,064 159 66 46 54 486,313Identity and benefit fraud (IBF) investigations 4 . . . . . . . . . 5,351 3,872 1,310 709 533 660 1,497,285Alien smuggling organizations investigations 5 . . . . . . . . . 3,984 3,141 1,121 689 408 498 4,123,440Alien smuggling individuals/groups investigations 5 . . . . . . 3,958 3,281 1,295 759 491 234 1,053,737Alien absconder investigations. . . . . . . . . . . . . . . . . . . . 2,911 2,866 19 (D) (D) (D) 103Compliance enforcement investigations . . . . . . . . . . . . . . 9,622 6,458 40 (D) (D) (D) −Alien Present Without Authorization (PWA) (EWI) statusviolation investigations 6 . . . . . . . . . . . . . . . . . . . . . . . 3,521 3,332 260 93 102 11 139,154
Non-Identification and Authentication (I&A) Act relatedactivities requiring investigation . . . . . . . . . . . . . . . . . . 2,811 2,809 (NA) (NA) (NA) (NA) (NA)
Alien investigative support functions—limited inquiryinvestigations . . . . . . . . . . . . . . . . . . . . . . . . . . . . . . 2,835 2,815 10 4 3 (D) −
Alien asset forfeiture investigations. . . . . . . . . . . . . . . . . 2,840 2,826 10 9 8 6 98,200Joint Terrorism Task Force (JTTF) 7 . . . . . . . . . . . . . . . . 3,711 3,070 130 40 36 25 117,079
− Represents zero. NA Not available. D Figure withheld to avoid disclosure pertaining to a specific organization orindividual. 1 Human trafficking cases include investigations into alleged violations of severe forms of human trafficking which isdefined by the Trafficking Victims Protection Act of 2000. 2 Criminal alien cases include large-scale organizations engaged inongoing criminal activity and individual aliens convicted of crimes such as terrorism or drug trafficking. 3 Employer investigationstarget employers of unauthorized aliens and include criminal investigations, administrative investigations, auxiliary investigations,ICE Headquarters Investigation Project, and Department of Labor ESA-91. Starting in FY 2003, also includes statistics pertainingto Work Site Enforcement National Interest Investigations. 4 Fraud investigations seek to penetrate fraud schemes of all sizesand degrees of complexity which are used to violate immigration and related laws or to shield the true status of illegal aliens in orderto obtain entitlement benefits. The fraud schemes may be related to marriage fraud, immigration benefit fraud, employer sanctionsdocument fraud, other document fraud, and entitlement fraud. 5 Smuggling cases involve those which target persons or entitieswho bring, transport, harbor or smuggle illegal aliens into or within the United States. 6 Includes Entry Without Inspection (EWI),such as stowaways, or landed crewmen who were ordered detained on board, and status violators. 7 FBI Joint Terrorism TaskForces (JTTF) include ICE Special Agents who perform counter-terrorism investigations and provide actionable proactivecounter-terrorism lead information, in efforts to prevent and disrupt alien terrorist cells domestically and abroad.
Source: U.S. Department of Homeland Security, Office of Immigration Statistics, 2004 Yearbook of Immigration Statistics. Seealso <http://uscis.gov/graphics/shared/statistics/yearbook/index.htm> (accessed 8 May 2005).
Table 521. Aliens Expelled and Aliens Removed by Administrative Reason forRemoval: 2000 to 2004
[As of the end of September. The administrative reason for formal removal is the legal basis for removal. Some aliens who arecriminals may be removed under a different administrative reason (or charge) for the convenience of the government]
Violations 2000 2001 2002 2003 2004
Total Aliens Expelled: . . . . . . . . . . . . . . . . . . . . 1,861,933 1,432,061 1,084,661 1,076,483 1,238,319
Voluntary departures 1 . . . . . . . . . . . . . . . . . . . . 1,675,711 1,254,035 934,119 887,115 1,035,477Formal removals 2 . . . . . . . . . . . . . . . . . . . . . . 186,222 178,026 150,542 189,368 202,842Administrative reason for forced removal:
Attempted entry without proper documentsor through fraud or misrepresentation . . . . . . 89,912 76,254 41,347 52,670 50,420
Criminal . . . . . . . . . . . . . . . . . . . . . . . . . . . 41,127 40,170 37,785 40,266 42,510Failed to maintain status . . . . . . . . . . . . . . . . 740 720 1,248 1,309 1,104Previously removed, ineligible for reentry . . . . . 11,659 10,677 12,838 17,950 19,773Present without authorization . . . . . . . . . . . . . 40,396 48,053 55,603 75,052 85,659Security . . . . . . . . . . . . . . . . . . . . . . . . . . . 13 12 11 14 11Smuggling or aiding illegal entry . . . . . . . . . . . 492 509 579 619 722Other . . . . . . . . . . . . . . . . . . . . . . . . . . . . 1,877 1,625 1,106 1,482 2,636Unknown . . . . . . . . . . . . . . . . . . . . . . . . . . 6 6 25 6 7
1 Voluntary departures verified includes aliens under docket control required to depart and voluntary departures not underdocket control; first recorded in 1927. Beginning FY 2004, voluntary departures verified include both Deportable Alien ControlSystem (DACS) cases under docket control and Performance Analysis System (PAS) Border Patrol voluntary departuresverified-cases not under docket or aliens processed for removal under safeguard. The latter is used as a measure of border patrolvoluntary departures verified-cases not under docket. In FY 2004, complete Detention and Removal Office district level figures forvoluntary departures-cases not under docket are unavailable in PAS and as a result are excluded for that year. Prior to FY 2004,the reporting of voluntary departures verified included all locations, Border Patrol Sectors and districts. 2 Formal removals includedeportations, exclusions, and removals. 3 Includes those aliens charged under the statutes previous to April 1, 1997, as ‘‘enteredwithout inspection’’ (EWI).
Source: U.S. Department of Homeland Security, Office of Immigration Statistics, 2004 Yearbook of Immigration Statistics. Seealso <http://uscis.gov/graphics/shared/statistics/yearbook/index.htm>. (accessed 8 May 2005).
National Security and Veterans Affairs 341
U.S. Census Bureau, Statistical Abstract of the United States: 2007

Table 522. Department Participation in the Control of Marijuana, Narcotics, andDangerous Drug Traffic: 2000 to 2004
[As of the end of September. Department participation includes Border Patrol, Inspections and Investigations through 2003. Forfiscal year 2004, includes narcotic seizure data reported by Customs and Border Protection inspectors and Border Patrol only. ExcludesImmigration and Customs Enforcement (ICE) investigations data]
Year and seizure
Total
Type of contraband
Marijuana(lbs.)
Heroin(ozs.)
Cocaine(ozs.)
Dangerousdrug pills
(units) Other
2000Number of seizures. . . . . . . . . . . . . . . . 12,143 9,914 225 1,020 470 514Amount seized. . . . . . . . . . . . . . . . . . . . (X) 1,597,395 5,487 567,341 1,426,547 (X)Estimated value of seizures (mil. dol.) . . . . 2,314 1,289 32 946 5 41
2002Number of seizures. . . . . . . . . . . . . . . . 10,231 8,289 160 991 250 541Amount seized. . . . . . . . . . . . . . . . . . . . (X) 1,440,488 6,887 489,491 619,004 (X)Estimated value of seizures (mil. dol.) . . . . 1,980 1,177 32 736 2 32
2003Number of seizures. . . . . . . . . . . . . . . . 10,284 8,528 119 742 362 533Amount seized. . . . . . . . . . . . . . . . . . . . (X) 1,562,368 6,624 336,493 395,714 (X)Estimated value of seizures (mil. dol.) . . . . 2,107 1,434 42 598 9 24
2004Number of seizures. . . . . . . . . . . . . . . . 10,897 9,289 71 727 331 479Amount seized. . . . . . . . . . . . . . . . . . . . (X) 1,552,906 3,069 350,584 345,776 (X)Estimated value of seizures (mil. dol.) . . . . 2,008 1,278 14 670 3 42
X Not applicable.
Source: U.S. Department of Homeland Security, Office of Immigration Statistics, 2004 Yearbook of Immigration Statistics. Dataas of 3 May 2006. See also <http://uscis.gov/graphics/shared/aboutus/statistics/ybpage.htm>.
Table 523. Prohibited Items Intercepted at U.S. Airport Screening Checkpoints:2002 to 2005
[Passengers boarding aircraft in thousands (612,876 represents 612,876,000). For the calendar year. TransportationSecurity Administration (TSA) assumed responsibility for airport security on February 17, 2002, and by November 19, 2002, TSAassumed control over all passenger screenings from private contractors. TSA data are incomplete for 2002]
Year 2002 2003 2004 2005
Passengers boarding aircraft total (1,000) 1. . . . . 612,876 646,275 702,921 738,568Domestic . . . . . . . . . . . . . . . . . . . . . . . . . . . . 560,107 592,412 640,698 670,360International . . . . . . . . . . . . . . . . . . . . . . . . . . 52,769 53,863 62,222 68,208
Total prohibited items . . . . . . . . . . . . . . . . . . . . 4,185,916 6,167,497 7,103,560 15,886,014Knife 2 . . . . . . . . . . . . . . . . . . . . . . . . . . . . . 1,147,843 1,969,003 2,055,306 1,822,846Other cutting items 3 . . . . . . . . . . . . . . . . . . . . 2,063,729 3,029,318 3,409,724 3,276,936Club 4 . . . . . . . . . . . . . . . . . . . . . . . . . . . . . . 13,134 25,578 28,998 20,531Box cutter 5 . . . . . . . . . . . . . . . . . . . . . . . . . . 37,504 21,396 22,428 21,319Firearm 6. . . . . . . . . . . . . . . . . . . . . . . . . . . . 983 638 254 (NA)Incendiary 7 . . . . . . . . . . . . . . . . . . . . . . . . . . 83,086 485,792 697,242 371,711Lighters 8 . . . . . . . . . . . . . . . . . . . . . . . . . . . (X) (X) (X) 9,420,653Other 9 . . . . . . . . . . . . . . . . . . . . . . . . . . . . . 839,637 635,772 889,608 952,018
NA Not Available. X Not applicable. 1 Data comes from the Air Transport Association. Data are for U.S. passenger andcargo airlines only. 2 Knife includes any length and type except round-bladed, butter, and plastic cutlery. 3 Other cuttinginstruments refers to, e.g., scissors, screwdrivers, swords, sabers, and ice picks. 4 Club refers to baseball bats, night sticks, billyclubs, bludgeons; etc. 5 Box cutter. 6 Firearm refers to items like pistols, revolvers, rifles, automatic weapons, shotguns, partsof guns and firearms. 7 Incendiaries refer to categories of ammunition and gunpowder, flammables/irritants, and explosives. 8
As of April 14, 2005, passengers are prohibited from carrying all lighters on their person or in carry-on luggage or onboard anairplane. 9 Other refers to tools, self-defense items, and sporting goods (excluding baseball bats).
Source: U.S. Department of Homeland Security, Transportation Security Administration, unpublished data; 13 April 2006<http://www.tsa.gov>. Air Transport Association of America, Washington, DC. annual operations, traffic, and capacity. See also<http://www.airlines.org/home/default.aspx>.
Table 524. Seizure Statistics for Intellectual Property Rights (IPR):2000 to 2005
[Customs and Border Protection (CBP) is dedicated to protecting against the importation of goods which infringe/violate IntellectualProperty Rights (IPR) by devoting substantial resources toward identifying and seizing shipments of infringing articles]
Item 2000 2001 2002 2003 2004 2005
Number of IPR Seizures . . . . . . . . . . . . . . . . . . . . . . . 3,244 3,586 5,793 6,500 7,255 8,022Total domestic value in U.S. dollars of IPR seizures(1,000)1. . . . . . . . . . . . . . . . . . . . . . . . . . . . . . . . . . 45,328 57,439 98,990 94,019 138,768 93,235
Selected IPR commodities seized by value (1,000): . . .Wearing apparel . . . . . . . . . . . . . . . . . . . . . . . . . . . 4,329 7,833 9,295 13,889 51,737 16,100Handbags/wallets/backpacks . . . . . . . . . . . . . . . . . . . 1,729 3,164 2,927 11,458 23,190 14,955Cigarettes . . . . . . . . . . . . . . . . . . . . . . . . . . . . . . . 4,223 4,550 37,580 41,720 24,161 9,649Consumer electronics 2 . . . . . . . . . . . . . . . . . . . . . . 1,463 (NA) 5,307 3,780 8,880 8,794Toys/electronic games . . . . . . . . . . . . . . . . . . . . . . . 5,996 4,355 2,151 1,511 3,971 8,569Watches/parts. . . . . . . . . . . . . . . . . . . . . . . . . . . . . 3,993 5,632 3,919 3,384 2,543 3,071Media 3 . . . . . . . . . . . . . . . . . . . . . . . . . . . . . . . . . 7,851 7,324 28,396 7,358 5,050 (NA)All others . . . . . . . . . . . . . . . . . . . . . . . . . . . . . . . . 8,801 8,623 6,154 5,697 13,184 13,550
1 Domestic value is the cost of the seized goods, plus the costs of shipping and importing the goods into the U.S. and anamount for profit. 2 Consumer electronics includes cell phones an accessories, radios, power strips, electrical tools andappliances. 3 Media includes motion pictures on tape, laser disc, and DVD; interactive and computer software on CD-ROM,CD-R, and floppy discs; and music on CD or tape.
U.S. Department of Homeland Security, Customs and Border Protection, Import, Commercial Enforcement, IntellectualProperty Rights, Seizure Statistics for Intellectual Property Rights; <www.cbp.gov/xp/cgov/import/commercial_enforcement/ipr/seizure/>.
342 National Security and Veterans Affairs
U.S. Census Bureau, Statistical Abstract of the United States: 2007