section 10.1a comparing two proportions€¦ · · 2018-03-1512 2 v ppˆˆ first then ... section...
TRANSCRIPT

Section 10.1a Comparing Two Proportions
Page 1 of 20
Often in statistics we want to compare parameters from two different populations. For example we might want
to compare the opinions of men and women on abortion and know if the difference is significant. Comparing
parameters from two or more populations is an important topic in statistics and in this investigation we will look
at comparing the difference between two proportions from two different populations. As you might have
guessed we will need to investigate the sampling distribution for the difference between two proportions.
The sampling Distribution of a Difference between Two Proportions
To explore the sampling distribution of 1 2
ˆ ˆp p , let’s start with two populations having a known proportion of
successes. Suppose that there are two large high schools, each with over 2000 students, in a certain town.
1. At School 1, 70% of students did their homework last night. Only
50% of the students at School 2 did their homework last night. The
counselor at School 1 takes a SRS of 100 students and records the
sample proportion 1p̂ that did the homework. School 2’s counselor
takes a SRS of 200 students and records the sample proportion 2p̂ that
did the homework.
We want to look at the sampling distribution for the difference 1 2ˆ ˆp p
in the sample proportions.
Notice that we can consider 1p̂ and 2p̂ as random variables since the values will vary from random sample to
random sample.
a. What is the mean of the sampling distribution for 1 2ˆ ˆp p ? How do we know?
1 2ˆ ˆp p
b. What is the standard deviation of the sampling distribution for 1 2ˆ ˆp p ? Recall that variances for
independent random variables add, but standard deviations do not. So find the variance 1 2
2
ˆ ˆp p first then
determine the standard deviation.
1 2
2
ˆ ˆp p
1 2ˆ ˆp p
What must be true about the random variables in order to be able to add their variances?

Section 10.1a Comparing Two Proportions
Page 2 of 20
c. We now have the mean and the standard deviation for the sampling distribution of 1 2
ˆ ˆp p . What about the
shape of the distribution?
The Fathom file sampdifferenceofprop shown below shows a partial sampling distribution (500 sample p̂ s
from samples of size n) for two different p̂ values from two different populations. The graph at the upper left is
a portion of the sampling distribution for 1p̂ and the graph at the upper right is a portion of the sampling
distribution for 2p̂ . The graph below these two graphs is a portion of the sampling distribution of the difference
1 2ˆ ˆp p .
The slider bars allow you to change the sample sizes n and the population proportion p for each sampling
distribution. Change the values of the proportions and the sample sizes to the values given in our school
problem for School 1 and School 2 and notice the shapes of the distributions. In particular what do you think
you can conclude about the shape of the distribution for the difference in the sample proportions?
Experiment with other values and observe the shape of the sampling distribution for the difference of these
proportions. What can you conclude?
What is the test to determine if the distribution for a sample proportions is normal?

Section 10.1a Comparing Two Proportions
Page 3 of 20
If two random variables are approximately normally distributed, is the difference between them also normally
distributed?
Considering the two statements above, determine criteria for determining if the sampling distribution of
1 2ˆ ˆp p is approximately normal.
d. Assuming the criteria in part c are satisfied, sketch a graph of the sampling distribution of 1 2ˆ ˆp p .

Section 10.1a Comparing Two Proportions
Page 4 of 20
Here is a summary of the facts for the sampling distribution of 1 2
ˆ ˆp p :
Choose an SRS of size n1 from Population 1 with proportion of successes p1 and an independent SRS of size n2
from Population 2 with proportion of successes p2.
Shape: When n1p1, n1(1 − p1), n2p2, and n2(1 − p2) are all at least 10, the sampling distribution of
1 2ˆ ˆp p is approximately Normal.
Center: The mean of the sampling distribution is p1 − p2. That is, the difference in sample proportions is
an unbiased estimator of the difference in population proportions.
Spread: The standard deviation of the sampling distribution 1 2
ˆ ˆp p is
1 1 2 2
1 2
1 1p p p p
n n
as long as each sample is no more than 10% of its population (the 10% condition) and we have independence of
the two samples.
The figure below displays the sampling distribution for 1 2ˆ ˆp p
Section 10.1a Comparing Two Proportions
Page 5 of 20
e. Suppose that the two counselors from School 1 and School 2 meet to compare the proportions of students
who did their homework last night and find that 1 2
ˆ ˆp p is 0.10. Find the probably of getting this difference or
less.
f. Does the probability in part e give you a reason to doubt the counselors’ reported difference of 0.20? Explain.
CHECK YOUR UNDERSTANDING
Your teacher brings two bags of colored goldfish crackers to class. She tells you that Bag 1 has 25% red
crackers and Bag 2 has 35% red crackers. Each bag contains more than 500 crackers. Using a paper cup, your
teacher takes an SRS of 50 crackers from Bag 1 and a separate SRS of 40 crackers from Bag 2. Let 1 2ˆ ˆp p be
the difference in the sample proportions of red crackers.
a. What is the shape of the sampling distribution of 1 2ˆ ˆp p ? Why?
b. Find the mean and standard deviation of the sampling distribution. Show your work.

Section 10.1a Comparing Two Proportions
Page 6 of 20
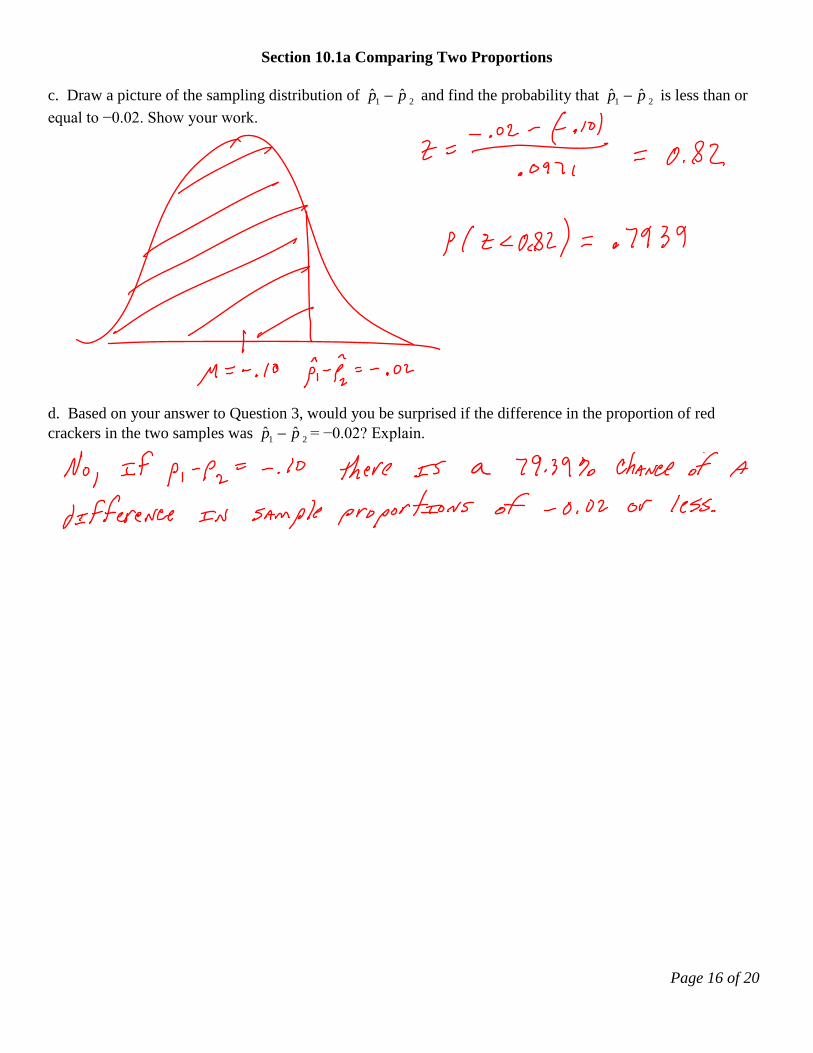
c. Draw a picture of the sampling distribution of 1 2
ˆ ˆp p and find the probability that 1 2
ˆ ˆp p is less than or
equal to −0.02. Show your work.
d. Based on your answer to Question 3, would you be surprised if the difference in the proportion of red
crackers in the two samples was 1 2ˆ ˆp p = −0.02? Explain.

Section 10.1a Comparing Two Proportions
Page 7 of 20
Confidence Intervals for 1 2p p
2. Who do you think are more intelligent, men or women? To find out what
people think, the Gallup Poll selected a random sample of 520 women and 506
men. The pollsters showed them a list of personal attributes and asked them to
indicate whether each attribute was “generally more true of men than women”.
When asked about intelligence, 28% of the men thought men were generally
more intelligent, but only 13% of the women agreed. Is there a gender gap in
opinions about which sex is smarter or is the difference simply due to chance?
And if there is a gap, then what would we estimate the true size of that gap to be?
Comparing parameters from two different populations, like the difference in the
opinions of men and women on gender intelligence is a fundamental idea in
statistics and in this chapter we will explore this important idea.
We know that the difference between the two proportions (men – women) from our samples is 15%, but what is
the true difference for all men and women? Let’s construct a 95% confidence interval for this difference.
Recall that the general recipe for a confidence interval is:
statistic (critical value) (standard deviation of statistic)
Before we construct the confidence interval we should verify that we meet the conditions.
a. Verify that we meet the Random condition.
b. Independence. For this check we need to verify that the two groups are independent and that the
individuals within the groups are independent. If you are sampling without replacement you also need to check
the 10% condition for both groups. Check this condition.
c. Normality. Since the population parameter is unknown and is not assumed (as in a hypothesis test) we need
to use the statistics from both of our samples to check this condition. Check that this condition is met.

Section 10.1a Comparing Two Proportions
Page 8 of 20
To construct the confidence interval we need the standard deviation
1 2
1 1 2 2
ˆ ˆ
1 2
1 1p p
p p p p
n n
. But
again since we do not know the population proportions 1p and 2p we will need to substitute the sample
proportions 1p̂ and 2p̂ to get what we call the standard error
1 1 2 2
1 2
ˆ ˆ ˆ ˆ1 1p p p pSE
n n
.
e. Based on what you now know, what is the formula for calculating a level C confidence interval for the
difference of two proportions?
g. Construct a 95% confidence interval for estimating the true difference in the proportions of men and women
with regard to their opinions on intelligence. Interpret your results in the context of the problem situation.

Section 10.1a Comparing Two Proportions
Page 9 of 20
The confidence interval you constructed in 2g is called a Two-Sample z Interval for a Difference of Two
Proportions. The summary is as follows:
When the Random, Normal, and Independent conditions are met, a level C confidence interval for 1 2
ˆ ˆp p is
1 1 2 2
1 2
1 2
ˆ ˆ ˆ ˆ1 1ˆ ˆ *
p p p pp p z
n n
where z* is the critical value for the standard Normal curve with area C between −z* and z*.
Random The data are produced by a random sample of size n1 from Population 1 and a random sample
of size n2 from Population 2 or by two groups of size n1 and n2 in a randomized experiment.
Normal 1 1p̂ n , 1 1ˆ1 p n , 2 2p̂ n , 2 2
ˆ1 p n are all at least 10.
Independent Both the samples or groups themselves and the individual observations in each sample or
group are independent. When sampling without replacement, check that the two populations are at least
10 times as large as the corresponding samples (the 10% condition).
TECHNOLOGY
Your calculator can do the calculations for you when performing inference on the difference of two proportions.
Select STAT then TESTS. For a confidence interval on the difference in proportions select option
B: 2-PropZInt… as shown in the screen below.
Verify your confidence interval from question 2g by entering the appropriate values in screen shown below and
having the calculator find the interval. Note that x1 and x2 must be whole numbers, so you may have to round
accordingly in some problems.

Section 10.1a Comparing Two Proportions
Page 10 of 20
CHECK YOUR UNDERSTANDING
As part of the Pew Internet and American Life Project, researchers
conducted two surveys in late 2009. The first survey asked a random
sample of 800 U.S. teens about their use of social media and the
Internet. A second survey posed similar questions to a random
sample of 2253 U.S. adults. In these two studies, 73% of teens and
47% of adults said that they use social-networking sites. Use these
results to construct and interpret a 95% confidence interval for the
difference between the proportion of all U.S. teens and adults who
use social-networking sites. Follow all the appropriate steps for
construction a confidence interval.

Section 10.1a Comparing Two Proportions
Page 11 of 20
Often in statistics we want to compare parameters from two different populations. For example we might want
to compare the opinions of men and women on abortion and know if the difference is significant. Comparing
parameters from two or more populations is an important topic in statistics and in this investigation we will look
at comparing the difference between two proportions from two different populations. As you might have
guessed we will need to investigate the sampling distribution for the difference between two proportions.
The sampling Distribution of a Difference between Two Proportions
To explore the sampling distribution of 1 2
ˆ ˆp p , let’s start with two populations having a known proportion of
successes. Suppose that there are two large high schools, each with over 2000 students, in a certain town.
1. At School 1, 70% of students did their homework last night. Only
50% of the students at School 2 did their homework last night. The
counselor at School 1 takes a SRS of 100 students and records the
sample proportion 1p̂ that did the homework. School 2’s counselor
takes a SRS of 200 students and records the sample proportion 2p̂ that
did the homework.
We want to look at the sampling distribution for the difference 1 2ˆ ˆp p
in the sample proportions.
Notice that we can consider 1p̂ and 2p̂ as random variables since the values will vary from random sample to
random sample.
a. What is the mean of the sampling distribution for 1 2ˆ ˆp p ? How do we know?
1 2ˆ ˆp p
b. What is the standard deviation of the sampling distribution for 1 2ˆ ˆp p ? Recall that variances for
independent random variables add, but standard deviations do not. So find the variance 1 2
2
ˆ ˆp p first then
determine the standard deviation.
1 2
2
ˆ ˆp p
1 2ˆ ˆp p
What must be true about the random variables in order to be able to add their variances?

Section 10.1a Comparing Two Proportions
Page 12 of 20
c. We now have the mean and the standard deviation for the sampling distribution of 1 2
ˆ ˆp p . What about the
shape of the distribution?
The Fathom file sampdifferenceofprop shown below shows a partial sampling distribution (500 sample p̂ s
from samples of size n) for two different p̂ values from two different populations. The graph at the upper left is
a portion of the sampling distribution for 1p̂ and the graph at the upper right is a portion of the sampling
distribution for 2p̂ . The graph below these two graphs is a portion of the sampling distribution of the difference
1 2ˆ ˆp p .
The slider bars allow you to change the sample sizes n and the population proportion p for each sampling
distribution. Change the values of the proportions and the sample sizes to the values given in our school
problem for School 1 and School 2 and notice the shapes of the distributions. In particular what do you think
you can conclude about the shape of the distribution for the difference in the sample proportions?
Experiment with other values and observe the shape of the sampling distribution for the difference of these
proportions. What can you conclude?
What is the test to determine if the distribution for a sample proportions is normal?

Section 10.1a Comparing Two Proportions
Page 13 of 20
If two random variables are approximately normally distributed, is the difference between them also normally
distributed?
Considering the two statements above, determine criteria for determining if the sampling distribution of
1 2ˆ ˆp p is approximately normal.
d. Assuming the criteria in part c are satisfied, sketch a graph of the sampling distribution of 1 2ˆ ˆp p .

Section 10.1a Comparing Two Proportions
Page 14 of 20
Here is a summary of the facts for the sampling distribution of 1 2
ˆ ˆp p :
Choose an SRS of size n1 from Population 1 with proportion of successes p1 and an independent SRS of size n2
from Population 2 with proportion of successes p2.
Shape: When n1p1, n1(1 − p1), n2p2, and n2(1 − p2) are all at least 10, the sampling distribution of
1 2ˆ ˆp p is approximately Normal.
Center: The mean of the sampling distribution is p1 − p2. That is, the difference in sample proportions is
an unbiased estimator of the difference in population proportions.
Spread: The standard deviation of the sampling distribution 1 2
ˆ ˆp p is
1 1 2 2
1 2
1 1p p p p
n n
as long as each sample is no more than 10% of its population (the 10% condition) and we have independence of
the two samples.
The figure below displays the sampling distribution for 1 2ˆ ˆp p

Section 10.1a Comparing Two Proportions
Page 15 of 20
e. Suppose that the two counselors from School 1 and School 2 meet to compare the proportions of students
who did their homework last night and find that 1 2
ˆ ˆp p is 0.10. Find the probably of getting this difference or
less.
f. Does the probability in part e give you a reason to doubt the counselors’ reported difference of 0.20? Explain.
CHECK YOUR UNDERSTANDING
Your teacher brings two bags of colored goldfish crackers to class. She tells you that Bag 1 has 25% red
crackers and Bag 2 has 35% red crackers. Each bag contains more than 500 crackers. Using a paper cup, your
teacher takes an SRS of 50 crackers from Bag 1 and a separate SRS of 40 crackers from Bag 2. Let 1 2ˆ ˆp p be
the difference in the sample proportions of red crackers.
a. What is the shape of the sampling distribution of 1 2ˆ ˆp p ? Why?
b. Find the mean and standard deviation of the sampling distribution. Show your work.
Section 10.1a Comparing Two Proportions
Page 16 of 20
c. Draw a picture of the sampling distribution of 1 2
ˆ ˆp p and find the probability that 1 2
ˆ ˆp p is less than or
equal to −0.02. Show your work.
d. Based on your answer to Question 3, would you be surprised if the difference in the proportion of red
crackers in the two samples was 1 2ˆ ˆp p = −0.02? Explain.

Section 10.1a Comparing Two Proportions
Page 17 of 20
Confidence Intervals for 1 2p p
2. Who do you think are more intelligent, men or women? To find out what
people think, the Gallup Poll selected a random sample of 520 women and 506
men. The pollsters showed them a list of personal attributes and asked them to
indicate whether each attribute was “generally more true of men than women”.
When asked about intelligence, 28% of the men thought men were generally
more intelligent, but only 13% of the women agreed. Is there a gender gap in
opinions about which sex is smarter or is the difference simply due to chance?
And if there is a gap, then what would we estimate the true size of that gap to be?
Comparing parameters from two different populations, like the difference in the
opinions of men and women on gender intelligence is a fundamental idea in
statistics and in this chapter we will explore this important idea.
We know that the difference between the two proportions (men – women) from our samples is 15%, but what is
the true difference for all men and women? Let’s construct a 95% confidence interval for this difference.
Recall that the general recipe for a confidence interval is:
statistic (critical value) (standard deviation of statistic)
Before we construct the confidence interval we should verify that we meet the conditions.
a. Verify that we meet the Random condition.
b. Independence. For this check we need to verify that the two groups are independent and that the
individuals within the groups are independent. If you are sampling without replacement you also need to check
the 10% condition for both groups. Check this condition.
c. Normality. Since the population parameter is unknown and is not assumed (as in a hypothesis test) we need
to use the statistics from both of our samples to check this condition. Check that this condition is met.

Section 10.1a Comparing Two Proportions
Page 18 of 20
To construct the confidence interval we need the standard deviation
1 2
1 1 2 2
ˆ ˆ
1 2
1 1p p
p p p p
n n
. But
again since we do not know the population proportions 1p and 2p we will need to substitute the sample
proportions 1p̂ and 2p̂ to get what we call the standard error
1 1 2 2
1 2
ˆ ˆ ˆ ˆ1 1p p p pSE
n n
.
e. Based on what you now know, what is the formula for calculating a level C confidence interval for the
difference of two proportions?
g. Construct a 95% confidence interval for estimating the true difference in the proportions of men and women
with regard to their opinions on intelligence. Interpret your results in the context of the problem situation.
Section 10.1a Comparing Two Proportions
Page 19 of 20
The confidence interval you constructed in 2g is called a Two-Sample z Interval for a Difference of Two
Proportions. The summary is as follows:
When the Random, Normal, and Independent conditions are met, a level C confidence interval for 1 2
ˆ ˆp p is
1 1 2 2
1 2
1 2
ˆ ˆ ˆ ˆ1 1ˆ ˆ *
p p p pp p z
n n
where z* is the critical value for the standard Normal curve with area C between −z* and z*.
Random The data are produced by a random sample of size n1 from Population 1 and a random sample
of size n2 from Population 2 or by two groups of size n1 and n2 in a randomized experiment.
Normal 1 1p̂ n , 1 1ˆ1 p n , 2 2p̂ n , 2 2
ˆ1 p n are all at least 10.
Independent Both the samples or groups themselves and the individual observations in each sample or
group are independent. When sampling without replacement, check that the two populations are at least
10 times as large as the corresponding samples (the 10% condition).
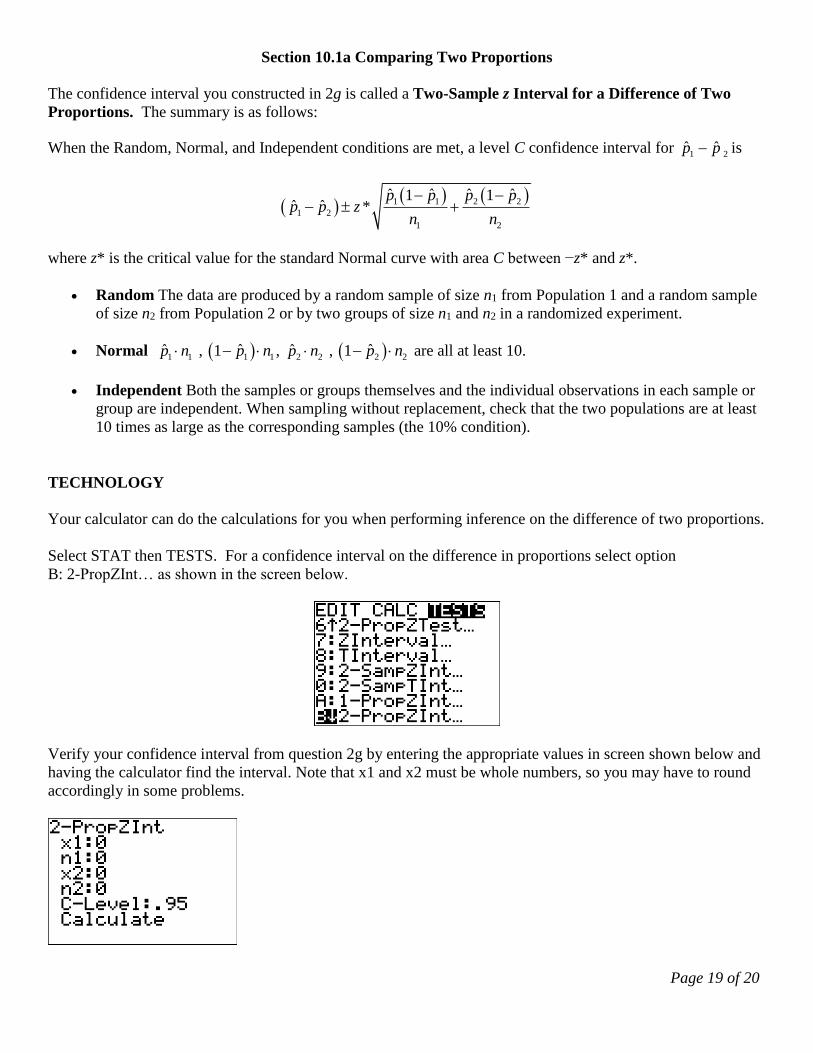
TECHNOLOGY
Your calculator can do the calculations for you when performing inference on the difference of two proportions.
Select STAT then TESTS. For a confidence interval on the difference in proportions select option
B: 2-PropZInt… as shown in the screen below.
Verify your confidence interval from question 2g by entering the appropriate values in screen shown below and
having the calculator find the interval. Note that x1 and x2 must be whole numbers, so you may have to round
accordingly in some problems.

Section 10.1a Comparing Two Proportions
Page 20 of 20
CHECK YOUR UNDERSTANDING
As part of the Pew Internet and American Life Project, researchers
conducted two surveys in late 2009. The first survey asked a random
sample of 800 U.S. teens about their use of social media and the
Internet. A second survey posed similar questions to a random
sample of 2253 U.S. adults. In these two studies, 73% of teens and
47% of adults said that they use social-networking sites. Use these
results to construct and interpret a 95% confidence interval for the
difference between the proportion of all U.S. teens and adults who
use social-networking sites. Follow all the appropriate steps for
construction a confidence interval.