section 13 assessment of bering sea/aleutian islands atka mackerel
TRANSCRIPT

1
Section 13
ASSESSMENT OF BERING SEA/ALEUTIAN ISLANDS ATKA MACKEREL
bySandra A. Lowe, Rebecca F. Reuter, and Harold Zenger
EXECUTIVE SUMMARY
Summary of Major Changes
Relative to the November 2000 SAFE report, the following substantive changes have been made in theassessment of Atka mackerel.
Changes in the Input Data1) Catch data were updated.2) The 2000 fishery age composition data were included.
Changes in the Assessment Methodology1) No substantive changes were made in the assessment model.
Changes in Assessment Results1) The mean recruitment from the stochastic projections is 502 million recruits, which gives an
estimated B40% level of 124,500 mt.2) The projected female spawning biomass for 2002 is estimated at 118,000 mt.3) BSAI Atka mackerel are in Tier 3b for the first time; the 2002 estimated female spawning biomass
is below B40% .4) The projected age 3+ biomass at the beginning of 2002 is estimated at 439,700 mt.5) The addition of the 2000 fishery age composition resulted in downward revised estimates of
recruitment starting in about 1990, which translated to lower estimates of biomass. Last year’sassessment projected the 2001 age 3+ biomass to be 553,000 mt which compares to the estimated2001 age 3+ biomass of 426,000 mt in the current assessment.
6) The projected 2002 yields at F40% adj and FABC are 71,300 and 49,000 mt, respectively.7) The 2002 recommended ABC is 49,000 mt corresponding to F = 0.21.8) The projected 2002 overfishing level at F35% adj (F = 0.37) is 82,300 mt.
Response to comments by the Scientific and Statistical Committee (SSC)
1) “While the SSC recognizes the F40% value to be clearly too high”, they did not accept the procedureused to provide a lower FABC in last year’s assessment. The SSC recommended the F52% rate that hadbeen adopted for the 1999 and 2000 Atka mackerel ABCs.
The current assessment recommends the F52% rate be used to calculate the 2002 ABC.

2
2) A new TAC apportionment scheme was suggested in last year’s assessment. The SSC believed thenew time weighting scheme properly accounted for measurement error and recommended using thisscheme.
The current assessment has adopted this approach to suggest TAC apportionment for 2002.

3
13.1 INTRODUCTION
Atka mackerel (Pleurogrammus monopterygius) are distributed from the east coast of the Kamchatkapeninsula, throughout the Komandorskiye and Aleutian Islands, north to the Pribilof Islands in the easternBering Sea, and eastward through the Gulf of Alaska to southeast Alaska. Their center of abundanceaccording to past surveys has been in the Aleutian Islands, particularly from Buldir Island to Seguam Pass.
Atka mackerel are pelagic during much of the year, but migrate annually from the lower edge of the shelfto the shallow coastal waters where they become demersal during spawning (Morris et al. 1983). Whilespawning, they are distributed in dense aggregations near the bottom. Spawning is reported to peak fromJune through September in eastern Kamchatkan waters (Musienko 1970; Morris 1981), and from July toOctober in Alaskan waters (McDermott and Lowe 1997). Atka mackerel are reported to deposit their eggsin rock crevices or among stones, guarded by brightly colored males until hatching (Gorbunova 1962;Zolotov 1993). The adhesive eggs hatch in 40-45 days (Musienko 1970), releasing planktonic larvae whichhave been found up to 800 km from shore. The first in situ observations of spawning habitat in Seguam Passwere recently (August, 1999 and 2000) documented (pers. comm. Harold Zenger and Robert Lauth, AFSC).Nest-guarding males and spawning females were observed. Little is known of the life history of young Atkamackerel prior to their appearance in trawl surveys and the fishery at about age 2-3 years. Adult Atkamackerel in the Aleutians consume a variety of prey, but principally calanoid copepods and euphausiids, andare consumed by a variety of piscivores, including groundfish (e.g., Pacific cod and arrowtooth flounder,Livingston et al. unpubl. manuscr.), marine mammals (e.g., northern fur seals and Steller sea lions, Kajimura1984, NMFS 1995), and seabirds (e.g., tufted puffins, Byrd et al. 1992).
A morphological and meristic study suggested that there may be separate populations in the Gulf of Alaskaand the Aleutian Islands (Levada 1979). This study was based on comparisons of samples collected offKodiak Island in the central Gulf, and the Rat Islands in the Aleutians. Lee (1985) also conducted amorphological study of Atka mackerel from the Bering Sea, Aleutian Islands and Gulf of Alaska. The datashowed some differences (although not consistent by area for each characteristic analyzed), suggesting acertain degree of reproductive isolation. However, results from a genetics study comparing Atka mackerelsamples from the western Gulf of Alaska with samples from the eastern, central, and western Aleutian Islandsshowed no evidence of discrete stocks (Lowe et al. 1998). Between-sample variation was extremely lowamong the four samples indicating that a large amount of gene flow is occurring throughout the range. It ispresumed that gene flow is occurring during the larval, pelagic stage, and that the localized aggregationsreflect the distribution of surviving, settled larvae and juveniles. Differences in growth rates consistentlyobserved throughout their Alaskan range are phenotypic characteristics reflecting differences in the localenvironment.
While genetic information suggests that the Aleutian Island (AI) and Gulf of Alaska (GOA) populations ofAtka mackerel could be managed as a unit stock, there are significant differences in population size,distribution, recruitment patterns, and resilience to fishing that suggest otherwise. Bottom trawl surveys andfishery data suggest that the Atka mackerel population in the GOA is smaller and much more patchilydistributed than that in the AI, and composed almost entirely of fish > 30 cm in length. There are also moreareas of moderate Atka mackerel density in the AI than in the GOA. The lack of small fish in the GOAsuggests that Atka mackerel recruit to that region differently than in the AI, perhaps as juveniles moving eastfrom the larger population in the AI rather than from larval settlement in the area. This might also explainthe greater sensitivity to fishing depletion in the GOA as reflected by the history of the GOA fishery since

4
the early 1970s. Catches of Atka mackerel from the GOA peaked in 1975 at about 27,000 mt. Recruitmentto the AI population was low from 1980-1985, and catches in the GOA declined to 0 in 1986. Only after aseries of large year classes recruited to the AI region in the late 1980s, did the population and fisheryreestablish in the GOA beginning in the early 1990s. After passage of these year classes through thepopulation, the GOA population, as sampled in the 1996 and 1999 GOA bottom trawl surveys, has declinedand is very patchy in its distribution. These differences in population resilience, size, distribution, andrecruitment argue for separate assessments and management of the GOA and AI stocks despite their geneticsimilarities.
13.2 FISHERY
13.2.1 Catch History
Annual catches of Atka mackerel in the eastern Bering Sea (EBS) and Aleutian Islands (AI) regions increasedduring the 1970s reaching an initial peak of over 24,000 mt in 1978 (see SAFE Table 3). Atka mackerelbecame a reported species group in the BSAI Fishery Management Plan in 1978. Catches (includingdiscards) by region and corresponding Total Allowable Catches (TAC) set by the North Pacific FisheryManagement Council (Council) from 1978 to the present are given in Table 13.1. Table 13.2 documentsannual research catches (1977 - 1998) from NMFS trawl surveys.
From 1970-1979, Atka mackerel were landed off Alaska exclusively by the distant water fleets of theU.S.S.R., Japan and the Republic of Korea. U.S. joint venture fisheries began in 1980 and dominated thelandings of Atka mackerel from 1982 through 1988. The last joint venture allocation of Atka mackerel offAlaska was in 1989, and since 1990, all Atka mackerel landings have been made by U.S. fishermen. Totallandings declined from 1980-1983 primarily due to changes in target species and allocations to variousnations rather than changes in stock abundance. From 1985-1987, Atka mackerel catches were some of thehighest on record, averaging 34,000 mt annually. Beginning in 1992, TACs increased steadily in responseto evidence of a large exploitable biomass, particularly in the central and western Aleutian Islands.
13.2.2 Description of the Directed Fishery
The patterns of the Atka mackerel fishery generally reflect the behavior of the species: (1) the fishery ishighly localized and usually occurs in the same few locations each year; (2) the schooling semi-pelagic natureof the species makes it particularly susceptible to trawl gear fished on the bottom; and (3) trawling occursalmost exclusively at depths less than 200 m. In the early 1970s, most Atka mackerel catches were made inthe western Aleutian Islands (west of 180�W longitude). In the late 1970s and through the 1980s, fishingeffort moved eastward, with the majority of landings occurring near Seguam and Amlia Islands. In 1984 and1985 the majority of landings came from a single 1/2� latitude by 1� longitude block bounded by 52�30'N,53�N, 172�W, and 173�W in Seguam Pass (73% in 1984, 52% in 1985). Areas fished by the Atka mackerelfishery from 1977 to 1992 are displayed in Fritz (1993). Areas utilized by the 2001 fisheries are shown inFigure 13.1.

5
13.2.3 Management History
In 1993, an initial Atka mackerel TAC of 32,000 mt was caught by March 11, almost entirely south ofSeguam Island (Seguam Bank). This initial TAC release represented the amount of Atka mackerel whichthe Council thought could be appropriately harvested in the eastern portion of the Aleutian Islands subarea(based on the assessment for 1993; Lowe 1992) since there was no mechanism in place at the time tospatially allocate TACs in the Aleutians to minimize the likelihood of localized depletions. In mid-1993,however, Amendment 28 to the Bering Sea/Aleutian Islands Fishery Management Plan became effective,dividing the Aleutian subarea into three districts at 177�W and 177�E longitudes for the purposes of spatiallyapportioning TACs (Figure 13.1). On August 11, 1993, an additional 32,000 mt of Atka mackerel TAC wasreleased to the Central (27,000 mt) and Western (5,000 mt) districts. The fishery in the Central area (542)was closed on October 29, 1993 after harvest levels reached 26,560 mt. Only 2,285 mt were landed in theWestern area (543) in all of 1993; annual landings for 1993 in the eastern area (541) and the EBS totaled36,892 mt. Since 1994, the BSAI Atka mackerel TAC has been allocated to the three regions based on theaverage distribution of biomass estimated from the Aleutian Islands bottom trawl surveys.
In June 1998, the Council passed a fishery regulatory amendment which proposed a four-year timetable totemporally and spatially disperse and reduce the level of Atka mackerel fishing within Steller sea lion criticalhabitat in the Bering Sea/Aleutian Islands. The temporal dispersion is accomplished by dividing the BSAIAtka mackerel TAC into two equal seasonal allowances. The first allowance is made available for directedfishing from January 1 to April 15 (A season), and the second seasonal allowance is made available fromSeptember 1 to November 1 (B season). The spatial dispersion is accomplished through maximum catchpercentages of each seasonal allowance that can be caught within sea lion critical habitat (CH) as specifiedfor the Central and Western Aleutian Islands. No critical habitat closures are established for the Easternsubarea, but the 20 nm trawl exclusion zones around Seguam and Agligadak rookeries that have been in placeonly for the pollock A-season, are in effect year-round. These regulations implementing these managementchanges became effective January 22, 1999. The four-year timetable for spatial dispersion outside of criticalhabitat is:
Aleutian Island DistrictArea 541 Area 542 Area 543
Year(s) Inside CH Outside CH Inside CH Outside CH Inside CH Outside CH
1999 80% 20% 65% 35%
2000 67% 33% 57% 43%
2001 54% 46% 49% 51%
2002 40% 60% 40% 60%
Effective August 8, 2000, there was an injunction against all trawl fishing inside critical habitat.

6
13.2.4 Bycatch and Discards
Atka mackerel are not commonly caught as bycatch in other directed fisheries. The largest amounts ofdiscards of Atka mackerel, which are likely under-size fish, occur in the directed Atka mackerel trawlfisheries. Atka mackerel are also caught as bycatch in the trawl Pacific cod and rockfish fisheries. Thedirected Atka mackerel fishery has had low bycatch rates of rockfish (1-5% of the total Atka mackerel catch)and slightly higher bycatch rates of cod (3-15%). There were anecdotal reports of high discard rates ofnorthern rockfish in the 2001 Atka mackerel fishery. While the 2001 discard rate of northern rockfish as atotal of the Atka mackerel catch is low (1%), the actual amount of northern discards (716 mt) is about 11%of the 2001 BSAI northern TAC (6,760 mt). The amount of northern rockfish discarded in the Atka mackerelfisheries in 1997, 1998, 1999, and 2000 were 238 mt, 585 mt, 804 mt, and 1,398, respectively.
Discard data have been available for the groundfish fishery since 1990. Discards of Atka mackerel for 1990-1998 have been presented in previous assessments (Lowe et al. 2000). Discard data from 1995 to presentare given below:
Year Fishery Discarded (mt) Retained (mt) Total (mt) Discard Rate (%)1995 Atka mackerel 13,669 66,153 79,823 17.1
All others 849 499 1,349All 14,519 66,652 81,171
1996 Atka mackerel 15,354 84,835 100,189 15.3All others 1,298 1,638 2,936
All 16,652 86,473 103,1251997 Atka mackerel 5,829 57,850 63,680 9.1
All others 552 1,393 1,945All 6,381 59,243 65,625
1998* Atka mackerel 4,585 50,184 54,769 8.4All others 483 846 1,329
All 5,068 51,030 57,0981999* Atka mackerel 4,010 47,351 51,361 7.8
All others 743 1,751 2,494All 4,753 49,102 53,855
2000* Atka mackerel 2,388 43,977 46,365 5.1All others 201 272 473
All 2,589 44,249 46,838 *Includes CDQ catch
The discard rate of Atka mackerel by the directed fishery has decreased from 17% in 1995 to the 2000 valueof 5%, the lowest reported discard rate since data collection began. Small Atka mackerel were encounteredin large numbers in 1995 which may have been the strong 1992 year class, a likely factor contributing to thesecond highest discard rate since data collection began (Lowe et al., 2000).
7
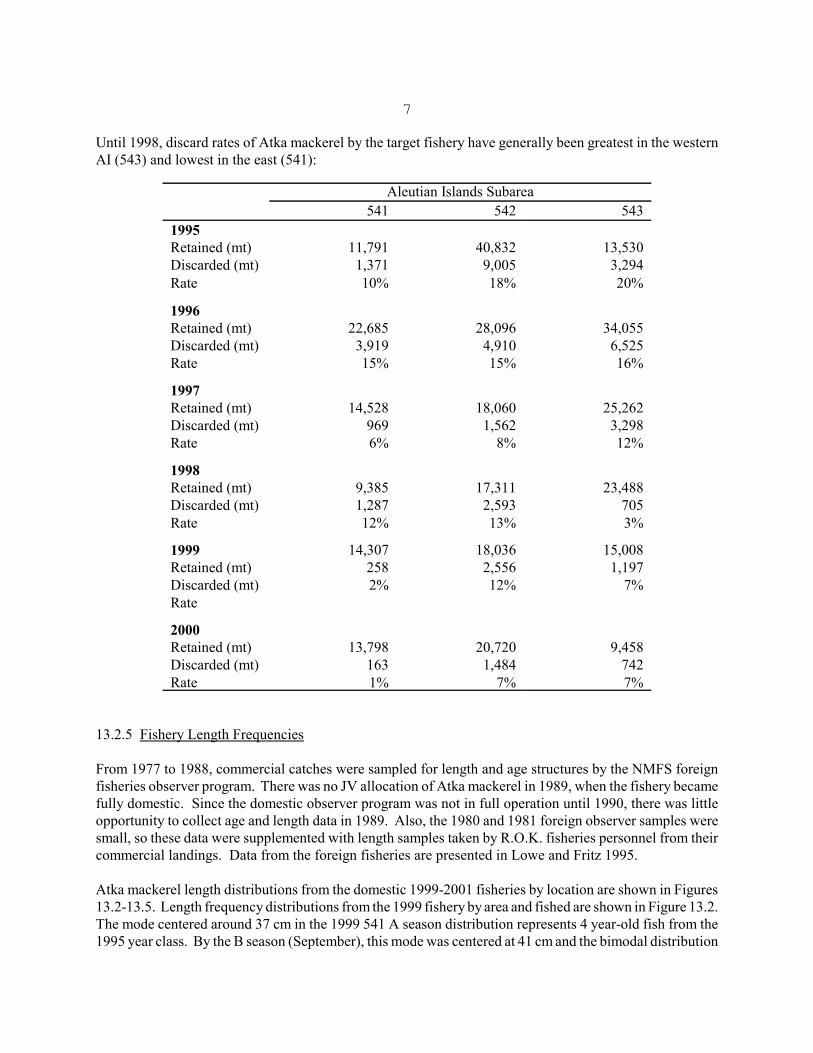
Until 1998, discard rates of Atka mackerel by the target fishery have generally been greatest in the westernAI (543) and lowest in the east (541):
Aleutian Islands Subarea541 542 543
1995Retained (mt) 11,791 40,832 13,530Discarded (mt) 1,371 9,005 3,294Rate 10% 18% 20%
1996Retained (mt) 22,685 28,096 34,055Discarded (mt) 3,919 4,910 6,525Rate 15% 15% 16%
1997Retained (mt) 14,528 18,060 25,262Discarded (mt) 969 1,562 3,298Rate 6% 8% 12%
1998Retained (mt) 9,385 17,311 23,488Discarded (mt) 1,287 2,593 705Rate 12% 13% 3%
1999 14,307 18,036 15,008Retained (mt) 258 2,556 1,197Discarded (mt) 2% 12% 7%Rate
2000Retained (mt) 13,798 20,720 9,458Discarded (mt) 163 1,484 742Rate 1% 7% 7%
13.2.5 Fishery Length Frequencies
From 1977 to 1988, commercial catches were sampled for length and age structures by the NMFS foreignfisheries observer program. There was no JV allocation of Atka mackerel in 1989, when the fishery becamefully domestic. Since the domestic observer program was not in full operation until 1990, there was littleopportunity to collect age and length data in 1989. Also, the 1980 and 1981 foreign observer samples weresmall, so these data were supplemented with length samples taken by R.O.K. fisheries personnel from theircommercial landings. Data from the foreign fisheries are presented in Lowe and Fritz 1995.
Atka mackerel length distributions from the domestic 1999-2001 fisheries by location are shown in Figures13.2-13.5. Length frequency distributions from the 1999 fishery by area and fished are shown in Figure 13.2.The mode centered around 37 cm in the 1999 541 A season distribution represents 4 year-old fish from the1995 year class. By the B season (September), this mode was centered at 41 cm and the bimodal distribution

8
had disappeared. The recruitment of the 1995 year class was confirmed by the 1999 fishery age composition(Figure 13.3) which was dominated by the 1995 year class in all three management areas.
Length frequency distributions from the 2000 fishery by area and season fished are shown in Figure 13.4.The B season reflects the fishery entirely outside of critical habitat, as there was an injunction on all trawlfishing inside critical habitat effective August 8, 2000. The modes in all areas are comprised mostly of the1995 year class. The A and B season fisheries at Buldir-Tahoma reef and at Petral Bank were similar. Aslightly greater proportion of larger fish were caught during the B season in Seguam. This area was probablythe least affected by the injunction as trawl fishing has been prohibited year round in the 20 nm trawlexclusion zones around Seguam and Agligadak rookeries; areas which encompass much of critical habitatin 541. There was only an A season fishery conducted at the Stalemate, Kiska, and Amchitka locations.There was some fishing effort off the Delarof Islands in the B season, but too few specimens were collectedfor length frequency composition.
Preliminary length frequency distributions from the 2001 fishery by area and season fished are shown inFigure 13.5. The A and B season fisheries at Near Islands, Amchitka, and Petral Bank were similar. Therewere modes in the length distribution of fish from the B season fishery between 30 and 35 cm at Buldir-Tahoma and Kiska, which may be comprised of 3 year old fish of the 1998 year class. The modes at 35 cmand 37 cm at Delarof Islands and Seguam Bank respectively, may be 4 year old fish from the 1997 year class.The 2001 fishery age data are not yet available.
13.2.6 Steller Sea Lions, Atka mackerel, and the Fishery
The western stock of Steller sea lions (defined as west of 144�W at Cape Suckling) is currently listed asendangered under the Endangered Species Act, and had been listed as threatened since 1990. In 1991-92,10 nm year-round trawl exclusion zones were established around all rookeries west of 150�W; in 1992-93,20 nm trawl exclusion zones were established around 6 rookeries in the eastern Aleutian Islands that areoperational only during the BSAI pollock A-season. Two of the 20 nm zones are located within the Aleutian541 management district, those around Seguam and Agligadak Islands (Figure 13.1). In 1993, NMFSdesignated Steller sea lion critical habitat, which includes a 20 nm aquatic zone around all rookeries andmajor haulouts west of 144�W, and three foraging areas, one of which is located around Seguam Pass. Sealion food habits data collected in the Aleutian Islands revealed that Atka mackerel was the most commonfood item of adults and juveniles in summer (NMFS 1995) and winter (Sinclair and Zeppelin, in press).
Since 1979, the Atka mackerel fishery has occurred largely within areas designated as Steller sea lion criticalhabitat. While total removals from critical habitat may be small in relation to estimates of total Atkamackerel biomass in the Aleutian region, fishery harvest rates in localized areas may have been high enoughto affect prey availability of Steller sea lions (Section 12.2.2 of Lowe and Fritz 1997). The localized patternof fishing for Atka mackerel apparently does not affect fishing success from one year to the next since localpopulations in the Aleutian Islands appear to be replenished by immigration and recruitment. However, thispattern could create temporary reductions in the size and density of localized Atka mackerel populationswhich could affect Steller sea lion foraging success during the time the fishery is operating and for a periodof unknown duration after the fishery is closed.
To address the possibility that the fishery creates localized depletions of Atka mackerel and adverselymodifies Steller sea lion critical habitat by disproportionately removing prey, the Council passed the fisherymanagement regulatory amendment described in Section 13.2.3 in June 1998. As a result of this

9
NMFS/Council action, the U.S. District Court, Western District agreed with NMFS' conclusion that the Atkamackerel fishery, as modified by this regulatory amendment, was not likely to jeopardize the continuedexistence of the Steller sea lion nor adversely modify its critical habitat.
NMFS is investigating the efficacy of trawl exclusion zones as a fishery-Steller sea lion management tool,and trying to determine the local movement rates of Atka mackerel through tagging studies. In August 1999,the AFSC conducted a pilot survey to explore the variance in survey catches of Atka mackerel and thefeasibility of tagging as methods to determine small-scale changes in abundance and distribution. Thetagging work was very successful and a dedicated tagging survey was conducted again in August 2000 and2001 in the closed and open areas of 541. This was followed by a tag recovery survey conducted in theclosed area of 541 in September 2000; a recovery effort is also planned for 2001.
13.3 DATA 13.3.1 Fishery Data
Fishery data consist of total catch biomass from 1977 to 2001 (Table 13.1), and the age composition of thecatch from 1977-2000 (Table 13.3). Catch-at-age (in numbers) was estimated using the length frequenciesdescribed above and age-length keys. The formulas used are described by Kimura (1989). As with thelength frequencies, the age data for 1980-1981, 1989, 1992-1993, and 1997 presented problems. Thecommercial catches in 1980 and 1981 were not sampled for age structures, and there were too few agestructures collected in 1989, 1992 ,1993, and 1997 to construct age-length keys. Therefore, the 1980 surveyage-length key was used to estimate the 1980 commercial catch age distribution, and these data were furtherused to estimate the 1981 commercial catch age distribution using a mixture model (Kimura and Chikuni1987). However, this method did not provide satisfactory results for the more recent (1989, 1992, 1993 and1997) catch data. Thus, the 1989, 1992, 1993 and 1997 fishery length frequency data were used directly instock synthesis and fitted simultaneously with the time series of catch-age data. Length frequency data wereconverted to ages within the model using a transition matrix. The transition matrix for length data wasdefined from a von Bertalanffy growth function of the form:
Lt = L�
+ (L1 - L�
) * exp (-K (t - 1))
Where L�
is the asymptotic length, L1 is the mean size at age 1, and K is the growth parameter. Parametersfor this equation were estimated from the 1986, 1991 and 1994 age-length data collected from the surveys.
Bin 1 2 3 4 5 6 7 8 9 10 11 12 13 14 15Length (cm) 20 21 22 23 24 25 26 27 28 29 30 31 32 33 34
Bin 16 17 18 19 20 21 22 23 24 25Length (cm) 35 36 37 38 39 40 41-45 46-50 51-55 56-64
The most salient features of the estimated catch-at-age (Table 13.3) are the strong 1975 and 1977 yearclasses, and the appearance of a large number of 4-year-olds in 1988, 1992, 1995, 1996, and most recentlyin 1999 representing the 1984, 1988, 1991, 1992 and the 1995 year classes, respectively. The 1975 year classappeared strong as 3 and 4-year-olds in 1978 and 1979. It is unclear why this year class did not continue toshow up strongly after age 4. The 1977 year class appeared strong through 1987, after entering the fisheryas 3-year-olds in 1980. The 1988 fishery was basically supported by the 1984 year class which showed up

10
strongly as 4-year-olds. The length frequency data from the 1988 foreign fishery, correspondingly showeda large drop in the mean length as the 1984 year class appeared in large numbers. This year class did notcontinue to show up strongly after 1988 in the domestic fisheries. The 1988 year class persisted in largenumbers in the 1992-1996 commercial catches, and also dominated the catch in the 1994 survey. The 1996-1998 catch data are dominated by the strong 1992 year class, and the 1999 and 2000 catch data weredominated by the 1995 year class (Table 13.3)
It is interesting to note that before 1984, catches consisted of fish less than 7 years old. Since 1984, 7+ year-old fish have made up a significant portion of the catches. It is not known if there has been an increase inthe numbers of older fish, or if they were previously unavailable to the fishery.
13.3.2 Survey Data
Atka mackerel are a difficult species to survey because: (1) they do not have a swim bladder, making thempoor targets for hydroacoustic surveys; (2) they prefer hard, rough and rocky bottom which makes samplingwith survey bottom trawl gear difficult; and (3) their schooling behavior and patchy distribution result insurvey estimates with large variances. Despite these shortcomings, the U.S.-Japan cooperative trawl surveysconducted in 1980, 1983, 1986, and the 1991, 1994, 1997, and 2000 domestic surveys, provide the only directestimates of population biomass from throughout the Aleutian Islands region.
Trawl survey biomass estimates of Atka mackerel varied from 197,529 mt in 1980 to 306,780 mt in 1983,and 544,754 mt in 1986 (Table 13.4). However, the high value for 1986 is not directly comparable toprevious estimates. During the 1980 survey, no successful sampling occurred in shallow waters (<100 m)around Kiska and Amchitka Islands, and during the 1983 survey very few shallow water stations weresuccessfully trawled. However, during the 1986 survey, several stations were successfully trawled in watersless than 100 m, and some produced extremely large catches of Atka mackerel. In 1986, the biomass estimatefrom this one depth interval alone totaled 418,000 mt in the Southwest Aleutians (Table 13.4), or 77% of thetotal biomass of Atka mackerel in the Aleutian Islands. This was a 403,000 mt increase over the 1983biomass estimate for the same stratum-depth interval. The 1986 biomass estimate is associated with a largecoefficient of variation (0.63). Due to differences in areal and depth coverage of the surveys, it is not clearhow this biomass estimate compares to earlier years.
The most recent biomass estimate from the 2000 Aleutian Islands bottom trawl survey is 510,900 mt, upabout 40% relative to the 1997 survey estimate (Table 13.5). Previous to this, the 1997 Aleutian Islandsbottom trawl survey biomass estimate of 366,300 mt, was down about 50% and 40% relative to the 1991and 1994 survey estimates, respectively (Table 13.5). The breakdown of the Aleutian biomass estimates byarea corresponds to the management districts (541-Eastern, 542-Central, and 543-Western). The increasein biomass in the 2000 survey all occurred in the Western and Central areas; biomass in the Eastern area wasslightly less than 1000 mt in the 2000 survey. Relative to the 1997 survey, the 2000 biomass estimates areup 34% in the Western area, up 77% in the Central area, and down 98% in the Eastern area (Figure 13.6).The 98% decline in the Eastern area follows a 78% decline in the 1997 survey relative to the 1994 survey. The 95% confidence intervals about the mean total 1991, 1994, 1997, and 2000 Aleutian biomass estimatesare 475,860-971,975 and 201,701-1,002,621 mt, and 146,296-586,331 and 214,779 -806,934 mt, respectively.The coefficient of variation (CV) of the 2000 mean Aleutian biomass is 28%, consistent with the CVs fromthe 1994 and 1997 surveys, as are the CVs by area for these surveys (Table 13.5).

11
The distribution of biomass in the Western, Central, and Eastern Aleutians, and the southern Bering Seashifted between each of the 1991, 1994, 1997, and 2000 surveys, and most dramatically in area 541 in the2000 survey (Figure 13.6). In 1994 for the first time since the initiation of the Aleutian triennial surveys,a significant concentration of biomass was detected in the southern Bering Sea area (66,600 mt) and againin 1997 (95,700 mt, Table 13.5). This was attributed to a large catch from a single haul encountered northof Akun Island in 1994 and in 1997. In both 1991 and 1994, the Western area contributed approximately halfof the total estimated Aleutian biomass, but dropped to 37% in 1997 and 35% in 2000. In 1994, 14% of theAleutian biomass was found in the Central area compared to 40% in 1991 and up to 51 and 65% in the 1997and 2000 surveys, respectively. The contribution of Eastern area biomass from the 1997 survey (12%) wasdown relative to 1994 (35%), but consistent with the 1991 distribution (11%). The 2000 541 biomassestimate (900 mt) was the lowest of all surveys, contributing only 0.2% of the total 2000 Aleutian biomass.
The area specific variances for area 541 have always been high relative to 542 and 543; the distribution ofAtka mackerel in 541 is patchier. The extremely low 2000 biomass estimate for 541 has not been reconciled,but there are at least three factors that may have had a significant impact on the distribution of Atka mackerelin 541: 1) The survey started 3 weeks earlier in May 2000 relative to past surveys which have started inJune. Atka mackerel are summer spawners and presumed to distribute themselves differently in the spawningmonths, becoming more demersal and forming dense aggregations near bottom. A start date in May mayhave been early enough such that the fish were not distributed in their typical summer spawning mode andhabitat; 2) The average bottom temperatures measured in the 2000 survey were the lowest of any of theAleutian surveys, particularly in depths less than 200 m where 99% of the Atka mackerel are caught in thesurveys (pers. comm, Harold Zenger, AFSC, Figure 13.7). The low temperatures could have impacted thedistribution of Atka mackerel and/or their food source, however, temperatures were significantly lower inthe 2000 survey throughout the Aleutians. Atka mackerel in the 2000 survey were found to weigh less fora given age compared to the 1994 and 1997 surveys, suggesting a food related impact in 2000; 3) Thesampling in 541 occurred at an extreme high tide; Atka mackerel are thought to be very responsive to tidecycles. During extremes in the tidal cycle, Atka mackerel may not be accessible (pers. comm., HaroldZenger, AFSC). Perhaps the combination of these factors coupled with the typically patchier distributionof 541 Atka mackerel impacted the distribution of the fish such that they were not available at the surveyedstations at the time of the survey in 541.
The survey was able to go back and resample a few stations that historically have had high Atka mackerelcatch rates in 541. The lack of biomass as sampled by the survey was corroborated at these resampledstations. The very low survey catch rates in 541 in May, were subsequently not encountered by the 2000 Bseason fishery or the 2000 August and September Atka mackerel tagging surveys. There is no evidence tosuggest that the survey vessels were not sampling properly in 541, rather we presume that the availabilityof fish in 541 at the time of the survey was different. There is also no evidence to suggest that fish in 541migrated to adjacent areas in 542. Area specific growth relationships which have been substantiated to besignificantly different by area (Kimura and Ronholt 1988, Lowe et al. 1998) were examined and comparedwith previous years and found to be consistent. Also, short term tagging data from the late 1980s and the1999 and 2000 studies have not shown any evidence of large scale movements. Appendix 1 examines thedistribution of historical Atka mackerel survey data. Simulation results show that it is very possible tounderestimate the true biomass when the target organism has a very patchy distribution (E. Conners,Appendix 1).
Virtually all (>99%) of the Atka mackerel biomass in the trawl surveys has been encountered in the 1-200m depth strata, however, the proportions in the 1-100 m and 100-200 m strata differ among years (Table

12
13.5). The only thing consistent about Atka mackerel biomass as sampled by the surveys, is that theestimates are highly variable over depth, area, and survey year. Given that the variability associated withthe overall 2000 Aleutian biomass estimate is consistent with previous surveys, and the area specific varianceassociated with area 541 biomass estimate is also consistent with previous surveys, we accepted the overall2000 Aleutian biomass estimate. Areas with large catches of Atka mackerel during the 1994 survey includedsouth of Buldir Island, north of Akun Island, Seguam Pass, southwest of Atka Island, Stalemate Bank, andsouth of Amchitka Island. In the 1997 survey, areas with large catches were located north of Akun Island,southwest of Tanaga Island, west of Rat Island, Buldir Island, and Stalemate Bank. In the 2000 survey, areaswith large catches were located in Tanaga Pass, south of Amchitka Island, and at Kiska.
There is greater confidence in Atka mackerel biomass estimates from bottom trawl surveys of the groundfishcommunity of the Aleutian Islands (AI) than the Gulf of Alaska (GOA). First, the coefficients of variationof the mean Atka mackerel biomass estimates have been considerably smaller from the recent AI surveysthan the recent GOA surveys: 0.33, 0.29, and 0.28 from the 1994, 1997 and 2000 AI surveys, respectively,compared with 0.61, 0.99, 0.40, and 1.00 from the 1993, 1996, 1999 and 2001 GOA surveys. Second, whilepatchy in its distribution compared to other groundfish species, Atka mackerel have been much moreconsistently encountered in the AI than the GOA surveys, appearing in 41% , 33%, 23% and 33% of thehauls in the 1991, 1994, 1997, and 2000 AI surveys, compared to 5%, 28%, 12%, 20% and 10% of the haulsin the Shumagin area in the 1990, 1993, 1996, 1999, and 2001 GOA surveys, respectively. For these reasonswe utilize bottom trawl surveys to assess the relative abundance of Atka mackerel in the Aleutian Islands,but do not consider the highly variable estimates of biomass from the GOA surveys useful for trackingabundance trends.
Survey Length Frequencies
The 1994, 1997, and 2000 bottom trawl surveys revealed a strong east-west gradient in Atka mackerel size,with the smallest fish in the west and progressively larger fish to the east (Figure 13.8). This pattern is alsoapparent in the fishery data (Figures 13.2-13.5). In 1994 and 1997, the survey found smaller fish in theWestern area than did the fishery, while the size distribution of their catches were more similar in the Centralarea (Figure 13.8). This compares with the 2000 survey where the survey caught larger fish in the Centralarea. The 1997 survey also found larger Atka mackerel than the fishery in the Eastern area. Differences inthe timing and location of survey and fishery catches may account for the observed differences in Atkamackerel sizes encountered in the east. The fishery is currently excluded from Seguam Pass (10 and 20 nmtrawl exclusion zones) and fishes almost exclusively southeast of the pass in winter. Recent surveys,conducted in summer, have been unsuccessful in capturing Atka mackerel southeast of the pass in thesummer, but have found large fish inside the pass. In general, the observed differences in fish size betweenthe fishery and survey may be due to differences in timing and distribution of the fishery and survey, andrelated to inshore movements of the reproductive (i.e. larger-sized) fish in summer for spawning. In winter,the population moves offshore to deeper waters and appears to be more mixed by size and sex than insummer (Fritz and Lowe,1998). The 2000 survey length frequency distributions showed a mode a fishbetween 20 and 25 cm in all areas, which was found to be the 1998 year class (Figure 13.9a).
Survey Age Frequencies
The age compositions from the 1991, 1994, 1997 and 2000 Aleutian surveys are shown in Figure 13.9. Inthe 1991 survey, the catch was dominated by 3-year-old fish of the 1988 year class. The 1988 year classshowed up strongly as 6-year-olds in the 1994 survey catches, and was still evident as 9-year-olds in the 1997

13
survey catch. The 2000 survey age composition shows a strong 1992 and 1995 year class, and a very strongshowing of 2 year olds from the 1998 year class. The selectivity of 2 year olds in the survey is thought tobe fairly low, and this age group has not shown up in significant proportions in previous surveys (Figure13.9b). The mean age in the 1991 survey was 3.9 years, the youngest mean age of any survey. The meanages of the 1994, 1997, and 2000 surveys were 5.4, 4.8, and 5.0 years, respectively.
Atka mackerel are a summer-fall spawning fish that do not appear to lay down an otolith annulus in the firstyear (Anderl et al., 1996). For stock assessment purposes, one year is added to the number of otolith hyalinezones determined by the Alaska Fisheries Science Center Age and Growth Unit. All age data presented inthis report have been corrected in this way.
Survey Abundance Indices
Two time series of survey data are used in the age-structured model: 1) relative indices of abundance withthe associated standard errors, and corresponding age compositions from the 1980, 1983, 1986, and 1991Aleutian Islands surveys; and 2) absolute estimates of abundance with the associated standard errors, andcorresponding age compositions from the 1986, 1991, 1994, 1997, and 2000 surveys. These data sets wereincorporated into the model to calibrate the estimated abundance to the appropriate level. The relativeindices of abundance exclude biomass from the 1-100 m depth strata of the Southwest region due to the lackof sampling in this strata in some years.
13.3.3 Weight at Age Data
Separate weight-at-age vectors were estimated for the fishery and survey data sets (Table 13.6). The surveyvector was estimated with 1986, 1991, and 1994 survey data, and the fishery vector was estimated with 1990-1996 fishery data.
13.4 ANALYTIC APPROACH
13.4.1 Age-Structured Modeling Approach
The stock synthesis model described by Methot (1989, 1990) was used to assess the status of Aleutian IslandsAtka mackerel as in previous assessments, given a delay in conversion to AD Model Builder software. Thisapproach to catch-at-age analysis was designed to incorporate diverse auxiliary information, and follows themaximum likelihood approach described by Fournier and Archibald (1982). The model is structured tosimultaneously analyze catch biomass, age composition and effort from multiple fisheries, and abundanceand age composition from multiple surveys (Methot 1990).
In the stock synthesis model deviations between the observations and the expected values are quantified witha specified error model and cast in terms of log-likelihood. The overall log-likelihood (L) is the weightedsum of the calculated log-likelihoods for each type of data or component. The emphasis factors (thecomponent weights) should all be equal to 1 in a perfectly specified model. These emphasis factors aresubjectively adjusted to distinguish those components which may be subject to greater error (i.e. thosecomponents in which less confidence is placed). Numerical estimation of the derivative of L with respectto small changes in each parameter is used in an iterative approach to maximization of L (Methot 1990).
The basic equations describing the population dynamics are given below:

14
a age
y year
j fishery or survey
M instantaneous natural mortality rate
maproportion of mature females at age a
Waj body weight-at-age for fishery or survey j
saj selectivity at age for fishery or survey j
fy annual fishing mortality factor
Fya = fysa fishing mortality at age
Zya=M + �j(Fya) total fishing mortality rate
Ny+1,a+1=Nyae-Zya population numbers at age at the beginning of year y
cya=[Nya(1-e-Zya)/Zya]Fya catch in numbers at age for year y
Cyj = �a(cyajWaj) catch biomass in year y for fishery or survey j
By=Nya Waj population biomass in year y
Sy= 0.5�a(Nya Waj ma) female spawner biomass in year y
13.4.2 Model Assumptions
Some of the basic assumptions of the stock synthesis model are: 1) Catch-at-age (cya) is modeled by theBaranov catch equation; 2) Catch biomass is measured with much greater precision than other types of data,thus in stock synthesis, the level of fishing mortality is calculated so that the estimated catch biomassmatches the observed catch biomass; and 3) Fishing mortality is separable into a year-dependent factor andan age-dependent factor.
In addition to these basic assumptions, the following assumptions specific to Atka mackerel were used in thisconfiguration of stock synthesis: 1) Natural mortality is equal to 0.3 and is constant for all ages and years;2) There are 2 time series of survey data. Survey data which exclude the 1-100 m depth strata in theSouthwest region represent an index of relative abundance, and the absolute estimates of abundance includeall data from the 1986, 1991, 1994, 1997, and 2000 surveys. 3) Survey catchability associated with estimatesof absolute biomass is fixed at 1.0, and the catchability of the relative index of abundance is estimated withinthe model. 4) Survey selectivities are estimated from the survey age compositions; and 5) There is 1 fisherywhich is separated into 2 time periods 1972-1983 and 1984-2000. Thus, the fishery selectivity-at-age vectorsare estimated for two different time periods. The rationale for this is that prior to 1984 the fishery basicallyconsisted of fish 2-7 years old and was harvested by the foreign fishery. The oldest fish during this timeperiod was 9 years old (Table 13.3). After 1983, fish greater than 7 years old appeared in the fishery(maximum of 15 years old from the 1994 fishery), and the fishery was prosecuted by domestic fishermen.
Exploratory model runs were made incorporating a third time period with the years 1999 and 2000 to explorethe impacts of Steller sea lion regulations. Preliminary results showed lower selectivity at age after age 5,

15
and similar biomass and recruitment trends with a marginal increase in the overall fit of the test modelcompared to the standard assessment model. Initial results based on only 2 years of fishery data wereconsidered too preliminary. A new model will be presented next year that incorporates the 2001 fishery agedata and more fully explores the addition of a third time period to look at the impacts of the recent Stellersea lion regulations.
13.4.3 Model Components
The likelihood components and the corresponding emphasis factors used in this analysis are listed below:
Likelihood component Emphasis Catch biomass 1
Catch age composition 1Catch length composition 1Survey biomass (indices) 1Survey age comp. (indices) 1Survey biomass (absolute) 1Survey age comp. (absolute) 1Stock recruitment-individual 1Stock recruitment-mean 1
In previous assessments, survey estimates of absolute biomass had a high emphasis (10) in order to tune themodel to those levels of abundance. In the 1996 assessment, a sensitivity analysis of the absolute surveyemphasis factor was conducted which led to the selection of an emphasis of 1 for absolute survey biomass(Lowe and Fritz 1995). The stock recruitment-individual component relates to the deviations between theindividual recruitment estimates and the predicted values from the stock recruitment curve. The stockrecruitment-mean component relates to the deviation between the stock recruitment curve parameters andthe mean and variance of the individual recruitment estimates. The stock recruitment-mean componentensures that the expected value of the recruitment curve is consistent with the average of the individualrecruitment estimates. In previous assessments with a single stock recruitment component, this componentwas de-emphasized (0.01) in order to allow for individual recruitment variability each year. Addingemphasis on the former stock recruitment component was overly restrictive on allowing for individualrecruitment variability, e.g., with higher stock recruitment emphasis, recruitment variability approached zero.The stock recruitment mean component allows the underlying model to remain consistent with the averageestimated recruitment without sacrificing recruitment variability. Thus, the emphasis on the two stockrecruitment components were set to 1.
13.4.4 Parameters
13.4.4.1 Parameters Estimated Independently
Natural Mortality
Natural mortality (M) is a very difficult parameter to estimate. The regression model of Hoenig (1983) whichrelates total mortality as a function of maximum age, was used to estimate M:
ln(Z) = 1.46 - 1.01(ln(Tmax)).

16
Where Z is total instantaneous mortality (the sum of natural and fishing mortality, Z=M+F), and Tmax is themaximum age. The instantaneous total mortality rate can be considered an upper bound for the naturalmortality rate if the fishing mortality rate is minimal. The catch-at-age data showed a 14-year-old fish in the1990 fishery, and a 15-year-old in the 1994 fishery. Assuming a maximum age of 14 years and Hoenig'sregression equation, Z was estimated to be 0.30 (Lowe 1992). Since fishing mortality was relatively low in1990, natural mortality has been reasonably approximated by a value of 0.30 in this assessment.
An analysis was undertaken to explore alternative methods to estimate natural mortality for Atka mackerel(Lowe and Fritz, 1997). Several methods were employed based on correlations of M with life historyparameters including growth parameters (Alverson and Carney 1975, Pauly 1980, Charnov 1993), longevity(Hoenig 1983), and reproductive potential (Roff 1986, Rikhter and Efanov 1976).
Atka mackerel appear to be segregated by size along the Aleutian chain. Thus, natural mortality estimatesbased on growth parameters would be sensitive to any sampling biases that could result in under- or over-estimation of the von Bertalanffy growth parameters. Fishery data collections are more likely to be biasedas the fishery can be more size selective and concentrates harvests in specific areas as opposed to the surveys.Natural mortality estimates derived from fishery data ranged from 0.05 to 1.13 with a mean of 0.53. Naturalmortality estimates, excluding those based on fishery data, ranged from 0.12 to 0.74 with a mean value of0.34. The current assumed value of 0.3 is consistent with these values. Also, a value of 0.3 is consistent withvalues of M derived by the methods of Hoenig (1983) and Rikhter and Efanov (1976) which do not rely ongrowth parameters (Lowe and Fritz, 1997). Differential mortality at age was explored in the 1999 assessment(Lowe and Fritz, 1998), and is summarized in Section 13.5 Model Evaluation.
Length and Weight at Age
Atka mackerel exhibit large annual and geographic variability in length at age. Because survey data providethe most uniform sampling of the Aleutian Islands region, data from these surveys were used to evaluatevariability in growth (Kimura and Ronholt 1988). Length-at-age data from the 1980, 1983, and 1986 U.S.-Japan surveys, and the U.S.-U.S.S.R. surveys in 1982 and 1985 were analyzed by six areas. It appeared thatlength at age was smallest in the west and largest in the east.
Analysis of variance (ANOVA) was used to evaluate these differences statistically. The analyses indicatedthat length at age did not differ significantly by sex, so that factor was ignored in further analyses. Resultsshowed that the area and age effects were both significant, but the year effect was not quite significant. Thearea effect appeared much stronger than the age effect and all interactions were significant.
Further analysis to determine whether the area differences could be expected to remain consistent over theyears demonstrated that the differences in growth between areas is probably a real phenomenon rather thanjust a chance sampling of years.
Kimura and Ronholt (1988) estimated parameters of the von Bertalanffy length-age equation and a weight-length relationship using Aleutian Islands survey data from the 1980, 1983, and 1986 surveys. Sexes werecombined in the analysis as sex was not determined to be an important differentiating variable for Atkamackerel growth. These parameters have also been calculated for (1) the combined 1986, 1991, and 1994survey data for the entire Aleutians region, and for the Eastern (541) and combined Central and Western (542and 543) subareas, and (2) the combined 1990-96 fishery data for the same areas:

17
Data source L�
(cm) K t0
Early surveysAreas combined 41.4 0.311 -1.23
86, 91& 94 surveysAreas combined 41.4 0.439 -0.13
541 42.1 0.652 0.70542 & 543 40.3 0.425 -0.38
1990-96 fisheryAreas combined 41.3 0.670 0.79
541 44.1 0.518 0.35542 & 543 40.7 0.562 0.37
Length-age equation: Length (cm) = L�
{1-exp[-K(age-t0)]}
Both the combined survey and fishery data show a clear east to west size cline in length at age with thelargest fish found in the eastern Aleutians (Figure 13.10).
The weight-length relationships determined from the early (1980, 1983 and 1986) and recent (1986, 1991,and 1994) surveys are similar:
weight (kg) = 4.98E-06 * length (cm) 3.2403 (early surveys; N=899)weight (kg) = 9.08E-06 * length (cm) 3.0913 (recent surveys; N=1,052)
Weight-length data collected from the 1990 to 1996 domestic fisheries were also used to estimate a weight-length relationship:
weight (kg) = 3.72E-05 * length (cm) 2.6949 (N=4,041).
The observed differences in the weight-length relationships from the survey and recent fishery data,particularly in the exponent of length, probably reflect the differences in the timing of sample collection.The survey data were all collected in summer, the spawning period of Atka mackerel when gonad weightwould contribute the most to total weight. The recent fishery data were collected primarily in winter, whengonad weight would be a smaller percentage of total weight than in summer.
Maturity at Age
Female maturity at length and age were determined for Aleutian Islands Atka mackerel (McDermott andLowe, 1997) The age at 50% maturity is 3.6 years. Length at 50% maturity differs by area as the length atage differs by Aleutian Islands subareas:

18
Length at 50% maturity (cm)Eastern Aleutians (541) 33.9Central Aleutians (542) 31.1Western Aleutians (543) 31.2
The maturity schedules are given in Table 13.7.
13.4.4.2 Parameters Estimated Conditionally
Deviations between the observations and the expected values are quantified with a specified error structure. Lognormal error is assumed for estimates of survey and fishery catch, and a multinomial error structure isassumed for analysis of the survey and fishery age compositions. These error structures are used to estimatethe following parameters conditionally within the model.
Fishing Mortality
The time series of fishing mortalities (Fya = fy sa) on fully selected age groups (sa = 1) are estimated withinthe model. The level of the annual fishing mortality factor (fy) is adjusted within the model so that theestimated catch biomass matches the observed catch biomass.
Selectivity
The patterns of selectivity-at-age of the 2 time series of survey data are modeled as the product of 2 logisticfunctions:
where sa is selectivity at age, P1 relates to the slope of the first function, P2 is the inflection age for the firstfunction, P3 relates to the slope of the second function, P4 is the inflection age of the second function, andT1 is a function of P1, P2, P3, and P4 which scales maximum selectivity to 1.
The fishery selectivity pattern (which is estimated for 2 time periods) is a 7-parameter dome-shapedrelationship, which in addition to using the 4 parameters above, specifies a transition age at which thetransition from the ascending to the descending side of the function occurs, a selectivity at the minimum age,and a selectivity at the maximum age. The following parameters are allowed to change between timeperiods: the transition age, the selectivity of the maximum age, the inflection age of the descending limb, andthe slope of the descending limb.

19
Survey Catchability
Catch-per-unit-effort for survey j in year y (Gyj), is expected to be proportional to the model’s estimate ofavailable biomass, Byj, at the time of the survey:
where Qj is the catchability coefficient. For surveys that are expanded to a measurement of absolute biomass,the scaling factor (catchability coefficient) is assumed to be known. In the case where survey CPUE isinterpreted as a relative index of population biomass, the scaling factor is calculated so that the mean logdeviation is zero:
where the summation is over years (y) and n is the number of years. Catchability for the absolute abundancesurvey time series is assumed to be 1.0, and catchability for the relative index survey time series is estimatedwithin the model.
13.5 MODEL EVALUATION
13.5.1 Past Assessment Model Evaluations
The sensitivity of the model output (total and component likelihoods, ending biomass, and recruitment andbiomass trends) to changes in three key model elements was explored in the 1996 assessment (Lowe and Fritz1995). The three elements were the selectivity at age of both the fishery and absolute surveys, the naturalmortality estimate, and the emphasis factor on the absolute survey biomass component.
Estimates of selectivity and natural mortality are confounded parameters. In the 1996 stock assessment, nomaxima in relative likelihoods were observed when fishery (or survey) terminal (oldest age) selectivity variedfrom 0.1 to 1, while at the same time fixing the survey (or fishery) terminal selectivity at 0.1 and allowingthe model to estimate M (Lowe and Fritz 1995). In both cases, the ability of the model to fit the catch orsurvey age composition degraded and M increased to > 0.4 with increasing terminal selectivities. Thompson(1994) showed that fixing M at it’s expected value is generally a safer strategy than allowing M to beestimated by assuming asymptotic selectivity. Based on these sensitivity analyses, it was determined thatthe model structure that best fit the data (highest total likelihoods) and provided the most reasonable biomasstrend was one that had dome-shaped selectivities for both the surveys and fisheries (Lowe and Fritz, 1995).
There are rationale based on Atka mackerel life history characteristics and the operation of the fishery forsurvey and fishery dome-shaped selectivities for Atka mackerel. The surveys have been conducted solelyin the summer, when some mature Atka mackerel move into shallow waters for spawning (Zolotov 1993;

20
Fritz and Lowe 1998). Consequently, nest-guarding males and spawning females, the largest and oldest partof the population, would likely be less available to the survey trawl gear (due to difficulties in sampling thenearshore rocky, high current areas utilized by spawning Atka mackerel) than the smaller and youngerportions of the population. Spawning and nest-guarding were observed (by divers and in in situ video) offSeguam Island in August 1999 and 2000 (pers. comm., Robert Lauth, AFSC). This could lead to theestimation of dome-shaped survey selectivities. With regard to the fisheries, the early fisheries (1977-83)were also conducted solely in the summer; hence, much of the same rationale used to explain the dome-shaped survey selectivities applies to the early fisheries. The late fisheries (1984-present) have the highestselectivities on fish older than 8 years relative to the surveys and the early fishery. This could be attributedto increased fishing effort in winter, when the Atka mackerel population appears to be less segregated by sexand age than in summer. While this would tend to increase the selectivities on the older fish, there is stillconsiderable summer fishing data from 1984 to the present averaged into the estimation of a single fisheryselectivity curve from this period which could lead to dome-shaped selectivity.
At the time of development of the first stock synthesis model (Lowe, 1991), only the 1986 and 1991 biomassestimates were available and were weighted heavily (emphasis factor of 10) to insure that the model wouldclosely approximate these levels; stock synthesis could not simultaneously fit both the 1986 and 1991 surveybiomass estimates (Lowe, 1991). A subsequent re-analysis of the absolute survey biomass emphasis factor(which included the 1994 survey biomass estimate) showed that increasing the emphasis factor from 1 to 10had a negligible effect on the model fit and only a small effect on ending biomass, thus the emphasis on theabsolute survey time series was set at 1 (Lowe and Fritz 1995).
13.5.2 Evaluation of Current Model
An evaluation of alternative models was undertaken in the 1999 assessment (Section 12.5.2 in Lowe andFritz, 1998). The 1998 baseline model configuration (described above in Section 13.5.1) denoted Model A,included fishery data from 1997 and 1998. Three alternative models were explored which analyzed:changing the starting year (Model B), estimating survey catchability of the absolute abundance time series(Model C), and differential natural mortality at age (Model D). A summary of the evaluation follows.
The estimation of survey catchability and natural mortality (Models C and D, respectively) had a significantimpact on ending biomass (Lowe and Fritz, 1998). The estimation of catchability in synthesis is problematicin that 1) it is highly confounded with selectivity, and 2) the estimation of catchability assumes equivalentstandard errors for the survey time series, an assumption which is not met. The estimation of naturalmortality in synthesis is also problematic due to the confounding of selectivity and natural mortality. Theseissues and the added uncertainty they present are currently being explored with alternative models.
Model B was selected as the final model configuration based on the assumptions that constant naturalmortality equal to 0.3 and absolute survey catchability of 1.0 are reasonable given the current difficultiesin estimating M and Q simultaneously with selectivity (Lowe and Fritz, 1998). Model B was updated in thecurrent assessment with 2000 fishery catch biomass and age composition.
21
13.6 MODEL RESULTS
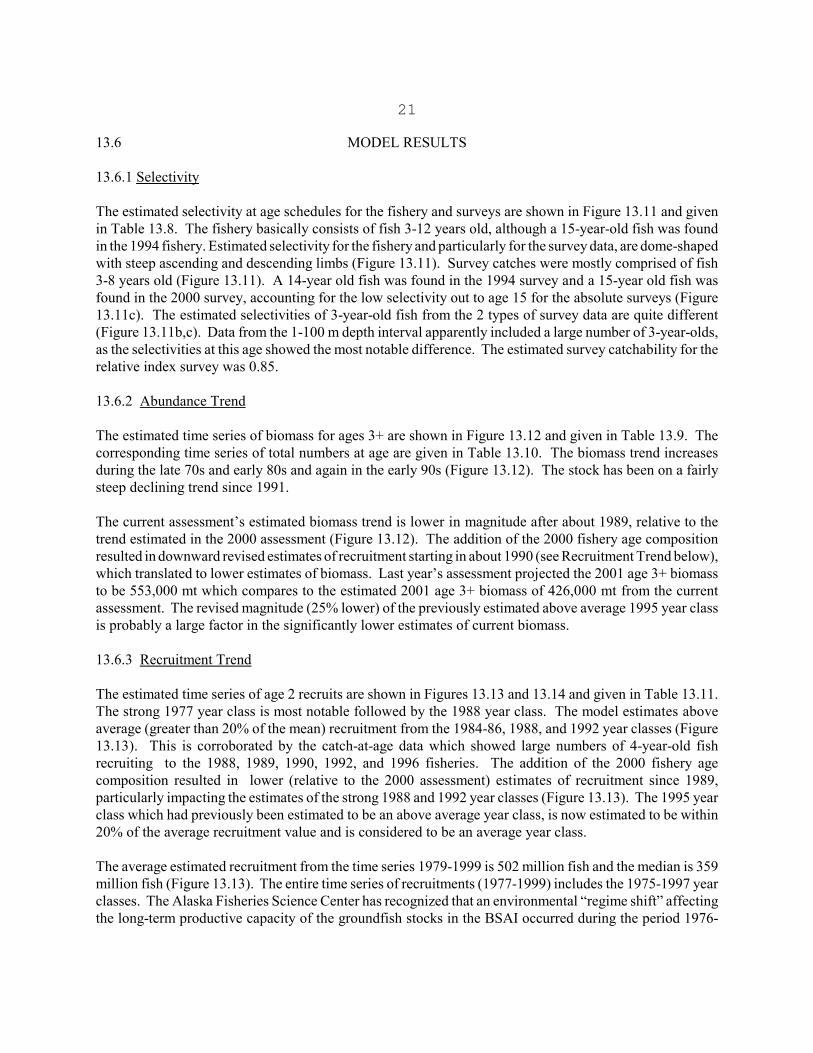
13.6.1 Selectivity
The estimated selectivity at age schedules for the fishery and surveys are shown in Figure 13.11 and givenin Table 13.8. The fishery basically consists of fish 3-12 years old, although a 15-year-old fish was foundin the 1994 fishery. Estimated selectivity for the fishery and particularly for the survey data, are dome-shapedwith steep ascending and descending limbs (Figure 13.11). Survey catches were mostly comprised of fish3-8 years old (Figure 13.11). A 14-year old fish was found in the 1994 survey and a 15-year old fish wasfound in the 2000 survey, accounting for the low selectivity out to age 15 for the absolute surveys (Figure13.11c). The estimated selectivities of 3-year-old fish from the 2 types of survey data are quite different(Figure 13.11b,c). Data from the 1-100 m depth interval apparently included a large number of 3-year-olds,as the selectivities at this age showed the most notable difference. The estimated survey catchability for therelative index survey was 0.85.
13.6.2 Abundance Trend
The estimated time series of biomass for ages 3+ are shown in Figure 13.12 and given in Table 13.9. Thecorresponding time series of total numbers at age are given in Table 13.10. The biomass trend increasesduring the late 70s and early 80s and again in the early 90s (Figure 13.12). The stock has been on a fairlysteep declining trend since 1991.
The current assessment’s estimated biomass trend is lower in magnitude after about 1989, relative to thetrend estimated in the 2000 assessment (Figure 13.12). The addition of the 2000 fishery age compositionresulted in downward revised estimates of recruitment starting in about 1990 (see Recruitment Trend below),which translated to lower estimates of biomass. Last year’s assessment projected the 2001 age 3+ biomassto be 553,000 mt which compares to the estimated 2001 age 3+ biomass of 426,000 mt from the currentassessment. The revised magnitude (25% lower) of the previously estimated above average 1995 year classis probably a large factor in the significantly lower estimates of current biomass.
13.6.3 Recruitment Trend
The estimated time series of age 2 recruits are shown in Figures 13.13 and 13.14 and given in Table 13.11.The strong 1977 year class is most notable followed by the 1988 year class. The model estimates aboveaverage (greater than 20% of the mean) recruitment from the 1984-86, 1988, and 1992 year classes (Figure13.13). This is corroborated by the catch-at-age data which showed large numbers of 4-year-old fishrecruiting to the 1988, 1989, 1990, 1992, and 1996 fisheries. The addition of the 2000 fishery agecomposition resulted in lower (relative to the 2000 assessment) estimates of recruitment since 1989,particularly impacting the estimates of the strong 1988 and 1992 year classes (Figure 13.13). The 1995 yearclass which had previously been estimated to be an above average year class, is now estimated to be within20% of the average recruitment value and is considered to be an average year class.
The average estimated recruitment from the time series 1979-1999 is 502 million fish and the median is 359million fish (Figure 13.13). The entire time series of recruitments (1977-1999) includes the 1975-1997 yearclasses. The Alaska Fisheries Science Center has recognized that an environmental “regime shift” affectingthe long-term productive capacity of the groundfish stocks in the BSAI occurred during the period 1976-

22
1977. Thus, the average recruitment value presented in the assessment is based on year classes spawned after1976 (1977-1997 year classes) for the years 1979-1999.
Projections of biomass are based on estimated recruitments from 1979-1999 using a stochastic projectionmodel described below.
13.6.4 Trend in Exploitation
The estimated time series of fishing mortalities on fully selected age groups and the catch-to-biomass (age3+) ratios are given in Table 13.12.
13.6.5 Model Fit
Figure 13.15 compares the observed (a) relative and (b) absolute abundance values from the surveys withthe model estimates of survey abundance values (observed versus expected). Stock synthesis applies theestimated survey selectivities to the population estimates to provide the expected values of survey abundance.The population estimates are also depicted for comparison to absolute estimates of biomass from the surveys(Figure 13.15b). The 1986, 1991, 1994, 1997, and 2000 observed trawl survey biomass estimates represented75, 60, 61, 54, and 105% respectively, of the population estimates.
The model fit the 1986 and 1991 survey estimates poorly compared to the more recent 1994 and 1997surveys (Figure 13.15b). The catch-at-age data do not show another strong year class following the 1977year class that would allow the model to achieve a better fit to the 1986 survey estimate. From 1986 to 1991,the population is estimated to have increased at a greater rate than shown by the surveys (Figure 13.15b).This lack of fit is confounded by the large coefficient of variation associated with the 1986 biomass estimate.The large decrease in biomass from the 1994 to 1997 surveys appears to be consistent with recruitmentpatterns, while the large increase in biomass from the 1997 to 2000 surveys appears to be inconsistent withthe recent recruitment patterns. The magnitude of the 1995 year class was revised downward with theaddition of the 2000 fishery age composition. This year class now appears to be about average in size. Thelack of a recent strong year class is inconsistent with the large increase in survey biomass observed in 2000.
The fits to the fishery and survey age compositions are depicted in Figure 13.16, and show relatively goodfits each year. It is interesting to note that the 2000 survey saw a much larger than expected number of 2-yearold fish (1998 year class) for which the selectivity is estimated to be very low (0.14), and a much poorer thanexpected showing of 3-year old (1997 year class) fish which are estimated to be fully selected (Figure13.16c).
13.7 HARVEST ALTERNATIVES AND PROJECTIONS
13.7.1 Reference Fishing Mortality Rates and Yields
The overfishing and maximum allowable ABC fishing mortality rates (FOFL and max FABC, respectively) aregiven in terms of percentages of unfished female spawning biomass per recruit (FSPR%), on fully selected agegroups. The associated long-term average female spawner biomass that would be expected under averageestimated recruitment from 1979-1999 (502 million recruits) and F = F40%, denoted B40%, is estimated to be124,500 mt. The projected 2002 female spawning biomass (SB02) under the recommended ABC harveststrategy is 118,000 mt. This differs from the projected 2002 female spawning biomass (SB01) under the

23
maximum allowable ABC harvest strategy (max FABC) of 113,100 mt. The reason for the difference inprojected 2002 female spawning biomass depending on the harvest strategy, is that spawning biomass isestimated at peak spawning (August), thus the projection incorporates 7 months of the specified fishingmortality rate. Under either harvest strategy, projected 2002 female spawning biomass is below B40% . Atkamackerel are now in Tier 3b for the first time, and the FOFL and the max FABC are adjusted F35% and F40% rates,denoted F35%adj and F40% adj, respectively.
If a projection is made under the max FABC strategy, FOFL= F35% adj = 0.37, and max FABC = F40% adj = 0.32.Projected 2002 yields associated with FOFL adj and max FABC adj are 82,300 and 71,300 mt, respectively.
Tier 3b
HarvestStrategy
FSPR% FishingMortality
Rate
2001ProjectedYield (mt)
FOFL F35% adj 0.37 82,300
max FABC F40% adj 0.32 71,300
The harvest strategy used by the SSC to set the 1999, 2000, and 2001 Atka mackerel ABCs is given belowwith the projected 2002 yield:
Tier 3b
HarvestStrategy
FSPR% FishingMortality
Rate
2001ProjectedYield (mt)
FABC F52% 0.21 49,000
13.7.2 ABC Considerations
Several observations and characterizations of uncertainty in the Atka mackerel assessment have been notedfor ABC considerations since 1997. These concerns are repeated below:
1) Stock size as estimated by the age structured model has declined approximately 63% since 1991;
2) Trawl survey estimates of biomass are highly variable; the 1997 Aleutian trawl survey biomassestimate was about 50% lower than the 1994 survey estimate, and the most recent 2000 surveyestimate showed a 39% increase that could not be fit by the stock assessment model.
3) Under an F40% adj harvest strategy, 2002 female spawning biomass is projected to be below B40% (andwithin 4% of B35%) and remain below B40% until 2005.

24
The last concern stems from the current assessment:
4) The hindcast of biomass from the current assessment yielded lower estimates of current biomass thanthe previous assessments due to lower estimates of recruitment from recent strong year classes. Inparticular, the 1995 year class which had previously been estimated to be an above average yearclass, is now estimated to be within 20% of the average recruitment value and is considered to bean average year class. Although there were large numbers of 2 year old fish of the 1998 year classencountered by the 2000 survey, it is still too early to determine the magnitude of this year class andan average size 1998 year class was assumed in the model for the biomass projection.
The 2002 yield associated with the maximum allowable F40% adj rate is 71,300 mt, a 3% increase over the2000 TAC (based on an F52% rate). This does not seem prudent given the concerns listed above, thedifficulties in characterizing the true range of uncertainty in the Atka mackerel assessment, the downwardrevision in the magnitude of recent year class strengths, and the unknown impacts of future harvests as thefishery shifts to new areas. We recommend a 2002 ABC of 49,000 mt based on the F52% harvest strategyused since 1999 to set ABC. Short-term projections under an average fishing mortality rate equal to F52%= 0.21 show that female spawning biomass will increase above the estimated B40% spawning biomass by2003.
13.7.3 Projections
A standard set of projections is required for each stock managed under Tiers 1, 2, or 3 of Amendment 56.This set of projections encompasses seven harvest scenarios designed to satisfy the requirements ofAmendment 56, the National Environmental Protection Act, and the Magnuson-Stevens Fishery Conservationand Management Act (MSFCMA).
For each scenario, the projections begin with the vector of 2001 numbers at age estimated in the assessment.This vector is then projected forward to the beginning of 2002 using constant natural mortality of 0.3, andthe schedules of selectivity estimated in the assessment. In each subsequent year, the fishing mortality rateis prescribed on the basis of the spawning biomass in that year and the respective harvest scenario. In eachyear, recruitment is drawn from an inverse Gaussian distribution whose parameters consist of maximumlikelihood estimates determined from recruitments estimated for 1979-1999 in the assessment. Spawningbiomass is computed in each year based on the time of peak spawning (August) and the maturity and weightschedules described in the assessment. Total catch is assumed to equal the catch associated with therespective harvest scenario in all years. This projection scheme is run 1000 times to obtain distributions ofpossible future stock sizes, fishing mortality rates, and catches.
Five of the seven standard scenarios will be used in an Environmental Assessment prepared in conjunctionwith the final SAFE. These five scenarios, which are designed to provide a range of harvest alternatives thatare likely to bracket the final TAC for 2002, are as follow (“max FABC” refers to the maximum permissiblevalue of FABC under Amendment 56):
Scenario 1: In all future years, F is set equal to max FABC.

25
Scenario 2: In all future years, F is set equal to a constant fraction of max FABC, where this fractionis equal to the ratio of the FABC value for 2002 recommended in the assessment to the max FABC for2002.
Scenario 3: In all future years, F is set equal to 50% of max FABC.
Scenario 4: In all future years, F is set equal to the 1996-2000 average F.
Scenario 5: In all future years, F is set equal to zero.
Two other scenarios are needed to satisfy the MSFCMA’s requirement to determine whether a stock iscurrently in an overfished condition or is approaching an overfished condition. These two scenarios are asfollow (for Tier 3 stocks, the MSY level is defined as B35%):
Scenario 6: In all future years, F is set equal to FOFL. (Rationale: This scenario determines whethera stock is overfished. If the stock is expected to be above ½ of its MSY level in 2002 and above itsMSY level in 2012 under this scenario, then the stock is not overfished.)
Scenario 7: In 2002 and 2003, F is set equal to max FABC, and in all subsequent years, F is set equalto FOFL. (Rationale: This scenario determines whether a stock is approaching an overfishedcondition. If the stock is expected to be above its MSY level in 2014 under this scenario, then thestock is not approaching an overfished condition.)
The projected biomass of ages 3+ at the beginning of 2002 is 439,700 mt. The projected yields, femalespawning biomass, and associated fishing mortality rates for the seven harvest strategies are shown in Table13.13. Under a harvest strategy of F40% adj (Scenario 1), female spawning biomass is projected to be belowB40% in 2002, and remain so until 2005. Female spawning biomass is also projected to drop below B40% whenfishing at FOFL (Scenarios 6 & 7, Table 13.13). The other harvest strategies project female spawning biomassto increase above B40% by 2003. It should be noted that in the projections, the fishing mortality rates areprescribed on the basis of the harvest scenario and the spawning biomass in each year. Thus, fishingmortality rates may not be constant within the projection if spawning biomass drops below B40% in any run.Figure 13.17 illustrates 5-year projections for F = F40% adj (Scenario 1), F = FABC (Scenario 2), and F = FOFL= F35% adj (Scenario 6). The associated long-term average female spawner biomass that would be expectedunder average estimated recruitment from 1979-1999 (502 million recruits) and F = F35% , denoted B35%, isestimated to be 109,000 mt. This value (B35%), which is used in the status determination criteria (Section13.7.4), is provided as a reference level along with B40% (Figure 13.17).

26
13.7.4 ABC Recommendation, Overfishing Level, and Status Determination
Short-term stochastic projections under an average fishing mortality rate of FABC = 0.21, result in femalespawning biomass increasing above B40% by 2003, compared to harvesting at F40% adj in which projectedfemale spawning biomass remains below B40% until 2005. Based on a comparison of the F40% adj strategyversus an F = 0.21 in the projections, and given the ABC considerations described above, we recommendthat FABC = 0.21. The 2002 projections assuming fishing at the recommended FABC places Atka mackerel inTier 3b. The associated 2002 yield with a fishing mortality rate of 0.21 is 49,000 mt, which is our 2002ABC recommendation for BSAI Atka mackerel.
The F35% adj overfishing level is 82,300 mt. The estimated B35% female spawner biomass is 109,000 mt.Female spawning biomass for 2002 is projected to be above B35% thus, the BSAI Atka mackerel stock isdetermined to be above its minimum stock size threshold (MSST) and is not overfished. Female spawningbiomass for 2014 is projected to be above B35% thus the BSAI Atka mackerel stock is not expected to fallbelow its MSST in two years and is not approaching an overfished condition.
13.7.5 Apportionment of Catch
Amendment 28 of the Bering Sea/Aleutian Islands Fishery Management Plan divided the Aleutian subareainto 3 districts at 177� E and 177� W longitude, providing the mechanism to apportion the Aleutian Atkamackerel TACs. The Council used the average of the 1994 and 1997 survey biomass distributions of Atkamackerel to apportion the 1999 and 2000 ABCs, and a new 4-survey weighted average to apportion the 2001ABC. The rationale for the new weighting scheme is given below.
The triennial Aleutian trawl survey occurs every three years in the summer months. The historical patternor rather lack of pattern in the Atka mackerel biomass distribution likely indicates a high degree ofobservation and process error. The sensitivity of the 2000 biomass distribution to an extremely large declinein biomass in the Eastern Aleutians (541) is also a concern.

27
0%
20%
40%
60%
80%
100%
1991 1994 1997 2000Survey Year
% B
iom
ass
Dis
trib
utio
n
541542543
1991 1994 1997 2000
2000 TACApportionment(ave. 1994 &
1997)
4 surveyunweighted
average
4 surveyweightedaverage
543 49.0% 51.4% 36.4% 35.2% 42% 43.0% 40.2%542 40.3% 14.0% 51.0% 64.6% 35% 42.5% 48.5%541 10.7% 34.6% 12.3% 0.2% 23% 14.5% 11.2%
Weights 8 12 18 27
As a more robust way of apportioning biomass, we suggested using a longer term weighted average. A four-survey average (1991, 1994, 1997, and 2000) was suggested to capture changes in the average biomassdistribution. A weighted average with the highest weights given to the most recent survey year was alsorecommended to adapt to current information and the possibility of autocorrelation, that is, the tendency forthe true biomass distribution to be similar from one year to the next
Following the apportionment method used for GOA rockfish, we assumed that observation error contributedat least 2/3 of the total variability in predicting the distribution of biomass; (the survey variability for Atkamackerel is similar to the level of survey variability estimated for most rockfish, Appendix 2 in Lowe et al.2000), thus the weight of a prior survey should be 2/3 the weight of the subsequent survey. This resulted inweights of 8:12:18:27 for the 1991, 1994, 1997, and 2000 surveys, respectively.

28
ABC Apportionment of 49,000 mt4 survey
weighted1
average
543 19,700 23,800 5,500 49,000
542541
Total1The weighting scheme is based on theassumption that survey error (measurementerror) contributes 2/3 of the totalvariability in predicting biomass distribution,and the weight of a prior survey should be 2/3the weight of the subsequent survey.
The apportionment based on the 4 survey weighted average is the recommendation for the 2002 ABC: 19,700mt for 543, 23,800 mt for 542, and 5,500 mt for 541.

29
13.8 SUMMARY
M = 0.30
2001: FABC= 0.23 yield = 69,300 mt
2002 (Tier 3b) Maximum permissible ABC F40% adj = 0.32 yield = 71,300 mtRecommended ABC: FABC%
= 0.21 yield = 49,000 mtOverfishing FOFL : F35% adj = 0.37 yield = 82,300 mt
B40% female spawning biomass = 124,500 mtB35% female spawning biomass = 109,000 mt
Projected 2002 3+ biomass = 439,700 mtProjected 2002 female spawning biomass = 118,000 mt
Note: The F values are the full-selection fishing mortality rates.
13.9 ACKNOWLEDGMENTS
We thank the AFSC survey personnel for the collection of data and providing the biomass estimates. Inparticular we acknowledge our co-author Skip Zenger. We also thank the staff of the AFSC Age and GrowthUnit for the ageing of otoliths used to determine the age compositions in the assessment.
30
13.10 REFERENCES
Alverson, D.L., and M.J. Carney. 1975. A graphic review of the growth and decay of population cohorts.J. Cons. Int. Explor. Mer 36:133-143.
Anderl, D.M., A. Nishimura, and S.A. Lowe. 1996. Is the first annulus on the otolith of the Atka mackerel,Pleurogrammus monopterygius, missing?. Fish. Bull. 94:163-169.
Byrd, G. V., J. C. Williams, and R. Walder. 1992. Status and biology of the tufted puffin in the AleutianIslands, Alaska, after a ban on salmon driftnets. U. S. Fish and Wildlife Service, Alaska MaritimeNational Wildlife Refuge, Aleutian Islands Unit, PSC 486, Box 5251, FPO AP 96506-5251, Adak,Alaska.
Charnov, E.L. 1993. Life history invariants some explorations of symmetry in evolutionary ecology. Oxford University Press Inc., New York. 167p.
Deriso, R.B., T.J. Quinn II, and P.R. Neal. 1985. Catch-age analysis with auxiliary information. Can. J.Fish. and Aquat. Sci. 42:815-824.
Fournier, D., and C. P. Archibald. 1982. A general theory for analyzing catch at age data. Can. J. Fish.
Aquat. Sci. 39:1195-1207.
Fritz, L. W. 1993. Trawl locations of walleye pollock and Atka mackerel fisheries in the Bering Sea,Aleutian Islands, and Gulf of Alaska from 1977-1992. AFSC Processed Report 93-08, NMFS, 7600Sand Point Way, NE, Seattle, WA 98115. 162 pp.
Fritz, L.W., and S.A. Lowe. 1998. Seasonal distributions of Atka mackerel (Pleurogrammus monopterygius)in commercially-fished areas of the Aleutian Islands and Gulf of Alaska. U.S. Dep. Commer.,NOAA Tech. Memo. NMFS-AFSC-92. 29p.
Gorbunova, N.N. 1962. Razmnozhenie i razvite ryb semeistva terpugovykh (Hexagrammidae) (Spawningand development of greenlings (family Hexagrammidae)). Tr. Inst. Okeanol., Akad. Nauk SSSR59:118-182. In Russian. (Trans. by Isr. Program Sci. Trans., 1970, p. 121-185 in T.S. Rass (editor),Greenlings: taxonomy, biology, interoceanic transplantation; available from the U.S. Dep. Commer.,Natl. Tech. Inf. Serv., Springfield, VA., as TT 69-55097).
Hoenig, J.M. 1983. Empirical use of longevity data to estimate mortality rates. Fish. Bull. 82: 898-903. Kajimura, H. 1984. Opportunistic feeding of the northern fur seal Callorhinus ursinus, in the eastern north
Pacific Ocean and eastern Bering Sea. NOAA Tech. Rept. NMFS SSRF-779. USDOC, NOAA,NMFS, 49 pp.
Kimura, D.K. 1989. Variability in estimating catch-in-numbers-at-age and its impact on cohort analysis.P.57-66, In Effects of ocean variability on recruitment and evaluation of parameters used in stockassessment models, R.J. Beamish and G.A. McFarlane (editors), Can. Spec. Pub. Fish. Aquat. 108.
Kimura, D.K., and S. Chikuni. 1987. Mixtures of empirical distributions: an iterative application of the
age-length key. Biometrics 43: 23-35.

31
Kimura D.K. and L.L. Ronholt. 1988. In R.G. Bakkala (editor), Condition of groundfish resources of the
eastern Bering Sea and Aleutian Islands region in 1987, p. 143-171. U.S. Dep. Commer., NOAATech. Memo. NMFS F/NWC-139.
Lee, J.U. 1985. Studies on the fishery biology of the Atka mackerel Pleurogrammus monopterygius (Pallas)in the north Pacific Ocean. Bull. Fish. Res. Dev. Agency, 34, pp.65-125.
Levada, T.P. 1979. Comparative morphological study of Atka mackerel. Pac. Sci. Res. Inst. Fish. Oceanogr.(TINRO), Vladivostok, U.S.S.R., Unpublished manuscript.
Livingston, P.A., M-S. Yang and G.M. Lang. Unpublished manuscript. Comparison of the role of walleyepollock in groundfish food webs of the eastern Bering Sea, Aleutian Islands, and Gulf of Alaska.NMFS. Alaska Fisheries Science Center, 7600 Sand Point Way NE., Seattle, WA 98115.
Lowe, S.A. 1992. Atka mackerel. In Stock Assessment and Fishery Evaluation Report for the GroundfishResources of the Bering Sea/Aleutian Islands Regions as Projected for 1993. North Pacific FisheriesManagement Council, P.O. Box 103136, Anchorage, AK.
Lowe, S.A. and L.W. Fritz. 1995. Atka mackerel. In Stock Assessment and Fishery Evaluation Report forthe Groundfish Resources of the Bering Sea/Aleutian Islands Regions as Projected for 1997. NorthPacific Fisheries Management Council, P.O. Box 103136, Anchorage, AK.
Lowe, S.A. and L.W. Fritz. 1997. Atka mackerel. In Stock Assessment and Fishery Evaluation Report forthe Groundfish Resources of the Bering Sea/Aleutian Islands Regions as Projected for 1998. NorthPacific Fisheries Management Council, P.O. Box 103136, Anchorage, AK.
Lowe, S.A. and L.W. Fritz. 1998. Atka mackerel. In Stock Assessment and Fishery Evaluation Report forthe Groundfish Resources of the Bering Sea/Aleutian Islands Regions as Projected for 1999. NorthPacific Fisheries Management Council, P.O. Box 103136, Anchorage, AK.
Lowe, S.A., L.W. Fritz and H. Zenger. 2000. Atka mackerel. In Stock Assessment and Fishery EvaluationReport for the Groundfish Resources of the Bering Sea/Aleutian Islands Regions. North PacificFisheries Management Council, P.O. Box 103136, Anchorage, AK.
Lowe, S.A. and G.G. Thompson. 1993. Exploitation strategies for the Atka mackerel resource of theAleutian Islands. In Proceedings of the International Symposium on Management Strategies forExploited Fish Populations, Alaska Sea Grant College Program, AK-SG-93-02, 1993.
Lowe, S.A., D.M. Van Doornik, and G.A. Winans. 1998. Geographic variation in genetic and growthpatterns of Atka mackerel, Pleurogrammus monopterygius (Hexagrammidae), in the Aleutianarchipelago. Fish. Bull. U.S. 96:502-515.
McDermott, S.F. and S.A. Lowe. 1997. The reproductive cycle of Atka mackerel, Pleurogrammus monopterygius, in Alaska waters. Fish. Bull. U.S. 95:231-333.

32
Methot, R.D. 1989. Synthetic estimates of historical abundance and mortality for northern anchovy. In E.Edwards and B. Megrey (eds.) Mathematical analysis of fish stock dynamics: reviews and currentapplications. Amer. Fish. Soc. Symposium 6:66-82.
Methot, R.D. 1990. Synthesis model: An adaptable framework for analysis of diverse stock assessmentdata. INPFC Bull. 50:259-277.
Morris, B.F. 1981. An assessment of the living marine resources of the central Bering Sea and potentialresource use conflicts between commercial fisheries and Petroleum development in the NavarinBasin, Proposed sale No. 83. Anchorage, AK: USDOC, NOAA, NMFS, Environmental AssessmentDivision.
Morris, B.F., M.S. Alton, and H.W. Braham. 1983. Living marine resources of the Gulf of Alaska: Aresource assessment for the Gulf of Alaska/Cook Inlet proposed oil and gas lease sale no. 88.Seattle, WA: USDOC, NOAA, NMFS.
Musienko, L.N. 1970. Razmnozheine i razvitie ryb Beringova morya (Reproduction and development ofBering Sea fishes). Tr. Vses. Nauchno-issled. Inst. Morsk. Rybn. Koz. Okeanogr. 70: 161-224 InP.A. Moiseev (ed.), Soviet fisheries investigations in the northeastern Pacific, Pt. 5, Avail. Natl.Tech. Info. Serv., Springfield, VA as TT 74-50127.
NMFS. 1995. Status review of the Unites States Steller sea lion (Eumetopias jubatus) population. NationalMarine Mammal Laboratory, Alaska Fishery Science Center, National Marine Fisheries Service,7600 Sand Point Way, NE, Seattle, WA 98115.
Pauly, D. On the interrelationships between natural mortality, growth parameters, and mean environmentaltemperature in 175 fish stocks. J. Cons. Int. Explor. Mer 39(2):175-192.
Rikhter, V.A., and V.N. Efanov. 1976. On one of the approaches to estimation of natural mortality of fishpopulations. ICNAF Res. Doc. 76/VI/8. Serial N. 3777. 13p.
Roff, D.A. 1986. The evolution of life history parameters in teleosts. Can. J. Fish. Aquat. Sci. 41:989-1000.
Sinclair, E.H. and T.K. Zeppelin. In press. Seasonal and spatial differences in diet in the western stock ofSteller Sea Lions (Eumetopias jubatus). Journal of Mammology.
Thompson, G.G. 1994. Confounding of gear selectivity and the natural mortality rate in cases where theformer is a nonmonotone function of age. Can. J. Fish. Aquat. Sci., (51):2654-2664.
Zolotov, O.G. 1993. Notes on the reproductive biology of Pleurogrammus monopterygius in Kamchatkanwaters. J. of Ichthy. 33(4), pp. 25-37.

33
Table 13.1. Atka mackerel catches (including discards) by region and corresponding Total AllowableCatches (TAC) set by the North Pacific Fishery Management Council from 1978 to thepresent. Catches are in mt.
Year
Eastern Bering Sea Aleutian Islands RegionEBS-AI
ForeignDomestic
Total ForeignDomestic
TotalJVP DAP JVP DAP Total TAC
1977 0 0 0 a 21,763 0 0 21,763 21,763 b1978 831 0 0 831 23,418 0 0 23,418 24,249 24,8001979 1,985 0 0 1,985 21,279 0 0 21,279 23,264 24,800
1980 4,690 265 0 4,955 15,533 0 0 15,533 20,488 24,8001981 3,027 0 0 3,027 15,028 1,633 0 16,661 19,688 24,8001982 282 46 0 328 7,117 12,429 0 19,546 19,874 24,8001983 140 1 0 141 1,074 10,511 0 11,585 11,726 24,8001984 41 16 0 57 71 35,927 0 35,998 36,055 23,130
1985 1 3 0 4 0 37,856 0 37,856 37,860 37,7001986 6 6 0 12 0 31,978 0 31,978 31,990 30,8001987 0 12 0 12 0 30,049 0 30,049 30,061 30,8001988 0 43 385 428 0 19,577 2,080 21,656 22,084 21,0001989 0 56 3,070 3,126 0 0 14,868 14,868 17,994 20,285
1990 0 0 480 480 0 0 21,725 21,725 22,205 21,0001991 0 0 2,596 2,596 0 0 24,144 24,144 26,740 24,0001992 0 0 2,610 2,610 0 0 47,425 47,425 50,035 43,0001993 0 0 213 213 0 0 65,524 65,524 65,737 64,0001994 0 0 189 189 0 0 69,401 69,401 69,590 68,000
1995 0 0 a a 0 0 81,554 81,554 81,554 80,0001996 0 0 a a 0 0 103,943 103,943 103,943 106,1571997 0 0 a a 0 0 65,845 65,845 65,845 66,7001998 0 0 a a 0 0 57,177 57,177 57,177 64,3001999 0 0 a a 0 0 53,643 53,643 53,643 66,400
2000 0 0 a a 0 0 42,440 42,440 42,440 70,8002001c 0 0 a a a 0 55,961 55,961 55,961 69,300
Catch table footnotes:a) Eastern Bering Sea catches included with Aleutian Islands.b) Atka mackerel was not a reported species group until 1978 c) 2001 data as of 10/4/01 from NMFS Alaska Regional Office Home Page.
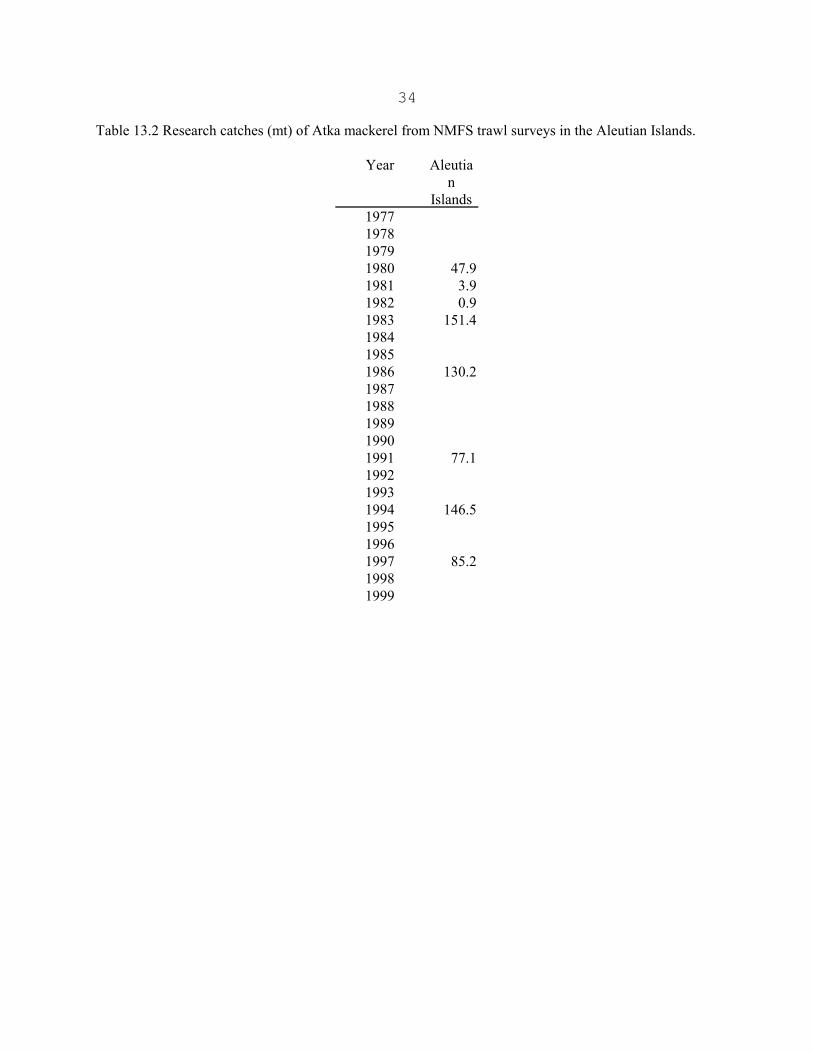
34
Table 13.2 Research catches (mt) of Atka mackerel from NMFS trawl surveys in the Aleutian Islands.
Year Aleutian
Islands1977197819791980 47.91981 3.91982 0.91983 151.4198419851986 130.219871988198919901991 77.1199219931994 146.5199519961997 85.219981999
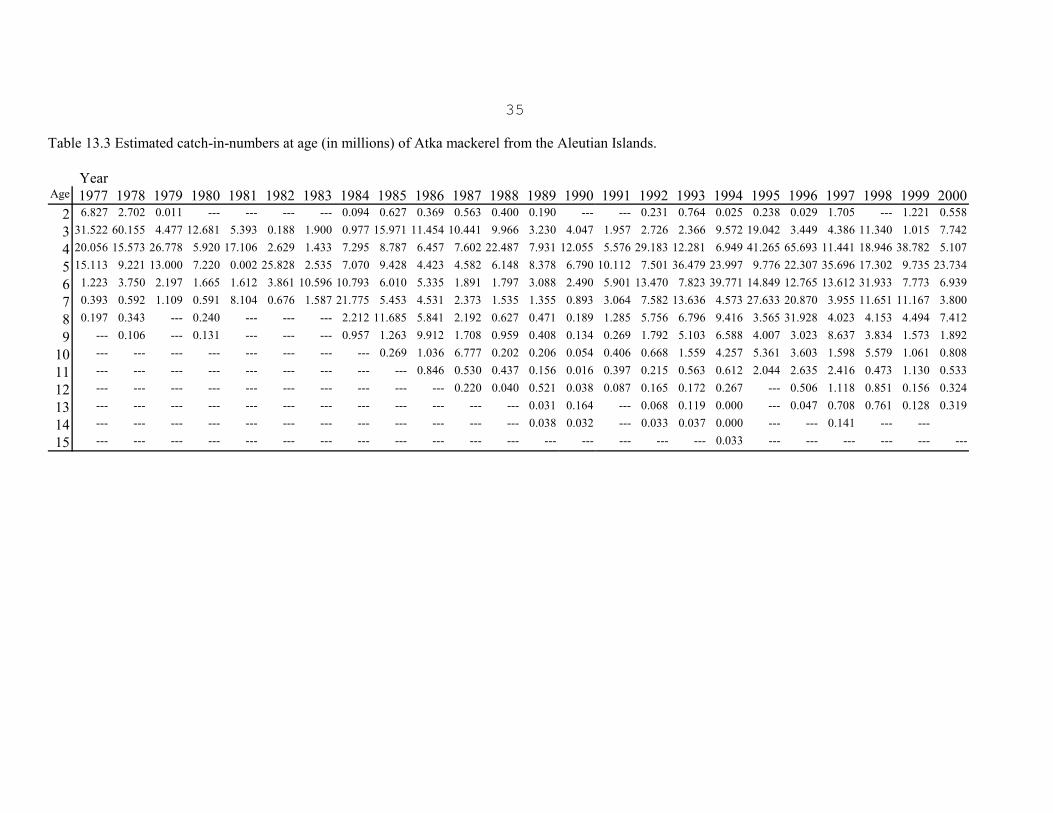
35
Table 13.3 Estimated catch-in-numbers at age (in millions) of Atka mackerel from the Aleutian Islands.
YearAge 1977 1978 1979 1980 1981 1982 1983 1984 1985 1986 1987 1988 1989 1990 1991 1992 1993 1994 1995 1996 1997 1998 1999 2000
2 6.827 2.702 0.011 --- --- --- --- 0.094 0.627 0.369 0.563 0.400 0.190 --- --- 0.231 0.764 0.025 0.238 0.029 1.705 --- 1.221 0.558
3 31.522 60.155 4.477 12.681 5.393 0.188 1.900 0.977 15.971 11.454 10.441 9.966 3.230 4.047 1.957 2.726 2.366 9.572 19.042 3.449 4.386 11.340 1.015 7.742
4 20.056 15.573 26.778 5.920 17.106 2.629 1.433 7.295 8.787 6.457 7.602 22.487 7.931 12.055 5.576 29.183 12.281 6.949 41.265 65.693 11.441 18.946 38.782 5.107
5 15.113 9.221 13.000 7.220 0.002 25.828 2.535 7.070 9.428 4.423 4.582 6.148 8.378 6.790 10.112 7.501 36.479 23.997 9.776 22.307 35.696 17.302 9.735 23.734
6 1.223 3.750 2.197 1.665 1.612 3.861 10.596 10.793 6.010 5.335 1.891 1.797 3.088 2.490 5.901 13.470 7.823 39.771 14.849 12.765 13.612 31.933 7.773 6.939
7 0.393 0.592 1.109 0.591 8.104 0.676 1.587 21.775 5.453 4.531 2.373 1.535 1.355 0.893 3.064 7.582 13.636 4.573 27.633 20.870 3.955 11.651 11.167 3.800
8 0.197 0.343 --- 0.240 --- --- --- 2.212 11.685 5.841 2.192 0.627 0.471 0.189 1.285 5.756 6.796 9.416 3.565 31.928 4.023 4.153 4.494 7.412
9 --- 0.106 --- 0.131 --- --- --- 0.957 1.263 9.912 1.708 0.959 0.408 0.134 0.269 1.792 5.103 6.588 4.007 3.023 8.637 3.834 1.573 1.892
10 --- --- --- --- --- --- --- --- 0.269 1.036 6.777 0.202 0.206 0.054 0.406 0.668 1.559 4.257 5.361 3.603 1.598 5.579 1.061 0.808
11 --- --- --- --- --- --- --- --- --- 0.846 0.530 0.437 0.156 0.016 0.397 0.215 0.563 0.612 2.044 2.635 2.416 0.473 1.130 0.533
12 --- --- --- --- --- --- --- --- --- --- 0.220 0.040 0.521 0.038 0.087 0.165 0.172 0.267 --- 0.506 1.118 0.851 0.156 0.324
13 --- --- --- --- --- --- --- --- --- --- --- --- 0.031 0.164 --- 0.068 0.119 0.000 --- 0.047 0.708 0.761 0.128 0.319
14 --- --- --- --- --- --- --- --- --- --- --- --- 0.038 0.032 --- 0.033 0.037 0.000 --- --- 0.141 --- ---
15 --- --- --- --- --- --- --- --- --- --- --- --- --- --- --- --- --- 0.033 --- --- --- --- --- ---

36
Table 13.4 Atka mackerel estimated biomass in metric tons from the bottom trawl survey, by subregion,depth interval, and survey year, with the corresponding coefficients of variation.
Depth (m) Biomass (mt) Coefficient of variationArea 1980 1983 1986 1980 1983 1986Aleutian 1-100 48,306 140,552 450,869 1.00 0.26 0.76
101-200 144,431 162,399 93,501 0.46 0.25 0.30201-300 4,296 3,656 331 0.59 0.42 0.57301-500 483 172 16 0.77 1.00 0.87501-900 13 1 37 0.75 1.00 1.00Total 197,529 306,780 544,754 0.42 0.22 0.63
Southwest 1-100 95 15,321 418,271 0.00 0.61 0.82Aleutian 101-200 75,857 120,991 51,312 0.58 0.41 0.39
201-300 619 2,304 122 0.61 0.57 0.83301-500 105 172 14 0.77 1.00 0.98501-900 9 1 0 0.96 1.00 0.00Total 76,685 138,789 469,719 0.57 0.36 0.73
Southeast 1-100 0 65,814 33 0.00 0.00 0.42Aleutian 101-200 21,153 854 89 0.87 0.92 0.90
201-300 115 202 3 0.14 0.86 0.88301-500 16 0 0 0.00 0.00 0.00501-900 0 0 0 0.00 0.00 0.00Total 21,284 66,870 125 0.86 0.01 0.64
Northwest 1-100 0 41,235 32,564 0.00 0.72 0.65Aleutian 101-200 382 5,571 211 0.71 0.69 0.54
201-300 2,524 34 0 0.96 0.69 0.00301-500 0 0 0 0.00 0.00 0.00501-900 4 0 0 1.12 0.00 0.00Total 2,910 46,840 32,775 0.84 0.64 0.65
Northeast 1-100 48,211 18,182 1 1.00 1.00 1.00Aleutian 101-200 47,039 34,983 44,889 0.98 0.71 0.46
201-300 1,038 1,116 206 0.65 0.69 0.78301-500 362 0 2 1.00 0.00 0.71501-900 0 0 37 0.00 0.00 1.00Total 96,650 54,281 42,135 0.69 0.57 0.46
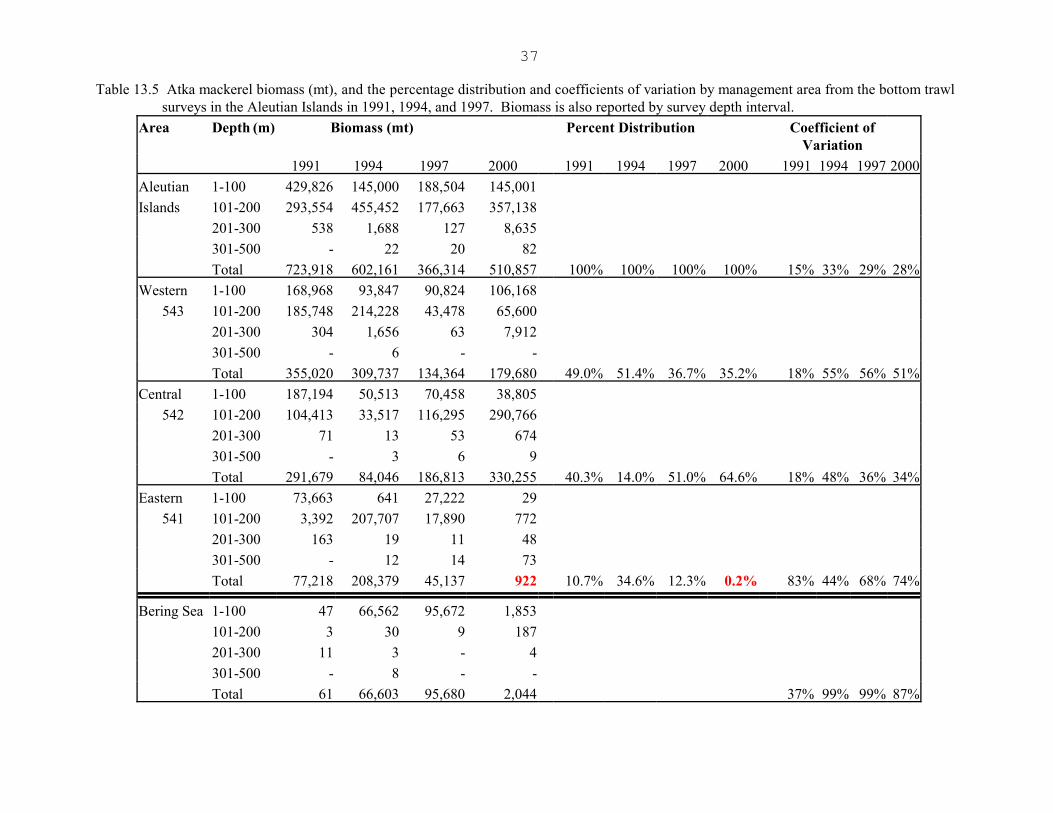
37
Table 13.5 Atka mackerel biomass (mt), and the percentage distribution and coefficients of variation by management area from the bottom trawl surveys in the Aleutian Islands in 1991, 1994, and 1997. Biomass is also reported by survey depth interval.
Area Depth (m) Biomass (mt) Percent Distribution Coefficient ofVariation
1991 1994 1997 2000 1991 1994 1997 2000 1991 1994 1997 2000Aleutian 1-100 429,826 145,000 188,504 145,001Islands 101-200 293,554 455,452 177,663 357,138
201-300 538 1,688 127 8,635301-500 - 22 20 82Total 723,918 602,161 366,314 510,857 100% 100% 100% 100% 15% 33% 29% 28%
Western 1-100 168,968 93,847 90,824 106,168543 101-200 185,748 214,228 43,478 65,600
201-300 304 1,656 63 7,912301-500 - 6 - -Total 355,020 309,737 134,364 179,680 49.0% 51.4% 36.7% 35.2% 18% 55% 56% 51%
Central 1-100 187,194 50,513 70,458 38,805542 101-200 104,413 33,517 116,295 290,766
201-300 71 13 53 674301-500 - 3 6 9Total 291,679 84,046 186,813 330,255 40.3% 14.0% 51.0% 64.6% 18% 48% 36% 34%
Eastern 1-100 73,663 641 27,222 29541 101-200 3,392 207,707 17,890 772
201-300 163 19 11 48301-500 - 12 14 73Total 77,218 208,379 45,137 922 10.7% 34.6% 12.3% 0.2% 83% 44% 68% 74%
Bering Sea 1-100 47 66,562 95,672 1,853101-200 3 30 9 187201-300 11 3 - 4301-500 - 8 - -Total 61 66,603 95,680 2,044 37% 99% 99% 87%

38
Table 13.6 Mean weight-at-age values (kg) for Atka mackerel from the Aleutian trawl surveys and thecommercial fishery. The survey weight-at-age vector was derived from the 1986, 1991, and1994 weight-at-age data; the fishery weight-at-age data was derived from fishery weight-at-age data from 1990 to 1996.
Age Survey Fishery
23456789
101112131415
0.1840.3980.5490.6560.7320.7850.8230.8500.8690.8820.8920.8990.9030.907
0.1280.4210.6600.7560.7940.8100.8160.8180.8190.8200.8200.8200.8200.820

39
Table 13.7 Schedules of age and length specific maturity of Atka mackerel from McDermott and Lowe (1997) by Aleutian Islands subareas. Eastern - 541, Central - 542, and Western - 543.
Proportion mature
ProportionLength(cm)
541 542 543 Age mature
25 0.00 0.00 0.00 1 0.0026 0.00 0.00 0.00 2 0.0427 0.00 0.01 0.01 3 0.2228 0.00 0.02 0.02 4 0.6929 0.01 0.04 0.04 5 0.9430 0.01 0.07 0.07 6 0.9931 0.03 0.14 0.13 7 1.0032 0.06 0.25 0.24 8 1.0033 0.11 0.40 0.39 9 1.0034 0.20 0.58 0.56 10 1.0035 0.34 0.73 0.7236 0.51 0.85 0.8437 0.68 0.92 0.9238 0.81 0.96 0.9639 0.90 0.98 0.9840 0.95 0.99 0.9941 0.97 0.99 0.9942 0.99 1.00 1.0043 0.99 1.00 1.0044 1.00 1.00 1.0045 1.00 1.00 1.0046 1.00 1.00 1.0047 1.00 1.00 1.0048 1.00 1.00 1.0049 1.00 1.00 1.0050 1.00 1.00 1.00

40
Table 13.8 Atka mackerel age specific selectivities (percent) for fishery and survey data as estimated by stock synthesis.
Age
2 3 4 5 6 7 8 9 10 11 12 13 14 15
Fishery (1977-83) 2 31 88 97 100 22 22 22 22 22 22 22 22 22
Fishery (1984-98) 2 18 90 97 100 99 86 74 62 49 37 24 12 0
Survey (indices) 1 16 72 97 100 99 66 3 0 0 0 0 0 0
Survey (absolute) 14 100 100 99 99 99 99 37 28 28 28 28 28 28

41
Table 13.9 Estimated time series of Atka mackerel female spawning biomass (1000s mt) and age 3+ biomass (1000s mt) as estimated by stock synthesis in the current assessment. Estimated age 3+ biomass from last year’s assessments is given for comparison.
Current Assessment
Last Year’sAssessment
FemaleSpawning
Age 3+Biomass
Age 3+Biomass
Year Biomass1977 61.0 206.9 213.01978 73.3 355.7 366.71979 108.6 365.5 378.0
1980 158.0 790.6 816.11981 244.3 810.8 837.31982 270.9 754.0 779.21983 251.4 690.6 714.11984 219.9 612.2 634.2
1985 187.5 555.7 577.41986 173.5 560.7 584.91987 188.5 705.8 739.61988 232.6 809.2 850.21989 279.1 957.3 1011.3
1990 315.0 934.0 988.21991 332.9 1139.7 1214.81992 356.8 1081.0 1157.31993 333.2 928.9 999.71994 282.2 842.3 917.0
1995 251.2 870.2 958.51996 232.0 730.2 815.51997 196.6 578.7 662.01998 168.8 584.1 685.81999 157.4 473.6 569.6
2000 135.2 407.0 549.22001 116.4 425.9

42
Table 13.10 Atka mackerel numbers at age as estimated by stock synthesis (millions). Zero values denote less than 1,000 fish.
AgeYear 2 3 4 5 6 7 8 9 10 11 12 13 14 15
77 680.8 152.0 46.5 30.5 0.0 6.0 0.0 0.0 0.0 0.0 0.0 0.0 0.0 106.078 199.8 501.3 102.6 26.5 16.9 0.0 4.2 0.0 0.0 0.0 0.0 0.0 0.0 73.479 1666.5 147.5 352.2 65.5 16.6 10.6 0.0 3.0 0.0 0.0 0.0 0.0 0.0 52.380 279.1 1232.3 106.2 240.5 44.3 11.2 7.7 0.0 2.1 0.0 0.0 0.0 0.0 37.981 217.3 206.6 897.6 75.0 169.1 31.1 8.2 5.6 0.0 1.6 0.0 0.0 0.0 27.782 259.2 160.8 151.6 647.3 53.9 121.5 22.9 6.0 4.1 0.0 1.2 0.0 0.0 20.483 177.4 191.9 117.9 108.8 463.3 38.6 89.2 16.8 4.4 3.0 0.0 0.8 0.0 15.084 300.9 131.4 141.1 85.5 78.8 335.1 28.4 65.8 12.4 3.3 2.2 0.0 0.6 11.185 459.0 222.5 95.9 98.2 58.7 54.0 229.6 19.7 45.9 8.7 2.3 1.6 0.0 8.686 873.7 339.3 161.6 65.3 65.6 39.1 36.0 155.2 13.5 31.9 6.1 1.7 1.2 6.487 713.0 646.0 246.7 110.6 43.9 44.0 26.3 24.5 106.8 9.4 22.5 4.4 1.2 5.688 901.7 527.3 471.2 171.1 75.6 30.0 30.1 18.1 17.1 75.2 6.7 16.2 3.2 5.089 368.3 667.4 387.4 336.8 121.3 53.6 21.2 21.4 13.0 12.3 54.5 4.9 11.8 6.190 1248.9 272.7 491.6 280.2 242.3 87.2 38.5 15.3 15.5 9.4 9.0 39.9 3.6 13.291 359.6 924.6 200.8 355.0 201.2 173.9 62.6 27.8 11.1 11.3 6.9 6.6 29.3 12.492 210.7 266.2 680.1 144.2 253.3 143.4 124.0 44.9 20.0 8.0 8.2 5.0 4.8 30.893 469.4 155.9 194.9 478.8 100.4 176.1 99.8 86.9 31.7 14.2 5.8 5.9 3.7 26.494 790.1 347.1 113.5 133.8 323.5 67.7 118.8 68.1 60.0 22.1 10.1 4.1 4.3 22.295 190.9 583.8 251.1 75.9 87.6 211.1 44.2 78.8 45.9 41.1 15.4 7.1 3.0 19.696 211.3 141.0 419.1 162.6 47.7 54.9 132.4 28.3 51.5 30.6 28.0 10.7 5.1 16.797 561.5 155.9 100.2 260.3 97.2 28.4 32.7 81.0 17.8 33.3 20.4 19.1 7.5 16.098 74.3 414.5 111.7 64.5 162.4 60.4 17.7 20.8 52.7 11.8 22.6 14.1 13.6 17.399 214.2 54.8 296.8 71.6 40.0 100.4 37.4 11.2 13.5 34.9 8.0 15.7 10.0 22.6
100 425.0 158.2 39.3 191.7 44.9 25.0 62.8 23.9 7.3 9.0 23.7 5.6 11.1 24.0101 425.0 313.8 113.5 25.4 120.1 28.0 15.6 40.1 15.6 4.9 6.1 16.5 4.0 25.9

43
Table 13.11 Estimated age 2 recruits (millions of Atka mackerel) from the current assessment and last year’s assessment.
Current Last Year’s Year Assessment Assessment1977 680.8 700.81978 199.8 207.81979 1666.5 1715.71980 279.1 288.41981 217.3 224.51982 259.2 267.71983 177.4 186.11984 300.9 313.51985 459.0 479.81986 873.7 918.01987 713.0 749.71988 901.6 961.91989 368.3 389.31990 1248.9 1347.31991 359.6 391.51992 210.7 229.81993 469.4 524.11994 790.1 875.51995 190.9 220.21996 211.3 251.71997 561.5 670.71998 74.2 100.01999 214.4

44
Table 13.12 Time series of historical fishing mortality rates for Atka mackerel, and catch/biomass (age 3+) rates estimated by stock synthesis.
Catch/BiomassYear Fa Rateb
1977 0.30 0.111978 0.17 0.071979 0.09 0.061980 0.05 0.031981 0.03 0.021982 0.04 0.031983 0.02 0.021984 0.08 0.061985 0.11 0.071986 0.10 0.061987 0.08 0.041988 0.04 0.031989 0.03 0.021990 0.03 0.021991 0.04 0.021992 0.06 0.051993 0.09 0.071994 0.13 0.081995 0.17 0.091996 0.22 0.141997 0.18 0.111998 0.18 0.101999 0.17 0.112000 0.17 0.10
2001c 0.28 0.14
a/ Fishing mortality rate on fully-recruited fish.b/ Catch/biomass rate is the catch to beginning year biomass (ages 3+) ratio.c/ The 2000 catch/biomass rate is based on catch as of 10/14/00.

45
Table 13.13 Projections of Bering Sea/Aleutian Islands Atka mackerel female spawning biomass (1000 mt), yield (1000 mt), and full-selection fishing mortality rate for seven future harvest scenarios The average recruitment from the stochastic projections is 502 million recruits which gives
B40% and B35% levels (female spawning biomass) of 124,500 and 109,000 mt, respectively.Scenario 1 Scenario 2Maximum Permissible FABC (max FABC) F = 0.56 of max FABC
Female FemaleYear Spawning biomass Yield F Year Spawning biomass Yield F2001 116.356 59.984 0.28 2001 116.356 59.986 0.282002 113.093 71.353 0.32 2002 118.017 48.973 0.212003 116.608 78.565 0.32 2003 128.344 59.293 0.222004 122.852 87.461 0.32 2004 139.946 67.967 0.222005 127.302 93.418 0.32 2005 148.84 73.961 0.222006 129.431 96.238 0.32 2006 154.283 77.358 0.222007 130.66 98.229 0.32 2007 157.856 79.648 0.222008 131.276 99.518 0.32 2008 160.149 81.143 0.222009 131.282 99.962 0.32 2009 161.333 81.823 0.222010 131.251 100.143 0.32 2010 162.085 82.164 0.222011 131.407 100.858 0.32 2011 162.799 82.894 0.222012 130.544 99.334 0.32 2012 162.231 82.018 0.222013 130.509 99.483 0.32 2013 162.269 82.069 0.222014 130.252 99.183 0.32 2014 162.123 81.727 0.22
Scenario 3 Scenario 450% of max FABC F = to the 1996-2000 average F
Female FemaleYear Spawning biomass Yield F Year Spawning biomass Yield F2001 116.355 59.986 0.28 2001 116.356 59.984 0.282002 120.426 37.801 0.16 2002 120.834 35.898 0.152003 134.612 47.837 0.17 2003 136.394 42.498 0.152004 149.699 55.742 0.17 2004 153.31 49.900 0.152005 161.674 61.354 0.17 2005 166.977 55.314 0.152006 169.601 64.698 0.17 2006 176.317 58.517 0.152007 175.078 66.984 0.17 2007 182.934 60.645 0.152008 178.826 68.451 0.17 2008 187.612 61.976 0.152009 181.101 69.192 0.17 2009 190.635 62.644 0.152010 182.642 69.584 0.17 2010 192.765 62.969 0.152011 183.959 70.229 0.17 2011 194.56 63.525 0.152012 183.808 69.639 0.17 2012 194.768 63.047 0.152013 184.075 69.707 0.17 2013 195.267 63.150 0.152014 184.09 69.465 0.17 2014 195.443 62.965 0.15
Scenario 5F = 0
FemaleYear Spawning biomass Yield F2001 116.356 59.984 0.282002 128.36 0 02003 157.761 0 02004 189.211 0 02005 217.222 0 02006 239.505 0 02007 257.132 0 02008 270.902 0 02009 281.223 0 02010 289.022 0 02011 295.252 0 02012 298.829 0 02013 301.692 0 02014 303.635 0 0

46
Table 13.13 cont. Projections of Bering Sea/Aleutian Islands Atka mackerel female spawning biomass(1000 mt), yield (1000 mt), and full-selection fishing mortality rate for seven futureharvest scenarios. The average recruitment from the stochastic projections is 502 million recruits which gives B40% and B35% levels (female spawning biomass) of 124,500 and 109,000 mt, respectively.
Scenario 6 Scenario 7F = FOFL F = to max FABC in 2001 and 2002, and FOFL in all
subsequent years.Determination if Atka mackerel are overfished Determination if Atka mackerel are approaching an
overfished conditionFemale Female
Year Spawning biomass Yield F Year Spawning biomass Yield F2001 116.356 59.984 0.28 2001 116.586 60.036 0.282002 110.637 82.290 0.37 2002 115.148 73.183 0.322003 111.216 86.515 0.37 2003 122.030 83.794 0.322004 115.353 95.610 0.37 2004 124.008 106.574 0.372005 118.077 101.322 0.36 2005 122.430 106.206 0.372006 119.021 103.647 0.36 2006 121.429 106.335 0.372007 119.522 105.251 0.36 2007 120.781 106.862 0.372008 119.649 106.521 0.36 2008 120.104 106.724 0.372009 119.383 106.606 0.36 2009 119.724 106.702 0.372010 119.241 106.670 0.36 2010 119.653 107.481 0.362011 119.313 107.495 0.36 2011 118.661 105.735 0.362012 118.418 105.738 0.36 2012 118.559 106.035 0.362013 118.386 106.039 0.36 2013 118.218 105.700 0.362014 118.094 105.705 0.36 2014 117.924 105.779 0.36

Appendix I – Characteristics of Atka Mackerel trawl data andestimation of stock biomass from surveys
Prepared by M. Elizabeth Conners, AFSC
Stock assessments at the AFSC are based on research surveys conducted by the AFSC’s RACE
Division. These surveys conduct, as nearly as possible, a randomized sampling survey over the
vast areas of the Aleutian Islands (AI), Bering Sea, and Gulf of Alaska. These surveys provide
catch and size distribution data for a wide variety of groundfish species, and so must be kept to a
general, broadly applicable design. (A survey design “tuned” for one particular species might
perform poorly for other species). Because of its particular biology, Atka mackerel has
characteristics that make it particularly difficult to assess with a trawl survey using this type of
general design. This appendix is included to illustrate the reasons for the high uncertainty
associated with survey estimates of Atka mackerel biomass.
Atka mackerel in the AI tend to occur in very dense, spatially discrete schools. Trawl samples
that include Atka mackerel tend to have very high catch, indicating that the trawl path intersected
a large school of mackerel. The majority of trawls, even those in areas where Atka mackerel are
known to occur, miss these dense schools and come up with few or no mackerel in the catch. The
reasons for this effect are not fully understood. Schooling behavior of the mackerel, especially in
the summer around spawning season, may be an important factor. It is also highly likely that
Atka mackerel schools associate with some small-scale habitat features that have not been
identified. The location of individual mackerel and mackerel schools can change substantially
over day/night and tidal cycles. The inability of trawl gear to sample over very rocky bottom and
the difficulty of keeping a trawl net on the bottom also contribute to this effect. The result is that
the trawl catches of Atka mackerel tend to be either very high or very low, with the majority of
hauls containing few or no Atka mackerel. This type of behavior is found to some extent with
almost all fish species, but Atka mackerel represent an extreme case.
To get an idea of the actual distribution of Atka mackerel catch data in the AI, I used the AFSC’s
RACE Division database, which includes haul-by-haul results of research surveys. This database
includes bottom trawl surveys of the Aleutian Islands from 1980 through 2000, including both
joint US-Japan surveys conducted in the early 1980’s and the triennial NMFS survey conducted
in 1991, 1994, 1997, and 2000. The following analysis uses all haul records from the database
that were located between 170 W and 170 E; that were randomly-selected bottom trawl stations;

Observed Distributrion of Atka Mackerel Catches
0.0
0.2
0.4
0.6
0.8
1.0
0 0.5 1 5 10 50 100
500
1000
5000
1000
0
5000
00
1000
00
Catch Weight (Kg)
Freq
uenc
y
CDF PDF
and that were rated as successful haul performance. The raw catch data (Kg/haul) was examined,
as well as the catch–per-trawled-area or CPUE data (Kg/Km2). Figure 1 shows the estimated
probability distribution of Atka mackerel catch in Kg/haul over all of the AI survey data. For
56% of the hauls, there were no Atka mackerel present in the catch (haul weight of 0). Another
30% of the time, a few individual mackerel were caught, and the catch weight was between 0 and
100Kg. Catch weights of more than 100Kg but less than 1000 Kg were relatively rare, making up
only 5.5% of the hauls. Finally, the upper 8.5% of the hauls reflect a “hit” of schooling Atka
mackerel, with catch weights from 1000kg (1 mt) up to 33,335Kg (33.3 mt) in a single haul.
When the data are broken down by year or by spatial regions these percentages vary, but the
grouping of catches into these general categories persists.
Figure 1. Observed distribution of Atka mackerel trawl catch weights from the Aleutian Islands. This data includes all bottom trawl research survey hauls collected in the AI regionfrom 1980-2000.
In a statistical sense, this distribution is strongly right-skewed, with a high fraction of very low
values and a small fraction of very high values. While the arithmetic mean of this distribution is
an intermediate value (498 Kg/haul), very few of the individual hauls actually get a catch close to
this figure. The arithmetic mean is heavily influenced by the number and magnitude of the few
high catches in the “upper tail” of the distribution; if a sample happens to include a higher
fraction of “big” hauls than usual, the sample mean will be substantially higher than he true mean.
If, by chance, the sample includes fewer of these “big” hauls, then the sample mean will be lower
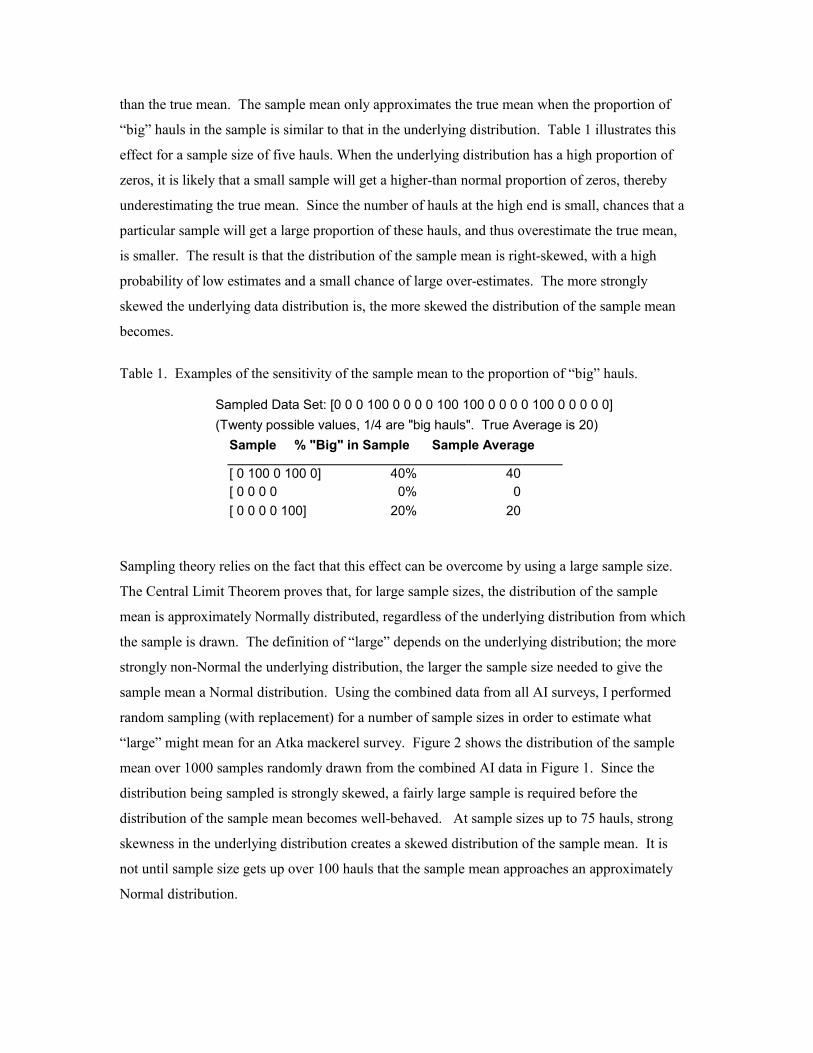
than the true mean. The sample mean only approximates the true mean when the proportion of
“big” hauls in the sample is similar to that in the underlying distribution. Table 1 illustrates this
effect for a sample size of five hauls. When the underlying distribution has a high proportion of
zeros, it is likely that a small sample will get a higher-than normal proportion of zeros, thereby
underestimating the true mean. Since the number of hauls at the high end is small, chances that a
particular sample will get a large proportion of these hauls, and thus overestimate the true mean,
is smaller. The result is that the distribution of the sample mean is right-skewed, with a high
probability of low estimates and a small chance of large over-estimates. The more strongly
skewed the underlying data distribution is, the more skewed the distribution of the sample mean
becomes.
Table 1. Examples of the sensitivity of the sample mean to the proportion of “big” hauls.
Sampled Data Set: [0 0 0 100 0 0 0 0 100 100 0 0 0 0 100 0 0 0 0 0](Twenty possible values, 1/4 are "big hauls". True Average is 20)
Sample % "Big" in Sample Sample Average
[ 0 100 0 100 0] 40% 40[ 0 0 0 0 0% 0[ 0 0 0 0 100] 20% 20
Sampling theory relies on the fact that this effect can be overcome by using a large sample size.
The Central Limit Theorem proves that, for large sample sizes, the distribution of the sample
mean is approximately Normally distributed, regardless of the underlying distribution from which
the sample is drawn. The definition of “large” depends on the underlying distribution; the more
strongly non-Normal the underlying distribution, the larger the sample size needed to give the
sample mean a Normal distribution. Using the combined data from all AI surveys, I performed
random sampling (with replacement) for a number of sample sizes in order to estimate what
“large” might mean for an Atka mackerel survey. Figure 2 shows the distribution of the sample
mean over 1000 samples randomly drawn from the combined AI data in Figure 1. Since the
distribution being sampled is strongly skewed, a fairly large sample is required before the
distribution of the sample mean becomes well-behaved. At sample sizes up to 75 hauls, strong
skewness in the underlying distribution creates a skewed distribution of the sample mean. It is
not until sample size gets up over 100 hauls that the sample mean approaches an approximately
Normal distribution.

Effect of Sample Size on Distribution of the SampleMean: Atka Data from AI
Figure 2. Example of the effect of sample size on the distribution of the sample mean. Sampleswere drawn from trawl results for all AI surveys 1980-2000, in depths <200m. Thevertical line in each graph represents the true mean of 497.65. The mean and standarddeviation in each plot are for the distribution of the sample mean. At small samplesizes, the sample mean is an unbiased estimator but has a highly skewed distribution,with a large chance of under-predicting the true mean and a small chance of a largeover-prediction.
This skewness of the sample mean at smaller sample sizes effects the survey estimate of biomass.
For the AI survey, the study area is divided into strata based on depth, location and regulatory
regions. Sample sizes in each stratum typically range from 6-8 (for the deeper strata) up to 20-40
(for the strata containing the majority of fish biomass). As seen in Figure 2, a sample size of 25
still shows strongly skewed distribution of the sample mean. This means that the estimated
biomass of Atka mackerel calculated for each stratum (as the mean catch x stratum area) will also
have a skewed distribution. The survey estimate for total biomass of Atka Mackerel in the AI is
based on combining these stratum estimates. Another sampling simulation (Figure 3) shows an

mean of estimates is 269,326 mt, std of estimates is 160,307
True biomass is 2.7 x10⁵
Estimate of Total Biomass Based on Stratifed Sampling
1 2 3 4 5 6 7 8 9 10x 105
0
50
100
150
200
250
approximate distribution for a stratified biomass estimate, based on stratified sampling from the
combined CPUE data (Kg/Km2). This combined data set and the simulation are based on strata
less than 200m deep, since Atka mackerel were rarely found in deeper strata. The allocation of
samples to strata used is the same as in the 2000 survey. Samples for all strata were drawn from
the same CPUE distribution, although in reality the actual distribution of Atka mackerel biomass
is expected to vary by region. The resulting distribution of the estimated total biomass is also
right-skewed, with 61% of samples underestimating the true total biomass and 6% overestimating
it by a factor of 2 or more. The most common estimate based on stratified sampling is on the
order of 2.0 x 10⁵ mt, 26% below the true total for the sampled datset.
AFSC scientists have been concerned about the unusually low estimates of biomass for area 541
in the 2000 survey. The survey sample for the strata in area 541 in 2000 did not include any high
catches, and thus the estimated biomass for this region was much smaller than in preceding
surveys. This appendix was included to show that such low estimates can result simply from the
strongly skewed nature of Atka mackerel catch data.
Figure 3. Distribution of the estimated total biomass of Atka Mackerel in AI waters <200m deep,based on stratified random sampling from the combined historical CPUE data.