section 16.0 - open.alberta.ca · 2 risk quotients calculated for 10-minute exposures using 1st...
TRANSCRIPT
Devon NEC Corporation Pike 1 Project Volume 2 – Environmental Impact Assessment June 2012
Table of Contents – Page i
SECTION 16.0 – HEALTH RISK ASSESSMENT TABLE OF CONTENTS
PAGE
16.0 HEALTH RISK ASSESSMENT ................................................................................... 16-1 16.1 Introduction ....................................................................................................... 16-1
16.2 Scope of Assessment ....................................................................................... 16-1 16.2.1 Terms of Reference ......................................................................... 16-1 16.2.2 Pubic Consultation ........................................................................... 16-1
16.3 Study Area ........................................................................................................ 16-2 16.3.1 Spatial Boundaries ........................................................................... 16-2 16.3.2 Temporal Boundaries ....................................................................... 16-3
16.4 Assessment Cases ........................................................................................... 16-3
16.5 Existing Conditions ........................................................................................... 16-4 16.5.1 Current Health Status in the Region ................................................ 16-4 16.5.2 Regional Air Quality and Human Health Studies ............................. 16-8
16.6 Methods .......................................................................................................... 16-10 16.6.1 Problem Formulation ...................................................................... 16-11 16.6.2 Exposure Assessment ................................................................... 16-26 16.6.3 Toxicity Assessment ...................................................................... 16-34 16.6.4 Risk Characterization ..................................................................... 16-45
16.7 Results ........................................................................................................... 16-49 16.7.1 Acute Inhalation Assessment ......................................................... 16-49 16.7.2 Chronic Inhalation Health Risks ..................................................... 16-64 16.7.3 Chronic Multiple Exposure Pathway Assessment .......................... 16-68
16.8 Monitoring ....................................................................................................... 16-76 16.8.1 Air Quality ...................................................................................... 16-77 16.8.2 Groundwater Quality ...................................................................... 16-77 16.8.3 Surface Water Quality .................................................................... 16-77
16.9 Summary ........................................................................................................ 16-77 16.9.1 Acute Inhalation Health Risks ........................................................ 16-77 16.9.2 Chronic Inhalation Health Risks ..................................................... 16-78 16.9.3 Chronic Multiple Pathway Health Risks ......................................... 16-78
16.10 References ..................................................................................................... 16-79

Devon NEC Corporation Pike 1 Project Volume 2 – Environmental Impact Assessment June 2012
Table of Contents – Page ii
TABLE OF CONTENTS (cont)
PAGE LIST OF TABLES
Table 16.5-1: Mortality Cancer Rates per 100,000 Population in the Northern Lights Health Region During Three Year Periods from 2000 to 2010 (Provincial Averages are in Parentheses) ...................................... 16-7
Table 16.5-2: Mortality Rates per 100,000 Population for Chronic Obstructive Pulmonary Disease and Asthma in the Northern Lights Health Region During Three Year Periods from 2000 to 2010 (Provincial Averages are in Parentheses) ..................................................................... 16-7
Table 16.6-1: Project Air Emissions Inventory ................................................................. 16-13 Table 16.6-2: Assumed Physical Characteristics of the Aboriginal Group ....................... 16-21 Table 16.6-3: Assumed Consumption Rates for the Aboriginal Group ............................ 16-22 Table 16.6-4: Assumed Physical Characteristics of Adult Workers ................................. 16-24 Table 16.6-5: Exposure Pathways Assessed for the Lifestyle Categories ....................... 16-26 Table 16.6-6: Identification of the Non-Volatile Chemicals Emitted from the Project ....... 16-29 Table 16.6-7: Ambient Concentrations used in Multiple Pathway Assessment ............... 16-33 Table 16.6-8: Environmental Concentrations Used in the Multiple Pathway
Assessment ............................................................................................... 16-35 Table 16.6-9: Exposure Limits for the Chemicals Emitted from the Project ..................... 16-41 Table 16.6-10: Chemicals of Potential Concern in the Inhalation and Multiple
Pathway Assessments ............................................................................... 16-46 Table 16.6-11: Potential Additive Interactions of the Chemicals of Potential Concern ...... 16-47 Table 16.6-12: Major Assumptions used in the Human Health Risk Assessment ............. 16-50 Table 16.7-1: Acute Inhalation Risk Quotients – AQLSA-MPOI ...................................... 16-52 Table 16.7-2: Acute Inhalation Risk Quotients – AQRSA-MPOI ...................................... 16-53 Table 16.7-3: Acute Inhalation Risk Quotients – Aboriginal Group .................................. 16-54 Table 16.7-4: Acute Inhalation Risk Quotients – Worker Group ...................................... 16-55 Table 16.7-5: Predicted 10-minute (peak) and 1-hour SO2 Air Concentrations for
the MPOI Locations and Worker Locations with Risk Quotients Exceeding 1.0 ............................................................................................ 16-57
Table 16.7-6: Predicted 10-minute (9th highest) SO2 Air Concentrations for the MPOI Locations and Worker Locations with Risk Quotients Exceeding 1.0 ............................................................................................ 16-57
Table 16.7-7: Comparison of SO2 Risk Quotients Calculated for 10-minute Exposures Using 1st Highest (Peak) and 9th Highest (99.9%ile) Predicted Air Concentrations ..................................................................... 16-59
Table 16.7-8: Potential Acute Health Effects Associated with SO2 .................................. 16-60 Table 16.7-9: Potential Frequencies of SO2 Concentration Ranges at the MPOIs .......... 16-61

Devon NEC Corporation Pike 1 Project Volume 2 – Environmental Impact Assessment June 2012
Table of Contents – Page iii
TABLE OF CONTENTS (cont)
PAGE
Table 16.7-10: Comparison of Maximum Respiratory Irritant Risk Quotients Based on the 1-Hour Peaks and the 1-Hour 9th Highest Air Concentrations ........................................................................................... 16-64
Table 16.7-11: Chronic Inhalation Risk Quotients – Aboriginal Group .............................. 16-65 Table 16.7-12: Chronic Inhalation Risk Quotients – Worker Group ................................... 16-66 Table 16.7-13: Chronic Inhalation Risk Quotients – Aboriginal Group .............................. 16-67 Table 16.7-14: Chronic Inhalation Risk Quotients – Worker Group ................................... 16-67 Table 16.7-15: Maximum Chronic Multiple Exposure Pathway Risk Quotients
for Non-Carcinogens – Aboriginal Group ................................................... 16-69 Table 16.7-16: Maximum Chronic Multiple Exposure Pathway Risk Quotients
for Non Carcinogens – Worker Group ....................................................... 16-70 Table 16.7-17: Manganese Risk Quotients for the Life Stages of the
Aboriginal Group ........................................................................................ 16-71 Table 16.7-18: Breakdown of Exposure Pathways Contributing to the Predicted
Manganese Risks ...................................................................................... 16-72 Table 16.7-19: Maximum Chronic Multiple Exposure Pathway Incremental Lifetime
Cancer Risks – Aboriginal Group .............................................................. 16-76 Table 16.7-20: Maximum Chronic Multiple Exposure Pathway Incremental Lifetime
Cancer Risks – Worker Group ................................................................... 16-76

Devon NEC Corporation Pike 1 Project Volume 2 – Environmental Impact Assessment June 2012
Table of Contents – Page iv
TABLE OF CONTENTS (cont)
PAGE
LIST OF FIGURES
Figure 16.6-1: Receptor Locations .................................................................................... 16-19 Figure 16.7-1: Worker Group Locations at Which the Predicted 10-Minute
Peak SO2 Concentrations Exceed the WHO Air Quality Guideline (500 µg/m3) ................................................................................ 16-58

Devon NEC Corporation Pike 1 Project Volume 2 – Environmental Impact Assessment June 2012
Page 16-1
16.0 HEALTH RISK ASSESSMENT
16.1 Introduction
This section provides the methods and findings of the human health risk assessment (HHRA) portion of the environmental impact assessment (EIA). The primary objective of the HHRA is to describe the nature and significance of potential health risks to humans from chemical emissions from the Pike 1 Project (the Project). In addition, the HHRA examined potential health risks associated with the environmental conditions that would exist prior to development of the Project, as well as the environmental conditions that would exist as a result of the Project in combination with other planned activities for the region.
16.2 Scope of Assessment
The scope of the HHRA was based on the following:
• Terms of Reference issued by Alberta Environment and Water (AEW) for the Project; and
• health-related issues and concerns expressed by stakeholders during consultation on the Pike and Jackfish projects, with particular attention being given to those expressed during the Project consultation process.
Further details associated with the scope of the HHRA are presented in the sections below.
16.2.1 Terms of Reference
The HHRA was designed, in part, to address provincial regulatory requirements established by AEW, as described in the Terms of Reference for the Project (Volume 3, Appendix A). Specific health-related issues addressed in the HHRA include:
• determine quantitatively whether there may be implications for public health arising from the Project;
• document any health concerns raised by stakeholders during consultation on the Project; and
• document any health concerns identified by Aboriginal communities or groups resulting from impacts of existing development and of the Project specifically on their traditional lifestyle and include an Aboriginal receptor type in the assessment.
16.2.2 Pubic Consultation
Devon has been actively involved in public consultation in the region, starting with its first Jackfish Project in 2002. Devon continues to gather information from communities, residents and other stakeholders, with respect to their issues and concerns. The community consultation undertaken in support of the Project is described in Volume 1, Section 5.0.

Devon NEC Corporation Pike 1 Project Volume 2 – Environmental Impact Assessment June 2012
Page 16-2
Health-related concerns raised by stakeholders include:
• an overall deterioration in environmental quality (e.g., air, water, fish, vegetation and wildlife);
• the potential changes in quality of the game and fish in the region;
• the safety of traditional food consumption, including vegetation (e.g., berries) and wild game, specifically as this relates to cancer; and
• access to medical services. Other than the concern related to access to medical services (Volume 2, Section 17.0), these issues are addressed in the following sections of the HHRA.
16.3 Study Area
16.3.1 Spatial Boundaries
The Project will be located in Townships 73 and 75, Ranges 5 to 7, West of the Fourth Meridian. The nearest town is Conklin, AB, which is approximately 25 km northwest of the Project. In determining the health study area, consideration was given to:
• the predicted spatial extent of the Project’s influence on air quality in the region; and
• the locations of nearby communities and areas of residence potentially affected by the Project.
On this basis, the HHRA focused on potential health risks to people in the:
• air quality regional study area (AQRSA), which has a north-south extent of 190 km and an east-west extent of 150 km. The AQRSA extends from Anzac to approximately Lac La Biche and extends eastward about 30 km into Saskatchewan. The AQRSA comprises the major emission sources in the Athabasca oil sands south of Fort McMurray (Volume 2, Section 4.2); and
• air quality local study area (AQLSA), which defines a 40 km by 40 km area centered on the central processing facility (CPF). The boundary of the AQLSA was delineated to focus the assessment of air quality within the immediate vicinity of the Project.
Health risks were not assessed inside the developed area, which is defined as the area within the Project CPF footprint. The CPF is expected to be located within the southern half of section 35-74-6W4. The developed area will be frequented only by Devon’s employees and contractors. As such, potential exposures and the associated health risks inside the developed area fall under Alberta’s occupational health and safety guidelines.

Devon NEC Corporation Pike 1 Project Volume 2 – Environmental Impact Assessment June 2012
Page 16-3
The HHRA assessed the potential health risks at over 200 locations, including those locations inside the AQLSA and AQRSA where the maximum ground-level air concentrations are predicted to occur (i.e., the maximum points of impingement or MPOIs). The details of the locations assessed in the HHRA are described in Section 16.6.1.2.
16.3.2 Temporal Boundaries
Construction of the Project will take place in three separate phases, with the first phase scheduled to begin in 2014. Initial production is scheduled to commence in 2016, upon completion of the first phase of construction and the commissioning of the Project CPF. The Project is currently anticipated to operate for 25 to 30 years. The HHRA assessed both short-term (acute) and long-term (chronic) health risks to people associated with the chemicals emitted from the Project. The two exposure durations can be described as follows:
• Acute – exposure extends over a time period covering minutes to a day; and
• Chronic – exposure occurs continuously or regularly over extended periods, lasting for periods of months to years and possibly extending over an entire lifetime. For the purpose of the HHRA, chronic exposure was assumed to extend over an 80-year life (as recommended in Health Canada 2009a).
As such, the temporal scope of the HHRA extended from acute exposure durations in the order of 24 hours or less to chronic exposure durations equivalent to a lifetime. Although the anticipated operational life of the Project is 25 to 30 years, the HHRA assumed that the chemical emissions attributable to the Project would continue for a period of 80 years (i.e., equivalent to a person’s assumed lifespan).
16.4 Assessment Cases
Consistent with the assessment of air quality (Volume 2, Section 4.4), potential health risks were evaluated for the following three assessment cases:
• Baseline Case – includes existing and approved emission sources in the region, as well as estimated emissions from various non-industrial sources such as vehicle and recreational emissions. The air quality assessment assumed that all current and approved facilities are operating at their maximum approved levels;
• Application Case – includes existing and approved emission sources in the region along with those from the Project (i.e., Baseline Case plus Project); and
• Planned Development Case (PDC) – includes existing, approved and planned future emission sources in the region, including emissions originating from the Project (i.e., Application Case plus planned future emission sources).
For ease of comparison, the results of the HHRA are presented together for the three assessment cases in Section 16.7.

Devon NEC Corporation Pike 1 Project Volume 2 – Environmental Impact Assessment June 2012
Page 16-4
In addition to the three assessment cases, the incremental health risks associated with the Project-Alone and planned future emission sources were evaluated. Incremental changes in ground-level air concentrations attributable to the Project were based on the findings of the air quality assessment (Volume 2, Section 4.0), while incremental changes associated with planned future emission sources were evaluated by subtracting the Baseline Case from the PDC. 16.5 Existing Conditions Sections 16.5.1 and 16.5.2 describe the current status with respect to air quality and human health to gain an understanding of how existing conditions may impact human health, as well as contribute to future exposures. 16.5.1 Current Health Status in the Region The Project will be situated in an area of the province which, prior to the amalgamation of all the Alberta regional health authorities in 2008, fell under the governing body of the Northern Lights Health Region (NLHR). Although the NLHR was considerably larger than the AQRSA of the Project, information on the overall health status in the region can still be used in a broad sense as many of the communities that fall inside the NLHR are comparable to those in the vicinity of the Project. Baseline health data are publicly available on a relatively broad scale, wherein information is presented for the primary urban centres or for large geographic areas. No specific baseline health data are currently available for the communities in the vicinity of the Project (e.g., Conklin). Although some of the information presented below may not be specifically relevant to residents inside the AQLSA or AQRSA, it can still be useful for “identifying critical receptors as well as in interpreting the HHRA in the context of population baseline, project and cumulative risks” (AHW 2011). The overall health status of people in the region was summarized based on four sources of information:
• Cancer in Alberta: A Regional Picture 2007 – This annual report outlines cancer trends and regional rates in Alberta. It provides a synopsis of data from the Alberta Cancer Registry to provincial health professionals and planners in an effort to assist with planning and policy-setting (ACB 2007);
• Health Trends in Alberta: A Working Document – The primary communications tool for the Provincial Government’s Health Trends Initiative. It provides technical information on a number of general health and health determinant indicators across Alberta (AHW 2007a);
• Interactive Health Data Application (IHDA) Website – Alberta Health and Wellness has designed this site to provide information on health status and determinants of health. The IHDA contains health indicators derived from various sources, in topics such as demographics, mortality, chronic and infectious disease and children's health (AHW 2012); and
• Report on the Health of Albertans – A document about the health status of Albertans which includes discussions of important health issues and strategies. This document is written to be understood by a broad public audience (AHW 2006a).

Devon NEC Corporation Pike 1 Project Volume 2 – Environmental Impact Assessment June 2012
Page 16-5
These sources of information provide a summary on the health status of people living in the HHRA study area relative to other regions in Alberta. The indicators for measuring and reporting health trends in Alberta are consistent with efforts led by the Canadian Institute of Health Information to align a number of indicators for comparison to national data. Data for select health determinants and non-communicable diseases are described below.
16.5.1.1 Health Determinants
In addition to the quality of a person’s ambient environment (e.g., air, water, etc.), many other factors play a role in determining a person’s overall health. Collectively, these factors are referred to as health determinants and include such things as income and social status, social support networks, education, employment and working conditions, physical environment, biology and genetics, personal health practices and coping skills and access to health services, to name a few. Research shows that Canadians in rural, remote and northern communities generally have a lower health status relative to other Canadians (CPHI 2006). This applies across a number of indicators, including lifestyle related illnesses, injuries and cardiovascular diseases. The 2010 Royal Society of Canada report on the oil sands indicates that the health status in the NLHR is worse than the provincial average for several non-environmental indicators, such as substance-related disorders, sexually transmitted infections, prevalence of diabetes and mortality due to homicide as well as mortality rates due to motor vehicle collisions. The report also highlights the fact the NLHR has the lowest availability of doctors. These indicators are typical of what the Royal Society of Canada report refers to as a “boomtown effect" (RSCEP 2010). Those health determinants potentially relevant to the HHRA that were examined by AHW (2006a, 2007a) are summarized below.
• Self-Perceived Health – 62% of Albertans reported their health to be very good or excellent in 2005, while about 67% of individuals in the NLHR reported the equivalent (AHW 2007a); and
• Nutrition – The NLHR had the lowest proportion (approximately 28%) of individuals reporting that they consume five or more servings of fruits and vegetables compared to other health regions. Approximately 36% of Albertans reported consuming the Health Canada recommended serving of fruits and vegetables (AHW 2006a).
16.5.1.2 Non-Communicable Disease
The AHW (2006a, 2007a) studies focused on the most common non-communicable diseases:
• Cancer – In 2002 to 2004, the age standardized incidence rates (ASIR) for all invasive cancers (per 100,000 population, all ages) was lower in the NLHR than the provincial average for females and slightly lower in the NLHR when compared to the provincial average for males (ACB 2007). Age-standardized mortality rates (ASMR) in females

Devon NEC Corporation Pike 1 Project Volume 2 – Environmental Impact Assessment June 2012
Page 16-6
were slightly lower in the NLHR, while ASMRs for males were similar to the provincial average in the NLHR (ACB 2007). Rates of the most common cancers (i.e., prostate, breast, colorectal and lung) are discussed for the NLHR and province below (ACB 2007):
prostate: no significant differences in ASIRs were identified between the NLHR and the provincial average. The ASMRs were slightly higher in the NLHR compared to the provincial average;
breast: when compared to the provincial averages, the ASIRs and ASMRs in the NLHR were lower;
colorectal: no significant differences in ASIRs for both genders were identified between the NLHR and the provincial average. Female ASMRs were not significantly different while the ASMRs for males were lower in the NLHR than the provincial average; and
lung: the incidence rate for females was slightly lower in the NLHR when compared to the provincial average. No significant differences were identified in the ASIRs for males and the ASMRs for both genders between the NLHR and the provincial average;
• Cardiovascular Disease – ASMRs as a result of ischaemic heart disease were significantly lower in the NLHR than the provincial average (AHW 2007a);
• Cerebrovascular Disease – In the NLHR, ASMRs as a result of cerebrovascular disease were significantly lower than the provincial average (AHW 2007a);
• Hypertension – Age-standardized treated prevalence of hypertension was significantly higher in the NLHR when compared to the provincial average (AHW 2006a);
• Chronic Respiratory Disorders – ASMRs for chronic obstructive pulmonary disease (COPD) were significantly lower in the NLHR when compared to the provincial rates. There were no reported cases of mortality as a result of asthma in the NLHR (AHW 2007a);
• Diabetes – ASMRs as a result of diabetes were significantly lower in the NLHR than the provincial average (AHW 2007a); and
• Chronic Renal Failure – ASMRs as a result of chronic renal failure were significantly lower than the provincial average. Although not significant, age-standardized mortality rates of chronic renal failure were higher than the provincial average (AHW 2007a).
In addition to the Alberta Cancer Board report (ACB 2007), more recent mortality data (per 100,000 population) were available for the most common cancers from the Government of Alberta’s IHDA (AHW 2012). The mortality rates for lung, colorectal, breast and prostate cancer for both males and females in the NLHR (Table 16.5-1) are presented as three year rolling averages from 2000 to 2010.

Devon NEC Corporation Pike 1 Project Volume 2 – Environmental Impact Assessment June 2012
Page 16-7
Table 16.5-1: Mortality Cancer Rates per 100,000 Population in the Northern Lights Health Region During Three Year Periods from 2000 to 2010 (Provincial Averages are in Parentheses)
Years Lung Colorectal Breast Prostate
Female Male Female Male Female Male 2000 to 2002 43.2 (32.5) = 59.7 (50.3) = 16.9 (11.9) = 16.2 (19.0) = 29.3 (23.5) = 22.6 (29.2) = 2001 to 2003 43.7 (32.3) = 56.6 (51.0) = 13.9 (12.2) = 13.8 (18.6) << 26.7 (24.2) = 21.1 (28.5) = 2002 to 2004 40.0 (33.6) = 47.8 (51.2) = 16.1 (12.5) = 7.6 (18.9) << 19.3 (22.4) = 42.3 (27.6) + 2003 to 2005 38.1 (33.3) = 48.6 (50.5) = 22.8 (12.7) + 6.2 (19.9) = 12.6 (21.6) < 60.6 (26.4) ++ 2004 to 2006 44.6 (33.5) = 57.6 (48.1) = 30.7 (12.6) + 20.7 (19.9) = 8.3 (20.4) << 50.9 (25.0) + 2005 to 2007 41.8 (33.2) = 73.6 (47.4) + 23.1 (12.4) + 18.6 (18.8) = 6.1 (20.6) << 42.3 (24.2) + 2006 to 2008 38.9 (33.6) = 66.4 (45.1) + 12.0 (11.8) = 17.8 (18.6) = 2.3 (20.0) << 21.1 (23.5) = 2007 to 2009 31.9 (33.3) = 54.9 (45.5) = 1.6 (11.6) << 16.6 (19.4) = 9.9 (19.6) < 18.8 (22.8) = 2008 to 2010 26.5 (33.2) = 52.2 (43.6) = 3.0 (11.7) << 24.0 (19.3) = 19.1 (18.7) = 10.0 (22.4) <<
Notes: Legend to significance ratings (AHW 2012): ++ Regional mortality rate is significantly higher than the provincial average. + Regional mortality rate is slightly higher than the provincial average. = Regional mortality rate is similar to provincial average. < Regional mortality rate is slightly lower than the provincial average. << Regional mortality rate is significantly lower than the provincial average.
Much like the cancer mortality rates, additional asthma and COPD mortality data (per 100,000 population) were available from the Alberta IHDA from 2000 until 2010 (AHW 2012). The mortality rates for asthma and COPD in the NLHR (Table 16.5-2) are presented as three year rolling averages from 2000 to 2010.
Table 16.5-2: Mortality Rates per 100,000 Population for Chronic Obstructive Pulmonary Disease and Asthma in the Northern Lights Health Region During
Three Year Periods from 2000 to 2010 (Provincial Averages are in Parentheses) Year COPD Mortality Asthma Mortality 2000 to 2002 45.9(26.5) + 0.4(0.7) = 2001 to 2003 51.4(25.9) ++ 0.4(0.7) = 2002 to 2004 42.7(25.2) + 0.4(0.7) = 2003 to 2005 41.5(24.8) + 0(0.7) = 2004 to 2006 43.6(24.8) ++ 0(0.6) = 2005 to 2007 46.2(25.2) ++ 0(0.6) = 2006 to 2008 39.4(25.4) + 0(0.6) = 2007 to 2009 29.1(24.9) = 0(0.6) = 2008 to 2010 26.0(23.9) = 0.3(0.5) =
Notes: These values differ slightly from those presented in AHW (2007a) as different sources of population data were used to standardize the mortality rates. Legend to the significance ratings (AHW 2012): ++ Regional ASMR significantly higher than provincial average. + Regional ASMR slightly higher than provincial average. = Regional ASMR similar to provincial average. < Regional ASMR slightly lower than provincial average. << Regional ASMR significantly lower than provincial average.

Devon NEC Corporation Pike 1 Project Volume 2 – Environmental Impact Assessment June 2012
Page 16-8
The extent to which the Project and other industrial sources in the region will influence some of these health indices will be addressed through the findings of this HHRA. 16.5.2 Regional Air Quality and Human Health Studies The Alberta Oil Sands Community Exposure and Health Effects Assessment Program is a joint industry, government and community initiative that was established to investigate possible links between air quality and human health outcomes in the Fort McMurray region (AHW 2000). Results from the program (AHW 2000) showed chemical air concentrations to be generally low in the Fort McMurray region, compared to air quality objectives, regardless of whether they were measured indoors or outdoors. Air concentrations were not significantly different in the City of Fort McMurray compared to the reference location (Lethbridge, AB), despite the high degree of oil sands development in the Fort McMurray region. As well, no significant differences in health status were found between the two communities in terms of physician visits or prevalence of disease. The former Human Exposure Monitoring Program (HEMP) was designed to continuously monitor certain air contaminants that individuals are exposed to throughout the Regional Municipality of Wood Buffalo. The program was developed to enhance the knowledge of the potential link between air quality and human health in the region. Although the Project will be located a considerable distance from the largest industrial emission sources in the Athabasca oil sands (e.g., open pit mines), the findings of the AHW (2000) study and HEMP help put the potential risks associated with the Project into context. For example, the level of industrial activity north of Fort McMurray exceeds the extent of industrial development in the Project’s AQRSA. As such, any conclusions drawn with respect to the oil sands development north of Fort McMurray and its potential influence on air quality and human health could, over time, be applied to the Project AQRSA. The existing air quality is described in Volume 2, Section 4.5 and Volume 3, Appendix C4. The ambient air quality data were summarized to describe the existing conditions near the Project. A review of the local ambient air quality observations at the Jackfish 1 monitoring station indicates that between 2007 and 2011
• all of the maximum 1-hour, 24-hour, 30-day and annual SO2 concentrations were less than the Alberta Ambient Air Quality Objectives (AAAQO); and
• all of the maximum 1-hour and annual NO2 concentrations were less than the AAAQO. Data collected at the Anzac station between 2006 and 2010 indicates that:
• the maximum 1-hour ozone concentrations measured exceeded the 1-hour AAAQO on one occasion. The measured maximum 8-hour ozone concentrations were below the Canada-Wide Standard (CWS). The ozone concentrations measured during the mobile air surveys were all below the 1-hour AAAQO; and
• a small number of exceedances of the 24-hour peak PM2.5 AAAQO have been observed at the Anzac monitoring station (i.e., 8 times). However, the 24-hour CWS, which is based on a 98th percentile rather than the maximum of monitored PM2.5 values, was not exceeded.

Devon NEC Corporation Pike 1 Project Volume 2 – Environmental Impact Assessment June 2012
Page 16-9
The ambient air quality data collected at the Jackfish 1 and Anzac monitoring stations indicate that the maximum existing concentrations of SO2 and NO2 are below the applicable air quality objectives. High PM2.5 concentrations occur infrequently and can be attributed to rare events such as forest fires or grass fires that emit large amounts of particulate matter. Monitoring data for ozone indicate that maximum existing concentrations are closer to the AAAQO. In the case of ozone, these values are typical of other rural monitoring sites in Alberta and are often related to background. With respect to the Wood Buffalo Environmental Association (WBEA) monitoring network, the AHW (2000) report and the more recent information from the HEMP report (WBEA 2007) suggest the following:
• NO2 concentrations were low compared to air quality objectives, although levels have increased since the AHW (2000) study. Indoor concentrations were lower than outdoor concentrations. The most important exposure sources were local, suggesting that regional development has little influence;
• SO2 concentrations were low compared to air quality objectives and in general, outdoor air concentrations reported by the WBEA (2007) were similar to the AHW (2000) levels. Indoor concentrations were lower than outdoor levels. The most important exposure sources were determined to be local, followed by regional sources (such as oil sands activity);
• measured outdoor fine particulate matter (PM2.5) air concentrations were less than the CWS of 30 µg/m³. PM2.5 outdoor concentrations did not play an important role in personal exposure. Instead, the most important factors contributing to exposure were personal activity and indoor air;
• indoor and personal ozone concentrations were lower than the 1-hour AAAQO of 160 μg/m³ and 8-hour CWS of 127 μg/m³; outdoor ambient levels were an order of magnitude higher than the measured indoor levels, with the outdoor concentrations being predominantly due to naturally occurring conditions; and
• indoor concentrations were the predominant factor affecting personal exposure to volatile organic compounds (including but not limited to benzene, ethylbenzene, hexane, toluene and xylenes).
Kindzierski et al. (2010) conducted a trend analysis of air quality data between 1998 and 2007 from WBEA. Through their analysis, Kindzierski et al. (2010) concluded that “there is little or no pattern to the changes in concentrations of [NO2, SO2, PM2.5 and ozone] across the oil sands region over the past 10 years”. The authors noted increasing hourly concentrations of nitrogen oxides at the Fort McMurray Patricia McInnes and Fort McKay ambient monitoring stations. In contrast, decreasing hourly concentrations were observed for PM2.5 at all of the community air monitoring stations (Fort McMurray, Fort McKay and Fort Chipewyan).

Devon NEC Corporation Pike 1 Project Volume 2 – Environmental Impact Assessment June 2012
Page 16-10
Additionally, WBEA publishes an annual report detailing the results from the continuous ambient air quality monitoring. This report includes the number of exceedances during the year for air quality components (including NO2, SO2, ozone and PM2.5), as well as reporting the annual trends since the inception of the monitoring stations in 1998 (WBEA 2010). This report is only for outdoor air, but it shows the same trends as the HEMP Report (WBEA 2007), in which air quality concentrations were mostly low compared to air quality objectives and in general, do not vary much year to year (WBEA 2010). 16.6 Methods The HHRA examined potential acute and chronic health risks associated with the Project using a conventional risk assessment paradigm. The paradigm is consistent with those developed by:
• Health Canada (Health Canada 1995, 2009a); • Canadian Council of Ministers of the Environment (CCME 2006); • California’s Office of Environmental Health Hazard Assessment (OEHHA 2001); • United States National Research Council (US NRC 1983, 1994); and • United States Environmental Protection Agency (US EPA 1989; US EPA OSW 2005). The methods employed herein have been endorsed in the past by regulatory authorities in Alberta, such as Alberta Health and Wellness, AEW and the Energy Resources Conservation Board (ERCB) and remain consistent with the approach that was followed in the HHRAs completed in support of the Devon Jackfish projects. The four steps of the HHRA involve:
• Problem Formulation – identification of the chemicals associated with Project emissions, characterization of people potentially ‘at risk’ and identification of relevant exposure pathways;
• Exposure Assessment – identification of the non-volatile chemicals emitted from the Project that would be expected to be deposited nearby and possibly persist or accumulate in the environment, determination of measures of background or ambient concentrations in the environment and quantification of the potential amount or dose of each chemical received by humans through all relevant exposure pathways; Toxicity Assessment – identification of potential adverse health effects associated with exposure to each of the chemicals (acting either singly or in combination) emitted from the Project, the conditions under which these effects are observed and determination of the maximum safe dose of the chemical for sensitive human subjects following exposure for a prescribed period of time (i.e., identification of acute and chronic exposure limits for the chemicals emitted from the Project); and
• Risk Characterization – comparison of estimated exposures (identified in the exposure assessment) with exposure limits (identified in the toxicity assessment) to identify potential human health risks for the different assessment cases, as well as discussion of assessment uncertainties and how these were addressed.

Devon NEC Corporation Pike 1 Project Volume 2 – Environmental Impact Assessment June 2012
Page 16-11
Uncertainty associated with the prediction of potential health risks was addressed, in part, through the use of reasonable worst-case assumptions. Using this approach, health risks identified by the assessment are unlikely to be understated. It is important that the assumptions underlying any potential health risks are clearly stated. The uncertainties addressed and the assumptions used in the HHRA are documented as part of the risk characterization step of the assessment (Section 16.6.4).
16.6.1 Problem Formulation
The problem formulation is the initial step of the assessment, in which practical boundaries are placed on the overall scope of work and the key areas of concern are identified. The three major tasks of the problem formulation are described in detail below:
• identification of the chemicals emitted or released from the Project that might contribute to potential human health risks;
• characterization of people who might be exposed to Project emissions or releases, with special consideration given to sensitive and more susceptible individuals (e.g., infants and young children, the elderly, individuals with compromised health); and
• identification of all relevant exposure pathways for people who might be exposed to emissions or releases from the Project.
16.6.1.1 Chemical Emissions Inventory
A comprehensive inventory of chemicals that could be emitted or released from the Project and to which people might be exposed, was developed. Development of the chemical inventory considered both possible air emissions and releases to water attributable to the Project.
Air Emissions
The Project will potentially emit chemicals into the air from several sources, including well pads, steam generators (boilers), heaters, flares and storage tanks (see Volume 2, Section 4.6). The main sources of air emissions associated with the Project will be the boiler and heater stacks located at the CPF. Fugitive emissions from storage tanks, valves, flanges, rotating seals and drains located in the process areas are also possible. While most of the emissions from the Project result from sources located at the CPF, additional emissions can occur from the well pads Mitigation measures to manage air emissions were incorporated into the design of the Project. These include:
• combustion of produced gas, as opposed to direct venting or flaring, offers the advantage of more reliable and complete combustion, reducing the opportunity for the formation of incomplete combustion products and reducing the need for natural gas required for the combustion process;
• the use of produced gas in the boilers to replace natural gas that would otherwise be required;

Devon NEC Corporation Pike 1 Project Volume 2 – Environmental Impact Assessment June 2012
Page 16-12
• installation of a sulphur removal unit at the Project CPF to reduce the H2S content of the produced gas and reduce total sulphur emissions;
• use of low-NOx burner technology for the once-through steam generators and heaters to achieve emissions below the applicable NOx emission levels specified by the CCME;
• steam generators will be designed to operate at a high efficiency (i.e., above 84% on a high heating value basis); and
• use of a vapour recovery system to capture vapours from vapour flash or tank volume displacement, thereby reducing fugitive tank emissions;
• the facility design will include a vapour recovery system to reduce vented emissions, odours and fugitive emissions from facility tankage;
• partial redundancy in compressors for the CPF vapour recovery system will be installed to minimize emissions in the event of a compressor upset;
• the development of a fugitive emissions management plan that meets the requirements of Directive 060: Upstream Petroleum Industry Flaring, Incinerating, and Venting;
• the centralization of emissions from the field to the plant will result in lower impact compared to that from scattered sources; and
• limiting continuous flaring to a pilot in the flare at the CPF. As well, flaring due to upset/emergency conditions, startup and commissioning will be minimized for the Project.
Although these mitigation measures will reduce emissions, the Project will be a potential source of the following chemicals:
• federally regulated contaminants that are referred to as criteria air contaminants (CACs), including CO, NO2, PM2.5 and SO2;
• acids, including carboxylic acids and sulphuric acid;
• metals and minerals;
• polycyclic aromatic hydrocarbons (PAHs);
• sulphur compounds, including CS2 and H2S; and
• volatile organic compounds (VOCs), including aldehydes and aliphatic and aromatic compounds.
Specifically, the chemicals potentially emitted from the Project are listed in Table 16.6-1. Each of these chemicals was considered in the HHRA.

Devon NEC Corporation Pike 1 Project Volume 2 – Environmental Impact Assessment June 2012
Page 16-13
Table 16.6-1: Project Air Emissions Inventory
CACs Organic Compounds PAHs Metals and
Minerals Sulphur Compounds
CO 1,3-Butadiene 7,12-Dimethylbenz(a)anthracene Aluminum CS2 NO2 2-Methylnaphthalene Acenaphthene Antimony H2S PM2.5
1 3-Methylcholanthrene Acenaphthylene Arsenic SO2 Acetaldehyde Anthracene Barium Acrolein Benzo(a)anthracene Cadmium Aliphatic aldehydes Benzo(a)pyrene Calcium Aliphatic C5-C8 Benzo(b)fluoranthene Chromium Aliphatic C9-C16 Benzo(g,h,i)fluoranthene Cobalt Aliphatic C17-C34 Benzo(g,h,i)perylene Copper Aromatic C9-C16 Benzo(k)fluoranthene Gallium Aromatic C17-C34 Chrysene Indium Benzaldehyde Cyclopenta(cd)pyrene Iron Benzene Dibenzo(a,h)anthracene Lanthanum Carboxylic acids Fluoranthene Lead Dichlorobenzene Fluorene Magnesium Ethylbenzene Indeno(1, 2,3-cd)pyrene Manganese Formaldehyde Naphthalene Nickel Methacrolein Phenanthrene Palladium n-Hexane Pyrene Potassium n-Pentane Silicon Sulphuric acid Silver Toluene Strontium Xylenes Tin Titanium Vanadium Zinc Zirconium
Note: 1 PM2.5 includes both primary (emitted directly into the atmosphere) and secondary (formed in the atmosphere
through chemical and physical transformations) particulates.
A chemical was only considered in the HHRA if the Project is expected to be a potential source of that particular chemical. The Project is not a mining operation and, therefore, does not have a diesel-fueled shovel and truck mine fleet as is associated with oil sands mining operations. On this basis, mercury from mine fleet emissions was not included in the assessment. The main combustion sources associated with the Project are fired with natural gas. Mercury emissions are not expected to result from natural gas combustion.

Devon NEC Corporation Pike 1 Project Volume 2 – Environmental Impact Assessment June 2012
Page 16-14
The ERCB found that while mercury in natural gas is common in other parts of the world, it is essentially absent in Alberta natural gas samples (ERCB 1982). Also, dilution tunnel stack testing measurements sponsored jointly by the United States Department of Energy, the Gas Research Institute, the California Energy Commission, the New York State Energy Research and Development Authority, and the American Petroleum Institute found that mercury was below the detection level for a number of differing natural gas-fired combustion units, which included: a process heater (Wien et al. 2003a); a process heater with selective catalytic reduction (SCR) (Wien et al. 2003b); a dual fuel-fired commercial boiler (Wien et al. 2004a); a combined cycle power plant with supplementary firing, oxidation catalyst and SCR (Wien et al. 2004b); and a cogeneration plant with supplementary firing, oxidation catalyst and SCR (England and McGrath 2004). On the basis of these referenced studies, mercury is not expected to be associated with the Project natural gas-fired combustion sources.
Groundwater Releases
The hydrogeology assessment is presented in Volume 2, Section 6.0, wherein the potential environmental effects on groundwater quality associated with the Project are described. The hydrogeology assessment addressed the following issues with respect to groundwater quality:
• accidental releases from surface facilities, such as pipelines, tanks, buildings and well casings;
• wastewater disposal; and • subsurface thermal plumes. The mitigative measures and groundwater monitoring in the vicinity of the Project’s surface facilities will ensure that any releases will be identified and response measures implemented to minimize impacts (Volume 2, Section 6.3.3.1 and Volume 2, Section 6.8.1). The Project wastewater is planned to be disposed into the McMurray Aquifer due to its salinity (e.g., TDS of 30 700 mg/L), thick water saturated zone beneath the bitumen zone, and depth relative to domestic water users. This level of TDS is generally unusable for most industrial uses; however, use for the Project makeup water supply is possible due to mixing with relatively less saline Lower Grand Rapids Aquifer water (TDS of 7 500 to 9 880 mg/L beneath the Project Area). Devon will implement the following mitigation measures to reduce or eliminate the potential effects on groundwater quality associated with wastewater disposal (Volume 2, Section 6.3.2.2):
• optimal wastewater disposal well network design (i.e., number and spacing of wells) will be utilized and aquifers for wastewater disposal will be selected to reduce conflict with other groundwater users;
• the wastewater injection wells will be drilled, completed and tested as per the requirements outlined in ERCB Directive 051: Injection and Disposal Wells - Well Classifications, Completions, Logging, and Testing Requirements (ERCB 1994). The Directive 051 applications will be well-specific;

Devon NEC Corporation Pike 1 Project Volume 2 – Environmental Impact Assessment June 2012
Page 16-15
• there will be separate disposal pipelines and wells for steam generation blowdown water and water softener regeneration wastewater. The facility design provides means to recycle streams within process constraints to minimize disposal volumes; and
• each disposal well will be equipped with flow metering and control automation at the wellsite (turbine meter, flow choke and pressure recorder). The wellhead injection pressure and disposal rate for each well will be monitored on a daily basis.
Project operations may affect the thermal regime of groundwater aquifers because the steam will be injected at a temperature far greater than those in the ambient groundwater. High temperature steam in the wellbore may result in the development of a thermal plume in those hydrostratigraphic units intersected by the steam assisted gravity drainage wellbores. The previous assessment of subsurface thermal plumes for the Jackfish 2 project estimated that for each well pad, the thermal plume is predicted to extend 40 to 150 m from the wellbore as a result of eight years of steam injection (Volume 2, Section 6.6.3). The variation in extent of the thermal plume between the different formations is largely the result of contrasting rates of forced convection which is a function of the groundwater flow velocity for that specific formation. To date, approximately five years after steaming at Jackfish 1 Well Pad B, the Groundwater Monitoring Program has not detected changes in temperatures, water levels, or water quality, approximately 30 m downgradient of the steam assisted gravity drainage injection wells. Given that the characteristics of the formations are the same as in the Jackfish 2 and Jackfish 3 assessments, the assessment of potential extent of thermal effects associated with the Project is expected to be similar. Devon is committed to monitoring groundwater in the vicinity of a representative well pad in the Project where steam injection will occur and will leverage the monitoring results to build on the learnings achieved at the Jackfish projects. Overall, Devon’s Groundwater Monitoring Program will be designed to detect changes in water quantity or quality due to subsurface thermal plumes. If, through the Groundwater Monitoring Program, a thermal plume is identified as migrating towards a surface waterbody or domestic water well, a site specific response plan will be implemented. The site specific response plan would incorporate detailed information about the situation which may include: identification of the aquifer, groundwater quality in the plume, distance to the receptor, estimated groundwater travel time to the receptor, and vulnerability of the receptor. The Groundwater Monitoring Program will ensure that Devon will have adequate time to respond to the subsurface mobilization of minerals as a result of a thermal plume, thereby effectively blocking potential exposure to downgradient receptors. Potential impacts to groundwater quality will be eliminated or minimized through appropriate design elements and effective management measures (Volume 2, Sections 6.6.4 and 6.8). On this basis, potential Project releases to groundwater were not included in the development of the inventory of chemical of potential concern (COPC).

Devon NEC Corporation Pike 1 Project Volume 2 – Environmental Impact Assessment June 2012
Page 16-16
Surface Water Releases
As described in Volume 2, Section 8.3, the Project has the potential to affect the water quality of local waterbodies through:
• direct disturbance during construction and operation of the Project;
• changes to water quality as a result of potential land disturbance causing changes in runoff characteristics, flow of the streams and erosion;
• spills of liquids that could affect surface water quality; and
• acidifying effects on local waterbodies as a result of air emissions from the Project. During construction (i.e., the development of roads, the CPF, well pads, pipelines and water crossings), the Project has the potential to directly affect the surface water quality via the introduction of sediment to local streams. Use of appropriate technologies and best management practices will minimize erosion and potential sediment loadings to streams. These best practices are identified in surface water quality (Volume 2, Section 8.6). Based on the effective implementation of these mitigation measures, the surface water quality assessment determined the final impact rating for construction activities to be low. Surface water quality could also be affected by runoff from the CPF, well pads and other disturbed areas through the introduction of sediment. In order to mitigate the potential negative effects of runoff, berms and stormwater collection ponds that collect surface runoff water from the CPF and well pads will be constructed. Prior to being released, runoff in the stormwater collection ponds will meet regulatory requirements. Contaminated runoff will be treated via an overland discharge system designed to reduce erosion and sedimentation in the surrounding environment. In order to ensure compliance with provincial and federal surface water quality regulations, monitoring will be implemented. Based on the proposed mitigation measures and planned monitoring, no chemical releases to the watershed are expected from the CPF and well pads and a low final impact rating was concluded (Volume 2, Section 8.6). Runoff associated with roads and utility corridors can potentially affect surface water quality via the introduction of sediment. Road runoff will be controlled using vegetated roadside ditches to collect and contain sediments, culverts and/or rock drains will be installed at drainage lows, wetlands and watercourse crossings. With implementation of these mitigation measures, the effects of runoff from roads and utility corridors on the surface water quality of the local waterbodies were given a low impact rating (Volume 2, Section 8.6). Effects on surface water quality due to wastewater releases during the construction and operation of the Project could result from the release of stormwater containing contaminants, waste streams from Project operations, septic/sewage waste and accidental spills of liquids that could reach waterbodies. However, as a result of the planned mitigation measures, process waters or other chemicals are not expected to be released to surface waterbodies. Therefore, the potential negative effects of wastewater releases on surface water quality were given a low impact rating (Volume 2, Section 8.6).

Devon NEC Corporation Pike 1 Project Volume 2 – Environmental Impact Assessment June 2012
Page 16-17
All lakes in the aquatic local study area (ALSA) and aquatic regional study area are adequately buffered against potential acidifying depositions. The final impact rating associated with acidifying emissions from the Project was predicted to be low (Volume 2, Section 8.6). Based on the planned mitigation measures and the conclusions in the surface water quality assessment (Volume 2, Section 8.6), chemical releases to surface waterbodies from the Project are not expected as a result of direct disturbance, changes in overland flow, spills or acidifying effects. As such, no chemicals were added to the chemical emissions inventory.
Final Chemical Emissions Inventory
Based on the findings of the air quality, hydrogeology and surface water quality assessments of the EIA, it was concluded that the only reasonable opportunity for exposure to the chemical emissions will result from those components of the Project that emit directly into the air. The chemical emissions inventory for the Project provided in the air quality assessment included CACs, VOCs, metals and minerals, PAHs and sulphur compounds.
Additional Considerations
Although the Project will not emit O3 directly to the atmosphere, it will emit its precursor chemicals, such as NOx and non-methane VOCs. Precursor chemicals react to form O3 downwind from emission sources under specific meteorological conditions (i.e., high solar radiation, high temperature and low wind speed, typically on a hot summer day). It is important to note that although some meteorological conditions lead to the reactions that produce O3, others favour its destruction. Also, reactions that create O3 can occur simultaneously with those that destroy O3. Because of the uncertainty associated with the sources of O3 in northeastern Alberta, the complexity of the chemical reactions associated with O3 formation and destruction and the possible transport of O3 over long distances, ground-level O3 concentrations were not quantitatively assessed in the HHRA. The potential for ozone formation is discussed in Volume 2, Section 4.7. An effective approach to assessing possible links between O3 concentrations and human health may be through the continuous monitoring of O3 concentrations in the region. Environment Canada and WBEA are carrying out ambient monitoring and photochemical modeling of O3 in the oil sands. This program was initiated in an effort to determine the roles that precursor emissions and photochemistry play in contributing to O3 levels in the region. Recognizing the value of this multi-stakeholder group, Devon is a WBEA member and plans to provide Project-specific air monitoring data in support of the expanded regional monitoring network.

Devon NEC Corporation Pike 1 Project Volume 2 – Environmental Impact Assessment June 2012
Page 16-18
16.6.1.2 Characterization of People Potentially at Risk People potentially at risk include sensitive or susceptible individuals who receive the highest exposures to the Project emissions. In this regard, consideration was given to:
• the people who are known or anticipated to spend time near the Project; • the lifestyles (e.g., consumption patterns) and physical characteristics of the individuals
in the health study area; and • the sensitivity or susceptibility of individuals in the region (e.g., infants and young
children, the elderly, individuals with compromised health). Locations at Which People Reside or Visit The HHRA recognizes that people may use the area in the vicinity of the Project for recreational or traditional activities, such as hunting, trapping or gathering plants. Emphasis was given to examining the potential health risks to people living and working in the area (i.e., within the AQRSA). The HHRA was expanded to include an assessment of the potential health risks to people at the location(s) where the maximum ground-level air concentrations in the AQRSA were predicted to occur. The air quality assessment considered two different MPOIs: i) the maximum concentration inside the AQLSA (AQLSA-MPOI); and, ii) the maximum concentration inside the air quality AQRSA (AQRSA-MPOI). In addition to the MPOIs, over 200 locations where people are known or anticipated to spend time were identified and assessed as part of the HHRA. These include:
• neighbouring communities and reserves; • cabins (>30); • recreational lodges, including Grist Lake, Winefred Lake and Christina Lake; • commercial operations, such as commercial campsites, a firefighter base camp, fire
lookouts, wild rice operations and a fish plant; • permanent worker housing complexes (i.e., camps) Cenovus, Devon, KNOC, MEG
Energy, Nexen Long Lake, CCS Janvier Waste Management Facility, Northgate Camp, CNRL Kirby, Petrobank Whitesands and May River, Statoil KKD, Perpetual Energy Kettle River Gas Plant and Operations, along with many other industrial campsites; and
• locations used for recreational or traditional purposes, such as campsites, grave sites, plant and berry gathering areas and hunting areas.
These locations are shown in relation to the Project on Figure 16.6-1. In general, maximum Project-related concentrations were predicted to occur in close proximity to the CPF emission sources and predicted to decrease with increasing distance from these sources (Volume 2, Section 4.0). The HHRA assessed potential health risks to people active within the AQLSA and AQRSA surrounding the Project. The MPOI for each chemical of COPC was predicted for the AQLSA-MPOI and AQRSA-MPOI.

!(
!(
!(
!(
!(
!(
!(
!(
!(
")
")
")
")
")")")
")
")
")
")
")
")
")
")
")
")
")
")
")")")
")")")
")
")")
")")")")
")")")")")
")
")
")
")
")
")
")")")")
")
")
")
")
")
")")")
")")
")
")
")
")
")
")
")")
")
")")
")")")
")
")
")")
")
")
")")
")
")
")
")")")")")
")")
")")")")
")")
")
")
")
")
")
")
")
")
")
")")")")
")
")
")
")")
")
")
")
")
")
")
")
")
")
")
")
")
")
")")
")
")
")
") ")
")
")
") ")
")
")
")
")
")
")
")
#*#*
#*
#*
#*
#*#*
#*
#*
#*
#*
#*
#*#*
#*#*
#*
#*
#*#*
#*#*
#*
#*
#*
#*
#*
#*#*
#*
#*
#* #*
#*
#*
#*
###
#*
#*
#*#*
WinefredLake
GristLake
LoganLake
CaribouLake
Christina
Saskatchewan
Alberta
Fort McMurray
Lac La Biche
ClearwaterRive
r
River
Athabasca
PrimroseLake
Lac La Biche
GordonLake
LacLa Loche
GarsonLake
!!63
Rive
r!!881
Anzac
Draper
Chard/Janvier
Conklin
Philomena
Gregoire Lake Estates
LegendAir Quality RSA
Air Quality LSA
CPF
Cold Lake Air Weapons Range
Open Water
Watercourse
Road
Receptor Locations
Pike 1 Project
May 22, 2012
Figure16.6-1
PROVIDED BY:
AMECFINAL MAPPING BY:
AMEC
Fig16.06-01 HH Receptor Locs.mxd
±M
ap P
ath:
S:\G
is\P
roje
cts\
CE
\Dev
on\0
4050
_Pik
e\A
rcG
IS P
roje
cts\
Volu
me
02 -
Sec
tion
16 H
uman
Hea
lth\F
ig16
.06-
01 H
H R
ecep
tor L
ocs.
mxd
A
naly
st -
Mat
t Mill
ard
Source: CNRL, Devon, MEG, GeoBase®, Spatial Data Warehouse Ltd.
10 0 10 205
Kilometres1:1000000
MEG Christina Lake Receptors
#* Additional Receptor
#* Additional Development
#* Camp
#* Community
#* First Nation Reserve
# Gas Plant
#* Hunter/Trapper Cabin
#* Recreation Receptor
CNRL Kirby Receptors
Cabin
Camp
Commercial
Community
Grave Site
Lodge
MPOI
Recreational
Worker Camp
Devon Jackfish3 Receptors
") Cabin Location
") Commercial Campsite
") Commercial Recreational
") First Nation Reserve
") Firefighter Base Camp
") Horse Holding Area
") Hunting Lodge
") Industrial Campsite
") Metis Location
") Metis Residence
") Non-industrial campsite
") Recreation Area
") Recreational Campsite
") Residence

Devon NEC Corporation Pike 1 Project Volume 2 – Environmental Impact Assessment June 2012
Page 16-20
Characterization of Receptor Groups
Health risk assessments in the Oil Sands Region commonly establish various lifestyle categories that represent groups of people that share common behavioural characteristics, such as time spent on the land or particular dietary patterns. These groups are, therefore, assumed to receive similar levels of exposure to the COPCs. The MPOIs and 219 different discrete receptor locations were assigned to the following three receptor groups:
• MPOIs – includes the locations where the maximum ground-level air concentrations in the AQLSA and AQRSA are predicted to occur. The health risks for these locations are based on short-term exposures only;
• Aboriginals – includes all locations other than the commercial operations and worker housing complexes. Individuals within this group are assumed to use the cabins, recreational areas, lodges, etc. on a permanent basis. As well, this group is assumed to be actively engaged in traditional use of the neighbouring lands. The HHRA assumed that all residents of the area were part of the Aboriginal group. The health risks for this group are based on both short-term and long-term exposures. This group includes 137 discrete receptor locations; and
• Workers – includes all workers who reside at the worker housing complexes during the time of their employment or are employed at one of the commercial operations. Like the Aboriginal group, the health risks for the worker group are based on both short-term and long-term exposures. This group includes 82 discrete receptor locations.
The individuals with the highest predicted exposure of each lifestyle category were conservatively assumed to represent the potential health risks for all of the people assessed as part of that particular lifestyle category. Each lifestyle category is described in greater detail in the sections that follow.
Aboriginal Group
This group is represented by 137 fixed locations corresponding to actual cabins, lodges, traditional land use areas, etc. found in the AQRSA. In order to assess the potential health risks that might impact the people at these locations, it was necessary that all age classes or life stages be considered. The five life stages used to assess potential health risks to the area residents are consistent with Health Canada guidance for the Canadian general population (Health Canada 2009a):
• Infant – 0 to 6 months (0.5 years); • Toddler – 7 months to 4 years (4.5 years); • Child – 5 to 11 years (7 years); • Teen – 12 to 19 years (8 years); and • Adult – 20 to 80 years (60 years).

Devon NEC Corporation Pike 1 Project Volume 2 – Environmental Impact Assessment June 2012
Page 16-21
Similarly, the physical characteristics of the area residents were obtained from documents published by Health Canada (2009a). For the assumed physical characteristics for the HHRA, see Table 16.6-2.
Table 16.6-2: Assumed Physical Characteristics of the Aboriginal Group
Physical Characteristics Life Stages
Infant Toddler Child Teen AdultBody weight (kg) 8.2 16.5 32.9 59.7 70.7 Inhalation rate (m³/d) 2.2 8.3 14.5 15.6 16.6 Soil ingestion rate (g/d) 0.02 0.08 0.02 0.02 0.02 Water ingestion rate (L/d) 0.3 0.6 0.8 1.0 1.5 Body surface area (cm²) – hands – arms – legs – total body
320 550 910
3 620
430 890
1 690 6 130
590
1 480 3 070
10 140
800
2 230 4 970
15 470
890
2 500 5 720
17 640 Soil adherence factor (g/cm²/d) – hands – surfaces other than hands
0.0001
0.00001
0.0001
0.00001
0.0001
0.00001
0.0001
0.00001
0.0001
0.00001
Although people would likely only occupy the cabins and many of the other locations in the area during traditional or recreational activities, the actual time spent at these locations could not be definitively determined. As such, it was assumed that people would maintain permanent residency at the cabins and other locations for their entire lifetimes. As the MPOIs are not fixed locations, people were assumed to be situated at the MPOIs for periods of 24 hours or less. Due to the short-term nature of their potential exposure to the COPCs at these locations, people were assessed on an acute basis only for the AQLSA and AQRSA-MPOIs. It was assumed, for the purpose of the HHRA that the Aboriginal residents would:
• be present at the select locations 24 hours per day, 365 days per year over an 80-year lifespan;
• practice a subsistence lifestyle, such that all traditional and non-traditional foods would be obtained from local sources;
• drink water from local waterbodies; and • swim in local waterbodies three months of the year (i.e., during the summer months). It was conservatively assumed that the Aboriginal residents would obtain all (100%) of their food from local, natural food sources (e.g., wild game, fish, berries and plants). Consumption rates for wild game were based on Health Canada’s food ingestion rates for Canadian First Nations populations in combination with the frequency of consumption reported for Native Canadians near Wood Buffalo National Park by Wein et al. (1991). Food consumption patterns were obtained by repeated 24-hour food recall surveys: two surveys were completed between late
Devon NEC Corporation Pike 1 Project Volume 2 – Environmental Impact Assessment June 2012
Page 16-22
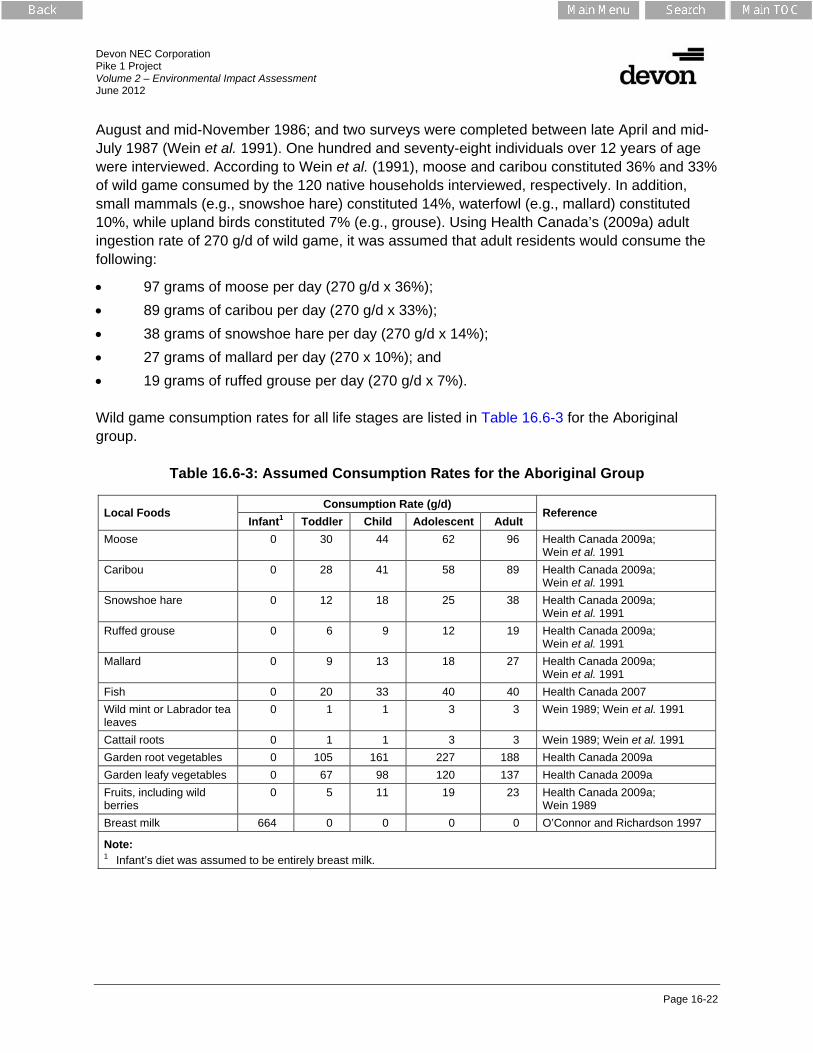
August and mid-November 1986; and two surveys were completed between late April and mid-July 1987 (Wein et al. 1991). One hundred and seventy-eight individuals over 12 years of age were interviewed. According to Wein et al. (1991), moose and caribou constituted 36% and 33% of wild game consumed by the 120 native households interviewed, respectively. In addition, small mammals (e.g., snowshoe hare) constituted 14%, waterfowl (e.g., mallard) constituted 10%, while upland birds constituted 7% (e.g., grouse). Using Health Canada’s (2009a) adult ingestion rate of 270 g/d of wild game, it was assumed that adult residents would consume the following:
• 97 grams of moose per day (270 g/d x 36%); • 89 grams of caribou per day (270 g/d x 33%); • 38 grams of snowshoe hare per day (270 g/d x 14%); • 27 grams of mallard per day (270 x 10%); and • 19 grams of ruffed grouse per day (270 g/d x 7%). Wild game consumption rates for all life stages are listed in Table 16.6-3 for the Aboriginal group.
Table 16.6-3: Assumed Consumption Rates for the Aboriginal Group
Local Foods Consumption Rate (g/d)
Reference Infant1 Toddler Child Adolescent Adult
Moose 0 30 44 62 96 Health Canada 2009a; Wein et al. 1991
Caribou 0 28 41 58 89 Health Canada 2009a; Wein et al. 1991
Snowshoe hare 0 12 18 25 38 Health Canada 2009a; Wein et al. 1991
Ruffed grouse 0 6 9 12 19 Health Canada 2009a; Wein et al. 1991
Mallard 0 9 13 18 27 Health Canada 2009a; Wein et al. 1991
Fish 0 20 33 40 40 Health Canada 2007 Wild mint or Labrador tea leaves
0 1 1 3 3 Wein 1989; Wein et al. 1991
Cattail roots 0 1 1 3 3 Wein 1989; Wein et al. 1991 Garden root vegetables 0 105 161 227 188 Health Canada 2009a Garden leafy vegetables 0 67 98 120 137 Health Canada 2009a Fruits, including wild berries
0 5 11 19 23 Health Canada 2009a; Wein 1989
Breast milk 664 0 0 0 0 O’Connor and Richardson 1997
Note: 1 Infant’s diet was assumed to be entirely breast milk.

Devon NEC Corporation Pike 1 Project Volume 2 – Environmental Impact Assessment June 2012
Page 16-23
For health risks related to fish, Health Canada (2007) assumed an adult subsistence consumption rate of 40 grams of fish per day. This value was obtained from a Market Facts of Canada (1991) study on national seafood consumption and a Bureau of Chemical Safety (BCS) evaluation of current intake rates by Canadian consumers (BCS 2004). The BCS (2004) study considered the information provided in multiple studies and recommended subsistence consumption rates that included consideration of sport, subsistence and Aboriginal fish eaters. Similar fish consumption rates have been reported in the 1997 diet and activity survey conducted in Swan Hills by AHW where the ‘medium consumer’ was reported to ingest 47 grams of fish per day (AHW 1997) and in a 1999 survey conducted by Health Canada of an Aboriginal population in the Lesser Slave Lake region of Alberta where a moderate consumer was reported to consume on average about 46 grams of fish per day (AHW 2009). Plant consumption rates were segregated into traditional aboveground plants (e.g., wild mint and Labrador tea leaves) and below ground plants (e.g., cattail root), as well as garden aboveground vegetables (e.g., lettuce) and below ground vegetables (e.g., potatoes). Wein (1989) provides a consumption rate of 134 g/d, which was adjusted by the frequency of 2% (i.e., 7 days in 365 days) at which wild mint and Labrador tea leaves were reportedly consumed in the Native households interviewed (Wein et al. 1991). From this, an adult consumption rate of 3 g/d was assumed for traditional aboveground plants (e.g., wild mint and Labrador tea leaves). Wein et al. (1991) reports that wild roots were seldom used in the Native households interviewed and does not provide any consumption data for wild roots. As a result, it was assumed for the HHRA that the consumption rates for traditional below ground and aboveground plants were equivalent (i.e., 3 g/d). Health Canada provides vegetable (root and other) ingestion rates for the Canadian general population based on 24-hour recall data collected in 1970 and 1972 as part of the Nutrition Canada Survey (Health Canada 1994, 2009a). The dietary survey involved a statistically representative sample of the Canadian population, personal interviews conducted by trained interviewers and 3D models of meal portions to assist in determining food portion sizes for some 180 different foods. Summary data are provided by Health Canada for vegetable (root and other) ‘eaters only’, which exclude individuals reporting no vegetable consumption. Using statistics for ‘eaters only’ ensures that the consumption rates of the individuals who consume the majority of the vegetables are not under estimated. Health Canada’s vegetable ingestion rates were used to assess potential health risks associated with the consumption of garden vegetables. Infant consumption rates for solid foods (i.e., vegetables and game meat) were reduced to reflect changing dietary patterns in the Canadian population. Specifically, the consumption rates for game, berries, fish, game, aboveground plants and belowground plants were assumed to be zero (Table 16.6-3). The assumption is based on the following:
• the infant consumption rates for aboveground and below ground produce in the most recent Health Canada (2009a) guidance are based on O’Connor and Richardson (1997), which is based on data obtained in a Nutrition Canada Survey between 1970 and 1972;

Devon NEC Corporation Pike 1 Project Volume 2 – Environmental Impact Assessment June 2012
Page 16-24
• the infant consumption rates for game and fish meat in the most recent Health Canada (2009a) guidance are zero; and
• Health Canada (1994) states the following – “In Canada, infant feeding practices have changed dramatically over the last 30 years (Tanaka et al. 1987; Health and Welfare Canada 1991). Recent studies indicate that a majority of Canadian mothers breast-feed; breast-feeding initiation rates are close to 80%, with 30% still breast-feeding their infants after 6 months. The intake of breast milk peaks between 4 to 6 months of age. Solid foods are introduced to approximately 50% of infants by 4 months of age and 89.5% by 6 months of age. To reflect these practices, estimation of total daily intake is generally based on the assumption that a typical infant is exclusively breast-fed up to 6 months of age, after which foods are consumed in the quantities determined in the Nutrition Canada Survey”.
Therefore, the HHRA assumed that infant consumption rates for berries, vegetables, traditional plants, game meat and fish were zero for the first six months of age.
Worker Group
The workers were represented by 82 discrete locations corresponding to the commercial operations and worker housing complexes. It was assumed that these housing complexes would be occupied by adult workers only. Assumed physical characteristics as recommended by Health Canada (2009a) for adult construction workers are provided in Table 16.6-4.
Table 16.6-4: Assumed Physical Characteristics of Adult Workers
Physical Characteristics Adult Worker Body weight (kg) 70.7 Inhalation rate (m³/d) 33.61
Soil ingestion rate (g/d) 0.1 Water ingestion rate (L/d) 1.5 Body surface area (cm²) – hands – arms – legs – total body
890
2 500 5 720
17 640 Soil adherence factor (g/cm²/d) – hands – surfaces other than hands
0.0001
0.00001
Notes: 1 Health Canada (2009a) provides inhalation rates for both male and female workers.
Because the inhalation rate for the male worker is higher, it results in a higher exposure estimate and subsequently a higher health risk estimate. On this basis, the inhalation rate for the male worker was used in the HHRA.

Devon NEC Corporation Pike 1 Project Volume 2 – Environmental Impact Assessment June 2012
Page 16-25
Although workers would likely only reside at the housing complexes during their years of employment, it was conservatively assumed that they would maintain permanent residency at the housing complexes over their entire adult life. As such, workers could be continuously exposed to the Project emissions on a long-term basis; specifically, 24 hour per day, 365 days per year for an assumed 60 years of adult life (Health Canada 2009a). It was further assumed that workers would obtain all of their food and water from the housing complex, which in turn would obtain all food from offsite sources.
Sensitive and Susceptible Individuals
Sensitive and susceptible individuals were, in part, addressed in the HHRA through the use of health-based exposure limits developed by leading scientific authorities and regulatory agencies as objectives, guidelines or standards for the protection of human health. These exposure limits are typically based on highly conservative assumptions, as the mandate of the authorities and regulatory agencies is to offer guidance aimed at the protection of all persons. More information on the exposure limits used in the HHRA is provided as part of the toxicity assessment (Section 16.4) and Volume 3, Appendix L1.
16.6.1.3 Exposure Pathway Identification
Exposure pathways refer to the various avenues by which the chemical emissions might “travel” from the Project to the people living in the local area and who might frequent the area (Health Canada 1995; US EPA 2002). Since the emissions will be released directly into air from various sources, an obvious pathway by which the people could be exposed is via inhalation; less obvious pathways could also exist and these were explored as part of the HHRA. Direct inhalation of air (i.e., primary pathway of exposure) was assumed to be an applicable exposure pathway for residents, workers and recreational persons. This exposure pathway was determined to be the only applicable pathway of exposure for the recreational persons, as these individuals would not be expected to frequent and remain in the area for extended time periods (i.e., equal to or less than a 24-hour period). Residents and workers, however, might also be exposed to the chemical emissions on a long-term basis through secondary exposure pathways (e.g., inhalation of dust, food and water ingestion and dermal contact). For example:
• some chemicals emitted to air could potentially be deposited onto soils surrounding the Project. Depending on the volatility of the chemical, deposition could affect local soil concentrations. Exposure through dust inhalation, inadvertent ingestion of soil and dermal contact with soil were necessarily included in the HHRA;
• concentrations of some chemicals in local vegetation could be affected by both direct deposition of atmospheric emissions onto plant surfaces and uptake from soils. As a result, exposure through ingestion of local plants was necessarily included in the HHRA; and

Devon NEC Corporation Pike 1 Project Volume 2 – Environmental Impact Assessment June 2012
Page 16-26
• concentrations of some chemicals in local wild game could be affected by both the direct inhalation of the atmospheric emissions and the ingestion of the chemicals in soil, soil invertebrates, plants and water. Exposure through ingestion of local wild game was necessarily included in the HHRA.
A complete listing of the exposure pathways included in the HHRA for each of the lifestyle categories is provided in Table 16.6-5. Although in certain cases the opportunity for exposure is quite limited, the pathways were still included to ensure that potential exposures would not be overlooked.
Table 16.6-5: Exposure Pathways Assessed for the Lifestyle Categories
Exposure Pathway Lifestyle Category Aboriginals Workers
Inhalation Inhalation of air Inhalation of dust Ingestion
Ingestion of soil (inadvertent) Ingestion of local surface water as drinking water x Ingestion of local surface water while swimming (inadvertent)
x
Ingestion of local wild game x Ingestion of local fish x Ingestion of local, natural foods (i.e., berries, cattail roots and tea leaves)
x
Ingestion of local, garden foods (i.e., fruits and vegetables) x
Dermal Contact
Dermal contact with soil Dermal contact with surface water while swimming x
Notes: Exposure pathway is applicable for the lifestyle category.
x Exposure pathway is not applicable for the lifestyle category.
16.6.2 Exposure Assessment
The primary objective of the exposure assessment is to estimate, based on the use of reasonable worst-case assumptions, potential chemical exposures received by the local residents as well as people who might visit or frequent the area for work, recreation or other purposes. Since the emissions will be released directly into air from various sources, people could be exposed via the primary exposure pathway of inhalation over both the short-term and long-term. Potential health risks associated with the inhalation of the chemical emissions are evaluated in the inhalation assessment, discussed in detail in the section that follows.

Devon NEC Corporation Pike 1 Project Volume 2 – Environmental Impact Assessment June 2012
Page 16-27
As a principal outcome of the problem formulation step of the assessment (Section 16.4), it was determined that residents and workers might also be exposed to the chemical emissions on a long-term basis through secondary exposure pathways. Potential health risks associated with the secondary pathways of exposure are assessed in the multiple pathway assessment. Details concerning the multiple pathway assessment are provided below.
16.6.2.1 Inhalation Assessment
Inhalation exposure estimates were based on the results of air dispersion modeling described in the air quality assessment (Volume 2, Section 4.0). The modeling results consisted of the maximum predicted ground-level air concentrations of the chemicals emitted from the Project that could occur at each of the fixed locations identified in the problem formulation step of the assessment (Section 16.4). The inventory of chemicals emitted by the Project as well as the fixed locations at which people are known or anticipated to spend time were provided in Table 16.6-1 and Figure 16.6.1, respectively. Each of the chemicals identified in the air emissions inventory was included in the inhalation assessment provided that inhalation exposure limits were available for the chemical. Predicted ground-level air concentrations of the chemicals emitted from the Project were evaluated in association with different averaging periods (i.e., 10-minute, 1-hour, 8-hour, 24-hour and annual) to allow for the assessment of both short-term and long-term inhalation health risks. On a short-term basis, maximum (1st highest) 10-minute, 1-hour, 8-hour or 24-hour ground-level air concentrations were used to evaluate potential health risks in the order of 24 hours or less. Exceptions include 1-hour NO2, 1-hour SO2 and 24-hour PM2.5, consistent with the required form of the United States Environmental Protection Agency Office of Solid Waste (US EPA) and CCME standards, respectively. Long-term health risks were assessed using maximum (1st highest) annual average ground-level air concentrations. In addition to the Project emissions, air quality (Volume 3, Appendix C1) provided predictions under the Baseline Case, Application Case and PDC for emissions associated with all major regional sources. The non-industrial sources include residential traffic emissions, highway traffic and domestic and commercial heating emissions from communities. Because air quality was able to adequately characterize existing conditions in the area, further background or ambient concentrations were not added to the predicted values in the HHRA.
16.6.2.2 Multiple Pathway Assessment
In order to assess the potential health risks associated with possible secondary pathways, it was necessary to identify those chemicals potentially emitted by the Project that, although emitted into air, could be deposited nearby and possibly persist or accumulate in the environment. For this purpose, the HHRA used a step-wise process to identify those chemicals that could lead to exposure via secondary pathways:
Devon NEC Corporation Pike 1 Project Volume 2 – Environmental Impact Assessment June 2012
Page 16-28
Step 1: Comparison of Physical-Chemical Properties with Established Criteria for Volatility The purpose of this step is to identify all emitted COPCs that are non-volatile and thus have the potential to accumulate in media other than air, in accordance with the following criteria from the US EPA (2003):
• molecular weight ≥200 g/mol; • Henry’s Law Constant ≤0.00001 atm-m³/mol (or 1.0E-05 atm-m³/mol); and • vapour pressure ≤0.001 mmHg (or 1.0E-03 mmHg). Step 2: Comparison of Octanol-Water Partition Coefficients (Kow) For COPCs that were identified as volatile in Step 1, another screening step was completed where the Log Kow values for these volatile substances were evaluated. In the event that the Log Kow for a COPC exceeded 3.5, indicating a potential to bioaccumulate, the COPC was carried forward to Step 3. Step 3: Fugacity Modeling For COPCs from Step 2 that had Log Kow values greater than 3.5, fugacity modeling was completed to determine the potential relative apportionment of the chemical within environmental compartments other than air. Fugacity model results were based on the Level III fugacity model developed by US EPA (2011) that adheres to methods developed by Mackay et al. (1992; 1993). If a COPC was found to be less than 95% in air, or more than 5% in environmental compartments other than air (i.e., water, soil or sediment), the COPC was included in the multiple exposure pathway assessment since it was assumed there was potential for persistence and accumulation within soils, plants or other biota (Boethling et al. 2009). Physical-chemical properties were adopted from Syracuse Research Corp. (SRC 2011), or, if a property was not available from SRC 2011, the EPI Suite program developed by US EPA (2011) was searched. However, for the petroleum hydrocarbon fractions, physical-chemical properties were sourced from CCME (2008). Table 16.6-6 summarizes the relevant physical-chemical properties for each of the chemicals emitted from the Project and identifies those COPCs to be included in the multiple exposure pathway assessment. The results of the physical-chemical screening revealed that, in addition to the metals automatically included, 26 COPCs are eligible for inclusion in the multiple pathway assessment. The premise of this exercise is that if a chemical that is emitted to the air does not meet any of the criteria, the potential for the chemical to deposit near the Project and persist or accumulate in the environment is negligible and only limited opportunity exists for exposure via secondary pathways. However, if a chemical meets any one of the criteria, sufficient opportunity could be presented for exposure via secondary pathways and the chemical was retained in the multiple pathway assessment.

Devon NEC Corporation Pike 1 Project Volume 2 – Environmental Impact Assessment June 2012
Page 16-29
Table 16.6-6: Identification of the Non-Volatile Chemicals Emitted from the Project
Chemical1
Step 1 Step 2 Step 3 Included in Multiple
Pathway Assessment
Molecular Weight (g/mol)
Henry’s Law Constant (atm-m³/mol)
Vapour Pressure (mm Hg) Log Kow Fugacity
> 200 < 0.00001 < 0.001 > 3.5 < 95% (air)
Acids Carboxylic acids 228.0 0.00000000000067 0.0000014 - - Yes Sulphuric acid 98.08 0.00000000000765 0.0000593 - - Yes
Volatile Organic Compounds (VOCs) 1,3-Butadiene 54.09 0.0736 2 110.0 1.99 - No Acetaldehyde 44.05 0.0000667 902.0 -0.34 - No Acrolein 56.07 0.000122 274.0 -0.01 - No Aliphatic Aldehydes2 58.08 0.0000734 317.0 0.59 - No Benzaldehyde 106.13 0.0000267 1.27 1.48 - No Benzene 78.12 0.00555 94.8 2.13 - No Dichlorobenzene 147.0 0.00355 1.47 3.28 - No Ethylbenzene 106.17 0.00788 9.6 3.15 - No Formaldehyde 30.03 0.000000337 3 890.0 - - Yes Methacrolein 70.09 0.000232 155.0 0.74 - No n-Hexane 86.18 1.8 151.0 3.9 100 No n-Pentane 72.15 1.25 514.0 3.39 - No Toluene 92.14 0.00664 28.4 2.73 - No Xylenes 106.17 0.00642 7.91 3.16 - No
Polycyclic Aromatic Hydrocarbons (PAHs) 2-Methylnaphthalene 142.0 0.000518 0.055 3.86 94 Yes 3-Methylcholanthrene 268.0 0.00000526 0.000000043 - - Yes 7,12-Dimethylbenz(a)anthracene 256.35 0.00000376 0.00000068 - - Yes Acenaphthene 154.21 0.000184 0.00215 3.92 76 Yes Acenaphthylene 152.2 0.000114 0.00668 3.94 85 Yes Anthracene 178.24 0.0000556 0.00000653 - - Yes Benzo(a)anthracene 228.3 0.000012 0.00000021 - - Yes Benzo(a)pyrene 252.32 0.000000457 0.0000000055 - - Yes Benzo(b)fluoranthene 252.32 0.000000657 0.0000005 - - Yes Benzo(g,h,i)fluoranthene 226.28 0.0000013 0.0000002 - - Yes Benzo(g,h,i)perylene 276.34 0.000000331 0.0000000001 - - Yes

Devon NEC Corporation Pike 1 Project Volume 2 – Environmental Impact Assessment June 2012
Page 16-30
Chemical1
Step 1 Step 2 Step 3 Included in Multiple
Pathway Assessment
Molecular Weight (g/mol)
Henry’s Law Constant (atm-m³/mol)
Vapour Pressure (mm Hg) Log Kow Fugacity
> 200 < 0.00001 < 0.001 > 3.5 < 95% (air) Benzo(k)fluoranthene 252.32 0.000000584 0.00000000097 - - Yes Chrysene 228.3 0.00000523 0.0000000062 - - Yes Cyclopenta(cd)pyrene 226.28 0.000000865 0.0000005 - - Yes Dibenzo(a,h)anthracene 278.36 0.000000141 0.00000000095 - - Yes Fluoranthene 202.26 0.00000886 0.00000922 - - Yes Fluorene 166.0 0.0000962 0.0006 - - Yes Indeno(1,2,3-cd)pyrene 276.34 0.000000348 0.00000000013 - - Yes Naphthalene 128.18 0.00044 0.085 3.3 - No Phenanthrene 178.24 0.0000423 0.000121 - - Yes Pyrene 202.26 0.0000119 0.0000045 - - Yes
Petroleum Hydrocarbon Fractions (PHCs) Aliphatic C5-C8 100.0 1.2 47.88 3.8 100 No Aliphatic C9-C16 200.0 12.0 0.03648 6.91 100 No Aliphatic C17-C34 270.0 120.0 0.00084 - - Yes Aromatic C9-C16 150.0 0.0013 0.03648 3.6 94 Yes Aromatic C17-C34 240.0 0.000016 0.00000033 - - Yes
Sulphur Compounds CS2 76.14 0.0144 359.0 1.94 - No H2S 34.08 0.00856 15 600.0 0.23 - No
Notes: Bold values indicate that the physical-chemical parameter meets or exceeds the criterion. – = not applicable or indicates that the step was not completed for the chemical, based on exceeding the criteria in the previous step. 1 CACs were not included in the physical-chemical screening as these chemicals predominantly exist in air and therefore, they strictly relate to inhalation exposures. Metals were not included in the
physical-chemical screening because metals were automatically included in the multiple exposure pathway assessment. 2 Propionaldehyde was the chemical surrogate for this chemical group. Therefore, physical-chemical properties of propionaldehyde was used to represent the aliphatic aldehyde group.

Devon NEC Corporation Pike 1 Project Volume 2 – Environmental Impact Assessment June 2012
Page 16-31
The findings of the exercise indicate that 53 of the chemicals emitted from the Project could contribute to human exposure via secondary pathways and thus were evaluated in the multiple pathway assessment. These include:
• 2 acids, including carboxylic acids and sulphuric acid; • 27 metals and minerals; • 20 PAHs; and • 4 VOCs, including aliphatic C17-C34, aromatic C9-C16, aromatic C17-C34 and
formaldehyde. Determination of potential exposure to these chemical emissions through various secondary pathways relied on both background or ambient measurements and predictive exposure modeling. The former approach involved the monitoring of these chemicals in environmental media, preferably in the area of the Project and was accomplished via the simple collection and quantification of the chemicals to provide estimates of ambient levels. Whenever possible, this approach was used to characterize the ambient concentrations of the chemicals in the environmental media. The second approach involved using predictive models to estimate the concentrations of the chemicals emitted from the Project in environmental media for each of the assessment cases (i.e., Baseline Case, Application Case and PDC). Further details concerning each approach are provided below.
Ambient Measurements
As part of the ambient sampling program completed in support of the Project, concentrations of metals and PAHs have been measured in soil, vegetation, sediment and surface water in the vicinity of the Project. In addition, measured concentrations of COPCs in wild game for grouse, hare and moose from the oil sands region were available from WBEA. Complete details surrounding the sampling data used in the multiple pathway assessment to characterize background or ambient conditions are provided in Volume 3, Appendix L2. A summary of the ambient site-specific sampling data for the Project is provided below.
• soil and vegetation – 10 samples of soil were collected within the terrestrial local study area (TLSA). In addition, three species of vegetation were collected: two that are known to be consumed traditionally by humans (Labrador tea leaves and berries) and one that represents forage vegetation consumed by wildlife (alder leaves). Ten samples of Labrador tea leaves, 11 samples of alder leaves and 12 samples of berries have been collected within the TLSA. No samples of cattail were collected within the TLSA. However, cattail samples were collected as part of the baseline sampling programs in support of EIA applications for other projects in the vicinity of the Project. Therefore, the cattail data was supplemented from data available from the Devon Jackfish 2 sampling program, Cenovus Christina Lake sampling program and MEG Christina Lake sampling program (n=31);

Devon NEC Corporation Pike 1 Project Volume 2 – Environmental Impact Assessment June 2012
Page 16-32
• sediment – samples were collected from 2006 to 2011 from waterbodies and watercourses within the ALSA. Fifteen sediment samples were analyzed for metals and thirteen samples were analyzed for PAHs;
• surface water – in support of the Project, numerous surface water samples have been collected from waterbodies within the surface water quality study area and analyzed for a suite of metals and PAHs. Samples were collected from 20 different waterbodies and watercourses within the surface water quality study area. Water samples were collected between 2002 and 2012 from Christina Lake, Hay Lake, Kirby Lake, Winefred Lake, Monday Creek, Sandy River and its tributaries and other watercourses. Additionally, surface water samples collected in support of previous Jackfish projects were included as part of the surface water data set. For the purpose of the HHRA, measured surface water concentrations were assumed to represent ambient or background chemical concentrations in wildlife and Aboriginal drinking water, as well as for baseline concentrations in surface water for fish exposure and for predicting dermal exposure from swimming; and
• fish – samples of fish were collected in 2010 from various waterbodies and watercourses within the ALSA. With the inclusion of sample duplicates, statistics of metals analyzed in fish were calculated for 38 fish samples. PAHs in fish were not analyzed.
The Terrestrial Environmental Effects Monitoring Program, which is part of WBEA, commissioned a traditional food sampling study that included the sampling of wild game in 1999 and 2000 in the oil sands region, with metals being analyzed in wild game (i.e., hare, grouse and moose). Concentrations of metals identified as COPCs were used to characterize baseline concentrations of COPCs in game meat. In addition, data from a report by Alberta Health and Wellness on arsenic exposure (AHW 2007b) was used to estimate arsenic concentrations in moose meat. Chemical concentrations measured during the sampling programs described above were used to characterize ambient exposures for the residents and workers in the multiple pathway assessment (Table 16.6-7). For the environmental concentrations of the COPCs used in the HHRA, see Volume 3, Appendices L2, L3, L4, and L5. COPCs associated with the Screening Level Wildlife Risk Assessment are presented in Appendix L6.

Devon NEC Corporation Pike 1 Project Volume 2 – Environmental Impact Assessment June 2012
Page 16-33
Table 16.6-7: Ambient Concentrations used in Multiple Pathway Assessment
Media Description
Soil Metal concentrations were typically at or above the method detection limits (MDLs) in soil. Sufficient soil data were available for the calculation of the 95% upper confidence level of the mean (95UCLM) in many instances. More than 80% of the soil samples were non-detect for arsenic and cobalt, while 100% of the soil samples were non-detect for antimony, cadmium, silver and tin. All PAHs were non-detect and thus measured PAH concentrations in soil were not incorporated in the multiple pathway models. Further details are provided in Volume 3, Appendix L2.
Vegetation In most instances, metals were detected at or above the MDLs in vegetation with sufficient vegetation data to allow for the calculation of the 95UCLM. All PAHs were non-detect and thus measured PAH concentrations in vegetation were not incorporated in the multiple pathway models. Further details are provided in Volume 3, Appendix L2.
Surface Water Either the 95UCLM or maximum value was used to characterize background concentrations of the COPCs in surface water, depending on the sample size of the data and the number of detected concentrations of COPCs in the dataset.
Additional detail on the surface water sampling program is provided in Volume 3, Appendix L2.
Sediment Concentrations of metals and PAHs in sediment were largely at or above the MDLs. In most cases, the 95UCLM was used to represent baseline concentrations for sediment. In a few cases, the maximum or 95th percentile was used when data were insufficient. Further details are provided in Volume 3, Appendix L2.
Fish The 95UCLM was used to characterize baseline fish tissue concentrations of the COPCs in the assessment. However, if insufficient data were available to calculate a 95UCLM, maximum values were used. Further details are provided in Volume 3, Appendix L2.
Game Meat Wild game traditionally consumed by local residents (i.e., moose, ruffed grouse and snowshoe hare), were measured at or above the MDL for most metals. Whenever possible, 95UCLMs were used in the multiple pathway exposure model. Further details are provided in Volume 3, Appendix L2.
Predictive Exposure Modeling
Predictive exposure models rely on the use of mathematical equations (algorithms) that define the movement of the chemicals from the point of release of the chemicals into the air to the point of contact with humans (Health Canada 1995; US EPA 2002). The following data were considered as part of the predictive exposure modeling:
• the maximum ground-level air concentrations of a chemical as a result of atmospheric emissions from the Project, in combination with those from other regional sources;
• the various physical-chemical characteristics (e.g., water solubility, volatility, deposition rates) that determine the fate and transport of the chemical in various environmental media and the food chain;
• the concentration of each chemical transported from air to other environmental compartments (e.g., soil, water, vegetation, wildlife);

Devon NEC Corporation Pike 1 Project Volume 2 – Environmental Impact Assessment June 2012
Page 16-34
• the ambient or background concentration of each chemical measured in samples of environmental media (i.e., soil, vegetation, sediment and surface water);
• the various exposure pathways identified in the problem formulation (Section 16.6.1) that could potentially contribute to uptake by humans;
• absorption characteristics of each chemical once exposure has occurred; and
• the activity patterns and characteristics of human receptors (e.g., respiration rate, food consumption).
The multiple pathway models predicted concentrations of the chemicals in environmental media for the Baseline Case, Application Case and PDC based on atmospheric deposition of the maximum predicted annual air concentrations for the two receptor groups. When possible, these predicted concentrations were added to the existing (or measured) concentrations to arrive at the cumulative exposures associated with each assessment case. The general approach to predicting chemical concentrations in environmental media is summarized in Table 16.6-8. To compensate, in part, for the uncertainty surrounding the use of modeled predictions of exposure, reasonable worst-case assumptions were applied to describe the movement of the chemicals to ensure that the predictions do not understate the potential risks. The uncertainties addressed and the assumptions used in the HHRA are documented as part of the risk characterization step of the assessment (Section 16.6.4). Additional details regarding the predictive exposure models used in the multiple pathway assessment are provided in Volume 3, Appendix L3.
16.6.3 Toxicity Assessment
The toxicity assessment involves identifying and understanding potential health effects that can result from exposure to each chemical emitted from the Project and the conditions under which these effects might be observed. The assessment relied on the following guiding principles that have been proven through years of scientific investigation and observation:
• the health effects produced by a chemical depend on both the intrinsic toxicity of the substance and the exposure, or dose, of the chemical that is received. Potential health effects associated with exposures to the chemical emissions and the basis of the individual chemical exposure limits, are described in Volume 3, Appendix L1;
• with few exceptions, the inherent toxicity of a chemical (i.e., the capacity to produce a harmful effect or physiological injury) is only expressed if the exposure exceeds a critical threshold level. Below this threshold dose, injury does not occur and health effects are not observed. A possible exception to this principle involves the actions of certain chemical carcinogens that act via genetically mediated mechanisms to produce certain forms of cancer. Some scientists contend that no safe dose levels exist for these carcinogens (Health Canada 2009b). Other scientific authorities disagree and argue that

Devon NEC Corporation Pike 1 Project Volume 2 – Environmental Impact Assessment June 2012
Page 16-35
Table 16.6-8: Environmental Concentrations Used in the Multiple Pathway Assessment
Media Description
Air Air dispersion modeling incorporated meteorological data that represented conditions contributing to maximum predicted ground-level air concentrations of the COPCs. The maximum annual air concentrations were predicted for each of the identified locations at which people are known or anticipated to spend time on a long-term basis.
Soil Ambient concentrations of metals were measured in soil. The soil concentrations used in the multiple pathway assessment were predicted for the Aboriginal group and worker group. Whenever possible, 95UCLMs were used in the multiple pathway models. All PAHs were non-detect and thus ambient PAH concentrations in soil were not incorporated in the multiple pathway models.
In general, soil concentrations were predicted based on: • ambient measurements; • 80-years of deposition of the highest annual air concentrations for the two groups; • chemical losses due to degradation and volatilization; and • the direct deposition of the highest annual air concentrations of all discrete receptor
locations.
Vegetation Ambient concentrations of certain metals and PAHs were measured at or above the MDL in vegetation known to be used for traditional purposes (e.g., Labrador tea leaves, cattail roots and berries). Whenever possible, 95UCLMs were used in the multiple pathway models.
Predicted vegetation concentrations were based on: • ambient measurements; • the direct deposition of the highest annual air concentrations of all fixed locations as
categorized in the Aboriginal group; • direct vapour uptake from the atmosphere; and • root uptake from soil.
Wild Game Tissue
Concentrations of certain metals were measured at or above the MDL in wild game traditionally consumed by local Aboriginals (i.e., moose, ruffed grouse and snowshoe hare), Whenever possible, 95UCLMs were used in the multiple pathway models. PAHs were not analyzed in wild game.
Predicted Application or PDC impacts on wild game tissue were based on: • tissue measurements; • the highest annual air concentrations of all locations and the AQLSA and AQRSA-
MPOI; • ingestion of soil and alder leaves from the receptor locations described above; • ingestion of water and aquatic plants from the local waterbodies; and • chemical losses due to metabolism of the chemicals.
Surface Water for Drinking and Swimming
The Project will have a negligible impact on surface water quality. As such, it was assumed that concentrations of the COPCs in the local surface waterbodies would remain unchanged from the Baseline Case.
For those COPCs that were not detected above their MDL in the surface water sampling program, background water concentrations were assumed to be negligible (i.e., 0).
Fish Tissue Because the Project will have a negligible overall impact on surface water quality, it was assumed that fish tissue concentrations of the COPCs would remain unchanged from the Baseline Case concentrations.

Devon NEC Corporation Pike 1 Project Volume 2 – Environmental Impact Assessment June 2012
Page 16-36
the threshold phenomenon applies equally to carcinogens and non-carcinogens; often this approach to carcinogens is chemically dependent (Health Canada 2009b; Klassen 1996). Debate also surrounds whether or not the threshold phenomenon applies to particulate matter or some other forms of air pollution (Health Canada 2009b; WHO 2000, 2006). In each case, experimental data demonstrating the absence of a threshold dose are lacking and the exceptions represent theoretical arguments only;
• if the threshold dose is exceeded, health effects may occur. The severity of these effects will depend on the level of exposure received, with more severe effects occurring with increasing dose;
• the toxicity of a chemical depends on its molecular structure. Within limits, chemicals with similar structures will produce similar evidence of toxicity. This principle allows the health effects of a chemical of unknown toxicity to be predicted by comparison with known health effects produced by a second chemical of similar molecular structure; and
• the health effects produced by a chemical depend on the nature, extent and duration of exposure. It is important to distinguish between the health effects that might result from acute exposures of short duration and effects that might occur following chronic or long-term exposure. Also, health effects might differ according to the route of exposure (e.g., inhalation rather than oral exposure).
Chemicals may differ not only with respect to the dosage required to cause an adverse effect, but also in the mechanism by which the adverse effect is elicited. For this reason, two general categories were used to evaluate the chemical emissions based upon their mode of action or mechanism of toxicity: threshold and non-threshold. In the case of threshold chemicals, which are generally non-carcinogenic chemicals, a benchmark or threshold level must be exceeded for toxicity to occur. The degree of toxicity expressed then increases with increasing dose. The threshold phenomenon applies to virtually all types of toxic responses and chemicals, with the exception of some carcinogens and some forms of cancer. For these chemicals, a no-observed-adverse-effects-level (NOAEL) can be identified. A NOAEL is the dose or amount of the chemical that results in no obvious response in the most sensitive test species and test endpoint. In some cases, a benchmark dose or concentration is derived, which represents the dose associated with a specific magnitude of response (i.e., 5 or 10% incidence within the study population). In the derivation of exposure limits by leading regulatory and scientific agencies, uncertainty factors are applied to the NOAEL or benchmark dose/concentration to provide protection for the most sensitive subjects following exposure over a prescribed period. Non-threshold chemicals are capable of producing cancer through one or more of a number of possible mechanisms (e.g., mutagenicity, cytotoxicity, inhibition of programmed cell death, mitogenesis [uncontrolled cell proliferation] and immune suppression) that, in theory, do not require the exceedance of a threshold (US EPA 2005). In general, tumourigenicity data from animals or human epidemiological studies are evaluated and examined using mathematical models to determine the chemical-specific unit risks or slope factors, which are in-turn used to
Devon NEC Corporation Pike 1 Project Volume 2 – Environmental Impact Assessment June 2012
Page 16-37
develop applicable exposure limits. Regulatory agencies such as Health Canada and the US EPA assume that any level of long-term exposure to carcinogenic chemicals is associated with some hypothetical cancer risk. As a result, Health Canada and AEW have specified an incremental (i.e., over and above background) lifetime cancer risk of 1.0 in 100,000, which these agencies consider acceptable, tolerable or essentially negligible (AEW 2009; Health Canada 2009b). The regulatory benchmark of an acceptable cancer risk is policy-based and its interpretation by various regulatory agencies differs (CCME 2006). An assumed incremental cancer risk of 1.0 in 100,000 increases a person’s lifetime cancer risk from 0.40000 for women (based on the 40% lifetime probability of developing cancer in Canada) to 0.40001 and 0.45000 for men (based on the 45% lifetime probability of developing cancer in Canada) to 0.45001 (CCS 2010). Because this assumed acceptable cancer risk level was specifically developed to address cancer risks over and above background cancer incidence, a portion of which includes background exposure to environmental pollutants, background exposures were not included in the assessment of potential cancer risks for non-threshold (i.e., carcinogenic) chemicals (Wilson 2005). The general terminology used to define threshold and non-threshold exposure limits differs according to the source and route of exposure. Also, it often varies between regulatory jurisdictions. Generic nomenclature has been developed, with the following terms and descriptions commonly used:
• Reference Concentration (RfC) – refers to the safe level of an airborne chemical for which the primary avenue of exposure is inhalation. It is expressed as a concentration of the chemical in air (e.g., µg/m³) and applies only to threshold chemicals;
• Reference Dose (RfD) – refers to the safe level or dose of a chemical for which exposure occurs through secondary pathways (i.e., inhalation of dust, oral and dermal). It is most commonly expressed in terms of the total intake of the chemical per unit of body weight (e.g., µg/kg bw/d). This term applies only to threshold chemicals;
• Risk-specific Concentration (RsC) – reserved for non-threshold or carcinogenic chemicals and refers to the level of an air-borne carcinogen for which the primary route of exposure is inhalation that results in a regulatory acceptable incremental increase in cancer (typically 1.0 in 100,000). It is expressed as a concentration of the chemical in air (e.g., µg/m³); and
• Risk-specific Dose (RsD) – reserved for non-threshold or carcinogenic chemicals and refers to the dose of a carcinogen for which exposure occurs through secondary pathways that results in a regulatory acceptable increased incidence of cancer (typically 1.0 in 100,000). It is expressed in terms of the total intake of the chemical (e.g., µg/kg bw/d).

Devon NEC Corporation Pike 1 Project Volume 2 – Environmental Impact Assessment June 2012
Page 16-38
16.6.3.1 Identification of the Chemicals of Potential Concern
The COPCs from the air emissions inventory for the Project were identified through:
• the recognition of pre-defined aliphatic and aromatic hydrocarbons as well as carcinogenic PAHs for which exposure limits have been developed by reputable scientific and/or regulatory authorities for the chemical group as a whole;
• the determination of whether or not sufficient toxicological information is available (i.e., the availability of regulatory exposure limits) to assess potential health risks for an individual chemical or chemical group; and
• selection of chemical surrogates to represent any of the chemicals for which no suitable exposure limits were available.
In recognition of various pre-defined chemical groups for which exposure limits have been developed, including the various categories of aliphatic and aromatic hydrocarbons (i.e., aliphatic C5-C8 group, aliphatic C9-C16 group, aliphatic C17-C34 group, aromatic C9-C16 group and aromatic C17-C34 group) as well as the carcinogenic PAHs, the air emissions inventory for the Project was examined with the aim of identifying those chemicals that could be assigned to one of the pre-defined groups. For example, hexane is an aliphatic hydrocarbon containing six carbon atoms. As such, hexane was combined with aliphatic C5-C8 in order to assess the aliphatic C5-C8 group as a whole. For the purpose of the HHRA, reliance was placed on exposure limits developed or recommended by regulatory or reputable scientific agencies as criteria (i.e., objectives, guidelines or standards) for the protection of human health. Exposure limits were obtained from:
• AEW;
• Agency for Toxic Substances and Disease Registry (ATSDR);
• American Conference of Governmental Industrial Hygienists (ACGIH);
• CCME;
• Health Canada and Environment Canada;
• Netherlands National Institute of Public Health and the Environment (RIVM);
• California Office of Environmental Health Hazard Assessment (OEHHA);
• Ontario Ministry of the Environment (OMOE);
• Texas Commission on Environmental Quality (TCEQ);
• US EPA; and
• World Health Organization (WHO). These exposure limits typically incorporate a high level of conservatism, in view of the authorities’ mandate to offer guidance aimed at the protection of public health. The basis of these exposure limits might differ depending on the responsible regulatory jurisdiction or scientific authority charged with developing the safe or acceptable level of exposure. The limits

Devon NEC Corporation Pike 1 Project Volume 2 – Environmental Impact Assessment June 2012
Page 16-39
also might differ in terms of the primary determinant(s) of concern (e.g., direct health effects versus odour) and the level of protection required. For inclusion in the HHRA, exposure limits were required to be:
• established or recommended by a reputable scientific or regulatory agency;
• supported by adequate documentation;
• protective of the health of the general public based on current scientific knowledge of the health effects associated with exposure to the chemical; and
• protective of sensitive individuals (i.e., children and the elderly) through the incorporation of uncertainty.
Emphasis was generally given to those limits that had adequate supporting documentation, so that the limits could be evaluated to ensure that their basis was relevant and sufficient. When these criteria were satisfied by more than one objective, guideline or standard, the most scientifically defensible limit was selected. The scientific rationale for the selection of each exposure limit is provided in Volume 3, Appendix L1. Because the toxicity and critical effect of a chemical has been observed to vary between acute and chronic exposure, it is important to differentiate exposure limits on the basis of exposure duration. The two exposure limit durations that will be used in the toxicity assessment can be described as follows:
• Acute Exposure Limit – the amount or dose of a chemical that can be tolerated without evidence of adverse health effects on a short-term basis. These limits are routinely applied to conditions in which exposures extend over several hours or several days only; and
• Chronic Exposure Limit – the amount of a chemical that is expected to be without effect, even when exposure occurs continuously or regularly over extended periods, lasting for periods of at least a year and possibly extending over an entire lifetime.
In the chronic assessment, further distinction must be made between the exposure limits developed for the primary inhalation pathway and secondary exposure pathways. For those chemicals for which exposure limits have not been developed or recommended by the various regulatory or reputable scientific agencies either as individuals or as pre-defined chemical groups, surrogate chemicals were identified. This step relied on the toxicological principle that states that the molecular structure of a chemical has a distinct bearing on its reactivity, biological activity and toxicity. The principle allows for the toxicity of a chemical for which little or no toxicological information exists to be predicted on the basis of information available on another chemical of similar molecular structure. The second chemical is termed a surrogate. For example, health-based exposure limits were not identified for the aliphatic aldehydes, but health-based exposure limits were available for propionaldehyde, which was then adopted as a surrogate chemical for the aliphatic aldehyde group. Therefore, the aliphatic aldehydes were assessed using the exposure limits for propionaldehyde.

Devon NEC Corporation Pike 1 Project Volume 2 – Environmental Impact Assessment June 2012
Page 16-40
A complete list of the exposure limits identified in the toxicity assessment is presented in Table 16.6-9. Most of the chemicals identified in the air emissions inventory were evaluated either as individual chemicals (e.g., benzene) or as chemical constituents within a pre-defined chemical group (i.e., aliphatic and aromatic hydrocarbon groups or benzo(a)pyrene and equivalents). Additionally, several of the chemicals were assessed both as an individual chemical (e.g., hexane) and as part of an aliphatic or aromatic group (e.g., in this case, the aliphatic C5-C8 group). In these instances, the exposure limit identified for the individual chemical was lower (i.e., more conservative) than the exposure limit for the aliphatic or aromatic group as a whole. The carcinogenic PAHs were assessed as benzo(a)pyrene equivalents and evaluated using two distinct approaches. For the first approach (Approach 1), the mixture of carcinogenic PAHs was evaluated by summing each individual PAH’s toxic equivalency to benzo(a)pyrene (i.e., the toxic equivalency quotient (TEQ) approach). The toxic equivalencies of the PAH groups were determined using potency equivalency factors that have been adopted by Health Canada (2009a). In the second approach (Approach 2), a mixture of carcinogenic PAHs was evaluated based on its benzo(a)pyrene content. The use of benzo(a)pyrene as an indicator of the potency of the mixture is based on the WHO review of air quality guidelines for PAHs (WHO 2000). Benzo(a)pyrene was chosen as the indicator PAH as its toxicity is best characterized out of all the carcinogenic PAH compounds. The first approach is consistent with the relative potency approach described by the US EPA (2002), in which the carcinogenic potencies of PAHs are scaled to an index compound (benzo(a)pyrene) using toxic equivalency factors (which are analogous to potency equivalency factors) and then added together to calculate the total cancer risk for the mixture. This approach permits the evaluation of the mixture when limited data are available for most of the mixture components.

Devon NEC Corporation Pike 1 Project Volume 2 – Environmental Impact Assessment June 2012
Page 16-41
Table 16.6-9: Exposure Limits for the Chemicals Emitted from the Project
COPC
Acute Inhalation Exposure Limit Chronic Inhalation Exposure Limit Chronic Multi-Pathway Exposure Limit
Duration Value [µg/m³] Critical Effect Agency Type Value
[µg/m³] Critical Effect Agency Type Value [µg/kg bw/d]
Critical Effect Agency
CACs
CO 1-Hour 40 000 Oxygen carrying capacity of blood
US EPA — — — — n/a n/a n/a n/a
8-Hour 10 000
NO2 1-Hour 188 Respiratory irritation US EPA RfC 100 Respiratory irritation US EPA n/a n/a n/a n/a
PM2.5 24-Hour 30 — CCME RfC 12 — CARB n/a n/a n/a n/a
SO2 10-Minute 500 Respiratory irritation WHO — — — — n/a n/a n/a n/a
1-Hour 196 US EPA
Metals and Minerals
Aluminum — — — — RfC 5 Neurological effects US EPA RfD 143 Reproductive and developmental effects; neurological effects; kidney and liver effects
WHO/ FAO
Antimony — — — — — — — — RfD 0.2 Hepatotoxicity HC
Arsenic 1-Hour 0.2 Reproductive and developmental effects
OEHHA RsC 0.0016 Lung tumours HC RsD 0.006 Bladder, liver and lung tumours
HC
Barium — — — — RfC 1.0 Cardiovascular effects RIVM RfD 200 (food) Kidney effects ATSDR
16 (water) Cardiovascular disease, increased blood pressure
HC
Cadmium 24-Hour 0.03 Nasal irritation; respiratory irritation
ATSDR RsC 0.002 Lung tumours OEHHA RfD 1 (food) Kidney effects US EPA
0.5 (water)
Calcium — — — — — — — — — — — —
Chromium III 1-Hour 12 Respiratory irritation TCEQ RfC 0.14 Respiratory irritation TCEQ RfD 1 500 — US EPA
Chromium VI — — — — RsC 0.00013 Lung tumours HC RfD 1.0 Gastrointestinal effects ATSDR
Cobalt — — — — RfC 0.1 Respiratory irritation ATSDR RfD 1.4 Cardiac effects RIVM
Copper 1-Hour 100 Respiratory irritation OEHHA RfC 1.0 Respiratory irritation; immunological effects
RIVM RfD 90 Liver effects HC
Gallium — — — — — — — — — — — —

Devon NEC Corporation Pike 1 Project Volume 2 – Environmental Impact Assessment June 2012
Page 16-42
COPC
Acute Inhalation Exposure Limit Chronic Inhalation Exposure Limit Chronic Multi-Pathway Exposure Limit
Duration Value [µg/m³] Critical Effect Agency Type Value
[µg/m³] Critical Effect Agency Type Value [µg/kg bw/d]
Critical Effect Agency
Indium — — — — — — — — — — — —
Iron — — — — — — — — — — — —
Lanthanum — — — — — — — — — — — —
Lead — — — — RfC 0.5 Neurological effects WHO RfD 1.85 Neurological effects; developmental effects
HC
Magnesium — — — — — — — — — — — —
Manganese — — — — RfC 0.05 Neurological effects HC RfD 140 (food) Neurological effects US EPA
47 (soil and water)
Nickel 1-Hour 1.1 Respiratory irritation TCEQ RsC 0.0077 Lung tumours HC RfD 22 Reproductive and developmental effects
WHO
Palladium — — — — — — — — — — — —
Potassium — — — — — — — — — — — —
Silicon — — — — — — — — — — — —
Silver — — — — RfC 0.4 Argyria ACGIH RfD 5 Argyria US EPA
Strontium — — — — — — — — RfD 600 Developmental effects US EPA
Tin — — — — — — — — RfC 200 Tin accumulation in bone and decrease in feed efficiency
RIVM
Titanium — — — — — — — — — — — —
Vanadium 1-Hour 30 Respiratory irritation OEHHA RfC 0.1 Respiratory irritation ATSDR RfD 2 Developmental effects RIVM
Zinc 1-Hour 250 Respiratory irritation ACGIH — — — — RfD 300 Change in copper status
US EPA
Zirconium — — — — — — — — — — — —
PAHs
2-Methylnaphthalene — — — — — — — — RfD 4 Pulmonary alveolar proteinosis
US EPA
Benzo(a)pyrene1 (Approach 1)
— — — — RsC 0.00012 Lung tumours WHO — — — —
Benzo(a)pyrene PEQ1
(Approach 2) — — — — RsC 0.32 Lung tumours HC RsD 0.0014 Gastrointestinal
tumours US EPA
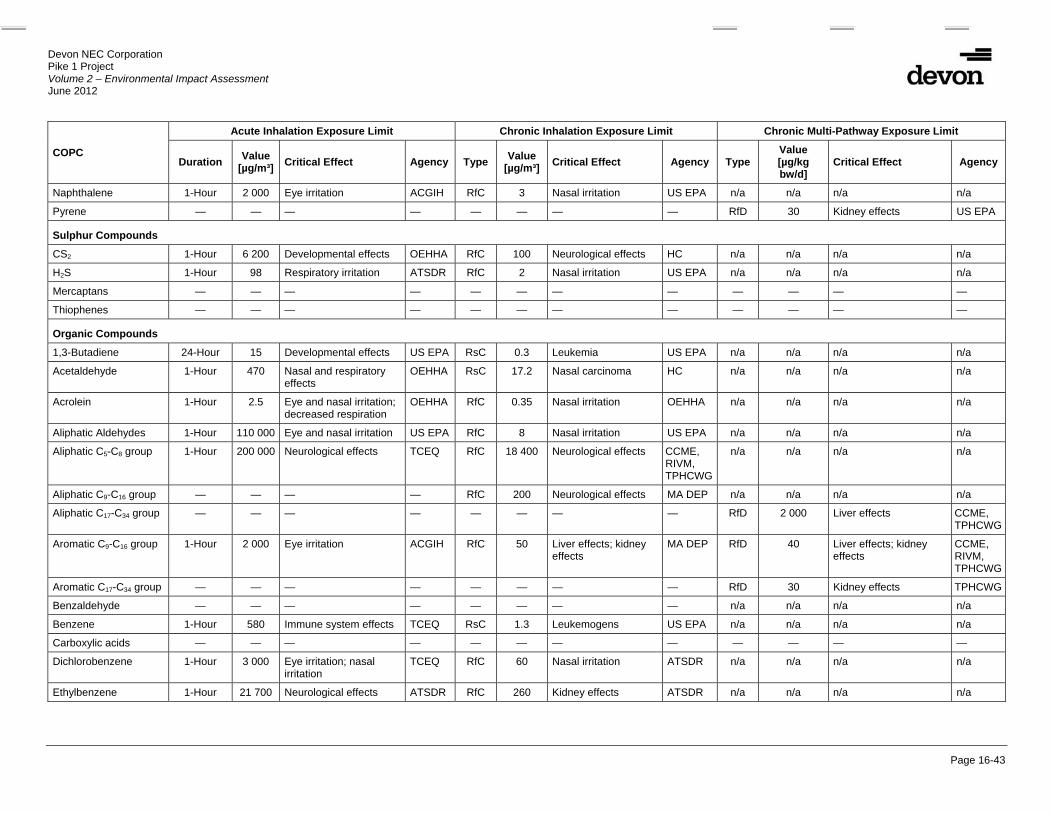
Devon NEC Corporation Pike 1 Project Volume 2 – Environmental Impact Assessment June 2012
Page 16-43
COPC
Acute Inhalation Exposure Limit Chronic Inhalation Exposure Limit Chronic Multi-Pathway Exposure Limit
Duration Value [µg/m³] Critical Effect Agency Type Value
[µg/m³] Critical Effect Agency Type Value [µg/kg bw/d]
Critical Effect Agency
Naphthalene 1-Hour 2 000 Eye irritation ACGIH RfC 3 Nasal irritation US EPA n/a n/a n/a n/a
Pyrene — — — — — — — — RfD 30 Kidney effects US EPA
Sulphur Compounds
CS2 1-Hour 6 200 Developmental effects OEHHA RfC 100 Neurological effects HC n/a n/a n/a n/a
H2S 1-Hour 98 Respiratory irritation ATSDR RfC 2 Nasal irritation US EPA n/a n/a n/a n/a
Mercaptans — — — — — — — — — — — —
Thiophenes — — — — — — — — — — — —
Organic Compounds
1,3-Butadiene 24-Hour 15 Developmental effects US EPA RsC 0.3 Leukemia US EPA n/a n/a n/a n/a
Acetaldehyde 1-Hour 470 Nasal and respiratory effects
OEHHA RsC 17.2 Nasal carcinoma HC n/a n/a n/a n/a
Acrolein 1-Hour 2.5 Eye and nasal irritation; decreased respiration
OEHHA RfC 0.35 Nasal irritation OEHHA n/a n/a n/a n/a
Aliphatic Aldehydes 1-Hour 110 000 Eye and nasal irritation US EPA RfC 8 Nasal irritation US EPA n/a n/a n/a n/a
Aliphatic C5-C8 group 1-Hour 200 000 Neurological effects TCEQ RfC 18 400 Neurological effects CCME, RIVM, TPHCWG
n/a n/a n/a n/a
Aliphatic C9-C16 group — — — — RfC 200 Neurological effects MA DEP n/a n/a n/a n/a
Aliphatic C17-C34 group — — — — — — — — RfD 2 000 Liver effects CCME, TPHCWG
Aromatic C9-C16 group 1-Hour 2 000 Eye irritation ACGIH RfC 50 Liver effects; kidney effects
MA DEP RfD 40 Liver effects; kidney effects
CCME, RIVM, TPHCWG
Aromatic C17-C34 group — — — — — — — — RfD 30 Kidney effects TPHCWG
Benzaldehyde — — — — — — — — n/a n/a n/a n/a
Benzene 1-Hour 580 Immune system effects TCEQ RsC 1.3 Leukemogens US EPA n/a n/a n/a n/a
Carboxylic acids — — — — — — — — — — — —
Dichlorobenzene 1-Hour 3 000 Eye irritation; nasal irritation
TCEQ RfC 60 Nasal irritation ATSDR n/a n/a n/a n/a
Ethylbenzene 1-Hour 21 700 Neurological effects ATSDR RfC 260 Kidney effects ATSDR n/a n/a n/a n/a

Devon NEC Corporation Pike 1 Project Volume 2 – Environmental Impact Assessment June 2012
Page 16-44
COPC
Acute Inhalation Exposure Limit Chronic Inhalation Exposure Limit Chronic Multi-Pathway Exposure Limit
Duration Value [µg/m³] Critical Effect Agency Type Value
[µg/m³] Critical Effect Agency Type Value [µg/kg bw/d]
Critical Effect Agency
Formaldehyde 1-Hour 50 Eye irritation; nasal irritation
ATSDR RfC 11 Eye, nasal and respiratory irritation
TCEQ RfD 150 Kidney effects; gastrointestinal effects
HC
n-Hexane — — — — RfC 670 Neurological effects TCEQ n/a n/a n/a n/a
Methacrolein 1-Hour 53 Eye irritation TCEQ RfC 1.2 Respiratory tract and eye irritation
TCEQ n/a n/a n/a n/a
Sulphuric acid 1-Hour 120 Respiratory irritation OEHHA RfC 1 Respiratory irritation OEHHA n/a n/a n/a n/a
Toluene 1-Hour 15 000 Eye irritation; nasal irritation; neurological effects
TCEQ RfC 5 000 Neurological effects US EPA n/a n/a n/a n/a
Xylenes 1-Hour 7 400 Respiratory irritation; neurological effects
TCEQ RfC 610 Eye irritation; upper respiratory irritation; neurological effects
TCEQ n/a n/a n/a n/a
Notes: 1 Potential chronic inhalation health risks associated with benzo(a)pyrene and the other carcinogenic PAHs were evaluated using two different approaches, as described in the text. The two RsC
values provided reflect these two approaches. — = No value available, or no information available. n/a Not applicable; these chemicals did not require chronic oral exposure limits as they were deemed gaseous or volatile and, therefore, did not screen on for the multiple pathway assessment HC Health Canada. RfC Reference Concentration (a general term to describe a non-cancer inhalation exposure limit which represents various specific definitions of limits from regulatory agencies: Alberta Environment’s
AAQOs, ATSDR's MRLs, Health Canada’s TC, OEHHA’s RELs, OMOE’s air quality Standards and Guidelines, RIVM’s TCA, TCEQ’s ReV, US EPA’s RfC and WHO’s AAQG). RfD Reference Dose (a general term to describe a non-cancer oral exposure limit which represents various specific definitions of limits from regulatory agencies: ATSDR’s MRLs, Health Canada’s TDIs
or ADIs, OEHHA’s CPFs, RIVM’s TDIs, US EPA’s RfD and WHO’s TDIs or ADIs). RsC Risk-specific Concentration (a general term to describe a cancer inhalation exposure limit which represents various specific definitions of limits from regulatory agencies: Health Canada’s
Tumorigenic Concentrations, inhalation slope factor and inhalation unit risk, OEHHA’s and US EPA’s RsC or Unit Risk Estimates (URE) or Slope Factors (SF)). RsD Risk specific Dose (a general term to describe a cancer oral exposure limit which represents various specific definitions of limits from regulatory agencies: Health Canada’s oral slope factor,
OEHHA’s and US EPA’s RsC or URE or SF).

Devon NEC Corporation Pike 1 Project Volume 2 – Environmental Impact Assessment June 2012
Page 16-45
The only chemicals not retained as COPCs in the HHRA from the air emissions inventory due to a lack of health-based exposure limits and applicable surrogates were:
• benzaldehyde;
• carboxylic acids; and
• 11 metals and minerals, including calcium, gallium, indium, iron, lanthanum, magnesium, palladium, potassium, silicon, titanium and zirconium.
Table 16.6-10 lists how the COPCs were assessed in the inhalation and multiple pathway assessments.
16.6.3.2 Chemical Mixtures
Given that chemical exposures rarely occur in isolation, the potential health risks associated with mixtures of the COPCs were assessed in the HHRA. Although the interaction between chemicals can take many forms, additive interactions were assumed for the HHRA (Health Canada 2009a). Additive interactions apply most readily to chemicals that are structurally similar, act toxicologically through similar mechanisms or affect the same target tissue in the body (i.e., share commonality in effect) (Health Canada 2009a). The endpoints of the exposure limits used in the HHRA provided the basis for an individual chemical’s inclusion in a chemical mixture. For example, the acute inhalation exposure limit for formaldehyde is based on its ability to cause eye and nasal irritation, thus formaldehyde was included in both the acute inhalation eye irritants and nasal irritants mixtures. For details concerning the critical effects of the chemicals included in each of the mixtures, see Table 16.6-11 and Volume 3, Appendix L1.
16.6.4 Risk Characterization
The final step of the assessment involves comparison of the estimated exposures with the selected exposure limits to determine potential health risks for the different assessment cases. In addition, sources of uncertainty and how these uncertainties were addressed are discussed. The uncertainty associated with the prediction of potential health risks was addressed, in part, through the use of reasonable worst-case assumptions. Using this approach, any health risks identified by the assessment are unlikely to be understated. Thus, it is important that the uncertainties and assumptions underlying the potential health risks be known and understood.

Devon NEC Corporation Pike 1 Project Volume 2 – Environmental Impact Assessment June 2012
Page 16-46
Table 16.6-10: Chemicals of Potential Concern in the Inhalation and Multiple Pathway Assessments
Chemical Category Chemicals of Potential Concern Acute Inhalation
Assessment Chronic Inhalation
Assessment
Chronic Multiple Pathway
Assessment CACs CO - x
NO2 x PM2.5
x SO2 - x
Metals Aluminum - Antimony - - Arsenic Barium - Cadmium Chromium III Chromium VI(a) - Cobalt - Copper Lead - Manganese - Nickel Silver - Strontium - - Tin - - Vanadium Zinc -
PAHs Benzo(a)pyrene TEQ (Approach 1) - Benzo(a)pyrene (Approach 2) - - Naphthalene x Pyrene - -
Sulphur Compounds
CS2 - x H2S x
Organic Compounds
1,3-Butadiene x Acetaldehyde x Acrolein x Aliphatic Aldehydes x Aliphatic C5-C8 group x Aliphatic C9-C16 group - x Aliphatic C17-C34 group - - Aromatic C9-C16 group Aromatic C17-C34 group - - Benzene x Dichlorobenzene x Ethylbenzene x Formaldehyde n-Hexane - x Methacrolein x Sulphuric acid - Toluene x Xylenes x
Notes: - No exposure limit was available, therefore, not assessed.
Assessed for the Project. x Pathway not applicable for COPC; therefore, not assessed.

Devon NEC Corporation Pike 1 Project Volume 2 – Environmental Impact Assessment June 2012
Page 16-47
Table 16.6-11: Potential Additive Interactions of the Chemicals of Potential Concern
Exposure Duration Toxicant Designation Chemicals of Potential Concern
Acute Inhalation Eye Irritants Acetaldehyde, acrolein, aliphatic aldehydes, aromatic C9-C16 group(1), dichlorobenzene, formaldehyde, methacrolein, toluene
Nasal Irritants Acetaldehyde, acrolein, aliphatic aldehydes, cadmium, dichlorobenzene, formaldehyde, toluene
Respiratory Irritants Acetaldehyde, acrolein, cadmium, chromium, copper, H2S, nickel, NO2, SO2
(2), sulphuric acid, vanadium, xylenes, zinc Reproductive and Developmental Toxicants
1,3-Butadiene, arsenic, CS2
Neurotoxicants Aliphatic C5-C8 group(3), ethylbenzene, toluene, xylenes Chronic Inhalation
Eye irritants Formaldehyde, methacrolein, xylenes Nasal irritants Acrolein, aliphatic aldehydes, dichlorobenzene, formaldehyde,
H2S, methacrolein, naphthalene, xylenes Respiratory irritants Chromium, cobalt, copper, formaldehyde, NO2, sulphuric acid,
vanadium Renal toxicants (Kidney Effects)
Aromatic C9-C16 group, ethylbenzene
Neurotoxicants Aliphatic C5-C8 group(3), aliphatic C9-C16 group, aluminum, CS2, hexane, lead, manganese, toluene, xylenes
Lung Carcinogens Arsenic, benzo(a)pyrene and equivalents(4), cadmium, chromium VI, nickel
Leukemogens (blood cancers) 1,3-butadiene, benzene Chronic Oral Exposure
Hepatotoxicants (Liver Effects)
Aliphatic C17-C34 group, aluminum, antimony, aromatic C9-C16 group, copper
Renal toxicants (Kidney Effects)
Aluminum, aromatic C9-C16 group, aromatic C17-C34 group, barium, cadmium, formaldehyde, pyrene(5)
Neurotoxicants Aluminum, lead, manganese Reproductive and developmental toxicants
Aluminum, lead, nickel, strontium, vanadium
Gastrointestinal toxicants Chromium VI, Formaldehyde
Notes: 1 Naphthalene was used as the chemical surrogate for the aromatic C9-C16 group on an acute basis. As a result,
naphthalene was not included in the acute inhalation assessment as an individual COPC, nor was it added to the eye irritants mixture as an individual COPC. It was, however, included in the eye irritants mixture as part of the aromatic C9-C16 group.
2 The highest risk estimate of the different averaging times for SO2 (i.e., 10-minute and 1-hour) was used in the prediction of potential health risks for the acute respiratory irritants mixture.
3 n-Pentane was used as the chemical surrogate for the aliphatic C5-C8 group on an acute and chronic inhalation basis. As a result, n-pentane was not included in the acute and chronic inhalation assessment as an individual COPC, nor was it added to the neurotoxicants mixture as an individual COPC. It was, however, included in the neurotoxicant mixtures.
4 The highest risk estimate of the different approaches to assessing the carcinogenic PAHs was used in the prediction of potential health risks for the lung carcinogens mixture.
5 On a chronic oral basis, pyrene was assessed as an individual chemical as well as a component of the aromatic C9-C16 group as pyrene was identified with an individual TRV (30 µg/kg/d) that is lower than the group TRV (40 µg/kg/d).

Devon NEC Corporation Pike 1 Project Volume 2 – Environmental Impact Assessment June 2012
Page 16-48
16.6.4.1 Non-Cancer Risks Estimates
Risk quotients (RQ values) were calculated by comparing the predicted levels of exposure for the non-carcinogenic COPCs to their respective exposure limits, as described in the toxicity assessment (Section 16.4), that have been developed by regulatory and scientific authorities. Risk quotients were calculated as follows:
RQ = Predicted Exposure (µg/m³ or µg/kg bw/d) Exposure Limit (µg/m³ or µg/kg bw/d)
Interpretation of the RQ values proceeded as follows:
• RQ ≤1.0 – indicates that the estimated exposure is less than or equal to the exposure limit (i.e., the assumed safe level of exposure). Risk quotients less than or equal to 1.0 are associated with low health risks, even in sensitive individuals given the level of conservatism incorporated in the derivation of the exposure limit and the risk estimate; and
• RQ >1.0 – indicates that the exposure estimate exceeds the exposure limit. This suggests an elevated level of risk, the significance of which must be balanced against the degree of conservatism incorporated into the risk assessment.
16.6.4.2 Cancer Risks Estimates
As previously mentioned, regulatory agencies such as Health Canada, AEW and the US EPA assume that any level of long-term exposure to carcinogenic chemicals is associated with some hypothetical cancer risk. On this basis, Health Canada and AEW have specified an incremental (i.e., over and above background) lifetime cancer risk of 1.0 in 100,000, which these agencies consider acceptable, tolerable or essentially negligible (AEW 2009; Health Canada 2009b). Because this assumed acceptable cancer risk level was specifically developed to address cancer risks over and above background cancer incidence, a portion of which includes background exposure to environmental pollutants, background exposures were not included in the assessment of potential health risks for non-threshold (i.e., carcinogenic) chemicals. Health Canada (2009b) requires that carcinogens be assessed on an incremental basis and mandates an acceptable incremental lifetime cancer risk (ILCR) of 1.0 in 100,000. For the purposes of this assessment, ILCR estimates have been determined for the Project alone as well as the incremental contribution of the planned future emission sources. The ILCR values were calculated for the Project alone and planned future emission sources as follows:
ILCR = Incremental Exposure (µg/m³ or µg/kg bw/d) Carcinogenic Exposure Limit (µg/m³ or µg/kg bw/d)

Devon NEC Corporation Pike 1 Project Volume 2 – Environmental Impact Assessment June 2012
Page 16-49
Interpretation of these ILCR values was based on comparison of the ILCR associated with the Project alone against the Health Canada (2009b) de minimus risk level of 1.0 in 100,000 (i.e., one extra cancer case in a population of 100,000 people).
16.6.4.3 Major Assumptions of the Human Health Risk Assessment
In an attempt to ensure that health risks would not be underestimated, reasonable worst-case assumptions were incorporated into the HHRA. A summary of the various assumptions that were incorporated into the HHRA is provided in Table 16.6-12.
16.7 Results
Given that health effects are dependent, in part, on the duration of exposure, separate assessments were completed for acute and chronic exposures. It is important to distinguish between potential health effects that might result from acute exposure or chronic exposure. For example, short-term exposure of cadmium in air is associated with nasal and respiratory irritation while long-term inhalation of elevated air concentrations can produce lung tumours. In the chronic assessment, further distinction was made between inhalation and multiple pathway exposures since the pathway of exposure will also influence the potential health effects associated with each of the COPCs. For example, chronic inhalation of cadmium can produce lung cancer but chronic oral exposure (i.e., ingestion) may result in kidney effects. In recognition of the influence of duration and pathway of exposure, risk estimates were segregated into:
• acute inhalation; • chronic inhalation; and • chronic multiple pathways. The predicted risk estimates are presented in scientific notation as many of the calculated numerical values are well below 1.0. For instance, the acute risk estimate for the Aboriginal receptor exposed to the maximum air concentration for CO under the Baseline Case is 4.4E-02, which is equivalent to an RQ of 0.044 (Table 16.7-1). The discussion of the results focuses on those risk estimates that exceeded 1.0 (presented in bold in the tables), as these could signify potential health risks. Where risk estimates did not exceed 1.0 (i.e., where the predicted exposures were less than the exposure limits), the predicted risk values are presented in the tables but were not discussed further.
16.7.1 Acute Inhalation Assessment
Acute inhalation risk estimates, expressed as risk quotients, were based on predicted exposure periods that range from a few minutes (e.g., 10-minute SO2) to 24 hours (e.g., PM2.5). The risk quotients for each chemical at the MPOI locations as well as the maximum risk quotients for each chemical within the Aboriginal and worker receptor groups are presented in Tables 16.7-1 to 16.7-4.

Devon NEC Corporation Pike 1 Project Volume 2 – Environmental Impact Assessment June 2012
Page 16-50
Table 16.6-12: Major Assumptions used in the Human Health Risk Assessment
Risk Assessment Step Assumption Discussion of Uncertainty
Exposure Assessment
Air dispersion modeling incorporated meteorological data that represented conditions contributing to maximum predicted ground-level air concentrations of the COPCs.
Use of the maximum (1st highest) predicted ground-level air concentrations of the COPCs likely contributed to the overstatement of the actual exposures that might be received by people residing in or visiting the area under most circumstances.
The people with the highest predicted exposures within each lifestyle category (i.e., Aboriginals, workers) were used to characterize the potential exposures for all people represented by the lifestyle category.
Potential exposure assumed for each lifestyle category represents a reasonable worst-case scenario. This contributes to the overstatement of the potential risks other people in the lifestyle category may be presented with.
Predicted chronic exposures for the Aboriginals were based on the assumption that individuals would be exposed 24 hours per day, 365 days per year to the maximum predicted ground-level air concentrations of the COPCs for the entire duration of their lives (i.e., 80 years).
The operating life of the Project is expected to be 25 to 30 years; thus, assuming 80 years of COPC emissions into the air as well as 80 years of deposition likely overstates actual levels of exposures.
Furthermore, Aboriginal residents would not be expected to maintain year-round occupancy at the camps, cabins or lodges in the area.
Predicted chronic multiple pathway exposures associated with the non-carcinogens were estimated for all life stages, but only the results of the most sensitive age groups were reported.
Predicted exposures for the other life stages are lower than those reported.
Aboriginal residents were assumed to obtain 100% of their food from local sources (e.g., berries and plants, wild game, fish and garden produce) and drinking water from local waterbodies.
The assumption that the Aboriginal residents obtain all of their food and water over their lifetime from the area is likely to contribute to the overstatement of the exposures that might be received by these people under actual circumstances.
Tissue concentrations from local wild game, such as moose, snowshoe hare and ruffed grouse, were based on the maximum predicted ground-level air concentrations of all fixed Aboriginal locations as well as the MPOI locations.
It is unlikely that wild game will forage at one fixed location over their entire lifetime, assuming that wild game will forage at the location where the maximum concentrations are predicted in air, soil, water and vegetation over their lifetime likely overstates the exposures to people who consume wild game.
Toxicity Assessment
Exposure limits were developed to be protective of sensitive and more susceptible individuals within the general population (e.g., infants and young children, the elderly, individuals with compromised health) (ATSDR 2009; US EPA 2002, 2010).
A considerable amount of conservatism is incorporated in the exposure limits. Limits are deliberately set to be protective of sensitive individuals. The limits were based on the most sensitive endpoints and then adjusted to account for differences in sensitivity to chemicals among individuals. The use of uncertainty factors is already directed, in part, towards the protection of sensitive individuals.

Devon NEC Corporation Pike 1 Project Volume 2 – Environmental Impact Assessment June 2012
Page 16-51
Risk Assessment Step Assumption Discussion of Uncertainty
Toxicity Assessment (cont’d)
The findings from toxicity studies with laboratory rodents can be used to gauge the types of responses and health effects that the chemicals may cause in humans and the findings from the laboratory rodent studies can be used, in part, to determine exposure limits for the chemicals.
Laboratory rodents have traditionally served as suitable surrogate species for humans. The use of uncertainty factors accounts for the possible differences in responses to chemicals that might be observed between laboratory rodents and other species, such as humans (see Volume 3, Appendix L1). Recent evidence suggests that rodents might be more sensitive to certain effects than humans as a result of higher doses reaching the critical target site in rodents (e.g., nasal effects).
The exposure limits for surrogate chemicals adequately represent the toxicity of the chemicals being represented.
In the absence of toxicity data for a number of the individual chemicals in the initial inventory, it was necessary to assume that structural similarity to the surrogate was a sufficient basis for the assumption of toxicological similarity.
Possible interactions of the COPCs released by the Project, which might lead to enhanced toxicity, were adequately addressed in the assessment.
Consistent with Health Canada (2009a) guidance, potential health risks associated with the COPCs were considered to be additive if the exposure limit for the COPCs had the same toxicological endpoint. In some instances, it is possible that components of a mixture may have different mechanisms of effect, contributing some uncertainty in the predicted risk estimates for mixtures.

Devon NEC Corporation Pike 1 Project Volume 2 – Environmental Impact Assessment June 2012
Page 16-52
Table 16.7-1: Acute Inhalation Risk Quotients – AQLSA-MPOI
Category COPC Averaging Time
Risk Quotient Baseline
Case Application
Case PDC
CACs CO 1-hour 4.4E-02 1.1E-01 1.1E-01 8-hour 4.8E-02 7.1E-02 7.1E-02
NO2 1-hour 7.0E-01 7.0E-01 7.0E-01 PM2.5 24-hour 5.7E-02 2.0E-01 2.0E-01 SO2 10-minute 1.4E+00 2.1E+00 3.1E+00
1-hour 7.0E-01 7.0E-01 1.1E+00Metals Arsenic 1-hour 2.1E-03 2.1E-03 4.5E-03
Cadmium 24-hour 2.1E-03 2.1E-03 4.5E-03 Chromium 1-hour 2.9E-05 2.9E-05 6.0E-05 Copper 1-hour 5.2E-05 5.2E-05 1.1E-04 Nickel 1-hour 4.7E-03 4.7E-03 1.0E-02 Vanadium 1-hour 6.9E-05 6.9E-05 1.5E-04 Zinc 1-hour 8.0E-05 8.0E-05 1.7E-04
Organics 1,3-Butadiene 24-hour 4.7E-05 4.7E-05 4.7E-05 Acetaldehyde 1-hour 9.5E-05 1.3E-03 1.3E-03 Acrolein 1-hour 2.1E-02 3.4E-02 3.4E-02 Aliphatic aldehydes 1-hour 1.2E-05 1.2E-05 2.5E-05 Benzene 1-hour 2.9E-03 2.9E-03 4.4E-03 Dichlorobenzene 1-hour 1.7E-06 1.7E-06 3.5E-06 Ethylbenzene 1-hour 2.4E-06 2.4E-06 4.8E-06 Formaldehyde 1-hour 1.3E-02 1.6E-02 1.6E-02 Methacrolein 1-hour 0.0E+00 1.0E-03 1.0E-03 Sulphuric acid 1-hour 2.3E-01 2.3E-01 2.5E-01 Toluene 1-hour 2.6E-05 2.6E-05 5.3E-05 Xylenes 1-hour 3.3E-05 3.3E-05 6.1E-05
PAHs Naphthalene 1-hour 4.9E-06 7.5E-06 7.5E-06 PHCs Aliphatic C5-C8 group 1-hour 2.1E-04 2.1E-04 3.2E-04
Aromatic C9-C16 group 1-hour 5.7E-04 5.7E-04 1.2E-03 Sulphur Compounds
CS2 1-hour 1.6E-08 2.2E-05 4.3E-05 H2S 1-hour 4.2E-03 4.2E-03 4.2E-03
Mixtures Eye irritants – 3.5E-02 5.3E-02 5.4E-02 Nasal irritants – 3.6E-02 5.4E-02 5.6E-02 Respiratory irritants – 2.4E+00 3.1E+00 4.1E+00Reproductive and developmental toxicants
– 2.1E-03 2.2E-03 4.6E-03
Neurotoxicants – 2.8E-04 2.8E-04 4.4E-04
Note: An RQ equal to or less than 1.0 signifies that the estimated exposure is equal to or less than the exposure limit. Values in bold indicate an RQ greater than 1.0. With scientific notation, any value expressed to the negative power (i.e., E-x) shows that predicted exposures were less than the exposure limit; whereas, a value expressed to the positive power (i.e., E+x) shows exposure estimates exceeded the exposure limit. – Multiple averaging times apply for mixtures.

Devon NEC Corporation Pike 1 Project Volume 2 – Environmental Impact Assessment June 2012
Page 16-53
Table 16.7-2: Acute Inhalation Risk Quotients – AQRSA-MPOI
Category COPC Averaging Time
Risk Quotient Baseline
Case Application
Case PDC
CACs CO 1-hour 4.7E-02 1.1E-01 1.1E-01 8-hour 4.8E-02 7.1E-02 7.1E-02
NO2 1-hour 7.6E-01 7.6E-01 7.6E-01 PM2.5 24-hour 1.0E-01 2.0E-01 2.0E-01 SO2 10-minute 4.0E+00 4.0E+00 4.0E+00
1-hour 2.1E+00 2.1E+00 2.1E+00Metals Arsenic 1-hour 2.1E-03 2.1E-03 4.5E-03
Cadmium 24-hour 2.2E-03 2.3E-03 4.7E-03 Chromium 1-hour 2.9E-05 2.9E-05 6.0E-05 Copper 1-hour 5.2E-05 5.2E-05 1.1E-04 Nickel 1-hour 4.7E-03 4.7E-03 1.0E-02 Vanadium 1-hour 6.9E-05 6.9E-05 1.5E-04 Zinc 1-hour 8.0E-05 8.0E-05 1.7E-04
Organics 1,3-Butadiene 24-hour 7.7E-04 7.7E-04 1.6E-03 Acetaldehyde 1-hour 4.7E-04 1.3E-03 1.3E-03 Acrolein 1-hour 2.1E-02 3.4E-02 3.4E-02 Aliphatic aldehydes 1-hour 1.2E-05 1.2E-05 2.5E-05 Benzene 1-hour 2.9E-03 2.9E-03 4.4E-03 Dichlorobenzene 1-hour 1.7E-06 1.7E-06 3.5E-06 Ethylbenzene 1-hour 8.8E-06 8.8E-06 8.8E-06 Formaldehyde 1-hour 1.3E-02 1.6E-02 2.0E-02 Methacrolein 1-hour 0.0E+00 1.0E-03 1.0E-03 Sulphuric acid 1-hour 4.8E-01 4.8E-01 4.9E-01 Toluene 1-hour 7.1E-05 7.1E-05 7.1E-05 Xylenes 1-hour 8.6E-05 8.6E-05 8.6E-05
PAHs Naphthalene 1-hour 3.3E-05 3.3E-05 7.0E-05 PHCs Aliphatic C5-C8 group 1-hour 2.1E-04 2.1E-04 3.2E-04
Aromatic C9-C16 group 1-hour 6.2E-04 6.2E-04 1.3E-03 Sulphur Compounds
CS2 1-hour 3.2E-07 2.2E-05 5.3E-05 H2S 1-hour 4.3E-03 4.3E-03 4.3E-03
Mixtures Eye irritants – 3.5E-02 5.3E-02 5.8E-02 Nasal irritants – 3.7E-02 5.4E-02 6.1E-02 Respiratory irritants – 5.3E+00 5.3E+00 5.3E+00Reproductive and developmental toxicants
– 2.9E-03 2.9E-03 6.2E-03
Neurotoxicants – 3.8E-04 3.8E-04 4.8E-04
Note: An RQ equal to or less than 1.0 signifies that the estimated exposure is equal to or less than the exposure limit. Values in bold indicate an RQ greater than 1.0. With scientific notation, any value expressed to the negative power (i.e., E-x) shows that predicted exposures were less than the exposure limit; whereas, a value expressed to the positive power (i.e., E+x) shows exposure estimates exceeded the exposure limit. – Multiple averaging times apply for mixtures.

Devon NEC Corporation Pike 1 Project Volume 2 – Environmental Impact Assessment June 2012
Page 16-54
Table 16.7-3: Acute Inhalation Risk Quotients – Aboriginal Group
Category COPC Averaging Time
Risk Quotient Baseline
Case Application
Case PDC
CACs CO 1-hour 1.4E-02 2.8E-02 2.8E-02 8-hour 1.0E-02 4.0E-02 4.0E-02
NO2 1-hour 5.9E-01 5.9E-01 6.0E-01 PM2.5 24-hour 8.5E-02 8.6E-02 1.4E-01 SO2 10-minute 9.2E-01 9.2E-01 9.2E-01
1-hour 5.6E-01 5.6E-01 5.7E-01 Metals Arsenic 1-hour 1.1E-03 1.1E-03 2.3E-03
Cadmium 24-hour 1.3E-03 1.3E-03 2.7E-03 Chromium 1-hour 5.8E-06 5.8E-06 1.2E-05 Copper 1-hour 2.7E-05 2.7E-05 5.7E-05 Nickel 1-hour 2.5E-03 2.5E-03 5.1E-03 Vanadium 1-hour 3.6E-05 3.6E-05 7.5E-05 Zinc 1-hour 1.8E-05 1.8E-05 3.7E-05
Organics 1,3-Butadiene 24-hour 7.7E-04 7.7E-04 1.6E-03 Acetaldehyde 1-hour 4.7E-04 4.7E-04 9.8E-04 Acrolein 1-hour 1.1E-02 1.1E-02 2.3E-02 Aliphatic aldehydes 1-hour 5.1E-06 5.1E-06 1.5E-05 Benzene 1-hour 1.2E-03 1.2E-03 2.1E-03 Dichlorobenzene 1-hour 7.3E-07 7.3E-07 2.2E-06 Ethylbenzene 1-hour 4.6E-06 4.6E-06 4.6E-06 Formaldehyde 1-hour 9.6E-03 9.6E-03 2.0E-02 Methacrolein 1-hour 0.0E+00 3.3E-04 3.3E-04 Sulphuric acid 1-hour 8.9E-02 8.9E-02 1.1E-01 Toluene 1-hour 3.8E-05 3.8E-05 3.8E-05 Xylenes 1-hour 4.5E-05 4.5E-05 4.5E-05
PAHs Naphthalene 1-hour 3.3E-05 3.3E-05 7.0E-05 PHCs Aliphatic C5-C8 group 1-hour 6.5E-05 6.5E-05 1.9E-04
Aromatic C9-C16 group 1-hour 2.4E-04 2.4E-04 7.0E-04 Sulphur Compounds
CS2 1-hour 1.6E-07 7.1E-06 4.9E-05 H2S 1-hour 2.2E-03 2.2E-03 2.2E-03
Mixtures Eye irritants – 2.1E-02 2.1E-02 4.5E-02 Nasal irritants – 2.3E-02 2.3E-02 4.7E-02 Respiratory irritants – 1.3E+00 1.3E+00 1.4E+00Reproductive and developmental toxicants
– 1.9E-03 1.9E-03 3.9E-03
Neurotoxicants – 1.5E-04 1.5E-04 2.6E-04
Note: An RQ equal to or less than 1.0 signifies that the estimated exposure is equal to or less than the exposure limit. Values in bold indicate an RQ greater than 1.0. With scientific notation, any value expressed to the negative power (i.e., E-x) shows that predicted exposures were less than the exposure limit; whereas, a value expressed to the positive power (i.e., E+x) shows exposure estimates exceeded the exposure limit. – Multiple averaging times apply for mixtures.

Devon NEC Corporation Pike 1 Project Volume 2 – Environmental Impact Assessment June 2012
Page 16-55
Table 16.7-4: Acute Inhalation Risk Quotients – Worker Group
Category Chemical Averaging Time
Risk Quotient Baseline
Case Application
Case PDC
CACs CO 1-hour 2.7E-02 2.7E-02 2.7E-02 8-hour 3.5E-02 3.5E-02 3.5E-02
NO2 1-hour 6.5E-01 6.5E-01 6.5E-01 PM2.5 24-hour 6.1E-02 6.1E-02 1.1E-01 SO2 10-minute 1.4E+00 1.4E+00 1.8E+00
1-hour 8.2E-01 8.2E-01 8.2E-01 Metals Arsenic 1-hour 1.5E-03 1.5E-03 3.6E-03
Cadmium 24-hour 1.2E-03 1.2E-03 2.6E-03 Chromium 1-hour 9.2E-06 9.2E-06 1.9E-05 Copper 1-hour 3.7E-05 3.7E-05 9.0E-05 Nickel 1-hour 3.4E-03 3.4E-03 8.2E-03 Vanadium 1-hour 4.9E-05 4.9E-05 1.2E-04 Zinc 1-hour 2.6E-05 2.6E-05 5.8E-05
Organics 1,3-Butadiene 24-hour 2.4E-04 2.4E-04 2.4E-04 Acetaldehyde 1-hour 1.2E-04 5.9E-04 5.9E-04 Acrolein 1-hour 8.6E-03 1.6E-02 1.6E-02 Aliphatic aldehydes 1-hour 9.6E-06 9.6E-06 2.0E-05 Benzene 1-hour 2.3E-03 2.3E-03 3.5E-03 Dichlorobenzene 1-hour 1.4E-06 1.4E-06 2.8E-06 Ethylbenzene 1-hour 2.5E-06 2.5E-06 3.8E-06 Formaldehyde 1-hour 5.3E-03 7.4E-03 1.1E-02 Methacrolein 1-hour 0.0E+00 4.7E-04 4.7E-04 Sulphuric acid 1-hour 1.4E-01 1.4E-01 1.6E-01 Toluene 1-hour 2.1E-05 2.1E-05 4.2E-05 Xylenes 1-hour 2.5E-05 2.5E-05 4.8E-05
PAHs Naphthalene 1-hour 8.5E-06 8.5E-06 1.8E-05 PHCs Aliphatic C5-C8 group 1-hour 1.2E-04 1.2E-04 2.5E-04
Aromatic C9-C16 group 1-hour 4.4E-04 4.4E-04 9.1E-04 Sulphur Compounds
CS2 1-hour 8.7E-08 1.0E-05 3.4E-05 H2S 1-hour 1.7E-03 1.7E-03 1.7E-03
Mixtures Eye irritants – 1.4E-02 2.5E-02 2.5E-02 Nasal irritants – 1.4E-02 2.4E-02 2.5E-02 Respiratory irritants – 1.9E+00 1.9E+00 2.4E+00Reproductive and developmental toxicants
– 1.5E-03 1.5E-03 3.7E-03
Neurotoxicants – 1.7E-04 1.7E-04 3.4E-04
Note: An RQ equal to or less than 1.0 signifies that the estimated exposure is equal to or less than the exposure limit. Values in bold indicate an RQ greater than 1.0. With scientific notation, any value expressed to the negative power (i.e., E-x) shows that predicted exposures were less than the exposure limit; whereas, a value expressed to the positive power (i.e., E+x) shows exposure estimates exceeded the exposure limit. – Multiple averaging times apply for mixtures.

Devon NEC Corporation Pike 1 Project Volume 2 – Environmental Impact Assessment June 2012
Page 16-56
With the exceptions of SO2 and the respiratory irritants mixture, all other COPCs and mixtures have risk quotients less than 1.0 for all three assessment cases (i.e., Baseline Case, Application Case and PDC). This indicates that predicted COPC air concentrations were less than their health-based exposure limits and that the additive interactions of the COPCs are not predicted to result in adverse health effects. Risk quotients were predicted to be greater than 1.0 for the following:
• 10-minute SO2 at the MPOI locations and maximum worker location for all assessment cases;
• 1-hour SO2 at the AQLSA-MPOI in the PDC;
• 1-hour SO2 at the AQRSA-MPOI for all three assessment cases; and
• respiratory irritants for the MPOI locations and two receptor groups for all three assessment cases.
For the acute inhalation assessment, the interpretation of the exceedances considered the following:
• the contribution of the Project and planned future emission sources to the predicted exceedances;
• the likelihood of the exceedances occurring at the specified location; and
• how predicted air concentrations compared with the exposure levels known to cause adverse health effects in people.
The significance of the predicted exceedances is discussed below.
16.7.1.1 SO2
Risk quotients were predicted to be greater than 1.0 for SO2 for the MPOI locations and the maximum worker receptor locations based on the 10-minute averaging period and the 1-hour averaging period. The Project is expected to influence the short-term SO2-related risks at the AQLSA-MPOI, as evident by the increase in risk quotients from the Baseline Case to the Application Case. In contrast, the changes in the Baseline Case to Application Case risks were negligible for the 10-minute and 1-hour SO2 averaging times for the AQRSA-MPOI, Aboriginal group and worker group, indicating that the Project will have little to no impact on the Baseline SO2-related health risks at these locations. All hourly SO2 risk quotients were calculated using the predicted peak 1-hour air concentrations in comparison to US EPA’s 1-hour National Ambient Air Quality Standard (NAAQS) of 196 µg/m³. The 10-minute SO2 air concentrations also were predicted based on the peak hourly concentrations and compared to the WHO air quality guideline of 500 µg/m³. It is worth noting that none of the predicted 9th highest 1-hour SO2 concentrations exceed the Alberta Ambient Air Quality Objective of 450 µg/m3.

Devon NEC Corporation Pike 1 Project Volume 2 – Environmental Impact Assessment June 2012
Page 16-57
Of the 82 locations included in the worker group, six locations had 10-minute SO2 air concentrations exceeding the WHO air quality guideline (receptors J3202, J3208, J3260, M17, M32 and M33) (Figure 16.7-1). The predicted hourly (peak) and 10-minute SO2 concentrations for these six locations, along with the MPOI locations, are presented in Table 16.7-5.
Table 16.7-5: Predicted 10-minute (peak) and 1-hour SO2 Air Concentrations for the MPOI Locations and Worker Locations with Risk Quotients Exceeding 1.0
Receptor Location Averaging Period
Exposure Limit (µg/m³)
Predicted Air Concentrations (µg/m³) Baseline Application PDC
AQLSA-MPOI 10-min 500 698.0 1 049.9 1 543.3 1-hour 196 136.9 136.9 206.0
AQRSA-MPOI 10-min 500 2 009.6 2 009.6 2 009.6 1-hour 196 420.3 420.4 421.3
M17 10-min 500 603.7 603.7 604.2 M32 10-min 500 608.5 608.5 609.3 M33 10-min 500 676.7 676.7 677.3 J3202 10-min 500 687.0 687.0 687.6 J3208 10-min 500 501.5 502.1 908.7 J3260 10-min 500 146.1 147.0 505.0
Notes: The 10-minute exposure limit of 500 µg/m³ is based on the WHO air quality guideline and the 1-hour exposure limit of 196 µg/m³ is based on US EPA’s NAAQS.
The predicted exceedances of the 10-minute WHO air quality guideline appear to be due to Baseline emission sources, as opposed to the Project for all locations other than the AQLSA-MPOI (i.e., there is little to no difference between the air concentrations predicted for the Baseline Case to Application Case). Using the peak hourly air concentrations is considered a conservative way to characterize health risks. AEW recommends that the eight highest predicted 1-hour concentrations for each receptor in a single year be disregarded (AEW 2009). In accordance with Alberta’s Air Quality Model Guideline, the 9th highest values are, therefore, reasonable concentrations to consider in the HHRA (AEW 2009). The likelihood of achieving any of the peak concentrations shown in Table 16.7-5 is low (less than 0.1%) and use of the peak predicted concentrations in the calculation of SO2 risk quotients likely overstates the actual risks. Table 16.7-6 presents the more realistic predicted 10-minute 9th highest SO2 concentrations.
Table 16.7-6: Predicted 10-minute (9th highest) SO2 Air Concentrations for the MPOI Locations and Worker Locations with Risk Quotients Exceeding 1.0
Receptor Location Averaging Period
Exposure Limit (µg/m³)
Predicted Air Concentrations (µg/m³) Baseline Application PDC
AQLSA-MPOI 10-min 500 271.2 271.2 377.8 AQRSA-MPOI 10-min 500 617.8 617.8 618.0 M17 10-min 500 137.4 137.4 138.7 M32 10-min 500 207.8 207.8 208.7 M33 10-min 500 222.1 222.1 222.7 J3202 10-min 500 224.8 224.8 225.4 J3208 10-min 500 208.2 208.4 295.7 J3260 10-min 500 56.3 57.5 226.6 Note: The 10-minute exposure limit of 500 µg/m³ is based on the WHO air quality guideline.

!(
!(
!(
!(
!(
!(
!(
!(!(!(
!(
!(
WinefredLake
GristLake
LoganLake
CaribouLake
Christina
S askatch ewa n
Albe rt a
Fort McMurray
Lac La Biche
ClearwaterRive
r
River
Athabasca
PrimroseLake
Lac La Biche
GordonLake
LacLa Loche
GarsonLake
!!63
Rive
r!!881
M32
Anzac
Draper
Chard/Janvier
Conklin
Philomena
Gregoire Lake Estates
J3260
J3208
J3202M33
M17
LegendAir Quality RSA
Air Quality LSA
CPF
Cold Lake Air Weapons Range
Open Water
Watercourse
Road
!( Receptor Location
Worker Group Locations at Which the Predicted10-minute Peak SO2 Concentrations Exceedthe WHO Air Quality Guideline (500 ug/m3)
Pike 1 Project
June 01, 2012
Figure16.7-1
PROVIDED BY:
AMECFINAL MAPPING BY:
AMEC
Fig16.07-01 Receptors Exceeding.mxd
±M
ap P
ath:
S:\G
is\P
roje
cts\
CE
\Dev
on\0
4050
_Pik
e\A
rcG
IS P
roje
cts\
Volu
me
02 -
Sec
tion
16 H
uman
Hea
lth\F
ig16
.07-
01 R
ecep
tors
Exc
eedi
ng.m
xd
Ana
lyst
- Ja
y B
outin
Source: Devon, GeoBase®, Spatial Data Warehouse Ltd.
10 0 10 205
Kilometres1:1000000

Devon NEC Corporation Pike 1 Project Volume 2 – Environmental Impact Assessment June 2012
Page 16-59
The use of the more representative 9th highest hourly air concentrations yields risks that are considerably lower than those based on the peak air concentrations. The 10-minute concentrations in Table 16.7-5 were predicted using the 1-hour peak concentrations for SO2.
The corresponding 10-minute air concentrations based on the 9th highest 1-hour SO2 air concentrations are presented in Table 16.7-6. As shown in Table 16.7-6, the 10-minute SO2 concentrations are predicted to be less than the WHO air quality guideline of 500 µg/m3, with the lone exception of the AQRSA-MPOI location, for which the air concentration still exceeds the WHO air quality guideline. The changes to the risk quotients related to the use of the 9th highest values are presented in Table 16.7-7.
Table 16.7-7: Comparison of SO2 Risk Quotients Calculated for 10-minute Exposures Using 1st Highest (Peak) and 9th Highest (99.9%ile) Predicted Air Concentrations
Receptor Group SO2 10-minute Peak SO2 10-minute 9th Highest
Baseline Application PDC Baseline Application PDCAQLSA-MPOI 1.4E+00 2.1E+00 3.1E+00 5.4E-01 5.4E-01 7.6E-01 AQRSA-MPOI 4.0E+00 4.0E+00 4.0E+00 1.2E+00 1.2E+00 1.2E+00Maximum Aboriginal 9.2E-01 9.2E-01 9.2E-01 3.0E-01 3.0E-01 3.1E-01 Maximum Worker 1.4E+00 1.4E+00 1.8E+00 4.5E-01 4.5E-01 5.9E-01
Note: Values in bold indicate instances where RQ>1.0.
As there is no change predicted in the risk quotients between the Baseline Case, Application Case or PDC at the AQRSA-MPOI, the risks appear to be due to Baseline Case emission sources, rather than those associated with the Project or other planned emission sources in the region. The dose-response relationship for SO2 must be considered in the interpretation of the potential adverse health effects. A review of the scientific literature indicates that no adverse effects among healthy individuals are observed for brief periods of exposure to concentrations of SO2 less than 530 µg/m³ (Table 16.7-8). Exposure of SO2 concentrations in the range of 530 to 1 300 indicates that asthmatic or sensitive individuals may have symptoms of potential bronchoconstriction when moderately exercising, however, effects on the lungs are not observed in normal individuals. Based on the predicted 9th-highest 10-minute SO2 concentrations at the AQRSA-MPOI for the Baseline Case (617.8 µg/m³), Application Case (617.8 µg/m³) and PDC (618.0 µg/m³), minimal to no adverse effects are expected depending on the health status of the individual (Table 16.7-8). The peak and 9th highest 10-minute SO2 concentrations predicted at the AQRSA-MPOI are 618 µg/m3 and 2 010 µg/m3, respectively. The highest 10-minute SO2 concentration of 2 010 µg/m3 could result in breathing difficulties in both sensitive and normal individuals. However, the likelihood of the SO2 concentrations reaching levels wherein clinical effects could occur is low, as shown in Table 16.7-9.

Devon NEC Corporation Pike 1 Project Volume 2 – Environmental Impact Assessment June 2012
Page 16-60
Table 16.7-8: Potential Acute Health Effects Associated with SO2
Concentration in Air Description of Potential Health Effects1
ppm µg/m³ <0.1 <250 No documented reproducible evidence of adverse health effects among healthy individuals or
susceptible individuals2 following short-term exposure.
0.1 to 0.2 250 to 530 Possible modest, transient changes in lung function indices, detectable by spirometry, among asthmatics during moderate to strenuous exercise. Changes characterized by increased airway resistance and/or reduced air conductance. All changes fully reversible and strictly subclinical in nature, with no evidence of wheezing, shortness of breath or other clinical signs. No documented effects among healthy individuals.
0.2 to 0.5 530 to 1 300
Increased airway resistance and potential bronchoconstriction in asthmatic or sensitive individuals engaged in moderate exercise. Bronchoconstriction with or without attendant clinical signs depending on severity of asthmatic condition. Typically no effects on lung function in normal individuals.
0.5 to 1 1 300 to 2 600
Increased resistance in airways and difficulties breathing may be experienced by normal individuals (in addition to asthmatics and sensitive individuals). Sore throat and the ability to taste and smell SO2 may also be apparent. Effects in asthmatics and other sensitive individuals may also include wheezing, dyspnea and bronchoconstriction.
1 to 5 2 600 to 13 000
Odour is detectable. Increased resistance in airways, decreased lung volume, reduced bronchial clearance and evidence of lung irritation (increased macrophages in lung fluid) were observed at this exposure level. Headache, coughing, throat irritation, nasal congestion, increased salivation may be evident and some symptoms may persist for several days after exposure. Mucociliary transport in the nasal passages may also be impaired, potentially leading to nasal congestion. Respiratory effects may be more severe in asthmatics and sensitive individuals.
5 to 10 13 000 to 26 000
Increased resistance in airways, decreased respiratory volume, difficulties breathing and lung irritation were reported at this exposure level. Nasal, throat and eye irritation, nosebleeds, coughing, potentially accompanied by erythema of trachea and bronchi may occur. Respiratory effects may be more severe in asthmatics and sensitive individuals.
10 to 50 26 000 to 130 000
Symptoms of more severe respiratory irritation may appear, such as burning of nose and throat, sneezing, severe airway obstruction, choking and dyspnea. Exposure may result in damage to airway epithelium that may progress to epithelial hyperplasia, an increased number of secretory goblet cells and hypertrophy of the submucosal glands. A condition known as Reactive Airway Dysfunction Syndrome (RADS) may arise in the concentration ranges (as well as above) as a result of bronchial epithelial damage. Chronic respiratory effects may develop. Eye irritation, watery eyes and skin eruptions (rashes) may be evident. Respiratory effects may be more severe in asthmatics and sensitive individuals.
50 to 100 130 000 to 260 000
Symptoms of severe respiratory irritation may occur, such as bronchitis, intolerable irritation of mucous membranes in addition to other effects described above, such as decreased lung capacity and breathing difficulties, runny nose, eye and skin irritation.
>100 >260 000 Immediately dangerous to life and health. Chemical bronchopneumonia and asphyxia were reported at high levels of exposure. Death may result from severe respiratory depression at concentrations of about 2 600 000 µg/m³.
Notes: 1 Note that the descriptions pertain largely to the types of health effects that might be experienced among normal,
healthy individuals following acute exposure to SO2. Some descriptions refer to the types of symptoms that might occur among individuals with pre-existing eye and/or breathing disorders, such as asthma, bronchitis or COPD. The exact nature and severity of responses that might occur among these latter individuals will depend on several factors, including: i) the severity of the person’s condition; ii) the age of the individual; iii) the level of management of the disorder, including the availability and use of medications; iv) the person’s level of physical activity; and/or, v) external environmental factors such as temperature and humidity. The symptoms that could be experienced by these individuals could be more or less severe that those described because of these factors.
2 Includes individuals suffering from respiratory disorders, such as asthma, bronchitis and COPD. Sources: NIOSH (1974), WHO (1979), ATSDR (1998), HSDB (2010), Cal EPA (1999), WHO (2000).

Devon NEC Corporation Pike 1 Project Volume 2 – Environmental Impact Assessment June 2012
Page 16-61
Table 16.7-9: Potential Frequencies of SO2 Concentration Ranges at the MPOIs
Receptor Type SO2 Concentration Range (µg/m3) Baseline Application PDC
AQLSA-MPOI 0 to 530 99.99% 99.97% 99.95% 530 to 1 300 0.01% 0.03% 0.05% 1 300 to 2 600 0.00% 0.00% 0.00%
AQRSA-MPOI 0 to 530 99.77% 99.75% 99.66% 530 to 1 300 0.22% 0.24% 0.33% 1 300 to 2 600 0.01% 0.01% 0.01%
Note: The frequency was determined using time-series data provided by air quality for five consecutive years of SO2 hourly data which was converted to 10-minute SO2 concentrations.
The potential frequencies of 10-minute exceedances of SO2 provided in Table 16.7-9 shows that SO2 concentrations are predicted to be above 530 µg/m³ less than 0.1% of the time at the AQLSA-MPOI and less than 0.5% of the time at the AQRSA-MPOI locations. Because SO2 irritates the breathing passages, people with breathing difficulties are often at higher risk from exposure. The airways of these people may already be irritated, making them particularly sensitive to the irritant action of SO2. Asthmatics are known to be especially responsive to SO2 and may show symptoms at lower concentrations than those affecting most people. Clear respiratory responses were not observed in a study in which non-exercising asthmatics were briefly exposed to SO2 concentrations of 1 300 µg/m³ (Linn et al. 1983, Sheppard et al. 1981). The level of sensitivity will vary among individuals depending on the asthmatic condition, the level of physical activity and the pattern of breathing (i.e., oral vs. nasal). While at rest, most people breathe mainly through the nose, which acts as a scrubber to remove SO2 from the air, preventing the gas from penetrating into the deeper airways and lungs where it can cause damage. On the other hand, while exercising, breathing occurs primarily through the mouth, with very little scrubbing, allowing greater amounts of SO2 to reach the lungs. In 2006, Alberta Health and Wellness released a report on the potential health effects associated with short-term exposure to low levels of SO2. The goal of the report was to “provide a comprehensive review of the available primary scientific literature in order to develop a quantitative understanding of the current state of knowledge with respect to the dose-response relationship between exposure [to SO2] and health effects based on the weight of evidence in the peer-reviewed scientific literature” (AHW 2006b). In the summary of their review of human clinical studies, AHW (2006b) reported that “the weight of evidence for exposures up to 30 minutes suggest that healthy humans can experience exposures to SO2 up to 10 ppm [26 000 µg/m³] with transitory effects on pulmonary function, even under challenging conditions involving hyperventilation, mouth-only exposure and heavy exercise. Transitory effects may be observed at concentrations as low as 0.75 ppm [1 950 µg/m³]” (AHW 2006b).

Devon NEC Corporation Pike 1 Project Volume 2 – Environmental Impact Assessment June 2012
Page 16-62
Typically, the onset of an individual’s response to SO2 is immediate, occurring within the first few minutes of exposure and usually reaching maximum levels within five to 10 minutes. After this time, the response may either stabilize or decline despite continued exposure. Recovery from short-term exposure to SO2 is generally complete within one hour of cessation of exposure (US EPA 1994). Despite predicted exceedances of the 10-minute air quality guideline and 1-hour US EPA NAAQS, the weight of evidence indicates a low potential for adverse health effects as a result of short-term SO2 exposures. The evidence is as follows:
• the localized nature of the exceedances;
• the infrequent nature of the exceedances;
• use of the peak (1st highest) hourly concentrations in the prediction of 10-minute concentrations likely overstated actual short-term exposures to SO2;
• no exceedances of the WHO air quality guideline or US EPA NAAQS were predicted at any of the Aboriginal locations; and
• no exceedances of the AAAQO were predicted at any of the locations.
16.7.1.2 Respiratory Irritants
The predicted risk quotients for the respiratory irritants exceed 1.0 at the AQLSA-MPOI and AQRSA-MPOI and for the Aboriginal group and worker group for all three assessment cases. At the Aboriginal locations, there is minimal to no difference between the Baseline Case and Application Case risk quotients, indicating that the Project’s emissions will have little impact on the respiratory irritant risks for the Aboriginal group. The significance of the Baseline Case respiratory irritant exceedances are described below. For the worker group, there appear to be minimal to no changes between the Baseline Case and Application Case risks. As such, the Project’s emissions are not expected to influence the acute respiratory irritant risks at these locations The acute respiratory irritant mixture consists of: acetaldehyde, acrolein, cadmium, chromium, copper, H2S, nickel, NO2, SO2, sulphuric acid, vanadium, xylenes and zinc. Of these, SO2 was the only mixture component predicted to exceed its exposure limit. At the AQLSA-MPOI, sulphuric acid, NO2 and SO2 are the primary contributors to the respiratory irritants mixture, contributing 10%, 30% and 59% to the total Baseline Case risks, respectively (i.e., cumulatively contributing 99% of the respiratory risk). For the Application Case, sulphuric acid, NO2 and SO2 contribute 7%, 23% and 68% to the respiratory irritant risks at the MPOI, respectively (i.e., 98%).

Devon NEC Corporation Pike 1 Project Volume 2 – Environmental Impact Assessment June 2012
Page 16-63
Under the Application Case, at the Aboriginal group location with the highest predicted respiratory irritant risks (receptor K95), NO2 and SO2 contribute 30% and 69% to the total respiratory irritant risks, respectively (i.e., 99% combined). Under the Application Case, at the worker location showing the highest predicted respiratory irritant risk (J3202), NO2 and SO2 contribute 27% and 72% to the respiratory irritant risks, respectively. As part of the mixtures assessment, it was assumed that the peak predicted short-term air concentration of each of the respiratory irritants mixture, including NO2 and SO2, would occur simultaneously. Review of the ambient air quality monitoring data from the Jackfish 1 Ambient Air Monitoring Station revealed that this is not the case for NO2 and SO2 under actual circumstances. That is, the peak measured 1-hour concentrations of NO2 at the Jackfish 1 Ambient Air Monitoring Station did not occur at the same time as the maximum measured 1-hour concentration of SO2. The acute mixtures assessment of the MPOI locations also assumed that the peak short-term air concentrations of the mixture constituents would occur at exactly the same location. However, detailed results of the air quality modeling predictions for NO2 and SO2 indicate that this is not the case at the MPOI locations. For example, the predicted 1-hour peak SO2 concentration at the AQRSA-MPOI was located at the UTM coordinates of 12N 510250E 6244250N, while the 1-hour peak NO2 concentration was located at the UTM coordinates of 12N 518250E 6166250N. Similarly, the predicted 1-hour peak SO2 concentration for the AQLSA-MPOI was located at the coordinates of 12N 507250E 6158250N, while the 1-hour peak NO2 concentration was located at the coordinates of 12N 517250E 6147250N. As such, the assumption that the peak air concentrations of the chemicals included in the respiratory irritants mixtures are occurring at precisely the same time and at precisely the same location resulted in an overstatement of the actual respiratory risks. Risk quotients resulting from peak predicted one hour air concentrations for all chemicals were used to calculate the respiratory irritant risks. As described previously, the likelihood of achieving any of these peak concentrations is low and use of the peak predicted concentrations in the calculation of the mixture risk quotients overstates the actual combined respiratory risks. The use of the more representative 9th highest hourly air concentrations yields respiratory irritant risks that are considerably lower than those based on the peak air concentrations (Table 16.7-10). Based on the 9th highest hourly concentrations for the chemicals in the respiratory irritant group, the combined risk quotients for the respiratory irritants only exceeded 1.0 at the AQLSA-MPOI and AQRSA-MPOI locations.

Devon NEC Corporation Pike 1 Project Volume 2 – Environmental Impact Assessment June 2012
Page 16-64
Table 16.7-10: Comparison of Maximum Respiratory Irritant Risk Quotients Based on the 1-Hour Peaks and the 1-Hour 9th Highest Air Concentrations
Receptor Group Peak Risk Quotients 9th Highest Risk Quotients
Baseline Application PDC Baseline Application PDCAQLSA-MPOI 2.4E+00 3.1E+00 4.1E+00 1.3E+00 1.3E+00 1.5E+00AQRSA-MPOI 5.3E+00 5.3E+00 5.3E+00 2.2E+00 2.2E+00 2.3E+00Maximum Aboriginal 1.3E+00 1.3E+00 1.4E+00 7.0E-01 7.1E-01 7.3E-01 Maximum Worker 1.9E+00 1.9E+00 2.4E+00 9.8E-01 9.8E-01 9.9E-01
Note: Values in bold indicate instances where RQ>1.0.
The weight of evidence indicates a low potential for adverse health effects as a result of short-term exposure to the respiratory irritants mixture for all locations, as follows:
• use of the peak (1st highest) hourly concentrations likely overstated the actual short-term exposures to the mixture constituents;
• the low likelihood of the predicted short-term air concentration (1st highest or 9th highest) of each of the respiratory irritants, including NO2 and SO2, occurring simultaneously at any given location; and
• the compounding conservatism of the individual respiratory irritants’ assessments. 16.7.2 Chronic Inhalation Health Risks This section describes the potential health risks associated with long-term (chronic) exposures to air emissions from the Baseline Case, Application Case and PDC. Separate assessments were completed for non-carcinogenic and carcinogenic exposures, reflecting the different approaches used in calculating and interpreting the risk estimates. Chronic inhalation health risks were estimated based on the assumption that Aboriginal receptors and workers would be continuously exposed to maximum predicted annual air concentrations. Chronic inhalation risks were evaluated for the Aboriginal and worker groups only. The MPOI locations were not evaluated on a chronic basis as area residents are not expected to be at this location for extended periods of time. 16.7.2.1 Non-Carcinogens The chronic, non-carcinogenic inhalation health risks, expressed as risk quotients, are presented in Tables 16.7-11 and 16.7-12 for the Aboriginal residents and workers, respectively. Predicted chronic risk quotients do not exceed 1.0 for any of the COPCs or mixtures under any of the three assessment cases (i.e., Baseline, Application and PDC). This demonstrates that in all cases predicted COPC air concentrations are less than their health-based exposure limits and the additive interactions of the COPCs are not predicted to result in health-related impacts. Therefore, potential chronic health risks associated with air inhalation are considered low and adverse health effects are not predicted to occur at any of the locations.

Devon NEC Corporation Pike 1 Project Volume 2 – Environmental Impact Assessment June 2012
Page 16-65
Table 16.7-11: Chronic Inhalation Risk Quotients – Aboriginal Group
Category COPC Risk Quotient
Baseline Application PDCCACs NO2 6.7E-02 6.8E-02 8.3E-02
PM2.5 5.0E-02 5.1E-02 9.3E-02 Metals Aluminum 9.2E-05 9.3E-05 1.9E-04
Barium 4.6E-05 4.6E-05 9.7E-05 Chromium 3.2E-05 3.2E-05 6.6E-05 Cobalt 1.1E-03 1.1E-03 2.2E-03 Copper 1.9E-04 1.9E-04 3.9E-04 Lead 6.9E-05 6.9E-05 1.4E-04 Manganese 7.5E-04 7.5E-04 1.6E-03 Silver 1.4E-05 1.4E-05 2.9E-05 Vanadium 7.4E-04 7.5E-04 1.5E-03
Organics Acrolein 5.2E-03 5.2E-03 1.1E-02 Aliphatic aldehydes 1.0E-03 1.2E-03 2.4E-03 Dichlorobenzene 2.4E-06 2.4E-06 5.0E-06 Ethylbenzene 3.6E-06 3.6E-06 3.7E-06 Formaldehyde 2.9E-03 2.9E-03 6.0E-03 Methacrolein 0.0E+00 1.2E-04 1.2E-04 n-hexane 3.4E-04 3.4E-04 6.9E-04 Sulphuric acid 1.5E-01 1.8E-01 2.6E-01 Toluene 2.9E-06 2.9E-06 5.8E-06 Xylenes 1.6E-05 1.6E-05 3.2E-05
PAHs Naphthalene 1.4E-03 1.4E-03 3.0E-03 PHCs Aliphatic C5-C8 group 3.1E-05 3.1E-05 6.3E-05
Aliphatic C9-C16 group 1.4E-03 1.4E-03 3.0E-03 Aromatic C9-C16 group 1.6E-04 1.6E-04 3.1E-04
Sulphur Compounds
Carbon Disulphide 8.5E-08 3.7E-06 2.4E-05 Hydrogen Sulphide 9.2E-04 9.6E-04 1.0E-03
Mixtures Eye irritants 2.9E-03 2.9E-03 6.1E-03 Nasal irritants 1.0E-02 1.0E-02 2.1E-02 Respiratory irritants 2.0E-01 2.4E-01 3.4E-01 Renal toxicants 1.6E-04 1.6E-04 3.2E-04 Neurotoxicants 1.7E-03 1.7E-03 3.6E-03
Note: An RQ equal to or less than 1.0 signifies that the estimated exposure is equal to or less than the exposure limit. Values in bold indicate an RQ greater than 1.0. With scientific notation, any value expressed to the negative power (i.e., E-x) shows that predicted exposures were less than the exposure limit; whereas, a value expressed to the positive power (i.e., E+x) shows exposure estimates exceeded the exposure limit.

Devon NEC Corporation Pike 1 Project Volume 2 – Environmental Impact Assessment June 2012
Page 16-66
Table 16.7-12: Chronic Inhalation Risk Quotients – Worker Group
Category COPC Risk Quotient
Baseline Application PDCCACs NO2 8.3E-02 8.4E-02 9.4E-02
PM2.5 3.2E-02 3.2E-02 6.0E-02 Metals Aluminum 2.3E-05 2.3E-05 4.7E-05
Barium 3.0E-05 3.0E-05 6.3E-05 Chromium 1.6E-05 1.6E-05 3.4E-05 Cobalt 2.3E-04 2.3E-04 5.3E-04 Copper 4.3E-05 4.3E-05 9.4E-05 Lead 4.7E-05 4.7E-05 9.9E-05 Manganese 1.7E-04 1.7E-04 3.7E-04 Silver 9.4E-06 9.4E-06 2.0E-05 Vanadium 1.6E-04 1.6E-04 3.7E-04
Organics Acrolein 4.1E-04 6.4E-04 6.5E-04 Aliphatic aldehydes 1.1E-03 1.2E-03 2.8E-03 Dichlorobenzene 5.2E-07 5.4E-07 1.5E-06 Ethylbenzene 2.8E-06 2.8E-06 3.5E-06 Formaldehyde 2.6E-04 3.1E-04 6.0E-04 Methacrolein 0.0E+00 4.6E-05 4.6E-05 n-hexane 1.0E-04 1.0E-04 2.4E-04 Sulphuric acid 1.6E-01 1.6E-01 3.1E-01 Toluene 9.3E-07 9.3E-07 1.4E-06 Xylenes 4.5E-06 4.5E-06 6.6E-06
PAHs Naphthalene 6.7E-05 6.7E-05 1.4E-04 PHCs Aliphatic C5-C8 group 1.3E-05 1.4E-05 3.0E-05
Aliphatic C9-C16 group 1.5E-03 1.5E-03 3.6E-03 Aromatic C9-C16 group 1.5E-04 1.6E-04 3.7E-04
Sulphur compounds Carbon Disulphide 6.6E-08 1.4E-06 2.8E-05 Hydrogen Sulphide 7.3E-04 7.9E-04 8.4E-04
Mixtures Eye irritants 2.6E-04 3.5E-04 6.3E-04 Nasal irritants 2.1E-03 2.7E-03 4.4E-03 Respiratory irritants 2.2E-01 2.2E-01 4.0E-01 Renal toxicants 1.5E-04 1.6E-04 3.7E-04 Neurotoxicants 1.8E-03 1.8E-03 4.3E-03
Note: An RQ equal to or less than 1.0 signifies that the estimated exposure is equal to or less than the exposure limit. Values in bold indicate an RQ greater than 1.0. With scientific notation, any value expressed to the negative power (i.e., E-x) shows that predicted exposures were less than the exposure limit; whereas, a value expressed to the positive power (i.e., E+x) shows exposure estimates exceeded the exposure limit.

Devon NEC Corporation Pike 1 Project Volume 2 – Environmental Impact Assessment June 2012
Page 16-67
16.7.2.2 Carcinogens
Chronic inhalation health risks for the carcinogenic COPCs, expressed as ILCR, are presented in Tables 16.7-13 and 16.7-14 for the Aboriginal group and worker group, respectively.
Table 16.7-13: Chronic Inhalation Risk Quotients – Aboriginal Group
Category COPC Incremental Lifetime Cancer Risks (per 100,000)
Project Alone Future CaseMetals Arsenic 3.7E-04 1.0E-02
Cadmium 1.2E-04 3.4E-03 Chromium VI 5.1E-05 1.5E-03 Nickel 9.4E-04 2.6E-02
Organics 1,3-Butadiene 3.9E-05 5.1E-03 Acetaldehyde 9.5E-05 9.1E-04 Benzene 9.1E-04 3.1E-02
PAHs Benzo(a)pyrene (Approach 1) 2.1E-04 6.5E-02 Benzo(a)pyrene (Approach 2) 3.3E-06 1.8E-04
Mixtures Lung Carcinogens 1.7E-03 1.1E-01 Leukemogens 9.5E-04 3.7E-02
Note: An ILCR equal to or less than 1.0 signifies an ILCR that is below the benchmark ILCR of one in 100,000 (i.e., within the generally accepted limit deemed to be protective of public health). With scientific notation, any value expressed to the negative power (i.e., E-x) shows that predicted exposures were less than the exposure limit; whereas, a value expressed to the positive power (i.e., E+x) shows exposure estimates exceeded the exposure limit.
Table 16.7-14: Chronic Inhalation Risk Quotients – Worker Group
Category COPC Incremental Lifetime Cancer Risks (per 100,000)
Project Alone Future CaseMetals Arsenic 1.4E-04 2.7E-03
Cadmium 4.5E-05 2.3E-03 Chromium VI 1.9E-05 7.6E-04 Nickel 3.5E-04 7.0E-03
Organics 1,3-Butadiene 1.5E-05 2.3E-04 Acetaldehyde 3.6E-05 4.3E-05 Benzene 3.4E-04 3.8E-03
PAHs Benzo(a)pyrene (Approach 1) 7.9E-05 3.0E-03 Benzo(a)pyrene (Approach 2) 1.2E-06 2.9E-05
Mixtures Lung Carcinogens 6.4E-04 1.2E-02 Leukemogens 3.6E-04 3.9E-03
Note: An ILCR equal to or less than 1.0 signifies an ILCR that is below the benchmark ILCR of one in 100,000 (i.e., within the generally accepted limit deemed to be protective of public health). With scientific notation, any value expressed to the negative power (i.e., E-x) shows that predicted exposures were less than the exposure limit; whereas, a value expressed to the positive power (i.e., E+x) shows exposure estimates exceeded the exposure limit.

Devon NEC Corporation Pike 1 Project Volume 2 – Environmental Impact Assessment June 2012
Page 16-68
As discussed previously, the regulatory benchmark of an acceptable ILCR of 1.0 in 100,000 is policy-based (AEW 2009; CCME 2006; Health Canada 2009b). The assessment focused on ILCRs from the Project alone and planned future emission sources in the area (i.e., PDC minus Baseline Case).
16.7.3 Chronic Multiple Exposure Pathway Assessment
This section describes the potential health risks associated with long-term (chronic) multiple pathway exposures for the Baseline Case, Application Case and PDC. As in the chronic inhalation assessment, separate assessments were completed for non-carcinogenic and carcinogenic exposures, reflecting the different approaches used in calculating and interpreting the risk estimates. Health risks were estimated for the Aboriginal group exposed via secondary exposure pathways over their entire lifespan of 80 years (Health Canada 2009a). In the case of the workers, it was assumed that secondary pathway exposures would be limited to the 60 years of their adult life. The multiple pathway assessment focused on those COPCs emitted into the air with the potential to persist or accumulate in the environment. As such, potential health risks associated with exposure through multiple pathways were considered for the persistent VOCs, PAHs and metals emitted by the Project.
16.7.3.1 Non-Carcinogens
For the Aboriginal group, the risk quotients are provided for the most sensitive life stage (Table 16.7-15). The most sensitive life stage is defined as the life stage with the greatest exposure per unit body weight per day (Health Canada 2004). On this basis, young children were typically identified as the most sensitive on a per unit body weight basis. In the case of the workers (Table 16.7-16), it was assumed that the camps and other worksites would be occupied by adult employees only. As such, the risk quotients for the workers are for the adult life stage only. With the single exception of manganese (Aboriginal group only), all risk quotients for the individual chemicals are less than 1.0. The Aboriginal group also had maximum risk quotients greater than 1.0 for the hepatotoxicants, neurotoxicants and reproductive and developmental toxicants mixtures. The significance of these exceedances is discussed below. No exceedances are predicted for the worker group, indicating that the health risks are low at these locations.

Devon NEC Corporation Pike 1 Project Volume 2 – Environmental Impact Assessment June 2012
Page 16-69
Table 16.7-15: Maximum Chronic Multiple Exposure Pathway Risk Quotients for Non-Carcinogens – Aboriginal Group
Category COPCs Risk Quotients Baseline Application PDC
Organics 2-Methylnaphthalene 2.6E-09 2.6E-09 5.5E-09
Aliphatic C17-C34 group 3.3E-05 3.3E-05 7.5E-05
Aromatic C9-C16 group 1.8E-07 1.8E-07 3.6E-07
Aromatic C17-C34 group 5.4E-08 7.8E-08 9.1E-08
Formaldehyde 8.7E-08 8.7E-08 1.8E-07
Pyrene 5.3E-06 5.3E-06 1.1E-05
Metals Aluminum 4.1E-01 4.1E-01 4.1E-01
Antimony 5.3E-01 5.3E-01 5.8E-01
Barium 1.9E-01 1.9E-01 1.9E-01
Cadmium 2.8E-01 2.8E-01 3.6E-01
Chromium 1.7E-03 1.8E-03 1.8E-03
Chromium VI 2.2E-01 2.2E-01 2.2E-01
Cobalt 5.8E-01 6.0E-01 6.2E-01
Copper 7.7E-02 8.2E-02 8.7E-02
Lead 5.4E-01 5.8E-01 6.3E-01
Manganese 1.2E+00 1.2E+00 1.2E+00Nickel 6.0E-02 6.2E-02 6.5E-02
Silver 4.9E-01 4.9E-01 4.9E-01
Strontium 1.3E-02 1.3E-02 1.5E-02
Tin 8.2E-03 1.8E-02 3.7E-02
Vanadium 5.3E-01 5.4E-01 5.5E-01
Zinc 4.3E-01 4.3E-01 4.4E-01
Mixtures Gastrointestinal toxicants 2.2E-01 2.2E-01 2.2E-01
Hepatotoxicants 1.0E+00 1.0E+00 1.1E+00Renal toxicants 8.7E-01 8.7E-01 9.5E-01
Neurotoxicants 2.1E+00 2.1E+00 2.2E+00Developmental & Reproductive toxicants 1.5E+00 1.6E+00 1.7E+00
Note: Values in bold indicate an RQ greater than 1.0. With scientific notation, any value expressed to the negative power (i.e., E-x) shows that predicted exposures were less than the exposure limit; whereas, a value expressed to the positive power (i.e., E+x) shows exposure estimates exceeded the exposure limit.

Devon NEC Corporation Pike 1 Project Volume 2 – Environmental Impact Assessment June 2012
Page 16-70
Table 16.7-16: Maximum Chronic Multiple Exposure Pathway Risk Quotients for Non Carcinogens – Worker Group
Category COPCs Risk Quotients
Baseline Application PDCOrganics 2-Methylnaphthalene 1.6E-12 1.6E-12 4.0E-12
Aliphatic C17-C34 group 5.9E-11 6.0E-11 1.4E-10
Aromatic C9-C16 group 1.4E-09 1.5E-09 3.5E-09
Aromatic C17-C34 group 1.7E-10 1.8E-10 2.4E-10
Formaldehyde 9.1E-14 1.1E-13 2.1E-13
Pyrene 2.1E-09 2.1E-09 4.5E-09
Metals Aluminum 5.0E-02 5.0E-02 5.0E-02
Antimony 4.8E-04 4.8E-04 1.0E-03
Barium 3.2E-04 3.2E-04 3.2E-04
Cadmium 1.9E-05 1.9E-05 4.0E-05
Chromium 2.6E-06 2.6E-06 2.6E-06
Chromium VI 3.3E-04 3.3E-04 3.3E-04
Cobalt 1.3E-03 1.3E-03 1.4E-03
Copper 2.7E-05 2.7E-05 3.1E-05
Lead 1.7E-03 1.7E-03 1.7E-03
Manganese 2.3E-02 2.3E-02 2.3E-02
Nickel 2.1E-04 2.1E-04 2.5E-04
Silver 1.5E-05 1.5E-05 3.1E-05
Strontium 3.0E-08 3.0E-08 6.3E-08
Tin 5.6E-07 5.6E-07 1.2E-06
Vanadium 4.8E-03 4.8E-03 4.9E-03
Zinc 5.5E-05 5.5E-05 6.0E-05
Mixtures Gastrointestinal toxicants 3.3E-04 3.3E-04 3.3E-04
Hepatotoxicants 5.0E-02 5.0E-02 5.1E-02
Renal toxicants 5.0E-02 5.0E-02 5.0E-02
Neurotoxicants 7.5E-02 7.5E-02 7.5E-02
Developmental & Reproductive toxicants 5.7E-02 5.7E-02 5.7E-02
Note: Values in bold indicate an RQ greater than 1.0. With scientific notation, any value expressed to the negative power (i.e., E-x) shows that predicted exposures were less than the exposure limit; whereas, a value expressed to the positive power (i.e., E+x) shows exposure estimates exceeded the exposure limit.

Devon NEC Corporation Pike 1 Project Volume 2 – Environmental Impact Assessment June 2012
Page 16-71
This demonstrates that, for most COPCs, predicted exposures are less than the health-based exposure limits and that the additive interactions of those COPCs are not predicted to result in health-related impacts. For all of the COPCs and mixtures, minimal changes in risk quotients are predicted between the Baseline and Application cases, indicating that the Project is not expected to have a material impact on the chronic multi-pathway health risks in the region.
Manganese
Risk quotients greater than 1.0 are predicted for manganese for the Aboriginal group (RQ=1.2). Interpretation of these exceedances considered the following factors:
• potential contributions from the Project and other planned future emission sources; • the primary exposure pathways contributing to the predicted exceedances; and • the degree of conservatism incorporated in the manganese exposure limit. Manganese is associated with risk quotients of 1.2 in the Baseline Case, Application Case and PDC for the Aboriginal group. The predicted risk quotients do not change between the Baseline Case, Application Case and PDC. The manganese risk quotients for the different life stages are presented in Table 16.7-17.
Table 16.7-17: Manganese Risk Quotients for the Life Stages of the Aboriginal Group
Life Stage Risk Quotients
Baseline Application PDC Infant 0.089 0.089 0.089 Toddler 1.15 1.15 1.15 Child 0.87 0.87 0.87 Adolescent 0.81 0.81 0.81 Adult 0.77 0.77 0.77
Given that the risk quotients are not predicted to change between the Baseline Case and the Application Case, the Project will have negligible influence on the risks estimated for the existing and approved activities under the Baseline Case. Similarly, planned future developments are not predicted to increase the risk of adverse health effects associated with long-term exposure to manganese in the region. This indicates that the risk quotients predicted under the Application Case and PDC are entirely attributable to the existing conditions captured under the Baseline Case. Manganese is commonly present in the environment and is an essential element involved in the formation of bone and in various aspects of metabolism (IOM 2001). Dietary sources are the primary route of human exposure to manganese, with people who consume a high amount of plant-based foods and legumes having potentially higher intake than other individuals (IOM 2001, ATSDR 2008, US EPA 1996).

Devon NEC Corporation Pike 1 Project Volume 2 – Environmental Impact Assessment June 2012
Page 16-72
The primary exposure pathways contributing to the risk quotients for the life stage (i.e., toddler) with risk quotients greater than 1.0 are presented in Table 16.7-18.
Table 16.7-18: Breakdown of Exposure Pathways Contributing to the Predicted Manganese Risks
Exposure Pathway Percentage Breakdown of Primary Contributing Exposure Pathways for the Toddler
Consumption of aboveground produce 31% Consumption of berries 26% Consumption of Labrador tea 20% Consumption of below-ground produce/root vegetables 10% Consumption of fish 4% Consumption of cattail roots 4% Drinking water 2% Incidental soil ingestion 1%
Note: All other exposure pathways contributed less than 1% to the total estimated daily intakes for manganese.
As shown in Table 16.7-18, most of the manganese exposure relates to the ingestion of above-ground plants, berries and Labrador tea. These observations are consistent with those of the ATSDR, the Institute of Medicine (IOM) and the US EPA in that those individuals who consume larger amounts of plant-based foods are exposed to higher levels of manganese. The risk quotients for manganese are based on the chronic oral exposure limit of 140 µg/kg bw/d recommended by the US EPA (1996). This exposure limit is based on a NOAEL of 10 mg/d (or 0.14 mg/kg bw/d for a 70 kg adult) derived from several population-based studies, each of which evaluated the relationship between manganese exposure and Central Nervous System effects in humans. The same NOAEL was identified by Health Canada (2009b) and WHO (2000) in their respective reviews of the toxicological effects associated with long-term exposure to manganese. In the current assessment, the estimated daily intake of manganese for toddlers was predicted to be 2.5 mg/d, well below the recognized NOAEL of 10 mg/d (Health Canada 2009b, US EPA 1996, WHO 2000). To date, the manganese exposure levels at which adverse effects are expected in humans has not been clearly defined; although the weight of evidence suggests that exposure below 10 mg/d is unlikely to be associated with adverse effects (IOM 2001; Santamaria and Sulsky 2010; Andersen et al. 2010). The WHO (2004) noted in its toxicological review that manganese is not considered very toxic to humans given the existence of homeostatic mechanisms and that the incidence of adverse health effects at the upper range of dietary intake is negligible. Health Canada estimates the average daily intake of manganese for toddlers (i.e., one to four years of age) and all Canadians to be between 2 and 5 mg/d based on Canadian food consumption data in combination with the manganese content of the various food items (Health Canada 2011). As such, it would seem that the predicted daily intake of manganese for toddlers of 2.5 mg/d, which is associated with the highest risk quotient of 1.2, is within the range of average rates of exposure for the Canadian population.

Devon NEC Corporation Pike 1 Project Volume 2 – Environmental Impact Assessment June 2012
Page 16-73
Hepatotoxicant Mixture – Potential Liver Effects
Risk quotients greater than 1.0 are predicted for the Aboriginal group under the PDC only. Risk quotients of 1.0, 1.0 and 1.2 are predicted for the Baseline Case, Application Case and PDC, respectively. The differences between the Baseline Case and Application Case risk quotients are negligible, suggesting that the Project is not expected to have an appreciable impact on the hepatotoxicant risks. The hepatotoxicant risk quotients for the worker group were all less than 1.0. Assessment of the hepatotoxicant mixture assumed an additive interaction between all potential hepatotoxicants emitted from the Project. As such, the predicted chronic health risks associated with each of the individual hepatotoxicants (aliphatic C17-C34 group, aluminum, antimony, aromatic C9-C16 group and copper) were summed. For the Baseline Case, Application Case and PDC, the five COPCs contribute the following percentage ranges to the hepatotoxicant risks: antimony (52% to 54%), aluminum (38% to 40%), copper (8%), aliphatic C17-C34 group (<1%) and aromatic C9-C16 group (<1%). The risk quotients of the individual hepatotoxicant COPCs were less than 1.0. While both antimony and aluminum (i.e., the primary contributors to the risks) are cited as having hepatic endpoints, the nature of these endpoints must be examined closely to determine whether or not the mechanisms and effects are additive. The hepatotoxicant effects of aluminum cited by WHO/FAO (2007) include mild histopathological changes in the liver in various species, over acute and subchronic study durations. Histological and subclinical endpoints were considered for antimony as well. The antimony exposure limit included mild histopathological changes and clinical chemical changes related to the liver. These effects are generally subclinical, meaning that they may not be related to actual, measurable adverse health effects. While there is some potential that these subclinical effects might be additive, because of the variety of endpoints, it is also possible that the effects are less than additive. The Project is predicted to have a negligible impact on the potential health risks associated with the long-term exposure to the hepatotoxicants. Despite the predicted exceedances for the Aboriginal group, the weight-of-evidence suggests that there is low potential for adverse health effects associated with long-term exposure to the hepatotoxicants in the region.
Neurotoxicant Mixture – Potential Neurological Effects
Risk quotients greater than 1.0 are predicted for the Aboriginal group. Risk quotients of 2.1, 2.1 and 2.2 are predicted for the Baseline Case, Application Case and PDC, respectively. The differences between the Baseline Case and Application Case RQ values are negligible, suggesting that the Project is not expected to have an appreciable impact on the neurotoxicant risks. Assessment of the neurotoxicants mixture assumed an additive interaction between all neurotoxicants emitted from the Project. As such, the predicted chronic health risks associated with each of the individual neurotoxicants (aluminum, lead and manganese) were summed. For the Baseline Case, Application Case and PDC, the three COPCs contribute the following percentages to the neurotoxicant risks: manganese (52% to 55%), lead (26% to 29%) and aluminum (19%).

Devon NEC Corporation Pike 1 Project Volume 2 – Environmental Impact Assessment June 2012
Page 16-74
As described in the discussion of the manganese risks, the estimated intake levels of manganese in this assessment fall within the range of typical Canadian exposure levels, at which adverse effects have not been observed. The daily intake of lead for toddlers is estimated to be 17.9 µg/d for the Application Case in the HHRA. In comparison, the estimated total daily intake of lead for toddlers in the Canadian general population is 28.6 µg/d (CCME 1996). This suggests that the intake levels of lead for the area residents in the HHRA are no higher than those expected for the general population. As such, the existing or future neurotoxicant risks are not elevated for the area residents. Adverse effects from the neurotoxicants mixture are not expected based on the following:
• the risk quotients for aluminum and lead are less than 1.0, while the health risks for manganese are likely overstated as a result of the conservative assumptions incorporated into the HHRA;
• the ATSDR (2004) acknowledges that the toxicological significance of lead’s potential interactive effect on manganese is unclear and states that “the mechanism(s) by which the interactions could occur has not been well characterized”;
• the risk quotient for manganese is based on a no-effect level for the central nervous system. Human studies suggest an association between ingestion of water and/or food containing increased levels of manganese and adverse neurological effects. However, there is no clear threshold level for neurological effects resulting from manganese exposures based on the toxicological data that are available for humans. In addition, no firm conclusions can be drawn regarding a critical effect level of chronic intake versus essential dietary levels of manganese (ATSDR 2004);
• the HHRA conservatively assumed that total metal concentrations measured in plants and game were 100% bioavailable. Metal cations can exist as potentially toxic uncomplexed species or as relatively nontoxic complexed forms, usually with organic ligands or non-metallic inorganic anions such as oxides, sulphates or phosphates. (US EPA 2007); and
• there are homeostatic mechanisms in mammals that lead to decreased absorption and/or increased excretion of manganese when manganese intakes are high (Rehnberg et al. 1980, ATSDR 2008, Health Canada 2010).
For the reasons stated, the potential for adverse neurotoxicological effects is considered low.
Reproductive and Developmental Toxicant Mixture
Risk quotients exceeding 1.0 are predicted for the Aboriginal group. Risk quotients of 1.5, 1.6 and 1.7 are predicted for this mixture under the Baseline Case, Application Case and PDC, respectively. Again, the differences between the risks for the three assessment cases are negligible, suggesting that the Project is not expected to have an appreciable impact on the reproductive and developmental risks.

Devon NEC Corporation Pike 1 Project Volume 2 – Environmental Impact Assessment June 2012
Page 16-75
Assessment of the reproductive and developmental toxicants mixture assumed an additive interaction between all chemicals emitted from the Project that could affect development (fetal and child) or the reproductive system. As such, the predicted chronic health risks associated with each of the individual constituents (aluminum, lead, nickel, strontium, vanadium) were summed. The primary contributors to the mixture risks are aluminum, lead and vanadium, collectively contributing greater than 95% to the reproductive and developmental risks for the Baseline Case, Application case and PDC (aluminum: 24 to 26%; lead: 35% to 38%; vanadium: 33% to 34%). Although the five COPCs share the same broad endpoint of reproductive and developmental effects, the specific basis of each exposure limit varies considerably. Aluminum is classified as a potential reproductive and developmental toxicant, neurotoxicant, nephrotoxicant and hepatotoxicant. Lead is a neurotoxicant and also classified as a reproductive and developmental toxicant on the basis that fetuses and young children are highly susceptible to neurotoxicants. While adverse effects were observed on the reproductive system and the developing nervous system for both aluminum and lead, available studies for aluminum have not adequately defined a dose-response relationship for these endpoints (WHO/FAO 2007). The exposure limit for nickel is based on the incidence of post-implantation lethality in laboratory rats. The endpoint for the strontium exposure limit is based on skeletal and cartilage changes in offspring, while the endpoint of the vanadium exposure limit is based on reduced body weight and relative weights of the liver, spleen and kidneys in offspring. Thus, the assumption that the potential risks of reproductive and developmental toxicity are additive is conservative and unrealistic, given the variety of endpoints and mechanisms by which such effects may occur for the COPCs identified in this mixture. As such, it is considered unlikely that the predicted risk quotients for the reproductive and developmental mixture would result in adverse health effects.
16.7.3.2 Carcinogens
The estimated carcinogenic ILCRs for the Aboriginal and worker groups are presented in Tables 16.7-19 and 16.7-20. Results are presented only for the two incremental scenarios in the HHRA: the Project only scenario and the Future scenario (PDC minus Baseline). The values represent the ILCR per 100,000 people. Note that no mixtures of carcinogenic endpoints were identified for the multiple pathway assessment.

Devon NEC Corporation Pike 1 Project Volume 2 – Environmental Impact Assessment June 2012
Page 16-76
Table 16.7-19: Maximum Chronic Multiple Exposure Pathway Incremental Lifetime Cancer Risks – Aboriginal Group
COPC Incremental Lifetime Cancer Risks (per 100,000)
Project Future Benzo(a)Pyrene equivalent 4.6E-03 4.4E-01 Arsenic 2.2E-03 5.3E-02
Note: An ILCR equal to or less than 1.0 signifies an ILCR that is below the benchmark ILCR of one in 100,000 (i.e., within the generally accepted limit deemed to be protective of public health). With scientific notation, any value expressed to the negative power (i.e., E-x) shows that predicted exposures were less than the exposure limit; whereas, a value expressed to the positive power (i.e., E+x) shows exposure estimates exceeded the exposure limit.
Table 16.7-20: Maximum Chronic Multiple Exposure Pathway Incremental Lifetime Cancer Risks – Worker Group
COPC Incremental Lifetime Cancer Risks (per 100,000)
Project Future Benzo(a)Pyrene equivalent 3.0E-05 8.7E-04 Arsenic 1.6E-04 3.1E-03
Note: An ILCR equal to or less than 1.0 signifies an ILCR that is below the benchmark ILCR of one in 100,000 (i.e., within the generally accepted limit deemed to be protective of public health). With scientific notation, any value expressed to the negative power (i.e., E-x) shows that predicted exposures were less than the exposure limit; whereas, a value expressed to the positive power (i.e., E+x) shows exposure estimates exceeded the exposure limit.
As shown, the maximum predicted ILCRs associated with the Project alone and the planned future emission sources in the area are all less than 1.0 in 100,000, indicating that the incremental cancer risk from the Project and future emission sources are deemed to be “essentially negligible” (Health Canada 2009b).
16.8 Monitoring
Devon will continue to consult with stakeholders and potentially affected communities on an ongoing basis. In 2008, Devon joined other insitu oil sands producers and the Chipewyan Prairie Dené First Nation (CPDFN) by becoming an active supporter of the CPDFN Traditional Food Study. This is a community based country foods sampling and risk assessment project and is a followup to the Southern Community Traditional Foods Study completed in 2006. As part of the CPDFN Traditional Food Study, tissue sampling is conducted by community members. To date, samples have been obtained for moose, duck, grouse, rabbit, and fish. The results of the CPDFN Traditional Food Study are pending.
Devon NEC Corporation Pike 1 Project Volume 2 – Environmental Impact Assessment June 2012
Page 16-77
16.8.1 Air Quality
The local air quality monitoring commitments include source monitoring, which characterizes the emissions from the Project’s relevant CPF units and ambient monitoring, which measures ambient air concentrations in the immediate vicinity of the Project. On a regional basis, air quality monitoring is primarily addressed through the multi-stakeholder WBEA network. Devon is a WBEA member and plans to provide Project-specific air monitoring data in support of the regional monitoring network.
16.8.2 Groundwater Quality
Devon plans to monitor potential impacts associated with the operation of its surface facilities, groundwater withdrawal and production and steaming. A network of groundwater monitoring wells will be installed at the Project CPF to establish baseline data for groundwater levels, flow conditions and groundwater quality. The groundwater monitoring well network at the CPF will focus on the shallowest formation as it will be the most vulnerable to impacts from the surface facility operations.
16.8.3 Surface Water Quality
Surface water quality monitoring planned for the Project is described in Volume 2, Section 8.8.
16.9 Summary
Overall, emissions from the Project are not expected to appreciably increase the risk of adverse health effects in the region. For most COPCs and mixtures, the changes between the predicted health risks under the Baseline Case and the Application Case are minimal. Similarly, cumulative health risks associated with the Project in combination with other planned future emission sources are not expected to result in measurable health effects in the region. The changes between the predicted health risks under the Baseline Case and the PDC are low. The conclusions for the acute inhalation assessment, chronic inhalation assessment and chronic multiple pathway assessment are described below.
16.9.1 Acute Inhalation Health Risks
Inhalation health risks associated with the Project air emissions on an acute or short-term basis were evaluated by comparing maximum predicted short-term air concentrations with health-based regulatory guidelines considered protective of the most sensitive individuals. With the exceptions of SO2 and the respiratory irritants mixture, predicted acute risk quotients did not exceed 1.0 for any of the individual COPCs and chemical mixtures under any of the three assessment cases (i.e., Baseline Case, Application Case and PDC). This demonstrates that, in most cases, predicted COPC air concentrations were less than their health-based guidelines and that the additive interactions of the COPCs are not predicted to result in adverse health effects. Therefore, health risks for these COPCs and mixtures are considered low.

Devon NEC Corporation Pike 1 Project Volume 2 – Environmental Impact Assessment June 2012
Page 16-78
Overall, the weight of evidence suggests that there is a low potential for adverse health effects as a result of short-term SO2 exposures. As part of the weight of evidence, consideration was given to:
• the use of peak (1st highest) predicted air concentrations, which likely overstated actual short-term exposures to SO2 in the area of the Project;
• the low likelihood of exceedances occurring; • the localized nature of the predicted exceedances; and • no SO2 exceedances predicted for any of the locations in the Aboriginal group. For the respiratory irritants mixture, consideration was given to the compounding conservatism of the individual respiratory irritants’ assessments, with particular attention given to the conservatism incorporated in the SO2 and NO2 assessments. The HHRA assumed that the peak (1st highest) predicted ground-level air concentrations of SO2 and NO2 would occur simultaneously and at precisely the same location. On this basis, it was concluded that there is a low potential for adverse health effects as a result of short-term exposures to the respiratory irritants.
16.9.2 Chronic Inhalation Health Risks
The long-term inhalation health risks were evaluated by comparing the predicted annual air concentrations with health-based regulatory guidelines considered protective of the most sensitive individuals. Predicted chronic inhalation health risks for the non-carcinogens, expressed as risk quotients, did not exceed 1.0 for any of the individual COPCs and chemical mixtures under any of the three assessment cases (i.e., Baseline Case, Application Case and PDC). This demonstrates that the predicted COPC air concentrations were less than their health-based guidelines and that additive interactions of the COPCs are not predicted to result in adverse health effects. Therefore, health risks for these COPCs and mixtures were considered low. The predicted cancer risks, expressed as ILCRs, associated with the Project and planned future emission sources in the area were all less than 1.0 in 100,000, indicating that the incremental cancer risk from the Project and planned future developments are deemed to be “essentially negligible” (Health Canada 2009b).
16.9.3 Chronic Multiple Pathway Health Risks
Health risks associated with multiple pathways of exposure were estimated by comparing exposure estimates with health-based exposure limits. In most cases, the risk quotients for the non-carcinogenic COPCs and mixtures did not exceed 1.0 under the three assessment cases (i.e., Baseline Case, Application Case and PDC). The exceptions include manganese and the hepatotoxicants, neurotoxicants and the reproductive and developmental mixtures. For the COPCs and mixtures, the potential health risks were dominated by the predicted risks for the Baseline Case. Given that health risks were not

Devon NEC Corporation Pike 1 Project Volume 2 – Environmental Impact Assessment June 2012
Page 16-79
predicted to significantly change between the Baseline Case and the Application Case, the Project emissions are predicted to have negligible impact on the potential health risks associated with long-term exposure in the region. Although the predicted risk estimates for the Baseline Case (and, in turn, the Application Case and the PDC) exceeded 1.0 for manganese and the hepatotoxicants, neurotoxicants and reproductive and developmental mixtures, the weight of evidence suggests that there is a low potential for health effects to occur. Because the estimated intake levels of manganese in this assessment fall within the range of typical Canadian exposure levels, at which adverse effects have not been observed, it is considered unlikely that the predicted risks for manganese and the associated neurotoxicants mixture (based largely on manganese), would result in adverse health effects. Since the risk quotients for individual member COPCs of the hepatotoxicants and the reproductive and developmental toxicants are all less than 1.0 and their health risks are not truly additive, it is considered unlikely that the predicted RQ values for the neurotoxicants and reproductive and developmental toxicants would result in adverse health effects. The cancer risk estimates, expressed as ILCRs, associated with the Project and the planned future emission sources were all less than 1.0 in 100,000, indicating that the incremental cancer risk is deemed to be “essentially negligible” according to Health Canada protocol (Health Canada 2009b). Overall, health risks in the region associated with multiple pathways of exposure to the COPCs and mixtures are considered low.
16.10 References
Agency for Toxic Substances and Disease Registry (ATSDR). 1998. Toxicological Profile for Sulphur Dioxide. Atlanta, GA: United States Department of Health and Human Services, Public Health Service. December 1998.
Agency for Toxic Substances and Disease Registry (ATSDR). 2004. Guideline Manual for the Assessment of Joint Toxic Action of Chemical Mixtures. US Department of Health and Human Services, Public Health Service. Atlanta, Georgia. May 2004.
Agency for Toxic Substances and Disease Registry (ATSDR). 2008. Draft Toxicological Profile for Manganese. Atlanta, GA: US Department of Health and Human Services, Public Health Service.
Agency for Toxic Substances and Disease Registry (ATSDR). 2009. Minimal Risk Levels (MRLs) Narrative. Available at: http://www.atsdr.cdc.gov/mrls/index.asp. September 2009.
Alberta Cancer Board (ACB). 2007. Cancer in Alberta: A Regional Picture 2007. ISSN 1913-5912.

Devon NEC Corporation Pike 1 Project Volume 2 – Environmental Impact Assessment June 2012
Page 16-80
Alberta Environment and Water (AEW). 2009. Alberta Tier 1 Soil and Groundwater Remediation Guidelines. Edmonton, AB: Alberta Environment. February 2009.
Alberta Health and Wellness (AHW). 1997. Swan Hills Special Waste Treatment Centre Human Health Impact Assessment. Health Surveillance Branch, Alberta Health and Wellness. October 1997.
Alberta Health and Wellness (AHW). 2000. The Alberta Oil Sands Community Exposure and Health Effects Assessment Program. Technical Report. Prepared by a Consortium of Government, University and Corporate Partners. Alberta Health Surveillance, Edmonton, AB.
Alberta Health and Wellness (AHW). 2006a. Health Effects Associated with Short-term Exposure to Low Levels of Sulphur Dioxide (SO2) – A Technical Review. Alberta Health and Wellness, Health Surveillance, Health Strategies Division. Edmonton, Alberta. ISBN 0-7785-3480-4.
Alberta Health and Wellness (AHW). 2006b. Report on the Health of Albertans. ISBN 0-7785-3476-6. Available at: http://www.health.alberta.ca/documents/Health-of-Albertans-2006.pdf.
Alberta Health and Wellness (AHW). 2007a. Health Trends in Alberta: A Working Document. Surveillance and Environmental Health Branch, Edmonton, AB. ISSN: 1480-6657.
Alberta Health and Wellness (AHW). 2007b. Assessment of the Potential Lifetime Cancer Risks Associated with Exposure to Inorganic Arsenic among Indigenous People Living in the Wood Buffalo Region of Alberta. Prepared by Cantox Environmental Inc. March 2007.
Alberta Health and Wellness (AHW). 2009. Human Health Risk Assessment Mercury in Fish in Central Alberta. Surveillance and Environmental Health, Alberta Health and Wellness. Edmonton, Alberta. March 2009. ISBN 978-0-7785-7427-9. Cited from: Health Canada. 1999. Lesser Slave Lake Health Study. Unpublished. Medical Service Branch, Health Canada.
Alberta Health and Wellness (AHW). 2011. Guidance on Human Health Risk Assessment for Environmental Impact Assessments in Alberta. August 2011.
Alberta Health and Wellness (AHW). 2012. Interactive Health Data Application (IDHA). Available at: http://www.ahw.gov.ab.ca/IHDA_Retrieval/. Accessed January 2012.
Andersen M.E., D.C. Dorman, H.J. Clewell III, M.D. Taylor, A. Nong. 2010. Multi-Dose Route, Multi-Species Pharmacokinetic Models for Manganese and their Use in Risk Assessment. J Toxicol Environ Health Part A. 73: 217-234.
Boethling, R., K. Fenner, P. Howard, G. Klečka, T. Madsen, J.R. Snape and M.J. Whelan. 2009. Environmental Persistence of Organic Pollutants: Guidance for Development and Review of POP Risk Profiles. Integr Environ Assess Manag 5(4):539-556.

Devon NEC Corporation Pike 1 Project Volume 2 – Environmental Impact Assessment June 2012
Page 16-81
Bureau of Chemical Safety (BCS), Health Canada. 2004. Fish Consumption: Review and Recommendation of Current Intake Figures for Canadian Consumers. Available at: http://www.hc-sc.gc.ca/fn-an/pubs/mercur/merc_fish_poisson-eng.php
California Environmental Protection Agency (Cal EPA). 1999. Air Toxics Hot Spots Program Risk Assessment Guidelines Part I: Determination of Acute Reference Exposure Levels for Airborne Toxicants. Air Toxicology and Epidemiology Section, Office of Environmental Health Hazard Assessment, California Environmental Protection Agency. March 1999.
Canadian Cancer Society (CCS). 2010. General Cancer Statistics for 2010. Available at: http://www.cancer.ca/canada-wide/about%20cancer/cancer%20statistics/stats%20at%20a%20glance/general%20cancer%20stats.aspx.
Canadian Council of Ministers of the Environment (CCME). 1996. A Protocol for the Derivation of Environmental and Human Health Soil Quality Guidelines. The National Contaminated Sites Remediation Program, Canadian Council of Ministers of the Environment. Winnipeg, MB. March 1996.
Canadian Council of Ministers of the Environment (CCME). 2006. A Protocol for the Derivation of Environmental and Human Health Soil Quality Guidelines. Winnipeg, MB: Canadian Council of Ministers of the Environment.
Canadian Council of Ministers of the Environment (CCME). 2008. Canada-Wide Standards for Petroleum Hydrocarbons (PHCs) in Soil: Scientific Rationale. Supporting Technical Documentation. Canadian Council of Ministers of the Environment. January 2008.
Canadian Population Health Initiative (CPHI) 2006. How Healthy are Rural Canadians? An Assessment of Their Health Status and Health Determinants. ISBN 13: 978-1-55392-881-2.
Energy Resources Conservation Board (ERCB). 1982. Sour Gas Processing in Alberta. A Review of Evidence Presented at Recent ERCB Hearings Respecting the Impacts and Surveillance of Sour Gas Plants. ERCB Report 82-D. April 1982.
Energy Resources Conservation Board (ERCB). 1994. Directive 051: Injection and Disposal Wells - Well Classifications, Completions, Logging, and Testing Requirements Calgary, Alberta.
England, G.C. and T. McGrath. 2004. Development of Fine Particulate Emission Factors and Speciation Profiles for Oil and Gas-fired Combustion Systems. Topical Report: Test Results for A Cogeneration Plant with Supplementary Firing, Oxidation Catalyst and SCR at Site Golf.
Hazardous Substances Data Bank (HSDB). 2010. Database On-line Search for Sulfur Dioxide. Available at http://toxnet.nlm.nih.gov/cgi-bin/sis/search/f?./temp/~ME7p1C:1.

Devon NEC Corporation Pike 1 Project Volume 2 – Environmental Impact Assessment June 2012
Page 16-82
Health and Welfare Canada. 1991. Report on Present Patterns and Trends in Infant Feeding in Canada. Ottawa: Health and Welfare Canada. 1991.
Health Canada. 1994. Human Health Risk Assessment for Priority Substances. Canadian Communication Group Publishing. Ottawa, ON.
Health Canada. 1995. Investigating Human Exposure to Contaminants in the Environment: A Handbook for Exposure Calculations. Volume 1-3. Published by the Minister of National Health and Welfare.
Health Canada. 2004. Federal Contaminated Site Risk Assessment in Canada. Part I: Guidance on Human Health Preliminary Quantitative Risk Assessment (PQRA). Environmental Health Assessment Services Safe Environments Program. Ottawa, Ontario. September 2004. ISBN 0 662-38244-7.
Health Canada. 2007. Human Health Risk Assessment of Mercury in Fish and Health Benefits of Fish Consumption. Bureau of Chemical Safety. Food Directorate. Health Products and Food Branch. March 2007.
Health Canada. 2009a. Federal Contaminated Site Risk Assessment in Canada. Part I: Guidance on Human Health Preliminary Quantitative Risk Assessment (PQRA) Version 2.0. Prepared by: Contaminated Sites Division, Safe Environments Program. May 2009.
Health Canada. 2009b. Federal Contaminated Site Risk Assessment in Canada. Part II: Health Canada Toxicological Reference Values (TRVs) and Chemical Specific Factors Version 2.0. Contaminated Sites Division. Safe Environments Programme. May 2009.
Health Canada. 2010. Guidelines for Canadian Drinking Water Quality – Technical Documents. Available at: http: //hc-sc.gc.ca/ewh-semt/pubs/water-eau/index-eng.php#tech_doc.
Health Canada. 2011. Dietary Intakes of Contaminants & Other Chemicals for Different Age-Sex Groups of Canadians. Average dietary intakes (µg/kg bw/day) of trace elements for Canadians in different age/sex groups for Total Diet Study in 2007. http://www.hc-sc.gc.ca/fn-an/surveill/total-diet/intake-apport/index-eng.php
Institute of Medicine (IOM). 2001. Dietary Reference Intakes for Vitamin A, Vitamin K, Arsenic, Boron, Chromium, Copper, Iodine, Iron, Manganese, Molybdenum, Nickel, Silicon, Vanadium, and Zinc. Institute of Medicine, Food and Nutrition Board. Washington DC. National Academy Press. P. 10-1 to 10-22.
Kindzierski, W.B., P. Chelme-Ayala and M.G. El-Din. 2010. Wood Buffalo Environmental Association Ambient Air Quality Data Summary and Trend Analysis. Department of Public Health Sciences, School of Public Health, University of Alberta. Available at: www.phs.ualberta.ca/reports.cfm
Klassen, C.D. 1996. Casarett and Doull’s Toxicology – the Basic Science of Poisons. 5th ed. McGraw Hill New York: 1996.

Devon NEC Corporation Pike 1 Project Volume 2 – Environmental Impact Assessment June 2012
Page 16-83
Linn, W.S., D.A. Shampoo, C.E. Spier, L.M. Valencia, U.T. Anzar, T.G. Venet and J.D. Hackney. 1983. Respiratory Effects of 0.75 ppm Sulphur Dioxide in Exercising Asthmatics: Influence of Upper Respiratory Defenses. Environmental Research 30: 340-348.
Mackay, D., W. Shiu and K. Ma. 1992. Illustrated Handbook of Physical-Chemical Properties and Environmental Fate for Organic Chemicals: Volume II. Lewis Publishers. Chelsea, Michigan.
Mackay, D., W. Shiu and K. Ma. 1993. Illustrated Handbook of Physical-Chemical Properties and Environmental Fate for Organic Chemicals: Volumes I-IV. Lewis Publishers. Chelsea, Michigan.
Market Facts of Canada. 1991. Research Report: National Seafood Consumption Study. Conducted for: Health and Welfare Canada. #C388/JdeB
National Institute of Occupational Safety and Health (NIOSH). 1974. Criteria for a Recommended Standard - Occupational Exposure to Sulphur Dioxide. United States Department of Health, Education and Welfare, Public Health Service, Center for Disease Control, National Institute of Occupational Safety and Health. DHHS (NIOSH) Publication No. 74-111.
O’Connor Associates Environmental Inc. and G Mark Richardson (O'Connor and Richardson). 1997. Compendium of Canadian Human Exposure Factors for Risk Assessment. 1155-2720 Queensview Dr., Ottawa, Ontario.
Office of Environmental Health Hazard Assessment (OEHHA). 2001. Guide to Health Risk Assessment. California Environmental Protection Agency, Office of Environmental Health Hazard Assessment.
Rehnberg, G.L,, J.F. Hein and S.D. Carter. 1980. Chronic Manganese Oxide Administration to Preweanling Rats: Manganese Accumulation and Distribution. J Toxicol Environ Health 6:217-226.
Royal Society of Canada Expert Panel (RSCEP). 2010. Environmental and Health Impacts of Canada’s Oil Sands Industry. Report. The Royal Society of Canada. The Academies of Arts, Humanities and Sciences of Canada. December 2010.
Santamaria, A.B. and S.I. Sulsky. 2010. Risk Assessment of an Essential Element: Manganese. J Toxicol Environ Health Part A 73: 128-155.
Sheppard, D., A. Saisho, J.A. Nadel and H.A. Boushey. 1981. Exercise Increases Sulphur Dioxide-Induced Bronchoconstriction in Asthmatic Subjects. Am. Rev. Respir. Dis. 123: 486–491.
Syracuse Research Corporation (SRC). 2011. Interactive PhysProp Database Demo. SRC Inc., 2011. Available at: http://www.syrres.com/what-we-do/databaseforms.aspx?id=386.

Devon NEC Corporation Pike 1 Project Volume 2 – Environmental Impact Assessment June 2012
Page 16-84
Tanaka, P.A., D.L. Yeung and G.H. Anderson. 1987. Infant Feeding Practices: 1984-1985 versus 1977-1978. Can. Med. Assoc. J. 136, 940-944.
United States Environmental Protection Agency (US EPA). 1989. Risk Assessment Guidance for Superfund Volume I Human Health Evaluation Manual (Part A) Interim Final. Office of Emergency and Remedial Response. US Environmental Protection Agency. Washington, DC 20450. December 1989. EPA/540/1/89002.
United States Environmental Protection Agency (US EPA). 1994. Review of the National Ambient Air Quality Standards for Sulfur Oxides: Assessment of Scientific and Technical Information. Supplement to the 1986 OAQPS Staff Paper Addendum. Research Triangle Park, NC: Air Quality Management Division, Office of Air Quality Planning and Standards, United States Environmental Protection Agency. EPA/452/R-94/013. September 1994.
United States Environmental Protection Agency (US EPA). 1996. IRIS Summary of Manganese (CASRN 7439-96-5). Reference Dose for Chronic Oral Exposure (RfD). Available at: http://www.epa.gov/ncea/iris/subst/0373.htm#reforal.
United States Environmental Protection Agency (US EPA). 2002. A Review of the Reference Dose and Reference Concentration Process: Risk Assessment Forum. Washington, DC: Risk Assessment Forum, United States Environmental Protection Agency. EPA/630/P-02/002F. December 2002.
United States Environmental Protection Agency (US EPA). 2003. Attachment 1-3 Guidance for Developing Ecological Soil Screening Levels (Eco-SSLs) Evaluation of Dermal Contact and Inhalation Exposure Pathways for the Purpose of Setting Eco-SSLs. OSWER Directive 92857-55. November 2003.
United States Environmental Protection Agency (US EPA). 2005. Guidelines for Carcinogen Risk Assessment. Washington, DC: Risk Assessment Forum, United States Environmental Protection Agency. EPA/630/P-03/001F. March 2005.
United States Environmental Protection Agency (US EPA). 2007. Concepts, Methods and Data Sources for Cumulative Health Risk Assessment of Multiple Chemicals, Exposures and Effects: A Resource Document National. National Center for Environmental Assessment Office of Research and Development U.S. Environmental Protection Agency. EPA/600/R-06/013F August 2007
United States Environmental Protection Agency (US EPA). 2010. Integrated Risk Information System (IRIS) Database On-line Search. Cincinnati, OH: United States Environmental Protection Agency. Available at: http://cfpub.epa.gov/ncea/iris/index.cfm?fuseaction=iris.showSubstanceList&list_type=alpha&view.
United States Environmental Protection Agency (US EPA). 2011. Estimation Programs Interface Suite™ for Microsoft® Windows, v 4.10. United States Environmental Protection Agency, Washington, DC, USA.

Devon NEC Corporation Pike 1 Project Volume 2 – Environmental Impact Assessment June 2012
Page 16-85
United States Environmental Protection Agency Office of Solid Waste (US EPA OSW). 2005. Human Health Risk Assessment Protocol for Hazardous Waste Combustion Facilities, Final. Database: Chemical-Specific Parameter Values. United States Environmental Protection Agency Region VI. Multimedia Planning and Permitting Division. Center for Combustion Science and Engineering. Office of Solid Waste and Emergency Response. EPA 530-R-05-006. September 2005.
United States National Research Council (US NRC). 1983. Risk Assessment in the Federal Government: Managing the Process. National Academy Press, Washington, D.C.
United States National Research Council (US NRC). 1994. Science and Judgment in Risk Assessment. Committee on risk Assessment of Hazardous Air Pollutants. Board on Environmental Studies and Toxicology, Commission on Life Sciences, National Research Council, National Academy Press, Washington, DC 1994. ISBN 0-309-04894-X.
Wein, E.E. 1989. Nutrient Intakes and Use of Country Foods by Native Canadians Near Wood Buffalo National Park. Thesis presented to the Faculty of Graduate Studies, University of Guelph. February 1989.
Wein, E.E., J.H. Sabry and F.T. Evers. 1991. Food Consumption Patterns and Use of Country Foods by Native Canadians near Wood Buffalo National Park, Canada. Arctic 44(3):196-205.
Wien, S., G.C. England and O.M.C. Chang. 2003a. Development of Fine Particulate Emission Factors and Speciation Profiles for Oil and Gas-fired Combustion Systems. Topical Report: Test Results for a Gas-Fired Process Heater (Site Alpha). Prepared for the National Petroleum Technology Office, the Gas Research Institute, the California Energy Commission, the New York State Energy Research and Development Authority, and the American Petroleum Institute. Prepared by GE Energy and Environmental Research Corporation.
Wien, S., G.C. England and O.M.C. Chang. 2003b. Development of Fine Particulate Emission Factors and Speciation Profiles for Oil and Gas-fired Combustion Systems. Topical Report: Test Results for a Gas-Fired Process Heater with Selective Catalytic Reduction (Site Charlie). Prepared for the National Petroleum Technology Office, the Gas Research Institute, the California Energy Commission, the New York State Energy Research and Development Authority, and the American Petroleum Institute. Prepared by GE Energy and Environmental Research Corporation.
Wien, S., G.C. England and O.M.C. Chang. 2004b. Development of Fine Particulate Emission Factors and Speciation Profiles for Oil and Gas-fired Combustion Systems. Topical Report: Test Results for a Combined Cycle Power Plant with Supplementary Firing, Oxidation Catalyst and SCR at Site Bravo. Prepared for the National Petroleum Technology Office, the Gas Research Institute, the California Energy Commission, the New York State Energy Research and Development Authority, and the American Petroleum Institute. Prepared by GE Energy and Environmental Research Corporation.

Devon NEC Corporation Pike 1 Project Volume 2 – Environmental Impact Assessment June 2012
Page 16-86
Wien, S., T.P. McGrath, G.C. England and O.M.C. Chang. 2004a. Development of Fine Particulate Emission Factors and Speciation Profiles for Oil and Gas-fired Combustion Systems. Topical Report: Test Results for a Dual Fuel-Fired Commercial Boiler (Site Delta). Prepared for the National Petroleum Technology Office, the Gas Research Institute, the California Energy Commission, the New York State Energy Research and Development Authority, and the American Petroleum Institute. Prepared by GE Energy and Environmental Research Corporation.
Wilson, R.M. 2005. Guidance on Air Quality Risk Assessment, Version 1. Prepared for Health Canada. HECS-SEP-BC/Yukon-04/05-06. August 8, 2005.
Wood Buffalo Environmental Association (WBEA). 2007. Wood Buffalo Environmental Association Human Exposure Monitoring Program Part I – Methods Report, Part II – 2005 Monitoring Year Results. February 2007.
Wood Buffalo Environmental Association (WBEA). 2010. Wood Buffalo Environmental Association Annual Report 2010. Available at: http://www.wbea.org/library/annual-reports.
World Health Organization (WHO). 1979. Environmental Health Criteria 8. Sulfur Oxides and Suspended Particulate Matter. Geneva, Switzerland: International Programme on Chemical Safety, United Nations Environment Programme and World Health Organization. ISBN 92 4 154068 0.
World Health Organization (WHO). 2000. Air Quality Guidelines for Europe, Second Edition. World Health Organization, Regional Office for Europe, Copenhagen.
World Health Organization (WHO). 2004. Manganese in Drinking-water. Background document for development of WHO Guidelines for Drinking-water Quality.
World Health Organization (WHO). 2006. Air Quality Guidelines: Global Update. 2005. Particulate matter, ozone, nitrogen dioxide and sulphur dioxide. ISBN 92 890 2192 6.
World Health Organization and the Food and Agriculture Organization of the United Nations. (WHO/FAO) 2007. Evaluation of Certain Food Additives and Contaminants. Sixty-seventh report of the Joint FAO WHO Expert Committee on Food Additives. WHO Technical Report Series 940. Geneva. Available at: http://whqlibdoc.who.int/ trs/WHO_TRS_940_eng.pdf.