section 2: risk management for institutional investors financial risk management uc berkeley prof....
TRANSCRIPT
Section 2: Risk Management for Institutional Investors
Financial Risk Management
UC Berkeley
Prof. Jeff (YuQing) Shen

Financial Risk Management
Prof. Jeff (YuQing) Shen, UC Berkeley2
The BIG Picture
• Theory
•Efficient Frontier
•Asset/Liability Framework
•Alpha/Beta risk budgeting
• Practice
•Pension Crisis
•GM Pension Plan
•Yale Endowment
• Theory
•VaR
•Stochastic behavior of asset
returns
•Worst case scenario
• Practice
•Investment bank VaR
•Bear Stearns
• The Theory
•Active Portfolio Management
•Quantitative equity models
•Hedge fund investment
• The Practice
•Hedge fund industry
•Aug 2007 crisis for quant
Investment BankInstitutional Investor Hedge Fund

Institutional investors in the US
3

Asset allocation trend
4

Significant turnover of managers
5
Financial Risk Management
Prof. Jeff (YuQing) Shen, UC Berkeley6
Institutional investor risk management
US corporate defined benefit plans
Endowment and foundation

Financial Risk Management
Prof. Jeff (YuQing) Shen, UC Berkeley7
The liability is the present value of benefit cash flows
Present value (discounted at 7.0%)
= $2.56 billion liability
Year Benefit payments2003 150,000,000$
2004 151,500,000$
2005 153,166,500$
2006 155,019,815$
2007 157,083,128$
2008 159,382,982$
2009 161,949,861$
2010 164,818,902$
2011 168,030,756$
2012 171,632,645$
2013 175,679,653$
2014 180,236,330$
2015 185,378,683$
2016 191,196,660$
2017 197,797,288$
2018 205,308,636$
2019 213,105,228$
2020 221,197,896$
… ……….
… ……….
… ……….
Annual benefit payment cash flows ($mm)
$-
$50
$100
$150
$200
$250
$300
20032006
20092012
20152018
20212024
20272030
20332036
2039
($ m
illio
ns
)
Year

Financial Risk Management
Prof. Jeff (YuQing) Shen, UC Berkeley
Duration estimation in a pension plan

Financial Risk Management
Prof. Jeff (YuQing) Shen, UC Berkeley9
The liability risk is sensitive to discount rate changes
$-
$1,000
$2,000
$3,000
$4,000
$5,000
$6,000
$7,000
$8,000
$9,000
2 3 4 5 6 7 8 9 10 11 12
Discount Rate
Pre
sen
t V
alu
e o
f L
iab
iliti
es (
$ m
illio
ns)
$3.5 billion @ 7%
•Duration measures the sensitivity of a liability’s value to changes in interest rates.
Bottom Line: Rates = Liabilities and Rates = Liabilities
•A duration of 14 means that the liability value will increase (decrease) by 14% given a 1% decrease (increase) in rates. Longer duration = greater sensitivityof liability value to rate changes.

Financial Risk Management
Prof. Jeff (YuQing) Shen, UC Berkeley10
ABO and PBO
ABO (Accumulated Benefit Obligation) is the value of all benefits earned to date. It includes nonvested as well as vested benefits. It may approximate the value of benefits payable on a plan termination and is the basis of a potential balance sheet liability.
PBO (Projected Benefit Obligation) is a measure of the liability for accumulated service, but reflects future salary increases. “Projected” refers to the projection of salaries.
The key difference is that PBO reflects future salary growth, which can be driven by at least two important factors:– Inflation– Productivity growth

Financial Risk Management
Prof. Jeff (YuQing) Shen, UC Berkeley11
Funded ratio is a key risk measure for managing pension plan
Funded RatioA ssets
L iab ility_

Financial Risk Management
Prof. Jeff (YuQing) Shen, UC Berkeley12
Case study: Pension Crisis of 2002
Financial Risk Management
Prof. Jeff (YuQing) Shen, UC Berkeley
Pension Crisis of 2002
1. Institutional context
2. Funded status
3. Assets
4. Liability
5. Contribution

Financial Risk Management
Prof. Jeff (YuQing) Shen, UC Berkeley
Significant assets in corporate DB plans

Financial Risk Management
Prof. Jeff (YuQing) Shen, UC Berkeley
Industry distribution of DB plans

Financial Risk Management
Prof. Jeff (YuQing) Shen, UC Berkeley
Pension Crisis of 2002
1. Institutional context
2. Funded status
3. Assets
4. Liability
5. Contribution

Financial Risk Management
Prof. Jeff (YuQing) Shen, UC Berkeley17
Funded ratios were at an all-time low in 2002
PBO funded ratio — Top 200 corporate plansFive-year intervals since 1987
Top 20% Median Bottom 20%
1987 150% 119% 82%
1992 142% 107% 79%
1997 147% 112% 90%
Source: S&P Compustat
2002 2002 113%113% 80%80% 60%60%

Financial Risk Management
Prof. Jeff (YuQing) Shen, UC Berkeley18
A volatile history with a dramatic drop
80% Funded
145% Funded
Assumes beginning Funded ratio of 100% in 1975, 10 duration, 6% benefit payouts, 3.5% Service cost. Asset returns reflect a hypothetical portfolio of 60% S&P 500/40% Lehman Aggregate Bonds. Discount rate is the AA Corp. Bond Yield. Assumes zero contributions.
60%
80%
100%
120%
140%
160%
19751977
19791981
19831985
19871989
19911993
19951997
19992001
2003
Fu
nd
ed
ra
tio
Funded ratio of a hypothetical DB plan

Financial Risk Management
Prof. Jeff (YuQing) Shen, UC Berkeley
Funded ratio status
19

Financial Risk Management
Prof. Jeff (YuQing) Shen, UC Berkeley
Underfunding crisis
20
Financial Risk Management
Prof. Jeff (YuQing) Shen, UC Berkeley
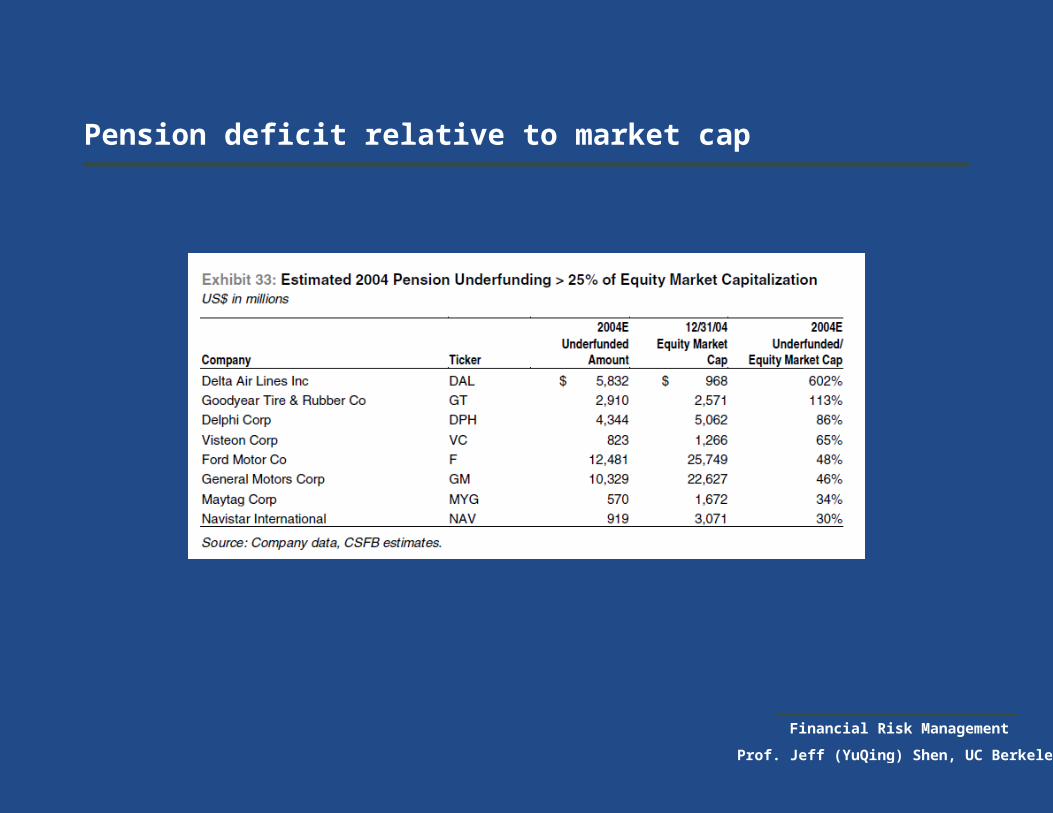
Pension deficit relative to market cap

Financial Risk Management
Prof. Jeff (YuQing) Shen, UC Berkeley
Pension Crisis of 2002
1. Institutional context
2. Funded status
3. Assets
4. Liability
5. Contribution

Financial Risk Management
Prof. Jeff (YuQing) Shen, UC Berkeley
Asset allocation

Financial Risk Management
Prof. Jeff (YuQing) Shen, UC Berkeley
Equity and fixed income allocations

Financial Risk Management
Prof. Jeff (YuQing) Shen, UC Berkeley
Asset allocation over time

Financial Risk Management
Prof. Jeff (YuQing) Shen, UC Berkeley
Different views of the world
26

Financial Risk Management
Prof. Jeff (YuQing) Shen, UC Berkeley
What are the pros and cons of owning the company stock in the pension plan?

Financial Risk Management
Prof. Jeff (YuQing) Shen, UC Berkeley
Pension Crisis of 2002
1. Institutional context
2. Funded status
3. Assets
4. Liability
5. Contribution

Financial Risk Management
Prof. Jeff (YuQing) Shen, UC Berkeley
Discount rate
29

Financial Risk Management
Prof. Jeff (YuQing) Shen, UC Berkeley
Discount rate
30

Financial Risk Management
Prof. Jeff (YuQing) Shen, UC Berkeley
Discount rate distribution
31
Financial Risk Management
Prof. Jeff (YuQing) Shen, UC Berkeley
Pension Crisis of 2002
1. Institutional context
2. Funded status
3. Assets
4. Liability
5. Contribution

Financial Risk Management
Prof. Jeff (YuQing) Shen, UC Berkeley
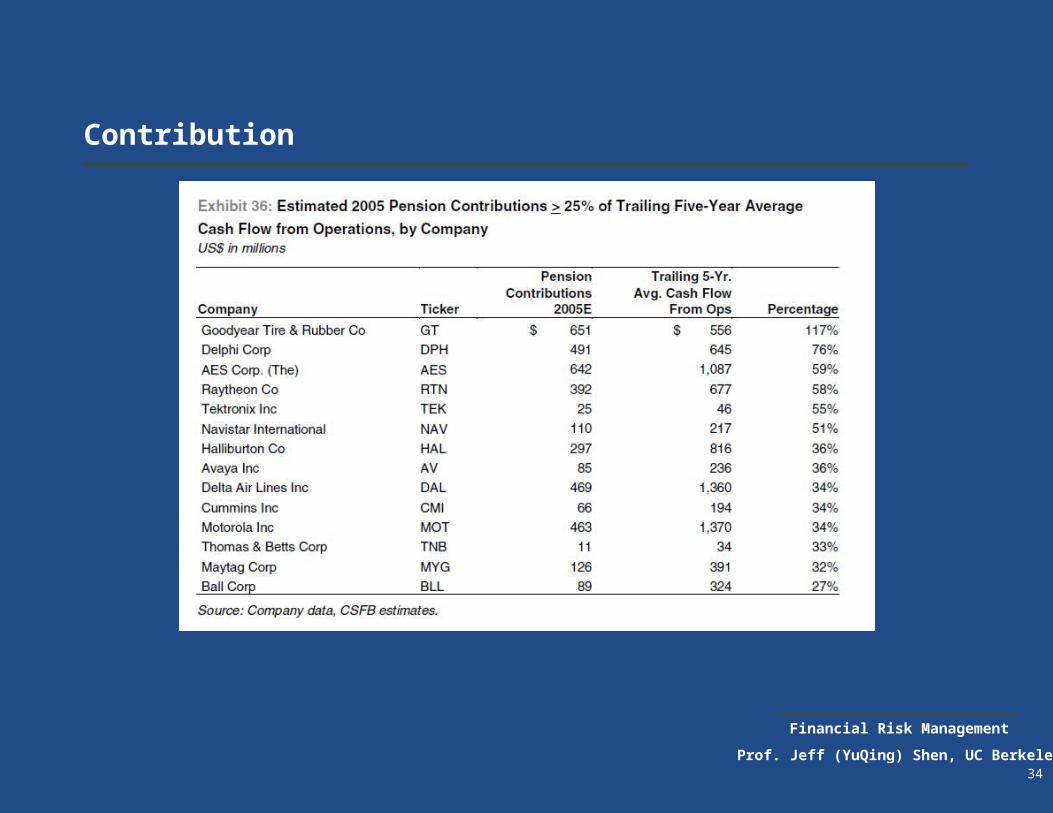
Contribution
33
Financial Risk Management
Prof. Jeff (YuQing) Shen, UC Berkeley
Contribution
34

Financial Risk Management
Prof. Jeff (YuQing) Shen, UC Berkeley
Pension income/expenses
35

Financial Risk Management
Prof. Jeff (YuQing) Shen, UC Berkeley36
What happened?
1. Interest rate
2. Asset return
3. Corporate finance implication

Financial Risk Management
Prof. Jeff (YuQing) Shen, UC Berkeley37
Liabilities “outperformed” assets
-15%
-10%
-5%
0%
5%
10%
15%
20%
25%
30%
1996 1997 1998 1999 2000 2001 2002 2003
Ann
ual a
sset
or
liabi
lity
grow
th
Asset growth (60/40)
Liability growthFor illustrative purposes only. Assumes 10-duration liability, 3.5% Service cost. Asset returns reflect a hypothetical portfolio of 60% S&P 500/40% Lehman Aggregate Bonds. Discount rate derived by the Lehman AA Long Corp. Bond and Moody’s AA Long Corp. Bond Yields. Assumes zero contributions. Benefit payouts are not reflected in individual years’ annual growth. Assumes rates dropped 135bp, from 7.85% at end of 1999 to 6.50% as of end of Aug 2003, as follows: 2000: -50bp; 2001: -60bp; 2002: -25bp; 2003: 0bp. Without rate drops over the last 4 years, liabilities would have outperformed assets by 46.5%.
Annual asset returns and liability growth
(hypothetical plan, before benefit payouts)
Assets outperform Liabilities outperform
12%17%16%
-9%-4%
-1%

Financial Risk Management
Prof. Jeff (YuQing) Shen, UC Berkeley38
Declining discount rate => increase in liability
5.0%
6.0%
7.0%
8.0%
9.0%
10.0%
11.0%
1987 1988 1989 1990 1991 1992 1993 1994 1995 1996 1997 1998 1999 2000 2001
End of Year
Dis
co
un
t R
ate
Discount Rate
Long AA Corp Bond Yield

Financial Risk Management
Prof. Jeff (YuQing) Shen, UC Berkeley
Corporate finance risk implications
39

Financial Risk Management
Prof. Jeff (YuQing) Shen, UC Berkeley40
Lower reported income (GAAP)Lower reported income (GAAP)
Decrease in book value
Decrease in book value
Rating agency pressure
Rating agency pressure
– Cash contribution required after extended funding holiday
– Large negative effect on earnings resulting from pension expense
– Writedown of book equity due to critical under-funding
– Shareholder aversion to earnings volatility created by pension income
Quality of earningsQuality of earnings
Liquidity requirements
Liquidity requirements
– Overhang of increasing net pension liability
Large bottom-line impacts
6

Financial Risk Management
Prof. Jeff (YuQing) Shen, UC Berkeley
Shareholder exposure

Financial Risk Management
Prof. Jeff (YuQing) Shen, UC Berkeley42
Accounting and corporate finance implications of pensions are asymmetric - the risks are weighted to the downside
There is greater downside to the corporation when the plan does poorly than upside when the plan does well
There is greater downside to the corporation when the plan does poorly than upside when the plan does well
Downside associated with poor performance
Downside associated with poor performance
Upside associated with strong performance
Upside associated with strong performance
Diversion of cash from core operations to cure deficits and meet statutory contribution minimums
Equity write-downs from ABO underfunding can threaten debt covenants
Attracts rating agency attention and may contribute to downgrade
Poor plan performance is often correlated with weak operating environment for core business
Severely underfunded plans must give notice to employees describing pension condition
May add to non-cash earnings– However, excise taxes prevent company
from realizing a cash benefit
May reduce or avoid the need to make ongoing contributions– Risk levels required to generate high returns
can lead directly to the harsh consequences of pension deficits
7

Financial Risk Management
Prof. Jeff (YuQing) Shen, UC Berkeley43
Financial economics and corporate pensions risk management
The shareholder’s perspective
If shareholders want equity leverage they can obtain it directly themselves
Companies should prefer to borrow in the capital markets or buy-back stock if they want to increase leverage – not mis-match pension liabilities
Pension investment decisions should be justified relative to other uses of corporate capital
Financial Risk Management
Prof. Jeff (YuQing) Shen, UC Berkeley
What are the lessons learned?
Did we manage pension risk well?

Financial Risk Management
Prof. Jeff (YuQing) Shen, UC Berkeley
Did we really learn the lessons?

Financial Risk Management
Prof. Jeff (YuQing) Shen, UC Berkeley
2008 Pension crisis

Financial Risk Management
Prof. Jeff (YuQing) Shen, UC Berkeley
What happened in 2008 for the pension plans?
What happened to
Equity return?
Interest rate?
Contribution?
47

Financial Risk Management
Prof. Jeff (YuQing) Shen, UC Berkeley
Funded ratio
48

Financial Risk Management
Prof. Jeff (YuQing) Shen, UC Berkeley
Asset liability performance
49
Financial Risk Management
Prof. Jeff (YuQing) Shen, UC Berkeley
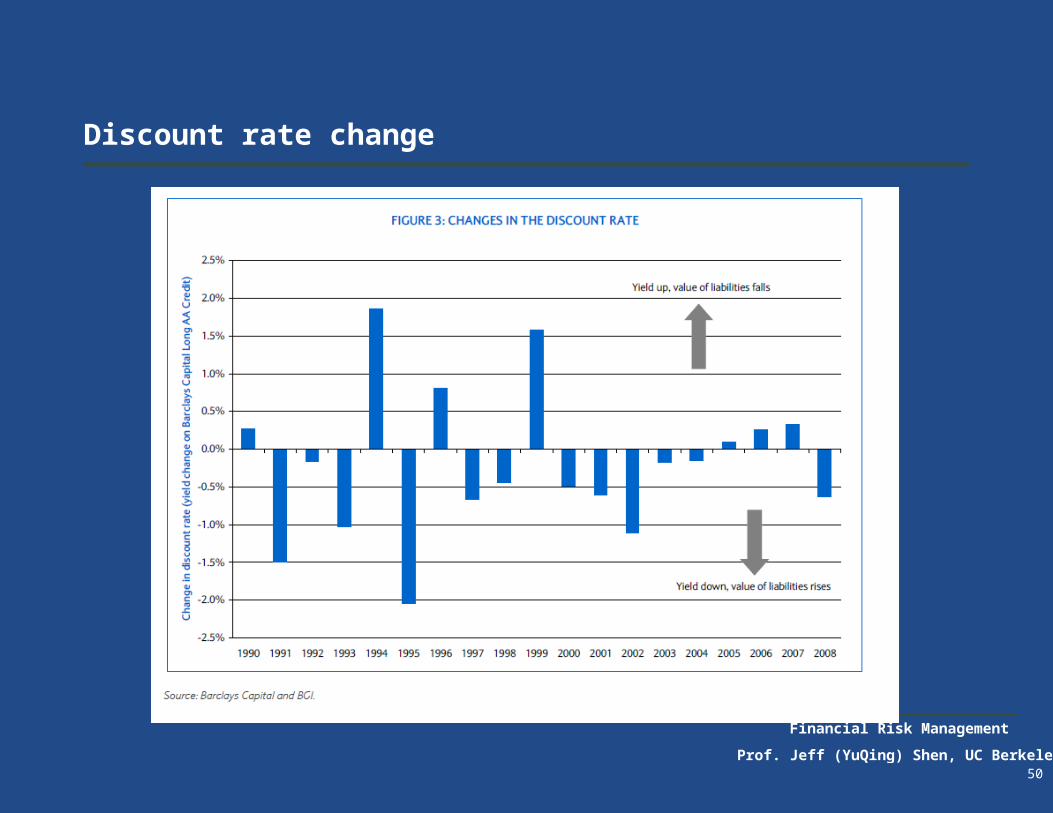
Discount rate change
50

Financial Risk Management
Prof. Jeff (YuQing) Shen, UC Berkeley
Risk free rate and credit spread
51

Financial Risk Management
Prof. Jeff (YuQing) Shen, UC Berkeley
Inflation
52

Financial Risk Management
Prof. Jeff (YuQing) Shen, UC Berkeley
Credit spread
53

Financial Risk Management
Prof. Jeff (YuQing) Shen, UC Berkeley
What are the lessons learned?
Did we manage pension risk well?

Financial Risk Management
Prof. Jeff (YuQing) Shen, UC Berkeley55
The BIG Picture
• Theory
•Efficient Frontier
•Asset/Liability Framework
•Alpha/Beta risk budgeting
• Practice
•Pension Crisis
•GM Pension Plan
•Yale Endowment
• Theory
•VaR
•Stochastic behavior of asset
returns
•Worst case scenario
• Practice
•Investment bank VaR
•Bear Stearns
• The Theory
•Active Portfolio Management
•Quantitative equity models
•Hedge fund investment
• The Practice
•Hedge fund industry
•Aug 2007 crisis for quant
Investment BankInstitutional Investor Hedge Fund

Financial Risk Management
Prof. Jeff (YuQing) Shen, UC Berkeley
Efficient frontier theory

Financial Risk Management
Prof. Jeff (YuQing) Shen, UC Berkeley57
Short-term (one period) analysis
Two assets:Risk free asset Rf,t+1 and risky asset Rt+1
The risky asset has expected return of EtRt+1 and expected variance t2.
The portfolio return is:
The portfolio expected return is
The portfolio expected risk is
1,11, )1( tfttttp RwRwR
1,11,1, tfttttftpt RREwRRE
222, tttp w

Financial Risk Management
Prof. Jeff (YuQing) Shen, UC Berkeley58
Mean-variance optimization: quadratic utility function
This can be rewritten as:
The solution is
MAXwt E tRp,t1 k
2 p,t
2
MAXwt R f ,t1 wt E tRt1 R f ,t1 k2
wt2 t
2
2
1,1
t
tfttt k
RREw

Financial Risk Management
Prof. Jeff (YuQing) Shen, UC Berkeley59
What does this mean?
2
1,1
t
tfttt k
RREw
Risk Aversion Parameter
The higher the risk aversion, the less
investment in the risky asset class
Risk of portfolio
The higher the risk or variance of return,
the less investment in the risky asset class
Return Premium of Risky Asset Class
The higher the return premium,
the more investment in the risky asset class
Allocation to
Risky Asset

Financial Risk Management
Prof. Jeff (YuQing) Shen, UC Berkeley60
Return and risk assumptions are crucial for efficient frontier construction
Optimal Portfolio
Expected Returns
Volatility Mean VarianceOptimisation
Correlation
5.0%
5.5%
6.0%
6.5%
7.0%
7.5%
8.0%
8.5%
9.0%
9.5%
10.0%
5.0% 7.0% 9.0% 11.0% 13.0% 15.0% 17.0%
Standard Deviation
Ex
pe
cte
d R
etu
rn

Financial Risk Management
Prof. Jeff (YuQing) Shen, UC Berkeley61
Market cap can help to set constraints
Source: Bloomberg.*
ASSET CLASS Constraints
Cash
US Core Fixed
High Yield Max 5%, <=10% US Fixed
US Large Cap
US Small Cap <=20% US Large Cap
Int'l Devpd Equity <=40% US Equity
Em.Mkts.Equity <=20% Int'l Devpd Equity
Private Equity PE Max 5%
REITS Alternatives (PE+REIT+RE+HF)
Direct Real Estate <={10%, 15%, 20%}
Hedge Funds Each Alternative Max 10%
These constraints were applied for illustrative purposes and do not represent the client’s specific risk or asset exposure tolerances. We recommend that a full asset-liability and investment policy analysis be conducted to determine an appropriate allocation for a given plan.
The constraints imposed can be informed by a consideration of global market capitalizations as well as risk tolerance, market views, liquidity needs, and other factors
SAMPLE CONSTRAINTS
Fixed Income: 48% Equity: 52%
Relative weights
US High Yield/US Inv.Grade 5%
US Small Cap/US Large Cap 7%
Em.Mkts./Int'l Devpd.Equity 11%
Int'l Equity/US Equity 60%
Global Market Weights
0%
10%
20%
30%
40%
50%
60%
70%
80%
90%
100%
Mar-99
Jun-99S
ep-99D
ec-99M
ar-00Jun-00S
ep-00D
ec-00M
ar-01Jun-01S
ep-01D
ec-01M
ar-02Jun-02S
ep-02D
ec-02M
ar-03
Int'l Devpd Fixed Income $6,200B (21%)
US High Yield FI $355B (1%)
US Investment Grade FI $7,600B (26%)
Emerging Markets Equity $532B (2%)
Int'l Developed Equity $5,275B (18%)
US Small Cap $625B (2%)
US Large Cap $8,700B (30%)

Financial Risk Management
Prof. Jeff (YuQing) Shen, UC Berkeley
Long term return forecasting

Financial Risk Management
Prof. Jeff (YuQing) Shen, UC Berkeley63
Financial Risk Management
Prof. Jeff (YuQing) Shen, UC Berkeley
How would you calculate the expected return of a condo in the bay area?
What’s the rent income return?
What’s the rent income growth potential?
What’s the potential for valuation upside/downside?
64

Financial Risk Management
Prof. Jeff (YuQing) Shen, UC Berkeley
Long term risk forecasting

Financial Risk Management
Prof. Jeff (YuQing) Shen, UC Berkeley66
US large cap equity volatility
Note: US large cap here is defined as S&P 500 index
Monthly standard deviation of US large cap 4.14%, which can be annualised to be 14.3%.
(20.00)
(15.00)
(10.00)
(5.00)
-
5.00
10.00
15.00
S&P 500 Monthly return
Postive 1 STD
Negative 1 STD
Financial Risk Management
Prof. Jeff (YuQing) Shen, UC Berkeley67
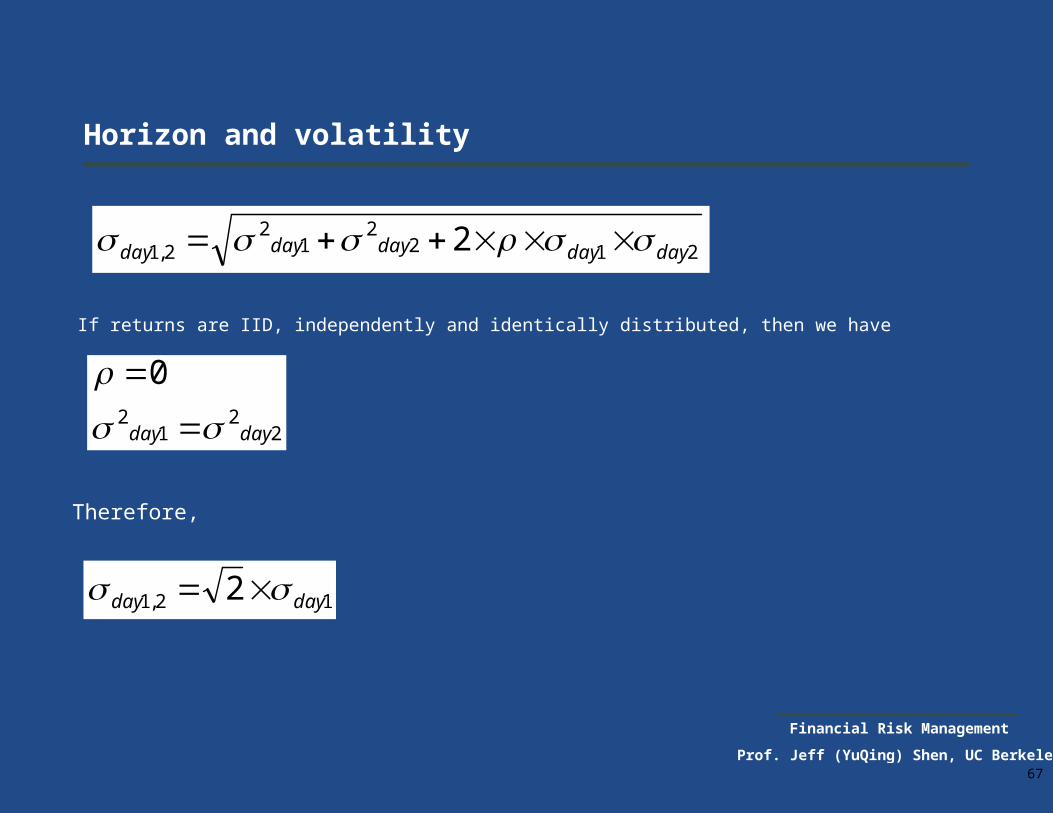
Horizon and volatility
If returns are IID, independently and identically distributed, then we have
2122
12
2,1 2 daydaydaydayday
22
12
0
dayday
Therefore,
12,1 2 dayday

Financial Risk Management
Prof. Jeff (YuQing) Shen, UC Berkeley68
Squared root of time
Volatility calculation
Monthly Quarterly Semiannualy Annualy1.0% 1.7% 2.4% 3.5%2.0% 3.5% 4.9% 6.9%3.0% 5.2% 7.3% 10.4%4.0% 6.9% 9.8% 13.9%5.0% 8.7% 12.2% 17.3%6.0% 10.4% 14.7% 20.8%7.0% 12.1% 17.1% 24.2%8.0% 13.9% 19.6% 27.7%9.0% 15.6% 22.0% 31.2%
10.0% 17.3% 24.5% 34.6%

Financial Risk Management
Prof. Jeff (YuQing) Shen, UC Berkeley69
Portfolio volatility calculation
22112
222
11 2 wwwwportfolio
33113,1
33223,2
22112,1
233
222
211
2
2
2
ww
ww
ww
www
portfolio
Two Assets
Three Assets

Financial Risk Management
Prof. Jeff (YuQing) Shen, UC Berkeley70
Portfolio volatility calculation
)''()( wwportfolio
n Assets
nnnn
n
n
n
nwwww
where
,2,1,
,22,21,2
,12,11,1
21
21
...
............
...
...
,...,
,...,

Financial Risk Management
Prof. Jeff (YuQing) Shen, UC Berkeley71
The BIG Picture
• Theory
•Efficient Frontier
•Asset/Liability Framework
•Alpha/Beta risk budgeting
• Practice
•Pension Crisis
•GM Pension Plan
•Yale Endowment
• Theory
•VaR
•Stochastic behavior of asset
returns
•Worst case scenario
• Practice
•Investment bank VaR
•Bear Stearns
• The Theory
•Active Portfolio Management
•Quantitative equity models
•Hedge fund investment
• The Practice
•Hedge fund industry
•Aug 2007 crisis for quant
Investment BankInstitutional Investor Hedge Fund

Financial Risk Management
Prof. Jeff (YuQing) Shen, UC Berkeley72
Asset only framework
US Equities SC
Emerging markets
Long Bonds
Cash
US Equities LC
Japanese EquitiesEuropean Equities
Increasing volatility
Incr
easi
ng r
etur
n
Aggressive Plans
Conservative Plans

Financial Risk Management
Prof. Jeff (YuQing) Shen, UC Berkeley73
ABO and PBO
ABO (Accumulated Benefit Obligation) is the value of all benefits earned to date. It includes nonvested as well as vested benefits. It may approximate the value of benefits payable on a plan termination and is the basis of a potential balance sheet liability.
PBO (Projected Benefit Obligation) is a measure of the liability for accumulated service, but reflects future salary increases. “Projected” refers to the projection of salaries.
The key difference is that PBO reflects future salary growth, which can be driven by at least two important factors:– Inflation– Productivity growth

Financial Risk Management
Prof. Jeff (YuQing) Shen, UC Berkeley74
Asset Liability Framework
US Equities SC
Emerging markets
Long Bonds
US Equities LC
Japanese EquitiesEuropean Equities
Increasing variability of fund surplus
Incr
easi
ng r
etur
n
Aggressive Plans
Conservative Plans
Note: This surplus optimization was performed including liabilities as a “negative asset,” highly negatively correlated with interest rates.
Financial Risk Management
Prof. Jeff (YuQing) Shen, UC Berkeley75
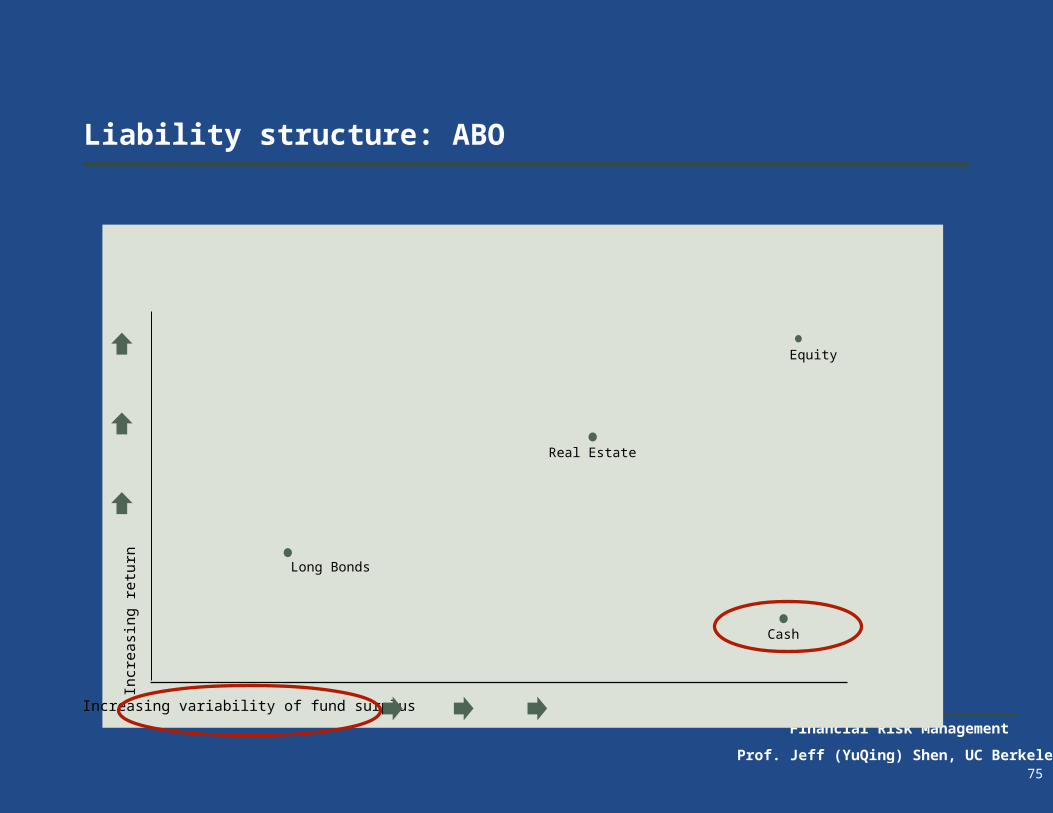
Liability structure: ABO
Equity
Long Bonds
Real Estate
Increasing variability of fund surplus
Incr
easi
ng r
etur
n
Cash
Financial Risk Management
Prof. Jeff (YuQing) Shen, UC Berkeley76
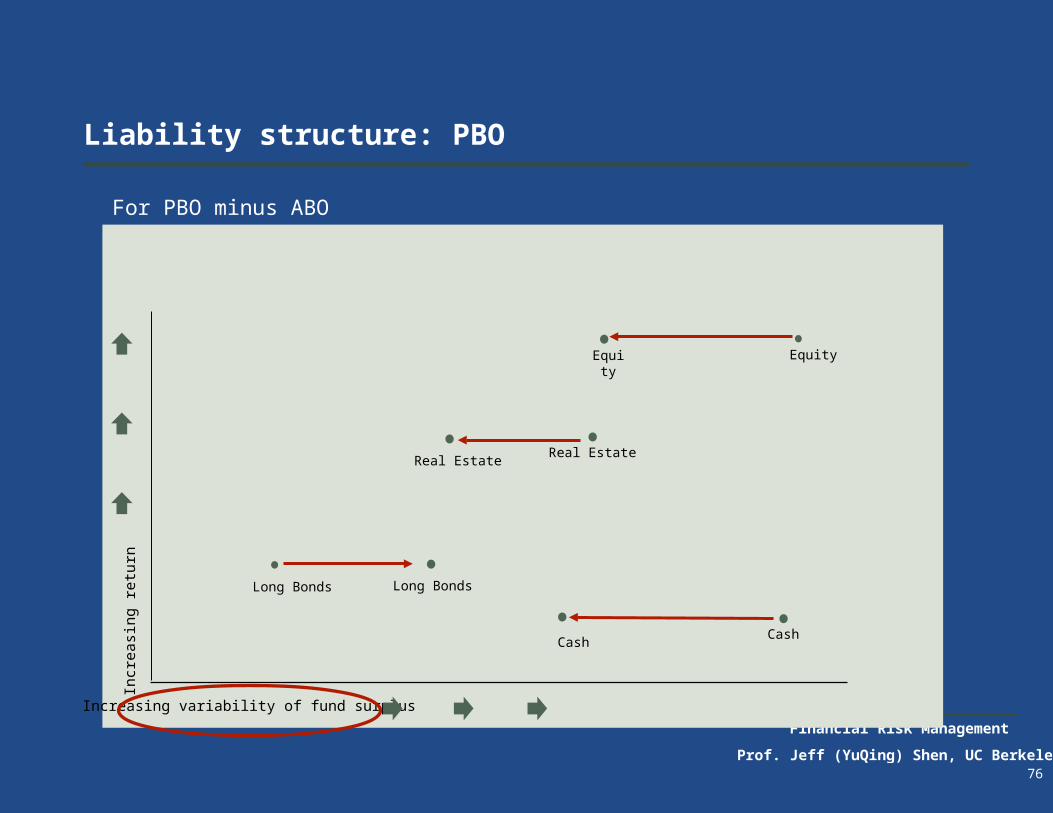
Liability structure: PBO
For PBO minus ABO
Equity
Long Bonds
Real Estate
Increasing variability of fund surplus
Incr
easi
ng r
etur
n
CashCash
Long Bonds
Real Estate
Equity
Financial Risk Management
Prof. Jeff (YuQing) Shen, UC Berkeley77
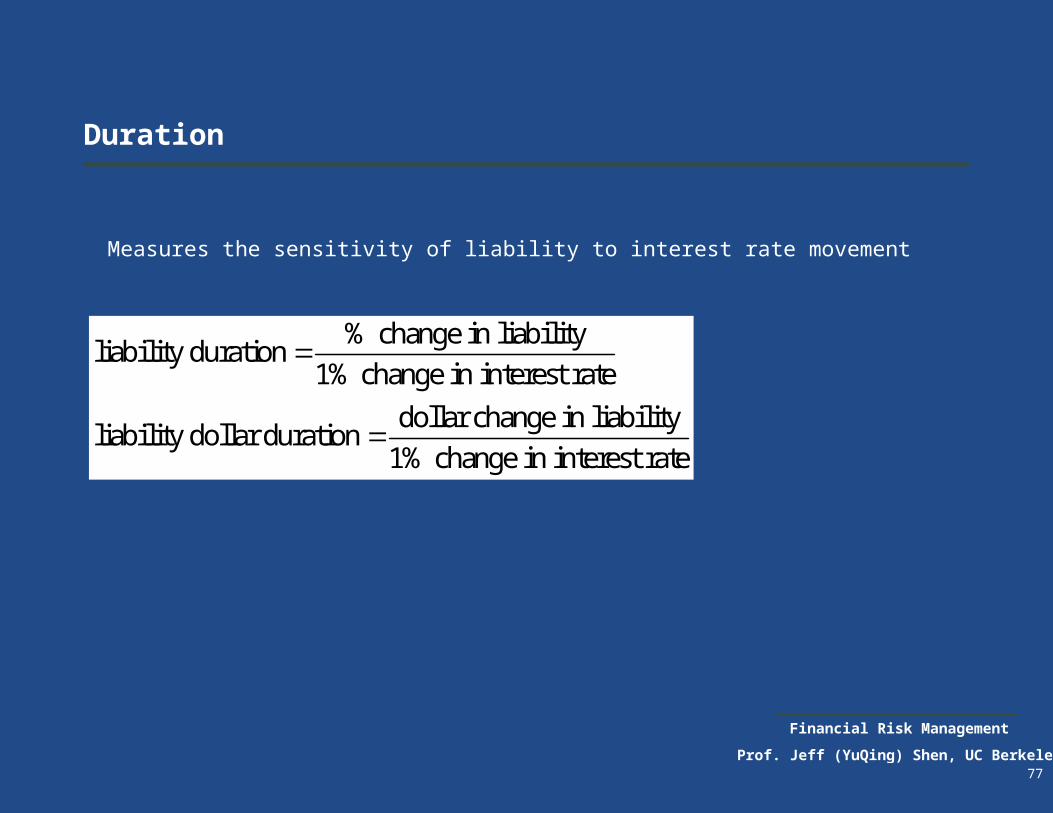
Duration
Measures the sensitivity of liability to interest rate movement
% change in liabilityliability duration
1% change in interest rate
dollar change in liabilityliability dollar duration
1% change in interest rate

Financial Risk Management
Prof. Jeff (YuQing) Shen, UC Berkeley78
Immunization
Immunization = Asset/liability duration matching
= Asset Liability Net Duration Close to Zero

Financial Risk Management
Prof. Jeff (YuQing) Shen, UC Berkeley
Liability driven investment
79

Financial Risk Management
Prof. Jeff (YuQing) Shen, UC Berkeley80
The BIG Picture
• Theory
•Efficient Frontier
•Asset/Liability Framework
•Alpha/Beta risk budgeting
• Practice
•Pension Crisis
•GM Pension Plan
•Yale Endowment
• Theory
•VaR
•Stochastic behavior of asset
returns
•Worst case scenario
• Practice
•Investment bank VaR
•Bear Stearns
• The Theory
•Active Portfolio Management
•Quantitative equity models
•Hedge fund investment
• The Practice
•Hedge fund industry
•Aug 2007 crisis for quant
Investment BankInstitutional Investor Hedge Fund

Financial Risk Management
Prof. Jeff (YuQing) Shen, UC Berkeley81
Alpha/Beta Framework
Issues
Solution 1: Diversify Beta
Solution 2: Diversify Alpha
Solution 3: Alpha/Beta Framework
Case Study
– Yale endowment approach

Financial Risk Management
Prof. Jeff (YuQing) Shen, UC Berkeley82
No free lunch: higher return requires higher risk
Strategically overweight high return assets: return the easy way
Tactically take more active risk: smart, but difficult
Exp
ecte
d R
etur
n
Risk
Easy but risky
CashGov’ts
CreditHigh Yield
EquitiesEmerging markets
Smart but harder

Financial Risk Management
Prof. Jeff (YuQing) Shen, UC Berkeley83
What are Beta and Alpha risks?
Beta returns are derived from asset class returns.
Characteristics of Beta return:
Limited in number
Economic fundamentals driven
Relatively low Sharpe ratio
Reliable over the long run
Easy but risky
Alpha returns are active managers’ value-added.
Characteristics of Alpha return:
Abundant in number
Manager skills driven
Zero-to-negative-sum game
Not necessarily reliable
Smart but harder
Financial Risk Management
Prof. Jeff (YuQing) Shen, UC Berkeley84
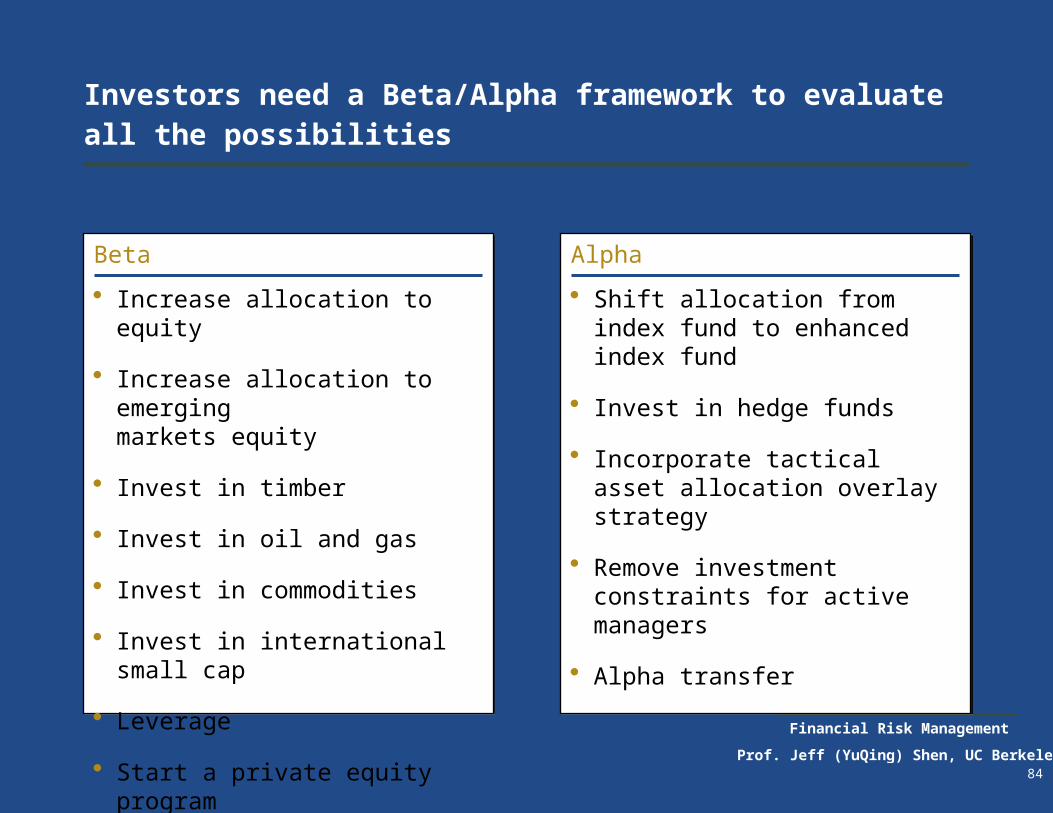
Investors need a Beta/Alpha framework to evaluate all the possibilities
Beta
Increase allocation to equity
Increase allocation to emergingmarkets equity
Invest in timber
Invest in oil and gas
Invest in commodities
Invest in international small cap
Leverage
Start a private equity program
Alpha
Shift allocation from index fund to enhanced index fund
Invest in hedge funds
Incorporate tactical asset allocation overlay strategy
Remove investment constraints for active managers
Alpha transfer
Financial Risk Management
Prof. Jeff (YuQing) Shen, UC Berkeley85
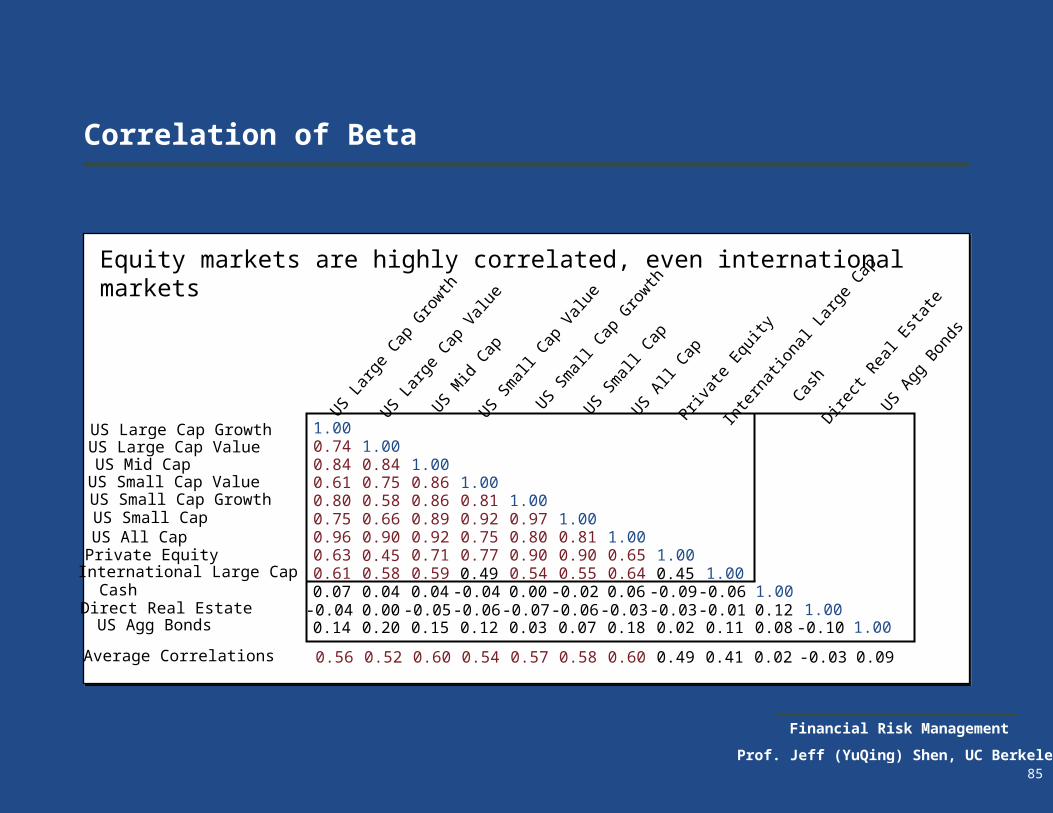
Correlation of Beta
Equity markets are highly correlated, even international markets
US Large Cap GrowthUS Large Cap ValueUS Mid CapUS Small Cap ValueUS Small Cap GrowthUS Small CapUS All Cap
International Large CapCashDirect Real EstateUS Agg Bonds
Private Equity
1.000.74 1.000.84 0.84 1.000.61 0.75 0.86 1.000.80 0.58 0.86 0.81 1.000.75 0.66 0.89 0.92 0.97 1.000.96 0.90 0.92 0.75 0.80 0.81 1.000.63 0.45 0.71 0.77 0.90 0.90 0.65 1.000.61 0.58 0.59 0.49 0.54 0.55 0.64 0.45 1.000.07 0.04 0.04 -0.04 0.00 -0.02 0.06 -0.09 -0.06 1.00
-0.04 0.00 -0.05 -0.06 -0.07 -0.06 -0.03 -0.03 -0.01 0.12 1.000.14 0.20 0.15 0.12 0.03 0.07 0.18 0.02 0.11 0.08 -0.10 1.00
Average Correlations 0.56 0.52 0.60 0.54 0.57 0.58 0.60 0.49 0.41 0.02 -0.03 0.09
US Lar
ge C
ap G
rowth
US Lar
ge C
ap V
alue
US Mid
Cap
US Sm
all C
ap V
alue
US Sm
all C
ap G
rowth
US Sm
all C
apUS A
ll Cap
Inte
rnat
iona
l Lar
ge C
ap
Cash
Direct
Rea
l Est
ate
US Agg
Bon
ds
Privat
e Equ
ity

Financial Risk Management
Prof. Jeff (YuQing) Shen, UC Berkeley86
First problem: portfolio risk is concentrated in Beta risk taking...
Description Allocation Risk contribution
Alpha Large Cap Managers 22%Small and Mid Cap Managers 26%International Managers 22%Alternative Investments 7%Fixed Income and Cash Managers 19%Real Assets 4%
Total Alpha Risk Contribution 100%
Beta U.S. Equities 48%International Equities 22%Fixed Income and Cash (incl Alt. Inv.) 26%Real Assets 4%
Total Beta Risk Contribution 100%
Total Risk
0.27%0.37%
-0.12%0.38%0.03%0.00%
0.93%
7.16%3.23%0.12%0.00%
10.51%
11.44%

Financial Risk Management
Prof. Jeff (YuQing) Shen, UC Berkeley87
The only Bloomberg Screen that matters
Financial Risk Management
Prof. Jeff (YuQing) Shen, UC Berkeley88
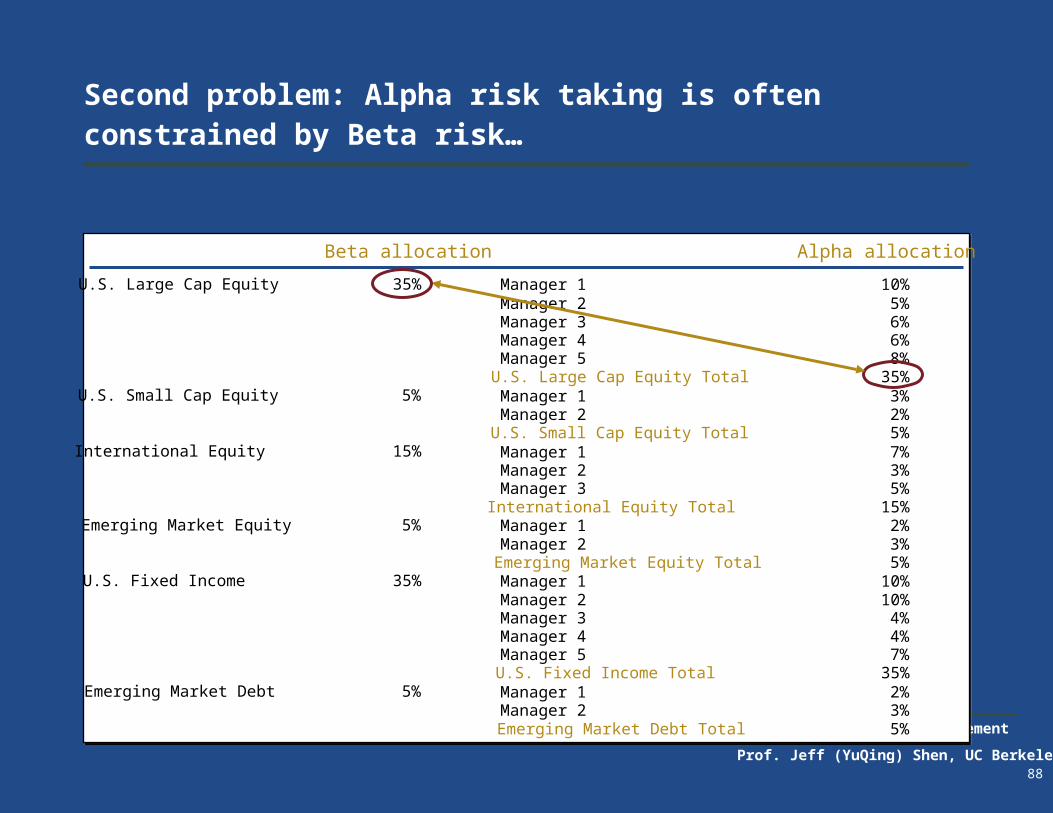
Second problem: Alpha risk taking is often constrained by Beta risk…
Beta allocation Alpha allocation
Manager 2 5%Manager 3 6%Manager 4 6%Manager 5 8%
U.S. Small Cap Equity 5% Manager 1 3%Manager 2 2%
U.S. Small Cap Equity Total 5%International Equity 15% Manager 1 7%
Manager 2 3%Manager 3 5%
International Equity Total 15%Emerging Market Equity 5% Manager 1 2%
Manager 2 3%Emerging Market Equity Total 5%
U.S. Fixed Income 35% Manager 1 10%Manager 2 10%Manager 3 4%Manager 4 4%Manager 5 7%
U.S. Fixed Income Total 35%Emerging Market Debt 5% Manager 1 2%
Manager 2 3%Emerging Market Debt Total 5%
U.S. Large Cap Equity 35% Manager 1 10%
U.S. Large Cap Equity Total 35%
Financial Risk Management
Prof. Jeff (YuQing) Shen, UC Berkeley89
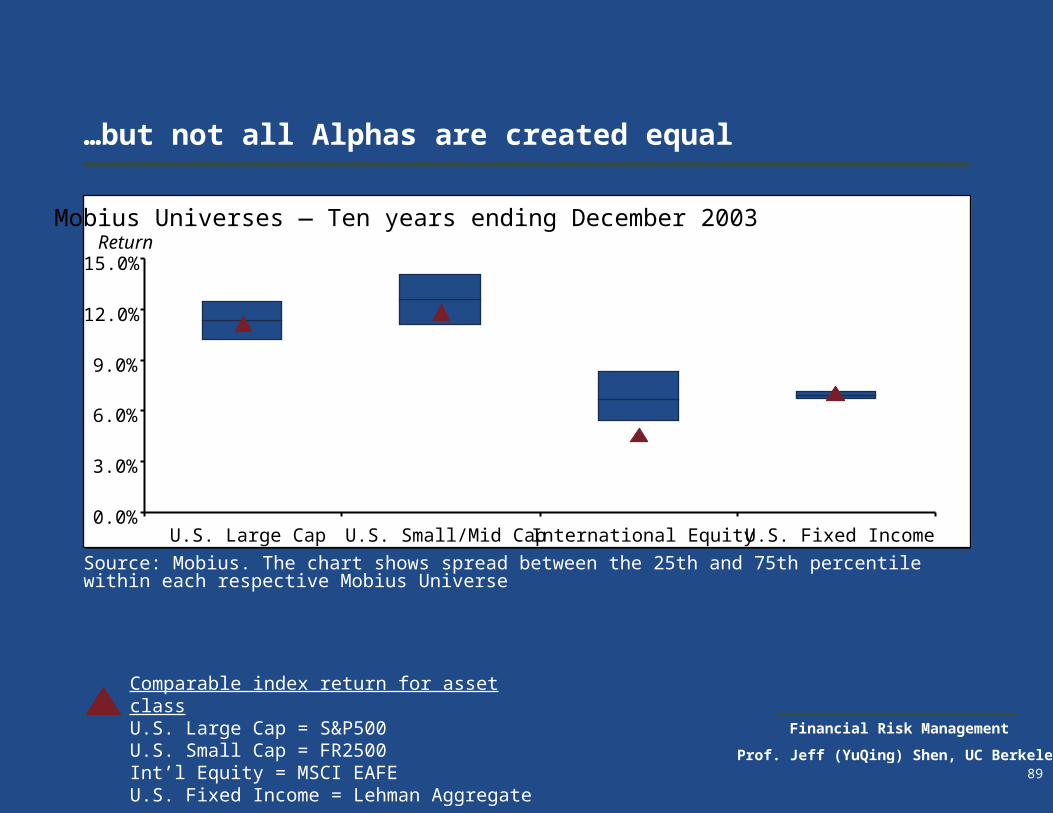
…but not all Alphas are created equal
Comparable index return for asset classU.S. Large Cap = S&P500U.S. Small Cap = FR2500Int’l Equity = MSCI EAFEU.S. Fixed Income = Lehman Aggregate
Source: Mobius. The chart shows spread between the 25th and 75th percentile within each respective Mobius Universe
Mobius Universes — Ten years ending December 2003Return
0.0%
3.0%
6.0%
9.0%
12.0%
15.0%
U.S. Large Cap U.S. Small/Mid Cap International Equity U.S. Fixed Income

Financial Risk Management
Prof. Jeff (YuQing) Shen, UC Berkeley90
…and dispersion is significant in alternative asset classes

Financial Risk Management
Prof. Jeff (YuQing) Shen, UC Berkeley
Persistence
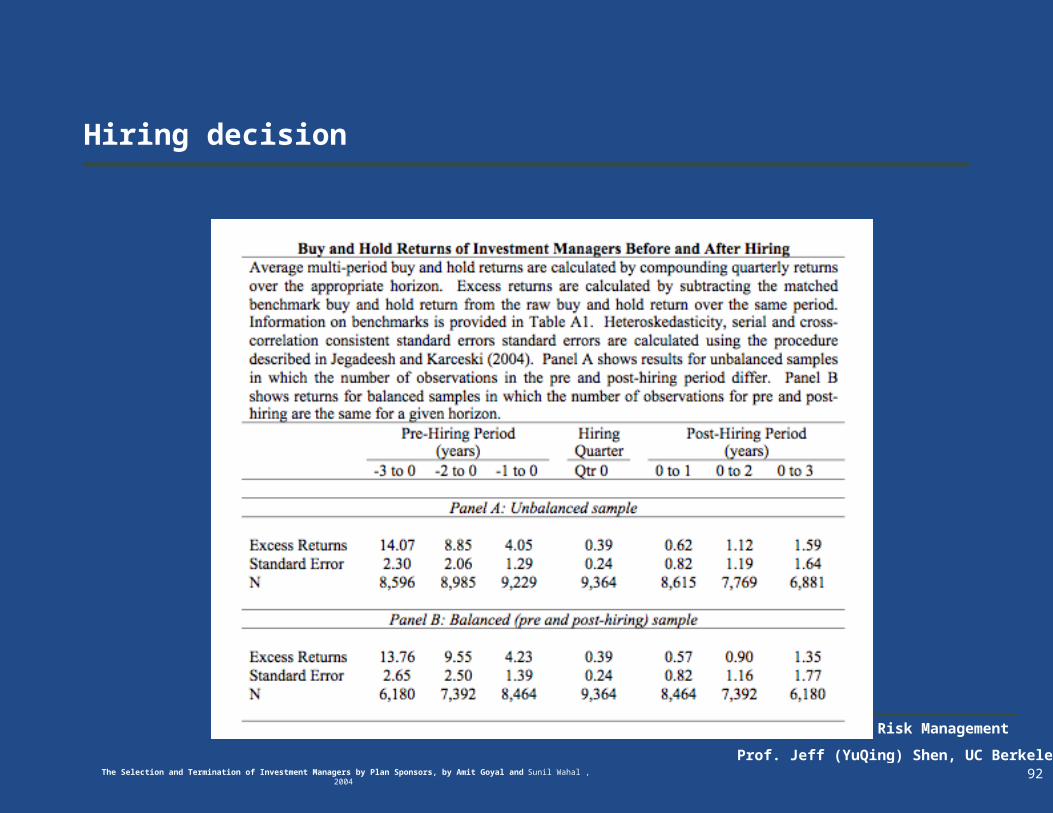
We examine the selection and termination of investment managers by plan sponsors, representing public and corporate pension plans, unions, foundations, and endowments. We build a unique dataset that comprises hiring and firing decisions by approximately 3,700 plan sponsors over a 10-year period from 1994 to 2003. Our data represent the allocation of over $730 billion in mandates to hired investment managers and the withdrawal of $110 billion from fired investment managers. We find that plan sponsors hire investment managers after these managers earn large positive excess returns up to three years prior to hiring. However, despite general persistence in investment manager returns, this return chasing behavior does not deliver positive excess returns thereafter; post-hiring excess returns are indistinguishable from zero. Plan sponsors terminate investment managers after underperformance but the excess returns of these managers after being fired are frequently positive. Finally, using a matched sample of firing and hiring decisions, we find that if plan sponsors had stayed with fired investment managers, their excess returns would be larger than those actually delivered by newly hired managers.
91
The Selection and Termination of Investment Managers by Plan Sponsors, by Amit Goyal and Sunil Wahal , 2004
Financial Risk Management
Prof. Jeff (YuQing) Shen, UC Berkeley
Hiring decision
92The Selection and Termination of Investment Managers by Plan Sponsors, by Amit Goyal and Sunil Wahal , 2004

Financial Risk Management
Prof. Jeff (YuQing) Shen, UC Berkeley
Firing decision
93The Selection and Termination of Investment Managers by Plan Sponsors, by Amit Goyal and Sunil Wahal , 2004

Financial Risk Management
Prof. Jeff (YuQing) Shen, UC Berkeley
Comparison of hiring and firing
94
The Selection and Termination
of Investment Managers by
Plan Sponsors, by Amit Goyal
and Sunil Wahal , 2004

Financial Risk Management
Prof. Jeff (YuQing) Shen, UC Berkeley95
% a
lloca
tion
35%
5%
15%
5%
35%
5%
15%
10%
25%
20%
10%
20%
0%
5%
10%
15%
20%
25%
30%
35%
40%
U.S. Large
Cap Equity
U.S. Small
Cap Equity
International
Equity
Emerging
Market
Equity
U.S. Fixed
Income
Emerging
Market Debt
Beta allocationAlpha allocation
Liberate Alpha from Beta
Financial Risk Management
Prof. Jeff (YuQing) Shen, UC Berkeley96
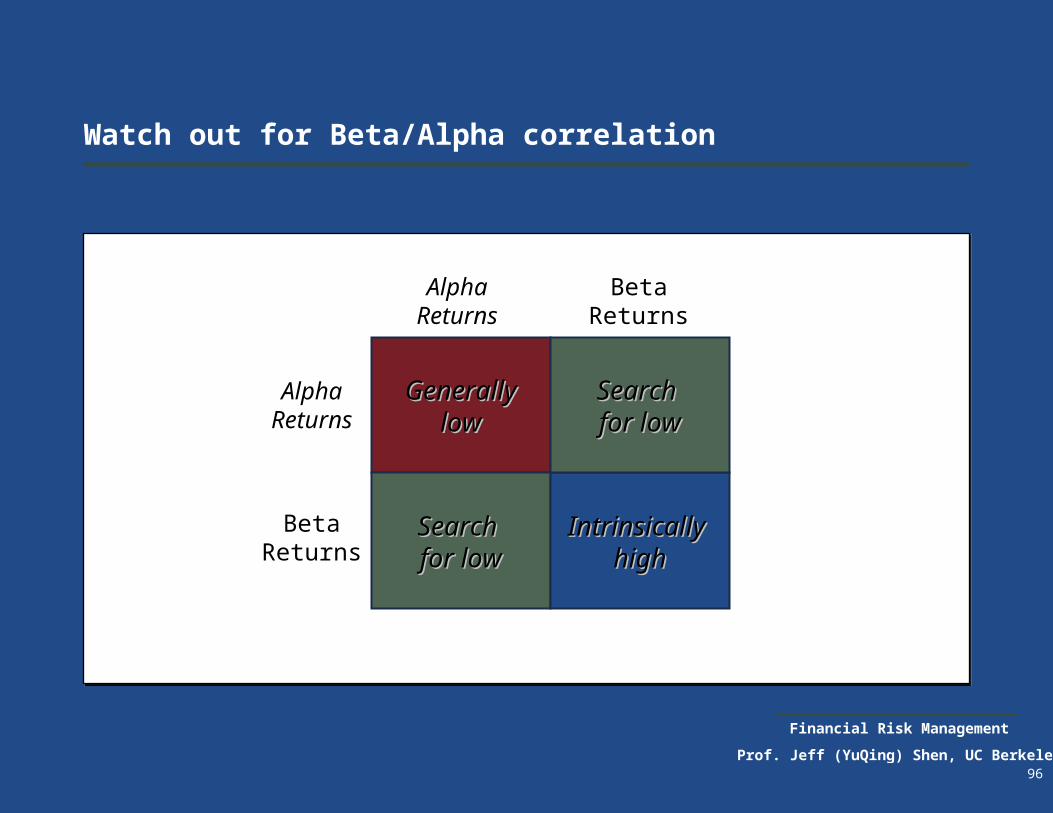
Watch out for Beta/Alpha correlation
GenerallyGenerallylowlow
Search Search for lowfor low
Intrinsically Intrinsically highhigh
Search Search for lowfor low
Alpha Returns
Beta Returns
Alpha Returns
Beta Returns

Financial Risk Management
Prof. Jeff (YuQing) Shen, UC Berkeley97
BetaBeta AlphaAlphaPortfolioReturn
Beta vs. Alpha framework
Diversify Beta risk
Liberate Alpha from Beta
…potential for more consistent portfolio return

Financial Risk Management
Prof. Jeff (YuQing) Shen, UC Berkeley98
The BIG Picture
• Theory
•Efficient Frontier
•Asset/Liability Framework
•Alpha/Beta risk budgeting
• Practice
•Pension Crisis
•GM Pension Plan
•Yale Endowment
• Theory
•VaR
•Stochastic behavior of asset
returns
•Worst case scenario
• Practice
•Investment bank VaR
•Bear Stearns
• The Theory
•Active Portfolio Management
•Quantitative equity models
•Hedge fund investment
• The Practice
•Hedge fund industry
•Aug 2007 crisis for quant
Investment BankInstitutional Investor Hedge Fund

Financial Risk Management
Prof. Jeff (YuQing) Shen, UC Berkeley99
Institutional investor risk management
US corporate defined benefit plans
Endowment and foundation

Financial Risk Management
Prof. Jeff (YuQing) Shen, UC Berkeley100
University of Illinois Endowment Investment Policy
The investment policy recognizes the long term nature of endowment funds and seeks to balance present and future support.
The investment objective is to preserve the real value, or purchasing power, of the endowment pool assets and the annual support provided by these assets for an infinite period. The endowment pool investment policy embraces the total return concept.
Total InvestmentReturn
Rate of PurchasingPower Loss
Spending Rate Real Asset GrowthRate
Financial Risk Management
Prof. Jeff (YuQing) Shen, UC Berkeley101
University of Illinois Endowment Investment Policy
The purpose of the spending rate formula is to provide a stable income stream that keeps pace with inflation and does not degrade the real value of the corpus of the endowment over time. Typically 5% in in the industry.
The rate of purchasing power loss is inflation. The primary inflation measure used to determine purchasing power is the Consumer Price Index.
The universe of comparison is the EK&A Endowment Fund Universe, which consists of the returns of approximately 274 endowments.
Financial Risk Management
Prof. Jeff (YuQing) Shen, UC Berkeley102
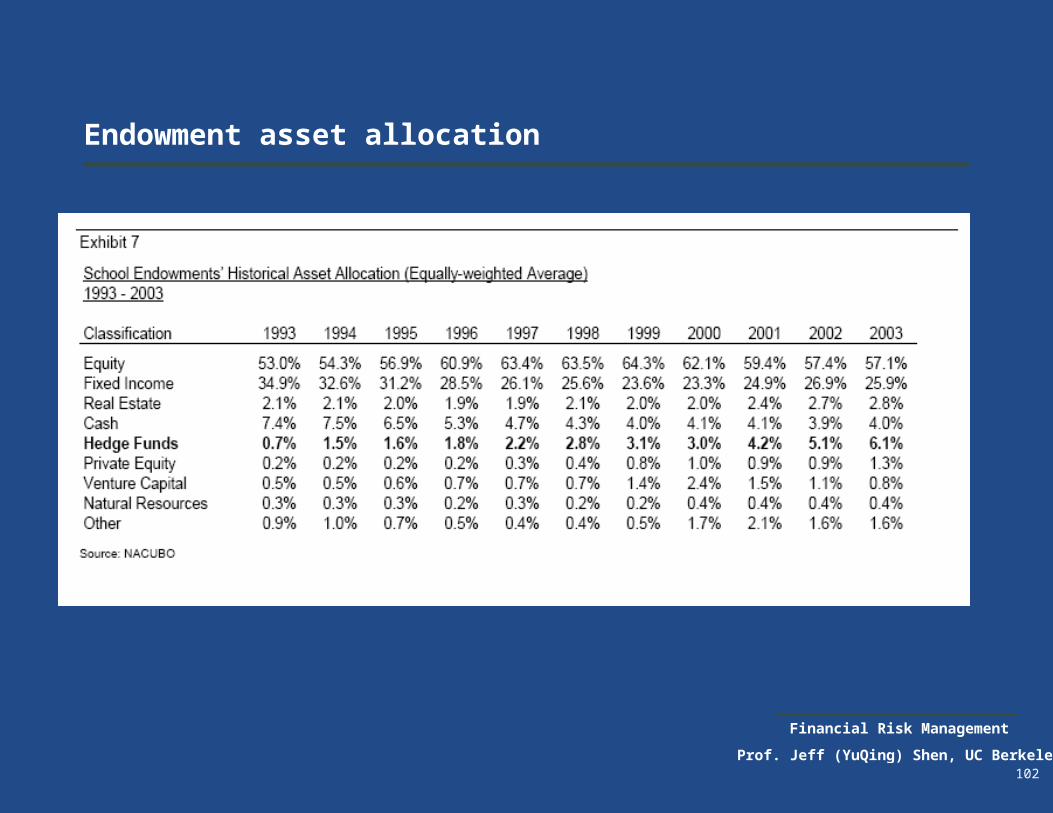
Endowment asset allocation
Financial Risk Management
Prof. Jeff (YuQing) Shen, UC Berkeley103
Case Study: Yale Endowment

Financial Risk Management
Prof. Jeff (YuQing) Shen, UC Berkeley104
Performance
*Source: Yale Endowment Annual Report 2008

Financial Risk Management
Prof. Jeff (YuQing) Shen, UC Berkeley
Endowment highlights
105

Financial Risk Management
Prof. Jeff (YuQing) Shen, UC Berkeley
Operating budget contribution
106

Financial Risk Management
Prof. Jeff (YuQing) Shen, UC Berkeley
Spending rate
107

Financial Risk Management
Prof. Jeff (YuQing) Shen, UC Berkeley
Peer comparison
108

Financial Risk Management
Prof. Jeff (YuQing) Shen, UC Berkeley109
Peer comparison
*Source: Yale Endowment Annual Report 2008
Financial Risk Management
Prof. Jeff (YuQing) Shen, UC Berkeley110
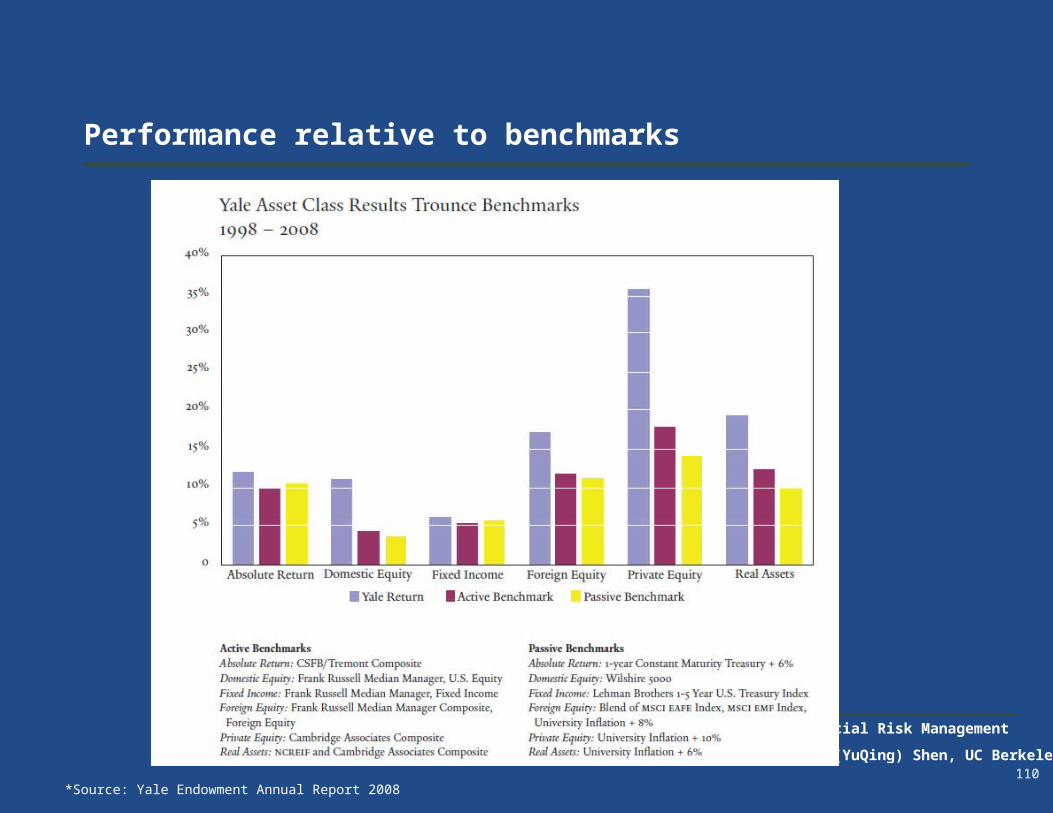
Performance relative to benchmarks
*Source: Yale Endowment Annual Report 2008

Financial Risk Management
Prof. Jeff (YuQing) Shen, UC Berkeley
Dispersion of active returns
111

Financial Risk Management
Prof. Jeff (YuQing) Shen, UC Berkeley
Dispersion of active returns
112

Financial Risk Management
Prof. Jeff (YuQing) Shen, UC Berkeley113
Historical asset allocation trends
*Source: Yale Endowment Annual Report 2005

Financial Risk Management
Prof. Jeff (YuQing) Shen, UC Berkeley114
Liquidity profile
*Source: Yale Endowment Annual Report 2005

Financial Risk Management
Prof. Jeff (YuQing) Shen, UC Berkeley
Yale Endowment Case Study Questions
What are the pros and cons of Yale Endowment investment style?
What are the key risk factors in Yale’s investment?
How does Yale manage its investment risk?
115

Financial Risk Management
Prof. Jeff (YuQing) Shen, UC Berkeley

Financial Risk Management
Prof. Jeff (YuQing) Shen, UC Berkeley117
The BIG Picture
• Theory
•Efficient Frontier
•Asset/Liability Framework
•Alpha/Beta risk budgeting
• Practice
•Pension Crisis
•GM Pension Plan
•Yale Endowment
• Theory
•VaR
•Stochastic behavior of asset
returns
•Worst case scenario
• Practice
•Investment bank VaR
•Bear Stearns
• The Theory
•Active Portfolio Management
•Quantitative equity models
•Hedge fund investment
• The Practice
•Hedge fund industry
•Aug 2007 crisis for quant
Investment BankInstitutional Investor Hedge Fund