section 202 supportive housing for the elderly: program ... · pdf filesection 202 supportive...
TRANSCRIPT

U.S. Department of Housing and Urban DevelopmentOffice of Policy Development and Research
Section 202 Supportive Housing for the Elderly:
Program Status and Performance Measurement

Visit PD&R’s Web Site www.huduser.orgto find this report and others sponsored by HUD’s Office of Policy Development and Research (PD&R). Other services of HUD USER, PD&R’s Research Information Service, include listservs;special interest reports, bimonthly publications (best practices, significant studies from other sources);access to public use databases; hotline 1-800-245-2691 for help accessing the information you need.

BSection 202 Supportive Housing for the Elderly: BProgram Status and Performance Measurement
Barbara A. Haley and Robert W. Gray
With: Lydia B. Taghavi, Dianne T. Thompson, Deborah Devine, Abdollah H. Haghighi, and
Seth R. Marcus
U.S. Department of Housing and Urban Development Office of Policy Development and Research
June, 2008

TABLE OF CONTENTS
Executive Summary 5 Description of Section 202 Supportive Housing 5 Unique aspects of Section 202 Supportive Housing 6
BProgram costs of Section 202 versus Housing Choice Vouchers 6 Development processing delays 7 Development cost limits 7 Methods used to allocate program funds 8 Alternative to institutionalization 8 Achieving cost savings 9 Estimating cost savings attributable to Section 202 10 Proposed program reforms 11 Measuring program performance 11 Conclusion 11
BChapter One: Program Overview 13 Organization of the study 13 Methodology and data sources 13 Description of the Section 202 program 14 Historical phases of the program 17 Persons eligible to participate 21
BNumbers of properties and units in the Section 202 program 22 BProviding assistance to frail elderly persons 24 BDemand for Section 202 housing 29
Chapter Two: Housing Quality and Quality of Life 47 Traditional measures of housing quality 47 Quality of supportive housing features 51
Neighborhood characteristics 58 Quality of life 60
Chapter Three: Improving Program Efficiency 82 Costs and benefits of Housing Choice Vouchers and Section 202 housing 82 Subsidy costs for Section 202 and other programs 86 Section 202 development cost limits 89 Time for development of Section 202 housing 91 HUD practices on establishing allocation areas 96
Conclusions and recommendations 98
2

TABLE OF CONTENTS (Continued)
BChapter Four: Cost of Institutionalization 102 BFederal assistance to programs offering community-based services 104 BFuture demand for long-term care 108 Risks of institutionalization 110 BAlternatives to nursing home care 115 �Reduction of institutionalization 117 �Comparison of the Costs of Institutionalization and the Costs of Providing Section 124202 Housing with Supportive Services �Conclusions and recommendations 135
BChapter Five: Measuring Performance in the Section 202 Program 138 �Overview 138
BOutput measures for the Section 202 program 139 BOutcome measures on quality of housing and services 141 BEfficiency measures: time and cost 142 BConclusion 146
Appendix A: NAHB Research Center Findings 147: Performance Measurement 150Appendix B
Appendix C: Fiscal Year 2009 Annual Performance Plan 152
3

Acknowledgements
BWe are grateful to many individuals for their comments, data, and other contributions. Many thanks to Mark Shroder, David A. Vandenbroucke, Carolyn Lynch, David Yao, David Chase, Mark Perdue, Dwight Jefferson, Brent Mast, and Mary Anthony Trujillo. We are also indebted to Willie Spearmon, Aretha Williams, Carissa Janis, Betty Park, Eric Axelrod, and Steve Martin. And, we very much appreciate insightful comments from Adam Hoffberg on an early draft of this report.
4

Executive Summary
The Section 202 Supportive Housing for the Elderly program provides capital advances and project rental assistance under Section 202 of the Housing Act of 1959 (as amended), for housing projects serving elderly households. The Office of Policy Development and Research (PD&R) at the Department of Housing and Urban Development (HUD) has conducted a study to assess whether the program has been effective in meeting the needs of very low-income elderly Americans.
BDescription of Section 202 Supportive Housing
Since enactment of the program in 1959, Section 202 has provided direct loans or capital advances from the federal government to enable private, not-for-profit sponsors to produce secure, barrier-free, and supportive housing facilities for older persons.1 Careful sponsor screening and rental subsidies have resulted in fewer defaults and greater financial stability in the Section 202 program than in most other federal housing programs. HUD’s administrative data show that, as of December 2006, over 6,000 Section 202 facilities housed approximately 263,000 households of older persons. Waiting lists for Section 202 facilities are long, especially when compared to the number of housing units becoming vacant each year. The relatively high demand for this housing means that applicants frequently must wait over two years for a unit.
Persons are eligible to apply for assistance if their incomes are very low, which is generally equal to 50 percent of the area median family income, adjusted for household size. Residents are predominantly elderly women living alone with incomes between $5,000 and $15,000. The median 2006 income of about $10,000 is well below the income eligibility limit for the program.
Housing made available under the Section 202 program is of good quality, and performs better during on-site physical inspections than other HUD-assisted housing programs. Available information on resident satisfaction suggests that residents of Section 202 facilities are more satisfied with their home and immediate surroundings than participants in the Housing Choice Voucher program or unassisted very low-income elderly persons.
In 2006, the median age of Section 202 residents was 74 years, and 31 percent were age 80 or older. For elderly persons admitted to Section 202 housing that year, the median age was 70 years, and about 19 percent of all persons admitted to Section 202 housing were age 80 or older.
Residents of Section 202 projects in 2006 had a median tenure of 4 years. Eighteen percent of all households had lived in the project for more than ten years. On average, elderly persons admitted to Section 202 projects generally resided for longer periods of time in this kind of housing than elders admitted to public housing, other multifamily assisted housing, or using Housing Choice Vouchers.
1 Elderly households are those with a head, spouse or co-head age 62 or older.
5
Unique Aspects of Section 202 Supportive Housing
A critical aspect of Section 202 housing is that it can accommodate residents with supportive services as they become more frail. A majority of facilities (73.9 percent) have grab rails, and 91.1 percent have a ramp or a level entrance. In the newer projects (built since 1990), nearly 100 percent of projects have at least one accessible unit, and 43 percent of all units are wheelchair-accessible.
A majority of Section 202 projects have the capacity to provide an array of communal services for their residents. Community space for social and recreational facilities is available and used in 90.2 percent of projects. Spaces for congregate dining and supportive service providers are used in about half of projects.
Costs of formal services are generally not paid by HUD, but instead are paid through a variety of other sources, principally through Medicaid. Examples of formal services are meals, housekeeping, assistance with medications, bathing, etc. A service coordinator is a person trained to work with residents and their families when supportive services are needed. In 2006, 38 percent of all Section 202 properties reported having a service coordinator on staff. Almost half of all facilities built before 1984 reported having one on staff, while the smallest service coordinator presence (26.9 percent) was reported at newer Section 202 projects developed after 1990. Older facilities tend to be larger than newer projects, which permits greater economies of scale in staffing than in the newer, smaller facilities.
BProgram Costs of Section 202 Versus Housing Choice Vouchers
An important source of information on the comparative costs of Federal housing assistance programs is a 2002 study by the Government Accountability Office (GAO).2
The GAO study compared the total per-unit costs of six active programs: Housing Choice Vouchers, Low-Income Housing Tax Credits, Hope VI, Section 202, Section 811, and Section 515. The GAO estimated the per-unit, thirty-year cost of the Section 202 program was 12 percent more than for Housing Choice Vouchers in metropolitan areas, and 39 percent more than for vouchers in non-metropolitan areas. A key issue is whether a twelve percent higher cost of a Section 202 project in a metropolitan area is offset by greater benefits, particularly since Section 202 housing can provide features and services that are not generally available in private-market housing available to very low-income persons using vouchers.
The quality of Section 202 housing is uniformly good, regardless of where the project is built, while the quality of housing occupied by elderly voucher participants varies by geographic region of the country. When an elderly person moves into a newly developed Section 202 project, he/she is likely to occupy good quality housing with accessibility
2 Government Accountability Office (2002) Federal Housing Assistance: Comparing the Characteristics and Costs of Housing Programs. GA0-02-76. Available at: www.gao.gov.
6

features, congregate dining (i.e. meals served to residents who sit together in a building’s dining area), and services, regardless of location. An elderly person using a voucher is likely to occupy much older housing, possibly without all needed accessibility features, and probably without access to congregate dining or service coordinators.
The needs of the elderly are quite diverse, and the voucher program has been found in prior research to be well suited to the needs of many low-income elderly persons who can live independently. But, vouchers should not be viewed as a panacea. Vouchers may not be the best choice for people who are unable to shop for food, cook meals, or perform housekeeping tasks. Nor are they necessarily the best choice for persons who are frail, need supportive personal services, or are at risk of institutionalization.
Development Processing Delays
The Government Accountability Office (GAO) and others have criticized HUD for Section 202 development processing delays.3 GAO’s May 2003 study of delays found that inadequate development cost limits appear to be a significant factor contributing to lengthy development times, negatively affecting project processing time. Research completed in 2005 confirmed the 2003 finding by the GAO that capital advances provided in HUD awards do not always cover the cost of developing projects, contributing to development processing delays.
Processing of Section 202 program applications has been a priority for HUD Field staff. By mid-2003, a backlog of 118 Section 202 projects had been essentially eliminated. HUD provided training in the processing of Section 202 applications to Field staff, and initiated the study on development cost limits. HUD also conducted a data clean-up of its Development Application Processing (DAP) system, to help support more effective monitoring. The average number of days from time of funding award to time of initial closing clearly has fallen in the past few years.
Another improvement that has occurred since the release of the GAO study is the implementation of the Section 202 Demonstration Pre-Development Grant Program. This program may have some impact on the ability of some sponsors to expedite the development processing of projects from fund reservation to initial closing within HUD’s required 18-month timeframe. HUD’s goal for Fiscal Year 2009 is to bring 90 projects containing a total of 3,600 units to initial closing.4
BDevelopment Cost Limits
The National Association of Homebuilders (NAHB) Research Center, under contract with HUD, conducted a cost evaluation of the Section 202 and Section 811 Supportive
3 Government Accountability Office (2003) Elderly Housing: Project Funding and Other Factors Delay Assistance to Needy Households. GAO-03-512. Available at: www.gao.gov
U.S. Department of Housing and Urban Development (2008) Fiscal Year 2009 Annual Performance Plan. Available at: http://www.hud.gov/offices/cfo/reports/pdfs/app2009.pdf.
7
4

Housing Programs. The primary purpose of this study was to determine the accuracy and reasonableness of the project development cost limits used in the programs. The NAHB Research Center study found that actual average costs for Section 202/811 projects were reasonable in that they generally were below R.S. Means estimated per square foot costs. Further, the maximum, HUD-allowed Section 202 costs per unit are, on average, approximately equal to R.S. Means estimated Total Construction and Development Costs, exclusive of land. 5
BMethods Used to Allocate Program Funds
Section 202 capital advance funds are allocated by formula to HUD Field Offices. They are announced through a Notice of Fund Availability (NOFA), and are competitively awarded to nonprofit sponsors. HUD’s current practice of making formula allocations to geographic areas as small as the jurisdiction of a HUD Field Office has adversely impacted program’s capacity to develop economically viable projects that are cost effective in addressing the needs of frail elderly persons.
In recent years, funds for the Section 202 program have not been increasing, while costs increase with inflation each year. As a result, the number of units that can be approved within new developments is shrinking. Each year, as Section 202 properties complete construction and are ready for initial occupancy, these properties require Project Rental Assistance Contract (PRAC) funds, and this shrinks available funds even further.
In order to be considered responsive to a NOFA, an applicant must not request a larger number of units for a geographic area (metro or non-metro) than has been allocated to that area. For many allocation areas, this effectively puts the maximum project size at less than 50 units in metropolitan areas and less than 20 units in non-metropolitan areas.
Eliminating a requirement to allocate 15 percent of funds to non-metropolitan areas would cause more funds to be allocated to areas of greater need, where cost efficiencies are also greater. Collapsing the boundaries of some allocation areas would also help to provide larger projects offering housing that is better suited to the needs of frail elderly. Research is needed to establish a minimum size that allows cost effective congregate dining and other services.
BAlternative to Institutionalization
The elderly overwhelmingly prefer living in their own homes to other options. They see nursing homes as the least attractive option for people who are dependent.6 It is therefore
5 National Association of Homebuilders Research Center, Inc. and Columbia enterprises, Inc. Construction Cost Indices: HUD Section 202 and 811 Supportive Housing Programs, March 2005. Available at www.HUDUSER.org
6 O'Keeffe, Janet, Christine O'Keeffe, and Shulamit Bernard (2003) Using Medicaid to Cover Services for Elderly Persons in Residential Care Settings: State Policy Maker and Stakeholder Views in Six States. Report was prepared under contract #HHS-100-97-0014 between the U.S.
8

not surprising that non-financial factors become more important for demand for Section 202 housing as the ages of applicants increase. In particular, needs for supportive services and improved security are more important to older applicants than to those in their 60s. When reporting the types of needs influencing a decision to move to Section 202 housing, 20.3 percent of applicants over age 80 reported needing supportive services because of frailty, which was twice the rate for other applicants.7
�Achieving Cost Savings
HUD’s Congregate Housing Services Program (CHSP), authorized under Title IV of the Housing and Community Development Act of 1978, awarded funds to pay for the provision of community-based supportive services to Section 202 projects and other housing projects built and operated by local public housing authorities. An evaluation of the CHSP found that one impact of the program was a reduction in placement in nursing homes. Specifically, for every recipient of CHSP services who experienced an institutional placement, 1.5 vulnerable tenants in non-CHSP buildings experienced such a placement. The authors noted that even greater short-term positive effects of CHSP services could be expected if the program is used to deinstitutionalize elderly persons.8
In 2005, 63 percent of total Medicaid expenditures for long-term care were for nursing homes. Of the $94.5 billion spent on long-term care, $59.3 billion went to these institutions.9 An estimated 20 percent of nursing home residents do not need skilled nursing and could be deinstitutionalized if appropriate community supports were available. Reforms of Medicaid program restrictions on funding community-based services will not by themselves produce desired savings. In addition, a reduction in the institutionalization of very low-income nursing home patients depends on an adequate supply of affordable, accessible housing with supportive services.
This point was established by the Centers for Medicare & Medicaid Services (CMS), in association with the Assistant Secretary of Planning and Evaluation (ASPE), at the US Department of Health and Human Services (HHS). It sponsored the Nursing Home Transition Demonstration Program, which was set up to assist States in providing
Department of Health and Human Services (HHS), Office of Disability, Aging and Long-Term Care Policy (DALTCP) and the Research Triangle Institute. Available at: http://aspe.hhs.gov/daltcp/reports/med4rcs.htm.
7 Heumann, Leonard, Karen Winter-Nelson, and James Anderson (2001) The 1999 Survey of Section 202 Housing for the Elderly. AARP Public Policy Report #2001-02. Washington DC: AARP.
8 Sherwood, Sylvia (1985) Evaluation of the Congregate Housing Services Program, HUD Contract # HC-5373. Boston, Mass: Hebrew Rehabilitation Center for Aged. Unpublished manuscript.
9 Health Policy Institute, Georgetown University (2007) “Fact Sheet: Medicaid and long-term care.” Available at: http://ltc.georgetown.edu/pdfs/medicaid2006.pdf;
9

transition options to nursing home residents who want to move back to the community. While special funding and other assistance enabled targeted nursing home residents to make the transition to community living, nearly all of the case studies in the Demonstration cited the lack of affordable, accessible housing as one of the major barriers facing residents seeking to return to the community.
BEstimating Cost Savings Attributable to Section 202
BWhen estimating cost savings attributable to the Section 202 program, several scenarios are possible. Arkansas was one of the grantees of the Nursing Home Transition Demonstration Program, mentioned above. Arkansas’ experience with deinstitutionalizing nursing home patients provides the most optimistic scenario of savings that could be achieved by the Section 202 program. Arkansas explicitly identified cost-effectiveness as one of the criteria for choosing nursing home residents who would make good candidates for community living. Costs for community living were 39 percent of Medicaid costs for the same consumers in their last three months in a nursing home. However, achievement of this level of savings depends on the Section 202 program adopting reforms recommended in this report, with targeting of the program to low-income seniors who are at risk of institutionalization.
Another scenario assumes that the program continues to serve very low-income seniors who are aging in place. We estimate that approximately 38 percent of Section 202 tenants are currently disabled enough to be considered at-risk for institutionalization. Of those, an estimated 90,000 persons lack spouses or other sources of informal supports who could prevent institutionalization.
For a 340-day stay in a nursing home, the cost of institutionalization greatly exceeds the costs of other options. In 2004, a stay in a nursing home funded by Medicaid cost about $49,000 on average, while Section 202 housing plus the most-often provided services (food, transportation and housekeeping) is estimated to cost only about $13,000. Should a fuller set of personal services be provided for very frail elders, the cost of housing plus services is estimated at only approximately $25,000, still about half the cost of institutionalization.
Residents who move into a Section 202 project between the ages of 75 and 79 typically reside in the project for 6.28 years. When measured over this period of time, the cost of institutionalization funded by Medicaid is estimated at approximately $90,000, including $63,000 for 1.2 years in a nursing home and $27,000 for housing vouchers without supportive services, at an average of $440 per month, when not residing in a nursing home. The cost of Section 202 housing plus assisted living services with high levels of personal care is about $171,000, almost twice the cost of institutionalization plus voucher. However, the cost of housing plus a more typical set of services - food, transportation and housekeeping services - is $88,000, which is about the same as the cost of 1.2 years of institutionalization plus a housing voucher. This lower-end estimate is likely to be closer to the actual cost.
10

The above estimates are very sensitive to the assumption on likely future use of nursing homes. If the alternative to provision of housing plus supportive services is to permanently live in a nursing home, then for the entire 6.28 years that a person would have stayed in Section 202 housing, the total cost of institutionalization would be an estimated $329,000. This amount is nearly twice as expensive as the cost of providing Section 202 housing with a full set of personal services, and is almost four times the cost of providing Section 202 housing with less intensive services.
Proposed Program Reforms
Proposed program reforms, discussed in Chapters Three and Four, are designed to improve efficiency of program delivery and help retarget the program to better address the needs of frail elderly persons as well as meet growing demand. These include:
o revise boundaries of allocation areas and development cost limits, o allow for larger project sizes, o provide funding for service coordinators within all Section 202 projects, o produce 10,000 units per year over the next ten to fifteen year period, and o encourage owners and managers of Section 202 projects to conduct active
outreach to nursing homes in their community.
BMeasuring Program Performance
This report provides the following recommendations (discussed in more detail in Chapter Five) for goals that could be set explicitly for the Section 202 program:
o measure the presence of service coordinators, o continue assessments of physical inspections and of resident satisfaction in
Section 202 properties, o track the percentage of new admissions entering directly from institutions or
approved by Medicaid for admission to nursing homes o develop a methodology that measures frailty, o monitor per-unit development costs, o produce regular reports that identify the cost of completed projects and provide
meaningful comparisons to reasonable cost standards, and o develop a performance measure that tracks the efficiency of the Section 202
program in helping to avoid premature or unnecessary institutionalization.
Conclusion
The Section 202 program produces good quality housing that is rated very highly by its residents. Recently completed research has shown that program costs are reasonable in relation to costs of other development programs as well as industry norms. As States begin planning to create comprehensive long-term care systems that will enable low-income elders with disabilities to live in the community instead of relying on institutions, the availability of affordable, accessible housing will need to be addressed. In recent
11

years, the historically low level of Section 202 annual appropriations provided by Congress, in combination with HUD practices regarding allocation of funds, has resulted in development of multiple, small projects - often proposed and developed by relatively inexperienced, small sponsors – that reduce program efficiency and significantly contribute to project processing delays.
Results from decades of research suggest the potential of the Section 202 program to reduce Medicaid expenditures while providing a humane alternative to institutionalization. Program efficiency could be increased if the Section 202 program were to provide more assistance to persons who are either at risk of institutionalization or already institutionalized. Section 202 program rules could be altered to permit construction of buildings that are large enough to permit cost effective delivery of needed services. In this study, we provide estimates of the cost savings that are achieved under the program as it exists today. Further research is needed to estimate with greater precision the level of savings that can be expected now and in the future.
12

Chapter One: Program Overview
The Section 202 Supportive Housing for the Elderly program provides capital advances and project rental assistance under Section 202 of the Housing Act of 1959 (as amended), for housing projects serving very low-income elderly households. This study reviews available evidence and provides new information in order to assess whether the program has been effective in meeting the needs of elderly Americans. The study reviews performance measures used for the program in the Department of Housing and Urban Development’s (HUD’s) Strategic Plan and Annual Performance Plans, and proposes new performance measures.10
Organization of the Study
This report is organized into five chapters. Chapter One reviews the purpose of the program, provides historical context, indicates the number of persons who are eligible to apply for Section 202 assistance, and describes characteristics of participants and properties as of 2006. Chapter Two provides evidence on the extent to which Section 202 improves the housing quality and quality of life for program participants. To the extent practicable, this chapter also contrasts information on program outcomes with those observed in Housing Choice Vouchers and other programs that provide housing assistance to elderly persons. Chapter Three examines aspects of the Section 202 program that impact on the program’s efficiency, including the amount of time needed to develop properties, and the development and subsidy costs incurred under the program. Subsidy costs are contrasted with those found in other comparable programs. This chapter documents recent trends in the time that it takes to develop housing under the Section 202 Program, and proposes ways that the program can be modified to increase efficiency. Chapter Four revisits the issue of efficiency by presenting evidence that the Section 202 program generates Medicaid cost savings when institutionalization is reduced or avoided. This chapter quantifies the cost savings and provides evidence that the savings could be increased if certain program design changes are made. Chapter Five reviews the basis for establishing long-range performance measures, reviews measures that currently apply to the Section 202 program, and proposes a methodology that would help to track the effectiveness and efficiency of the program.
BMethodology and Data Sources
The information presented in this report comes from a wide variety of sources. Special tabulations have been done using extracts of program administrative data from a number of HUD’s administrative data systems. These included the Real Estate Management System (REMS), the Tenant Rental Assistance Certification System (TRACS), the
10 See: A-133 Compliance Supplement CFDA 14.57 Supportive Housing for the Elderly (Section 202) at: http://searchprod.hud.gov/search?q=cache:CyvtvuM67EMJ:hudatwork.hud.gov/po/f/audit/hsgforelderly.pd f+affordability&access=p&output=xml_no_dtd&ie=UTF-8&client=default_frontend&site=default_collection&proxystylesheet=default_frontend&oe=UTF-8
13

Development Application Processing (DAP) system, the Public and Indian Housing Information System (PIC), and two systems of the Real Estate Assessment Center (REAC). We performed spatial analysis, using geographic information systems (GIS) software, to link HUD’s administrative data to Census data. An extensive literature search provides external sources of research and information on Section 202, the need for elderly housing with supportive services, various aspects of gerontology, risks of institutionalization and other subjects. Special mention must be made of a series of surveys and other studies conducted under the auspices of the American Association of Retired Persons (AARP) that provided a unique source of information on Section 202 properties, participants in the program, and trends between 1983 and 1999.
Description of the Section 202 program
The Section 202 program is the Department’s principal program designed to develop subsidized rental housing for very low-income older adults. The intent of the program is to provide more than just shelter, as shown by the following passages of the Housing Act of 1959:
“Sec. 202. (a) (1) The purpose of this section is to assist private nonprofit corporations to provide housing and related facilities for elderly families and elderly persons…
(d) (8) The term “related facilities” means (A) new structures suitable for use as cafeterias or dining halls, community rooms or buildings, or infirmaries or other inpatient or outpatient health facilities or for other essential service facilities, and (B) structures suitable for the above uses by rehabilitation, alteration, conversion, or improvement of existing structures which are otherwise inadequate for such uses.” (emphasis added)
The Congress clearly wanted to provide a continuum of care that includes appropriate support needed by frail elders to maintain independent living. 11
F
11 For a seminal discussion of continuum of care for the elderly, see: Liebowitz, B. and E.M. Brody (1970) “Integration of research and practice in creating a continuum of care for the elderly,” The Gerontologist, 10, 1, 11 -17. Since then, more than 3,000 scholarly books and articles have been published that include discussions of this topic. See, for example: McBryde-Foster, Merry and Toni Allen (2005) “The continuum of care: a concept development study,” Journal of Advanced Nursing 50, 6, 624 – 632; Hurley , Jeremiah (2005) “Your Money or Your Life: Strong Medicine for America's Health Care System,” Journal of Health Politics, Policy and Law 30, 4, 764-770; and Davis, M. Nelia, Sarah Toombs Smith, and Susan Tyler (2005) “Improving Transition and Communication Between Acute Care and Long-Term Care: A System for Better Continuity of Care,” Annals of Long-Term Care 13 , 5, 25-32.
14

The Cranston-Gonzalez National Affordable Housing Act of 1990 adds clarity to the description of the purpose of the program: to enable elderly persons to live with dignity and independence by expanding the supply of affordable housing that (1) is designed to accommodate the special needs of elderly persons and (2) provides a range of supportive services that are tailored to the needs of elderly persons occupying such housing.
Over the years, the program has provided direct loans or capital advances from the federal government to enable private, not-for-profit sponsors to produce secure, barrier-free, and supportive housing facilities for older persons. The Fiscal Year 2009 Annual Performance Plan (APP) states:
Many of the residents live in the Section 202 facilities for years; over time, these individuals are likely to become frailer and less able to live in rental facilities without additional services. Therefore, HUD also provides grants to convert all or part of existing properties to assisted-living facilities, which allows individual elderly residents to remain in their units. Grants also fund service coordinators who help elderly residents obtain supportive services from the community. 12
F
HUD’s administrative data show that, as of 2006, over 6,000 Section 202 facilities housed approximately 263,000 households headed by older people. Careful sponsor screening and rental subsidies have resulted in fewer defaults and greater financial stability in the Section 202 program than in other private, project-based rental subsidy
13programs.
The Section 202 program was substantially amended in the Cranston-Gonzalez National Affordable Housing Act of 1990. In that legislation, the financing method was changed from direct loans to capital advances, and Section 8 rental assistance was no longer provided to support development of Section 202. Instead, ongoing Project Rental Assistance Contracts were provided to reduce monthly costs to the tenants.
As currently enacted, the program makes capital advances available to private, nonprofit corporations and nonprofit consumer cooperatives, including faith-based groups, to finance the construction, rehabilitation, or acquisition of properties. 14 Project sponsorsF
are required to make available necessary services that may include meal and nutritional services, housekeeping aid, personal assistance, transportation aid and health-related services. Virtually all of the cost of these services is paid for through external sources, although the program does make funding available to pay for the cost of service
12 See: http://www.hud.gov/offices/cfo/reports/pdfs/app2009.pdf
13 Heumann, Leonard, Karen Winter-Nelson, and James Anderson (2001) The 1999 Survey of Section 202 Housing for the Elderly. AARP Public Policy Report #2001-02. Washington DC: AARP.
14 The owner entity may also be a for-profit limited partnership if the project is processed as a mixed finance transaction. These transactions will be discussed below.
15

coordinators. Project rental assistance covers the difference between reasonable operating costs and the portion of the rent paid by tenants. Project rental assistance can be used to pay for fifteen percent of supportive services costs, not to exceed $15 per month per unit. Tenants contribute on the basis of their income, generally paying 30 percent of monthly income for rent and sometimes paying additional amounts for services. Program eligibility is limited to very low-income households with a head, spouse or co-head age 62 or older.
Sponsors of Section 202 housing must be private, nonprofit entities, including consumer cooperatives, and cannot be public bodies. In order to participate in Section 202, after selection for funding, sponsor entities form a separate owner entity that must be a single purpose, private, nonprofit organization. Religious organizations and public bodies (such as public housing agencies) are not eligible to serve as owners of Section 202 properties. However, religious organizations may serve as sponsors, and in fact the most common nonprofit sponsors are religious organizations. Community-based development corporations, unions, fraternal organizations, and cooperatives are examples of other nonprofit sponsor types. In the early years of the program, owner/sponsors generally owned and managed just one project, but over the last decade or so most units have come under multi-site sponsorship or management. 15
It has long been acknowledged that elderly households with significant disabilities must have access to flexible packages of housing and supportive services that will ensure maximum independence and dignity. 16 The Section 202 program was among the first F
programs to incorporate physical infrastructure, such as space for services and common dining, in order to support the delivery of on-site services.
Other HUD rental assistance programs, such as public housing and Housing Choice Vouchers (formerly known as Section 8), sometimes provide assistance to elderly persons, including persons of advanced age, for whom there is an increased likelihood of frailty. 17 Among these programs, however, the Section 202 program is unique in that it F
is specifically designed to directly address such needs. It is also a significant source of
15 Heumann et al. (2001).
16 See: Cox, Beth M. (2001) “Linking Housing and Services for Low-Income Elderly: Lesson for 1994 Best Practice Award Winners,” Journal of Housing for the Elderly 15, 1/2: 97-110.
17 HOPE VI funds can be used for the development, modernization and operation of supportive housing for seniors. There are currently 6 Senior-only HOPE VI sites. They include: Allegheny County, PA; Cambridge, MA; Kansas City, MO; Miami-Dade, FL; Mobile, AL; New Bedford, MA. Housing Choice Vouchers can be used in assisted living facilities. However, vouchers only cover the rent, which has to be broken out from the full monthly costs that usually include the cost of services. The rent portion must be determined reasonable based on the PHA's methodology for determining rent reasonableness. See: http://www.hud.gov/offices/pih/pihcc/publichousing.cfm#7; http://www.hud.gov/offices/pih/pihcc/faq.cfm
16

new housing units for very low-income households, accounting for 52 percent of all new units produced by HUD between 2000 and 2006.
BHistorical Phases of the Program
There are five distinct phases in the history of the Section 202 program that are defined by differences in resident eligibility, facility characteristics, and funding policies. 18 TheseF
phases are important for understanding changes that have occurred with regard to project management, resident characteristics, supportive service needs and availability, demand and vacancies, retention and transfer, and fiscal ability to meet future resident needs. The five phases were:
The Moderate-Income Eligibility Phase – 1959-1974. In the beginning, the Section 202 program provided a below-market-rate direct loan (generally 3 percent interest for up to 50 years) aimed at lowering the cost of housing production. The below market interest rates and nonprofit sponsorship meant that rents were affordable to persons unable to afford market rate apartments but whose income was too high to qualify for public housing. More than 45,000 units in 335 projects were built during this phase. Individual projects for older persons were relatively large, averaging 153 units. Most of the units were efficiency apartments, and the projects tended to be located in large cities. The combination of the financing of these projects and the age of the buildings give the oldest Section 202 projects a unique profile. These moderate-income phase facilities house the oldest and frailest residents. Consistent with agreements signed when the Section 202 financing was awarded, moderate income eligibility is retained in these facilities, and the average resident income remains the highest among all phases of the program. These higher incomes allow managers of the pre-1975 projects better short-term rental income flexibility than facilities built in the later lower-income phases. Because of their larger size, projects in this phase also have greater economies of scale in staffing than the smaller facilities in subsequent program phases. In 1964, the Section 202 loan program was expanded to include funding of buildings designed to serve the "non-elderly handicapped" population.
The Low-Income Phase – 1975-1980. The 1974 Housing Act established a new mission for Section 202: to serve persons with low incomes, defined as households at or below 80 percent of the local median income. Project-based Section 8 rental assistance was made available to cover up to 100 percent of the units for 20 years. The addition of this rental assistance made units affordable to a lower-income population. Because of relatively generous terms of financing available at that time, some projects in this phase were able to accumulate very substantial capital reserves for future modernization. The 1974 Housing Act also set aside 20 to 25 percent of loans for rural areas and required increased occupancy by minority applicants. Frail persons were to be assisted by new provisions that encouraged supportive services and larger staff. The largest number of projects and units were built during this period. More than 20,000 units per year approved in the late 1970s, for a total of more than 91,000 units built. In addition, the construction of
18 Discussion of the phases of the program is excerpted from Heumann et al. 2001, pp. 1-5.
17

efficiency units fell. Ninety percent of all apartments built during this phase were one-bedroom units. Average size of projects fell to 92 units.
The Cost-Containment Phase – 1981-1990. In line with federal cuts in most housing and social welfare programs, funding of new construction under the Section 202 program declined substantially during this time. The funding cuts resulted in a decrease in both the number of projects built and in their amenities. By fiscal year 1989, fewer than 7,200 new units in projects for older people were being built each year, for a total of approximately 37,000 units. Project size declined to an average of 56 units per facility.
In addition, a series of regulations in the name of cost containment had been introduced beginning in 1981 that negatively affected the design and development or many facilities. During this period, HUD implemented a number of cost-containment measures, the most onerous of which was a requirement that at least 25 percent of all units must be efficiencies. Restrictions on commercial space had the effect of eliminating commercial activities altogether. Elevators in two-story buildings were disapproved. Limitations on common areas resulted in no dining rooms or meal service for residents in projects built in 1982 for the five field offices sampled by Turner (1985). 19
F
As of November 28, 1990, Congress lowered income eligibility from 80 percent (“low income”) to 50 percent of the local median income (“very low income”). Because little had been done to address the needs of older minorities in previous phases, HUD introduced priority selection criteria for sponsors located in minority neighborhoods. The impact of these changes was significant. Sponsorship by groups representing racial minorities rose from 7.5 percent in the first phase to 17.3 percent by the end of this phase. In 1988, one-third of the residents in projects built during the cost containment phase had incomes below $5,000, compared with just 17.9 percent of residents living in projects built before 1975.
The Transition Phase – 1990-1994. A transition phase occurred as Congress and HUD moderated the cost-containment approach and developed a new funding strategy, described below as the current, or “PRAC,” phase of the program. HUD Secretary Jack Kemp made clearing the Section 202 pipeline a top priority at HUD. The income level of the residents and the size and location of the projects resembled the very low-income phase. However, the design and construction quality during this transition began to improve. The most important change occurred in project financing. As many as 35 percent of the projects initially financed with Section 8 rental assistance were converted to the project rental assistance contracts used in the current phase of the program.
The Section 811 program was established by the National Affordable Housing Act of 1990 (also referred to as the Cranston-Gonzalez Act). It replaced the portion of the Section 202 program that provided long-term loans for construction of housing for very-
See: US Department of Housing and Urban Development, Notice H 81-65, November 12, 1981. Cited by Turner, Margery A. (1985) “Building Housing for the Low-Income Elderly: Cost Containment in the Section 202 Program,” The Gerontologist 25, 3: 271-77.
18
19

low-income persons with disabilities. Since then, the Section 202 program has served only very low-income elderly. However, non-elderly disabled persons continue to occupy apartments in these buildings. 20 From 1989 to 1992, Section 202 program assistance to F
the non-elderly disabled was in a transition phase, known as Project Assistance Contract (PAC). 21
F
The PRAC Phase – 1993-present. The current phase of the program is called the “PRAC” phase, which stands for the “project rental assistance contract,” that replaces Section 8. The most fundamental change made between PRAC and the previous phases is that the building is paid for with a construction capital advance, rather than a loan. The construction capital advance simplifies the sponsor’s development planning and budgeting. Section 202 properties comprised 46 percent of all multifamily properties financed by HUD and constructed between 2000 and 2006.
More important for the quality of the program, the PRAC phase requires sponsors to take into account the needs of older residents. Staff positions like service coordinators are now automatically eligible in the project’s annual budget. Efficiency units are only allowed if the sponsor can establish the marketability of such units. The profile of projects, residents, and staffing under PRAC has not changed much from the cost-containment and transition phases, which focused on very low-income residents. The average size of the facilities is about the same (50 units), the age and profile of applicants is the same, and the staff sizes are equivalent.
The one major change is another reduction in the number of projects funded and built each year. While the cost-containment and transition phases added, on average, around 170 facilities per year to the overall stock, the current PRAC phase has added only about 116 per year (see Table 1-1). The PRAC phase has contributed about 36 percent of the total number of facilities to the program but only about 24 percent of the units. This is a reflection of changes in funding allocations in the program, which will be discussed below.
20 For more details see: Evaluation of Supportive Housing Programs for Persons with Disabilities at http://www.huduser.org/Publications/pdf/suphous1.pdf
21 The PAC form of rental assistance was only in effect for Section 202 Direct Loan projects for nonelderly persons with disabilities funded in 1989 and 1990. The projects, referred to as Section 202/162, that were not closed by December 31, 1991 were converted to Section 811 with PRAC projects as of January 1, 1992.
19

Table 1-1 Number of Properties and Units Developed by Stage of the Section 202 Program
1959-74
B
1975-84 Sec 8
1985-88 Sec 8
1989-94 Sec 81
1993-98 PRAC
2000-06 PRAC2, 3
Number of Years 16 10 4 5 5 7
Number of sites 289 1021 690 855 554 839
Number of units 42,737 91,273 37,363 44,831 27,632 35,281
Share of sites 8.5% 30.0% 20.2% 25.1% 16.3% 19.8%
Share of total units 17.5% 37.4% 15.3% 18.4% 11.3% 12.6%
Facilities constructed per year 18 102 172 171 111 119
Units constructed per year 2,671 9,127 9,341 8,966 5,526 5,040
1Production for the most recent phases overlapped.2 Data for 1999 are not available. 3 Between 2000 and 2006, this program contributed 52 percent of all units and 46 percent of all multifamily properties financed by HUD. BSources: Heumann, Leonard, Karen Winter-Nelson, and James Anderson (2001) The 1999 Survey of Section 202 Housing for the Elderly. AARP Public Policy Report #2001-02. Washington DC: AARP; and special tabulations by PD&R staff.
Mixed Finance Program. Authorized in 2000, HUD’s Mixed Finance Program combines Section 202 funds with tax credits to create for-profit developments. Combining these funds with other sources of funds is allowed, but not required. Each individual State determines which costs must be paid from the developer's fee. A developer's fee is determined by the State tax credit agency, but cannot exceed 15 percent of the total replacement cost of a project. In addition to profit and external costs, this fee may cover such costs as staff overhead associated with putting a deal together and the ongoing additional monitoring costs associated with managing the asset. This fee typically comes from the syndication of the tax credits. If there are no tax credits, it can come from other sources that developers may find, but not the capital advance, project rental assistance or the tenant rents associated with the Section 202/811 capital advance assisted units. 22
F
22 For final regulations, see: Federal Register 7, no. 176, September 13, 2005, p. 54200. The FY 2007 NOFA language provides bonus points to nonprofit organizations that will utilize funding from other sources. One point is assigned to proposals that will provide 6 to 10 percent of capital advance amount from other sources; two points for proposals that provide 11 to 15 percent from other sources; three points for proposals that provide 16 to 20 percent from other sources; four points for proposals that provide 21 to 25 percent from other sources; and five points for proposals that provide over 25 percent from other sources. This is expected to help to increase the number of units supportable through program funds, and also will help to preserve the alliances between Section 202 sponsors and other State, local and private entities that have developed in recent years.
20

This is a relatively new program within the Section 202 program. HUD recently developed underwriting instructions, to be incorporated in a Handbook that is expected in 2009. To date, 46 projects have been funded under this program, and ten have gone to closing. In FY 2005, nine were funded, and an additional eleven were funded in FY 2006. This number is expected to rise appreciably, once developers have had a chance to learn how the program works and have seen past successes.
Section 202 Program Funding. In FY 2006 and again in FY 2007, $742 million was appropriated for the Section 202 program. However, this amount is used to fund amendments to capital advances made in prior-year project processing, service coordinators, amendments to project rental assistance contracts, assisted living conversion, predevelopment grants, and several other purposes. 23 The amount availableF
to fund new Section 202 projects was $476 million in FY 2006, and was $473.1 million in FY 2007.
BPersons Eligible to Participate
Elderly households are eligible to apply for Section 202 assistance if their incomes are less than 50 percent of the area median family income, adjusted for household size. Determinations of age eligibility are made on the basis of the household head, spouse or co-head.
Data from the 2005 American Housing Survey indicate that, of the 12.5 million elderly households with very low incomes, an estimated 3.8 million are renters (see Table 1-14, at the end of this chapter). About 737,000 of elderly renters subsist on incomes that are less than half of the official poverty level. 24
F
Nearly half of elderly renters with very low incomes have priority housing problems, meaning that they pay more than 50 percent of their incomes for housing or else live in severely inadequate housing, with nearly all suffering from high rent burden. Slightly
23 In his testimony on September 6, 2007 in front of the Committee on House Financial Services Subcommittee on Housing and Community Opportunity, Steve Protulis, Executive Director, Elderly Houisng Development and Operations Corporation, noted that new Section 202/PRAC communities do not have sufficient funding to include service coordinators and are not eligible for the annual Service Coordinator competitive grant program. Added operational increases in health benefits for staff, plus increased property taxes and utilities, have left many new projects struggling to meet the basic needs of the properties. See: CQ Congressional Testimony at http://www.knowledgeplex.org/news/816881.html.
24 Very low-income is an annual household income up to 50 percent of median income for households in the area in which the property is located. See also: Bogdon, Amy S. et al. (2001) “Exploring the Housing Needs of Elderly Renters,” Journal of Housing for the Elderly 15, 1/2: 111-130.
21

more than two-fifths of all elderly renters with very low incomes live in central cities. Fifty-five percent are women living alone.
Households of the very aged renters, who are 80 years and older, comprise about a third of the very low-income elderly renters (Table 1-15). Nearly half pay more than 50 percent of their incomes for housing. About one third live in central cities. Nearly two-thirds are women living alone.
There are an additional 8.9 million elderly homeowner households with very low incomes. About 1.3 million of these households subsist on incomes that are less than half of the official poverty level. Nearly two-fifths of elderly homeowners with very low incomes have priority housing problems, paying more than 50 percent of their incomes for housing or living in severely inadequate housing, with nearly all suffering from high cost burden. About 23 percent of elderly homeowners with very low incomes live in central cities. Single elderly women comprise 43 percent of very low income elderly homeowners.
BNumbers of Properties and Units in the Section 202 Program
As of 2006, there were approximately 6,000 properties providing Section 202 housing (see Table 1-16 at the end of this chapter). These included about 4,000 properties developed as Section 202/8 housing, and about 2,000 properties developed under the Section 202/PRAC housing after enactment of the Cranston-Gonzales National Affordable Housing Act of 1990 (NAHA). 25 Tenant data are available on approximately 302,000 households, including 263,000 with a head, spouse or co-head age 62 or older. (The remainder are non-elderly with a disability.) There are approximately 176,000 elderly households in the Section 202/8 housing and 87,000 in the Section 202/PRAC housing. The completeness of reporting is very high, with nearly all properties fully reported.
BComparisons to other programs. As of 2006, HUD rental assistance programs assist approximately 1.3 million elderly households. These programs are the Section 202 program, other private-owner multifamily assisted housing, the Housing Choice Voucher Program (formerly known as Section 8), and public housing. 26 Twenty percent are in F
Section 202 housing. In comparison, there are an estimated 3.8 million very low-income
25 Section 202 loan projects may include disabled non-elderly people, but Section 202/PRAC projects do not. There are an additional 80 properties developed prior to 1974 that are currently under management, but contain some Section 8 or other rental assistance contracts. These properties are not required to provide data to the Department on characteristics of tenants.
26 This estimate includes all Section 202 housing and all reported units occupied by elderly households in other programs included in Table 1-16. Elderly households are those with a head, spouse or co-head age 62 or older.
22

elderly renters and 8.8 million very low-income elderly homeowners nationally who are unassisted. Of these 1.4 million renters and 3.2 million owners have priority housing problems (see Table 1-14).
The number of elderly households assisted by the Section 202 program is somewhat smaller than the number assisted by the Housing Choice Voucher (HCV) Program and public housing. As of 2006, there were approximately 263,000 households living in Section 202 housing. There were 334,000 elderly households assisted with vouchers, and 305,000 in public housing. HUD’s multifamily assisted programs, including Section 8 project based assistance, Section 236 housing and Section 221(d)(3) Below Market Interest Rate (BMIR) housing, provided assistance to 422,000 elderly households.
The Section 202 residents are somewhat older than the elderly served by other programs, with a median age of 74 years. 27 The median age of those receiving vouchers is 69, and F
70 for those in public housing. However, for those in other multifamily housing, the median is also 74.
The Section 202 program and other assisted multifamily housing programs serve a somewhat different population than the HCV program and public housing. Even though all groups are predominantly women living alone with incomes between $5,000 and $15,000, Section 202 residents are less likely to be minorities (39 percent) than elders in public housing (61 percent) or with vouchers (52 percent). Elderly households participating in the HCV program are three times more likely to consist of households with 2 or more people (26 percent) than we see in the Section 202 program (8 percent).
Households in Section 202 housing have shorter average tenure in the program (5.5 years) than elders in public housing (12.5 years) or using vouchers (7.4 years). This is due to differences in age when entering these programs. Some public housing and voucher recipients could have been admitted to those programs many years prior to attaining their 62nd birthday, which is currently not the case for Section 202 tenants.
Residents in public housing were more than twice as likely as Section 202 residents to have received assistance for 10 or more years (43 percent vs. 18 percent). Tenure of elderly voucher holders and elders in other multifamily housing was somewhat longer than for Section 202 residents, with 26 percent and 32 percent, respectively, receiving benefits for 10 or more years. Median tenure of public housing residents was double that of Section 202 residents, 8.1 and 4 years, respectively.
Section 202 residents appear to have been more likely than voucher holders to have been in the labor force when they were younger, or part of a household with a worker. Section 202 tenants were nearly twice as likely as elderly users of housing vouchers to receive any income from a pension (23 vs. 14 percent). Social Security was the most frequent
27 The median age for the Section 202 program inTable 1-16 is somewhat understated, as this includes non-elderly, disabled program participants. We estimate that median age for elderly only is 76 years.
23

primary source of income for all groups. However, it was the primary source of income for 77 percent of Section 202 residents, but only for 62 percent for voucher holders. 28
F
Variation in tenant characteristics by size of Section 202 property. As of 2006, of the approximately 6,000 properties received assistance from the program, 38 percent contained over fifty units (see Table 1-17). More than two-thirds (71 percent) of the elderly households assisted by the Section 202 program lived in these large properties. Slightly more than a quarter (26 percent) lived in properties with 21 to 50 assisted units. Three percent of elderly households lived in properties with twenty or fewer assisted units. The vast majority, 87.8 percent, of households in these very small properties are occupied by disabled people who were under 62 years at admission.
The characteristics of tenants in small properties differed from those in large properties in several respects. As expected, the tenants in smaller properties were more likely to live in rural (i.e. non-metropolitan) than central city locations. Forty-five percent in properties with 10 to 20 units were located in the rural areas, while less than ten percent in properties with more than fifty units were in rural locations.
Thirty-five percent of households lived in very large properties, with 100 or more units. Of these, a remarkable thirty-six percent of residents were age 80 years or older. Two-fifths were ethnic/racial minorities, while about one-quarter in the smaller properties were minorities. Twenty-three percent lived in large properties for ten or more years, while the program’s average for this length of time was eighteen percent. That is, length of stay tended to be somewhat longer in the larger properties.
Women made up more than two-thirds of tenants in buildings with more than twenty units. This dropped to 57 percent in buildings with ten to twenty units, but this difference may be due to the fact that nearly half (i.e. 45.5 percent) of the tenants in these buildings are disabled people under the age of 62. 29
F
BProviding Assistance to Frail Elderly Persons
BIn 2006, about 19 percent of all persons admitted to Section 202 housing were age 80 or older (see Table 1-16). This information comes from HUD’s automated tenant data systems, which provide very good information on age, but no information on frailty. In 2006, about 96,000 people aged eighty or older were assisted by the Section 202 program
28 Voucher holders were almost twice as likely to receive income from SSI than Section 202 households (50 vs. 29 percent). Data from REMS and TRACS for 2006 demonstrate that 44 percent of the elderly households with vouchers who receive SSI payments are in California or New York, States that provide substantial supplements to SSI. 29 Many of these projects are group homes developed for nonelderly disabled persons prior to the PRAC phase of the program. Under the 202/PRAC program, most small projects are located in nonmetropolitan areas. These projects often use waivers and admit near-elderly and low-income applicants .
24

(see Table 1-18). This was approximately one-third of all elderly households. Nearly all (92 percent) lived alone, and four-fifths were women. Nearly a third had received Section 202 assistance for ten or more years. About a third were ethnic/racial minorities. For eighty-three percent, Social Security was the primary source of income. Fourteen percent were in rural areas and 39 percent were in suburban areas. Sixteen percent were in the West, with the rest more or less evenly distributed throughout the other three census regions, about a quarter in each respectively. About a third lived on incomes under $10,000 per year and three-quarters had incomes under $15,000 per year.
BThe best source of information on frailty is included in national surveys of Section 202 housing conducted with funding from the American Association of Retired Persons (AARP) in 1983, 1988 and again in 1999. 30 The surveys looked at resident frailty in two F
ways. First, all three surveys of Section 202 facilities asked site managers to estimate the percentage of their residents that they considered frail and the percentage they considered independent. This question gave the managers no definition of frailty, allowing them to determine who was and was not frail. The second approach was adapted from measures of activities of daily living (ADLs) and instrumental activities of daily living (IADLs), for which managers were asked to indicate the percentage of residents having difficulty “often” or “always.” Responses to both of these questions indicate increased levels of resident frailty. 31
F
In the 1999 survey, managers reported that they considered 22.3 percent of residents frail, a considerable increase from the 13 percent reported frail in 1988. The cross-sectional comparison presented in Table 1-2 shows that for facilities in every program phase, the amount of frailty reported by managers was rising. In general, as the age of the facility increases, the percentage of residents that are frail also increases.
In the 1999 survey, managers reported that about a third of residents had trouble getting out of chairs and getting to and from places. Table 1-3 shows that about a quarter had difficulty doing housework; one-fifth had difficulties doing laundry; and nearly one-fifth had difficulties performing personal care, taking medications and preparing meals. 32
F
Table 1-4 shows that about half of elderly persons who are admitted to Section 202 housing move from a private house or apartment, and an additional one-quarter were previously living with family or friends. Just under a fifth move from other types of assisted housing, including other Section 202 projects. Less than five percent move from
30 Throughout the remainder of this chapter, description of the program characteristics of Section 202 housing is excerpted and summarized from Heumann et al. (2001).
31 The activities of daily living (ADLs) are bathing, dressing, toileting, transferring, and eating. The ADLs specified in the 202 regulation (24 CFR 891.205) are: eating, bathing, grooming, dressing, and home management activities. The instrumental activities of daily living (IADLs), include escort help for outside appointments, medication monitoring and cueing, bill paying, and health status monitoring.
32 Heumann et al. (2001) cited by Wilden and Redfoot op. cit.
25

-- --
institutional or rehab care. The PRAC phase of the program reports only 0.4 percent of residents moving from institutional or rehab care.
Table 1-2 Percent Reported Frail and Independent by Managers, by Program Phase
1959-74 1975-84 Sec 8
1985-88 Sec 8
1989-94 Sec 8
1993-98 PRAC All projects
% independent 1999 70.4 % 70.1 % 69.4 % 73.9 % 77.0 % 71.6 %
% frail 1999 23.9 % 22.7 % 25.1 % 19.9 % 18.7 % 22.3 %
% frail 1988 15.1 % 14.5 % 10.1 % 13.0 % Source: Heumann, Leonard, Karen Winter-Nelson, and James Anderson (2001) The 1999 Survey of Section 202 Housing for the Elderly. AARP Public Policy Report #2001-02. Washington DC: AARP.
Table 1-3 Percent of Residents Having Difficulty Performing Various Activities,
As Reported by Manager, by Program Phase
1959-74 1975-84 Sec 8
1985-88 Sec 8
1989-94 Sec 8
1993-98 PRAC
1999 All projects
1988 All projects
Getting out of chairs 36.7 % 29.3 % 34.0 % 26.5 % 26.9 % 30.5 % 11.0 %
Getting to and from places 37.0 % 33.3 % 35.1 % 33.2 % 31.3 % 34.0 % 11.4 %
Performing personal care 21.1 % 20.7 % 19.7 % 14.1 % 13.4 % 18.5 % 4.9 %
Taking prescribed medications* 21.8 % 24.4 % 17.0 % 11.6 % 11.4 % 18.9 % NA
Preparing meals 25.6 % 18.8 % 18.2 % 14.4 % 15.9 % 18.7 % 5.4 %
Finding way to apartment 4.1 % 1.6 % 1.3 % 1.1 % 1.6 % 1.9 % 0.8 %
Remembering to do things 17.4 % 12.8 % 8.4 % 9.4 % 3.9 % 11.2 % 4.0 %
Doing laundry 24.1 % 22.7 % 18.1 % 20.8 % 18.1 % 21.3 % 6.5 %
Doing housekeeping 31.6 % 30.2 % 24.5 % 22.6 % 17.2 % 26.6 % 9.4 %
Average of all activities 24.4 % 21.5 % 19.6 % 17.1 % 15.5 % 20.2 % NA
Source: Heumann, Leonard, Karen Winter-Nelson, and James Anderson (2001) The 1999 Survey of Section 202 Housing for the Elderly. AARP Public Policy Report #2001-02. Washington DC: AARP.
26

Table 1-4 Previous Residence of Persons Entering Section 202 by Program Phase
1975-84 1985-88 1989-94 1992-98 1999 All 1988 All 1959-74 Sec 8 Sec 8 Sec 8 PRAC projects projects
Public housing 7.9 % 6.6 % 3.0 % 12.2 % 4.4 % 7.1 % 8.0 %
Institutional / rehab 5.9 % 2.6 % 3.0 % 6.9 % 0.4 % 3.8 % 2.6 % care
Family or friends 19.1 % 22.6 % 20.2 % 20.2 % 25.0 % 21.5 % 20.4 %
Other Section 202 7.6 % 10.9 % 11.3 % 10.0 % 18.4 % 11.1 % 9.4 % or Section 8 Private house or 55.2 % 54.4 % 51.4 % 45.4 % 49.0 % 51.7 % 52.1 %apartment Assisted living or 1.0 % 1.1 % 0.5 % 0.5 % 2.2 % 1.0 % NAcongregate care
Other 1.4 % 0.1 % 9.0 % 2.8 % 0.5 % 2.2 % 7.6 %
Don’t know 1.9 % 1.6 % 1.6 % 2.0 % 0.0 % 1.6 % NA
Source: Heumann, Leonard, Karen Winter-Nelson, and James Anderson (2001) The 1999 Survey of Section 202 Housing for the Elderly. AARP Public Policy Report #2001-02. Washington DC: AARP.
The 1999 survey results also indicate the types of housing need that influence residents' decisions to move to a Section 202 facility, as reported by the site managers whose job it is to screen applicants for admission (Table 1-5). Respondents were asked which of the following was the most important need influencing residents’ decision to move to their facility: financial assistance, support with frailty, increased social contacts, improved housing quality, or improved security. Financial support was the predominant reason for choosing Section 202 facilities, followed by needs for improved housing quality and improved security, both at 13.4 percent. Support with frailty was the next most common at 10.1 percent, and desire for increased social contacts was last at 8.4 percent. A similar pattern was found in 1988. The dominant needs of financial assistance with housing and higher quality and more secure housing are no surprise, since Section 202 housing residents generally have low incomes.
The earliest phase of the program (1959-1974), which predates the Section 8 income requirements, housed residents with higher average incomes than subsequent phases of the program. Properties developed during this period had the smallest percent of applicants whose primary need was reported by managers to be financial assistance (35.9 percent compared to 54.7 percent overall). In facilities built in the moderate-income phase of the program, an almost equal percentage of managers identified a primary need for supportive services (17.9 percent), increased social contacts (19.7 percent), and improved security (20.2 percent).
As noted above, the earliest facilities were larger and more likely to be in central cities than those built later. A higher percent of such facilities can attain scale economies in service delivery when compared to the newer and smaller facilities (see Table 2-3). Their
27

income streams from resident rents are also higher, which should make the provision of on-site congregate services more easily affordable. Frail applicants are more likely to be facility-bound, so projects offering on-site supportive services are more likely than other projects to attract applicants in need of such environments.
Table 1-5 Needs Influencing the Decision to Move to Section 202 Housing,
According to Building Managers by Program Phase
1959-74 1975-84 Sec 8
1985-88 Sec 8
1989-94 Sec 8
1993-98 PRAC
1999 All projects
1988 All projects
Financial assistance 35.9 % 57.3 % 56.5 % 66.5 % 52.7 % 54.7 % 60.9 %
Support with frailties 17.9 % 9.4 % 11.0 % 5.6 % 7.1 % 10.1 % 8.2 %
Increased social contacts 19.7 % 6.4 % 7.8 % 3.7 % 5.9 % 8.4 % 6.1 %
Improved housing quality 6.3 % 11.1 % 19.5 % 16.3 % 18.9 % 13.4 % 12.1 %
Improved security 20.2 % 15.8 % 5.2 % 7.9 % 15.4 % 13.4 % 12.6 %
Source: Heumann, Leonard, Karen Winter-Nelson, and James Anderson (2001) The 1999 Survey of Section 202 Housing for the Elderly. AARP Public Policy Report #2001-02. Washington DC: AARP.
Non-financial factors become more important as the ages of applicants increase. In particular, needs for supportive services and improved security were more important to older applicants than to those in their 60s. Table 1-6 shows that more than twice as many applicants over age 80 were reported as needing support with frailty (20.3 percent) than the three younger age groups (each under 10 percent).
Table 1-6 Needs Influencing the Decision to Move to Section 202 Housing,
According to Building Managers by Age of the Applicants
Applicant age Financial assistance
Support with frailties
Increased social contacts
Improved housing quality
Improved security
Under 62 64.8 % 9.4 % 2.7 % 20.0 % 3.1 %
62-69 64.0 % 2.7 % 9.1 % 16.0 % 8.3 %
70-79 51.7 % 7.7 % 11.6 % 13.8 % 15.2 %
80 or older 48.1 % 20.3 % 4.3 % 10.4 % 16.9 % Source: Heumann, Leonard, Karen Winter-Nelson, and James Anderson (2001) The 1999 Survey of Section 202 Housing for the Elderly. AARP Public Policy Report #2001-02. Washington DC: AARP.
28

BDemand for Section 202 Housing
Elders considering a move to Section 202 housing face very different housing outcomes, depending on the age and location of the property. This results from the statutory requirements and HUD implementation of the requirements during the separate stages of the program.
Project size has dropped throughout the history of the Section 202 program (see Table 17). Projects built before 1974 averaged 148 units. The average declined to 89 units for the low-income phase (between 1975 and 1984), declined still further to 54 units for 1985-88 and 52 units for projects built from 1989-1994, and reached an all time low of 50 units in the most recent phase, the PRAC phase. Throughout all phases of the Section 202 program, the percentage of small projects has increased. In the current Section 202/PRAC program, only 4 percent of facilities built have 100 or more units.
Table 1-8 Size of Section 202 Units, 1959-2006
�Type of unit 1959-74 1975-84 Sec 8
1985-88 Sec 8
1989-94 Sec 8
1993-98 PRAC
All projects up to 1999
2000-06 PRAC
Efficiency 59.4 % 7.5 % 21.8 % 14.5 % 0.5 % 15.5 % 1.6%
1-bedroom 38.7 % 90.8 % 77.6 % 84.3 % 98.3 % 83.1 % 98.1%
2-bedroom 2.0 % 1.7 % 0.6 % 0.9 % 1.2 % 1.2 % 0.1% Sources: Heumann, Leonard, Karen Winter-Nelson, and James Anderson (2001) The 1999 Survey of Section 202 Housing for the Elderly. AARP Public Policy Report #2001-02. Washington DC: AARP; and special tabulations by PD&R staff for 2000-2006.
Table 1-8 shows how policy regarding unit design has changed over the years. Efficiency apartments were very prevalent before 1975, when they accounted for 59.4 percent of the units. The number of efficiency units has decreased significantly in the program phases after 1974. Nevertheless, the share still varies significantly during these latter program phases from a high of 21.8 percent for 1985-1988 to virtual elimination as a design choice under Section 202/PRAC. In fact, under current PRAC regulations efficiency apartments are strongly discouraged.
Both the project size and unit design trends have profound effects as owners and managers try to provide supportive services to a resident population that is aging in place. Larger facilities are more likely than smaller buildings to have a critical mass of residents wanting supportive services as well as space to provide such services. As a result, they may have the ability to provide more on-site services. Larger facilities also tend to have more budgeting flexibility and service provision economies of scale when they provide on-site services for their residents, such as meals, which are often critical for averting unnecessary institutionalization. A minimum size whereby small facilities can generate sufficient demand and economies of scale to provide affordable on-site supportive services is a topic worthy of further research.
29

Demand for Section 202 housing has remained consistently strong. At the time of the 1999 survey, only 1.6 percent of all units were vacant, about the same as in 1988. Table 1-9 demonstrates that this increase is wholly attributable to vacancies in efficiency apartments. The vacancy rate for efficiency apartments increased from 2.7 percent in 1988 to 4 percent in 1999. The vacancy rate for one-bedroom units remained constant at a very low 1 percent.
The moderate-income phase of the program (1959-74) shows the highest vacancy rates of any phase of the program. This phase contains the facilities with the greatest number of efficiency units. Nevertheless, overall vacancy rates for efficiency units remain modest within these properties, and the vacancy rate for one-bedroom units has remained the same in the last two surveys, at a very low 1 percent.
The one-bedroom unit vacancy rate is a good indicator of the relative demand for similar units across time periods, since it provides a comparison of a standard unit. The extremely low vacancy rates found in all time periods indicate that demand remains very high. The lowest vacancy rates appear in low-income and cost-containment phases (the two earliest Section 8 phases), while the highest vacancy rate (1.4 percent) falls in the transition phase, the last Section 8 phase. The 1.1 percent vacancy rate for one-bedroom units in the oldest facilities shows that these units remain in high demand, despite their age and despite their smaller subsidy.
Table 1-10 shows that vacancy rates were lowest in metropolitan areas (including central cities and suburbs) of one million or more persons. 33 While still low, the rate was almost F
twice as high for communities in the three middle categories of 10,000 to 999,999 persons. Vacancy rates were highest in facilities located in the smallest towns and in rural communities below 10,000 persons. The vacancy rate for one-bedroom units remained under one percent for all community sizes except for the smallest category of under 10,000, where vacancy almost tripled to 2.1 percent.
Comparison of the one-bedroom vacancy rate shows that vacancies in small, rural communities (i.e. with populations under 10,000), while still very low at 2.1 percent, are substantially higher than the rates for all other locations.
Waiting lists for Section 202 facilities are long, especially when compared to the number of units becoming vacant each year. The relative dearth of vacancies each year means that applicants frequently wait over two years for a unit. Of facilities reporting in 1999, 83.9 percent reported having waiting lists that are exclusive to their facility. 34 TheF
description of waiting lists in 1999 was similar to that of 1988. The share of projects with
33 Results in the 1999 survey were based on community size as reported by Section 202 project managers.34 The analysis of waiting lists eliminated facilities that combine and share waiting lists with other projects, because those data could inflate the total waiting list figures and artificially decrease the percent of sites with small or no waiting lists. Even using this conservative method, long waiting lists continue to be the norm.
30

--
--
no waiting list, an indicator of projects with low demand, increased only slightly, from 7.1 percent in 1988 to 7.8 percent in 1999. Most of these projects are the oldest projects, concentrated in the first phase of the program.
Table 1-9 Section 202 Vacancy Rates, as of 1999
1999 1959-74 1975-84
Sec 8 1985-88
Sec 8 1989-92
Sec 8 1993-98 PRAC All
projects
1988 All projects
Overall1 3.0 % 1.0 % 1.6 % 1.6 % 1.2 % 1.6 % 1.4 %
Efficiencies/studios 3.7 % 4.7 % 5.1 % 3.2 % 2 4.0 % 2.7 %
One bedroom 1.1 % 0.8 % 0.6 % 1.4 % 1.2 % 1.0 % 1.0 %
Two bedrooms 0.3 % 0.6 % 0.0 % 2.2 % 2 0.7 % 1.7 % 1 Sum of all vacant units for the period divided by the sum of total units for the period 2 Efficiency units and 2-bedroom units were eliminated from the Section 202 program with the PRAC phase. Source: Heumann, Leonard, Karen Winter-Nelson, and James Anderson (2001) The 1999 Survey of Section 202 Housing for the Elderly. AARP Public Policy Report #2001-02. Washington DC: AARP.
�Table 1-10 Vacancy Rate by Size of City or Metropolitan Area
1,000,000 or 250,000- 50,000- 10,000- Under more 999,999 249,999 49,999 10,000
Overall 0.8 % 1.8 % 1.5 % 1.2 % 3.2 %
One Bedroom 0.7 % 0.7 % 0.9 % 0.7 % 2.1 % Source: Heumann, Leonard, Karen Winter-Nelson, and James Anderson (2001) The 1999 Survey of Section 202 Housing for the Elderly. AARP Public Policy Report #2001-02. Washington DC: AARP.
Table 1-11 shows that the greatest number of persons on waiting lists for each vacancy are in the largest metropolitan areas (central cities and suburbs) of a million of more persons (10.7 applicants per annual vacancy) and in metropolitan areas of 50,000 to 249,999 (11.2 applicants). The lowest number of older persons waiting per vacant unit was found in communities with populations under 10,000 (1.7 applicants).
The comparison of ratios reported in 1988 and 1999 for communities of the same size are very similar for the more populous areas. However, the number waiting for each vacancy has fallen in communities below 50,000 population and has declined by half in communities under 10,000 in size. The 1983, 1988, and 1999 studies of Section 202 housing have all found the same pattern of lower demand and shorter waiting times for units in rural areas than in urban areas and higher demand for the newest facilities. As Heumann et al. have pointed out, the newest projects have the longest waiting lists per
31

yearly vacancy overall, but even the newest projects located in rural areas have small numbers of applicants waiting for each yearly vacancy.
Table 1-11 Number of Applicants Per Annual Vacancy, by Program Phase and Size of Community
�City or Metropolitan area
size 1959-74 1975-84
Sec 8 1985-88
Sec 8 1989-94
Sec 8 1993-98 PRAC
1999 All projects
1998 All projects
1,000,000 or more 9.0 7.4 7.0 16.1 14.0 10.7 11.5 250,000-999,999 2.8 2.6 3.4 13.0 12.5 7.0 7.3
50,000-249,000 2.7 15.4 9.9 7.6 15.3 11.2 8.5
10,000-49,000 2.8 3.9 5.7 6.2 8.0 5.4 6.7
Under 10,000 4.9 1.4 1.9 1.0 1.8 1.7 4.0
Total 4.6 6.2 4.7 7.6 10.0 6.7 8.1 Source: Heumann, Leonard, Karen Winter-Nelson, and James Anderson (2001) The 1999 Survey of Section 202 Housing for the Elderly. AARP Public Policy Report #2001-02. Washington DC: AARP.
Available data on the length of time current applicants have been on the waiting list for a unit show that many applicants must wait a long time before a Section 202 unit becomes available. Long waits can present major difficulties for older persons, particularly if they are frail and in need of a barrier-free and service-enriched environment. Table 1-12 presents information on the length of time on waiting list for current applicants by size of community. Table 1-12 shows that projects in the largest metropolitan areas of one million or more population could not accommodate even half of their applicants within two years (45.2 percent). On the other hand, 79.9 percent of applicants located in small communities (10,000 to 49,999 population) and 89.9 percent of applicants in rural communities (under 10,000 population) had been waiting less than two years at the time of the survey. 35
F
The turnover rate is the share of units that becomes vacant in any given year. As one might expect, turnover is highest in the Section 202 facilities built in the earliest years of the program (see Table 1-13), which have the oldest and most frail residents. Facilities built in the PRAC period have the lowest annual turnover rate. Overall, the turnover rate has gone up from 13.4 percent in 1988 to 15.2 percent in 1999, a change that is consistent with residents who are now older and more frail.
35 Heumann et al. note that data on the length of time current applicants have been on the waiting list for a unit show the status of current applicants, rather than entering residents, and as such they are considered likely to undercount the length of time actually spent waiting for a unit.
32

�Table 1-12 Length of Time on Waiting List by Size of City or Metropolitan Area
1,000,000 or 250,000- 50,000- 10,000- Under 1999 All 1988 All more 999,999 249,999 49,999 10,000 projects projects
Under 2 years 45.2 % 59.6 % 64.1 % 79.9 % 89.9 % 54.4 % 63.3 %
2-4 years 33.0 % 29.7 % 25.1 % 14.6 % 8.4 % 28.3 % 26.9 %
Over 4 years 21.8 % 10.7 % 10.8 % 5.4 % 1.8 % 17.2 % 9.9 %
Total 100.0 % 100.0 % 100.0 % 100.0 % 100.0 % 100.0 % 100.0 % Source: Heumann, Leonard, Karen Winter-Nelson, and James Anderson (2001) The 1999 Survey of Section 202 Housing for the Elderly. AARP Public Policy Report #2001-02. Washington DC: AARP.
The reasons units become vacant have remained much the same between 1999 and 1988. The most common reason units become vacant is death of a resident (33.4 percent in 1999 and 32.6 percent in 1988). Transfer to a nursing home ran a close second (30.4 percent in 1999 and 31.3 percent in 1988), followed by moves to the home of a relative (13.8 percent in 1999).
Among vacated units, only 8.7 percent of former residents moved to an independent living situation, either a housing project for independent persons or a private home, a decrease from 11.1 percent in 1988. The last row of Table 1-13 indicates that moves to more supportive environments represent about half of residents who leave Section 202 facilities (52.4 percent in 1999, and 49.2 percent in 1988). Once deaths are excluded, moves for more support represent about three-fourths of the moves (78.7 percent in 1999 and 73 percent in 1988). The earliest projects show the highest percent of moves to more supportive service environments (57.7 percent). This percentage steps down with each consecutive phase of the program, as residents get younger and more independent, and the PRAC phase showing just 46.4 percent moving due to support needs.
The information presented in this chapter clearly reflects a continued need for affordable housing for older persons. This is reflected in the waiting list information for Section 202 facilities, and also in the eligibility data presented in Table 1-14. These data suggest that, for every elderly household assisted in Section 202 or other HUD rental assistance programs, there are nearly five other unassisted, elderly very low-income owners or renters with priority housing problems. In recent years, HUD has typically needed to reject more than half of all Section 202 development applications, solely because of lack of funding. 36
From Fiscal Year 2000 to Fiscal Year 2007, HUD’s Office of Housing received 2,614 applications for funding. Of these, 1126, or 43 percent, were funded. Appropriations for Fiscal Years 2006-2008 were essentially flat, at about $735 million per year (see: www.ruralhome.org).
33
36

Table 1-13 Annual Turnover Rate and Reasons for Becoming Vacant by Program Phase
�Annual Turnover Rate 1999 All and Reasons for 1959-74 1975-84 1985-88 1989-94 1993-98 projects 1988 All Becoming Vacant by Sec 8 Sec 8 Sec 8 PRAC projects Program Phase
�% of units that become 17.8 14.9 % 16.4 % 15.1 % 12.8 % 15.2 % 13.4%vacant per year �Reason for vacancy:
�Resident death 27.2 % 35.0 % 31.1 % 35.5 % 37.4 % 33.4 % 32.6 %
�Transfers to nursing 32.5 % 32.6 % 30.9 % 27.3 % 24.6 % 30.4 % 31.3 %home �Moves to home of 12.8 % 14.5 % 12.9 % 12.6 % 16.1 % 13.8 % 13.6 %relative
�Moves to independent 4.0 % projects 5.1 % 6.5 % 5.4 % 5.5 % 5.2 % 6.3 %
�Moves to a facility 12.4 % offering more services1 6.7 % 8.2 % 9.0 % 5.7 % 8.2 % 4.3 %
�Moves to private home 2.6 % 2.7 % 3.5 % 5.0 % 3.5 % 4.8 % (not relative or friend) 5.5 %
�Eviction or unknown 2.8 % 1.5 % 3.1 % 3.6 % 2.1 % 2.4 % 2.9 %
�Other reasons 2.8 % 2.0 % 4.7 % 3.0 % 3.6 % 2.9 % 4.3 %
�TOTAL 100.0% 100.0 % 100.0 % 100.0 % 100.0 % 100.0 % 100.0 % �Total need for more services2 57.7 % 53.8 % 51.9 % 49.0 % 46.4 % 52.4 % 49.2 %
1In 1998. this item was “moves to congregate housing.” 2Includes moves to a nursing home, to the home of a relative or friend, or to a facility with more services Source: Heumann, Leonard, Karen Winter-Nelson, and James Anderson (2001) The 1999 Survey of Section 202 Housing for the Elderly. AARP Public Policy Report #2001-02. Washington DC: AARP.
34

Table 1-14 �Housing Problems and Characteristics of Very Low Income Elderly Households,
Age 62 and Older, 2005*
�Total Elderly Renters Elderly Owners Households (in thousands): 12,545 3,762 8,783 Number of Persons 18,974 5,099 13,874 Persons/Household 1.51 1.36 1.58
Unassisted with Priority Problems 4,585 1,364 3,222 Unassisted with Other Problems 2,753 567 2,186 Unassisted with No Problems 3,800 425 3,375 Receives Housing Assistance 1,407 1,407
Any with Priority Problems: 5,036 1,815 3,222 Rent/cost Burden >50% of Income 4,893 1,755 3,138 Severely Inadequate Housing 257 117 140 [Rent/cost Burden only] 4,561 1,556 3,005
Any with Other (non-Priority) Problems: 3,181 995 2,186 Rent/cost Burden 30–50% of Income 2,955 937 2,019 Moderately Inadequate Housing 320 109 211 Crowded Housing 26 16 10 [Rent/cost Burden only] 2,843 878 1,965 Any with No Problems 4,328 952 3,375
Other Characteristics: One Person, Female 5,873 2,085 3,788 One Person, Male 1,796 742 1,054 2+ Person, with Children 556 175 381 2+ Person, without Children 4,319 759 3,559 AFDC/SSI Income 235 132 102 Social Security Income 11,243 3,143 8,100 Income Below 50% Poverty 2,063 737 1,326 Income Below Poverty 4,745 1,763 2,981 Income Below 150% of Poverty 8,654 2,858 5,796 High School Graduate 7,707 2,101 5,606 Two+ Years Post High School 1,662 514 1,148 Earnings at Minimum Wage: At Least Half Time 1,073 356 716 At Least Full Time 653 240 413 Earnings Main Source of Income 876 318 558 Housing Rated Poor 200 110 90 Housing Rated Good+ 10,744 3,159 7,585
35

Neighborhood Rated Poor 316 104 212 Neighborhood Rated Good+ 10,432 3,063 7,369 In Central Cities 3,641 1,610 2,031 Suburbs 5,430 1,347 4,083 Midwest 2,858 775 2,083 Northeast 2,956 1,140 1,816 South 4,521 1,076 3,445 West 2,210 771 1,439 White, non-Hispanic 9,593 2,457 7,135 Black, non-Hispanic 1,653 672 982 Other, non-Hispanic 464 205 259 Hispanic 835 428 407 * Head or Spouse is 62 or older. Very low-income is an annual household income up to 50 percent ofmedian income for households in the area in which the property is located. Source: Special tabulations of the 2005 American Housing Survey by PD&R staff. Note: “Priority Problems” are defined as severely inadequate housing or rent burden bigger than 50% of the income. “Rent burden,” in the case of a renter it is defined as (monthly rent + other costs, such as utility) / (monthly income). In the case of an owner it is (monthly mortgage payment + other costs) / (monthlyincome). “Any” means both assisted and unassisted.
�Table 1-15 �Housing Problems and Characteristics of Very-Low-Income Elderly Household,
Age 80 and Older, 2005*
�Total Elderly Renters Elderly Owners Households (in thousands): Number of Persons Persons/Household
4,338 5,968 1.38
1,309 1,596 1.22
3,029 4,372 1.44
Unassisted with Priority Problems 1,520 485 1,034
Unassisted with Other Problems 1,017 228 789 Unassisted with No Problems 1,374 169 1,206 Receives Housing Assistance 428 428 0
Any with Priority Problems: 1,684 650 1,034
Rent/cost Burden >50% of Income 1,639 632 1,007 Severely Inadequate Housing 80 30 51 [Rent/cost Burden only] 1,533 579 954
Any with Other (non-Priority) Problems: 1,112 323 789
Rent/cost Burden 30–50% of Income 1,020 304 716 Moderately Inadequate Housing 116 32 83 Crowded Housing 6 6 0 [Rent/cost Burden only] 995 289 706 Any with No Problems 1,542 337 1,206
36

Other Characteristics: One Person, Female 2,363 846 1,517 One Person, Male 596 225 371 2+ Person, with Children 82 19 63 2+ Person, without Children 1,296 219 1,078 AFDC/SSI Income 47 29 18 Social Security Income 4,126 1,217 2,909 Income Below 50% Poverty 712 241 471 Income Below Poverty 1,581 564 1,017 Income Below 150% of Poverty 3,005 965 2,039 High School Graduate 2,512 754 1,758 Two+ Years Post High School 488 183 306 Earnings at Minimum Wage:
At Least Half Time 138 40 98 At Least Full Time 78 27 50
Earnings Main Source of Income 96 31 65 Housing Rated Poor 59 25 33 Housing Rated Good+ 3,746 1,121 2,625 Neighborhood Rated Poor 80 21 60 Neighborhood Rated Good+ 3,700 1,106 2,593 In Central Cities 1,177 475 701 Suburbs 1,987 508 1,479 Midwest 1,036 295 741 Northeast 1,078 412 666 South 1,487 366 1,121 West 737 236 501 White, non-Hispanic 3,691 1,030 2,661 Black, non-Hispanic 389 143 246 Other, non-Hispanic 88 59 29 Hispanic 170 77 93 * Head or Spouse is 80 or older. Very low-income is an annual household income up to 50 percent of median income for households in the area in which the property is located. Source: Special tabulations of the 2005 American Housing Survey by PD&R staff Note: “Priority Problems” are defined as severely inadequate housing or rent burden bigger than 50% of the income. “Rent burden,” in the case of a renter it is defined as (monthly rent + other costs, such as utility) / (monthly income). In the case of an owner it is (monthly mortgage payment + other costs) / (monthly income). “Any” means both assisted and unassisted.
37

�Table 1-16 �Selected Characteristics of Section 202 Households and
�Elderly Households in Other Assisted Housing, December 2006
Other Private- Section 8
�Section 202/8 Section 202 PRAC
Section 202, All
Owner, Multifamily
Assisted1
Public Housing1
Housing Choice
Vouchers1
Number of properties 4,075 2,020 6,095 16,958 NA NA Number of units 230,778 91,333 322,111 1,341,677 NA NA Number of assisted unitsTotal number of households2
Property Type 217,327 213,884
90,318 87,843
307,645 301,727
1,136,200 1,066,034
NA 305,020
NA 334,445
Reported households with elderly (age 62+) head, co-head, or spouse 175,876 86,828 262,704 422,055 305,020 334,445 % under 62 years* 18.4 2 13.6 7.9 17.1 19.7 % age 62-64 5.2 5.4 5.3 9.4 12.3 13.7 % age 65-69 12.6 18 14.2 17.2 19.2 19.4 % age 70-74 15.4 22.7 17.5 17.9 16.8 15.9 % age 75-79 % age 80-84 % age 85 or older
Age Distribution (persons)
17.3 15.9 15.3
22.3 16.9 12.6
18.8 16.2 14.5
18.1 15.6 13.9
14.5 11.1
9
13.6 10.2
7.6 �Total 100% 100% 100% 100% 100% 100%
Mean age 71.4 75 72.4 71.9 66 64.2 Median age 74 75 74 74 70 69 % 1-person household 92.8 91.5 92.4 85.5 78.8 74 % 2 or more persons in household Household Size 7.2 8.5 7.6 14.5 21.2 26 Total 100% 100% 100% 100% 100% 100%
Gender (persons)
% Male % Female Total
30.0 70.0
100%
25.9 74.0
100%
28.8 71.1
100%
28.3 71.7
100%
33.6 66.4
100%
29.2 70.8
100% % White and non-Hispanic 63.4 55.8 61.2 58.5 39.1 48.2
Reference % Black and non-Hispanic 18.6 21.3 19.4 20.6 33.2 25.3 % Other and non-Hispanic % Hispanic
Person’s Race / Ethnicity
5.8 12.2
8.5 14.4
6.6 12.9
7.8 13.1
4.3 23.4
7.7 18.8
Total 100% 100% 100% 100% 100% 100% % less than $5,000 2.6 2 2.5 1.9 3.3 1.6 % $5,000 to $9,999 45.6 42.1 44.6 42 47.9 46.2 % $10,000 to 14,999 33.9 35.5 34.3 33.7 26.3 32.5
Household Income
Distribution
% $15,000 to $19,999 % $20,000 to $24,999 % $25,000 and over
12.5 3.8 1.5
15.1 4
1.3
13.3 3.9 1.5
14.5 5
2.9
11 4.8 6.7
13.1 3.9 2.8
Total 100% 100% 100% 100% 100% 100%
Mean income $11,229 $11,599 $11,337 $11,989 $12,608 $11,632 Median income $10,075 $10,514 $10,236 $10,526 $9,852 $10,034
38

�Table 1-16 (continued)
Other Private- Section 8
Section 202/8 Section 202 PRAC
Section 202, All
Owner, Multifamily
Public Housing
Housing Choice
Assisted Vouchers % wages 1.7 1.4 1.6 2.5 6.2 3.9 % welfare 0.6 0.4 0.5 0.5 1.0 0.6 % social security % SSI
Primary Income Sources
76.2 16.0
78.8 13.8
76.9 15.3
76.1 15.2
68.0 17.9
61.9 27.3
% pension 3.6 3.6 3.6 3.8 3.4 2.1 % other/none (includes no primary) 2.0 1.9 2.0 2.0 3.5 4.1 Total 100% 100% 100% 100% 100% 100% % wages 5.8 3.4 5.1 4.8 10.1 8.2 % welfare 2.5 1.8 2.3 2.9 10.2 15.1
Any Income % social security 82.7 86.1 83.7 83.9 81.0 73.7 Sources % SSI 30.0 27.2 29.2 29.0 37.3 50.0
% pension 22.0 24.8 22.8 24.3 19.7 14.2 % other/none 3.7 4.2 3.8 4.8 8.0 9.7 Central city (MSA) 51.1 50.0 50.8 51.4 55.9 48.9
Metropolitan Suburban (MSA) 33.4 36.4 34.2 33.6 22.8 37.4 Status Rural (non-MSA) 15.5 13.6 15.0 14.9 21.3 13.7
Total 100% 100% 100% 100% 100% 100% Northeast 24.3 25.2 24.6 31.7 39.5 25.1 Midwest 25.3 21.0 24.0 27.5 19.6 16.2
Location by South 31.0 30.2 30.8 20.0 26.1 24.8 WestCensus Region 15.6 18.9 16.6 16.9 7.0 29.4 Trust Territory 3.7 4.7 4.0 3.9 7.9 4.3 Total 100% 100% 100% 100% 100% 100% % Less than 1 year 21.6 27.5 23.3 15.6 12.0 11.3 % 1-2 years 10.6 14.3 11.7 8.7 7.0 7.4 % 2-3 years 8.8 11.1 9.5 7.7 6.2 7.5 % 3-4 years 7.7 9.8 8.3 6.8 5.7 9.4 % 4-5 years 6.4 7.5 6.7 6.3 5.1 9.8 % 5-10 years Number of years 21.7 24.4 22.5 23.3 20.9 28.2 % 10-15 years % 15-20 years
living in project (tenure)3
12.5 6.7
5.4 0.0
10.4 4.8
13.7 7.8
13.0 8.1
12.3 8.0
% 20 or more years 4.0 0.0 2.9 10.1 21.9 6.0 Total 100% 100% 100% 100% 100% 100%
Mean tenure 6.2 3.7 5.5 8.2 12.5 7.4 Median tenure 4 3 4 6 8.1 5.2
39

�Table 1-16 (continued)
Other Private- Section 8 Section 202 Section Owner, Public HousingSection 202/8 PRAC 202, All Multifamily Housing Choice
Assisted Vouchers % under 62 24.4 1.4 16.7 3.4 0.8 1.4 % age 62-64 12.2 14.9 13.1 17.7 20.4 19.3 % age 65-69 17.4 23.5 19.4 23.8 26.1 25.6
Age of % age 70-74 14.9 21.2 17 19.4 19.3 19.5 13.5 17.5 14.8 16.6 15.4 15.8household head % age 75-79
when admitted % age 80-84 10.2 12.7 11 11.5 10.6 11 in 2006 (new % age 85 or older 7.4 8.7 7.8 7.6 7.4 7.4
admissions only)Total 100% 100% 100% 100% 100% 100%
Mean age 66.9 73.1 69 72.1 72.1 72.2 Median age 69 72 70 71 71 71 % under 62* 23.8 1.9 17.4 21.2 40.9 32.7 % age 62-64 13.4 15.4 14.0 16.4 14.4 14.4 % age 65-69 20.5 25.4 21.9 22.6 18.1 19.8
Age of % age 70-74 17.0 22.7 18.6 17.2 12.2 14.7 household head % age 75-79 12.8 17.7 14.2 12.2 7.9 9.9
when first admitted to % age 80-84 8.0 11.0 8.8 7.0 4.3 5.4
project (current % age 85 or older 4.5 6.0 4.9 3.4 2.2 2.7 households)3 Total 100% 100% 100% 100% 100% 100%
Mean age 66.1 72.3 67.9 67.7 61.6 66.0 Median age 68.0 71.5 69.2 67.6 63.8 65.6
1 Section 202/8 refers to projects developed with loans and Section 8 rental assistance. Section 202/PRAC refers to projects developed with capital advances and project rental assistance contracts. Private owner multifamily assisted units are in projects developed under HUD programs including Section 8 New Construction and Substantial Rehabilitation, Loan Management Setaside Program, Section 236, and Section 221(d)(3) Below Market Interest Rate housing. Tenant characteristics data presented above are for households in which the head, spouse or co-head is age 62 or older. 2 Households receiving assistance in Section 202/8 properties may include a head, spouse or co-head who is nonelderly with disability. B
3 Note: The term “person” refers to individuals’ characteristics, not those of households. Persons under age 62 may include dependent children. Source: Special tabulations by PD&R staff.
40

BTable 1-17 Characteristics of Residents of Section 202 Properties,
by Number of Units in Property, December 2006
Less than 10 Section 10-20 units 21-50 units 51-99 units 100+ unitsunits in in property in property in property in property 202, property all
Property Type
Number of properties Number of units Number of assisted units Total number of households2
440 3,070 2,893 3,151
1,098 16,799 16,304 16,164
2,215 82,271 81,029 80,102
1,467 102,899 101,197 99,194
875 117,072 106,222 103,116
6,095 322,111 307,645 301,727
Reported households with elderly (age 62+) head, spouse, or cohead
610 7,954 67,584 92,622 93,934 262,704
% under 62 80.8 51.7 16.8 7.3 9.4 13.6
Age Distribution (persons)
% age 62-64 % age 65-69 % age 70-74 % age 75-79 % age 80-84 % age 85 or older
4.4 5.1 3.9 2.7 1.6 1.4
5.6 10.5
9.8 9
7.1 6.3
5.9 14.6 17.2 17.7 15.2 12.7
5.2 15.5 19.8 20.8 17.1 14.4
4.8 13.4 17.2 19.6 17.9 17.7
5.3 14.2 17.5 18.8 16.2 14.5
Total 100% 100% 100% 100% 100% 100%
Mean age 49.0 58.1 70.9 74.4 74.7 72.4 Median age 48.0 60.0 73.0 75.0 76.0 74.0
Household % 1-person household 97.7 95.0 94.1 91.8 91.2 92.4 Size % 2 or more persons in household 2.3 5.0 5.9 8.2 8.8 7.6
Total 100% 100% 100% 100% 100% 100%
Gender (persons)
% Male % Female
Total
52.2 47.8
100%
42.8 57.2
100%
28.3 71.6
100%
27.4 72.4
100%
27.6 72.3
100%
28.8 71.1
100%
% White and non-Hispanic 76.9 74.7 70.5 54.0 58.4 61.2 Race /
Ethnicity % Black and non-Hispanic % Other and non-Hispanic
15.2 2.0
16.8 2.5
17.3 3.6
20.9 9.1
20.0 7.2
19.4 6.6
% Hispanic 5.9 6.0 8.5 16.0 14.4 12.9 Total 100% 100% 100% 100% 100% 100%
% wages 3.4 3.4 1.7 1.4 1.4 1.6
Primary Income Sources
% welfare % social security % SSI % pension
0.8 62.0 27.6
1.6
0.8 71.4 18.9
2.0
0.5 81.3 11.1
3.4
0.6 76.8 15.5
3.7
0.5 75.0 17.5
4.0
0.5 76.9 15.3
3.6 % other/none (includes no primary) 4.6 3.4 2.0 2.0 1.7 2.0
Total 100% 100% 100% 100% 100% 100%
41

BTable 1-17 (continued)
Less than 10 10-20 units 21-50 units 51-99 units 100+ units Section units in in property in property in property in property 202, allproperty
% less than $5,000 6.2 4.1 2.3 2.7 2.0 2.5 % $5,000 to $9,999 59.1 54.6 45.1 43.2 43.5 44.6 % $10,000 to 14,999 28.6 31.3 35.3 34.8 33.8 34.3
Income Distribution
% $15,000 to $19,999 % $20,000 to $24,999 % $25,000 and over
4.4 1.2 0.5
7.6 1.8 0.6
13.0 3.3 1.0
14.1 3.9 1.3
13.8 4.7 2.2
13.3 3.9 1.5
Total 100% 100% 100% 100% 100% 100%
Mean income $9,315 $10,001 $11,176 $11,402 $11,670 $11,337 Median income $8,609 $9,048 $10,250 $10,272 $10,291 $10,236
% wages 33.3 18.8 5.5 3.4 3.5 5.1 Any
Income Sources
% welfare % social security % SSI
2.7 68.4 46.0
3.2 77.6 36.5
2.5 87.4 25.3
1.8 84.1 29.4
2.4 81.8 30.4
2.3 83.7 29.2
% pension 5.1 11.3 22.8 23.6 24.5 22.8 % other/none 3.9 4.3 3.7 3.8 3.9 3.8
Metropolitan Status
Central city (MSA) Suburban (MSA)
37.1 36.9
32.6 22.2
36.7 34.3
54.8 35.9
60.9 34.4
50.8 34.2
Rural (non-MSA) 26.0 45.2 29.0 9.4 4.7 15.0 Total 100% 100% 100% 100% 100% 100%
Northeast 28.0 15.1 20.6 24.8 28.8 24.6 Location by
Census Midwest South
18.0 35.4
26.0 37.6
29.2 29.9
21.3 29.6
22.5 31.5
24.0 30.8
Region West 14.3 14.9 16.6 19.5 14.1 16.6 Trust Territory 4.3 6.3 3.7 4.9 3.1 4.0
Total 100% 100% 100% 100% 100% 100%
Number of years living
in project (tenure)3
% less than 1 year % 1-2 years % 2-3 years % 3-4 years % 4-5 years % 5-10 years % 10-15 years % 15-20 years % 20 or more years
Total
24.4 7.8 6.7 6.3 4.9
16.7 13.1 10.9
9.2 100%
27.3 12.3
9.5 7.4 6.8
17.2 10.2
6.3 3.0
100%
26.6 13.0 10.3 8.8 6.7
20.4 8.7 4.0 1.4
100%
23.4 12.0
9.8 8.8 6.7
23.7 10.0
3.7 1.8
100%
19.9 10.3
8.6 7.6 6.7
23.9 12.2
6.0 4.8
100%
23.3 11.7
9.5 8.3 6.7
22.5 10.4
4.8 2.9
100%
Mean tenure 7.6 5.3 4.7 5.2 6.4 5.5 Median tenure 5.0 3.0 3.0 3.9 4.9 4.0
42

BTable 1-17 (continued)
Less than Section 10-20 units 21-50 units in 51-99 units 100+ units in10 units in in property property in property property 202, property all
% under 62 84.5 45.5 18.0 9.6 13.6 16.7
Age of household head when
admitted in 2006 (new admissions
only)
% age 62-64 % age 65-69 % age 70-74 % age 75-79 % age 80-84 % age 85 or older
Total
3.5 3.7 3.5 1.6 1.6 1.6
100%
11.0 13.9 10.2
8.3 6.9 4.3
100%
13.1 18.4 17.1 14.7 11.1
7.6 100%
13.7 21.6 19.1 16.1 11.7
8.1 100%
13.5 20.2 16.9 15.6 11.5
8.8 100%
13.1 19.4 17.0 14.8 11.0
7.8 100%
Mean age Median age
45.1 45.1
58.4 63.0
68.9 70.1
71.3 71.3
70.1 70.7
69.0 70.2
% under 62 87.8 55.5 19.8 10.3 14.4 17.4
Age of household head when
first admitted to project (current
households)3
% age 62-64 % age 65-69 % age 70-74 % age 75-79 % age 80-84 % age 85 or older
Total
3.2 3.2 2.6 1.5 1.1 0.6
100%
8.2 11.5
9.3 7.4 5.0 3.0
100%
13.4 20.1 17.7 14.5
9.3 5.2
100%
15.0 24.0 20.7 15.5
9.4 5.0
100%
14.6 23.6 19.3 14.3
8.8 5.1
100%
14.0 21.9 18.6 14.2
8.8 4.9
100%
Mean age Median age
42.2 40.5
54.2 55.6
67.4 69.1
70.1 70.1
69.1 69.4
67.9 69.2
Source: Special tabulations by PD&R staff.
43

Table 1-18 Characteristics of Program Participants Age 80 or Older,
for Section 202 and Other HUD Programs, December 2006
Section 202/8
Section 202 PRAC
Section 202, All
Other Private-
Owner, Multi -family
Assisted1
Public Housing1
Section 8 Housing Choice
Vouchers1
Number of properties 4,075 2,020 6,095 16,958 NA NA Number of units 230,778 91,333 322,111 1,341,677 NA NA
Property Type
Number of assisted unitsTotal number of households2
Reported households with head, spouse, or co-head age 80 or older
217,327 213,884
68,921
90,318 87,843
27,090
307,645 301,727
96,011
1,136,200 422,055
140,454
NA 305,020
76,989
NA 334,445
77,072
% 1-person household 92.6 91.9 92.4 88.7 84.7 80.6 Household % 2 or more persons in household 7.4 8.1 7.6 11.3 15.3 19.4
Size Total 100% 100% 100% 100% 100% 100%
% male 19.1 20.0 19.4 20.9 25.8 23.0 Gender % female 80.8 80.0 80.6 79.0 74.2 77.0
(persons) Total 100% 100% 100% 100% 100% 100%
% White and non-Hispanic 69.1 64.8 67.9 68.6 52.1 60.4 % Black and non-Hispanic 13.3 17.0 14.3 14.5 25.9 16.0
Race / Ethnicity
% Other and non-Hispanic % Hispanic
6.8 10.8
7.0 11.2
6.9 10.9
7.5 9.4
4.1 17.9
6.3 17.3
Total 100% 100% 100% 100% 100% 100%
% less than $5,000 1.0 0.9 1.0 0.8 1.7 0.7 % $5,000 to $9,999 33.9 32.8 33.6 33.1 41.6 40.1 % $10,000 to 14,999 39.8 40.3 40.0 38.9 32.6 38.0 % $15,000 to $19,999 17.5 19.4 18.0 18.3 13.8 15.3
Income Distribution
% $20,000 to $24,999 % $25,000 and over
Total
5.5 2.3
100%
5.2 1.5
100%
5.4 2.1
100%
6.0 2.9
100%
5.5 4.9
100%
3.9 2.0
100%
Mean income $12,537 $12,520 $12,532 $12,818 $12,662 $11,971 Median income $11,456 $11,752 $11,549 $11,664 $10,719 $10,572
% wages 1.2 1.4 1.2 1.5 4.3 3.4
Primary Income Sources
% welfare % social security % SSI
1.6 88.4 21.6
1.1 88.2 21.2
1.4 88.3 21.5
1.8 88.2 21.8
6.7 88
29.3
8.6 78.1 41.7
% pension 31.8 31.7 31.7 32.4 28.1 21.7 % other/none (includes no primary) 1.2 1.4 1.2 1.5 4.3 3.4
Total 100% 100% 100% 100% 100% 100%
44

Table 1-18 (continued)
Other Section 8 Private- Section Section 202 Section 202, Owner, Multi Public Housing 202/8 PRAC All -family Housing1 Choice
Assisted1 Vouchers1
% wages 0.2 0.3 0.3 0.5 2.0 1.1 % welfare 0.3 0.2 0.3 0.2 0.5 0.2
Any Income Sources
% social security % SSI % pension
82.5 11.6 4.5
82.6 11.5 4.2
82.6 11.6 4.4
82.1 11.8 4.4
78.1 12.8 4.3
69.9 23.8 2.8
% other/none 0.8 1.1 0.9 1.0 2.4 2.2
Metropolitan Status
Central city (MSA) Suburban (MSA) Rural (non-MSA)
Total
48.5 37.7 13.8
100%
45.5 40.7 13.8
100%
47.6 38.6 13.8
100%
46.6 36.9 16.5
100%
47.8 26.6 25.6
100%
45.8 40.9 13.4
100%
Northeast 28.5 26.8 28 33 39.6 28.4 Midwest 24.3 23.7 24.1 29.9 23.7 16.8
Location by Census
South West
28.6 15.4
28.6 17.2
28.6 15.9
17.2 16.4
23 6.5
21.5 28.8
Region Trust Territory 3.2 3.7 3.4 3.5 7.2 4.3 Total 100% 100% 100% 100% 100% 100%
% less than 1 year 12.6 20.4 14.8 9.7 8.5 8.9 % 1-2 years 7.5 12 8.8 6.2 5.2 6.2 % 2-3 years 6.7 10.2 7.7 5.8 4.8 6.4 % 3-4 years 6.4 9.8 7.4 5.4 4.6 8 % 4-5 years 5.8 8.3 6.5 5.2 4.3 8.7
Number of % 5-10 years 23.6 30.6 25.6 22.3 18.5 26.9 years living in project (tenure)
% 10-15 years % 15-20 years % 20 or more years
17.1 12.1
8.1
8.6 0 0
14.7 8.7 5.8
16.8 12.8 15.8
14.4 12.9 26.9
14 11.6
9.4 Total 100% 100% 100% 100% 100% 100%
Mean Tenure 8.7 4.5 7.5 10.5 14.6 8.7 Median Tenure 7.0 4.0 6.0 9.0 11.2 6.4
% under 62 0.0 0.0 0.0 1.4 0.8 1.4 % age 62-64 0.4 0.0 0.2 0.9 20.4 19.3
Age of household head when admitted in
% age 65-69 % age 70-74 % age 75-79
0.7 1.1 2.1
0.2 0.4 1.9
0.5 0.8 2.0
1.7 2.7 4.0
26.1 19.3 15.4
25.6 19.5 15.8
2006 (new admissions
% age 80-84 % age 85 or older
55.3 40.5
57.6 39.9
56.2 40.3
53.5 35.9
10.6 7.4
11.0 7.4
only) Mean age 84.5 84.6 84.5 83.2 72.1 72.2 Median Age 84.0 83.8 84.0 83.5 70.6 70.9
45
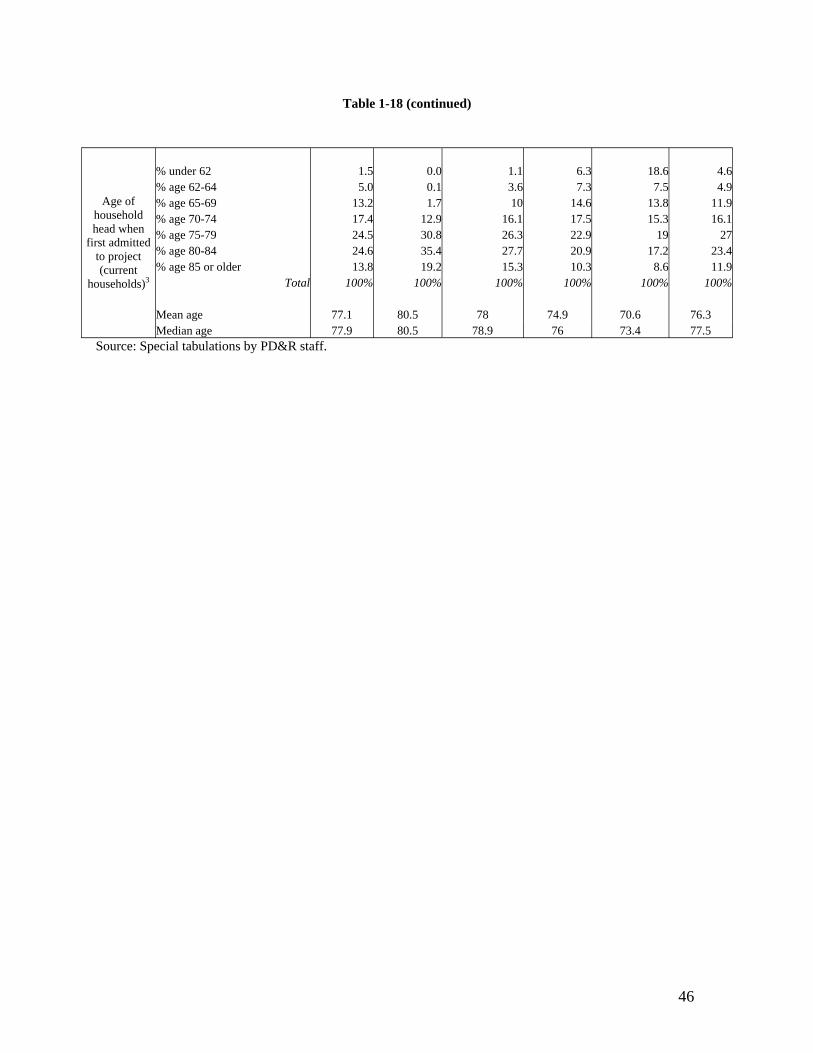
Table 1-18 (continued)
Age of household head when
first admitted to project (current
households)3
% under 62 % age 62-64 % age 65-69 % age 70-74 % age 75-79 % age 80-84 % age 85 or older
Mean age Median age
Total
1.5 5.0
13.2 17.4 24.5 24.6 13.8
100%
77.1 77.9
0.0 0.1 1.7
12.9 30.8 35.4 19.2
100%
80.5 80.5
1.1 3.6 10
16.1 26.3 27.7 15.3
100%
78 78.9
6.3 7.3
14.6 17.5 22.9 20.9 10.3
100%
74.9 76
18.6 7.5
13.8 15.3
19 17.2
8.6 100%
70.6 73.4
4.6 4.9
11.9 16.1
27 23.4 11.9
100%
76.3 77.5
Source: Special tabulations by PD&R staff.
46

BChapter Two: Housing Quality and Quality of Life
This chapter presents what we know about outcomes that are achieved in the Section 202 program. We examine results in terms of the quality of housing and quality of life that is made available to program participants. Where practicable, results are compared to the outcomes observed in other HUD rental assistance programs that provide benefits to elderly persons. We also describe the extent to which residents of Section 202 developments live in housing of better quality than similar elderly people (i.e. program eligible) who do not receive housing assistance. In considering these benefits and program outcomes, we go beyond just the housing and neighborhood to consider a definition of “quality” that includes the priority needs of the residents themselves. This is consistent with the statutory purpose of the Section 202 program, which is to enable elderly persons to live with dignity and independence, by accommodating special needs of elderly persons, and by providing a range of supportive services that are tailored to the needs of elderly persons.
BTraditional Measures of Housing Quality
Housing made available under the Section 202 program is of good quality, performing better in on-site physical inspections than other assisted housing programs, based on information from HUD’s Real Estate Assessment Center (REAC). However, for this analysis, it was not possible to separate out the Section 202 properties from those developed under Section 811. 37
F
Housing quality as measured by physical inspections. Information in Table 2-1 contrasts the results of physical inspections for Section 202/811 properties with those inspected under other private-owner, multifamily assisted programs, and under public housing. Section 202/811 properties score very highly in the inspection process, with a unit-weighted average of 90 on a 100-point scale. This result is about 5 points higher than other multifamily assisted housing, and about 13 points higher than public housing. Eleven percent of Section 202/811 properties score a perfect 100 in this inspection process, and 72 percent of properties score 90 or better.
An analysis by type of observed defect reveals that Section 202 properties have few emergency defects involving health and safety and that capital defects (requiring
37 Section 811 properties are developed under a similar process to the Section 202/PRAC properties. In addition to housing, the Section 811 program offers a variety of supportive services -- meals, transportation, and personal assistance -- to non-elderly disabled people. Nearly half of all residents of HUD-funded supportive housing are developmentally disabled and more than 20 percent are chronically mentally ill. See: Evaluation of Supportive Housing Programs for Persons With Disabilities. Available at: http://www.huduser.org/publications/suppsvcs/shp.html
47

replacement of major components or systems) are infrequent. 38 Compared with Section F
202, the observed average number of capital defects per unit was twice as high in private-owner, multifamily assisted housing overall and five times as high in public housing. The average number of observed maintenance defects were also twice as high in other multifamily assisted housing than in Section 202/811, and the average number of maintenance defects in public housing was three times as high as in Section 202 housing.
Table 2-1 Multifamily (MF) Properties Comparative Portfolio Analysis
202/811 Entire MF Portfolio Public Properties (including 202/811 Housing
Only Properties)* Portfolio Population1
Property Count w/valid PASS Inspection 7,118 30,654 14,472 Scoring Analysis2
Unit Weighted Average 100 point PASS Inspection Score 90.0 84.9 76.8 Average 100 point PASS Inspection Score 91.4 86.4 81.7 # of Properties Scoring 100 (maximum score) 752 1,517 393 % of Properties Scoring 100 (maximum score) 11% 5% 3% Scoring Distribution (% of properties) PASS Inspection Score between 0-30 0% 1% 1% PASS Inspection Score between 31-59 1% 4% 8% PASS Inspection Score between 60-79 8% 15% 25% PASS Inspection Score between 80-89 18% 25% 29% PASS Inspection Score between 90-100 72% 55% 37% Defect Analysis3
EHS Defects/Unit – Projected 0.0 0.1 0.1 Capital Defects/Unit – Projected 0.1 0.2 0.5 Maintenance Defects/Unit – Projected 0.5 1.0 1.8 Total Defects/Unit – Projected 0.6 1.3 2.4 Defects/Unit Distribution (% of properties) Total Defects/Unit - Projected = 0 5% 2% 1% Total Defects/Unit - Projected Between .01 - .05 47% 31% 12% Total Defects/Unit - Projected Between .051 - 1.0 25% 24% 17% Total Defects/Unit - Projected Between 1.01 and 2.0 17% 25% 28% Total Defects/Unit - Projected >2.0 5% 19% 42%
* Private-owner, multifamily assisted housing. Notes: 1. PASS = Physical Assessment Sub System. REAC conducts a program of annual physical inspections of more than 40,000 public and assisted multifamily housing properties. Property count based on most recent valid PASS physical inspection as of June 22, 2005. 2. All PASS physical inspection scores evaluated are 5-area scores. 3. Projections are made to observed defect counts for each property based on the representative sampled buildings and units. Source: HUD Real Estate Assessment Center (REAC).
38 Possible exceptions are the aging, under-funded buildings from the cost containment phase of the program.
48
In all, the observed number of defects in Section 202/811 housing was on average equal to 0.5 defects per unit. About 72 percent of Section 202/811 housing has one or fewer defect per unit. As the physical inspection protocol is very detailed, and housing like any physical system) is inherently subject to various kinds of breakdowns, this is a remarkable but perhaps not surprising result. Housing occupied by elderly persons is not subject to the same kinds of wear and tear that applies in housing for families with children. Nonetheless, it seems clear that Section 202 housing provides very good quality physical accommodations.
Housing quality obtained by unassisted, eligible households. The housing quality of elderly renters with very low incomes varies by demographic type and location as well as type of deficiency (see Tables 2-13 and 2-14, at the end of this chapter). 39 Overall, the deficiencies with the highest prevalence are:
Common stairways with loose, missing or broken steps (9%), Roof in need of repair (6%), Fuses/circuit breakers tripped in the last 3 months (4%), Outside walls in need of repair (3%), and Areas of peeling paint or broken plaster (2%).
These percentages mask variations by region and age. For most measures of housing quality, renters over 80 years fare better than younger renters (see Tables 2-15 and 2-16). About one-third of very low and extremely low-income elderly renters live in the Northeast. 40 Table 2-17 shows that renters in the Northeast generally have higher rates F
of deficiencies than renters in the other regions, especially for serious structural problems.
39 It is not possible to directly compare the above results from Section 202 physical inspections with information on housing quality for unassisted elderly persons prior to their admission to Section 202 facilities. There is no physical inspection process that reviews the pre-program condition of housing occupied by persons as they apply for assistance. We can, however, reasonably conclude that Section 202 contributes to a very significant increase in the quality of housing obtained. As noted in Chapter One, there are 11.7 million very low-income elderly households in the United States, including 3.4 million elderly renters. Among these households, particularly the renters, there is a relatively high incidence of housing problems. While the predominant housing problem observed in American Housing Survey data is high cost burden, there also is evidence of physical defects.
40 Very low-income is an annual household income up to 50 percent of median income for households in the area in which the property is located. Extremely low-income is an annual household income up to 30 percent of median income for households in the area in which the property is located.
49

Participants in Section 202 generally do not experience the types of problems reflected above. Their housing is at least as good as housing occupied by very low-income elderly households. When compared with housing occupied by minorities and by the lowest income households, the housing provided in Section 202 is almost certainly of better quality.
BHousing quality for elderly participants of the Housing Choice Voucher program. If Section 202 participants obtain better quality housing than unassisted eligible households, do they also obtain better housing than could be obtained in the private market using Housing Choice Vouchers? There is limited evidence of housing quality for elderly persons who use vouchers, based on results from resident surveys in the program. The survey methodology is different from that used in either the AHS or the REAC physical inspections, making comparisons across the three groups (i.e., Section 202 participants, voucher participants, and unassisted eligible households) difficult at best. Even so, there are a few general statements that can be made with reasonable confidence.
Housing obtained by elderly participants in the Housing Choice Voucher program is generally of good quality. During 2000 to 2002, approximately 466,000 assisted households responded to a mail survey by HUD that requested detailed information regarding the quality of the housing unit and neighborhood. Twenty-one percent of all households that responded to the survey (approximately 93,000) were elderly. 41 AnF
estimated 29 percent of units occupied by elderly households were reported to have no defects, and 21 percent have only one reported defect. 42 Eleven percent reported eight orF
more defects, although reported defects tended not to be items involving health and safety issues. Nonetheless, elderly households obtain much better housing than younger program participants, with an estimated 26 percent of non-elderly households reporting eight or more defects.
Although the survey is not identical to the AHS, results for specific defects are more or less comparable (see Tables 2-20 to 2-23, at the end of this chapter). As with the AHS, rates of deficiencies vary by location, age, race, and household type. The items that most closely resemble the deficiencies in the AHS with the highest prevalence, presented above, are:
Outside handrails, steps or stair that are unsafe (7.3%); Problems with roof, such as sagging, holes or missing roofing (3.4%); Fuses blown or circuit breakers tripped in last 3 months, 1-3 times (9.9%); Outside walls with serious leaning, buckling or large holes (3.0%); and
41 Response rates among elderly program participants was approximately 67 percent. The overall response rate for the survey was 51 percent.
42 In this case, most reported defects are those that could be a violation of the program’s Housing Quality Standards (HQS). Units are not surveyed at the time of housing inspection. Responses tend to be distributed throughout the year.
50

Areas of peeling paint/broken plaster larger than 8 x 11 ins (2.8%).
The largest difference is for the percentage reporting that fuses blew or circuit breakers tripped, which is nearly three times that from the AHS.
The survey requested more in-depth information about heating than the AHS and found higher rates of heating problems, ranging from 6.9 to 8.5 percent reporting heating breakdowns for six or more hours during the previous winter and the home so cold that someone there was uncomfortable during the previous winter, respectively.
The other defect in the survey with relatively high prevalence was that 8.6 percent reported floor problems, such as boards, tiles, carpeting or linoleum that are missing, curled or loose. In the AHS, respondents were asked a much more restrictive question about floors, viz. if there were holes large enough to catch a foot. Less than one percent reported this defect.
About 6 percent of unassisted very low income elderly households reported in the AHS live in housing that is classified as severely inadequate. While not directly comparable, a measure of housing adequacy constructed of survey questions patterned after AHS survey instrument questions also found that an estimated 6.5 percent of elderly households receiving voucher assistance also lived in severely inadequate housing. In other words, elderly voucher participants obtain more or less comparable housing as eligible, unassisted elderly households. There is no evidence that either group obtains better housing than residents of Section 202 facilities.
Quality of Supportive Housing Features
The foregoing discussion considers the quality of housing through a very limited set of measures. A complete understanding of the quality of housing in Section 202 must take into account the capacity of the program to deliver services, based on the presence of supportive design features, communal space, and service coordinators. The presence of service coordinators, experience with providing services, and the features of the buildings - e.g. kitchens, dining areas, and other common spaces - are crucial elements of a strategy for preventing unnecessary institutionalization. 43 In a HUD evaluation of the HOPE forF
Elderly Independence Demonstration Program (HOPE IV), service coordinators were reported as highly effective in connecting participants of the Housing Choice Voucher program with needed services. A similar outcome was reported as part of the evaluation of the New Congregate Housing Services Program. 44
43 See: Sheehan, Nancy (2000) “Resident Services Coordinator Program: Bringing Service Coordination to Federally Assisted Senior Housing,” Journal of Housing for the Elderly 13, ½: 35-50.
44 Ficke, Robert C. and Susan G. Berkowitz (1999) Evaluation of the HOPE for Elderly Independence Demonstration: Final Report. Available at: http://www.huduser.org/publications/doc/hopeval.doc; Griffith, Janet et al. (1996) Evaluation of the New Congregate Housing Services Program: Second Interim Report. Available at:
51

Fifty-nine percent of projects occupied before 1974 offer meals or housekeeping services, but less than twenty percent built since the mid-1980s offer them. More than sixty percent of projects occupied before 1984 had common dining areas. Due to cost-containment, only 29 percent of those built after that have this feature. As noted below, by 2006 only 38 percent of all properties had service coordinators on staff. 45
BAccessibility of housing. A critical housing quality feature of Section 202 facilities is that they have the capacity to accommodate residents as they become more frail. Accessible design includes features such as grab rails, ramps, elevators where necessary, and accessible units. Other support features assure residents of help when they need it and include 24-hour on-site personnel, intercom, call button, and an emergency phone number. Surveys of Section 202 housing done in 1988 and 1999 showed major differences between supportive design features at facilities built before and after 1975. 46
F
Supportive features linked to building size, such as 24-hour on-site personnel and intercom, were more prevalent in the older, larger facilities. However, only half of all sites built before 1975 had at least one accessible unit. Sites built since then have been required to make at least 10 percent of their units wheelchair-accessible. Most facilities have some support and accessible design features in place (see Table 2-2). A majority of facilities (73.9 percent) have grab rails, and 91.1 percent have a ramp or a level entrance.
Accessible design features vary by program phase (see Chapter One for information on the five phases of the Section 202 program). Older facilities are more likely to include elevators, since many are larger high-rise buildings. Fewer facilities built before 1975 had grab rails in public hallways. Most facilities (93.3 percent) have at least one accessible unit, but in 1999, only 47.9 percent of facilities built before 1975 reported having at least one wheelchair-accessible unit. Due to program requirements in the later phases, close to 100 percent of facilities had at least one accessible unit. Overall, nearly 30 percent of all units are wheelchair-accessible. The percentage of accessible units is lowest in the projects built between 1975 and 1988 (21.3 percent and 23 percent) and highest in the two most recent phases (35.8 percent and 42.6 percent).
Most projects provide at least one supportive feature. The most common features are call buttons (in 90.2 percent) and emergency phone numbers (in 80.1 percent). Just over one-fourth of all facilities (27.6 percent) report having 24-hour on-site personnel. Round-the-clock staffing is most common in the oldest two program phases. Overall, only 8.4 percent of facilities had the type of intercom found in hospitals and nursing homes that
http://www.huduser.org/Publications/pdf/enchsp.pdf
45 Heumann et al. (2001) cited by Wilden, Robert and Donald A. Redfoot (2002) Adding Assisted Living Services to Subsidized Housing: Serving Frail Older People with Low Incomes. AARP Public Policy Institute Report #2002-01. AARP: Washington DC.
46 The following description of availability of accessible features, availability of community space and presence of service coordinators is excerpted and summarized from Heumann et al. (2001).
52

puts residents in voice contact with a person (as opposed to a one-way alarm that only signals that someone in an apartment might need assistance). Pre-1975 facilities were more likely to have two-way intercoms. These facilities often are high-rise buildings (see Table 2-2). Since call buttons require someone to go to the apartment, an intercom may be particularly useful in these large buildings.
Much of the decline in the presence of support features may stem from declines in average facility size. Elevator access, intercom connections, and the presence of 24-hour onsite personnel are all features associated with large facilities, whether because of their physical size or the greater cost effectiveness of having someone on call at a large facility. 47
F
Table 2-2 Percent of Facilities Reporting Support Features by Program Phase
1959-74 1975-84 Sec 8
1985-88 Sec 8
1989-94 Sec 8
1993-98 PRAC
1999 All projects
1988 All projects
Accessible design feature:
Grab rails 43.9 % 83.5 % 69.4 % 75.3 % 75.5 % 73.9 % 97.8 %
Ramp 93.0 % 93.9 % 91.7 % 88.5 % 88.3 % 91.1 % 97.3 %
Elevator 83.3 % 84.3 % 62.5 % 64.9 % 69.1 % 72.5 % 94.5 %
Mean % accessible units 28.3 % 21.3 % 23.0 % 35.8 % 42.6 % 29.3 % NA Facilities w/ 1+ wheelchair accessible unit 47.9 % 96.3 % 95.7 % 100.0 % 100.0 % 93.3 % NA
Support feature: Call button 50.0 % Intercom 16.7 %
24-hr on-site personnel* 39.5 %
Emergency phone number 75.4 %
94.8 % 9.6 %
36.5 %
78.3 %
88.9 % 5.6 %
23.6 %
81.9 %
95.9 % 7.2 %
23.7 %
81.4 %
95.7 % 7.4 %
16.0 %
81.9 %
90.2 % 8.4 %
27.6 %
80.1 %
92.9 % 20.1 %
68.6 %
82.5 % Source: Heumann, Leonard, Karen Winter-Nelson, and James Anderson (2001) The 1999 Survey of Section 202 Housing for the Elderly. AARP Public Policy Report #2001-02. Washington DC: AARP.
BAvailability of community space. Community space must be present in order for Section 202 facilities to provide certain on-site supportive services. Public spaces may be designed to provide adequate and appropriate room for socializing, exercising, meals and other supportive services. On-site provision of these activities and services is especially helpful for residents who are frail and facility-bound.
Table 2-3 presents findings regarding the presence and adequacy of four types of community spaces: congregate dining, social/recreational activity space, other visiting
47 However, findings showing declines in presence of these features may also be attributable to differences in questionnaire design in 1988 and 1999.
53

-- -- --
service spaces (such as for a visiting nurse, podiatrist, beautician, etc.) and laundry facilities. The respondents were asked to describe the provision of these services at their facility in terms of whether each service is (1) provided in a single-purpose space, (2) provided in a multi-purpose space, (3) not provided due to lack of space, or (4) not provided for other reasons.
Table 2-3 Community Space and Availability of Services by Program Phase
1959-74 1975-84 Sec 8
1985-88 Sec 8
1989-94 Sec 8
1993-98 PRAC
1999 All projects
1988 All projects
Congregate dining provided in: Single- or multi-purpose space 61.4 % 60.6 % 29.0 % 46.3 % 56.3 % 50.0 % 49.5 %
Single-purpose space 29.7 % 17.2 % 3.2 % 9.8 % 8.8 % 12.2 % 26.2 %
Would like to offer but lack 6.9 % 2.0 % 1.6 % 8.5 % 0.0 % 3.6 % 4.7 % space Social/rec activities provided in:
Single- or multi-purpose space 92.0 % 96.4 % 74.6 % 93.5 % 92.3 % 90.2 % 93.5 % Single-purpose space 12.5 % 10.0 % 15.7 % 19.6 % 16.5 % 14.8 % 39.8 % Would like to offer but lack 1.8 % 0.9 % 7.1 % 3.3 % 1.1 % 2.9 % 1.9 % space Other visiting services1 provided in: Single- or multi-purpose space 76.8 % 58.4 % 32.8 % 43.2 % 55.2 % 50.4 % 50.5 % Single-purpose space 44.4 % 29.7 % 11.5 % 13.6 % 29.9 % 23.3 % 29.1 % Would like to offer but lack 7.1 % 8.9 % 19.7 % 13.6 % 3.0 % 11.2 % 5.6 % space Common spaces:
Inadequate 15.8 % 7.9 % 14.3 % 15.6 % 6.4 % 11.6 % 10.8 %
Inadequate in 1988 10.6 % 7.4 % 16.3 % 10.8 % 1e.g., beautician or podiatrist Source: Heumann, Leonard, Karen Winter-Nelson, and James Anderson (2001) The 1999 Survey of Section 202 Housing for the Elderly. AARP Public Policy Report #2001-02. Washington DC: AARP.
A majority of Section 202 facilities have the capacity to provide an array of communal services for their residents. Community space for social and recreational facilities is available and used in 90.2 percent of facilities. Spaces for congregate dining and visiting services are used in about half of facilities.
All types of services are provided more frequently in multi-purpose than in single-purpose spaces. Relatively few facilities report inadequate common space, either in general or for a particular service. Space is most frequently provided for social and recreational activities. Over 90 percent of facilities provide this service. In only 14.8 percent of facilities they were provided in a single-purpose space.
54

Congregate dining is provided in 50 percent of facilities, 37.7 percent in multi-purpose spaces and 12.2 percent in single-purpose spaces. Visiting services - e.g., beautician or podiatrist - are also provided in half of all facilities (50.4 percent); slightly more provided these services in multi-purpose spaces.
The availability of community spaces declined to a low point in the cost-containment phase (1985-1988), but a renewed commitment to providing such spaces is found in the Section 202/PRAC (Project Rental Assistance) program. Community space provision and barrier-free design are more common in the newest facilities.
BPresence of service coordinators. A service coordinator is a person trained to work with residents and their families when supportive services are needed. His or her role is to assist residents in obtaining supportive services, coordinate service delivery to maximize independent living, and monitor the quality and quantity of services to fit the wants and needs of residents. Originally authorized by Congress in the housing acts of 1990 and 1992, service coordinators have emerged as staff members at many Section 202 facilities in the past decade.
BIn 2006, results from HUD’s Real Estate Management System (REMS) show that 38 percent of all properties, containing about 140,000 households, reported having a service coordinator on staff (see Table 2-24 at the end of this chapter). This is slightly more than half of all elderly households in the Section 202 program. Forty-three percent were in buildings with 100 or more units, and 41 percent were in properties with 50 to 99 units. Less than a fifth (17 percent) were in properties with fewer than fifty units.
More than half (55.5 percent) of households in properties with a service coordinator are in central cities, and more than a third (35.3 percent are in suburban locations. Even though 15 percent of households live in rural (i.e. non-metropolitan) locations, only nine percent lived in a property with a service coordinator.
Larger properties with service coordinators are rarely found in rural locations. Just 2.9 percent of households in properties with 100 or more units and a service coordinator were in rural locations, and 7.7 percent of properties with 50 to 99 units were in rural locations. Of the households living in small properties with less than fifty units, 27.2 percent were in rural locations.
BProperties in the Southern census region were more likely to lack a service coordinator than in other regions. Even though 30.8 percent of households resided in the South, 35.1 percent of households in Southern properties lacked a service coordinator. This is hardly surprising, as the smallest properties with 20 or fewer units, that can ill afford a service coordinator, tend to located in the South (see Table 1-17).
People living in properties with service coordinators tend to be older than people in properties lacking service coordinators. About a third (33.5 percent) of residents in properties with service coordinators are eighty years or older, while about a quarter (27.8 percent) of people in properties without service coordinators are in this age group. The
55

largest properties have the highest concentrations of people who are eighty or older. About a third of people living in properties with 50 or more units, while about a quarter in properties with fewer than fifty units are this old.
BFor properties with service coordinators, about 45 percent of households had incomes of less than $10,000, regardless of the size of the property. However, Supplemental Security Income (SSI) as the major source of income was more likely in the largest properties, while Social Security was more likely in the smaller properties. Residents in small properties with fewer than 50 units were considerably less likely to have SSI as the major source of income than those in the largest properties: 10.8 and 17.5 percent, respectively, had income from that source. Residents in small properties with fewer than 50 units were more likely to have Social Security as the major source of income than those in the largest properties: 81.1 and 74.8 percent, respectively, had income from that
48source. F
BThe 1999 AARP survey provides additional details. Almost half of all facilities built before 1984 (moderate-income and low-income phases) reported having a service coordinator on staff. The smallest service coordinator presence was reported at Section 202/PRAC facilities, i.e. 26.9 percent (see Table 2-4).
Most facilities that did not have a service coordinator on staff reported that service coordination was available in the community, but a significant minority reported “no service coordination” (18.7 percent). This response may indicate that residents and managers at these facilities lack information on services available in the community as well as guidance in using an appropriate combination of services. The frequency of this response varied widely. It was highest for facilities in the 1989-1994 transition phase (25.3 percent) and lowest for the 1975-1984 low-income phase (9.9 percent).
Managers overwhelmingly reported positive experiences with service coordinators. Nine out of ten managers reported that service coordinators enabled them to have more time for other management issues and that the managers and service coordinators worked together to meet residents needs. Less than 3 percent of those with on-site service coordinators noted problems of coordination of support or management activities. Typical comments from managers were that the service coordinators caused a “greater awareness of resident needs” and “low turnover rate [from] tenants staying longer thus management saving time and money.”
Equally positive was the reported impact of service coordinators on residents (see Table 2-5). Less than 4 percent of facility managers reported “no impact” on residents from the introduction of service coordinators. On the other hand, more than three-quarters reported that service coordinators had increased the range of services (90.5 percent), increased the quality of services (78.3 percent), and allowed residents to stay independent longer (81.1 percent).
48 For an overview of the SSI program, see: http://www.ssa.gov/ssi/
56

Table 2-4 Availability of Service Coordinators by Program Phase
1959-74 1975-84 Sec 8
1985-88 Sec 8
1989-94 Sec 8
1993-98 PRAC
1999 All projects
Service coordinator on staff 47.7 % 46.8 % 31.0 % 34.7 % 26.9 % 37.4 %
Service coordination available in the community 35.1 % 43.2 % 47.9 % 40.0 % 50.5 % 43.8 %
No service coordination 17.1 % 9.9 % 21.1 % 25.3 % 22.6 % 18.7 %
Source: Heumann, Leonard, Karen Winter-Nelson, and James Anderson (2001) The 1999 Survey of Section 202 Housing for the Elderly. AARP Public Policy Report #2001-02. Washington DC: AARP.
Table 2-5 Impact of Service Coordinators on Residents by Program Phase
1959-74 1975-84 Sec 8
1985-88 Sec 8
1989-94 Sec 8
1993-98 PRAC
1999 All projects
Increase in range of services 100.0 % 90.2 % 90.9 % 83.9 % 95.8 % 90.5 %
Increase in quality of services 92.3 % 78.4 % 68.2 % 83.9 % 75.0 % 78.3 %
Increase in hours of service availability 76.9 % 62.7 % 63.6 % 67.7 % 58.3 % 64.6 %
Residents stay independent 92.3 % 78.4 % 81.8 % 83.9 % 75.0 % 81.1 % longer
No impact 0.0 % 2.0 % 4.5 % 6.5 % 4.2 % 3.8 %
Other 5.8 % 9.8 % 9.1 % 3.2 % 8.3 % 7.4 %
Source: Heumann, Leonard, Karen Winter-Nelson, and James Anderson (2001) The 1999 Survey of Section 202 Housing for the Elderly. AARP Public Policy Report #2001-02. Washington DC: AARP.
Almost all of the comments included such positive impacts of service coordinators as:
• easing the transition when residents move in; • developing resident volunteers to help each other; • improving family relationships; and • improving management relationships with Hispanic tenants when the service
coordinator is bilingual.
When managers were asked to pick the most important impact, allowing residents to stay independent was the overwhelming choice.
57

BNeighborhood Characteristics
BAnother characteristic of the quality of Section 202 housing is location. We used HUD’s GIS software and data to analyze the location of Section 202 residents relative to hospitals, transportation, and other critical services. This section presents selected Census Tract characteristics of Section 202 properties, and compares these to the characteristics to those of other forms of elderly assisted housing. Nationwide, there are some 66,000 Census Tracts. Approximately 60 percent of these Census Tracts have some assisted housing with elderly tenants. Most of these are Housing Choice Vouchers, which can be found in more than 39,000 tracts. Public Housing elderly units are found in more than 7,000 tracts and Section 202 properties are located in only 4,261 tracts, or about 6 percent of all tracts nationwide. Of the tracts containing Section 202 properties, about 80 percent also have elderly voucher recipients and about 20 percent have elderly public housing residents. There are 769 tracts (or a little over 1 percent of all tracts) that have all three forms of assisted housing with elderly tenants.
In general, the neighborhoods of Section 202 properties are similar to those of the other types of assistance. For example, Census Tracts containing Section 202 properties have an average of just over 18 percent elderly. This compares to an average of 17 percent elderly for Public Housing and 16 percent for elderly using Housing Choice Vouchers. Section 202 properties with Project Rental Assistance (PRAC) have a slightly lower percentage elderly in the neighborhood than those without PRAC—17 percent compared to 18 percent.
The Census Tract poverty rate averaged 18 percent for Section 202 properties, slightly higher than the rate for tracts with Housing Choice Vouchers (HCV) and substantially lower than the rate for the elderly in public housing (26 percent). Similarly, the median income of all households in Section 202 tracts were slightly lower than those for Housing Choice Vouchers and substantially higher than tracts containing the elderly in public housing (see Figures 2-A and 2-B). Other neighborhood comparisons failed to reveal any significant difference between Section 202 tracts and those of other forms of elderly housing assistance. Section 202 properties were located comparable distances from hospitals, for example.
58

�Figure 2-A
Comparison of Selected Neighborhood
0%
10%
20%
30%
40%
Section PRAC All
Public Housing HCV
)
Characteristics between Section 202 and other Assisted Housing Programs
202/8 Section 202 Section 202, Section 8
% of Census Tract Elderly (Age 62 + % of Census Tract in Poverty
Source: Special tabulations by PD&R staff.
�Figure 2-B
$0 Section
PRAC All Public
Housing HCV
Comparison of Neighborhood Income between Section 202 and other Elderly Assisted Housing Programs
$5,000
$10,000
$15,000
$20,000
$25,000
$30,000
$35,000
$40,000
202/8 Section 202 Section 202, Section 8
Median Census Tract Income
BSource: Special tabulations by PD&R staff.
59

BQuality of Life
BSection 202 housing provides good quality housing that almost always provides one or more support features, often provides community space, and where available, offers service coordinators who are reported to have very positive impacts on the residents. This combination of features would seem to allow for a better quality of life for facility residents. Whether or not this in fact happens is the subject of this section.
Survey results. An obvious way to approach the subject of quality of life for residents of Section 202 facilities is to ask the residents themselves. HUD administers resident surveys of Section 202 and other private-owner multifamily assisted properties through its Real Estate Assessment Center (REAC). REAC conducted a survey of its multifamily (MF) properties in the Fall, 2002, using sampling stratification to select potential respondents. REAC received 50,220 responses from approximately 2,030 properties, of which approximately 689 properties were assisted under Section 202/811. The response rate (across 202/811, Older, and Newer Assisted) was approximately 45%, which was considered a good response that exceeds the industry average for direct mail surveys.
The 2002 MF survey used a stratified sample included properties for 202/811, Older Assisted, and Newer Assisted programs across all of HUD’s field office jurisdictions. However, properties may not have been selected randomly in all cases, so these survey results may not be nationally representative.
For purposes of this report, special tabulations were done to compare the degree of residents' satisfaction on 202/811 properties with all properties (including 202/811) on two "Overall Satisfaction" items:
1. How satisfied are you with your unit/home? 2. How satisfied are you with your property/building?
There were five response options for both items: Very Satisfied, Satisfied, Dissatisfied, Very Dissatisfied, and Does Not Apply.
About 91 percent of residents of Section 202/811 facilities indicated that they were satisfied or very satisfied with their home, and about 89 percent indicated that they were satisfied or very satisfied with their property/building. We lack comparable statistics for the public housing or multifamily assisted projects occupied primarily by elderly households. However, the rates of satisfaction for the entire multifamily assisted inventory were 86% regarding their home and 82% regarding their property/building. Residents of 202/811 properties had a higher percentage of satisfaction than for the multifamily inventory overall.
There were similar questions asked of elderly participants in the Housing Choice Voucher program, and among unassisted eligible households through the American Housing Survey (AHS). Precise comparisons across these data sources are not possible
60

due to the differences in survey instruments and sampling methodologies. Nonetheless, some comparison is possible. Here is what these other sources indicate.
For the Housing Choice Voucher program, we have tabulated data for elderly participants surveyed through the Section 8 Housing Quality Survey. Using data from all three years of the survey, 2000 to 2002, we have results for 93,333 elderly households. About 76 percent of these respondents rate their home as good, based on a rating of 8 or above on a ten point scale. About 72 percent rate their neighborhood as good, again based on a rating of 8 or above on a ten point scale.
Responses from unassisted very low-income households with an elderly head or spouse to the American Housing Survey yield similar results. About 82 percent rate their home as “good,” based on a rating of 8 or above on a ten point scale. About 80 percent rated their neighborhood as “good.”
This very limited information on resident satisfaction suggests that residents of Section 202 facilities seem more satisfied with their home and immediate surroundings than participants in the Housing Choice Voucher program or very low-income elderly generally. We found no evidence to suggest that residents of Section 202 facilities are unsatisfied with their surroundings, or that they were less satisfied than unassisted eligible households or voucher program participants.
�Longevity and length of stay in Section 202 facilities. Another dimension of quality of life is the ability of elderly individuals to live longer and to live outside institutional settings. To shed some light on this issue, we will compare the ages of elderly residents of different types of assisted housing. We begin with the age and length of stay of participants as measured in the tenant data systems of these programs, and then report on the observed eight-year pattern of tenure of elderly persons who joined the program at age 75 or older in 1995. We conclude with projections of the length of stay for such households in Section 202 and other programs.
One measure of the impact of housing and services is the proportion of residents age 80 and older. Information from the TRACS data system and from a 1999 survey of Section 202 facilities offers ample evidence that there is a significant population of Section 202 residents that are 80 or older. While this result is not unique to the program, it does appear that Section 202 residents are able to age in place.
About 36 percent of residents of Section 202 facilities are age 80, including 39 percent in the older Section 202/8 projects and about 30 percent in the Section 202/PRAC properties (See Table 1-16 at the end of Chapter One). The median age of Section 202 residents is 76. Even in the relatively new Section 202/PRAC properties, the median age is 75. In other private-owner multifamily assisted properties, the median age is also 75. Most of these properties were developed in the 1980s. The 1999 survey of Section 202 facilities indicates that there is a relationship between age of facility and age of resident, both because residents age in place, and also because of self-selection by newly admitted
61

persons. There tends to be relatively more interaction with friends and less isolation in facilities where the age of the other residents is comparable. 49
F
The public housing and Housing Choice Voucher programs also provide assistance to significant numbers of people age 80 years or above. About 25 percent of the elderly in public housing and about 21 percent of the voucher participants are at least this age. The median age of residents is 72 years in public housing and 71 years for the elderly with vouchers. In short, the median age of residents in Section 202/PRAC is considerably higher than in public housing, even though the age of the Section 202/PRAC properties is newer.
For elderly household heads that were admitted to Section 202 or one of the other programs in 2006, the age distribution does not vary much from one program to the next. (see Table 1-16). The median age for newly admitted elderly households was 70 years in Section 202, 71 years in other private-owner multifamily assisted properties, public housing, and for Housing Choice Vouchers. Since the ages are similar at time of admission, but different (i.e. older) for Section 202 when considering the residents overall, this would seem to suggest a greater ability to age in place in Section 202 than in other types of assisted housing.
Another approach this subject is to compare of average tenure for Section 202 residents with participants in the other programs. Median length of tenure has been longest in public housing, 8.1 years. Median tenure in Housing Choice Vouchers has been 5.2 years. The median length of stay for Section 202 has been 4 years, including 4 years in Section 202/8 program and 3 years in Section 202/PRAC. However, the reason that tenants have longer tenure in the voucher program and in public housing than in Section 202 is that for these other programs the households can join the program as non-elderly participants, i.e. below the age of 62. A better way to consider length of stay is to follow households longitudinally, for a cohort that joins the program in a particular year.
Length of stay based on cohort analysis. Analysis in this section is based upon a 100 percent count of households in the Section 202, other multifamily assisted housing, public housing, and Housing Choice Voucher (HCV) programs for the reporting years from 1996 to 2002. This longitudinal data included both former participants (households that have already left assisted housing) as well as current ones (those that have not yet exited). Two data sets were analyzed. Extracted from MTCS (the Multifamily Tenant Characteristics System), the first longitudinal data file contained household information for public housing and HCV recipients. The second data set, derived from TRACS (the Tenant Rental Assistance Certification System), included Section 202 and other multifamily assisted data. All tenure calculations were informed by the difference between the latest effective date and the earliest admission date for every household record across 1996 to 2002.
49 Davidson, Sandra et al. (2001) “Age-segregated Housing and Friendship Interaction for Older People,” Journal of Housing for the Elderly, 12, 2: 123-35.
62
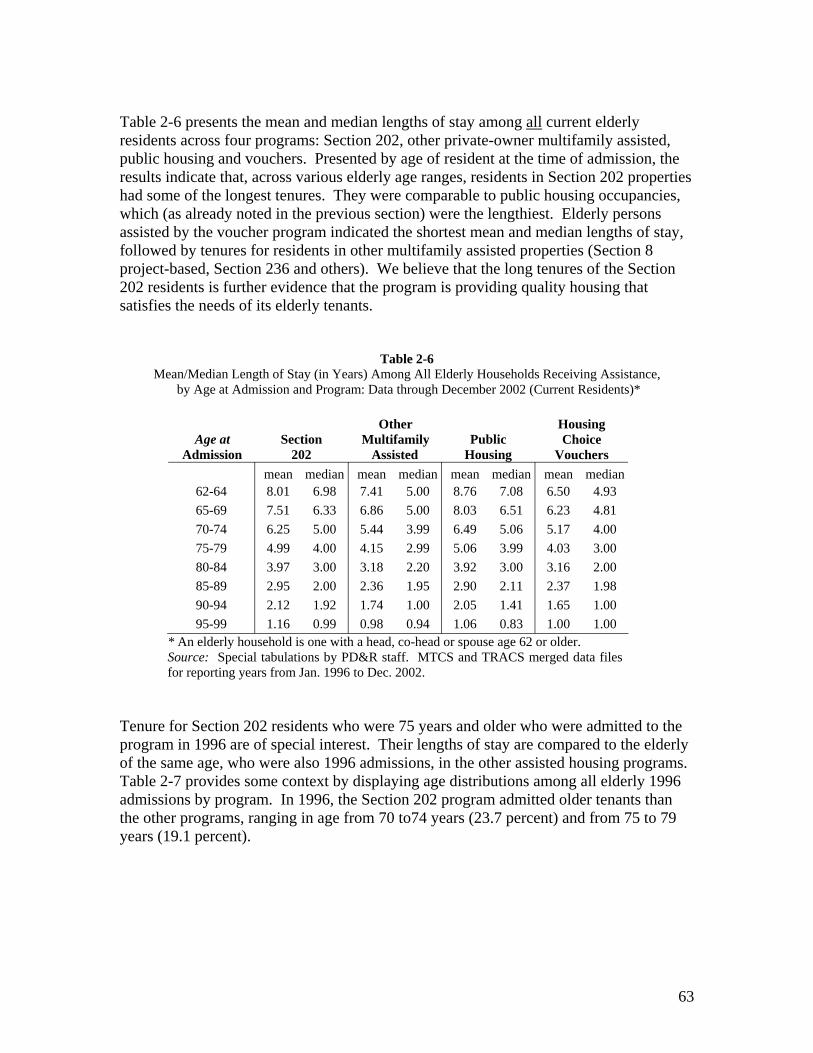
Table 2-6 presents the mean and median lengths of stay among all current elderly residents across four programs: Section 202, other private-owner multifamily assisted, public housing and vouchers. Presented by age of resident at the time of admission, the results indicate that, across various elderly age ranges, residents in Section 202 properties had some of the longest tenures. They were comparable to public housing occupancies, which (as already noted in the previous section) were the lengthiest. Elderly persons assisted by the voucher program indicated the shortest mean and median lengths of stay, followed by tenures for residents in other multifamily assisted properties (Section 8 project-based, Section 236 and others). We believe that the long tenures of the Section 202 residents is further evidence that the program is providing quality housing that satisfies the needs of its elderly tenants.
Table 2-6 Mean/Median Length of Stay (in Years) Among All Elderly Households Receiving Assistance,
by Age at Admission and Program: Data through December 2002 (Current Residents)*
BOther Housing B�Age at Section Multifamily Public Choice
BAdmission 202 Assisted Housing Vouchers
62-64 65-69 70-74 75-79 80-84 85-89 90-94 95-99
mean 8.01 7.51 6.25 4.99 3.97 2.95 2.12 1.16
median 6.98 6.33 5.00 4.00 3.00 2.00 1.92 0.99
mean 7.41 6.86 5.44 4.15 3.18 2.36 1.74 0.98
median 5.00 5.00 3.99 2.99 2.20 1.95 1.00 0.94
mean median 8.76 7.08 8.03 6.51 6.49 5.06 5.06 3.99 3.92 3.00 2.90 2.11 2.05 1.41 1.06 0.83
mean 6.50 6.23 5.17 4.03 3.16 2.37 1.65 1.00
median 4.93 4.81 4.00 3.00 2.00 1.98 1.00 1.00
* An elderly household is one with a head, co-head or spouse age 62 or older. Source: Special tabulations by PD&R staff. MTCS and TRACS merged data files for reporting years from Jan. 1996 to Dec. 2002.
Tenure for Section 202 residents who were 75 years and older who were admitted to the program in 1996 are of special interest. Their lengths of stay are compared to the elderly of the same age, who were also 1996 admissions, in the other assisted housing programs. Table 2-7 provides some context by displaying age distributions among all elderly 1996 admissions by program. In 1996, the Section 202 program admitted older tenants than the other programs, ranging in age from 70 to74 years (23.7 percent) and from 75 to 79 years (19.1 percent).
63

Table 2-7 Age Distribution of Elderly Admissions in 1996 by Program
(As A Percent of All Elderly Admissions Per Program in 1996)
B BOther Public Housing Age at �SectionAdmission 202 Multifamily Housing Choice
In 1996 Assisted Vouchers 62-64 13.1% 14.3% 17.0% 18.2%
65-69 23.9% 24.1% 25.4% 27.8%
70-74 23.7% 22.5% 21.8% 21.8%
75-79 19.1% 17.9% 16.9% 15.8%
80-84 13.1% 13.0% 12.0% 9.5%
85-89 5.7% 6.2% 5.3% 5,1%
90-94 1.4% 1.7% 1.4% 1.6%
95-99 .1% .2% .2% .2%
All Admissions 100.0% 100.0% 100.0% 100.0% Note: These elderly households were admitted to an assisted housing program between 1/1/96 and 12/31/96, and their household record included either a new admission or end of participation code, and the household’s earliest admission date was later than 12/31/95. Source: Special tabulations by PD&R staff. MTCS and TRACS merged data files for reporting years from Jan. 1996 to Dec. 2002.
Table 2-8 presents the results from the tracking of a cohort of residents age 75 at admission across programs for each year from 1996 through 2002, by whether they stayed in the program (Stayer) or left it (Leaver). As shown in this table, the 1996 cohorts from the Section 202 program, with a few exceptions, experienced a smaller attrition rate (the rate at which participants left assisted housing, based on the total number of Stayers and Leavers for a given year) across time as compared to those in other assisted housing programs. Over time, attrition rates in the Section 202 program ranged from 3.8% to 12.2%, depending on the year. Generally, the highest attrition rates occurred in the public housing and other multifamily assisted housing programs. Overall, the Section 202 program had the lowest attrition rate, more evidence that it is an effective program.
The underlying administrative data (not shown) from Table 2-8 indicate that a larger share (51.9 percent, or 298 out of 574 admitted to the program at age 75 in 1996) within the Section 202 program still remained in 2002, as compared to their counterparts who participated in other assisted housing programs. For other multifamily assisted, the rate was 40.1 percent (i.e. 679 out of 1692 residents). Meanwhile, only 34.1 percent (i.e. 136 out of 399 residents) and 43.1 percent (i.e. 110 out of 255 residents) of cohorts in the public housing and HCV programs, respectively, were still receiving assistance by 2002.
64

Table 2-8 Tenure of Cohort Age 75 at Admission in 1996, by Program
�1996 �Years Other Housing Cohort In Multifamily Choice
�In Year �Age �Program Section 202 Assisted Public Housing Vouchers
1996
1997
1998
1999
2000
2001
2002
75
76
77
78
79
80
81
0
1
2
3
4
5
6
Stayers 96.2%
95.0%
87.9%
87.8%
93.0%
92.4%
90.6%
Leavers 3.8%
5.0%
12.1%
12.2%
7.0%
7.6%
9.4%
Stayers 94.1%
89.1%
82.3%
81.1%
87.9%
88.5%
92.3%
Leavers 5.9%
10.9%
17.7%
18.9%
12.1%
11.5%
7.7%
Stayers Leavers 90.7% 9.3%
82.9% 17.1%
79.3% 20.7%
84.9% 15.1%
82.2% 17.8%
91.0% 9.0%
90.1% 9.9%
Stayers 89.4%
88.2%
86.1%
89.0%
87.0%
92.5%
88.7%
Leavers 10.6%
11.8%
13.9%
11.0%
13.0%
7.5%
11.3% Note: These elderly households were admitted at age 75 to an assisted housing program during calendar year1996. Source: Special tabulations by PD&R staff. MTCS and TRACS merged data files for reporting years from Jan. 1996 to Dec. 2002.
As shown in Table 2-9, Section 202 residents age 75 at admission in 1996 had the longest tenures, contrasting with similar cohorts from the other three programs. This trend held across three different measures for length of stay. These elderly cohorts living in Section 202 properties reported mean and median tenures of 4.67 and 5.92 years, respectively. Their median survival time, an actuarial estimate based on life tables analysis, was 6.60
50years. F
In order to further investigate these results, we created additional cohorts of elderly residents in their mid-to-late seventies. Tables 2-10 through 2-12 display tenure calculations by program for cohorts age 75 through 79 at admission in 1996, separately for Section 202, public housing, and Housing Choice Vouchers. Elderly Section 202 residents, whether age 75, 76, 77, 78 or 79 at admission in 1996, also stayed longer (by one to two years) than comparable age cohorts in the other two programs. The median survival time for Section 202 residents who were admitted to the project from age 75 to 79 was 6.28 years (Table 2-10).
Residents of Section 202 housing express a high rate of satisfaction with their home and immediate surroundings. Their rates of satisfaction compare favorably with those of elderly Housing Choice Voucher participants and unassisted elderly households who are eligible to join the program. The age of Section 202 residents and median length of stay suggest that it is possible for persons to age successfully in place, and the information on
50 Note that median survival time is the time it will take for half of the recipients to leave an assisted housing program. In the context of this study, it does not estimate the remaining life span of these housing recipients
65

cohort analysis for persons who join the program at age 75 or older suggest that living in a Section 202 facility helps to improve quality of life and extend life.
Table 2-9 Length of Stay (in Years) Among Cohorts Age 75 at Admission in 1996 by Program
(Current and Former Residents)
BOther Housing �Length of Section BMultifamily Public Choice
BStay 202 Assisted Housing Vouchers Mean 4.67 3.89 3.49 3.85
Median 5.92 4.19 3.67 4.42 Estimated Median
Survival Time 6.60 4.36 3.70 5.16
Note: Median survival time is the estimated tenure at which exactly half the households would still be expected to survive as housing recipients, while the other half would have exited. Source: Special tabulations by PD&R staff. MTCS and TRACS merged data files for reporting years from Jan. 1996 to Dec. 2002.
Table 2-10 Length of Stay (in Years) Among Cohorts Age 75-79 at Admission in 1996:
Section 202 Current and Former Residents
BLength of Stay Section 202 Cohorts by Age
75 76 77 78 79 75-79
Mean 4.67 4.62 4.48 4.69 4.39 4.58
Median 5.92 5.86 5.61 5.80 5.21 5.73
Estimated Median Survival Time 6.60 6.54 6.10 6.32 5.62 6.28
Note: Median survival time is the estimated tenure at which exactly half the households would still be expected to survive as housing recipients, while the other half would have exited. Source: Special tabulations by PD&R staff. TRACS merged data file for reporting
years from Jan. 1996 to Dec. 2002.
66

Table 2-11 Length of Stay (in Years) Among Cohorts Age 75-79 at Admission in 1996:
Public Housing Current and Former Residents
�Length of Stay �Public Housing Cohorts by Age
Mean
Median
Estimated Median Survival Time
75
3.49
3.67
3.70
76
3.43
3.55
3.64
77
3.37
3.33
3.42
78
3.55
3.64
3.68
79
3.37
3.44
3.38
75-79
3.44
3.50
3.56
Note: Median survival time is the estimated tenure at which exactly half the households would still be expected to survive as housing recipients, while the other half would have exited. Source: Special tabulations by PD&R staff. MTCS merged data file for reporting years from Jan. 1996 to Dec. 2002.
Table 2-12 Length of Stay (in Years) Among Cohorts Age 75-79 at Admission in 1996:
Housing Choice Vouchers Current and Former Residents
�Length of Stay �Housing Choice Voucher Cohorts by Age
Mean
Median
Estimated Median Survival Time
75
3.85
4.42
5.16
76
3.79
4.00
4.19
77
3.97
4.42
4.75
78
3.92
4.50
4.45
79
3.51
3.42
3.36
75-79
3.81
4.06
4.34
Note: Median survival time is the estimated tenure at which exactly half the households would still be expected to survive as housing recipients, while the other half would have exited. Source: Special tabulations by PD&R staff. MTCS merged data file for reporting years from Jan. 1996 to Dec. 2002.
67

-- --
--
--
--
--
--
�Table 2-13 Presence of Selected Housing Problems of Very Low Income Elderly Renters,
by Sex and Household Type, National Totals, 2003*
TwoOne Person, Or more Total Elderly One Person, Male FemalePercent of Households with Identified Problem: Persons
Total Households in Nation (in thousands): 3,416 681 1,819 916
Cooking stove or range/oven not in working order: 1.15 1.51 1.42 0.36 Refrigerator not in working order: 0.33 0.13 0.44 0.25 Without both hot and cold water for house or full bath: 0.78 1.56 0.78 0.21 Toilet not working within past 3 months: 1.15 0.80 1.10 1.50
1-3 breakdowns for 6+ hrs: 1.11 0.64 1.10 1.50 4+ breakdowns for 6+ hrs: 0.03 0.16
Room(s) without a working electrical outlet or wall plug: 1.07 0.89 0.71 1.93 Exposed wiring or no electrical wiring in home: 0.47 0.75 0.27 Fuses blown or circuit breakers tripped in last 3 months: 3.86 6.88 2.47 4.36
1-3 times: 3.50 5.94 2.47 3.73 4+ times: 0.36 0.94 0.63
Cold for 24+ hrs. due to breakdown of main heating unit: 1.62 0.84 1.52 2.40 1-3 breakdowns for 6+ hrs: 1.49 0.84 1.39 2.17 4+ breakdowns for 6+ hrs: 0.13 0.13 0.24
Areas of peeling paint/broken plaster larger than 8 x 11 ins: 2.03 1.91 1.44 3.30 Floors with holes large enough to catch a foot: 0.90 0.91 1.55 Common stairways with loose, broken, or missing steps: 8.80 8.86 8.77 8.81 Roof in need of repair: 5.96 8.28 4.42 7.30 Outside walls in need of repair: 3.02 4.44 1.71 4.58 All elevators not in working order: 0.10 0.14 0.10
B*Very low-income is an annual household income up to 50 percent of median income for households in the area in which the property is located.
BSource: Special tabulations of the 2003 American Housing Survey by PD&R staff. N=1,705 For a full discussion of confidence intervals around estimates of zero (shown here as --), see: American Housing Survey for the United States: 2003. Available at http://webstore.huduser.org/catalog/product_info.php?products_id=8056
68

Table 2-14 Presence of Selected Housing Problems of Extremely Low-Income Elderly Renters,
by Sex and Household Type, National Totals, 2003*
One One TwoTotal Elderly Person, Person, Or More
Percent of Households with Identified Problem: Male Female Persons
Total Households in Nation(in thousands): 2,290 468 1,284 539
Cooking stove or range/oven not in working order: 1.45 2.19 1.53 0.61 Refrigerator not in working order: 0.39 0.20 0.62 0.00 Without both hot and cold water for house or full bath: 1.08 2.27 1.10 0.00 Toilet not working within past 3 months: 1.13 1.17 1.19 0.95
1-3 breakdowns for 6+ hrs: 1.08 0.93 1.19 0.95 4+ breakdowns for 6+ hrs: 0.05 0.24 0.00 0.00
Room(s) without a working electrical outlet or wall plug: 1.22 1.29 0.73 2.33 Exposed wiring or no electrical wiring in home: 0.52 0.00 0.93 0.00 Fuses blown or circuit breakers tripped in last 3 months: 3.62 6.31 2.35 4.33
1-3 times: 3.35 5.56 2.35 3.81 4+ times: 0.27 0.75 0.00 0.52
Cold for 24+ hrs. due to breakdown of main heating unit: 1.61 0.80 1.62 2.28 1-3 breakdowns for 6+ hrs: 1.61 0.80 1.62 2.28 4+ breakdowns for 6+ hrs: 0.00 0.00 0.00 0.00
Areas of peeling paint/broken plaster larger than 8 x 11 ins: 2.34 2.38 1.51 4.29 Floors with holes large enough to catch a foot: 0.93 0.00 1.13 1.28 Common stairways with loose, broken, or missing steps: 9.17 8.50 9.24 9.59 Roof in need of repair: 5.75 7.03 4.77 6.98 Outside walls in need of repair: 3.17 5.65 1.77 4.35 All elevators not in working order: 0.15 0.00 0.20 0.17
B* Extremely low-income is an annual household income up to 30 percent of median income for households in the area in which the property is located.
BSource: Special tabulations of the 2003 American Housing Survey by PD&R staff. N=1,162
69

--
-- --
--
--
--
-- --
BTable 2-15 BPresence of Selected Housing Problems of
BVery Low Income Elderly Renters, by Age, 2003*
Percent of Households with Identified Problem: Total Elderly Age 62-70 Age 71-79 Age 80+ Total Households in Nation(in thousands): 3,416 1,152 1,161 1,103
Cooking stove or range/oven not in working order: 1.15 0.40 1.97 1.08 Refrigerator not in working order: 0.33 0.28 0.69 Without both hot and cold water for house or full bath: 0.78 0.87 0.83 0.64 Toilet not working within past 3 months: 1.15 1.73 0.93 0.76
1-3 breakdowns for 6+ hrs: 1.11 1.64 0.93 0.76 4+ breakdowns for 6+ hrs: 0.03 0.10
Room(s) without a working electrical outlet or wall plug: 1.07 1.62 1.17 0.40 Exposed wiring or no electrical wiring in home: 0.47 1.03 0.37 Fuses blown or circuit breakers tripped in last 3 months: 3.86 4.22 5.05 2.22
1-3 times: 3.50 3.47 4.75 2.22 4+ times: 0.36 0.76 0.30
Cold for 24+ hrs. due to breakdown of main heating unit: 1.62 1.94 2.08 0.80 1-3 breakdowns for 6+ hrs: 1.49 1.75 1.89 0.80 4+ breakdowns for 6+ hrs: 0.13 0.19 0.20
Areas of peeling paint/broken plaster larger than 8 x 11 ins: 2.03 2.27 2.38 1.42 Floors with holes large enough to catch a foot: 0.90 0.85 0.25 1.63 Common stairways with loose, broken, or missing steps: 8.80 7.12 9.24 10.09 Roof in need of repair: 5.96 6.23 6.83 4.77 Outside walls in need of repair: 3.02 4.04 2.83 2.16 All elevators not in working order: 0.10 0.31 B*Very low-income is an annual household income up to 50 percent of median income for households in the area in which the property is located.
BNote: Age based on householder or spouse. BSource: Special tabulations of the 2003 American Housing Survey by PD&R staff. N=1,705
70

--
-- --
-- --
--
-- -- -- --
-- --
Table 2-16 Presence of Selected Housing Problems of Extremely Low-Income Elderly Renters,
by Age (Based on Householder or Spouse), National Totals, 2003*
Percent of Households with Identified Problem: Total Elderly Age 62-70 Age 71-79 Age 80+
Total Households in Nation(in thousands): 2,290 733 817 740
Cooking stove or range/oven not in working order: 1.45 0.62 2.48 1.13
Refrigerator not in working order: 0.39 0.13 0.98
Without both hot and cold water for house or full bath: 1.08 1.36 1.18 0.69
Toilet not working within past 3 months: 1.13 2.24 0.99 0.19
1-3 breakdowns for 6+ hrs: 1.08 2.09 0.99 0.19
4+ breakdowns for 6+ hrs: 0.05 0.15
Room(s) without a working electrical outlet or wall plug: 1.22 2.07 1.25 0.34
Exposed wiring or no electrical wiring in home: 0.52 1.46
Fuses blown or circuit breakers tripped in last 3 months: 3.62 4.38 4.80 1.58
1-3 times: 3.35 3.87 4.49 1.58
4+ times: 0.27 0.51 0.31
Cold for 24+ hrs. due to breakdown of main heating unit: 1.61 2.15 2.05 0.58
1-3 breakdowns for 6+ hrs: 1.61 2.15 2.05 0.58
4+ breakdowns for 6+ hrs: Areas of peeling paint/broken plaster larger than 8 x 11 ins: 2.34 2.98 2.82 1.19
Floors with holes large enough to catch a foot: 0.93 1.04 0.35 1.47
Common stairways with loose, broken, or missing steps: 9.17 7.49 9.12 10.90
Roof in need of repair: 5.75 5.31 7.07 4.73
Outside walls in need of repair: 3.17 4.57 3.22 1.73
All elevators not in working order: 0.15 0.48 B* Extremely low-income is an annual household income up to 30 percent of median income for households in the area in which the property is located. BSource: Special tabulations of the 2003 American Housing Survey by PD&R staff. N=1,162
71

-- --
-- -- --
-- --
-- --
-- --
BTable 2-17 BPresence of Selected Housing Problems of
BVery Low Income Elderly Renters, by Region, 2003*
Percent of Households with Identified Problem: Northeast Midwest South West
Total Households in Region(in thousands): 1,064 799 939 614
Cooking stove or range/oven not in working order: 0.81 0.23 2.19 1.37
Refrigerator not in working order: 0.11 1.09
Without both hot and cold water for house or full bath: 0.26 0.37 1.96 0.42
Toilet not working within past 3 months: 0.67 0.26 1.90 1.98
1-3 breakdowns for 6+ hrs: 0.67 0.26 1.90 1.79
4+ breakdowns for 6+ hrs: 0.18
Room(s) without a working electrical outlet or wall plug: 1.17 0.12 0.98 2.30
Exposed wiring or no electrical wiring in home: 0.42 1.23
Fuses blown or circuit breakers tripped in last 3 months: 3.96 3.21 4.49 3.55
1-3 times: 3.70 2.72 4.00 3.40
4+ times: 0.26 0.48 0.49 0.16
Cold for 24+ hrs. due to breakdown of main heating unit: 1.92 2.95 0.85 0.56
1-3 breakdowns for 6+ hrs: 1.72 2.66 0.85 0.56
4+ breakdowns for 6+ hrs: 0.20 0.29
Areas of peeling paint/broken plaster larger than 8 x 11 ins: 2.53 1.45 2.16 1.73
Floors with holes large enough to catch a foot: 1.64 0.63 0.48 0.62
Common stairways with loose, broken, or missing steps: 13.78 6.84 4.66 9.05
Roof in need of repair: 6.03 6.55 6.65 4.02
Outside walls in need of repair: 2.73 3.19 4.47 1.10
All elevators not in working order: 0.25 0.11 B*Very low-income is an annual household income up to 50 percent of median income for households in the area in which the property is located.
BNote: Age based on householder or spouse. BSource: Special tabulations of the 2003 American Housing Survey by PD&R staff. N=1,705
72

-- -- --
-- -- --
-- --
-- -- --
-- --
Table 2-18 Presence of Selected Housing Problems of Very Low Income Elderly Renters,
by Racial/Ethnic Group, National Totals, 2003*
White, Black, Other, Elderly Non- Non- Non-
Percent of Households with Identified Problem: Total Hispanic Hispanic Hispanic Hispanic
Total Households in Nation(in thousands): 3,416 2,241 618 151 406
Cooking stove or range/oven not in working order: 1.15 1.25 1.03 2.20 0.40 Refrigerator not in working order: 0.33 0.50 Without both hot and cold water for house or full bath: 0.78 0.67 1.15 1.96 0.40 Toilet not working within past 3 months: 1.15 0.68 2.22 1.36 2.01
1-3 breakdowns for 6+ hrs: 1.11 0.63 2.22 1.36 2.01 4+ breakdowns for 6+ hrs: 0.03 0.05
Room(s) without a working electrical outlet or wall plug: 1.07 0.61 2.08 3.66 1.13 Exposed wiring or no electrical wiring in home: 0.47 0.54 0.64 Fuses blown or circuit breakers tripped in last 3 months: 3.86 3.45 4.73 2.85 5.14
1-3 times: 3.50 3.07 4.73 2.85 4.21 4+ times: 0.36 0.38 0.93
Cold for 24+ hrs. due to breakdown of main heating unit: 1.62 1.21 2.64 3.95 1.49 1-3 breakdowns for 6+ hrs: 1.49 1.21 2.27 3.95 0.96 4+ breakdowns for 6+ hrs: 0.13 0.37 0.54
Areas of peeling paint/broken plaster larger than 8 x 11 ins: 2.03 1.19 5.45 2.25 Floors with holes large enough to catch a foot: 0.90 0.24 2.19 1.34 2.38 Common stairways with loose, broken, or missing steps: 8.80 7.60 9.45 10.64 13.74 Roof in need of repair: 5.96 5.27 9.33 6.73 4.35 Outside walls in need of repair: 3.02 2.38 5.61 2.20 2.90 All elevators not in working order: 0.10 0.04 0.43
B*Very low-income is an annual household income up to 50 percent of median income for households in the area in which the property is located.
BSource: Special tabulations of the 2003 American Housing Survey by PD&R staff. N=1,705
73

-- -- --
-- -- -- -- -- --
-- --
-- -- -- -- -- --
-- --
�Table 2-19 Presence of Selected Housing Problems of Extremely Low-Income Elderly Renters,
by Racial/Ethnic Group, National Totals, 2003*
White, Black, Other, Percent of Households with Identified Problem: Total Non- Non- Non-
BElderly Hispanic Hispanic Hispanic Hispanic
Total Households in Nation(in thousands): 2,290 1,455 456 110
Cooking stove or range/oven not in working order: 1.45 1.69 1.34 0.81 0.61 Refrigerator not in working order: 0.39 0.61 Without both hot and cold water for house or full bath: 1.08 0.90 1.56 2.68 0.61 Toilet not working within past 3 months: 1.13 0.65 1.97 1.86 2.01
1-3 breakdowns for 6+ hrs: 1.08 0.57 1.97 1.86 2.01 4+ breakdowns for 6+ hrs: 0.05 0.08
Room(s) without a working electrical outlet or wall plug: 1.22 1.06 1.90 1.40 Exposed wiring or no electrical wiring in home: 0.52 0.55 0.87 Fuses blown or circuit breakers tripped in last 3 months: 3.62 2.64 5.92 3.90 4.93
1-3 times: 3.35 2.40 5.92 3.90 3.88 4+ times: 0.27 0.24 1.04
Cold for 24+ hrs. due to breakdown of main heating unit: 1.61 1.44 1.34 5.40 1.45 1-3 breakdowns for 6+ hrs: 1.61 1.44 1.34 5.40 1.45 4+ breakdowns for 6+ hrs:
Areas of peeling paint/broken plaster larger than 8 x 11 ins: 2.34 1.53 5.85 1.79 Floors with holes large enough to catch a foot: 0.93 0.24 1.37 1.83 3.59 Common stairways with loose, broken, or missing steps: 9.17 8.55 9.83 7.64 12.04 Roof in need of repair: 5.75 4.74 8.84 7.30 5.32 Outside walls in need of repair: 3.17 2.21 5.55 3.01 4.39 All elevators not in working order: 0.15 0.06 0.58
B* Extremely low-income is an annual household income up to 30 percent of median income for households in the area in which the property is located.
BSource: Special tabulations of the 2003 American Housing Survey by PD&R staff. N=1,162
74
269

Table 2-20 Presence of Selected Housing Problems of Elderly Participants
in the Housing Choice Voucher Program, by Household Type, 2000-2002*
Percent of Households with Identified Problem:
Total Elderly
One Person,
Male
One Person, Female
Two Or More Persons
Some stove burners do not work: 3.8 3.7 3.3 5.2 Oven not in working order: 2.1 2.7 2.0 2.2 Refrigerator does not keep food cold enough that it does not spoil: 2.4 3.5 2.1 2.6 Without both hot and cold water for each kitchen and bathroom sink, tub and shower: 1.5 1.7 1.2 2.0
Toilet not working today: 1.0 1.0 0.7 1.7 Toilets not working within past 3 months:
1-3 breakdowns for 6+ hrs: 4.8 5.1 4.5 5.7 4+ breakdowns for 6+ hrs: 1.6 1.5 1.2 2.5
Room(s) without a working electrical outlet: 0.8 1.0 0.6 1.4 Electrical wiring not enclosed in walls or metal coverings: 3.7 5.1 2.8 5.5 Electrical outlets and switches lack cover plates: 4.8 3.8 4.7 5.5 Fuses blown or circuit breakers tripped in last 3 months:
1-3 times: 9.3 8.0 8.4 12.2 4+ times: 1.1 0.8 0.9 2.0
Heating systems fails to provide enough heat in every room: 8.5 9.9 7.5 10.3 Last winter so cold for 24+ hours that someone in the home was uncomfortable: 8.9 10.3 7.9 11.1
Last winter 1-3 heating breakdowns for 6+ hrs: 6.9 5.7 6.6 8.4 Last winter 4+ heating breakdowns for 6+ hrs: 1.8 4.2 1.2 1.9
Areas of peeling paint/broken plaster larger than 8 x 11 ins: 3.2 3.5 2.7 4.5 Floor problems such as boards, tiles, carpeting or linoleum that are missing, curled, or loose: 8.9 8.8 7.5 12.6
Place where floor problems can cause one to trip: 4.5 3.9 3.8 6.9 Outside handrails, steps or stair that are unsafe: 7.4 6.6 6.8 9.2 Problems with roof, such as sagging, holes or missing roofing: 3.4 3.5 3.0 4.2 Outside walls with serious leaning, buckling or large holes: 2.9 2.8 2.7 3.5 All elevators not in working order:++ 3.9 1.6 3.9 5.6
BSource: Special tabulations of the Section 8 Customer Satisfaction Survey by PD&R staff. *Elderly is 62 years or older. N=93,333; 4,866=missing. ++ N=14,283
75

Table 2-21 Presence of Selected Housing Problems of Elderly Participants
in the Housing Choice Voucher Program, by Age of Reference Person, 2000-2002*
Total Percent of Households with Identified Problem: Elderly Age 62-70 Age 71-79 Age 80+
Some stove burners do not work: 3.8 3.9 3.1 4.7 Oven not in working order: 2.3 2.2 2.0 2.8 Refrigerator does not keep food cold enough that it does not spoil: 2.4 2.6 2.4 2.1 Without both hot and cold water for each kitchen and bathroom sink, tub and shower: 1.7 2.0 1.4 1.5
Toilet not working today: 1.0 1.1 .9 1.0 Toilets not working within past 3 months:
1-3 breakdowns for 6+ hrs: 4.9 5.6 4.4 4.1 4+ breakdowns for 6+ hrs: 1.6 2.0 1.4 1.1
Room(s) without a working electrical outlet: 0.9 0.9 0.9 0.7 Electrical wiring not enclosed in walls or metal coverings: 3.8 4.6 3.6 2.4 Electrical outlets and switches lack cover plates: 4.8 4.5 5.0 5.1 Fuses blown or circuit breakers tripped in last 3 months:
1-3 times: 9.2 10.5 8.9 7.3 4+ times: 1.1 1.4 1.0 0.8
Heating systems fails to provide enough heat in every room: 8.6 10.2 8.1 6.5 Last winter so cold for 24+ hours that someone in the home was uncomfortable: 9.0 10.4 8.3 7.2
Last winter 1-3 heating breakdowns for 6+ hrs: 6.9 7.3 6.6 6.7 Last winter 4+ heating breakdowns for 6+ hrs: 1.8 2.4 1.7 0.8
Areas of peeling paint/broken plaster larger than 8 x 11 ins: 3.3 4.0 2.9 2.3 Floor problems such as boards, tiles, carpeting or linoleum that are missing, curled, or loose: 8.9 11.1 7.6 6.8
Places where floor problems can cause one to trip: 4.5 5.4 4.0 3.7 Outside handrails, steps or stair that are unsafe: 7.4 8.2 6.8 6.9 Problems with roof, such as sagging, holes or missing roofing: 3.4 4.2 3.2 2.1 Outside walls with serious leaning, buckling or large holes: 2.9 3.4 2.8 1.9 All elevators not in working order:++ 3.9 5.9 3.2 2.7
BSource: Special tabulations of the Section 8 Customer Satisfaction Survey by PD&R staff. *Elderly is 62 years or older. N=93,333; 4206=missing.++ N=14,371
76

Table 2-22 Presence of Selected Housing Problems of Elderly Participants
in the Housing Choice Voucher Program, by Region, 2000-2002*
Percent of Households with Identified Problem: Northeast Midwest South West
Some stove burners do not work:Oven not in working order:Refrigerator does not keep food cold enough that it does not spoil:Without both hot and cold water for each kitchen and bathroom sink, tub and shower: Toilet not working today: Toilets not working within past 3 months:
1-3 breakdowns for 6+ hrs: 4+ breakdowns for 6+ hrs:
Room(s) without a working electrical outlet: Electrical wiring not enclosed in walls or metal coverings: Electrical outlets and switches lack cover plates: Fuses blown or circuit breakers tripped in last 3 months:
1-3 times: 4+ times:
Heating systems fails to provide enough heat in every room: Last winter so cold for 24+ hours that someone in the home was uncomfortable:
Last winter 1-3 heating breakdowns for 6+ hrs: Last winter 4+ heating breakdowns for 6+ hrs:
Areas of peeling paint/broken plaster larger than 8 x 11 ins: Floor problems such as boards, tiles, carpeting or linoleum that are missing, curled, or loose:Place where floor problems can cause one to trip: Outside handrails, steps or stair that are unsafe:Problems with roof, such as sagging, holes or missing roofing:Outside walls with serious leaning, buckling or large holes:All elevators not in working order:++
5.1 3.1 4.2 2.7 3.1 1.4 1.9 1.9 3.1 2.0 2.3 2.1
2.2 .9 1.4 1.0
1.0 0.8 1.2 0.8
4.3 4.4 6.5 4.2 1.4 1.4 2.1 1.4 0.8 0.5 0.9 1.0 4.7 2.1 3.3 4.2 5.2 4.5 5.3 4.1
9.8 9.9 9.9 8.0 1.1 1.3 1.5 0.7 8.5 7.0 8.3 9.4
12.8 8.1 7.6 7.2
11.8 6.5 6.2 3.7 2.5 1.2 1.1 2.0 4.6 2.6 3.4 2.3
9.2 8.5 10.4 7.6
5.5 3.6 5.2 3.6 8.0 8.0 7.3 6.5 4.0 3.9 3.7 2.4 3.4 2.6 3.3 2.2 3.7 3.3 5.6 3.6
BSource: Special tabulations of the Section 8 Customer Satisfaction Survey by PD&R staff. *Elderly is 62 years or older. N=93,333; 4,731=missing. ++ N=14,325
77

------------------------------------------------------------------------------------------------------------------------------------
Table 2-23 Presence of Selected Housing Problems of Elderly Participants
in the Housing Choice Voucher Program, by Race, 2000-2002*
Percent of Households with Identified Problem: Elderly White, Black, Other, Hispanic Total Non- Non- Non-
Hispanic Hispanic Hispanic
Some stove burners do not work: 3.5 3.0 4.9 2.8 5.6 Oven not in working order: 1.8 1.7 1.9 2.8 4.8 Refrigerator does not keep food cold enough that it 2.2 1.8 3.0 4.0 3.4 does not spoil: Without both hot and cold water for each kitchen and 1.3 1.2 1.5 1.3 3.6 bathroom sink, tub and shower: Toilet not working today: 0.8 0.6 1.4 0.5 1.8 Toilets not working within past 3 months:
1-3 breakdowns for 6+ hrs: 4.8 4.1 6.9 4.6 5.1 4+ breakdowns for 6+ hrs: 1.5 1.1 2.4 1.6 2.3
Room(s) without a working electrical outlet: 0.7 0.6 0.9 2.3 1.6 Electrical wiring not enclosed in walls or metal 3.3 2.7 4.3 6.3 6.3 coverings: Electrical outlets and switches lack cover plates: 4.6 3.8 6.3 7.4 6.0 Fuses blown or circuit breakers tripped in last 3 months:
1-3 times: 9.9 8.7 12.4 5.7 7.7 4+ times: 1.1 0.9 1.8 1.4 1.1
Heating systems fails to provide enough heat in every 8.3 6.5 13.2 8.1 10.2 room: Last winter so cold for 24+ hours that someone in the 8.5 7.5 11.3 7.3 11.5 home was uncomfortable:
Last winter 1-3 heating breakdowns for 6+ hrs: 6.5 5.8 8.7 4.7 9.2 Last winter 4+ heating breakdowns for 6+ hrs: 1.8 1.6 2.3 0.9 1.8
Areas of peeling paint/broken plaster larger than 8 x 2.8 2.0 5.0 2.8 5.5 11 ins: Floor problems such as boards, tiles, carpeting or 8.6 7.1 13.4 5.1 10.1 linoleum that are missing, curled, or loose: Place where floor problems can cause one to trip: 4.3 3.6 6.5 2.3 5.6 Outside handrails, steps or stair that are unsafe: 7.3 6.1 10.5 6.8 8.2 Problems with roof, such as sagging, holes or missing 3.4 2.8 5.2 3.3 3.4 roofing: Outside walls with serious leaning, buckling or large 3.0 2.3 5.1 2.0 2.3 holes: All elevators not in working order: 3.8 3.4 4.9 4.4 4.7
B
BSource: Special tabulations of the Section 8 Customer Satisfaction Survey by PD&R staff. *Elderly is 62 years or older. N=93,333; 13,019=missing. ++ N=12,971
78

Table 2-24 Characteristics of Residents of Section 202 Properties,
By Presence of Service Coordinators and Number of Units in Property, 2006
Without Service
Coordinator
With Service Coordinator, by Property Size
1-49 property
50 - 99 property
100+ property
With service Coordinator
202, All
units units units Number of Properties 3,779 858 913 545 2,316 6,095 Number of units 157,603 28,368 61,602 74,538 164,508 322,111 Number of assisted units 151,858 28,001 60,587 67,199 155,787 307,645 Total Households 147,941 28,013 60,431 65,342 153,786 301,727 Reported Elderly Households 122,563 23,826 56,654 59,661 140,141 262,704 Total Members 158,592 29,838 64,337 70,629 164,804 323,396 % Less than 62 17.8 16.4 6.8 9.1 9.5 13.6 % 62-64 5.6 5.6 4.7 4.8 4.9 5.3 % 65-69 14.3 14.5 14.5 13.4 14 14.2 % 70-74 16.9 17 19.4 17.4 18.1 17.5 % 75-79 17.6 18.1 21.1 19.6 19.9 18.8 % 80-84 14.8 15.5 18.1 17.9 17.5 16.2 % 85 or older 13 13 15.4 17.7 16 14.5
Total 100% 100% 100% 100% 100% 100% Age Distribution of Persons
Mean 70.7 71 74.9 74.7 74.1 72.4 Median 73 73.5 76 76 75 74
Household size 1-person household 92.5 93.5 93 91.3 92.4 92.4
2 or more persons in households 7.5 6.5 7 8.7 7.6 7.6
Total 100% 100% 100% 100% 100% 100% Gender of persons male 30.6 27.9 26.1 27.6 27.1 28.8 female 69.4 72.1 73.8 72.4 72.9 71.1
Total 100% 100% 100% 100% 100% 100% Race of persons White, non-Hispanic 62.2 72 58 57.1 60.2 61.2 Black, non-Hispanic 18.3 15.6 21.7 21.4 20.4 19.4 Other, non-Hispanic 6.4 3.9 6.8 8.1 6.8 6.6 Hispanic 13.1 8.5 13.5 13.5 12.6 12.9
Total 100% 100% 100% 100% 100% 100%
79

Table 2-24 (continued)
Without Service
Coordinator
With Service Coordinator, by Property Size
1-49 property units
50 - 99 property units
100+ property units
With service
Coordinat or
202, All
Household income less than $5,000 3 2.4 1.8 1.9 1.9 2.5 $5,000 to $9,999 46.5 42.7 42 43.5 42.8 44.6 $10,000 to $14,999 33.4 35.9 36.2 34.1 35.2 34.3 $15,000 to $19,999 12.3 14.1 14.6 13.8 14.2 13.3 $20,000 to $24,999 3.4 3.8 4.1 4.8 4.3 3.9 $25,000 and over 1.3 1.2 1.4 2 1.6 1.5
Total 100% 100% 100% 100% 100% 100% Household income Mean $11,074 $11,418 $11,594 $11,658 $11,589 $11,337 Median $10,032 $10,462 $10,452 $10,315 $10,404 $10,236 Major source of household income Wage 1.8 1.9 1.3 1.3 1.4 1.6 Welfare 0.6 0.5 0.4 0.5 0.5 0.5 SS 76.4 81.1 78.6 74.8 77.5 76.9 SSI 15.7 10.8 14 17.5 14.9 15.3 Pension 3.3 3.5 3.8 4.1 3.9 3.6 Other 2.1 2.2 1.8 1.8 1.8 2
Total 100% 100% 100% 100% 100% 100% Percent with any income % wages 6.7 5.1 3.2 3.3 3.6 5.1 % welfare 2.4 2.3 1.8 2.5 2.2 2.3 % Social Security 83.1 87.1 85.7 81.6 84.2 83.7 % SSI 30.4 24.1 27.1 30.5 28 29.2 % pension 20.6 24.3 25.5 24.8 24.9 22.8 % other,none 3.9 4.4 3.6 3.6 3.8 3.8
80

---------------------------------------------------------------------------------------------------------------------------------
Table 2-24 (continued)
Without With Service Coordinator, by
Service Coordinator 1-49
property
Property Size 50 - 99 property
100+ property
With service Coordinator
202, All
units units units
Metropolitan location Central City(MSA) 45.8 34.9 54.6 65.1 55.5 50.8 Suburban (MSA) 33.1 37.8 37.8 32 35.3 34.2 Rural (Non-MSA) 21.1 27.2 7.7 2.9 9.2 15
Total 100% 100% 100% 100% 100% 100% Regional location Northeast 21.1 26.4 27.1 29.2 27.9 24.6 Midwest 21.2 30.6 26.2 25.7 26.7 24 South 35.1 22.5 28 27.3 26.7 30.8 West 17.1 17.6 15.9 15.5 16 16.6 Trust territories 5.4 2.8 2.9 2.4 2.7 4
Total 100% 100% 100% 100% 100% 100% Tenure years % Less than 1 year 25 25.4 21.5 20.2 21.7 23.3 % 1-2 years 12.2 12.7 11.6 10.2 11.2 11.7 % 2-3 years 9.5 10.3 9.8 8.6 9.4 9.5 % 3-4 years 8.2 9 9 7.6 8.4 8.3 % 4-5 years 6.5 7.1 7.1 6.6 6.9 6.7 % 5-10 years 21.4 21.1 24.1 24.1 23.5 22.5 % 10-15 years 9.7 8.8 11 12.4 11.2 10.4 % 15-20 years 4.5 4.4 4.2 6.1 5 4.8 % 20 or more years 3 1.2 1.7 4.4 2.8 2.9
Total 100% 100% 100% 100% 100% 100% Mean tenure,years 5.3 4.8 5.4 6.4 5.7 5.5 Median tenure,years 3.5 3 4 4.9 4 4 Age at admission, New % Less than 62 20.3 18.1 8.9 13.2 12.6 16.7 % 62-64 12.9 12.7 13.5 13.5 13.4 13.1 % 65-69 18.8 18.3 20.7 20.4 20.1 19.4 % 70-74 16.5 16.5 19.1 16.8 17.6 17 mean age at admission 66.4 67.6 70.4 69.2 69.4 67.9 median age at admission 68.5 69.3 70.3 69.5 69.8 69.2
Source: Special tabulations by PD&R staff.
81

Chapter Three: Improving Program Efficiency
This chapter presents evidence on cost issues for the Section 202 program, including subsidy costs, development costs, development cost limits, and time needed to process Section 202 projects. The chapter concludes with recommendations for improving program efficiency.
Costs and Benefits of Housing Choice Vouchers and Section 202 Housing
An important source of information on the comparative costs of Federal housing assistance programs is a 2002 study by the Government Accountability Office (GAO). 51
F
The GAO study compared the total per-unit costs of six active programs: Housing Choice Vouchers, Low-Income Housing Tax Credits, Hope VI, Section 202, Section 811, and Section 515. The GAO determined total costs and estimated the share of total costs paid for by the Federal government, tenants, and others, including State and local governments. In comparing the total costs of these programs, the GAO took into account - but did not attempt to measure - quality differences.
GAO’s definition of total cost basically consists of rent plus expenses not included in rent. In the private rental housing market, the rent covers the total cost of providing a housing unit, including the operating expenses (e.g., administrative expenses, utilities, routine maintenance, and property taxes); debt service; deposits to a replacement reserve for major capital improvements over time; and a market return to equity investors. Under the voucher program, the rent also covers other expenses of providing a housing unit. For example, the assisted household generally pays 30 percent of income for rent, but the voucher makes up the difference between the household’s contribution and the market rent. In addition, the federal government pays a fee, estimated by the GAO to be about 7 to 8 percent of the rent, to the public housing agency that administers the voucher program locally on HUD’s behalf. Thus, under the voucher program, GAO’s formula for total cost of the program is:
Total Costs = Rents + Administrative Fee
Note that in this formula, rents include contributions by both the federal government and the assisted households.
Under the production programs, such as Section 202, the federal government provides development subsidies for new construction or substantial rehabilitation and frequently also provides rental assistance. State and local governments or private entities may provide additional development subsidies. In Section 202, the federal subsidy is a capital advance, essentially an up-front grant, if the housing remains available for 40 years to the low-income elderly. The subsidies help to lower the rents while also providing additional services and amenities. The Section 202 resident generally pays 30 percent of income
51 Government Accountability Office (2002) Federal Housing Assistance: Comparing the Characteristics and Costs of Housing Programs. GA0-02-76. Available at: www.gao.gov.
82

toward rent, and the government makes up the difference. Thus, GAO’s formula for Section 202 (and other production programs) is:
Total Costs = Rents + Development Subsidies
Note that for Section 202, rents include both contributions made under Project Rental Assistance Contracts (PRAC) and contributions towards housing expense made by the assisted households.
Vouchers and the production programs are subject to and insulated from different cost risks over time. Whereas vouchers are vulnerable to inflation in market rents, programs such as Section 202 are less vulnerable because of federal regulations or limits on rents that are associated with development subsidies. Unlike vouchers, the production programs can pose substantial cost risks if capital reserves are under-funded. This has not been a significant problem for the Section 202 program, however, for a several reasons. The early Section 202/8 projects received a relatively generous rent, which allowed for very adequate reserves for maintenance and capital improvement. Further, the use of non-profit entities as owners apparently helped to assure that these funds were used as intended. The result (as indicated in Chapter Two) is that Section 202 facilities are generally in good condition, particularly when compared with the remainder of the multifamily portfolio. 52
F
As already noted in Chapter Two, Section 202 properties frequently include congregate dining facilities, and often include common rooms as well as access to transportation, housekeeping, health care, and other services. Recently built Section 202/PRAC housing often offers accessible housing with modern amenities, whereas voucher units often lack accessibility features and have amenities that are characteristic of substantially older rental properties. New units developed under the Section 202/8 PRAC program clearly start out in better condition than existing units primarily utilized under the voucher program, and over time, these units are likely to remain in better condition.
In their 2002 report, GAO’s most important finding regarding total cost was that in both metropolitan and non-metropolitan areas, the average total 30-year cost of each of the production programs, including Section 202, exceeds the cost of providing a voucher for a unit with the same number of bedrooms. To control the impact of unit size on costs, the GAO compared the costs of units with the same number of bedrooms across programs.
The GAO estimated the per-unit, thirty-year cost of Section 202 housing at $157,000 in metropolitan areas and $133,000 in non-metropolitan areas. This is the discounted
52 Some of the oldest Section 202 projects have not been able to maintain adequate reserves. Twenty percent of these facilities reported in 1999 that their capital reserves were inadequate to meet current repair needs, and 36 percent reported that reserves were inadequate to meet projected repair needs. See: Heumann, Leonard, Karen Winter-Nelson, and James Anderson (2001) The 1999 Survey of Section 202 Housing for the Elderly. AARP Public Policy Report #2001-02. Washington DC: AARP.
83

present value cost of the stream of payments, both by the tenant and by the government, and including the capital advance to support the original development. This cost was 12 percent more than for vouchers for metropolitan areas, and 39 percent more than vouchers in non-metropolitan areas. However, one must take into account that Section 202 housing is more likely to include features that are supportive of the frail elderly than vouchers. In serving their needs, Section 202 housing is clearly a better value.
The GAO found that, across the production programs, the average total costs are actually very similar to each other. For one-bedroom units in metropolitan areas, the average 30year cost of the most expensive program (i.e. tax credits) is only 10 percent greater than that of the least expensive one (i.e. Section 811). In non-metropolitan areas, the difference in the average total cost for one-bedroom units between the most expensive program (tax credits) and the least expensive one (Section 811) is even smaller—only 6 percent.
Figure 3-1 Comparison of Per-Unit, Thirty Year Costs,
by Program Type and Type of Location
Source: Government Accountability Office (2002) Federal Housing Assistance: Comparing the HCharacteristics and Costs of Housing Programs. GA0-02-76. Available at: www.gao.gov.
84

The GAO notes that neighborhood characteristics may influence market rents and total development costs (in particular, the value of land). Under the voucher program, variations in market rents within a metropolitan area for similar-sized units may be influenced by neighborhood differences, such as quality of schools, crime rates, and pollution. Market rents may also be influenced by the quality of the units, proximity to jobs and shopping centers, and the amenities and services offered. Under production programs such as Section 202, variations in total development cost within a metropolitan area reflect not only differences in neighborhoods but also in property and unit amenities, project sponsors, program requirements, and a host of other factors. In short, the GAO recognizes a lack of comparability in how programs are costed out, because the value of land and therefore rents paid by vouchers are going to inflate over time.
GAO’s findings quantify the additional cost that Section 202 properties incur when compared with vouchers. A key issue is whether a twelve percent higher cost incurred for a Section 202 unit in a metropolitan area is offset by greater benefits, particularly since Section 202 housing provides features and services that are not generally available in private-market housing available to persons using vouchers.
The quality of new Section 202/PRAC housing is uniformly good, regardless of where the project is built. The quality of housing occupied by elderly voucher participants varies by geographic region of the country. Housing in the western States is likely to be newer and in better condition, while housing in large northeastern cities and in the rural south is likely to be much older and in poorer condition. Thus, when an elderly person moves into a newly developed Section 202/PRAC facility, she is likely to occupy good quality housing with accessibility features, congregate dining (i.e. meals served to residents who sit together in a building’s dining area), and services, regardless of location (see Table 2-3). An elderly person using a voucher is likely to occupy much older housing, possibly without all needed accessibility features and probably without access to congregate dining or services.
Elderly participants using vouchers will find the best quality housing where there is an adequate supply: housing quality and availability must both be adequate. Vouchers work better in some housing markets than others, and they also work better in some years than others, because market conditions change. Within individual markets there can be wide swings in housing availability, and in landlord willingness to participate in the voucher program.
The voucher program works best if participants are willing and able to move to a new residence. It is the responsibility of the participant to communicate to the landlord when repairs are needed. Participants are also expected to move if the rent (which is set by the landlord, not the government), becomes more than the participant is willing or able to pay. 53 On other words, if the rent burden become too high in the voucher program, the F
remedy is to move, which is not very realistic for a frail elder.
53 Rent increases are borne by the participant only to the extent that the gross rent (including the utility allowance) exceeds the payment standard established by the public housing agency (PHA). The PHA must also make a finding that the rent is reasonable. Past research has indicated that
85
Note that Section 202 insulates elderly tenants from increases in rent burden, by limiting rents to 30 percent of household income for units not subject to price fluctuations of the private housing market. This is appropriate for frail, elderly people. If these residents are required to relocate, they are at a distinct disadvantage in the competition for the limited supply of affordable, eligible housing. 54
F
Finding another willing landlord and moving to another location is difficult for any voucher program participant, but may be particularly challenging for elders, especially those who are frail. The needs of the elderly are quite diverse, and the voucher program has been found in prior research to be well suited to the needs of some elderly persons. About 23 percent of all elderly households who receive rental assistance under a HUD program use vouchers, and (as indicated in Chapter Two) these households express a high degree of satisfaction with their home and their neighborhoods.
An evaluation of the Hope for Elderly Independence Demonstration Program (also known as HOPE IV), which provided supportive services to frail elderly persons who used housing vouchers, found a high degree of satisfaction with the program. 55 Elderly voucher participants live in a broader range of neighborhoods than residents of Section 202 or other Federal housing programs. So, for those elderly persons who have family supports and sufficient mobility, including the ability to move to another housing unit if necessary, the voucher program can be a very good choice. But, vouchers should not be viewed as a panacea. Vouchers may not be the best choice for persons who are at risk of institutionalization. Risk factors can include mobility impairments that limit the ability to perform necessary activities, such as shopping, cleaning and cooking. This topic will be discussed in greater depth in Chapter Four.
Subsidy Costs for Section 202 and Other Programs
This section uses HUD administrative data and information from a one-time survey to compare subsidy costs of these programs: Section 202/8 (i.e., the older Section 202 projects); Section 202/PRAC (the newer Section 202 projects); Section 8 New
about half of units occupied by elderly participants have gross rents that are below the payment standard. Voucher program participants (whether elderly or nonelderly) may sometimes find it difficult to grasp the implications of these program rules and of changes in PHA payment standard policy.
54 Joint Center for Housing Studies (1995) cited by Keyes, Langley C. et al. (1996) “Networks and Nonprofits: Opportunities and Challenges in an Era of Federal Devolution,” Housing Policy Debate 7 (2) 201-229.
55Ficke, Robert C. and Susan G. Berkowitz (1999) Evaluation of the HOPE for Elderly Independence Demonstration: FINAL REPORT. Westat, Inc., Rockville, MD. Note that vouchers provided under Hope IV have higher total costs than regular vouchers because they include the costs of supportive services and administrative costs that are not normally part of the voucher program.
86

Construction and Substantial Rehabilitation (NC/SR); and Housing Choice Vouchers. To the extent possible, costs are compared only for elderly participants occupying one-bedroom units. 56
F
Information on rental subsidies comes from HUD’s administrative data systems, as of December 2004. The average subsidy cost for Housing Choice Vouchers when used by an elderly household (i.e., with a head or spouse age 62 or older) was $441 per month. This cost includes the rental assistance payment and an additional eight percent to reflect the cost of administrative fees. The subsidy cost for Section 8 NC/SR was $483 per month, and the cost for Section 202/8 housing was $534 monthly.
In order to present information on the subsidy cost for Section 202/PRAC, it is necessary to combine two different kinds of cost. The PRAC is a monthly rental assistance cost, and is comparable to the Section 8 Housing Assistance Payment (HAP). The capital advance, which covers most or all of the cost of development, provides benefits over a long period of time, thirty to forty years. To allow for a valid comparison of subsidy costs incurred in vouchers and other programs, we have made a discounted,present value calculation for rental assistance and capital advance costs.
In 2005, the National Association of Homebuilders Research Center conducted a cost evaluation of the Section 202 (and Section 811) Supportive Housing programs. The primary purpose of this study was to determine the accuracy and reasonableness of the project development cost limits used in the programs. 57 The NAHB Research Center collected data from HUD’s local field offices for Section 202 projects with construction completed after January 2000 and through December 2002. Complete cost data was assembled and analyzed for 338 Section 202 properties. Average construction costs (these are construction costs that reflect the cost of improvements but not the land cost) was found to be $72,554 per unit. 58 A key finding of the study was construction costs are F
reasonable on a per-unit and per square foot basis when compared with industry standards. The study did not provide information on the portion of development cost covered by capital advances for these projects.
HUD’s Development Application and Processing (DAP) system is used to manage new multifamily development applications. It captures information on development costs, but the fields are not always kept complete and current, and as a result, DAP does not provide reliable information on Section 202 development costs. However, data are available from
56 It was not possible to exclude Section 202 development costs for efficiency or two bedroom units.
57 National Association of Homebuilders Research Center, Inc. and Columbia enterprises, Inc. Construction Cost Indices: HUD Section 202 and 811 Supportive Housing Programs, March 2005. Available at www.HUDUSER.org
58Assuming that land costs are, on average, equal to approximately 15 percent of total development cost, these findings would be consistent with a total development cost of approximately $85,350 during the 2000-2002 time period.
87

a special survey conducted by HUD’s Office of Housing for projects that reached initial closing during FY 2000. HUD’s field staff conducted a review of project files for these properties, and collected information from sponsors and other sources (such as State agencies) in order to compile information on development cost. Information was gathered on 135 properties (5,605 units) located in 38 States and Puerto Rico. The average development cost per-unit was found to be $81,143.
In FY 2000, on average, the capital advance to a sponsor was equal to about 90 percent of the total development cost. 59 For just under one-half of the properties, the capital F
advance was equal to 100 percent of the development cost, while in 14 percent of properties the advance was equal to 80 percent or less of the development cost. Many properties had obtained outside sources of funding, including grants from local Community Development Block Grant (CDBG) or HOME programs, from the local housing authority, the Federal Home Loan Bank, and numerous other sources.
The development costs found in the FY 2000 HUD survey became the starting point for our estimate of 2004 subsidy cost for Section 202/PRAC housing. We adjusted for inflation in development cost between FY 2000 and December 2004, assuming a 5 percent annual increase. Our estimated December 2004 development cost was $89,626. The cost of amortizing this amount at six percent for 30 years is $543 monthly. In addition, the subsidy cost of rental subsidies for Section 202/PRAC properties as of December 2004 was $225 per month. Combining these total costs, we then calculated a discounted present value of total subsidy cost over a thirty-year period, assuming a 3 percent rental inflation rate and a 6 percent discount rate. The resulting thirty-year present value cost for vouchers was $104,962. 60
F
Subsidy costs of production programs were higher: when compared with the cost of vouchers, subsidy costs were 21.2 percent higher for Section 202/8 projects, 9.4 percent higher for Section 8 NC/SR projects, and 29.0 percent higher for Section 202/PRAC projects (see Table 3-1).
Table 3-1 also indicates that the 30-year subsidy costs of Section 202/PRAC projects are 32.8 percent higher than subsidy costs of housing vouchers in central cities and more than twice as expensive (114.3 percent higher) in non-metropolitan areas. At suburban locations, the cost of Section 202/PRAC is only 13.2 percent more expensive than providing vouchers. These results are considered preliminary. A more definitive set of subsidy cost estimates would be based on development cost data from more than one fiscal year, and would adjust for the somewhat lower incomes of Section 202 recipients. 61
F
The capital advance period is 40 years.
60 This includes only subsidy and administrative costs, not total cost as measured by GAO in 2002.
61Public housing subsidy costs have also been found to be higher than for housing vouchers. The most recent available comparison, with data as of FY 1998, found that when comparing the cost
88
59
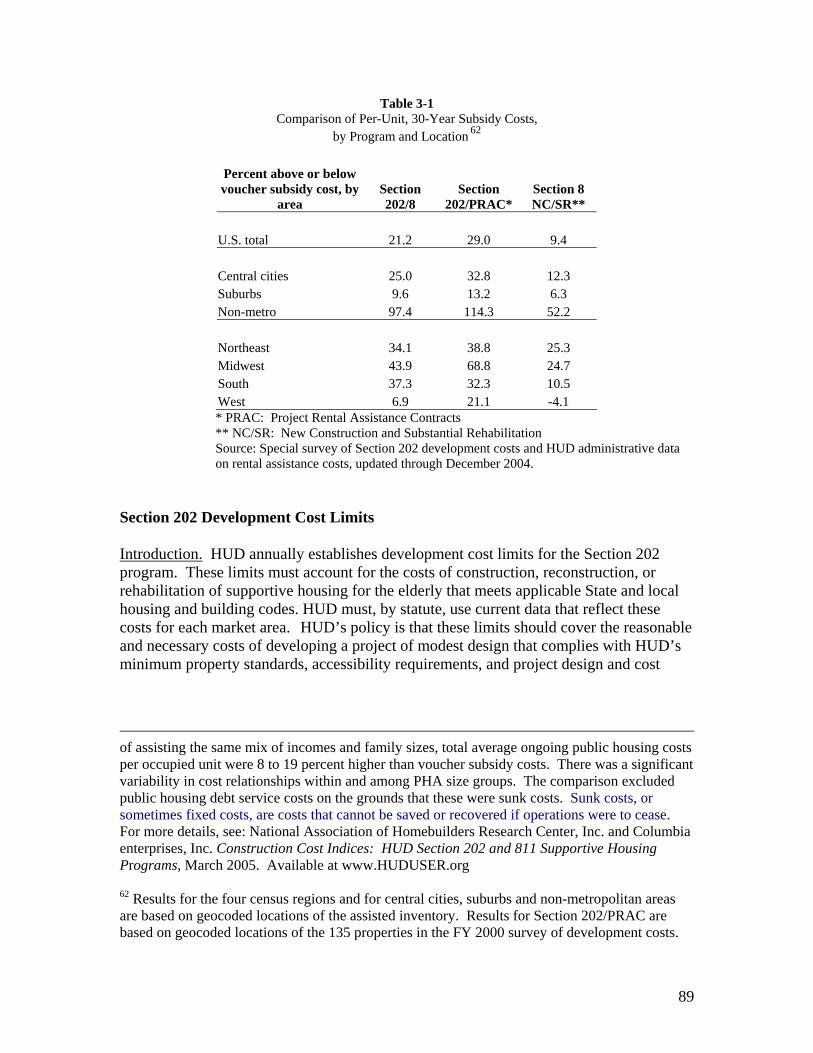
Table 3-1 Comparison of Per-Unit, 30-Year Subsidy Costs,
by Program and Location 62 F
Percent above or below voucher subsidy cost, by Section Section Section 8
area 202/8 202/PRAC* NC/SR**
U.S. total 21.2 29.0 9.4
Central cities 25.0 32.8 12.3 Suburbs 9.6 13.2 6.3 Non-metro 97.4 114.3 52.2
Northeast 34.1 38.8 25.3 Midwest 43.9 68.8 24.7 South 37.3 32.3 10.5 West 6.9 21.1 -4.1 * PRAC: Project Rental Assistance Contracts ** NC/SR: New Construction and Substantial Rehabilitation Source: Special survey of Section 202 development costs and HUD administrative data on rental assistance costs, updated through December 2004.
Section 202 Development Cost Limits
Introduction. HUD annually establishes development cost limits for the Section 202 program. These limits must account for the costs of construction, reconstruction, or rehabilitation of supportive housing for the elderly that meets applicable State and local housing and building codes. HUD must, by statute, use current data that reflect these costs for each market area. HUD’s policy is that these limits should cover the reasonable and necessary costs of developing a project of modest design that complies with HUD’s minimum property standards, accessibility requirements, and project design and cost
of assisting the same mix of incomes and family sizes, total average ongoing public housing costs per occupied unit were 8 to 19 percent higher than voucher subsidy costs. There was a significant variability in cost relationships within and among PHA size groups. The comparison excluded public housing debt service costs on the grounds that these were sunk costs. Sunk costs, or sometimes fixed costs, are costs that cannot be saved or recovered if operations were to cease. For more details, see: National Association of Homebuilders Research Center, Inc. and Columbia enterprises, Inc. Construction Cost Indices: HUD Section 202 and 811 Supportive Housing Programs, March 2005. Available at www.HUDUSER.org
62 Results for the four census regions and for central cities, suburbs and non-metropolitan areas are based on geocoded locations of the assisted inventory. Results for Section 202/PRAC are based on geocoded locations of the 135 properties in the FY 2000 survey of development costs.
89

standards. Once HUD calculates a capital advance, the amount is placed in reserve, and 63the funds are made available to the sponsor. F
GAO findings on development cost limits. In May 2003, the GAO issued a study of Section 202 development processing delays, and found that inadequate development cost limits appeared to be a significant factor contributing to lengthy development times. GAO found that while HUD’s policy intends for capital advances to fund the cost of constructing a modestly designed project, capital advances are not always sufficient to cover these expenses. HUD field staff, project sponsors, and consultants reported that program limits on capital advances often kept projects from meeting HUD’s time guideline for approving projects for construction. Most field offices, and every sponsor and consultant that GAO surveyed reported that insufficient capital advances negatively affected project processing time. A substantial majority of respondents indicated that this problem occurred frequently.
According to some sponsors and consultants, the capital advance amounts set by HUD were often inadequate to cover labor and construction costs. Indeed, they were not supposed to cover land or fees imposed by local governments. As a result, sponsors had to seek secondary financing from other federal, State, and local resources -- including other HUD programs -- or redesign projects to cut costs, or both. Many respondents also reported that securing secondary financing to supplement the capital advance amount often added to processing time.
Some sponsors and consultants said that the search for secondary financing could add months to the construction approval process. This delay was due to the fact that funding application and award cycles for other programs varies. They reported that sponsors had to meet HUD’s documentation requirements for every additional funding source, before
64the agency could authorize construction. F
NAHB Research Center findings. Shortly after GAO finished its study, HUD commissioned the NAHB Research Center study (already referenced above). The study noted that current HUD cost limits and High Cost Percentages force many projects to seek supplemental sources of funding before and after initial approval of the project. There were many cases where it was reported that the need to seek additional funding significantly lengthened the total development time frame. (See Appendix A) These findings confirmed the conclusions made by the GAO in their May 2003 study.
The research project provided a spreadsheet-based Cost Model, in which the user enters the type of project, construction start date, bedroom mix, and elevator/non-elevator characteristics and the model calculates a cost estimate based on HUD guidelines for
63 Government Accountability Office (2003) Elderly Housing: Project Funding and Other Factors Delay Assistance to Needy Households. GAO-03-512. Available at: www.gao.gov64 GAO op. cit.
90

apartment rental square footage for different bedroom sizes. The model appears to provide an improved means to equitably administer HUD’s current average approved cost levels.
Time for Development of Section 202 Housing
Overview. The Section 202 program has been widely criticized for inordinate delays in getting projects from the date of initial reservation of funds to construction start. Delays in timely Section 202 project processing can prolong project completion, on average, by nearly a year and result in higher balances of unexpended funds that await commencement of construction. Awarding capital advances that are sufficient to cover project development costs can alleviate delays by averting the need for sponsors to seek secondary financing or request approval from HUD headquarters for additional funding. Without an increase in appropriations, providing sufficient capital advance funding for projects would result in fewer units that could be funded annually. But it would also result in the prompt delivery of housing assistance to needy households and a reduction of unexpended balances attributable to delayed projects. 65
F
This section reviews the causes of development delay, as reported in a study by GAO; reviews the steps that HUD has taken to reduce delay; and presents data on the actual number of months between fund reservation and construction start in recent years.
GAO findings on causes of development delay. Each year HUD announces the availability of Section 202 funds. Potential project sponsors submit their applications for these funds to HUD’s field offices. An application includes the description of the sponsor’s nonprofit status, past experiences in providing housing and supportive services, and the housing needs of the elderly in the market area to be served. Once the applications are ranked according to criteria published in the Federal Register, field offices send their selection recommendations to HUD headquarters. If HUD headquarters approves these recommendations, HUD reserves funds for these proposed projects and sends notification letters to project sponsors. Between the time HUD sends notification letters and approves the start of construction, the sponsors must complete, and HUD must approve, design plans and other documents. These actions are referred to as project processing. Generally, 45 of HUD’s 81 field offices are responsible for processing Section 202 projects. HUD’s guidelines stipulate that HUD field offices and project sponsors should complete project processing within 18 months of the date the funding is awarded. However, the field offices may grant extensions of up to 6 months. 66
F
In its May 2003 study, the GAO found that 73 percent of Section 202 projects funded between 1998 and 2000 were delayed—that is, these projects took longer than the 18 months set out in HUD’s guidelines to proceed from the date of the funding award to the
65 Ibid.
66 Ibid.
91

date of HUD’s approval to start construction. However, 55 percent of projects were approved for construction within 24 months, or 18 months plus the 6-month discretionary extension. Seventy-eight percent of projects located in metropolitan areas and 61 percent of projects in non-metropolitan areas exceeded the 18-month guideline. Further, projects that exceeded the 18-month guideline ultimately took an average of 11 months longer to finish than projects that met the time guideline. 67
The GAO found that several factors impeded the timely processing of projects, according to project sponsors, consultants, and HUD field office staff. First, it was found that capital advances that HUD awards do not always cover the entire cost of developing projects. Field offices, sponsors, and consultants reported that this factor often prolonged processing time, in part because sponsors needed to seek additional funding. GAO found that field offices that cited capital advance shortfalls and the need for sponsors to seek outside funding were less likely to have met the 18-month processing time guideline, compared with field offices that did not report these problems. Second, field offices, sponsors, and consultants reported that inconsistent implementation of procedures HUD adopted to streamline processing by field office staff, as well as limited training and out-of-date guidance on processing policies and procedures, impeded timely processing. Third, prolonged response times from HUD headquarters on requests for additional funds or time have affected processing times, according to project sponsors and consultants and HUD field offices. Fourth, HUD’s project monitoring system was found to have limitations that may impede HUD’s ability to oversee project timeliness. Finally, field offices, sponsors, and consultants reported that other factors -- including inexperienced sponsors and local requirements in areas such as using land use and building permits and zoning -- negatively affected processing time for some projects.
In addition, the GAO noted that issuing an updated program handbook and providing adequate formal training can help in timely project processing, by ensuring that staff are accountable for applying and interpreting HUD policies and procedures in a consistent manner. Finally, GAO indicated that HUD’s project monitoring system, in its current form, was not as effective as it can be and may hinder HUD’s oversight. Maintaining reliable, centralized data on the processing of Section 202 projects is essential to overseeing project status as well as determining problematic processing stages.
HUD actions to reduce delays. Shortly after the release of the GAO report, Assistant Secretary and FHA Commissioner John Weicher testified before the U.S. Senate Committee on Aging about the Section 202 program. Assistant Secretary Weicher noted that HUD had made timely processing of Section 202 program applications a priority since the end of fiscal year 2000, the concluding date for the analysis in the GAO report. In a report that HUD had prepared for the GAO early in fiscal year 2002, HUD had identified 118 Section 202 pipeline projects that had exceeded HUD’s processing guidelines. These had included projects that received funding in 1997 or earlier.
67 Ibid.
92

HUD provided training in the processing of Section 202 applications to Field staff, and initiated the study on development cost limits referenced above. As a result of the study and to reduce delays caused by owners having to seek other funding, HUD has increased the development cost limits to the statutory limits established for the Section 221(d)(3) program. The backlog of projects was essentially eliminated by mid-2003. 68 Currently,F
regulations are being amended to permit the purchase of sites.
The performance evaluations of program managers now include goals to insure that projects are closed within established time frames. Quarterly calls are made to each of the 18 Multifamily Hub Directors throughout the country to discuss the progress, the impediments to progress, and solutions for resolving issues on projects in the development pipeline to help eliminate delays. HUD also implemented a GAO recommendation to conduct a data clean-up of its Development Application Processing (DAP) system, to help support more effective monitoring.
Since the time of the GAO study, HUD has implemented the Section 202 Demonstration Pre-Development Grant Program. This program facilitates planning, design and other pre-development activities for section 202 projects. This program has provided grants to over 241 projects.
Trends in development processing time. The average number of days from time of funding award to time of initial closing clearly has fallen in the past few years. In 2002, the year prior to publication of the GAO report on processing days, grantees completed 308 Section 202 projects, which took on average 968.5 days (32.3 months) to get from fund reservation to initial closing (Table 3-2). In the following three years, construction was completed on 300+ properties each year, and the average processing time declined each year, from 942.9 days (31.4 months) in 2003; to 831.1 days (27.7 months) in 2004; to 802.5 days (26.8 months) in 2005.
Table 3-2 Section 202 Development Processing Time, by Year
Average days to FY Projects closed initial closing
2000 277 761.6 2001 302 834.4 2002 308 968.5 2003 332 942.9 2004 304 831.1 2005 303 802.5
Source: Special tabulations by PD&R staff of the Development Application Processing System
(DAP).
68 See: http://hudatwork.hud.gov/po/h/hm/fog/dev/statutorymortgagelimits08.pdf
93

The percentage of projects that have exceeded the 18-month guideline was reduced by half in 2005, from an average of 62 percent during FY 2001 to FY 2004 to 32 percent in 2005 (see Table 3-3). For projects initiated in Fiscal Years 2001-2005, the five years
following GAO’s study period, only about 25 percent of Section 202 projects were approved for construction start within 18 months of fund reservation, but 66 percent were approved within the 24 months guideline (see Table 3-4). As of 2005, 32 percent were pending, and about 4 percent had their funding award cancelled.
Overall, HUD has successfully eliminated a large backlog of very old applications, and has reduced the average time elapsed between the fund reservation and initial closing, but has not solved the basic problem, viz. that it takes a long time, currently about 2.2 years, to get from fund reservation to initial closing and approval of construction start for a Section 202 project. Table 3-5 (presented at the end of this chapter) shows results by HUD Field Office. There is wide variation by Office in the percent of projects that get to initial closing with 18 (or 24) months. Table 3-4 shows the trend in development times in metropolitan and non-metropolitan areas. Projects in metropolitan areas during this more recent period were more likely than non-metropolitan projects to experience development delays.
To some extent, these new results on development times in Section 202 reflect the inherent complexities of developing these projects, as funding has to be pulled together from various sources. HUD needs to continually monitor information from the Development Application Processing (DAP) system to flag and resolve problems contributing to delays. HUD also could emphasize a program of continuing training for its Field staff, and take any other steps necessary to assure that HUD field staff have the resources they need to immediately and fully address Section 202 processing concerns. Field staff who leave or retire should be replaced immediately.
Finally, and perhaps most important, Section 202 development delays can be reduced by correcting the method for determining development cost limits, and refocusing the program on development of a lesser number of projects, developed in fewer communities, and with larger average project size. In addition to other benefits discussed elsewhere in this report, these program improvements will reduce development delays.
HUD’s goal for Fiscal Year 2009 is to bring 90 projects, containing a total of 3,600 units, to initial closing, down from 155 projects in 2004. At least 70 percent that are initially closed in Fiscal Year 2009 are expected to have completed the process within 24 months, and 25 percent are expected to have completed the process within 18 months. By Fiscal Year 2010, this is expected to improve to 80 percent and 35 percent, respectively. 69
U.S. Department of Housing and Urban Development (2008) Fiscal Year 2009 Annual Performance Plan. Available at: http://www.hud.gov/offices/cfo/reports/pdfs/app2009.pdf.
94
69

Table 3-3 Section 202 Development Processing Time and Expenditures, by Fiscal Year
Fiscal Less than Greater Pending than 18 approval for Cancelled
Year 18 months months construction projects
Number of Projects 44 100 13 2 Percent of Projects 28 64 8 Capital Advances (in millions) $124 $370 $39
2001 PRAC Funds (in millions) $23 $67 $7 Total Funds (in millions) $147 $437 $47 Percent of Total Funds 23 69 7 Number of Projects 28 92 47 2 Percent of Projects 17 55 28 Capital Advances (in millions) $85 $354 $156
2002 PRAC Funds (in millions) $17 $65 $31 Total Funds (in millions) $102 $419 $187 Percent of Total Funds 14 59 26 Number of Projects 38 94 5 9 Percent of Projects 26 64 3 6 Capital Advances (in millions) $108 $418 $18 18
2003 PRAC Funds (in millions) $20 $71 $4 4 Total Funds (in millions) $128 $489 $22 22 Percent of Total Funds 19 74 3 3 Number of Projects 32 94 18 4 Percent of Projects 22 64 12 3 Capital Advances (in millions) $98 $400 $92 4
2004 PRAC Funds (in millions) $18 $65 $17 1 Total Funds (in millions) $115 $465 $109 4 Percent of Total Funds 17 67 16 1 Number of Projects 40 43 42 5 Percent of Projects 31 33 32 4 Capital Advances (in millions) $155 $174 $184 4
2005 PRAC Funds (in millions) $26 $26 $34 1 Total Funds (in millions) $181 $200 $218 5 Percent of Total Funds 30 33 36 1
95

Note: Capital Advances are the monies authorized to build the projects. PRAC funds are the rental assistance to assist the tenants so they can have affordable rents. Source: Special tabulations by PD&R staff of the Development Application Processing System (DAP).
Table 3-4 Comparison of Development Time by Metropolitan and Non-metropolitan Location
for Fiscal Years 2001 to 2005
�Approval status �Metropolitan Non-metropolitan All projects Number Percent Number Percent Number Percent
Approved within 18 months 69 25 % 41 32 % 110 27 %
Not approved within 18 months 210 75 % 86 68 % 296 73 %
Approved within 24 months 173 62 % 94 74 % 267 66 %
Not approved within 24 months 106 38 % 33 26 % 139 34 % Source: Development Application Processing System (DAP).
HUD Practices on Establishing Allocation Areas
Section 202 capital advance funds are allocated by formula to HUD Field Offices, are announced through a Notice of Fund Availability (NOFA), and are competitively awarded to nonprofit sponsors. HUD’s current practice of making formula allocations to geographic areas as small as the jurisdiction of a HUD Field Office have adversely impacted program’s capacity to develop economically viable projects that effectively address the needs of frail elderly persons.
Beginning with the low-income phase of the Section 202 program in 1975, and due to the link of Section 202 financing to Section 8 rental assistance, Section 202 funding has been distributed widely across the country. The “Fair-Share” allocation process required under Section 8 more or less guaranteed this result. Allocations of Section 202/PRAC are not subject to Fair-Share allocation, but under the HUD Reform Act of 1989, HUD is required to allocate Section 202 funds to the smallest practical area consistent with the delivery of assistance through meaningful competition. The Cranston-Gonzalez Act in 1990 further required that HUD allocate Section 202 funds in a manner that ensures selections of projects of sufficient size to accommodate facilities for supportive services appropriate to the needs of the population to be served (emphasis added). 70
F
HUD’s interpretation of this statutory direction has been to allocate funds to the metropolitan and non-metropolitan portions of HUD Field Offices (known as HUBs or Program Centers, which are parts of HUBs), using a formula based on decennial census
70 HUD Housing Notice 04-14, issued August 19, 2004.
96

data. In Fiscal Years 2004-2005, the formula was based on the number of one-person elderly renter households (householder age 62 and older) with incomes at or below the very low-income threshold, as determined by HUD. Fifteen percent of capital advance funds are allocated to non-metropolitan areas. 71 Each HUD Field Office jurisdiction F
receives sufficient capital advance funds for a minimum of 20 units in metropolitan areas and 5 units in non-metropolitan areas. The total of capital advance funds needed to support these minimum set-asides is subtracted from the national aggregate (metropolitan or non-metropolitan) capital advance amount available. The remainder of funds is then distributed by formula.
There is a minimum proposal size of 5 units and a maximum of 125 units for projects in metropolitan and non-metropolitan areas. More important, where the office allocation in either the metropolitan or non-metropolitan areas is less than 125, the maximum proposal size will be limited by the allocation amount. In order to be considered responsive to the NOFA, an applicant must not request a larger number of units for a geographic area (metro or non-metro) than has been allocated to that area. For many allocation areas, this effectively puts the maximum project size at less than 50 units in metropolitan areas and less than 20 units in non-metropolitan areas. 72
F
This allocation process has widely distributed program funding between central cities, suburbs, and non-metropolitan areas. Data for 2004 from the Department’s Real Estate Management System (REMS) indicate that central cities contain 43 percent of elderly, very low-income renters, and have received 48 percent of Section 202/PRAC units developed since inception of the program. Metropolitan suburbs contain 38 percent of elderly very low-income (VLI) renters, and have received 37 percent of units. Non-metro areas contain 19 percent of elderly VLI renters, and have received 15 percent of units. While a more meaningful comparison might be based on other measures of need, such as for extremely low-income renters, it does appear that the distribution of 202 units to central cities and suburbs is reasonably consistent with the needs. 73
F
However, the use of formula distribution to HUBs or Program Centers, with a 15 percent set-aside to non-metropolitan areas, and minimum allocations to each allocation area, along with maximum project size limitations, has resulted in approval of very small projects. As noted in Chapter One, the average size of Section 202 projects has declined throughout the entire history of the program, and this trend is continuing at the present time. Evidence presented previously indicate that larger projects, not small ones, are the most likely to include the supportive services that are central to the program’s mission.
71 The Cranston-Gonzalez Act of 1990 required that 20 percent of Section 202 funding be provided to non-metropolitan areas, but this was reduced to 15 percent in 1992 legislation.
72 See the NOFAs for Fiscal Years 2004 and 2005.
73 The information on elderly, very-low income renters is from the 2003 American Housing Survey, and is based on head or spouse (or cohead) age 62 or older.
97
In recent years, funds for the Section 202 program have not been increasing, while costs increase with inflation each year. As a result, the number of units that can be approved within new developments is shrinking. Each year, as Section 202/PRAC properties complete construction and are ready for initial occupancy, these properties require Project Rental Assistance Contract (PRAC) funds, and this shrinks available funds even further. Persistent under funding reduces the ability of the program to provide cost effective congregate dining and other supportive services critical for meeting the needs of frail elderly.
Conclusions and Recommendations
The Section 202 program is HUD’s only program that targets housing assistance specifically to very low-income, elderly renters. The program provides good quality housing at a cost that is comparable to costs of other development programs. While assistance provided under the Section 202 program does cost more than assistance provided under the Housing Choice Voucher program, Section 202 provides excellent value, because it can offer features to frail elderly persons that are difficult of obtain with vouchers, such as accessible housing and access to service coordinators and supportive services. 74 The program also offers insulation from the fear of rent increases or the need F
to move in order to obtain assistance. Perhaps for this reason, the Section 202 program attracts and retains a higher percentage of persons age 80 and over than vouchers or other HUD rental assistance programs.
Section 202 has experienced development delays that to some extent have eroded the efficiency of the program. Development delays add to per-unit costs and thus reduce the number of elderly persons who ultimately can be assisted. HUD has taken steps to minimize the delays, with considerable success. Continued monitoring of this aspect of the program is needed. Revising the method of establishing development cost limits, as proposed in recently completed research and summarized in this Chapter, will considerably ease the difficulty of development and help minimize delays.
Section 202/PRAC cannot fully achieve its mission of developing projects that provide supportive services if average projects sizes continue to fall. The relatively flat level of appropriations being provided by Congress each year, in combination with statutory requirements and recent HUD practices regarding allocation of funds, does not advance the efficiency of program delivery. Not only does this result in development of multiple, small projects - often proposed and developed by relatively inexperienced, small sponsors - it also contributes to the need for program amendments, further contributing to project processing delays.
To improve efficiency of program delivery, HUD should take the following actions:
74 See, for example: Turner, Margery Austin et al. (2005) Discrimination Against Persons With Disabilities: Barriers At Every Step. Washington DC: The Urban Institute Available at: http://www.huduser.org/Publications/pdf/DDS_Barriers.pdf
98

• Request that Congress lift the 15 percent set-aside of Section 202 funds to non-metropolitan areas.
• Substantially reduce the number of allocation areas, consistent with the statutory requirement that calls for selection of projects of sufficient size to accommodate facilities for supportive services appropriate to the needs of the population to be served.
• Revise development cost limits to more accurately reflect true costs, to support development of projects with full supportive services, and also to help reduce delays. This will raise average, per-unit development costs and lower the number of supportable units, but it is necessary if the program is to achieve its objectives.
• Reduce delays in HUD’s Mixed Finance Program (described in Chapter One) by adopting a less prescriptive process for bond financing; enhancing common standards of administration; and adjusting cost ceilings to account for a) volatility of construction costs and b) demands for “amenities” such as congregate dining facilities.
• Revise NOFA language to encourage larger average project size, consistent with the need to more efficiently provide supportive services. One or two additional points should be awarded for such projects, provided there is an objective way to rate this factor in a competitive process. The NOFA should provide more emphasis on the availability of congregate dining, housekeeping and other supportive services; and there should be more emphasis on serving needs of frail elderly, that ensures selections of projects of sufficient size to accommodate facilities for supportive services appropriate to the needs of the population to be served. Encourage existing projects to add supportive features and sufficient units to achieve economies of scale.
• Maximum project size specified in the NOFA should be increased, and should probably be 50 units in non-metropolitan areas and 200 units in metropolitan areas. Given the current level of program funding, this will clearly cause some States to receive new Section 202 funding on less than an annual basis, but this may be necessary if the program is to achieve its objectives.
• Place a priority on accuracy and completeness of reporting of development cost data to the Development Application Processing (DAP) system, and use these data for regular, ongoing monitoring of trends in development cost. Identify projects with cost issues early in the processing cycle to further minimize undue processing delays.
99

Table 3-5 Section 202 Developments by HUD Field Office,
2001 to 2005
Field Office Total # of Projects approved Projects approved projects within 18 months within 24 months
Number Percent Number Percent Albuquerque 1 Anchorage 14 Atlanta 17 Baltimore 12 Birmingham 12 Boston 25 Buffalo 22 Caribbean 7 Charleston 4 Chicago 21 Cincinnati 2 Cleveland 24 Columbia 16 Columbus 23 Denver 22 Des Moines 7 Detroit 11 Fort Worth 15 Grand Rapids 1 Greensboro 22 Hartford 12 Honolulu 13 Houston 11 Indianapolis 19 Jackson 5 Jacksonville 17 Kansas City 10 Knoxville 11 Las Vegas 1 Little Rock 16 Los Angeles 21 Louisville 13 Manchester 23 Miami 8 Milwaukee 12 Minneapolis 17 Nashville 19 New Orleans 21
1 6 2 4 4 0 4 0 0 3 0 2 5 6 6 2 6 4 1
10 2 0 2
12 1 2 4 7 0 7 0 7 4 0 3
11 8 8
100 43 12 33 33 0 18 0 0
14 0 8
31 26 27 29 55 27
100 45 17 0
18 63 20 12 40 64 0
44 0
54 17 0 25 65 42 38
1 100 6 43 14 82 9 75
10 83 2 8 13 59 0 0 1 25
10 48 1 50 10 42 13 81 15 65 13 59 5 71 9 82
10 67 1 100
19 86 9 75 0 0 6 55
18 95 4 80 9 53 7 70
11 100 0 0
15 94 12 57 10 77 15 65 3 38 5 42
16 94 17 89 12 57
100

-----------------------------------------------------------------------------------------------------------------
Table 3-5 (Continued)
Field Office Total # of projects
Projects approved within 18 months
Projects approved within 24 months
Number Percent Number Percent New York 25 0 0 4 16 Newark 14 1 7 5 36 Oklahoma City 14 2 14 11 79 Omaha 8 3 38 5 63 Philadelphia 18 1 6 10 56 Phoenix 11 0 0 4 36 Pittsburgh 14 4 29 8 57 Portland 8 4 50 5 63 Providence 9 1 11 5 56 Richmond 17 3 18 6 35 Sacramento 4 0 0 2 50 San Antonio 10 0 0 5 50 San Francisco 26 2 8 11 42 Seattle 19 9 47 14 74 Shreveport 2 2 100 2 100 St Louis 8 1 13 6 75 St. Louis 6 3 50 4 67 Tampa 1 1 100 1 100 Tulsa 5 1 20 5 100 Washington, DC 3 0 0 0 0
Total (All offices) 749 182 24 444 59
Source: Special tabulations from the Development Application Processing (DAP) system by PD&R staff.
101

Chapter Four: Cost of Institutionalization
The Section 202 program can offer very low-income, dependent elderly a humane alternative to institutionalization. As part of a continuum of care available to those with few resources, it has the potential of providing States significant cost savings for the care of elders with lower levels of impairment. It is also one option that States can use to comply with Olmstead v. L.C. (1999), where the Supreme Court ruled that States may not discriminate against persons with disabilities by refusing to provide community services when these are available and appropriate. 75
F
The needs of today’s elderly are diverse, and this is not expected to change. They overwhelmingly prefer living in their own homes to other options. They see nursing homes as the least attractive option for people who are dependent. 76, 77 Advocates alsoF
F
stress the need for access to a continuum of care. Nonetheless, about six times as much is spent on the most expensive end of the continuum, nursing home care, as on home-based care, because public funding has long favored institutionalization over other arrangements. 78 Spillman et al. (2002) report that an estimated 1.35 million elders F
resided in nursing homes in 1998. 79 F
75 Harrington, Charlene et al. (2000) “Predicting State Medicaid Home and Community Based Waiver Participants and Expenditures, 1992-1997,” The Gerontologist 40, 6: 673-686. See also: Mollica, Robert (2003) “Coordinating Services Across the Continuum of Health, Housing and Supportive Services,” Journal of Aging and Health 15: 165-188. Available at: http://jah.sagepub.com/cgi/content/abstract/15/1/165
76 Dependence, in this report, refers to needs for supports for the activities of daily living (ADLs) – bathing, dressing, toileting, transferring, and eating – and assistance with the instrumental activities of daily living (IADLs), including, for example, escort help for outside appointments, medication monitoring and cueing, bill paying, and health status monitoring.
77 O’Keeffe, Janet et al. op. cit;. Eckert, J. Kevin et al. (2004) “Preferences for Receipt of Care Among Community-Dwelling Adults,” Journal of Aging and Social Policy 16, 2: 49-65; Reinhardy, James R. and Rosalie A. Kane (2003) “Anatomy of a Choice: Deciding on Assisted Living or Nursing Home Care in Oregon” Journal of Applied Gerontology 22: 152-174. . Available at: http://jah.sagepub.com/cgi/content/abstract/22/1/152 . Corbet (2007: 82) reports: “Nursing homes are environments of isolation and disempowerment. They dictate when to get up, when to go to bed, when and what to eat, when to take showers and who will help, and when and if to leave.” For details see: Corbet, Barry (2007) “ Embedded,” AARP Magazine, January & February 2007: 81-100. Available at: http://www.aarpmagazine.org/health/embedded.html
78 Kingson, Eric R. (1996) “Ways of Thinking about the Long-Term Care of the Baby-Boom Cohorts,” Journal of Aging and Social Policy 7, 3-4:3-23; U.S. Department of Health and Human Services (1981) cited by Estes, Carroll L. and Charlene A. Harrington (1981) “Fiscal Crisis, Deinstitutionalization, and the Elderly,” American Behavioral Scientist 24: 811-826. Available at http://abs.sagepub.com.
Spillman, Brenda C., Korbin Liu and Carey McGilliard (2002) Trends in Residential Long-Term Care: Use of Nursing Homes and Assisted Living and Characteristics of Facilities and
102
79

In addition to the high cost of care in institutional settings, there has been a concern going back decades that some elders with long-term care needs have been unnecessarily or inappropriately institutionalized, because there was no other means available to enable public support for their care. In 1978, the US Department of Health, Education and Welfare estimated that up to 25 percent of institutionalized patients could be cared for in less restrictive settings. 80 Since then, research has been leading policymakers toward an emphasis on home and community services in residential care alternatives to nursing homes, such as adult foster care homes, assisted living facilities and other board and care settings. Currently, an estimated 20 percent of nursing home residents could be deinstitutionalized if appropriate community supports were available. 81
F
Branch and Stuart (1984) and others published reports demonstrating that home-based supportive services can serve as an alternative to institutionalization for at-risk individuals. Not surprisingly, fragmentation of medical care, social services, needs assessments, placement, and reimbursement functions have been significant impediments to deinstitutionalization of patients who require nursing home care. Integration of these services, medical technology, and increased public funding of formal in-home health and supportive services have resulted in moderately dependent patients staying at home for longer periods. Indeed, the prevalence of nursing home residence among elders declined 27 percent between 1973 and 2000, with the nursing home patient mix shifting during the 1990s toward increasing dependency, even though admission diagnoses remained the
82same.
Residents. Report was prepared under contract #HHS-100-97-0010 between the U.S. Department of Health and Human Services, Office of the Assistant Secretary for Planning and Evaluation, Office of Disability, Aging and Long-Term Care Policy and the Urban Institute. Available at: http://aspe.hhs.gov/daltcp/reports/rltct.htm
80 Jette, Alan M. and Lawrence G. Branch (1983) “Targeting community services to high-risk elders: Toward preventing long-term care institutionalization,” Aging and Prevention 3, 1: 53-69; Scanlon, William J. (1980) “Nursing home utilization patterns: Implications for policy,” Journal of Health Politics, Policy and Law 4, 4: 619-641; Doty, Pamela (2000) Cost-Effectiveness of Home and Community-Based Long-Term Care Services. Paper prepared by the Office of Disability, Aging and Long-Term Care Policy within the U.S. Department of Health and Human Services. Available at: http://aspe.hhs.gov/daltcp/reports/costeff.htm
81 Spillman, Brenda C. et al. (2002) Trends in Residential Long-Term Care: Use of Nursing Homes and Assisted Living and Characteristics of Facilities and Residents Report prepared under contract between ASPE, HHS and the Urban Institute. Available at: http://aspe.hhs.gov/daltcp/reports/rltct.htm.
82 Branch, Laurence G. and Neil E. Stuart (1984) “A Five-Year History of Targeting Home Care Services to Prevent Institutionalization,” The Gerontologist 24, 4: 387-91; Allison-Cooke, Sherry (1984) “Deinstitutionalizing Nursing Home Patients: Potential versus Impediments,” The Gerontologist 22, 4: 404-8; Hays, Judith C. et al. (2003) “Competing Risk of Household Expansion or Institutionalization in Late Life,” Journal of Gerontology: SOCIAL SCIENCES 58B, 1: S11-20.
103

The lack of affordable, accessible housing is one of the major barriers facing nursing home residents with low incomes who are capable of returning to the community. The Section 202 program has the potential to deinstitutionalize many of these seniors, if it builds on the example set by Peter Sanborn Place in Reading, Massachusetts. This Section 202 facility gives high priority to seniors needing a high level of care. It created a sister agency, Sanborn Home Care, that provides case management and service coordination, personal care, transportation to medical appointments, companion and respite care, and assistance with local errands and other tasks. Peter Sanborn Place also contracts with the Visiting Nurses Association for nursing care and rehabilitation therapy. Services are paid for by Medicaid, Medicare, State programs, and self-pay. 83
F
�Federal Assistance to Programs Offering Community-Based Services
The Medicaid program has been largest source of public funds for home and community based care. Two-thirds of the total costs of nursing home and home care services are paid for through the Medicaid program. 84 In 2005, 63 percent of total Medicaid expenditures for long-term care were for institutional services. Of the $94.5 billion spent on long-term care, $59.3 billion went to institutions. 85 The current bias in the US toward F
the use of institutional settings for long-term care was created by Medicaid legislation more than 35 years ago: nursing home care is an entitlement while community-based care is not. 86
The nursing home industry strongly prefers patients who can pay for care with private funds, as they can be billed at considerably higher rates than patients supported by
83 Harahan, Mary F et al. (2006a) Inventory of Affordable Housing Plus Services Initiatives for Low- and Modest-Income Seniors. Prepared for US Department of Health and Human Services Contract #TLG-03-045-3925 and US Department of Housing and Urban Development Contract #I-OPC-22893. Institute for the Future of Aging Services, American Association of Homes and Services for the Aging. For a description of respite care, see: Smith et al. (2000) op. cit.
84 ‘As Mississippi Gov. Haley Barbour (R) put it, "It's a real problem, and it is a here-and-now problem. There's nothing theoretical about it. . . . It's a problem that's crushing states today." ‘In “Governors Urge Focus on Medicaid,” Washington Post, July 26, 2005. Available at: http://www.washingtonpost.com/wp-dyn/content/article/2005/07/25/AR2005072501277_pf.html
85 Health Policy Institute, Georgetown University (2007) “Fact Sheet: Medicaid and long-term care.” Available at: http://ltc.georgetown.edu/pdfs/medicaid2006.pdf; See also: Verdier, James M. (2007) “Medicaid Managed Long-Term Care: Challenges and Opportunities for State Policymakers and Low-income Individuals,” Presentation at Michigan Family Impact Seminar. 86 Redfoot, Donald and Andrew Kochera (2004) “Targeting Services to Those Most at Risk: Characteristics of Residents in Federally Subsidized Housing,” Journal of Housing for the Elderly 18, ¾. 137-163. Branch and Jette op. cit. note that the Medicare program is of little use to most community living elders who need long term care, because it does not reimburse elders for the purchase of assistance with IADL.
104

Medicaid. As of 2004, the national average annual cost of private pay nursing home care was $70,080. 87 In 2002, the average allowable daily cost for nursing home care under F
the Medicaid program $136.67 per patient, or just $49,885 per year. However, both supply and reimbursement rates vary considerably by State. 88
The Omnibus Budget and Reconciliation Act of 1981 permitted States to apply for waivers to spend Medicaid funds on non-medical community-based services that replace institutional care. 89 By 1993, 45 States had waivers. By 2005, all States were required to offer home health care. In addition, States have the option of providing services through the Medicaid home and community-based (HCBS) plan benefit, or States may offer personal care services as a State plan benefit. Twenty-six States and the District of Columbia now offer the optional State plan. F
90,, 91
Home and community-based care generally costs less than nursing facilities. 92 It isF
therefore not surprising that the percentage of Medicaid long-term care expenditures for home and community-based care has increased from 14 percent in 1991 to 37 percent in
87 Modern Healthcare (2004) “By the Numbers; Healthcare Economics,” December 20, 2004: 219; Herd, Pamela (2001) “Vertical axes on the Long-Term Care Continuum: A comparison of Board and Care and Assisted Living,” Journal of Aging and Social Policy 13, 1: 37-56.
88 BDO Seidman, LLP (2005) A Report on Shortfalls in Medicaid Funding for Nursing Home Care. Prepared for the American Health Care Association. Available at: http://www.ahca.org/brief/seidmanstudy0312.pdf; Swan, James H. et al. (2000) “Medicaid Nursing Facility Reimbursement Methods: 1979-1997,” Medical Care Research and Review 57: 361-378. Available at: http://mcr.sagepub.com/cgi/content/abstract/57/3/361; Harrington, Charlene et al. (2005) “Trends in the Supply of Long-Term Care Facilities and Beds in the United States,” Journal of Applied Gerontology 24: 265-282. Available at: http://jag.sagepub.com/cgi/content/abstract/24/4/265
89 As mentioned above, at its inception Medicaid funds could not be spent on non-medical community-based services. A “waiver” is coverage for services not originally provided. Medicare offers a home health care benefit, but it is limited to post-acute care. The number of home health visits declined from about 29 visits per episode immediately prior to the implementation of the prospective payment system to 22 visits per episode in 2001 (see: GAO (2002) Long-term Care: Availability of Medicaid Home and Community Services for Elderly Individuals Varies Considerably. GAO-02-1121.)
90 Han, Lein et al. (1996) “Race and Gender Differences in the Distribution of Home and Community-Based Services in Florida,” Journal of Aging and Social Policy 7, ¾: 93-107.
91 Summer, Laura L. and Emily S. Ihara (2005) The Medicaid Personal Care Services Benefit: Practices in States that Offer the Optional State Plan Benefit, AARP Public Policy Institute Report #2005-11. See also: Smith et al. (2000) op. cit.
92 For example, a FY 2005 comparison of total Medicaid costs in Ohio for nursing homes and the Ohio Medicaid waiver program, PASSPORT, found that the average cost per year for a nursing facility was $55,751 and for community-based services was $23,702. See: http://www.goldenbuckeye.com/_pdf/ppeval2007_cost_neutrality.pdf
105

2005. The absolute amounts have also increased, from $4.8 billion in 1991 to $35.2 billion in 2005. 93
F
In 1998, 28 States covered services in assisted living or board and care settings, with 23 of them using Medicaid Home and Community Based Service (HCBS) waivers. These waivers are limited to persons whose level of disability would make them eligible for Medicaid nursing home benefits, and also allow States to extend benefits to persons with slightly higher incomes than those with other types of benefits. In early 1998, only about 40,000 people received benefits from either HCBS waivers or personal care benefits. Most assisted living facilities will admit and retain individuals needing assistance with fewer than three ADLs, who are continent, and do not need assistance transferring. As noted above, Spillman (2002) reports that an estimated 20 percent of nursing home residents potentially meet these criteria, but the actual proportion may be higher. In 1998, more than half of residents in assisted living needed assistance with 3 or more ADLs. 94
Most Medicaid funds for long-term care that support home and community-based services (HCBS) go to waivers, with the majority paying for services to people with developmental disabilities. A shortage of waivers for the Medicaid population is a problem across the States. States either lack funds to match Federal Medicaid dollars or have low overall resources. In 1996, 33 States had waiting lists for individuals who wanted to be in waiver programs and were Medicaid eligible. The Deficit Reduction Act of 2005 allows States to offer HCBS without a waiver, but with controlled enrollment and spending. States use spending caps, service limits, enrollment caps and waiting lists to control spending.. 95
The nation’s first statewide, capitated long-term care Medicaid program, the Arizona Long-Term Care System, appears to have operated cost-effectively while offering an expanded home care option. However, the Medicaid program does not provide coverage for expenses for non-institutional housing or food. It is therefore not a surprise that assisted living residents are somewhat better off financially than nursing home residents.
93 See: www.kff.org/kcmu. Publication #2186-04. 94 Spillman, Brenda C. op cit.; Spillman et al. op. cit.; Doty op. cit. notes that the only mandatory coverage for home health services are for registered nurses, licensed rehabilitation therapists and home health aide services delivered through certified home health agencies. Other services are only offered at the discretion of the States. The personal care benefit, unlike waivers, is not restricted by Federal law to persons who are in need of institutionalization. However, it only covers personal care attendant services. New York, California, Texas, and Arkansas are examples of States that have chosen to provide home and community-based services for the elderly and disabled predominantly through the personal care services benefit. If a State elects to provide the personal care benefit, it must be available to all those enrolled in the Medicaid program who meet the criteria for personal care, so some States, fearing runaway spending, do not offer this option.
95 Harrington op. cit; Fox-Grage, Wendy et al. (2008) “Rebalancing: Ensuring Greater Access to Home and Community-based Services,” at www.aarp.org/research/housing-mobility/homecare/fs132_hcbs.html
106

Spillman et al. (2002) note that the use of assisted living as a cost-cutting alternative to nursing homes, is greatly limited by the ability of low-income elders to pay for their own room and board. 96
F
In States that do not limit the amount that residential care providers can charge Medicaid clients for room and board, these charges are unaffordable for Medicaid clients. On the other hand, inadequate service rates are a disincentive to serve Medicaid clients, particularly in States that restrict room and board charges to SSI levels. O’Keeffe et al. (2003) report that State staff face ongoing struggles to find ways to cover the costs of serving frail elders in residential care settings, when Medicaid is not permitted to pay room and board and there are insufficient resources for this. In addition, State staff grapple with the problem of finding ways to meet expectations of Medicaid clients for residential care settings that offer privacy, amenities, and quality services that have been created by the private pay dominated model of “assisted living” when Medicaid cannot afford to pay private rates. 97
F
Another source of federal funding for social services for the elderly has been the Social Services Block Grant (SSBG), formerly Title XX of the Social Security Act. The States have considerable flexibility in the use of these funds. In addition to home and community-based services, they can also be used for child welfare, services to persons with disabilities, domestic violence prevention, early intervention to help families with children with disabilities, family planning, homeless assistance, legal services, mental health, mental retardation, rape crisis programs, subsidized child care, and youth development services for adjudicated delinquents. In 2002, 35 States used some of these funds for home and community-based services, including homemaker, home health, and home maintenance services. About $226 million was spent in 2002 for all these services, with an average of $6.5 million per State for the 35 States. In 1997, about $1.8 million was spent for congregate or home-delivered meals, with an average of $71,000 per State for the 25 States with such expenditures. 98
Other public sources of funds for personal care services are local governments, Older Americans Act funds, the Federally Qualified Health Center Program (for community health centers), PACE (adult day health care) and the Medicare program. However, Medicaid is still by far the largest source of funds for publicly financed home and
96 Doty, Pamela, op. cit.; Spillman, Brenda C. op cit.
97 O'Keeffe, Janet, Christine O'Keeffe, and Shulamit Bernard (2003) Using Medicaid to Cover Services for Elderly Persons in Residential Care Settings: State Policy Maker and Stakeholder Views in Six States. Report was prepared under contract #HHS-100-97-0014 between the U.S. Department of Health and Human Services (HHS), Office of Disability, Aging and Long-Term Care Policy (DALTCP) and the Research Triangle Institute. Available at: http://aspe.hhs.gov/daltcp/reports/med4rcs.htm. For an example of a State’s SSBG programs, see: www.dpw.state.pa.us/PubsFormsReport/PubsHandbksMansRulesRegs/003675350.htm.
98 Committee on Ways and Means, US House of Representatives (2000) 2000 Green Book. Washington DC: US Government Printing Office.
107

community-based care. Following the Supreme Court’s 1999 Olmstead decision, States made increased use of the Medicaid program to increase both the amount and share of its resources going to home and community services. 99 Service coordination may be a F
component of some public housing and LIHTC properties, but it is most likely found in Section 202 properties. 100
F
�Future Demand for Long-Term Care
The age group comprising persons aged 85 and older tends to be less healthy and more socially isolated than younger seniors. They are most likely to have functional limitations, mobility limitations, and social activity limitations. Persons aged 85 and older are the most likely to need long-term care services, and this group is expected to increase in size nationally by 88 percent between 2005 and 2030. 101
�F
Between 1946 and 1964, 76 million people were born in the US, 17 million more than would have been born if the previous fertility pattern of the early 1940s had prevailed. Known popularly as “baby boomers,” they are slightly more than one-quarter of today’s population. Even if we see lower rates of disability than among older cohorts, the large size of the baby boomer cohort ensures an absolute increase in the need for long-term care when they enter advanced old age. However, Johnson et al. (2007) project that the percentage of adults age 65 and older with severe disabilities will remain stable, viz. 8.4 percent in 2010 and 8.5 percent in 2040, and the number will increase from 3.3 million to 6.3 million. 102
�F
99 Nyman, John A. (1994) “Assisted Living: Will It Reduce Long-Term Care Costs? Journal of Aging and Social Policy 6, 4: 33-51; Smith et al. (2000) Understanding Medicaid Home and Community Services: A Primer. Report prepared under contract #HHS-100-97-0015 between the U.S. Department of Health and Human Services (HHS), Office of Disability, Aging and Long-Term Care Policy (DALTCP) and George Washington University's Center for Health Policy Research. Available at: http://aspe.hhs.gov/daltcp/reports/primer.htm
100 Summer and Ihara op. cit; Harahan, Mary F et al. (2006a) op. cit.
101Blake, Kevin and Aleksandra Simic (2005), “Elderly Housing Consumption: Historical Patterns and Projected Trends. Available at http://www.huduser.org.
102 Johnson, Richard W. et al. (2007) Meeting the Long-Term Care Needs of the Baby Boomers: How Changing Families Will Affect Paid Helpers and Institutions. The Urban Institute. Report prepared under grant 049919 from the Robert Wood Johnson Foundation. See also: Gusmano, Michael K. (2004) “Review Essay,” Journal of Health Politics, Policy, and Law 29, 4: 1227-1234. The National Center for Health Statistics recently provided indications that the boomers may not always be healthier than the previous birth cohort. A new report discusses evidence that rates of hypertension and obesity are higher for the current group of 55-to-64-year-olds. Summary available at: http://channels.netscape.com/homerealestate/story.jsp?idq=/ff/story/0001/20051208/2116781523. htm&floc=LIV-1_T.
108

The GAO estimates that by 2020 the number of elders living alone in the community without living children or siblings will reach 1.2 million, twice the number without family support in 1990. 103 Based on current data, 40 to 48 percent who reach the age of�F
85 and live in the community are expected to have disability, which may be as little as needing help with shopping or as great as the level of care required by a person who is bedridden. Living in the homes of relatives is rarely acceptable. Currently, just 14
�F �Fpercent choose this option. 104, 105
The ability for all boomers to pay for needed assistance themselves remains in doubt, especially for non-homeowners, the marginally employed, and low-income single parents. During the Senate Special Aging Committee hearing on April 12, 2005, Chair Gordon Smith explained that the "average life expectancy of Americans has been steadily increasing. For example, the average life expectancy of Americans born in 1960 was about 70 years. Yet, in 2003, life expectancy was about 77. And although Americans are living longer than ever before, most Americans continue to retire before age 65. At the same time, the personal-savings rate in the United States has declined dramatically over the last two decades, reaching about one percent of personal income in 2004. The decline in our savings rate is a disturbing trend because as the length of retirement grows, Americans must save more -- not less -- to ensure a financially secure retirement." 106
F
Economic simulations point toward an emerging underclass of baby boomers: about 4 million in 2030, with incomes at 150 percent of the poverty line. Minorities, very old women, the unmarried, and those who sustain large health care costs are substantially at risk of poverty in old age. In addition, the availability of informal support may not be at the same level as for their parents, due to fewer children, greater labor-force participation among women, and increased longevity of their parents. Johnson et al. (2007) project that unpaid hours of home care per recipient will not increase much over time. Between 2000 and 2040, the average number of hours of unpaid help from adult children is estimated to increase by about 7 percent among recipients. The average from other sources will fall by about 6 percent. 107
F
103 United States Government Accountability Office (2005) Long Term Care Financing: Growing Demand and Cost of Services are Straining Federal and State Budgets, GAO-05-564T.
104 Manton, Kenneth G. and Eric Stallard (1996) “Changes in Health, Mortality, and Disability and Their Impact on Long-Term Care Needs,” Journal of Aging and Social Policy 7, 3-4:25-52.
105 Bould, Sally et al. (1997) “Ability, Disability, and the Oldest Old,” Journal of Aging and Social Policy 9, 1: 13-31.
106 Available at: http://www.womenspolicy.org/thesource/issue.cfm?IssueID=207
107 Johnson, Richard W. et al. (2007) op. cit. In their summary of the literature, Mutchler and Burr (2003: 534) note that spouses form an especially crucial part of one’s social support network. See: Mutchler, Jan E. and Jeffrey A. Burr (2003) “Living Arrangements among Older Persons: A Multilevel Analysis of Housing Market Effects,” Research on Aging 25: 531-558. Available at: http://roa.sagepub.com/cgi/content/abstract/24/6/531.
109

108
When grown children are divorced, widowed, or remarried, they give less total help to aged parents than adult children with intact marriages. They perceive lower parental needs and feel more limited in helping, due to job responsibilities. Plus, childless couples are projected to be one of the fastest growing segments of the elderly population. By 2030 an estimated 25 percent of elderly persons aged 70-85 years will lack a living spouse, living children, or living stepchildren. 108
F
Households headed by African American people are at a disadvantage in their ability to pay for long-term care. In 2005, the median net worth of older black households was $37,800, one-sixth of Whites. 109
�F
Homeownership does not necessarily guarantee the ability to pay for long-term care. Smeeding (2008) reports that data from the 2001 Luxembourg Wealth Study indicate that 16 percent of US households with an elderly woman, who is either head or spouse and 65 years or older, are income and asset poor (i.e. assets are less than 25 percent of median
111DPI 110). For those who are homeowners, the average home equity was $54,848.�F �F
Likewise, the Federal Reserve Board’s Survey of Consumer Finances found that the average net worth of homeowners with incomes under $16,000 is $73,000. 112
�F
BRisks of Institutionalization
The capacity to perform both basic ADLs and IADLs are crucial for an elder’s ability to remain outside of nursing homes and other long-term care institutions if high levels of informal assistance are unavailable. In other words, the ability to prepare food is as important as the ability to dress if an elder is to maintain him- or herself in the
Kingson, op. cit.; Cicirelli, Victor G. (1983) “A Comparison of Helping Behavior to Elderly Parents of Adult Children with Intact and Disrupted Marriages,” The Gerontologist 23, 6, 619-25; Zhang, Zhenmei, and Mark D. Hayward (2001) “Childlessness and the Psychological Well-Being of Older Persons,” Journal of Gerontology: Social Sciences, 56B, 5, S311-320; Pilisuk, Marc and Meredith Minkler (1985) “Supportive Ties: A Political Economy Perspective,” Health Education and Behavior 12: 93-106. Available at http://heb.sagepub.com.
109 Federal Interagency Forum on Aging-Related Statistics (2008). Older Americans 2008: Key Indicators of Well-Being. Washington DC: U.S. Government Printing Office.
110 DPI = earnings + capital income + private transfers (including occupational pensions) + public transfers, net of direct taxes, contributions.
111 Smeeding, Timothy M., Gornick Janet and Sierminska, Eva (2008) “The Social and Economic Vulenerability of Older Women in Rich Countries,” Presentation at the Population Reference Bureau, February 28, Washington DC.
112 See: http://moneycentral.msn.com/content/Banking/Homebuyingguide/P72655.asp
110

community. Indeed, walking across a room and heavy housework are the most common ADL and IADL disabilities, respectively. 113
F
In 2005, 42 percent of people aged 65 and over reported a functional limitation, but only four percent were in a long term care facility. Eighteen percent lived in the community and reported difficulties with one or two ADLs. Five percent had difficulty with three or four ADLs, and three percent had difficulty with five or six ADLs. Twelve percent had difficulties with two or more IADLs but had no ADL limitations. 114
F
Social supports, economic resources, and cultural preferences play important roles in determining living arrangements. Elders with higher incomes, greater net worth, and more children have higher probabilities of independent living than poorer, childless elders. African Americans and Hispanic elders are less likely than Whites and non-
��F FHispanics to live in institutions. 115, 116
As noted above, informal caregiving by younger spouses, children, relatives and other friends may be understood as part of part of lifelong reciprocity of giving and receiving aid. Indeed, the majority of elders who live in the community and receive some form of long-term care rely partly or solely on informal care provided by family members. As half of boomers’ marriages end in divorce and kinship networks can be complex, there is evidence of weakening filial obligations in blended families, where lifelong relationships may be missing. 117
�F
People with low informal resources, especially those living alone, are especially likely to have unmet needs for help with ADLs and IADLs. Data from the National Health Interview Survey, 1994-5, indicate that they tend to experience a variety of secondary
113 Branch, Laurence G. and Alan M. Jette (1983) “Elders’ Use of Informal Long-Term Care Assistance,” The Gerontologist 23, 1, 51-56; Waidmann, Timothy A. and Seema Thomas (2003) Estimates of the Risk of Long-Term Care: Assisted Living and Nursing Home Facilities. Report prepared under contract #HHS-100-97-0010 between the U.S. Department of Health and Human Services, Office of the Assistant Secretary for Planning and Evaluation, Office of Disability, Aging and Long-Term Care Policy and the Urban Institute. Available at: http://aspe.hhs.gov/daltcp/reports/riskest.htm
114 Federal Interagency Forum on Aging-Related Statistics op. cit.
115 Burr, Jeffrey et al. (2005) “State Commitment to Home and Community-Based Services: Effects on Independent Living for Older Unmarried Women,” Journal of Aging and Social Policy 17, 1: 1-18. 116 Racial and ethnic disparities are likely to be the result of systematic differences in the ability to pay, plus location of many nursing homes in communities that have been intentionally all White, at least into the 1970s. See: Loewen, James W. (2005) Sundown Towns: A Hidden Dimension of American Racism. New York: The New Press.
117 Kingson, op. cit.; Aykan, Hakan (2003) “Effect of Childlessness on Nursing Home and Home Health Care Use,” Journal of Aging and Social Policy 15, 1: 33-53.
111

conditions at rates higher than those whose needs are met, including falls, injuries due to falls, bedsores, and contractures. They are 20 times more likely to miss a meal because of lack of help with shopping. An estimated 949,000 people currently need help with two or more ADLs and have unmet needs. They tend to live alone, be female, and non-white. Compared to people with no umet needs, they are slightly more likely to have incomes below 100 percent of the SSI level. 118
�F
Spouses and grown children are the usual sources of informal care. However, about 20 percent of the population over 65 is childless. For the unmarried and childless with significant disabilities and living in the community, help comes from wider extended family members, siblings, nieces and nephews. These caregivers rarely expect to assume this role, and examination of actual family supports of childless elders shows substantial differences in these patterns of caregiving. 119
�F
It has been estimated that between five and ten percent of elders living in the community receive informal caregiving from non-kin, i.e. friends, neighbors or other unrelated people. The care tends to be acts of sharing and kindness between people, such as watering plants or caring for pets during absences or occasional grocery shopping. Proximity and social intimacy are important aspects of these relationships, with minor instrumental help, such as delivering newspapers or mailing letters, rather than personal
120care. ��F
National Mortality Followback Surveys. Results from the 1986 and 1994 National Mortality Followback Surveys, sponsored by the National Center for Health Statistics, show that residence in a nursing home during a person’s lifetime is not rare. Approximately 37 percent of elderly people who died in 1986 spent some time in a nursing home during their lives. This increased to 40.5 percent for those who died in 1993. The largest increase, 4.8 percentage points, was for people aged 65 to 74. For decedents in both years, about 30 percent spent less than three months in a nursing home, and about 20 percent spent between three months and one year in a nursing home.
118 LaPlante, Mitchell P. et al. (2004) "Unmet Need for Personal Assistance Services: Estimating the Shortfall in Hours of Help and Adverse Consequences," Journal of Gerontology 59B, 2: S98108. See also: Abt Associates, Inc. (2004) The Effect of Reducing Falls on Long-Term Care Expenses: Literature Review. Reports prepared under contract #HHS-100-03-0008 between the U.S. Department of Health and Human Services (HHS), Office of Disability, Aging and Long-Term Care Policy (DALTCP) and Abt Associates, Inc.
119 Johnson, Colleen L. and Donald J. Catalano (1981) “Childless Elderly and Their Family Supports,” The Gerontologist 21, 6, 610-17; Zhang and Hayward op. cit.; Branch and Jette op. cit. note that among women the use of informal support increases as the number of living children increases and the number of healthy children decreases. For men, physical disability has the strongest effect.
Barker, Judith C. (2002) “Neighbors, Friends, and Other Nonkin Caregivers of Community-Living Dependent Elders,” Journal of Gerontology: Social Sciences, 57B,3, S158-67.
112
120

124
Approximately one-third spent one to five years in a nursing home, and about seventeen percent spent five or more years in a nursing home. Nursing home use was higher among women, and among people who were not married. 121
�F
The 1994 Survey data support the projection that 46 percent of persons who turned 65 in 2000 will spend time in a nursing home before they die. Half of women aged 65 in 2000 will spend some time in a nursing home and twelve percent will spend at least five years. Among community residents, more than half of those younger than 90 years will spend a year or more in a nursing home. The expected number of years to admission varies by age. For those aged 65 in 2000, there are 18.4 years expected until admission, decreasing to 0.9 years for those aged 95.
National Long-Term Care Survey. Of course, both age and health figure prominently in decisions to enter nursing homes. Alzheimer’s disease is an important risk factor. Data from the 1982-84 National Long-Term Care Survey indicate that elders who live in the community and are dependent have a mean probability of 0.095 of a nursing home admission over the two-year survey period. This mean increases with age:
• Age 65 = .059, • Age 75 = .088, and • Age 85+ = .131.
The mean also increased with increasing levels of ADL limitations. The people with the highest probability of admission – equal to .154 - were those with five or more ADL dependencies. During the two-year survey period, the average length of stay (LOS) for a
F �Fperson who was either discharged alive or died in a nursing facility was 340 days. 122, 123,
�F
121 Spillman, Brenda and James Lubitz (2002) “New Estimates of Lifetime Nursing Home Use; Have Patterns of Use Changed?” Medical Care 40, 10: 965-975. See also: Kemper, Peter and Christopher M. Murtaugh (1991) “Lifetime use of nursing home care,” New England Journal of Medicine 324, 9: 595-631; Nishita CM, Wilber KH, Matsumoto S, Schnelle JF (2008) “Transitioning residents from nursing facilities to community living: who wants to leave?” J Am Geriatr Soc.56, 1:1-7.
122 Bauer, Ellen J. (1996) “Transition from Home to Nursing Home in a Capitated Long-Term Care Program: The Role of Individual Support Systems,” Health Services Research 31, 3: 309326.
123 Korbin, Liu et al. (1991) “Predicting nursing-home admission and length of stay, “ Medical Care 29, 2: 125-141.
124 Burr op. cit.
113
National Health Interview Survey and National Nursing Home Survey. Nursing home admissions tend to result in short stays, due to death, transfers or discharge in the community, with 54 percent of all nursing home admissions leaving within three months after admission. However, cross-sectional data from the 1977 National Health Interview Survey and 1977 National Nursing Home Survey show that the proportion of long-stayers in a nursing home at any given time exceeds the proportion who are short-stayers, with an average length of stay of more than 900 days and 75 percent with more than 195 days of residency. 125 Slightly more elders were nursing home residents in the coldest climates F
than the warmest climates, but this result may be confounded by the outmigration of healthy elders to warmer climates. 126
F
Massachusetts Health Care Panel Study. The Massachusetts Health Care Panel Study, begun in 1974-5, was a prospective cohort study of 1,625 people aged 65 and older. Follow-up a decade later showed that prior institutionalization, age and income interactions, and indicators of need were the strongest predictors of institutionalization. In this cohort, a woman 80 or older had a 0.51 probability of entering a nursing home over a decade with no other risk factors. This probability increased substantially when other risk factors are present, for example, rising to 0.84 with a combination of restricted mobility and fear of one’s neighborhood. When fear of the neighborhood was the only risk factor, the probability was 0.69. The risk for women in this age group with one or more ADL disabilities was 0.81. For men over 80 years, the risk was 0.42 with no other risk factors present, rising to 0.92 for smokers with restricted mobility. When fear of the neighborhood was the only risk factor, the probability was 0.59. 127
�F
Massachusetts Health Care Panel Study data show that a woman under 80 years had a 0.09 probability of entering a nursing home over a decade with no risk factors. This probability increased when other risk factors are present, for example, rising to 0.27 with a combination of restricted mobility and fear of one’s neighborhood. When fear of the neighborhood was the only risk factor, the probability was 0.16. The risk for women in this age group with one or more ADL disabilities was 0.24. For men under 80 years, the risk was 0.07 with no other risk factors present, rising to 0.38 for smokers with restricted mobility. When fear of the neighborhood was the only risk factor, the probability was 0.12.
125 Ninety-eight percent of residency status was correctly classified by the following variables: physical dependency, mental disorder and degenerative disease, lack of spouse, being white, poverty, older age, unoccupied nursing home beds, and climate. Climate was defined as the sum of the number of degrees by which each average daily temperature fell below 65 degrees for that month.
126 Weisert, William G. and Cynthia M. Cready (1989) “Toward a model for improved targeting of aged at risk of institutionalization,” Health Services Research 24, 4: 485-510.
127 Jette, Alan M. et al. (1992) “High-risk profiles for nursing home admission,” The Gerontologist 32, 5: 634-640.
114

�Alternatives to Nursing Home Care
Eligibility for assistance from the Medicaid program does not guarantee access to nursing home care. Private pay patients pay more for nursing home beds than Medicaid pays in reimbursement for the same bed. Consequently, those who can pay privately are favored over Medicaid patients when applying for admission.
Some States reimburse nursing homes according to the average cost of caring for their ill patients who receive assistance from Medicaid. An unintended consequence is that proprietary nursing homes value the most ill, consonant with their profit motive. Those who require the most care are preferred over the less sick. Minor improvements in one’s health can result in pressure for discharge. The result, for the less sick Medicaid patients, is fewer options for institutional care. 128
F
Choi (1998) reports that:
A nursing home stay can impoverish even a well-to-do elderly person. The poor elderly’s nursing home stays are most likely to be paid for by Medicaid and SSI, with the elderly likely to continue to be covered by Medicaid and receive SSI when they return to the community.
Renters and those who had been institutionalized are more likely than their homeowner, non-institutionalized counterparts to be impoverished to the point of achieving eligibility to receive Supplemental Security Income (SSI) payments. 129
�F
Nationally, occupancy rates in nursing homes declined in the 1990s, due to expansions of in-home services and alternative residential arrangements. In their summary of the literature, Freedman et al. (2004) note that home health care (i.e. skilled nursing visits, home health aid visits, various therapy services and use of durable medical equipment in the home) may reduce overall care costs without compromising clinical outcomes as well as lower the risk of functional decline and institutionalization. Highest usage has been among the poorest and the wealthiest clients. However, for a Medicare managed care population that has minimal copays that would otherwise reduce access, elders with low lifetime accumulation of assets are more likely than others to have one or more home health visits, controlling for differences in health status and key demographic factors. In
128 Abend-Wein, Marjorie (1991) “Medicaid’s Effect on the Elderly: How Reimbursement Policy Affects Priorities in Nursing Homes,” Journal of Applied Gerontology 10: 71-87. Available at: http://jag.sagepub.com/cgi/content/abstract/10/1/71
129 Choi, Namkee G. (1998) “A Comparative Study of Elderly SSI Recipients, Denied Applicants, and Eligible Nonapplicants,” Journal of Aging and Social Policy 10, 2: 7-28.
115

131
other words, elders with few assets are also appear to have relatively low access to informal, unpaid sources of care. 130
F
Private market assisted living. Assisted living emerged in the 1980s as an alternative to nursing home care. Assisted living, usually in upscale apartments, seeks to provide choice, privacy, control and dignity to its clients, attributes sorely lacking in most nursing homes. In the mid-1990s, 30,000 to 40,000 units were available to meet demand for this arrangement. By 2006, 900,000 lived in this type of setting. However, private market assisted living is not funded by Medicare or Medicaid programs, so it tends to attract people with higher incomes. It is affordable for only one-fifth of those aged 75 and older. 131, 132
��F
Assisted living projects focus on older people’s increasing need for assistance as they age, and they assure that supportive services are available to those who need them. A Metlife survey of assisted living facilities in 87 major markets in 2007 found an average cost per month of approximately $3,000. Costs varied considerably by location, with a low of $1963 in Indianapolis and a high of $5031 in Washington DC. 133
F
Board and care. Board and care is the most common affordable care alternative to nursing homes for low-income elderly. As of 2001, there were about 1 million residential care beds, as compared to 1.68 million nursing home beds. About half of these residents have self-care limitations. 134 Providers tend to offer the same level of care as in assisted �F
living, but in relatively modest conditions and for considerably less remuneration than required for assisted living. Residents mostly pay for care with Supplemental Social Insurance (SSI), supplemented in most States by State Supplemental Payments (SSP).
130 Applebaum, Robert A. et al. (2004) “The changing world of long-term care: A state perspective,” Journal of Aging and Social Policy 16, 1: 1-19; Freedman, Vicki A. et al. (2004) “Socioeconomic disparities in the use of home health services in a Medicare Managed Care population,” Health Services Research 39, 5: 1277-1297.
Gusmano, op cit.; Herd, Pamela op cit.; Harahan, Mary F, Alisha Sanders, and Robyn Stone (2006b) Lessons from the Workshops of Affordable Housing Plus Services Strategies for Low- and Modest-Income Seniors. Report prepared for HHS and HUD Contract #I-OPC-22893; Spillman , Brenda C. and Kirsten J. Black (2006) The Size and Characteristics of the Residential Care Population: Evidence from Three National Surveys. Report prepared under contract #HHS-100-97-0010 between the U.S. Department of Health and Human Services (HHS), Office of Disability, Aging and Long-Term Care Policy (DALTCP) and the Urban Institute. See also: Frank, Jaquelyn (2001) “How Long Can I Stay? The Dilemma of Aging in Place in Assisted Living,” Journal of Housing for the Elderly 15, ½: 5-30.
132 See: www..ncal.org/about/resident.cfm 133 See: www.consumerhealthratings.com/index.php?action=showSubCats&cat_id=208
134 Bould op. cit.
116

The supply of beds varies greatly by State, with small to medium States tending to have the highest supply per 1,000 population. Variations in the supply of board and care beds is explained by States’ SSI policies, board and care regulations, and Medicaid nursing homes reimbursement rates as well as the percentage of the population over age 65. 135
��F
As of 1998, 32 States were reimbursing board and care homes with Medicaid funds. These programs provide such low payments that most board and care operators, who tend to be unlicensed and low-income older women, can barely break even, with some actually operating at a loss. Quality of care is much more often an issue with this arrangement than with assisted living. 136
�F
�Reduction of Institutionalization
Identifying program designs that both reduce institutionalization and lower cost has been an important issue. States have often been unable to expand their Medicaid budgets, especially during economic downturns. As a result, reimbursement rate increases have not kept up with nursing home cost inflation. For example, rate and cost data from 37 States for 2001 indicate an average shortfall between Medicaid reimbursement and allowable Medicaid costs of $11.55 per Medicaid patient day. The average shortfall climbed 31 percent from 1999 to 2001. 137
�F
The idea that home and community-based care can function effectively as a lower cost alternative to nursing homes has been discussed for three decades. Nyman (1994) notes, though, that 28 early home and community care demonstrations failed to show an overall reduction of costs, because they did not select clients that were truly at-risk of institutionalization. A later demonstration in Oregon showed that well designed programs can be successful: for every 100 additional adult foster care patients in a county, 85 nursing home patients were eliminated. He suggests that targeting programs to the most vulnerable people is essential, and the most successful targeting is to people who are already residing in nursing homes or have completed preadmission screening for a nursing home. 138 A recent comparison of State spending on home and community-based services to older, unmarried women found considerable variation. As State spending for these services increased, the risk of institutionalization decreased. 139
F
135 Herd op. cit.; Benjamin, A.E. and Robert J. Newcomer (1986) “Board and Care Housing: An Analysis of State Differences,” Research on Aging 8: 388-406. Available at : http://abs.sagepub.com; Smith et al. (2000) op. cit. reports that in 2000 the maximum monthly Federal SSI benefit paid to persons with no other income was $512 for an individual and $774 for a couple.
136 Herd op cit.
137 BDO Seidman op. cit.
138 Nyman op. cit.
139 Burr op. cit.
117

The magnitude of savings will always depend on the specifics of programs in each State. The remainder of this section summarizes several demonstrations that are particularly instructive.
South Carolina Community Long Term Care project. The South Carolina Community Long Term Care (CLTC) section of the 1115 Medicaid demonstration program was initiated in 1978 by the South Carolina General Assembly to develop and evaluate a community-based long term care system. The demonstration program, completed in 1984, served three counties that were representative of the State. All persons attempting to obtain Medicaid-sponsored nursing home care were assessed by the project staff to determine functional disabilities, as defined by Medicaid regulations. Only persons who were eligible for Medicaid, or who would have been eligible if institutionalized, were admitted to the CLTC program via random assignment. They received case management and a variety of community services not offered in other parts of the State. Those not assigned to CLTC were only eligible for services under the regular Medicaid program. 140
�F
There were 284 clients in CLTC and 340 clients receiving regular Medicaid benefits. Data on each client were collected for eighteen months regarding entry into nursing homes and the number of days spent in nursing homes. During this time, 43 percent of CLTC participants entered a nursing home, while 59 percent of the control clients entered a nursing home. In addition, the CLTC participants spent 30 percent of the study period in nursing homes, while the control group spent 49 percent in nursing homes. These differences were statistically significant.
In addition to targeting services to clients who were financially and medically eligible for nursing home placement under Medicaid, the success of the CTLC project was in part due to having sufficient time allotted to program development, which included a great deal of dedicated staff work to establish ties to the community agencies at the local level that provided client referrals to the project. The authors also note that the project did not make nursing home services entirely unnecessary. The project prevented or delayed institutionalization when the client and her family wanted to avoid nursing home placement, when some family support was available, and when the client’s medical or personal care needs could be met by community services.
In 1987, a comparison of the CTLC project with other demonstrations that expanded in-home service coverage to include nonmedical services, such as homemaking and personal care, found that the CTLC clients were the most disabled of any of the demonstrations. A single year of follow-up data showed that the CTLC produced higher levels of reduction
140 Nocks, Barry C. et al. (1986) “The Effects of a Community-based Long Term Care Project on Nursing Home Utilization,” The Gerontologist 26 (2): 150-157.
118

of nursing home use, compared to the other projects. The CTLC project was cost effective, but that was due to their clients paying for room and board themselves. 141
�F
Nursing Home Transition Demonstration Grant Program. The Centers for Medicare & Medicaid Services (CMS), in association with the Assistant Secretary of Planning and Evaluation (ASPE) at HHS, sponsored the Nursing Home Transition Demonstration Program, which was set up to assist States in providing transition options to nursing home residents who want to move back to the community. Under the Demonstration program, CMS and ASPE awarded grants to 12 States between 1998 and 2000 to help nursing home residents move back to the community. 142 The nature of the intervention F
varied by site. The evaluation of the program employed a case study approach, based upon site visits to nine Demonstration States. �F
143 The findings from the demonstration
141 Kemper, Peter, Robert Applebaum, and Margaret Harrigan (1987) A Systematic Comparison of Community Care Demonstrations. Report prepared under contract between HHS’s Office of Social Services Policy (now the Office of Disability, Aging and Long-Term Care Policy) and the University of Wisconsin.
142 Not all of the persons targeted by the grantees were elderly. Some State demonstrations included elderly as well as non-elderly nursing home residents. In fact, two thirds of the people served by Arkansas were non-elderly. And Florida targeted the grant to people aged 55 and under with brain and spinal cord injuries. Wisconsin also targeted people with disabilities who were under 65 although they ended up serving some people over 65. Likewise, in Michigan most people enrolled in the program were under 60, although the overwhelming majority of Michigan nursing home residents are over 65. On the other hand, the majority of participants targeted by the Pennsylvania grantees were 60 and older. In Colorado, the average age of persons targeted for the Demonstration was 62. And most New Jersey enrollees were age 61 or older. In fact, nearly two fifths were age 81 and older.
See: 1. Eiken, Steve: "Community Choice: New Jersey's Nursing Home Transition Program" (December 22, 2003) [http://aspe.hhs.gov/daltcp/reports/NJtrans.htm]
2. Eiken, Steve, Brian Burwell and Anthony Asciutto: "Michigan's Transitioning Persons from Nursing Homes to Community Living Program" (July 31, 2002). [http://aspe.hhs.gov/daltcp/reports/MItrans.htm] 3. Eiken, Steve, Marjorie Hatzmann and Anthony J. Asciutto: "One-to-One: Vermont's Nursing Home Transition Program" (December 19, 2003). [http://aspe.hhs.gov/daltcp/reports/VTtrans.htm] 4. Eiken, Steve, and Alexandra Heestand: "Pennsylvania Transition to Home (PATH): Pennsylvania's Nursing Home Transition Program" (December 22, 2003). [http://aspe.hhs.gov/daltcp/reports/PAtrans.htm] 5. Eiken, Steve, Daria Steigman and Jeff Keilson: "Project CHOICE (Consumers Have Options for Independence in Community Environments): Texas' Nursing Home Transition Program" (December 22, 2003). [http://aspe.hhs.gov/daltcp/reports/TXtrans.htm] 6. Eiken, Steve, David Stevenson and Brian Burwell: "The Homecoming Project: Wisconsin's Nursing Home Transition Demonstration" (August 21, 2002). [http://aspe.hhs.gov/daltcp/reports/WItrans.htm]
119

provide important information on availability of affordable, accessible housing; on availability of services; and on cost savings due to deinstitutionalization.
The case studies make it clear that some elderly residents of nursing homes can move back to the community if they have access to affordable housing and other supportive services. But, nearly all of the case studies cited the lack of affordable accessible housing as one of the major barriers facing residents seeking to return to the community.
One of the main recommendations of the Colorado demonstration staff was to increase the supply of affordable, accessible housing. In New Jersey, staff noted that one of the most difficult challenges faced by demonstration participants was finding affordable, accessible housing, with most senior housing units having waiting lists. People in New Jersey often waited as long as two years to obtain housing.
In two of the Texas counties where the grant program was implemented, the researchers report that finding affordable and accessible housing was a significant barrier to successful program implementation. In Wisconsin, staff serving Milwaukee reported a lack of affordable and accessible housing was the most significant barrier to community relocation.
In Vermont, State staff and coalition members also said a lack of affordable, accessible housing was a significant barrier to transition. For some people, affordable housing was available but the housing was not accessible.
The Michigan demonstration staff reported that some people who had completed other preparations for living in the community remained in a nursing home due to a lack of accessible, affordable, safe housing, and there were few means to improve access to housing. Demonstration staff pointed out that many communities had long waiting lists for public housing. Housing Choice Vouchers were difficult to acquire.
The Pennsylvania demonstration staff said that the lack of available housing was the most significant barrier to transitioning. People who needed public housing faced waiting lists of several months and difficulty finding an accessible apartment or house. However, staff noted that housing accessibility was much less of an issue in rural areas.
7. Holtz, Debra, and Steve Eiken: "Fast Track and Other Nursing Home Diversion Initiatives: Colorado's Nursing Home Transition Grant" (December 23, 2003) [http://aspe.hhs.gov/daltcp/reports/COtrans.htm] 8. Schaefer, Michael, and Steve Eiken: "Partnerships for Community Living: Florida's Nursing Home Transition Program" (December 23, 2003) [http://aspe.hhs.gov/daltcp/reports/FLtrans.htm] 9. Schaefer, Michael, and Steve Eiken: "Passages: Arkansas's Nursing Home Transition Program" (December 26, 2003) [http://aspe.hhs.gov/daltcp/reports/ARtrans.htm]
120

The case studies indicate that nursing home representatives are often a source of resistance when it comes to facilitating such transitions. One reason may be that some nursing homes were concerned about loss of income, with the demonstration seen as siphoning off their clients. New Jersey was one of a number of demonstration States that pointed to non-cooperation by nursing home staff as a significant impediment.
Some nursing home residents enrolled in the demonstration succeeded in returning to community living because they were able to bypass the scarce supply of subsidized housing earmarked for the elderly and persons with disabilities. In Wisconsin some successful residents were also able to move to their children’s houses. In New Jersey, as well, almost half of the home-based consumers lived with a spouse or child.
The Nursing Home Transition Demonstration also provided findings regarding availability of supportive services. The required services seem to fall into two categories: those that are specifically housing-related and those that meet the daily needs of living. The former include money for furniture, utility and rent deposits, moving expenses, the cost of living space adaptations to promote accessibility, etc. Services related to daily living needs include case management, chore services, meal preparation, transportation, etc. In Colorado, food preparation was the most frequently identified service need, followed by personal care, homemaker services, medication monitoring and a personal emergency response system.
Although Medicaid has a waiver process to cover the services costs of people moving to the community from a nursing home, this process does not always coincide well with the timing of the transition. In many places, there are long waiting lists for such waivers. Vermont was one of a number of grantees citing this problem. The Michigan staff found the process of getting Medicaid approval of durable medical equipment like power wheelchairs to be cumbersome because of all the steps involved. In Wisconsin, several nursing home residents had tried to make a transition before the Demonstration, but had been unable to do so because they could not pay for such items as apartment deposits or furniture.
In Colorado, one of the major barriers preventing people from successfully returning to the community was the length of time required for Medicaid financial eligibility determination. Eligibility determination was often not completed in time for people who had been hospitalized and were at a crossroads in terms of whether they would be discharged to a nursing home or to a community living situation. One of the major uses of the Demonstration grants was to fast-track Medicaid eligibility and to provide gap funding to cover the up-front cost of services like those found in many Section 202 elderly projects, including case management, food, and transportation.
Finally, with regard to cost savings resulting from deinstitutionalization, the case studies provided evidence that community living is less expensive than the Medicaid costs associated with nursing home care. The Arkansas grantees explicitly identified cost-effectiveness as one of their criteria for choosing nursing home residents who would make good candidates for community living. Cost effectiveness is obviously dependent
121

on the level of care required by an individual, but all of the State grantees were able to identify a group of nursing home residents for whom transitioning to community living met the cost test. In Arkansas, the per-resident average expense of achieving a transition was $2,219. This amount included $1,150 for such expenses as furnishings and durable medical supplies; and also included $669 for supplemental services such as meals, personal care and chore services. Further, the Demonstration database recorded all Medicaid expenditures for Demonstration participants in order to compare the cost of nursing home and community living. The average Medicaid cost for the first three months living in the community was $1,303 ($434 per month). These costs were calculated to be 39 percent of the Medicaid costs for the same consumers in their last three months in a nursing home.
Colorado staff estimated their local Demonstration project saved $407,012 in Medicaid expenditures during the grant period. This estimate was based on statewide data comparing average nursing home costs to the average cost of delivering the services associated with the Demonstration.
HOPE IV. The HOPE for Elderly Independence Demonstration Program (HOPE IV) was designed to help low-income, frail, elderly persons maintain the highest possible quality of life, preferably their own homes. In addition to providing Section 8 housing voucher assistance, the program provided case management and non-medical supportive services. To understand the effects of the Program, HOPE IV elderly were compared to a similar population receiving Section 8 assistance only.
At the end of the two-year period of the study, the HOPE IV participants and the comparison group members differed in several respects. The HOPE IV participants were frailer than the comparison group and a higher percent received increasing amounts of services. The HOPE IV participants’ disabilities increased appreciably, while the control group’s did not. Attrition rates were nearly identical for HOPE IV participants and the comparison group, 40 percent versus 38 percent respectively. 144
�F
Harahan et al. note that the creation of affordable housing plus services on a wide scale requires a champion or catalyst that can bring together very disparate worlds to mobilize sufficient resources, in the face of declining funding. However, low-income housing providers vary in their willingness and capacity to support frail and disabled residents. While some affordable housing properties may be able to support older adults who need a nursing home level of care, this is not likely to be the norm for the foreseeable future. 145
�F
144 Ficke, Robert C. and Susan G. Berkowitz (1999) Evaluation of the HOPE for Elderly Independence Demonstration: FINAL REPORT. Westat, Inc., Rockville, MD. Available at: http://www.huduser.org/publications/pubasst/suppsvcs/hopeval.html.
145 Harahan et al. (2006b) op. cit.
122

Evaluation of HUD’s Congregate Housing Services Program. The Congregate Housing Services Program (CHSP), authorized under Title IV of the Housing and Community Development Act of 1978, awarded funds to pay for the provision of community-based supportive services to Section 202 projects and other housing projects built and operated by local public housing authorities. The purpose of the funds was to help frail and persons with disabilities to avoid premature or unnecessary institutionalization. Participants received two on-site meals daily, plus other non-medical services to fill gaps in a project’s service delivery system. These could include housekeeping, personal assistance, transportation, escort, and social services. The average monthly cost per participant in the early 1980s was $204, with slightly more than half that amount used to pay for meals. 146
�F
An evaluation of the Congregate Housing Services Program, conducted between 1980 and 1985, addressed questions pertaining to process, performance and impact of the program in 48 awardee buildings. Of these, 24 projects were Section 202 housing. 147
F
For the impact segment of the evaluation, recipients of CHSP services were compared to vulnerable tenants in non-CHSP buildings. After thirty months the death rates were almost identical. After fourteen months, differential effects on institutional placement rates were observed. Among those still alive, 92 percent of recipients of CHSP services resided on community settings while 88 percent of controls resided on community settings. For every recipient of CHSP services who experienced an institutional placement, 1.5 vulnerable tenants in non-CHSP buildings experienced such a placement. The authors noted that even greater short-term positive effects of CHSP services could be expected if the program is used to deinstitutionalize elderly persons. 148
F
The findings of the process segment of the evaluation suggest that congregate housing services need to be concentrated in housing sites with a substantial number of high-risk elders that will give admission priority to vulnerable housing applicants, especially those who are already in institutions or have applied for placement in a nursing home. Careful screening of applicants is important for maximum cost-effectiveness. The evaluation of the National Long Term Care Demonstration made similar recommendations. 149
�F
146 Sherwood, Sylvia (1985) Evaluation of the Congregate Housing Services Program, HUD Contract # HC-5373. Boston, Mass: Hebrew Rehabilitation Center for Aged. Unpublished manuscript. The CHSP program continues to provide funding to the originally selected projects. See also: Kaye, Lenard W. and Abraham Monk (1991) Congregate Housing for the Elderly: Theoretical, Policy and Programmatic Perspectives. Binghamton, NY: Haworth Press.
147 Sherwood op. cit.
148 Sherwood op. cit. The difference in institutional placement between recipients of CHSP services and vulnerable tenants in non-CHSP buildings was significant at the .01 level.
149 Kemper, P. (1988) “The Evaluation of the National Long Term Care Demonstration. 10. Overview of the Findings,” Health Services Research 23, 1: 161-74.
123

Comparison of the Costs of Institutionalization and the Costs of Providing Section 202 Housing with Supportive Services
Overview. Many States are currently diverting potential nursing home-eligible individuals to home and community-based services, in an attempt to reduce nursing home
Futilization. ��F F
150, 151, 152 The Section 202 program contributes to this effort by providing good quality, affordable housing and by making available service coordinators to link project residents with services available in the community. The Fiscal Year 2009 Annual Performance Plan (APP) notes that this achieves significant medical care-related savings.
As noted above, the Nursing Home Transition Demonstration Program in Arkansas explicitly identified cost-effectiveness as one of the criteria for choosing nursing home residents who would make good candidates for community living. The Arkansas demonstration reported costs for community living that were 39 percent of the Medicaid costs for the same consumers in their last three months in a nursing home. We regard the Arkansas example as the most optimistic scenario for savings that could be achieved by the Section 202 program, provided the reforms recommended in this report are adopted.
In this section of the report, we discuss another scenario, comparing the costs of Section 202 housing and supportive services with those of institutionalization, using an assumption of a very low-income population that is aging in place. The discussion begins with a presentation of evidence on the risk of institutionalization among 278,000 Section 202 residents. Based on the allowable daily costs in the Medicaid program, we estimate potential nursing home costs for an estimated 90,000 Section 202 residents considered to be “at-risk” of institutionalization. Using findings from the Congregate Housing Services Program (CHSP), we examine the potential for reduction in Medicaid
150 Government Accountability Office (1994) Medicaid Long-Term Care: Successful State Efforts to Expand Home Services While Limiting Costs. GA0/HEHS-94-167. Available at: www.gao.gov; BDO Seidman, LLP (2005) op. cit. See also: Mitchell, Jean M. and Kathryn H. Anderson (2000) “Effects of Case Management and New Drugs on Medicaid AIDS Spending,” Health Affairs 19, 4: 233-243. This study evaluates the effects of Florida's participation in the Medicaid acquired immunodeficiency syndrome (AIDS) home and community-based waiver and the use of recently developed AIDS drugs on spending per Medicaid beneficiary. Monthly Medicaid spending patients without waiver services was significantly higher than was spending for waiver participants.
151 Dan Balz comments: “Rising health care costs, particularly for prescription drugs and long-term care, have devastated state Medicaid budgets….Last month, the governors…presented Congress with a bipartisan proposal designed to give states more flexibility to administer the program and to save some money.” In “Governors Urge Focus on Medicaid; States Want More Flexibility to Administer Program, Reduce Cost,” in The Washington Post July 26, 2005.
152 See: O’Keeffe, Janet and Joshua Wiener (2004) “Public Funding for Long-Term Care Services for Older People in Residential Care Settings,” Journal of Housing for the Elderly 18, ¾: 51-80.
124

costs associated with institutionalization, when at-risk individuals live in Section 202 housing and receive supportive services instead of residing in a nursing home.
Next we provide per-person cost comparisons for at-risk individuals. We present costs estimates both for institutionalization and for the provision of Section 202 housing assistance plus supportive services. These estimates are presented for three time periods: 1) the length of time that an at-risk individual would be institutionalized; 2) a two-year period; and 3) the length of time that an at-risk individual would be likely to reside in Section 202 housing. For each time period, we present cost estimates for a lower-end level of services that corresponds to the services typically needed by a newly admitted, Section 202 at-risk resident; and also for an upper-end level that reflects a full range of services that might be needed by some residents who remain in Section 202 housing for an extended period.
Finally, we present aggregate cost comparisons for the entire Section 202 population. For this cost comparison, we include costs of supportive services that are made available to the at-risk population of 90,000 persons, but we include housing costs for all 278,000 Section 202 residents. These comparisons are made over a two-year period. Costs are once again estimated using a lower- and upper-end measure of the types of supportive services needed by at-risk residents.
Risk of Institutionalization. As of December 2004, there were approximately 278,000 elderly tenants in Section 202 assisted housing with nearly 89,000 who were more than 80 years old. 153 Table 4-1 shows the overall age distribution.�F
Table 4-1 Age Distribution of People Who Were
Section 202 Tenants, as of December 2004
Age Group Number of Persons Percent Under age 65 22,214 8 %
Age 66-70 47,205 17 % Age 71-75 58,312 21 % Age 76-80 61,089 22 % Age 81-84 49,982 18 % Age 85+ 38,875 14 %
Total 277,677 100 % Source: Special tabulations by PD&R staff.
Ideally, estimation of the percentage that is at risk for institutionalization among residents of Section 202 housing would be done on the basis of frailty. This type of information is
153 Source: special tabulations using data from HUD’s TRACS and REMS systems.
125

not currently available, however, and will need to be deduced from larger population estimates by age and income groups.
The US Census Bureau defines disability in two ways. Table 4-2 elaborates on these differences. Institutionalization is not just the result of disability. Typically, disabled elders are institutionalized when personal and financial resources to care for them in the community have been exhausted. Some of the elders who fall into the first definition (i.e., having severe disabilities) will be candidates for nursing home placement when resources to care for them fall short. For the purpose of estimating the number of Section 202 residents who are candidates for institutionalization, however, the second more restrictive definition, based on the percentage needing personal services with at least one activity of daily living (ADL or IADL), will be used.
A commonly used summary measure of morbidity used by the National Center for Health Statistics (NCHS) is self-reported overall health, which can be “excellent,” “good,” “fair,” or “poor.” Survey data show that the percentage of adults who report that they are in “fair” or “poor” health varies by income level. The near-poor are slightly more than twice a likely as the non-poor to report “fair” or “poor” health. Plus, Redfoot and Kochera (2004) report that the 1999 National Long-Term Care Survey finds a similar gap in health status for all Americans over age 65. Among the lowest income quartile, 24.5 percent have one or more ADL or IADL disabilities. For the middle two quartiles and the highest quartile, 14.8 and 8.8 percent are this disabled, respectively. 154
��F
Census Bureau data on the percentages needing personal assistance with the six activities of daily living (ADLs) or six instrumental activities of daily living (IADLs) (Table 4-2) provide a starting point for our estimates of potential savings. However, the Census Bureau’s rates of disability by age group are for all adults, regardless of income, and we know that disability rates are higher among the low-income population. Since morbidity rates are highly correlated with social class generally, any estimate of disability rates of the Section 202 tenant population must take into account that the vast majority are poor or near-poor. In 2002, 6.4 percent of the non-poor, with incomes at 200 percent or greater of the poverty threshold, reported fair or poor health, while 14.6 percent of the near poor, at 100 to 200 percent of poverty reported this level of health. This is considerably lower than for persons with less than a poverty level income, with 20.9 reporting fair or poor health. 155
F
154 See: National Center for Health Statistics: Health, United States, 2004. Table 56; Redfoot and Kochera op. cit.
See, for example: Borg, V. and T. Kristensen (2000) “Social Class and Self-Rated Health: Can the Gradient be Explained by Differences in Life Style or Work Environment,” Social Science and Medicine 51: 1019-1030; Lantz, P. et al (1998) “Socioeconomic Factors, Health Behaviors, and Mortality,” Journal of the American Medical Association 279 (21): 1703-1708; Marmot, M. et al. (1997) “Social Inequalities in Health: Next Questions and Converging Evidence,” Social Science and Medicine 44: 901-910; and Power, C. et al. (1998) “Inequalities in Self-Rated Health: Explanations from Different Stages of Life,” The Lancet 351: 1009-1014: cited in Contoyannis, Paul and Andrew M. Jones (2004) “Socio-economic Status, Health and Lifestyle,” Journal of Health Economics 23: 965-995; Smith, J.P. (1997)"Wealth Inequality
126
155

Table 4-2 Alternative Definitions of Disability, According to Census Bureau Definitions
Definitions 1. Having severe disabilities 2. Needing personal care
Actual text
Elders living in the community with a severe disability, including people with mobility restrictions, mental conditions that interfere with everyday activities, or Alzheimer’s disease. ��F
156
Elders living in the community who were so disabled that they need personal assistance with the six activities of daily living (ADLs) or six instrumental activities of daily living (IADLs). �F 157
National Age 65-69 30.7 % 8.1 % percentages Aged 70-74 28.3 % 10.5 %
of Elders with these problems:
Aged 75-79 Aged 80 and
over
38.0 %
57.6 %
16.9 %
34.9 %
Table 4-3 presents our estimates of number of Section 202 residents with high risk of institutionalization, by age group. We divide the Section 202 population into groups based on age, apply the disability rates found in the literature to each group, and then add the resulting numbers to arrive at a national estimate. Our estimated rates of risk for institutionalization reflect the very low-income status of the Section 202 population, and are consistent with National Center for Health Statistics (NCHS) national rates cited above.
For all age groups combined, the estimates in Table 4-3 translate to an estimated 38 percent of the Section 202 population that is disabled enough to be considered at-risk for institutionalization. This percentage is consistent with information reported by Section 202 managers in 1999 to Heumann et al. (2001). For example, managers reported that 30.5 percent of their tenants have difficulties getting out of chairs, and 34 percent have difficulties getting to and from places. Similarly, the 1999 Long-Term Care Survey
Among Older Americans," Journal of Gerontology B, 52, Spec no.: 74-81; Smith, J.P. and Raynard Kington (1997) “Demographic and Economic Correlates of Health,” Demography 34, 1: 159-170; Robert, Stephanie and James S. House (1996) “SES Differentials in Health by Age and Alternative Indicators of SES,” Journal of Aging and Health; 8, 3: 359-388. Waidmann and Thomas op.cit. report that elders with incomes over $50,000 per year face 21 percent of the risk of nursing home admission when compared to elders with incomes less than $10,000. After controlling for age, sex, race, education, family structure and geography, the magnitude of this difference is somewhat smaller, but still present and very significant.
156 McNeil, Jack (1997) Current Population Reports: Americans with Disabilities; Household Economic Studies, U.S. Census Bureau.
157 McNeil, Jack op cit. As noted above, the activities of daily living (ADLs) are bathing, dressing, toileting, transferring, and eating. The instrumental activities of dialing living (IADLs), include escort help for outside appointments, medication monitoring and cueing, bill paying, and health status monitoring.
127
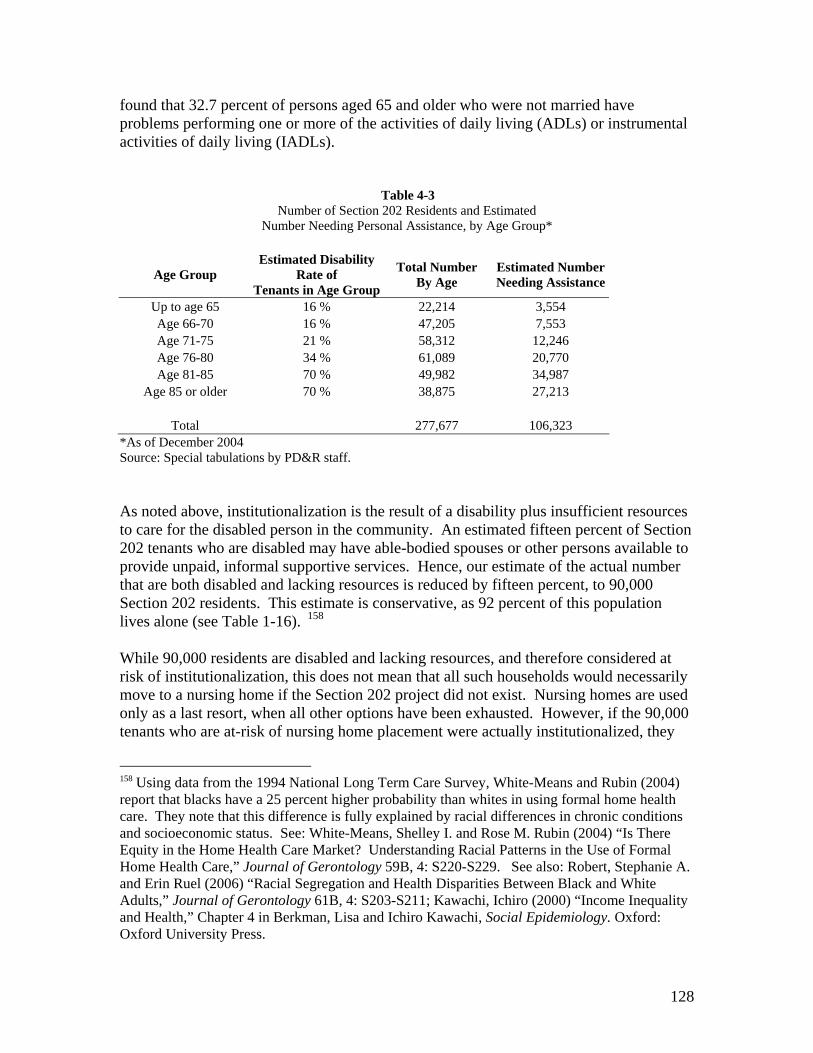
found that 32.7 percent of persons aged 65 and older who were not married have problems performing one or more of the activities of daily living (ADLs) or instrumental activities of daily living (IADLs).
�Table 4-3 Number of Section 202 Residents and Estimated
Number Needing Personal Assistance, by Age Group*
Age Group Estimated Disability
Rate of Tenants in Age Group
Total Number By Age
Estimated Number Needing Assistance
Up to age 65 16 % 22,214 3,554 Age 66-70 16 % 47,205 7,553 Age 71-75 21 % 58,312 12,246 Age 76-80 34 % 61,089 20,770 Age 81-85 70 % 49,982 34,987
Age 85 or older 70 % 38,875 27,213
Total 277,677 106,323 *As of December 2004 Source: Special tabulations by PD&R staff.
As noted above, institutionalization is the result of a disability plus insufficient resources to care for the disabled person in the community. An estimated fifteen percent of Section 202 tenants who are disabled may have able-bodied spouses or other persons available to provide unpaid, informal supportive services. Hence, our estimate of the actual number that are both disabled and lacking resources is reduced by fifteen percent, to 90,000 Section 202 residents. This estimate is conservative, as 92 percent of this population lives alone (see Table 1-16). 158
�F
While 90,000 residents are disabled and lacking resources, and therefore considered at risk of institutionalization, this does not mean that all such households would necessarily move to a nursing home if the Section 202 project did not exist. Nursing homes are used only as a last resort, when all other options have been exhausted. However, if the 90,000 tenants who are at-risk of nursing home placement were actually institutionalized, they
158 Using data from the 1994 National Long Term Care Survey, White-Means and Rubin (2004) report that blacks have a 25 percent higher probability than whites in using formal home health care. They note that this difference is fully explained by racial differences in chronic conditions and socioeconomic status. See: White-Means, Shelley I. and Rose M. Rubin (2004) “Is There Equity in the Home Health Care Market? Understanding Racial Patterns in the Use of Formal Home Health Care,” Journal of Gerontology 59B, 4: S220-S229. See also: Robert, Stephanie A. and Erin Ruel (2006) “Racial Segregation and Health Disparities Between Black and White Adults,” Journal of Gerontology 61B, 4: S203-S211; Kawachi, Ichiro (2000) “Income Inequality and Health,” Chapter 4 in Berkman, Lisa and Ichiro Kawachi, Social Epidemiology. Oxford: Oxford University Press.
128

would probably turn to the Medicaid program to pay the cost. 159 We turn now to the F
problem of estimating these costs. Spells in nursing homes vary. Although the majority of the U.S. nursing home population on any given day are long-term residents, there is considerable turnover among the short-stayers.
As mentioned above, in 2002, the average allowable daily cost under the Medicaid program was $136.67 per patient. This cost is directly or indirectly related to patient care, and it excludes necessary operating costs, such as property costs related to purchase of facilities, bad debts, income taxes, legal and professional fees, marketing and public relations, etc. 160 Expressed in 2004 dollars, for a patient with the average nursing home �F
length of stay of 340 days over a two year period, and with an average daily cost of $143.51, the cost of a nursing home stay was $48,793. The cost of institutionalizing the 90,000 high risk Section 202 residents would have been $4.39 billion. As noted above, both supply and reimbursement rates vary considerably by State, so this figure should be understood as an order-of-magnitude estimate. �F
161
Some of these Medicaid costs are avoided when at-risk residents receive Section 202 housing and supportive services. To estimate the potential reduction in costs, we assume a lower rate of utilization of nursing facilities based on findings from research on the Congregate Housing Services Program (CHSP). As noted above, for every recipient of CHSP services who experienced an institutional placement, 1.5 vulnerable tenants in non-CHSP buildings experienced such a placement. Provision of similar services to current Section 202 tenants would probably reduce their usage of nursing home services by a third, from an estimated 90,000 to 60,000. The Medicaid cost of institutionalizing 60,000 at-risk individuals would be $2.93 billion, a savings of $1.46 billion in 2004 dollars. However, there are offsetting costs, including costs of services provided to individuals while living outside nursing homes, and the cost of Section 202 housing assistance. The following discussion examines whether savings due to reduced institutionalization are sufficient offset these costs.
There is no single accepted definition of the term “assisted living.” We use the term as defined by Wilden and Redfoot, to describe support for activities of daily living (ADLs) and instrumental activities of daily living (IADLs). ADL assistance includes such services as bathing, dressing, toileting, transferring, and eating. IADL assistance includes such services as escort help for outside appointments, medication monitoring and cueing,
159 Each State (and the District of Columbia) has its own Medicaid program and reimbursement rates. Eligibility criteria and benefits vary by program. Estimating actual eligibility of Section 202 tenants by State is beyond the scope of this report.
160 BDO Seidman, LLP (2005) op. cit.
161 Daily average cost in 2004 for private pay patients, reported at $192, multiplied by an average length of stay of 340 days over a two year period, yields an average per person cost of $65,280. Institutional care for the at-risk Section 202 tenants would therefore cost an estimated $5.88 billion if paid for at the rate paid by private payers.
129

bill paying, and health status monitoring. Sponsors may provide 24-hour supervision and medication management. �F
162
Per-person cost comparisons for at risk individuals. The costs of utilizing the Section 202 program to help prevent institutionalization can be broken down into housing and service costs. We estimate upper- and lower-end cost estimates that allow for variation in the extent of services provided. The upper end of a cost range is estimated as (1) the cost of services, averaging $1,500 per month; 163 plus 2) the cost of housing assistance, which we �F
estimate at $768 per month, 164 times twelve, to convert to an annual basis: �F
Upper-end annual outlay = 12 ($1500 + $768) = $27,216 per at-risk person.
The upper-end, services cost estimate of $1,500 per month comes from research on provision of assisted living services in subsidized housing. It is considered adequate to pay for a reasonably full range of supportive services, and is probably much higher than actually needed or paid, because the most-used services -- meals, transportation, and housekeeping -- are relatively low cost. 165
F
The lower-end of the cost range is estimated as (1) the cost of a less intensive set of services, averaging at $400 per month; 166 plus 2) the cost of housing assistance, times �F
twelve:
162Wilden and Redfoot op. cit.
163 Costs of services are generally not reimbursed through HUD programs. HUD does make grants to pay for service coordinators, but these costs are not included in the estimates presented in this report.
164 The estimates of housing cost are from Chapter Three, and are as of December 2004. Monthly rental assistance costs are $534 for Section 202/8 and $225 for Section 202/PRACS. The monthly cost of the capital advance for Section 202/PRACS is $543, which is the estimated capital cost amortized over 30 years at six percent interest. The sum of capital advance and rental assistance cost for Section 202/PRAC is thus $768. A weighted average of costs based on the distribution of units in December 2004, reflecting 74 percent of units that are Section 202/8 and 26 percent that are Section 202/PRACS, yields a monthly housing cost of $595.
165 See: Wilden, Robert and Donald A. Redfoot (2002) Adding Assisted Living Services to Subsidized Housing: Serving Frail Older People with Low Incomes, AARP Public Policy Institute Report #2002-01. AARP: Washington DC. Cost data was collected for eleven subsidized projects that offered assisted living. Excluding the high and low values, the average reported monthly cost in 2004 dollars is $1,191. Our estimate of $1,500 reflects the higher end of services cost observed for projects included in the study. Doty op. cit. notes that most Medicaid covered nursing home residents have some personal income from Social Security, private pensions and other sources, and they contribute towards the cost of their monthly Medicaid bill. A State-by-State breakdown of the amount that tenants, Medicaid, and other sources would pay for personal services is beyond the scope of this report. See also: Kemper et al. op. cit.
130

Lower-end annual outlay = 12 ($400 + $768) = $14,016 per at-risk person.
The lower-end cost estimate of $400 per month for services is considered adequate to pay for the most frequently used personal services, principally food, transportation and housekeeping, and is slightly above the median Medicaid Optional Personal Care Services (PCS) program benefit for the elderly. This level of services is also comparable to the services reported in the evaluation of HUD’s Congregate Housing Services Program. 167
F
Of the two cost levels, and based on our review of the literature, we believe the lower-end estimate is likely to be closer to the actual costs. 168 When elderly individuals move from �F
nursing homes to affordable housing and receive supportive services, the cost of the services, while varying widely, is usually well below our upper-end cost estimate. 169
F
With regard to residents of Section 202, among the residents that we have classified as at-risk, only a quarter are 85 years or older, the age group that is most likely to need higher levels of assistance. An evaluation of the Expanded Services Program, a 1994-96 Administration on Aging demonstration, found services costs that were well below our higher-end estimate. For an array of onsite services in a 350 unit Section 236 subsidized apartment building for seniors in Asbury Park, New Jersey, the average cost of services, meals, and housekeeping for participants who were medically and financially eligible for a Medicaid-supported nursing home admission was $547 per month. The cost for the highest user of services (including meals and housekeeping) was $869. 170
�F
166 Source: Georgetown University Health Policy Institute Survey. See: Summer, Laura L. and Emily S. Ihara (2005) The Medicaid Personal Care Services Benefit: Practices in States that Offer the Optional State Plan Benefit. AARP Public Policy Institute report #2005-11. Washington DC: AARP. Data on costs of services provided to elderly recipients are provided for eight States. After excluding the high and low values, the average (modal) monthly reported cost was calculated to be $377 in 2004 dollars. 167 When adjusted for inflation using CPI, the monthly CHSP services cost equates to $399 monthly in 2004 dollars.
168 For example, the National Center for Assisted Living reports that 900,000 Americans reside in assisted living facilities. Of these, only 22 percent need help eating; 25 percent need help transferring; and 34 percent need help toileting. Ninety-one percent require help with housework and 86 percent need help managing their medications. (see: www.ncal.org/about/resident.cfm.)
Wilden, Robert and Donald A. Redfoot (2002) Adding Assisted Living Services to Subsidized Housing: Serving Frail Older People with Low Incomes, AARP Public Policy Institute Report #2002-01. AARP: Washington DC. See also the separate reports of the Nursing Home Transition Demonstration Program, cited above.
170 Crystal, Stephen, Carol H. Kurland, and Lila Rosenthal (1996) Expanded Services for Frail Elderly Tenants; Final Evaluation Report. Report prepared under contract between New Jersey Department of Community Affairs and Institute for Health, Health Care Policy, and Aging Research, Rutgers University, Award no. AoA – 90AM0749.
131
169
To compare costs of institutionalization with the above housing-based alternatives, we present estimates for three time periods: 1) 340 days, which is the average length of stay in a nursing home; 2) two years, because the typical 340 day stay in a nursing home is spread over two years; and 3) 6.28 years, the median predicted tenure for persons admitted to Section 202 housing when moving into the project at ages 75-79. 171 Table 4-�F
4 presents our estimates of cost for these three time periods.
The first column in Table 4-4 shows costs during a 340-day stay in a nursing home. Not surprisingly, the costs of institutionalization greatly exceed the costs of other options. A stay in a nursing home costs $48,793, while Section 202 housing plus the most-often provided services (food, transportation and housekeeping) costs only $13,035. Even if a fuller set of personal services is provided, comparable to assisted living, the cost of housing plus services is only $25,311, about half the cost of institutionalization.
Within two years, the nursing home cost does not change, remaining at $48,793 (because the 340 day stay is spread over two years). However, other housing costs are necessarily incurred when the individual leaves the nursing home. The average cost of housing vouchers (without supportive services) used by elderly individuals in 2004 was $441 per month, and we have added it to the cost of the nursing home in the bottom row of the table. Including housing voucher and nursing home costs, the total cost of institutionalization over two years is $54,455. In comparison, the two-year cost of Section 202 housing with assisted living services is about the same ($54,432), while the cost of Section 202 housing with a more limited set of services that includes food, transportation and housekeeping is about half as expensive ($28,032).
Finally, we compare costs over the period of time that an at-risk person typically resides in a Section 202 project. As noted above, this is 6.28 years for residents who move into the project between the ages of 75 and 79. The cost of institutionalization includes the original 340 stay, but also assumes that some additional time is spent in a nursing home. Using results on lifetime stays in nursing homes, from the 1994 National Mortality Followback Survey, we have assumed that the total duration of stays in a nursing home (including the initial 340 day stay) would be 1.2 years over the 6.28 year period. 172 The�F
total cost of institutionalization would be $89,783, which includes $62,900 for stays in a nursing home and $26,883 for a housing voucher when not residing in a nursing home. Compared with these institutionalization costs, the cost of Section 202 housing plus assisted living services is $170,916, almost twice the cost of institutionalization plus a voucher. However, the cost of housing plus food, transportation and housekeeping services is $88,020, which is about the same as the cost of institutionalization and
171 See Chapter Two, Table 2-10.
172 Spillman, Brenda and James Lubitz (2002) “New Estimates of Lifetime Nursing Home Use; Have Patterns of Use Changed?” Medical Care 40, 10: 965-975.
132

174
voucher. As noted above, we believe this lower-end estimate is closer to the actual cost. 173
�F
�Table 4-4 Comparison of Costs of Providing Section 202 Housing with Supportive Services with Costs of
Institutionalization, Per-Person for At-Risk Individuals
Based on Average Type of Assistance Over a 340 Day
Nursing Home Stay Over a Two-Year
Period Length of Stay in a Section 202 Project
Cost of Section 202 housing plus assisted $25,311 $54,432 $170,916
living personal services Cost of Section 202
housing plus costs of food, transportation and $13,035 $28,032 $88,020
housekeeping services Cost of
institutionalization, for period of nursing home $48,793 $48,793 $62,900*
stay only Cost of
institutionalization, including housing voucher when not $48,793 $54,455 $89,783*
residing in a nursing home
* Assumes 1.2 years of stay in a nursing home over a 6.28 year period. Note: All costs expressed in 2004 dollars.
The above estimates are very sensitive to the assumption on likely future use of nursing homes. If the alternative to provision of housing plus supportive services is to permanently live in a nursing home, then for the entire 6.28 years that a person would have stayed in Section 202 housing, the total cost of institutionalization would be $329,179. This amount is nearly twice as expensive as the cost of providing Section 202 housing with assisted living services, and is almost four times the cost of providing Section 202 housing with less intensive services. �F
174
Of course, other factors related to how care is organized and delivered can influence costs. For example, Weissert et al. (2001) note: “Care planning appears to be hampered by so-called targeting: selecting patients for home care but giving little guidance regarding how much care they should receive. Supervision and program performance could be enhanced if care were titrated to specific risks faced by a given patient, his or her potential to benefit, and the value of those benefits. Additional skills, especially physicians’ diagnostic skills, could be better deployed into the home care setting, and funds could be freed up from low-risk patients to support physician involvement in the care of high-risk patients. Finally, research into the relationship between doses of home care and outcomes would be strongly encouraged by the payment method proposed here, and home care could become a venue for improving outcomes and reducing costs
“ rather than a problem for policymakers.” (See: Weissert, William et al Beyond Managed Long
133

Based on the cost estimates presented in Table 4-4, we conclude that managers of Section 202 projects should place more emphasis on admitting and retaining frail elderly persons, with particular attention to deinstitutionalizing elders who can live in the community with lower levels of assistance. Managers should work with Medicaid agencies and nursing home owners to assist current residents who are able to live in a community setting, to make transitions from nursing homes to Section 202 housing with supportive services.
Aggregate cost comparisons for the entire Section 202 population. The previous section provides estimates of per-person costs for at-risk individuals. This section provides estimates of aggregate costs for the entire Section 202 population. The cost of Section 202 housing, when based on the entire inventory (not just newly built units, as presented previously), is $595 per month in 2004 dollars. 175 The average nursing home stay is F
assumed to be 340 days over a two-year period. We present housing and service costs only over a two-year period. 176 All other assumptions are the same as presented above. �F
As previously noted, the cost of institutionalizing 90,000 persons at $48,793 per person is $4.39 billion. Over a two-year period, these persons also incur housing costs for the time that they are not residing in a nursing home. Including these costs, the total cost of institutionalization is $4.9 billion.
For the entire Section 202 program, including 278,000 residents of existing properties, we calculate the housing costs for all residents, but we assume that supportive services are provided only to the 90,000 persons at high risk of institutionalization. Over two years, the cost of providing Section 202 housing plus a full range of assisted living services for residents of Section 202 is $7.21 billion. However, supportive services do not necessarily need to be as extensive as those typically provided in assisted living facilities in order to effectively reduce institutionalization. With a less intensive level of supportive services, the cost of providing Section 202 housing with services is $4.83 billion. That is, over two years, the lower-end Section 202 cost is roughly equivalent to the cost of institutionalization.
This scenario assumes no targeting of the program to high risk or already institutionalized elders. Currently, an estimated two-thirds of Section 202 residents are not at risk of institutionalization. The costs discussed in the preceding paragraph are for all 202
Term Care: Paying For Home Care Based On Risk Of Adverse Outcomes” Health Affairs 20, 3 2001: 172-9. at http://content.healthaffairs.org/cgi/reprint/20/3/172)
175 A weighted average of costs based on the distribution of units in December 2004, reflecting 74 percent of units that are Section 202/8 and 26 percent that are Section 202/PRACS, yields a monthly housing cost of $595. The cost of a housing voucher used by elderly individuals in 2004 was $441 monthly.
176 Creating a cost model that takes into account aging of the population and associated risks of institutionalization was considered outside the scope of this study.
134

residents, with associated benefits (good housing, safe neighborhoods, and improved quality of life) documented in Chapter Two. We conclude that, even without targeting, the savings associated with reduced institutionalization of frail elderly in the program are almost enough to pay for the entire cost of providing Section 202 housing.
As noted above, Medicaid reimbursement rates vary considerably by State. Research based on Medicaid administrative data would be needed in order to arrive at more precise cost comparisons. Better identification of the types of supportive services needed and actually utilized by residents of Section 202 projects is needed, and also information on how the need for services changes over time, as Section 202 residents age in place.
Conclusions and Recommendations
The GAO notes that, without fundamental changes in long-term health care financing, Medicaid can be expected to remain one of the largest sources of funding for these services. By 2050, these costs may be as high as $132 billion. 177
�F
In 1992, Mollica and colleagues estimated that assisted-living costs were 20 to 50 percent less than nursing homes. 178 Other authors and advocates have suggested that assisted-F
living care costs about 35 percent less than nursing home care for the same individuals. Tennstedt et al. (1996: 86) note that even when the cost of food and shelter is included in estimating the cost of home-based care, it is “still far less expensive” than institutionalization. 179 As noted above, the experience of Arkansas was that the cost of�F
community-based services plus subsidized housing was 39 percent of the cost of caring for the same individuals in nursing homes. 180 Our own estimate is that when Section 202 �F
housing is provided along with supportive services consisting primarily of meals, transportation and housekeeping, the cost of housing and Medicaid-paid services provided to at-risk individuals is about half as expensive as institutionalization over a two-year period. Over the expected length of stay (6.28 years) for an at-risk individual in a Section 202 housing project, the cost of housing and Medicaid-paid services provided to at-risk individuals costs no more than institutionalization. Even when the entire Section 202 population is taken into account (an estimated two-thirds of whom are not currently at-risk of institutionalization), the cost of housing and Medicaid-paid services provided over a two-year period was roughly equivalent to the cost of institutionalization, while significantly improving the quality of life for all Section 202 residents.
177 GAO (2005) op.cit.
178 Nyman op. cit.
179 Tennstedt, Sharon et al. (1996) “Informal Care vs. Formal Services: Changes in the Patterns of Care Over Time,” Journal of Aging and Social Policy 7, ¾: 71-91. See also: Skellie, F. Albert et al. (1982) “Cost-Effectiveness of Community-Based Long-Term Care: Current Findings of Georgia’s Alternative Health Services Project,” American Journal of Public Health 72, 4: 353358.
180 See the discussion of the Nursing Home Transition Demonstration Program.
135

The Section 202 program clearly provides the type of affordable housing needed by very low-income elderly who are either at risk of institutionalization or could be deinstitutionalized if proper supports were available. HUD could make significant contributions to savings in Medicaid program costs by taking the following actions:
• As noted in Chapter Two, future awards of Section 202/PRAC funding should be provided through projects that are large enough to effectively provide for supportive services and meet the needs of frail elderly. Metropolitan areas where longer waiting lists elevate applicants' risks of institutionalization should be targeted for more intensive funding. Outside of metropolitan areas, properties should be developed in communities that already provide a range of healthcare services to surrounding rural populations, where coordination of services is more feasible.
• HUD could provide funding for service coordinators within all Section 202 properties. Their duties should include establishing ties to the community agencies at the local level that can provide client referrals to their project as well as promoting a policy that values retaining tenants as long as possible. 181
�F
• For existing Section 202 properties, it is essential to improve the availability of supportive services in Section 202 projects. At the Federal level, this means improving coordination between HUD and the Department of Health and Human Services (HHS), as well as with State Medicaid agencies.
• HUD Field Office staff should monitor the coordination and delivery of supportive services to Section 202 properties, and should help to disseminate information on successful approaches, for the benefit of other projects in the same Field jurisdiction as well as nationally.
• HUD should develop new occupancy procedures to assure that owners and managing agents of Section 202 properties are effectively marketing their properties to persons who could be deinstitutionalized, or who are clearly frail and need supportive services to avert institutionalization. HUD’s regulations establishing occupancy policy should be revised to create a priority for admission of persons with such needs.
• Owners and managers of Section 202 properties could be encouraged to conduct active outreach to nursing homes in their community and applicants for Medicaid-funding nursing home placement. HUD should resist any suggestion by owners or managers of Section 202 properties that, when persons become frail, they should be asked to leave. Quite the contrary, Section 202 properties should be
181 The Fiscal Year 2009 Annual Performance Plan (APP) states that the number of households served by a service coordinator should be maintained at the FY 2008 level. Reaching this goal is contingent upon receiving sufficient appropriations to extend all existing service coordinator grants.
136

taking affirmative steps necessary for such persons to remain and avoid institutionalization unless there are medical reasons that make such a step necessary.
• HUD should make training available to project managers and service coordinators, perhaps through the use of webcasts, to disseminate ideas on ways to coordinate service delivery and best meet the needs of frail elderly residents.
• HUD could consider the development of a similar set of efforts for other assisted properties that provide housing to elderly persons, including Section 8, public housing, and properties developed under the Low-Income Housing Tax Credit program. While these other programs do not share the legislative history and statutory mandate regarding supportive services, these programs also have a significant potential to help elderly persons avoid institutionalization, helping to lengthen and improve the quality of their lives.
137

Chapter Five: Measuring Performance in the Section 202 Program
BOverview
This chapter proposes performance measures for the Section 202 Program. Performance is examined in terms of outputs, outcomes and efficiency measures. Specific measures are proposed within each of these categories, and research is proposed to help advance performance measurement for this program.
The Government Performance and Results Act (GPRA) guides agencies in preparing strategic plans, performance plans, and performance reports that set goals and report on achieving them. The Office of Management and Budget’s Program Assessment Rating Tool (PART) assesses program performance against its goals. 182 The PART reinforces the outcome-oriented performance measurement framework developed under GPRA and builds on GPRA by encouraging agencies to integrate operational decisions with strategic and performance planning. All Federal programs are subject to an evaluation through the PART process. This chapter reviews the performance measures currently applicable for the Section 202 program and proposes new measures that take into account the findings and recommendations included in this report.
The Office of Management and Budget (OMB) identifies three types of performance measures: outcome, output, and efficiency.
• An outcome refers to the events or conditions of direct importance to the public/beneficiary that are external to the program. An outcome answers the question “What is the program’s goal or purpose?” For example, the goal of a job-training program is to give someone the skills to find a job, as opposed to giving out a grant. An outcome measure may be the number and percent of people employed within six months of completing the job-training program.
• An output refers to the internal activities of a program (e.g., the products or services delivered). The output answers the question “What does the program do to achieve its goal or purpose?” For example, a job-training program may provide a class to teach someone the skills necessary to find a job. An output measure may be the number of people who complete a job-training program.
• A measure of efficiency captures a program’s ability to implement its activities and achieve results (an outcome or output), relative to resources (an input such as cost and/or time). The best kind of efficiency measure addresses the cost of achieving a unit of outcome. Efficiency measures must be useful, relevant to program purpose, and help improve program performance.
182 See: www.whitehouse.gov/omb/expectmore/part.html
138

Together, outcome, output, and efficiency measures should tell a comprehensive story of program performance (see Appendix B). 183
�F
BOutput Measures for the Section 202 Program
BQuantity of Housing. A very basic output measure for the Section 202 program would be simply the number of housing units produced each year. The number of Section 202 housing units actually produced is dependent on Congressional appropriations, a factor that is not under HUD’s control. Historically, this program received funding allocations sufficient for more than 15,000 units annually in the late 1970s, and was still receiving allocations of 10,000 or more units annually through 1987. Funding fluctuated between 5,000 and 10,000 units during the following ten-year period, but has been less than 5,000 units per year since that time. 184
F
In 2008, the first members of the “Baby Boomer” generation turn 62. The GAO and many scholars have noted that the effective time during which new public policy can be formulated to address the needs of this generation is rapidly diminishing. As noted in Chapter Four, the number of senior households headed by those 85 or older is expected to increase by approximately 88 percent between 2005 and 2030. Their increased numbers imply substantial growth in specific social demands and support networks that will need to be planned and developed over the coming years. 185
F
In 2005, approximately 1.29 million elderly households (age 62+) experienced severe housing problems. 186 Between 1999 and 2020, the number of very-low income elderly F
renters with severe housing problems is expected to increase by 435,000 (33 percent). 187 �F
The annual allocations made under the Section 202 program have been so small that they will only modestly reduce these needs. However, the Section 202 program provides assistance to an older and more frail population than reflected in the overall needs estimates, and, as already noted in this report, targeting of this program could be further improved.
183 Ibid.
184 Commission on Affordable Housing and Health Facility Needs for Seniors in the 21st Century (2002), “A Quiet Crisis in America,” Exhibit 15.
185 Blake, Kevin and Simic, Aleksandra (2005), “Elderly Housing Consumption: Historical Patterns and Projected Trends. Available at http://www.huduser.org.
186 Fiscal Year 2009 Annual Performance Plan. See also: HUD, Office of Policy Development and Research (2006), “Affordable Housing Needs: A Report to Congress on the Significant Need for Housing”.
187 Golant, Stephen, “Housing Problems of the Future Elderly”, Table 8, as cited in Commission on Affordable Housing and Health Facility Needs for Seniors in the 21st Century (2002).
139

A reasonable output measure for the Section 202 program would be to produce 10,000 units per year over the next ten to fifteen year period. With appropriately located properties, that are large enough to provide for community space, meal preparation and service coordination, the Section 202 program should be able to reduce unnecessary institutionalizations. Research is needed to establish the minimum number of units in a building needed to assure reasonable costs per person for supportive services.
As noted above, results from HUD’s Real Estate Management System (REMS) show that, as of 2008, 32 percent of Section 202 projects have service coordinators on-staff. This is approximately the same result we saw in the 1999 survey of Section 202 properties. The 1999 survey also found that managers of Section 202 housing overwhelmingly reported positive experiences with service coordinators (see Chapter Two). While service coordinators were present in many cases, and while space in the buildings for services was quite often available, only about one-quarter of properties (27.6 percent) provided “some congregate services” (defined as meals or housekeeping), as of the 1999 survey. The percentage was even lower (18.7 percent) for properties developed under the most recent Section 202/PRAC stage of the program. 188
�F
HUD’s FY 2009 Annual Performance Plan (APP) includes a performance measure regarding presence of service coordinators for all HUD multifamily assisted housing, including Section 202. This measure indicates that the number of elderly households living in private assisted housing developments for the elderly, where a service coordinator is present, should be maintained at the FY 2008 level. At a minimum, a separate measure should be established for the Section 202 program. In addition, though, the measure should be based on the number of properties that either have service coordinators or provide supportive services.
Beyond that, HUD should establish a clear goal for presence of service coordinators in existing Section 202 projects. This would entail a new monitoring effort, to accurately measure the presence of service coordinators. A comprehensive survey of all HUD-assisted, multifamily housing designed for elderly and people with disabilities could be used to determine how many have service coordinators and the method of funding used to pay for service coordinator programs, as well as how many provide supportive services.
Making service coordinators available in all Section 202 projects would require additional funding from Congress, as funding for the service coordinator contracts (including renewals) is taken out of the program’s total allocation and reduces money available for development. Ultimately, making a service coordinator available within all Section 202 properties would help assure that Section 202 housing is well suited to the needs of frail elderly.
Heumann Leonard et al. (2001) “The 1999 National Survey of Section 202 Elderly Housing”. pgs. 49-52.
140
188

BOutcome Measures on Quality of Housing and Services
Physical condition. As documented in Chapter Two, the Section 202 program produces good quality housing that has remained in good condition over time. The Real Estate Assessment Center (REAC) conducts physical inspections of all of Section 202 housing, producing well documented assessments of conditions. In addition, there is already a performance measure in HUD’s FY 2009 Annual Performance Plan (APP) that applies to all HUD multifamily assisted housing (see Appendix C). This measure could be recast to apply specifically to the Section 202 program.
HUD should provide necessary funding and assure ongoing assessment of the physical conditions of Section 202 properties. Residents' overall ratings of their units' in response to mailed surveys have been found to be highly consistent with assessments by on-site inspectors. 189 Using their ratings would be a low cost alternative to sending professional ��F
inspectors.
Resident satisfaction. Available evidence from the 1999 assessment of Section 202 suggests that residents of Section 202 properties are satisfied with their housing unit and general living conditions. 190 The REAC resident assessment survey also is a source of �F
information on resident satisfaction with Section 202 housing. As is the case for physical inspections, there is already a performance measure in HUD’s FY 2009 APP that applies to all HUD multifamily assisted housing. This measure should be redefined to apply specifically to Section 202.
The REAC system does not now provide enough information on resident satisfaction within Section 202 properties to allow for ongoing assessment of resident satisfaction. Sampling of 202 residents could be increased to meet that need.
BFair Access. Available data on Section 202 indicates that the program performs well in providing fair access to very low-income elderly households. Demographic and income data for the program show that the program provides housing in central cities, suburbs, and rural areas, making it possible for persons with very little income to have a decent home and a suitable living environment.
The participation of non-profit sponsors, including faith-based groups, seems to make it possible to reach groups that are less likely to apply for assistance under other programs of the Department. Even though all of these programs are predominantly assisting women living alone with incomes between $5,000 and $15,000, Section 202 residents are far less likely to be minorities (26 percent) than elders in public housing (54 percent) or
See the summary of this research at: http://www.huduser.org/publications/pubasst/quality.html
190 Heumann op. cit.
141
189

with vouchers (45 percent). Section 202 residents appear more likely to have been in the labor force when they were younger or part of a household with a worker, than are voucher holders.
To the extent that fair access can be improved for the Section 202 program, it has to do with addressing the urgent need for services, plus attracting and retaining more residents who are at risk for institutionalization. An appropriate performance measure would be to increase the percentage that are frail or would benefit from provision of supportive services.
BAs noted in Chapter Two, participant data for the program indicate that there has already been a long-range trend in this direction. Average age of residents has increased from 72 years in 1983, to 73.6 years in 1988, to 75 years in 1999, and 76.2 years in 1994. In the oldest projects, the average age was 78.2 years in 1999, and 39 percent of the residents were over age 80. In 1999, managers reported that they considered 22.3 percent of residents in their project to be frail, a considerable increase from the 13 percent reported frail in 1988. As tenants age in place and the elderly population shifts nationally toward the very old, this percentage is expected to rise.
The unique mission of the Section 202 program can best be served by assuring that the needs of frail elderly who require less support than skilled nursing care are adequately addressed. For new projects, this can be accomplished by using the NOFA process to select projects and sponsors that provide priority to the needs of frail applicants. For existing projects, this can be accomplished by requiring project owners and managers to place increased priority on attracting and retaining frail elderly persons who are capable of independent living. Certain responsibilities on the part of the managers and HUD go with the change in program direction. For example, managers could encourage sponsors to establish procedures for transfers to and from hospitals and nursing homes as well as increase the range of services available to residents as they age in place.
Program effectiveness could be enhanced by establishing a goal that the percentage of newly admitted persons that are at-risk for institutionalization in Section 202 developments will increase over time. In order to do this, a methodology that uniformly measures frailty needs to be developed. Until such a methodology has been adopted, HUD could consider modifying existing data collection procedures to track the number of new admissions entering directly from institutions or approved by Medicaid for admission to nursing homes.
BEfficiency Measures: Time and Cost
Reducing development processing time. Congress needs to have confidence that appropriated funds will be used in a timely fashion. Nonetheless, developing multifamily housing for the elderly through nonprofit organizations does necessarily take time when sponsors are required to find additonal sources of funding. HUD has successfully cleared a backlog of pending projects, and has reduced the average time needed for development
142

processing in the past few fiscal years, but further steps can be taken to reduce the time needed for development.
The Department has emphasized the importance of the 18-month processing guideline in its Fiscal Year 2009 Annual Performance Plan. It states that “at least 70 percent of projects that are initially closed in FY 2009 will have completed the process within 24 months; and, of these, 25 percent will have completed the process within 18 months…The FY 2009 target has been established on the premise that beginning in FY 2008 and by the end of FY 2010, the number of projects closed within 24 months will be at least 80 percent and the number closed within 18 months will be at least 35 percent (p. 59)”
Section 202 development delays may be further reduced by:
• correcting the method for determining development cost limits, • improving training of HUD staff to process 202 development funding, • refocusing the program on development of a lesser number of projects, developed
in fewer communities, and with larger average project size, and • streamlining and automating paper-based and signature approved work flows of
business processes.
Program Costs. As noted in Chapter Three, the costs incurred in the Section 202 program have been found to be reasonable, in relation to costs of other Federal housing development programs, and in relation to industry standards. There is little evidence that further cost containment, beyond the current program procedures, is needed for Section 202. More needs to be learned about the minimum size of buildings that can economically support cost-effective provision of congregate meals and other supportive services. Once we have adequate knowledge of these, some reasonable cost containment measures may be possible.
There is already a capacity in the Development Application Processing (DAP) system to receive and maintain information on development costs. HUD could place a higher priority on assuring completeness and accuracy of this information and using this information in a systematic way to help contain program costs. Program effectiveness would be enhanced by making data integrity of this part of DAP a high priority and use this data for regular monitoring of per-unit development costs. HUD could produce regular automated reports that identify the cost of completed projects and provide meaningful comparisons to reasonable cost standards. Business intelligence software integrated into the DAP and REMS systems could accomplish this at relatively low cost.
Program Efficiency. HUD has long acknowledged that elderly persons need a wide range of housing choices. Supportive services that will ensure maximum independence and dignity will be required by many, especially those older than eighty years. The Section 202 program was among the first programs to incorporate physical infrastructure, such as
143

space for supportive services and common dining, to enable the delivery of on-site services. A proper measure of efficiency for the Section 202 program should capture the program’s ability to implement all of its activities, not just the provision of housing, and achieve desired results (i.e. outcomes associated with the provision of housing and services), relative to the sum of all governmental costs needed to address the needs of program participants. The costs are a combination of housing costs, services costs, and institutionalization costs. They are borne by HUD, HHS, and the States through their participation in the Medicaid program. By far the largest share of prospective cost savings as a result of reduced institutionalization would be achieved within the Medicaid program.
As noted above, the Arkansas experience with the Nursing Home Transition Demonstration Program was that costs for community living were only 39 percent of the Medicaid costs for the same consumers in their last three months in a nursing home. With appropriate modifications, many Section 202 properties could achieve similar savings.
Chapter Four provided estimates of the cost of Section 202 housing with supportive services and compares these to the cost of institutionalization, assuming a scenario of targeting of benefits based on income and aging in place. Our overall conclusion is that the cost of housing and Medicaid-paid services provided to at-risk individuals is no greater than the cost of institutionalization. Even with an assumption that an estimated two-thirds of the entire Section 202 population is not at-risk of institutionalization (which is likely at present to be the case), the cost of providing housing and Medicaid-paid services over a two-year period is roughly equivalent to the cost of institutionalization. However, we recognize that these are order-of-magnitude estimates. A robust performance measure that uses HUD and State Medicaid administrative data to track efficiency will require completion of the type of research outlined in the next section.
Recommendations for further research. The Section 202 program can be modified to accommodate elders who can be deinstitutionalized and target very low-income elders who are likely to be institutionalized. With cooperation from HHS and State Medicaid agencies, we believe it would be possible to use a matched-pair control group methodology to greatly increase our knowledge of the role of Section 202 in reducing institutionalization and achieving Medicaid cost savings. The following is an outline for a research project that would provide a measure of efficiency for the Section 202 program as it is today, using the methods developed by Metraux et al.(2001) and the discussion of PART at OMB’s website for guidance. 191 The purpose of the research would be to�F
estimate the differences in cost between placement in a Section 202 facility and nursing home for frail elders, using a matched-pair control group.
191 Metraux, Stephen, Steven C. Marcus, and Dennis P. Culhane (2003) “The New York-New York Housing Initiative and Use of Public Shelters by Persons With Severe Mental Illness,” Psychiatric Services 54:67-71. See: http://ps.psychiatryonline.org/cgi/content/full/54/1/67.
144

A sample of at-risk Section 202 residents would be matched to a sample of Medicaid-funded nursing home patients who are capable of living in a supportive environment outside an institution, using the following criteria:
• Demographics: race, gender, age, and income; • Sources of informal social support: marital status, number and proximity of adult
children and grandchildren; • Geography: area cost of living and urbanity; and • Health: number and type of deficits in performing ADLs and IADLs.
The analysis of the data would include:
• Descriptive statistics on the costs of services consumed, separating housing from personal services;
• Descriptive statistics on changes in costs of housing and services consumed over at least a two-year period; and
• Using a generalized estimating equations (GEE) methodology, estimation of the effect of placement in a Section 202 facility on the reduction in cost, measured in cost per day of consumption of services.
This project would need to be done as a joint effort with the Department of Health and Human Services (HHS). The first stage would be a pilot study that assesses the feasibility of the research and produces a reasonable preliminary estimate of costs. Prior to data collection, it will be necessary to develop a methodology for assessing Section 202 residents’ level of frailty that is comparable to assessments of nursing home patients found in Medicaid records.
In addition to the above-described research effort, program effectiveness would benefit from an upgrade of monitoring procedures that capture key indicators, including:
• extent of frailty among Section 202 project residents; • need for personal services and actual use of services; • presence of service coordinators and their level of effort; • project vacancy rates; and • number of new admissions entering directly from institutions or approved
by Medicaid for admission to nursing homes.
Surveys of project managers and project residents would be a useful complement to the physical assessments of property condition that are performed by on-site inspectors for the Real Estate Assessment Center (REAC). This report has relied heavily such indicators. The authors of the 1999 National Survey of Section 202 Elderly Housing have provided a valuable service by continuing a survey process that was undertaken by AARP in 1983 and 1988. HUD should begin a series of such surveys to assure that collection of this type of information is continued, describing Section 202 housing and the people who reside there, documenting the effects of legislative and regulatory changes, and identifying areas where further change may be needed.
145

Conclusion
The Section 202 program produces good quality housing that is rated highly by its residents. They are predominantly elderly women living alone with incomes between $5,000 and $15,000. Currently, demand for Section 202 housing far exceeds supply.
Recently completed research has shown that program costs are reasonable in relation to costs of other development programs as well as industry norms. However, in recent years, the historically low level of Section 202 annual appropriations provided by Congress, in combination with HUD practices regarding allocation of funds, has resulted in development of multiple, small projects – often proposed and developed by relatively inexperienced, small sponsors – that have reduced program efficiency and significantly contributed to project processing delays.
As States respond to the aging of their populations, they will find it necessary to create comprehensive long-term care systems that will enable very low-income elders to live in the community, instead of relying on institutions. Plus, an estimated 20 percent of nursing home residents could be deinstitutionalized immediately if appropriate community supports were available. If this is to be accomplished, the problem of low availability of affordable, accessible housing with supportive services will have to be addressed. Results from decades of research suggest the potential of the Section 202 program to reduce Medicaid expenditures while providing a humane alternative to institutionalization.
Program efficiency could be increased if the Section 202 program were to provide more assistance to persons who are either at risk of institutionalization or already institutionalized. Section 202 program rules could be altered to permit construction of buildings that are large enough to permit greater cost effectiveness in delivery of needed services. In this study, we provide estimates of the cost savings that are achieved under the program as it exists today and point to even greater savings that would accrue with program reforms. Further research is needed to estimate with greater precision the level of savings that can be expected now and in the future.
146

APPENDIX A
NAHB Research Center Findings
Shortly after the Government Accountability Office (2003) finished Elderly Housing: Project Funding and Other Factors Delay Assistance to Needy Households (GAO-03-512. Available at: www.gao.gov), HUD commissioned the NAHB Research Center study (referenced above). Major objectives of this research were to:
• Evaluate actual Section 202 and 811 construction and development costs with major industry construction cost indices.
• Analyze cost accounting and processing procedures to obtain the information needed to estimate costs on a per-unit, square footage, and elevator/non-elevator basis, with adjustments for local cost variations and accessibility costs.
• Determine accuracy of past indices used to adjust program costs limits, and determine if another cost index or locational approach would better match actual local cost variations.
• Determine if any revisions in current program cost limit relationships are needed.
• Identify the most appropriate construction cost index approach for use in annual updates of program cost limit, and recommend a cost model approach for estimating costs for future Section 202 and 811 projects. 192
�F
A database was created that included Section 202/811 development cost data and different available cost indices used to measure changes in costs, which included the Urban Consumer Price Index (CPI-U), currently used to update HUD Section 202/811 cost limits. The other cost indices entered into the database were the National Association of Homebuilders’ Economic Council Index (BEC), the R.S. Means Residential Construction Cost Index, the Craftsman National Construction Cost Estimator, and the Marshall and Swift Residential Cost Handbook. All but the CPI-U provided information on material and labor costs for different types of construction.
The HUD Section 202/811 High Cost Percentage (HCP) factors were also entered into the database. These are used to adjust statutory total development cost limits for higher local costs. The normal and HCP HUD cost limits include all construction costs, including land, and are therefore not directly comparable with construction cost indices that do not consider land. Use of a valid measure of construction costs, however, permits comparisons of project costs from area to area and with industry cost standards.
This NAHB Research Center report presents a detailed analysis of Section 202 and Section 811 program costs, comparative private market costs, and relationships between
192 National Association of Homebuilders Research Center, Inc. and Columbia enterprises, Inc. Construction Cost Indices: HUD Section 202 and 811 Supportive Housing Programs, March 2005. Available at www.HUDUSER.org
147

program costs, private market cost data, and HUD cost limits. Of the alternatives examined, the R.S. Means Index, which is heavily relied upon for costing in the private sector and provides detailed locality cost adjustments, was found to have the best fit with actual program costs. A cost model was derived using actual program costs and the R.S. Means Index. 193
�F
The current method of establishing Section 202 development cost limits is to calculate the cost limit for any given project as the total number of units multiplied by the respective structure type/number of bedrooms limit, multiplied by the area high cost percentage (if relevant). This figure is intended to cover all development costs, including land. However, this study found that neither the factors nor the fundamental approach accurately reflect current actual development costs for the projects studied or, for that matter, typical privately funded construction.
Of the cost indexing approaches tested, the R.S. Means Index (Means) data had the highest correlation with HUD High Cost Percentage (HCP) adjustments and with actual construction costs. This index has been extensively used and relied on in the private sector for decades. Use of this index resulted in a measurably better statistical match with actual HUD program costs than the national Consumer Price Index-Urban (all items) approach currently used by HUD to update its construction cost and High Cost Percentage factors.
The NAHB Research Center report found that actual average costs for Section 202/811 projects were generally below R.S. Means estimated per square foot costs. The observed cost relationships imply that the average 202/811 project is of relatively modest construction. Further, the maximum, HUD-allowed Section 202 costs per unit were, on average, approximately equal to R.S. Means estimated Total Construction and Development Costs, exclusive of land. Significant exceptions to this pattern were found in only three offices.
The study noted that there are large variations in actual project costs within and between offices, and significant differences exist even after cost normalization, as well as large variations in total square footage per unit. These were most apparent between different HUD Multifamily Processing Center (HUB) Offices, which are influential in defining what constitutes an acceptable project. For example, the average Honolulu Section 202 project studied had 38 percent more square footage per dwelling unit than the average for the second highest city, and 83 percent more than projects in San Antonio. The average Columbus, Ohio, Section 811 project had more than twice the square footage of the average Chicago project. The additional square footage may provide desired amenities and services, but the range of variation found appears high and suggests application of different local HUD policies.
193 Land costs were not included in the analysis or in the Cost Model. Land was found to have been donated for nearly all projects. About 75% of the projects had a land value equal to or less than 15% of the Development Cost. In areas where land prices are highly variable and locational specific, as is the case in most large metropolitan areas, there is no reasonable way to model land costs in a manner that accurately reflects the potential variations likely to occur.
148

The study noted that current HUD cost limits and High Cost Percentages force many projects to seek supplemental sources of funding before and after initial approval of the project. There were many cases where it was reported that the need to seek additional funding significantly lengthened the total development time frame. These findings confirmed the conclusions made by the GAO in their May 2003 study.
Recommended cost model for development cost limits. One of the objectives of the NAHB effort was to evaluate HUD’s current cost estimation system and, if appropriate, recommend an alternative approach. NAHB suggested that although program costs were found to be generally reasonable, use of High Cost Percentage (HCP) factors does not provide equivalent cost constraints in different parts of the country. Cost modeling should reflect industry standards to the extent possible, and not be subject to variations that make the program more attractive to developers in some regions than in others. A more reliable cost estimating and review process would assist in identifying high costs projects earlier and facilitate changing the design, or obtaining agreement on the need for higher costs earlier in the approval process.
Accordingly, the research project provided a spreadsheet-based Cost Model, in which the user enters the type of project, construction start date, bedroom mix, and elevator/non-elevator characteristics and the model calculates a cost estimate based on HUD guidelines for apartment rental square footage for different bedroom sizes. The model appears to provide an improved means to equitably administer HUD’s current average approved cost levels.
149

197
APPENDIX B
Performance Measurement
Outcome, output, and efficiency measures should tell a comprehensive story of program performance. Theorizing public management in this way is useful, because it provides a basis for evaluating the logic of program design and predicting the program’s effectiveness. Generation of testable models showing the relationship between public policies, organizational changes, and public service improvement is another useful outcome. 194
F
However, performance measurement may not be sufficient to drive actual improvements in decision-making by public organizations. The rational and technocratic process of policy adoption often founders in practice because of limited staff expertise in performance measurement as well as political and cultural factors within organizations and their stakeholders. In addition, performance improvements may not be sufficient to justify the resources consumed by internal processes and regulatory requirements. 195, 196,
F
�F
Extended periods of monitoring and evaluation should follow the launch of any new performance measure. Performance measures should be expected to evolve according to a dynamic of trial-and-error, due to the distinct risk that the measures themselves may elicit unanticipated outcomes. One source of such outcomes is a program’s managers and workers, who can use their expert knowledge of programs to manipulate performance outcomes. This is possible because they rapidly acquire a superior understanding of the levers available to manipulate results, which can only be discovered by the designers of the performance measures after a measure is in place. In addition, wasteful and destructive policies may result when performance measures are poorly aligned with the objectives of an organization. Moreover, such costs do not include the cost of the resources that must be committed to the implementation, monitoring, and modification of the performance measures themselves. 198
�F
194 Boyne, George (2000) “External Regulation and Best Value in Local Government,” Public Money & Management. July – September: 7-12.
195 Boyne, George et al. (2004) “Explicit reforms, Implicit Theories, and Public Service Improvement,” Public Money & Management. June, 6, 2: 189-210.
196 Julnes, P.D.L. and M. Holzer (2001) “Promoting the Utilization of Performance Measures in Public Organizations: An Empirical Study of Factors Affecting Adoption and Implementation,” Public Administration Review 61, 6: 693-708.
197 Boyne, George et al. (2002) “Plans, Performance Information and Accountability: The Case of Best Value,” Public Administration Winter, 80, 4: 691.
198 Courty, Pascal and Gerald Marschke (2003) Making Government Accountable: Lesson from a Federal Job Training Program. CMPO Working Paper Series No. 03/083. Available at: http://www.bris.ac.uk/Depts/CMPO/workingpapers/wp83.pdf
150

GPRA is based on the assumption that performance measures enhance public accountability and lead to improvements in service. Public organizations that develop and rely on performance measures face the challenges of devising strategies to: a) promote utilization of performance measures; b) sustain performance measurement systems; and c) involve citizens in the measurement efforts. The following types of activities are important for meeting these challenges:
• Provide training on how to effectively implement performance measures;
• Help organizations to develop strategies to promote and sustain appropriate citizen participation;
• Conduct targeted dissemination of knowledge about the value of performance measures and the necessary long-term commitment of stakeholders;
• Continue improvement in how to develop performance measurement systems, including defining goals and strategies for achieving goals, identifying appropriate indicators and collecting appropriate data for analysis;
• Provide assistance in identifying internal and external stakeholders; and
• Devise strategies for developing a culture that supports performance improvement and results. 199
��F
199 De Lancer Julnes, Patria (2000) “Evolution of Government Reform: The Center for Accountability and Performance (CAP) and Support of Managing for Results,” Paper prepared for V International Congress of CLAD on State and Public Administration Reform.
151

APPENDIX C
Fiscal Year 2009 Annual Performance Plan
The Fiscal Year 2009 Annual Performance Plan (APP) states:
B.9: The share of assisted and insured privately owned multifamily properties that meet HUD-established physical standards are maintained at no less than 95 percent.
This performance goal builds on recent successes and exceeds the benchmark established in the President’s Management Agenda, setting a goal that at least 95 percent of assisted multifamily properties will continue to meet HUD’s standards for physical condition in FY 2009. This is a very high performance rate and reflects the important outcome goal of providing healthy, quality, and safe housing for HUD’s multifamily inventory. The data source is the Real Estate Assessment Center’s Physical Assessment Subsystem which contains electronically coded and transmitted results of physical inspections of units, buildings, and sites, and is stored in the National Inspection Contract – Central Integrated Data Repository. The Physical Assessment Subsystem is a component of the overall Public Housing Assessment System, and is used separately for private multifamily housing.
152