section 2.1 basics of functions and their graphs - …parkkyu6/mth103/mth103chapter2.pdfsection 2.1...
TRANSCRIPT
1
Section 2.1 Basics of Functions and Their Graphs *Relations A relation is any set of ordered pairs. The set of all first components of the ordered pairs is called the domain of the relation and the set of all second components is called the range of the relation. Example 1) Find the domain and the range of the relation:
{(sitting, 80), (walking, 325), (aerobics, 505), (tennis, 505), (running, 720)} *Functions A function is a correspondence from a first set, called the domain, to a second set, called the range, such that each element in the domain corresponds to exactly one element in the range. Example 2) Determine whether each relation is a function:
a. {(1, 2), (3, 4), (5, 6), (5, 8)}
b. {(1, 2), (3, 4), (6, 5), (8, 5)} *Functions as Equations
For each , there is only one value of . Therefore, it is a function. The variable is called the independent variable and the variable is called the dependent variable. Not all equations with the variables and defined a function. If an equation is solved for and more than one value of can be obtained for a given , then the equation does not define as a function of .
2
Example 3) Solve each equation for y and then determine whether the equation defines as a functions of :
a.
b.
*Function Notation : a function
: “f of x”, the value of the function f at x. Example 4) If , evaluate each of the following:
a. b. c.
*Graph of Functions The graph of a function is the graph of its ordered pairs. Example 5) Graph the function and in the same rectangular coordinate system.
3
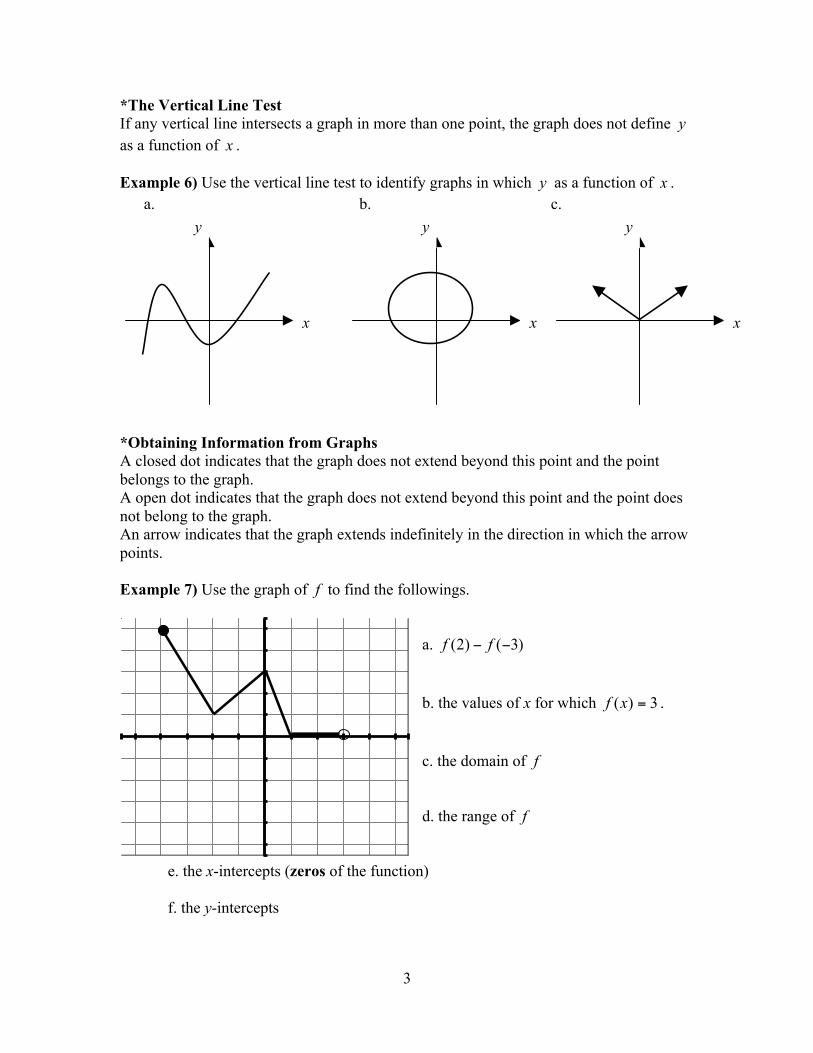
*The Vertical Line Test If any vertical line intersects a graph in more than one point, the graph does not define as a function of . Example 6) Use the vertical line test to identify graphs in which as a function of . a. b. c. *Obtaining Information from Graphs A closed dot indicates that the graph does not extend beyond this point and the point belongs to the graph. A open dot indicates that the graph does not extend beyond this point and the point does not belong to the graph. An arrow indicates that the graph extends indefinitely in the direction in which the arrow points. Example 7) Use the graph of f to find the followings.
a. b. the values of x for which . c. the domain of f d. the range of f
e. the x-intercepts (zeros of the function)
f. the y-intercepts
x
y
x
y
x
y
4
Section 2.2 More on Functions and Their Graphs *Functions and Difference Quotient The expression
for is called the difference quotient. Example 1) If , find and simplify each expression:
a.
b. ,
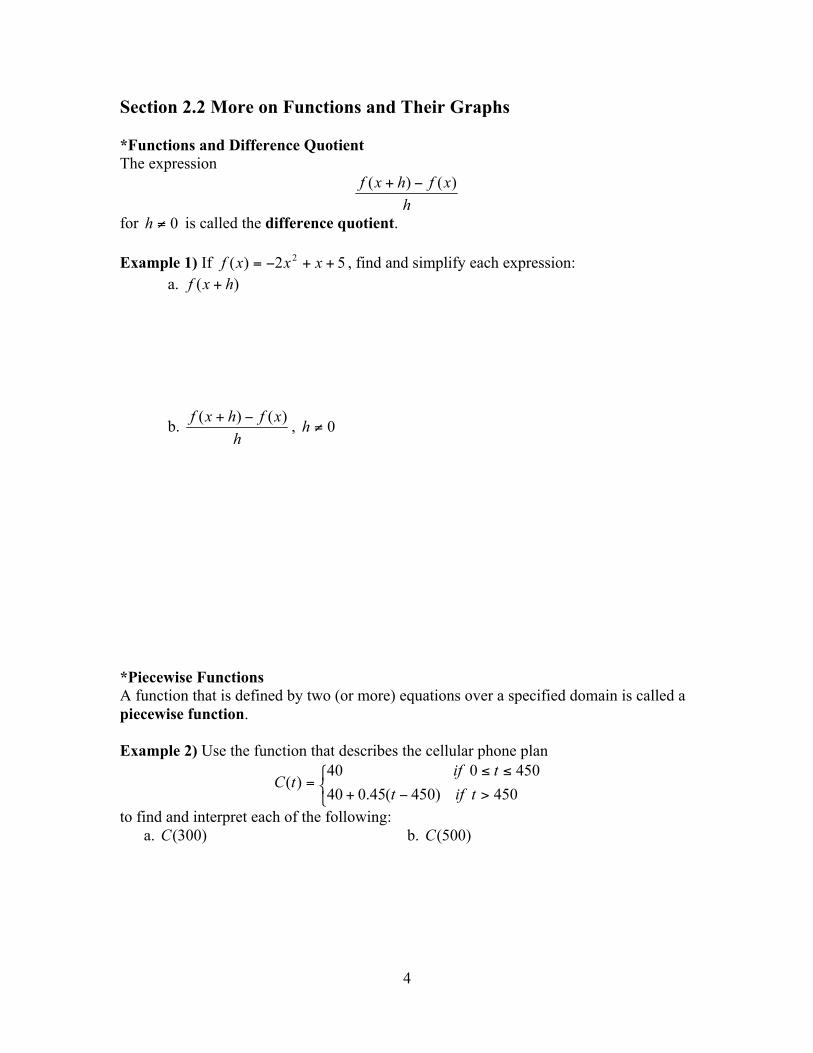
*Piecewise Functions A function that is defined by two (or more) equations over a specified domain is called a piecewise function. Example 2) Use the function that describes the cellular phone plan
to find and interpret each of the following: a. b.
5
x
y
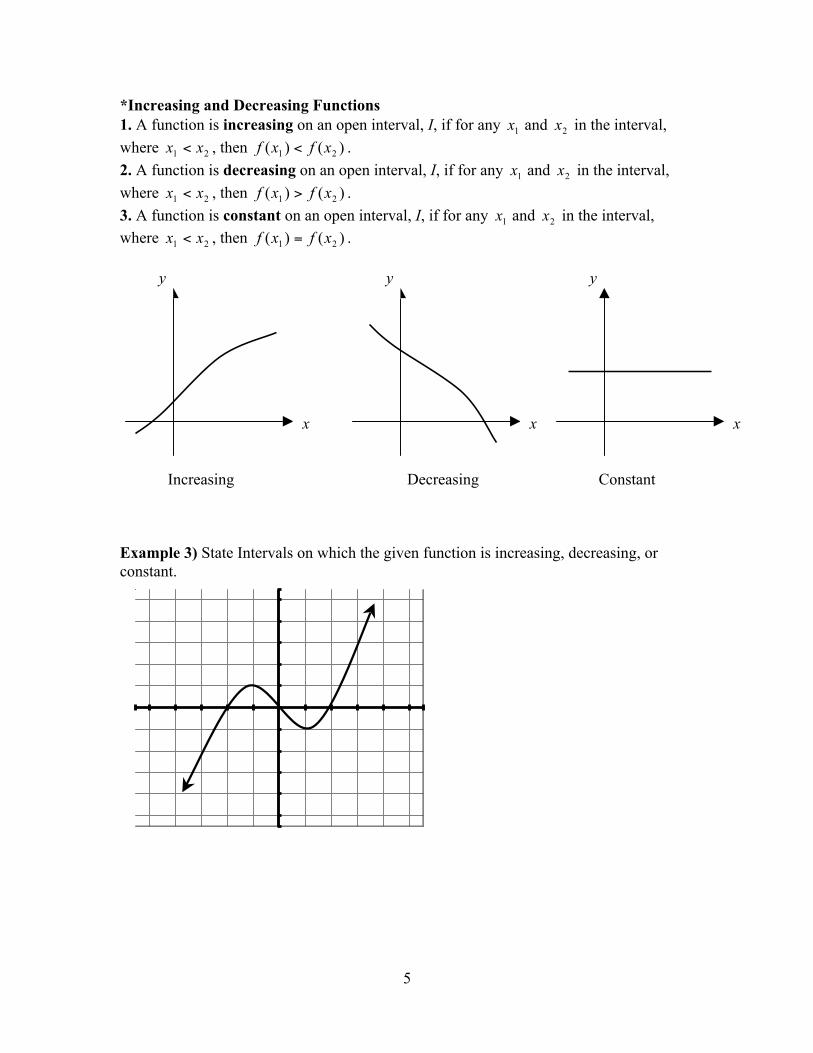
*Increasing and Decreasing Functions 1. A function is increasing on an open interval, I, if for any and in the interval, where , then . 2. A function is decreasing on an open interval, I, if for any and in the interval, where , then . 3. A function is constant on an open interval, I, if for any and in the interval, where , then .
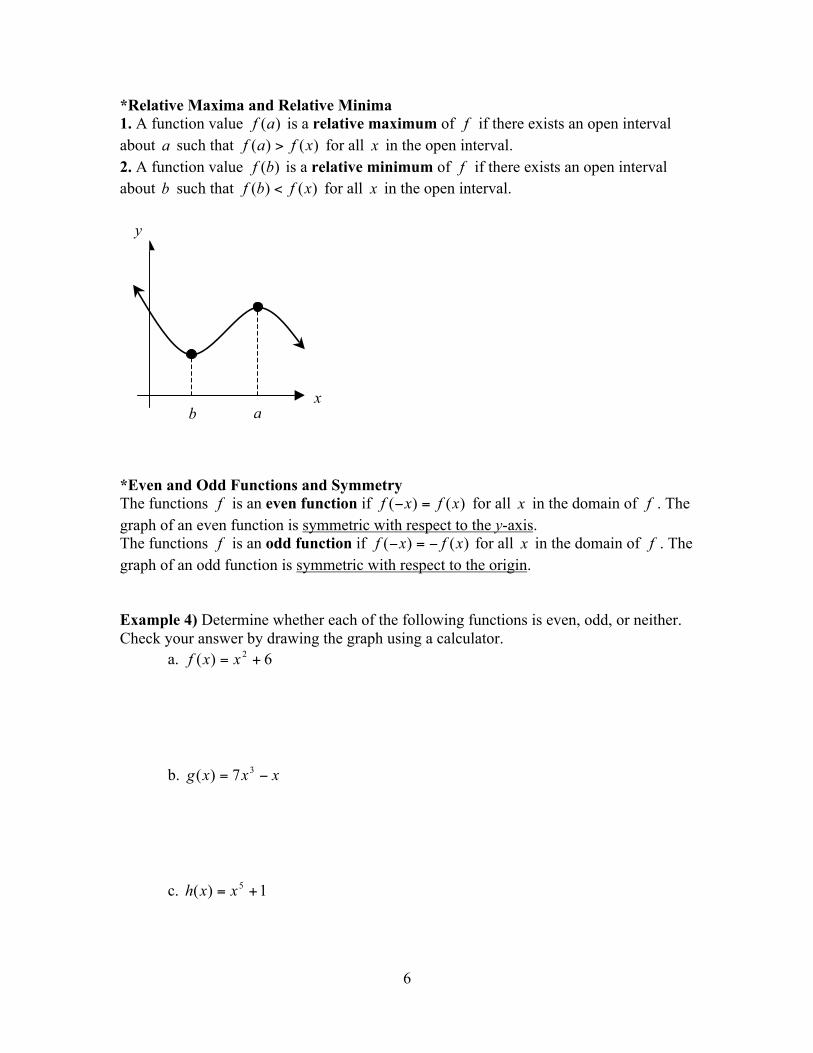
Increasing Decreasing Constant Example 3) State Intervals on which the given function is increasing, decreasing, or constant.
x
y
x
y
6
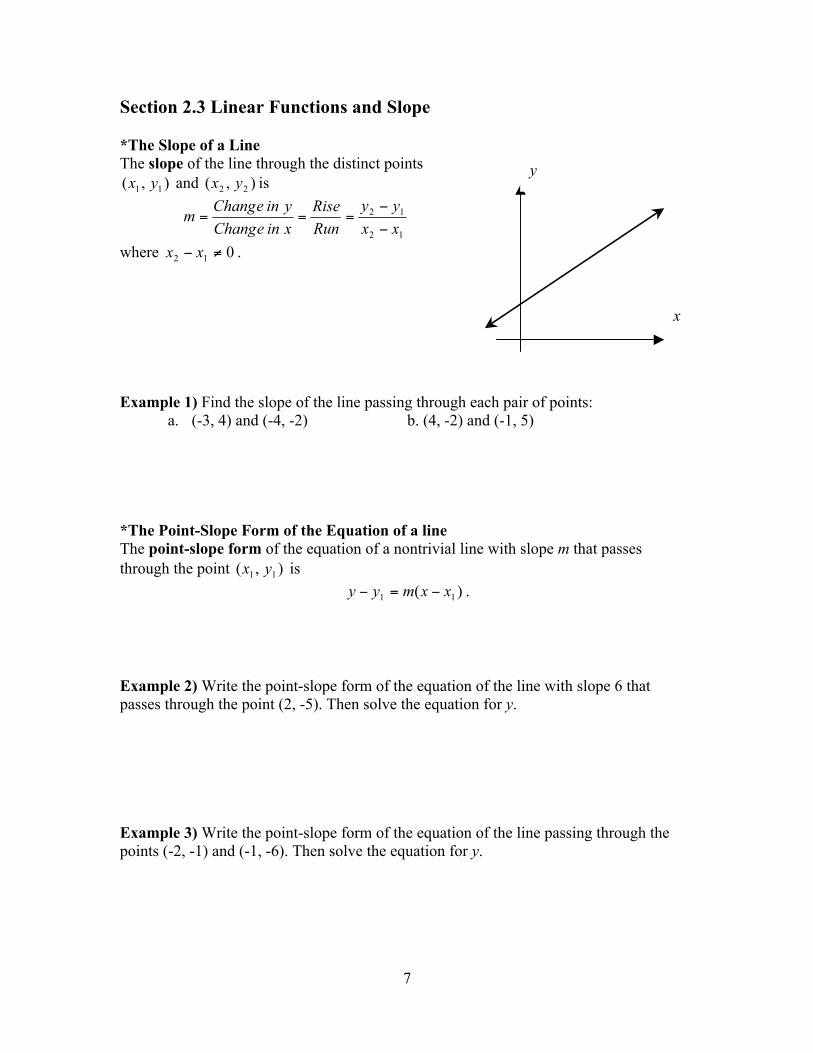
*Relative Maxima and Relative Minima 1. A function value is a relative maximum of if there exists an open interval about such that for all in the open interval. 2. A function value is a relative minimum of if there exists an open interval about such that for all in the open interval. *Even and Odd Functions and Symmetry The functions is an even function if for all in the domain of . The graph of an even function is symmetric with respect to the y-axis. The functions is an odd function if for all in the domain of . The graph of an odd function is symmetric with respect to the origin. Example 4) Determine whether each of the following functions is even, odd, or neither. Check your answer by drawing the graph using a calculator.
a.
b.
c.
x
y
b a
7
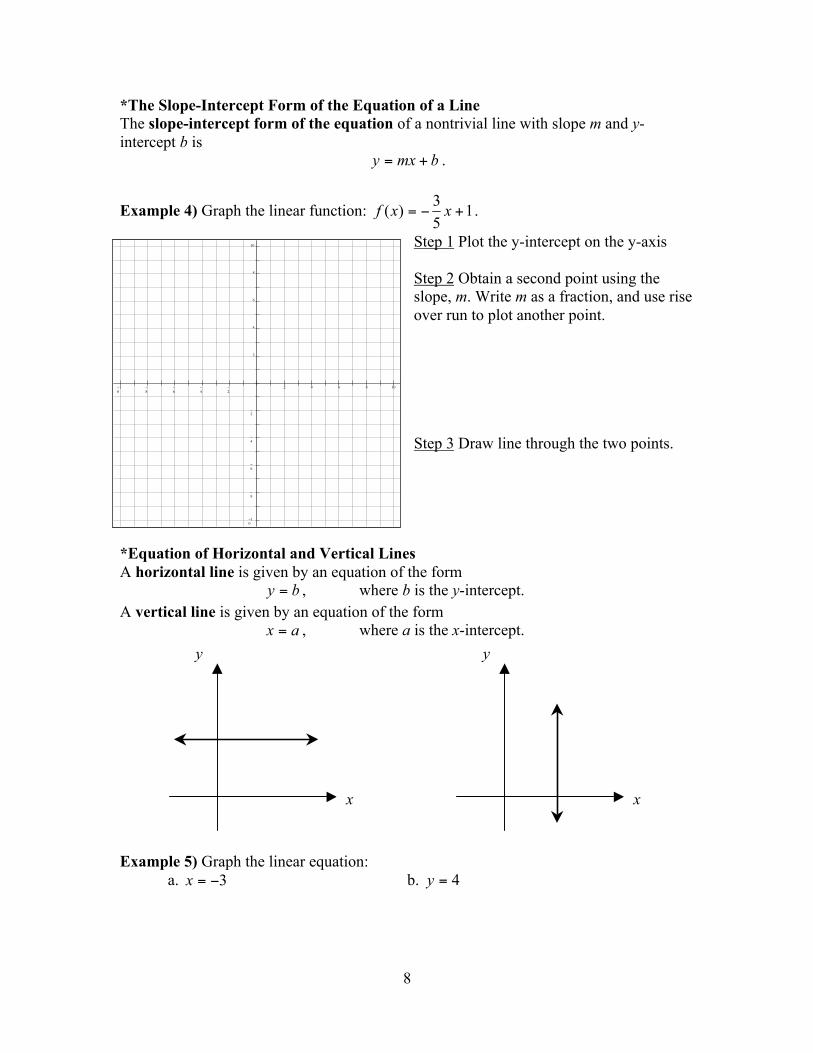
Section 2.3 Linear Functions and Slope *The Slope of a Line The slope of the line through the distinct points
and is
where . Example 1) Find the slope of the line passing through each pair of points:
a. (-3, 4) and (-4, -2) b. (4, -2) and (-1, 5) *The Point-Slope Form of the Equation of a line The point-slope form of the equation of a nontrivial line with slope m that passes through the point is
. Example 2) Write the point-slope form of the equation of the line with slope 6 that passes through the point (2, -5). Then solve the equation for y.
Example 3) Write the point-slope form of the equation of the line passing through the points (-2, -1) and (-1, -6). Then solve the equation for y.
x
y
8
*The Slope-Intercept Form of the Equation of a Line The slope-intercept form of the equation of a nontrivial line with slope m and y-intercept b is
.
Example 4) Graph the linear function: .
Step 1 Plot the y-intercept on the y-axis Step 2 Obtain a second point using the slope, m. Write m as a fraction, and use rise over run to plot another point. Step 3 Draw line through the two points.
*Equation of Horizontal and Vertical Lines A horizontal line is given by an equation of the form
, where b is the y-intercept. A vertical line is given by an equation of the form
, where a is the x-intercept.
Example 5) Graph the linear equation:
a. b.
x
y
x
y
−10 −
8 −6 −
4 −2 2 4 6 8 10
−10
−8
−6
−4
−2
2
4
6
8
10
9
*The General Form of the Equation of a Line Every line has an equation that can be written in the general form , where A, B, and C are real numbers, and A and B are not both zero. Example 6) Find the slope and the y-intercept of the line whose equation is
. Then use the y-intercept and the slope to graph the equation.
Example 7) Graph using intercepts: .
Step 1 Find the x-intercept. Let and solve for x. Step 2 Find the y-intercept. Let and solve for y.
Step 3 Graph the equation by drawing a line through the two points containing the intercepts.
−10 −
8 −6 −
4 −2 2 4 6 8 10
−10
−8
−6
−4
−2
2
4
6
8
10
−10 −
8 −6 −
4 −2 2 4 6 8 10
−10
−8
−6
−4
−2
2
4
6
8
10
10
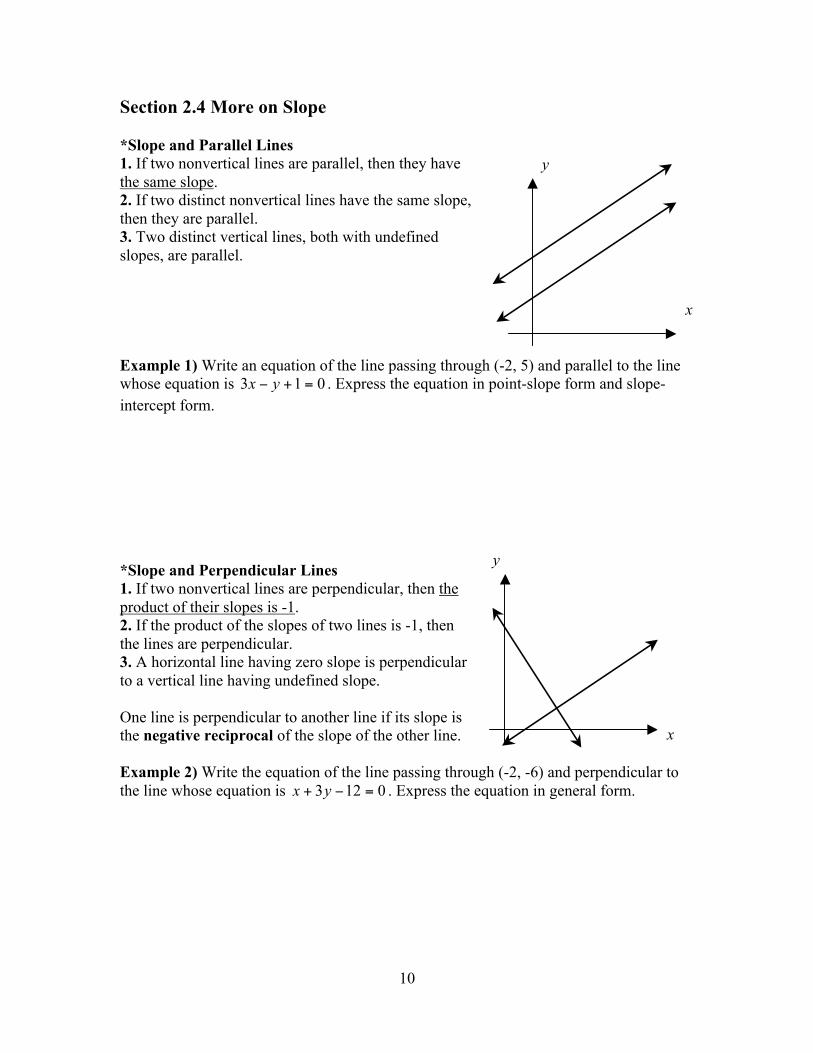
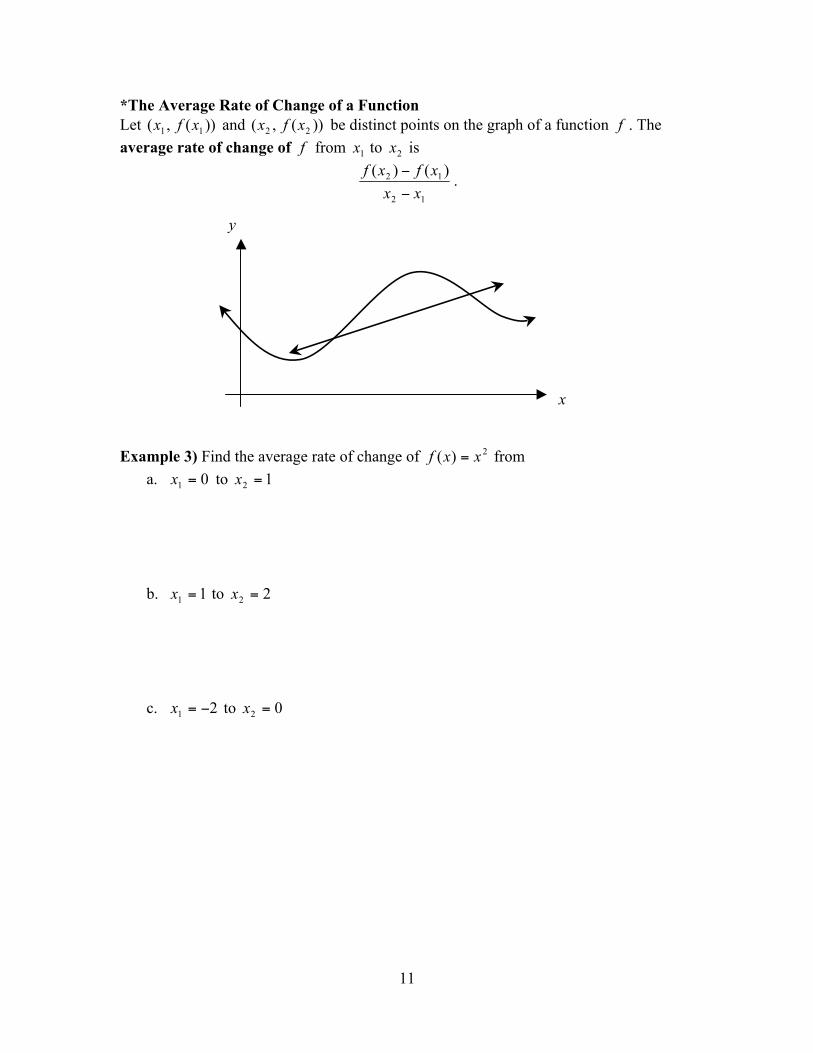
Section 2.4 More on Slope *Slope and Parallel Lines 1. If two nonvertical lines are parallel, then they have the same slope. 2. If two distinct nonvertical lines have the same slope, then they are parallel. 3. Two distinct vertical lines, both with undefined slopes, are parallel. Example 1) Write an equation of the line passing through (-2, 5) and parallel to the line whose equation is . Express the equation in point-slope form and slope-intercept form. *Slope and Perpendicular Lines 1. If two nonvertical lines are perpendicular, then the product of their slopes is -1. 2. If the product of the slopes of two lines is -1, then the lines are perpendicular. 3. A horizontal line having zero slope is perpendicular to a vertical line having undefined slope. One line is perpendicular to another line if its slope is the negative reciprocal of the slope of the other line. Example 2) Write the equation of the line passing through (-2, -6) and perpendicular to the line whose equation is . Express the equation in general form.
y
x
y
x
11
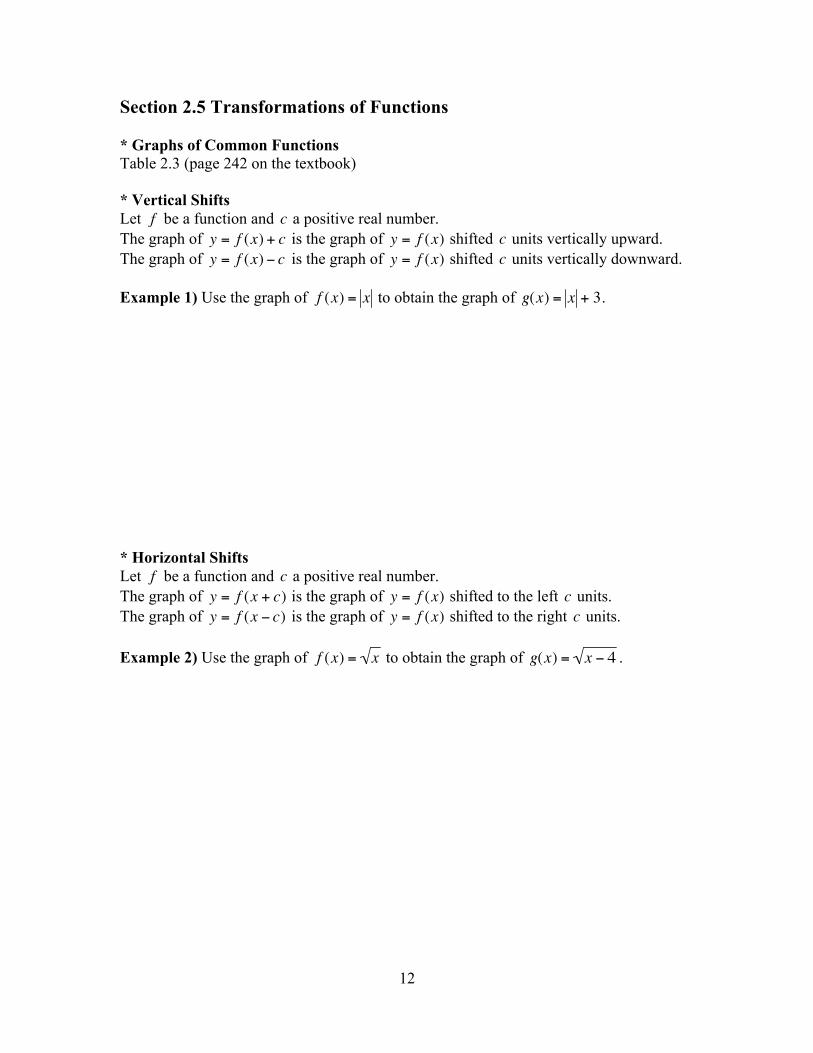
*The Average Rate of Change of a Function Let and be distinct points on the graph of a function . The average rate of change of from to is
.
Example 3) Find the average rate of change of from
a. to
b. to
c. to
y
x
12
Section 2.5 Transformations of Functions * Graphs of Common Functions Table 2.3 (page 242 on the textbook) * Vertical Shifts Let be a function and a positive real number. The graph of is the graph of shifted units vertically upward. The graph of is the graph of shifted units vertically downward. Example 1) Use the graph of to obtain the graph of . * Horizontal Shifts Let be a function and a positive real number. The graph of is the graph of shifted to the left units. The graph of is the graph of shifted to the right units. Example 2) Use the graph of to obtain the graph of .
13
Example 3) Use the graph of to obtain the graph of . *Reflections of Graphs The graph of is the graph of reflected about the x-axis. Example 4) Use the graph of to obtain the graph of . The graph of is the graph of reflected about the y-axis. Example 5) Use the graph of to obtain the graph of .
14
* Vertical Stretching and Shrinking Let be a function and a positive real number. If , the graph of is the graph of vertically stretched by multiplying each of its y-coordinates by c. If , the graph of is the graph of vertically shrunk by multiplying each of its y-coordinates by c.
Example 6) Use the graph of to obtain the graph of .
* Horizontal Stretching and Shrinking Let be a function and a positive real number. If , the graph of is the graph of horizontally shrunk by dividing each of its x-coordinates by c. If , the graph of is the graph of horizontally stretched by dividing each of its y-coordinates by c. Example 7) Use the graph of to obtain the graphs of and
.
15
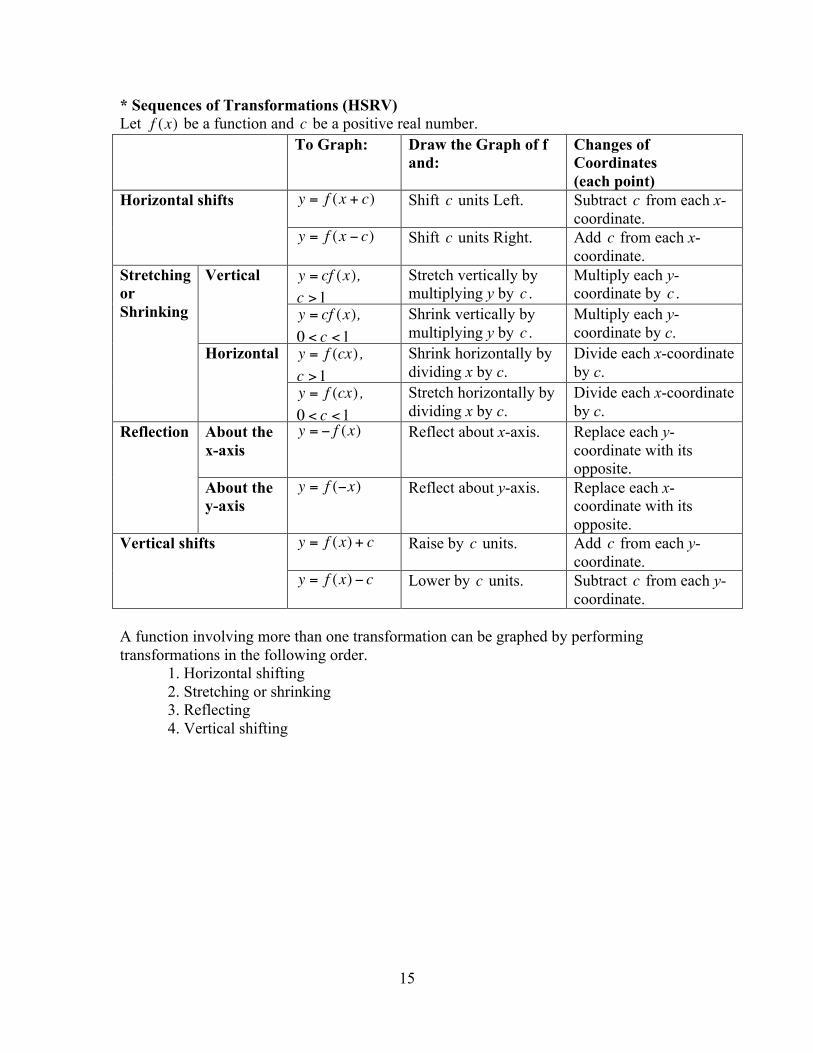
* Sequences of Transformations (HSRV) Let be a function and be a positive real number. To Graph: Draw the Graph of f
and: Changes of Coordinates (each point)
Shift units Left. Subtract from each x-coordinate.
Horizontal shifts
Shift units Right. Add from each x-coordinate.
,
Stretch vertically by multiplying y by .
Multiply each y-coordinate by .
Vertical
,
Shrink vertically by multiplying y by .
Multiply each y-coordinate by c.
,
Shrink horizontally by dividing x by c.
Divide each x-coordinate by c.
Stretching or Shrinking
Horizontal
,
Stretch horizontally by dividing x by c.
Divide each x-coordinate by c.
About the x-axis
Reflect about x-axis. Replace each y-coordinate with its opposite.
Reflection
About the y-axis
Reflect about y-axis. Replace each x-coordinate with its opposite.
Raise by units. Add from each y-coordinate.
Vertical shifts
Lower by units. Subtract from each y-coordinate.
A function involving more than one transformation can be graphed by performing transformations in the following order.
1. Horizontal shifting 2. Stretching or shrinking 3. Reflecting 4. Vertical shifting
16
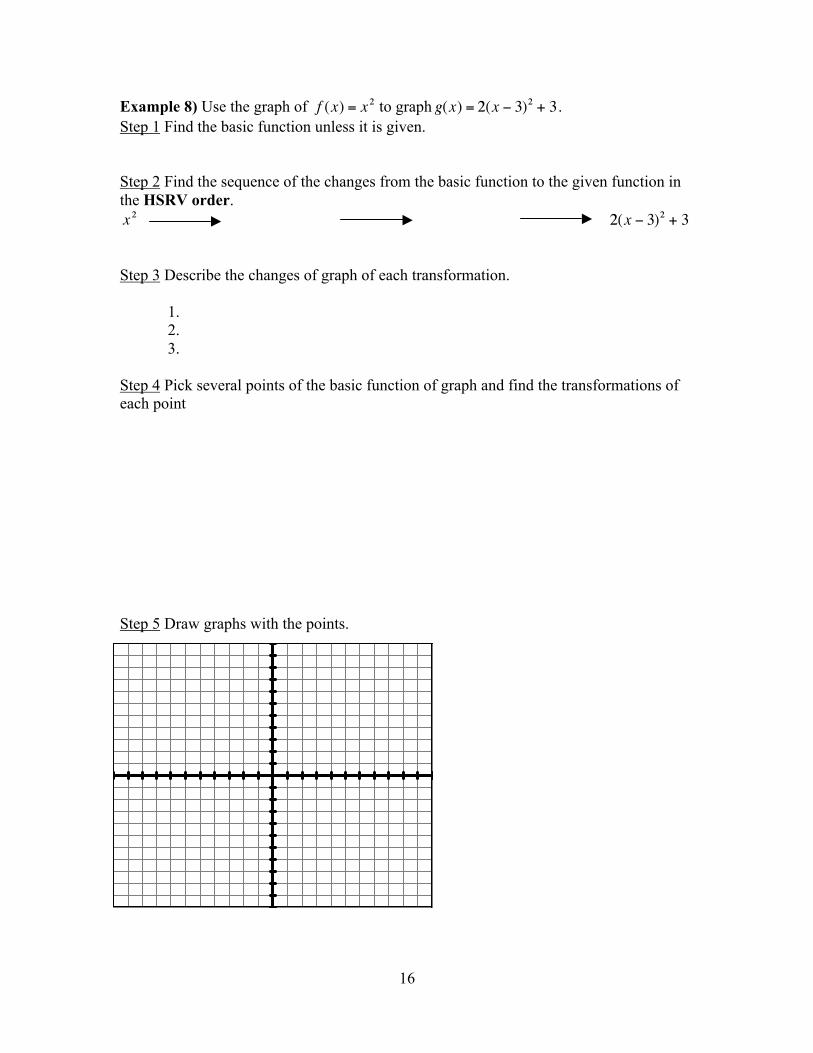
Example 8) Use the graph of to graph . Step 1 Find the basic function unless it is given. Step 2 Find the sequence of the changes from the basic function to the given function in the HSRV order.
Step 3 Describe the changes of graph of each transformation.
1. 2. 3. Step 4 Pick several points of the basic function of graph and find the transformations of each point Step 5 Draw graphs with the points.
17
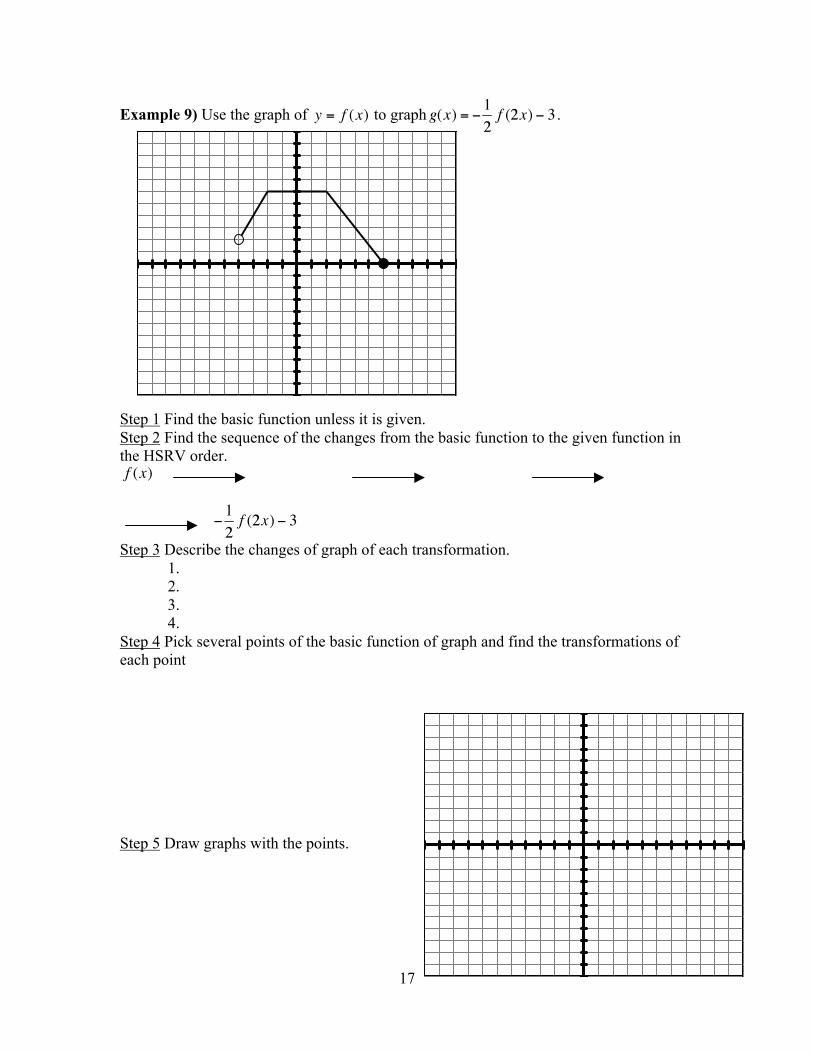
Example 9) Use the graph of to graph .
Step 1 Find the basic function unless it is given. Step 2 Find the sequence of the changes from the basic function to the given function in the HSRV order.
Step 3 Describe the changes of graph of each transformation. 1.
2. 3. 4. Step 4 Pick several points of the basic function of graph and find the transformations of each point Step 5 Draw graphs with the points.
18
Chapter 2.6 Combinations of Functions; Composite Functions * Finding a Function’s Domain The domain of a function is the largest set of real numbers for which the value of
is a real number. Exclude the numbers, which cause Division by Zero and a Square Root of a Negative Number. Example 1) Find the domain of each function.
a)
b)
c)
d)
* The Algebra of Function
1. Sum: 2. Difference: 3. Product:
4. Quotient:
Each domain is the intersection of domains of and .
19
Example2) Let and . Find the following functions.
a) b)
c)
d)
Example 3) Let and . Find and the domain of .
20
*Composite Functions The composition of the function with is
This can be read “ of of ” or “ composed with of ” The domain of the composite function is the set of all such that
1. x is the domain of and 2. is in the domain of f.
Example 4) Given and , find each of the following composite functions. a) b)
21
Example 5) Given and , find and the domain of .
*Decomposing Functions Example 6) Express as a composition of two functions. Example 7) Express as a composition of two functions.
22
Section 2.7 Inverse Functions * Definition of the Inverse of a Function Let f and g be two functions such that
€
f (g(x)) = x for every x in the domain of g and
€
g( f (x)) = x for every x in the domain of f. The function g is the inverse of the function f and is denoted by
€
f −1 (read “f-inverse”). Thus,
€
f ( f −1(x)) = x and
€
f −1( f (x)) = x . The domain of f is equal to the range of
€
f −1, and range of f is equal to the domain of
€
f −1. Example 1) Show that each function is the inverse of the other:
€
f (x) = 4x − 5 and
€
g(x) =x + 54
* Finding the Inverse of a Function Example 2) Find the inverse of
€
f (x) = 3x − 2 . Step 1 Replace
€
f (x) with y. Step 2 Interchange x and y. Step 3 Solve for y. Step 4 Replace y with
€
f −1(x)
23
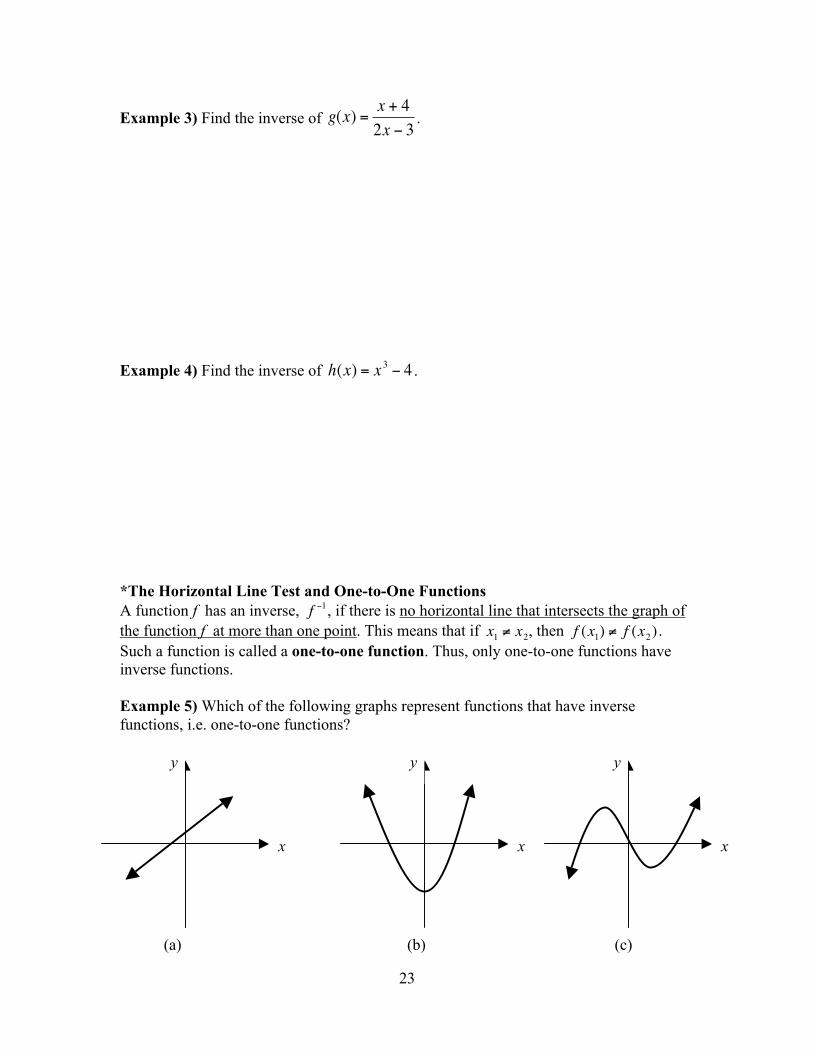
Example 3) Find the inverse of
€
g(x) =x + 42x − 3
.
Example 4) Find the inverse of
€
h(x) = x 3 − 4 . *The Horizontal Line Test and One-to-One Functions A function f has an inverse,
€
f −1, if there is no horizontal line that intersects the graph of the function f at more than one point. This means that if
€
x1 ≠ x2, then
€
f (x1) ≠ f (x2) . Such a function is called a one-to-one function. Thus, only one-to-one functions have inverse functions. Example 5) Which of the following graphs represent functions that have inverse functions, i.e. one-to-one functions? (a) (b) (c)
x
y
x
y
x
y
24
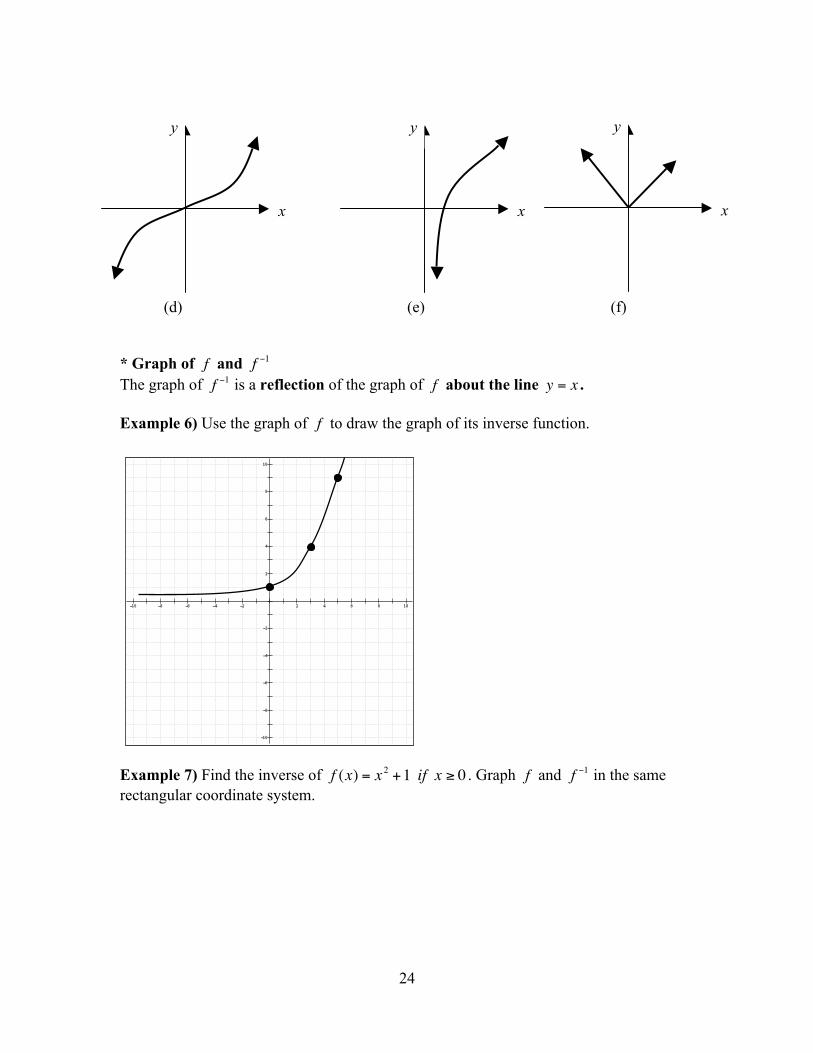
(d) (e) (f) * Graph of
€
f and
€
f −1 The graph of
€
f −1 is a reflection of the graph of
€
f about the line
€
y = x . Example 6) Use the graph of
€
f to draw the graph of its inverse function.
Example 7) Find the inverse of
€
f (x) = x 2 +1 if x ≥ 0 . Graph
€
f and
€
f −1 in the same rectangular coordinate system.
x
y
x
y
x
y
25
Section 2.8 Distance and Midpoint Formulas; Circles *The Distance Formula The distance, d, between the points and in the rectangular coordinate system is
.
Example 1) Find the distance between (-3, 10) and (2, -2). *The Midpoint Formula Consider a line segment whose endpoints are and . The coordinates of the segment’s midpoint are
.
Example 2) Find the midpoint of the line segment with endpoints (1, 3) and (6, -2). *Circle A circle is the set of all points in a plane that are equidistant from a fixed point, called the center. The fixed distance from the circle’s center to any point on the circle is called the radius. The Standard form of the equation of a circle with center (h, k) and radius r is
Example 3) Write the standard form of the equation of the circle with center (0, 0) and radius 3. Example 4) Write the standard form of the equation of the circle with center (3, -2) and radius 4.
26
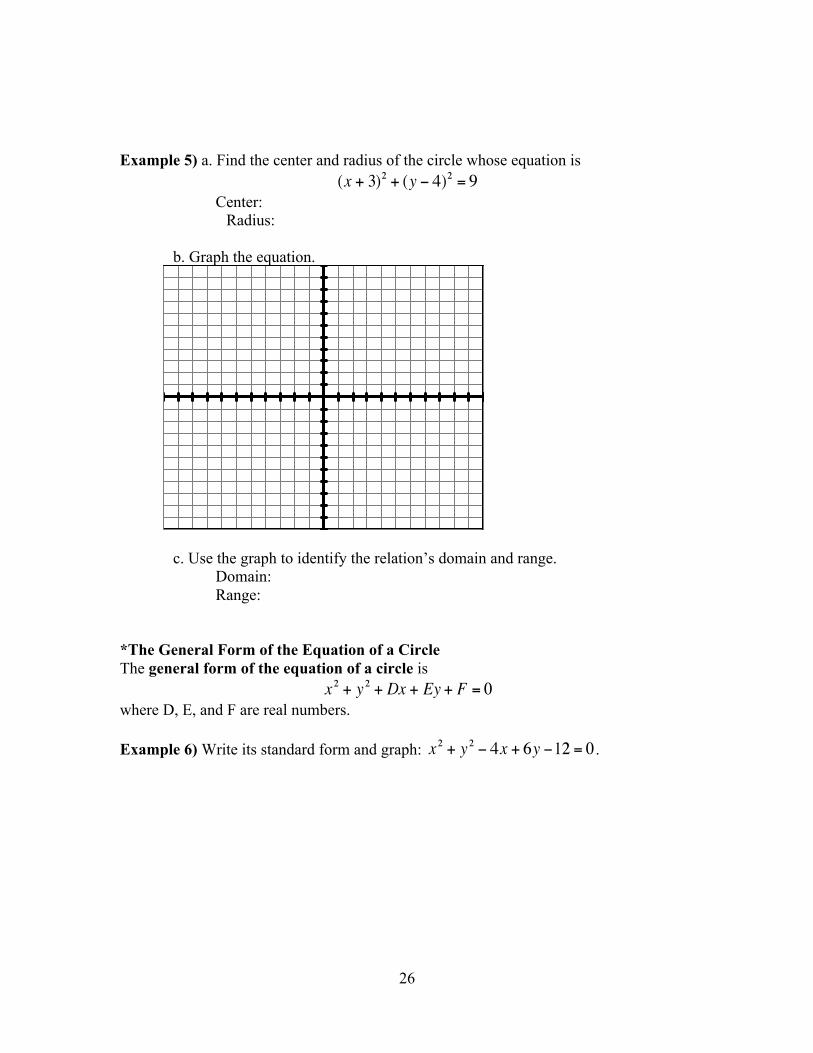
Example 5) a. Find the center and radius of the circle whose equation is
Center:
Radius: b. Graph the equation.
c. Use the graph to identify the relation’s domain and range.
Domain: Range: *The General Form of the Equation of a Circle The general form of the equation of a circle is
where D, E, and F are real numbers. Example 6) Write its standard form and graph: .