section 25 banking, finance, and insurancebanking, finance, and insurance this section presents data...
TRANSCRIPT
Section 25
Banking, Finance, and Insurance
This section presents data on the nation’sfinances, various types of financial institu-tions, money and credit, securities, insur-ance, and real estate. The primary sourcesof these data are publications of severaldepartments of the federal government,especially the Treasury Department, andindependent agencies such as the FederalDeposit Insurance Corporation, the Fed-eral Reserve Board, and the Securities andExchange Commission. National data oninsurance are available primarily from pri-vate organizations, such as the AmericanCouncil of Life Insurers and the InsuranceInformation Institute.
Flow of funds—The flow of fundsaccounts of the Federal Reserve Boardbring together statistics on all of themajor forms of financial instruments topresent an economy-wide view of assetand liability relationships. In flow form,the accounts relate borrowing and lend-ing to one another and to the nonfinancialactivities that generate income and pro-duction. Each claim outstanding isincluded simultaneously as an asset ofthe lender and as a liability of the debtor.The accounts also indicate the balancebetween asset totals and liability totalsover the economy as a whole. Severalpublications of the Board of Governors ofthe Federal Reserve System contain infor-mation on the flow of funds accounts:Summary data on flows and outstandings,in the Statistical Supplement to the Fed-eral Reserve Bulletin, and Flow of FundsAccounts of the United States (quarterly);and concepts and organization of theaccounts, in Guide to the Flow of FundsAccounts (2000). Data are also availableat the Board’s Web site <http://www.federalreserve.gov/releases/>.
Survey of Consumer Finances(SCF)—The Federal Reserve Board incooperation with the Department of theTreasury sponsors this survey, which isconducted every 3 years to providedetailed information on the finances ofU.S. families. Among the topics coveredare the balance sheet, pension, income,
and other demographic characteristics ofU.S. families. The survey also gathersinformation on the use of financial institu-tions. Since 1992, data for the SCF havebeen collected by the National Organiza-tion for Social Science and SurveyResearch at the University of Chicago.Data from the survey are published peri-odically in the Federal Reserve Bulletin.The latest survey is available in the Janu-ary 2003 issue of the Bulletin. More dataand information on the survey are avail-able at the following Web site of theFederal Reserve Board, <http://www.federalreserve.gov/pubs/oss/oss2/scfindex.html>.
Banking system—Banks in this countryare organized under the laws of both thestates and the federal government andare regulated by several bank supervisoryagencies. National banks are supervisedby the Comptroller of the Currency.Reports of Condition have been collectedfrom national banks since 1863. Summa-ries of these reports are published in theComptroller’s Annual Report, which alsopresents data on the structure of thenational banking system.
The Federal Reserve System was estab-lished in 1913 to exercise central bankingfunctions, some of which are shared withthe U.S. Treasury. It includes nationalbanks and such state banks that voluntar-ily join the system. Statements of statebank members are consolidated by theBoard of Governors of the Federal ReserveSystem with data for national banks col-lected by the Comptroller of the Currencyinto totals for all member banks of thesystem. Balance sheet data for memberbanks and other commercial banks arepublished quarterly in the StatisticalSupplement to the Federal Reserve Bulle-tin. The Federal Deposit Insurance Corpo-ration (FDIC), established in 1933, insureseach depositor up to $100,000. Majoritem balance sheet and income data forall insured financial institutions are pub-lished in the FDIC Quarterly Banking Pro-file. This publication is also available on
Banking, Finance, and Insurance 733
U.S. Census Bureau, Statistical Abstract of the United States: 2004-2005
the Internet at the following address:<http://www.fdic.gov>. Balance sheet andincome data for individual institutions arealso available at this site in the InstitutionDirectory (ID) system.
Credit unions—Federally charteredcredit unions are under the supervision ofthe National Credit Union Administration.State-chartered credit unions are super-vised by the respective state supervisoryauthorities. The administration publishescomprehensive program and statisticalinformation on all federal and federallyinsured state credit unions in the AnnualReport of the National Credit UnionAdministration. Deposit insurance (up to$100,000 per account) is provided tomembers of all federal and those statecredit unions that are federally-insured bythe National Credit Union Share InsuranceFund which was established in 1970.Deposit insurance for state charteredcredit unions is also available in somestates under private or state-administeredinsurance programs.
Other credit agencies—Insurance com-panies, finance companies dealing primar-ily in installment sales financing, andpersonal loan companies represent impor-tant sources of funds for the credit mar-ket. Statistics on loans, investments, cash,etc., of life insurance companies are pub-lished principally by the American Councilof Life Insurers in its Life Insurers FactBook. Consumer credit data are publishedcurrently in the Statistical Supplement tothe Federal Reserve Bulletin.
Government corporations and creditagencies make available credit of speci-fied types or to specified groups of pri-vate borrowers, either by lending directlyor by insuring or guaranteeing loansmade by private lending institutions. Dataon operations of government credit agen-cies, along with other government corpo-rations, are available in reports of indi-vidual agencies; data on their debtoutstanding are published in the Statisti-cal Supplement to the Federal Reserve Bul-letin.
Securities—The Securities and ExchangeCommission (SEC) was established in1934 to protect the interests of the publicand investors against malpractices in thesecurities and financial markets and toprovide the fullest possible disclosure of
information regarding securities to theinvesting public. Statistical data are pub-lished in the SEC Annual Report.
Data on the securities industry and securi-ties transactions are also available from anumber of private sources. The SecuritiesIndustry Association, New York, NY,<http://www.sia.com/>, publishes the SIAAnnual Report, Securities Industry Year-book, and the periodic Securities IndustryTrends. The Investment Company Insti-tute, Washington, DC,<http://www.ici.org/> publishes a refer-ence book, research newsletters, and avariety of research reports that examinethe industry, its shareholders, or industryissues. The annual Mutual Fund Fact Bookis a guide to trends and statisticsobserved in the investment companyindustry. Fundamentals is a newslettersummarizing the findings of major Insti-tute research projects. Institute researchreports provide a detailed examination ofshareholder demographics and otheraspects of fund ownership.
Among the many sources of data on stockand bond prices and sales are the NewYork Stock Exchange, New York, NY,<http://www.nyse.com/>; NASDAQ,Washington, DC, <http://www.nasdaq.com/>; Global Financial Data, Los Ange-les, CA, <http://www.globalfindata.com/>; Dow-Jones & Company, Inc., NewYork, NY, <http://www.dj.com/>; and theBond Market Association, New York, NY,<http://www.bondmarkets.com/>.
Insurance—Insuring companies, whichare regulated by the various states or theDistrict of Columbia, are classified aseither life or property. Both life and prop-erty insurance companies may underwritehealth insurance. Insuring companies,other than those classified as life, are per-mitted to underwrite one or more prop-erty lines provided they are so licensedand have the necessary capital or surplus.
There are a number of published sourcesfor statistics on the various classes ofinsurance—life, health, fire, marine, andcasualty. Organizations representing cer-tain classes of insurers publish reports forthese classes. The American Council ofLife Insurers publishes statistics on lifeinsurance purchases, ownership, benefitpayments, and assets in its Life InsurersFact Book.
734 Banking, Finance, and Insurance
U.S. Census Bureau, Statistical Abstract of the United States: 2004-2005
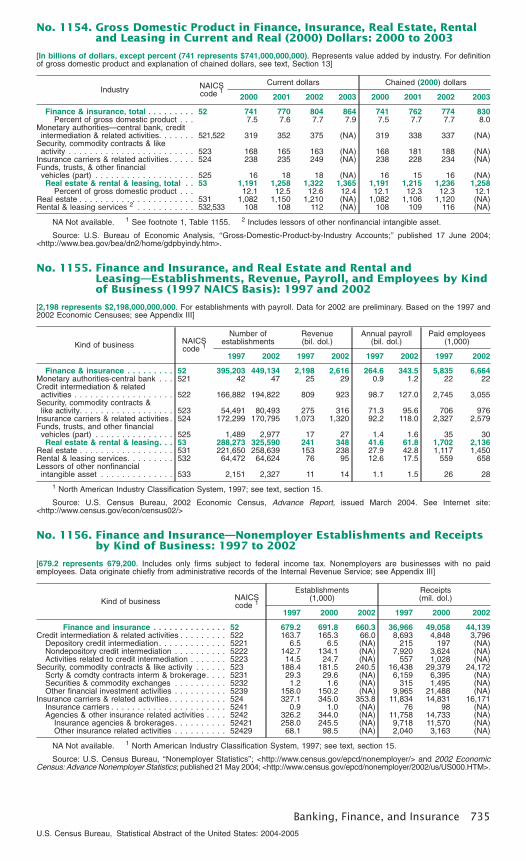
No. 1154. Gross Domestic Product in Finance, Insurance, Real Estate, Rentaland Leasing in Current and Real (2000) Dollars: 2000 to 2003
[In billions of dollars, except percent (741 represents $741,000,000,000). Represents value added by industry. For definitionof gross domestic product and explanation of chained dollars, see text, Section 13]
Industry NAICScode 1
Current dollars Chained (2000) dollars
2000 2001 2002 2003 2000 2001 2002 2003
Finance & insurance, total . . . . . . . . . 52 741 770 804 864 741 762 774 830Percent of gross domestic product . . . 7.5 7.6 7.7 7.9 7.5 7.7 7.7 8.0
Monetary authorities—central bank, creditintermediation & related activities. . . . . . . 521,522 319 352 375 (NA) 319 338 337 (NA)
Security, commodity contracts & likeactivity . . . . . . . . . . . . . . . . . . . . . . . . 523 168 165 163 (NA) 168 181 188 (NA)
Insurance carriers & related activities . . . . . 524 238 235 249 (NA) 238 228 234 (NA)Funds, trusts, & other financialvehicles (part) . . . . . . . . . . . . . . . . . . . 525 16 18 18 (NA) 16 15 16 (NA)Real estate & rental & leasing, total . . 53 1,191 1,258 1,322 1,365 1,191 1,215 1,236 1,258
Percent of gross domestic product . . . 12.1 12.5 12.6 12.4 12.1 12.3 12.3 12.1Real estate . . . . . . . . . . . . . . . . . . . . . . 531 1,082 1,150 1,210 (NA) 1,082 1,106 1,120 (NA)Rental & leasing services 2 . . . . . . . . . . . 532,533 108 108 112 (NA) 108 109 116 (NA)
NA Not available. 1 See footnote 1, Table 1155. 2 Includes lessors of other nonfinancial intangible asset.
Source: U.S. Bureau of Economic Analysis, ‘‘Gross-Domestic-Product-by-Industry Accounts;’’ published 17 June 2004;<http://www.bea.gov/bea/dn2/home/gdpbyindy.htm>.
No. 1155. Finance and Insurance, and Real Estate and Rental andLeasing—Establishments, Revenue, Payroll, and Employees by Kindof Business (1997 NAICS Basis): 1997 and 2002
[2,198 represents $2,198,000,000,000. For establishments with payroll. Data for 2002 are preliminary. Based on the 1997 and2002 Economic Censuses; see Appendix III]
Kind of business NAICScode 1
Number ofestablishments
Revenue(bil. dol.)
Annual payroll(bil. dol.)
Paid employees(1,000)
1997 2002 1997 2002 1997 2002 1997 2002
Finance & insurance . . . . . . . . . 52 395,203 449,134 2,198 2,616 264.6 343.5 5,835 6,664Monetary authorities-central bank . . . 521 42 47 25 29 0.9 1.2 22 22Credit intermediation & relatedactivities . . . . . . . . . . . . . . . . . . . 522 166,882 194,822 809 923 98.7 127.0 2,745 3,055
Security, commodity contracts &like activity. . . . . . . . . . . . . . . . . . 523 54,491 80,493 275 316 71.3 95.6 706 976
Insurance carriers & related activities . 524 172,299 170,795 1,073 1,320 92.2 118.0 2,327 2,579Funds, trusts, and other financialvehicles (part) . . . . . . . . . . . . . . . 525 1,489 2,977 17 27 1.4 1.6 35 30Real estate & rental & leasing. . . 53 288,273 325,590 241 348 41.6 61.8 1,702 2,136
Real estate . . . . . . . . . . . . . . . . . . 531 221,650 258,639 153 238 27.9 42.8 1,117 1,450Rental & leasing services. . . . . . . . . 532 64,472 64,624 76 95 12.6 17.5 559 658Lessors of other nonfinancialintangible asset . . . . . . . . . . . . . . 533 2,151 2,327 11 14 1.1 1.5 26 28
1 North American Industry Classification System, 1997; see text, section 15.
Source: U.S. Census Bureau, 2002 Economic Census, Advance Report, issued March 2004. See Internet site:<http://www.census.gov/econ/census02/>
No. 1156. Finance and Insurance—Nonemployer Establishments and Receiptsby Kind of Business: 1997 to 2002
[679.2 represents 679,200. Includes only firms subject to federal income tax. Nonemployers are businesses with no paidemployees. Data originate chiefly from administrative records of the Internal Revenue Service; see Appendix III]
Kind of business NAICScode 1
Establishments(1,000)
Receipts(mil. dol.)
1997 2000 2002 1997 2000 2002
Finance and insurance . . . . . . . . . . . . . . 52 679.2 691.8 660.3 36,966 49,058 44,139Credit intermediation & related activities . . . . . . . . . 522 163.7 165.3 66.0 8,693 4,848 3,796
Depository credit intermediation. . . . . . . . . . . . . 5221 6.5 6.5 (NA) 215 197 (NA)Nondepository credit intermediation . . . . . . . . . . 5222 142.7 134.1 (NA) 7,920 3,624 (NA)Activities related to credit intermediation . . . . . . . 5223 14.5 24.7 (NA) 557 1,028 (NA)
Security, commodity contracts & like activity . . . . . . 523 188.4 181.5 240.5 16,438 29,379 24,172Scrty & comdty contracts interm & brokerage. . . . 5231 29.3 29.6 (NA) 6,159 6,395 (NA)Securities & commodity exchanges . . . . . . . . . . 5232 1.2 1.6 (NA) 315 1,495 (NA)Other financial investment activities . . . . . . . . . . 5239 158.0 150.2 (NA) 9,965 21,488 (NA)
Insurance carriers & related activities . . . . . . . . . . . 524 327.1 345.0 353.8 11,834 14,831 16,171Insurance carriers . . . . . . . . . . . . . . . . . . . . . . 5241 0.9 1.0 (NA) 76 98 (NA)Agencies & other insurance related activities . . . . 5242 326.2 344.0 (NA) 11,758 14,733 (NA)
Insurance agencies & brokerages. . . . . . . . . . 52421 258.0 245.5 (NA) 9,718 11,570 (NA)Other insurance related activities . . . . . . . . . . 52429 68.1 98.5 (NA) 2,040 3,163 (NA)
NA Not available. 1 North American Industry Classification System, 1997; see text, section 15.
Source: U.S. Census Bureau, ‘‘Nonemployer Statistics’’; <http://www.census.gov/epcd/nonemployer/> and 2002 EconomicCensus: Advance Nonemployer Statistics; published 21 May 2004; <http://www.census.gov/epcd/nonemployer/2002/us/US000.HTM>.
Banking, Finance, and Insurance 735
U.S. Census Bureau, Statistical Abstract of the United States: 2004-2005
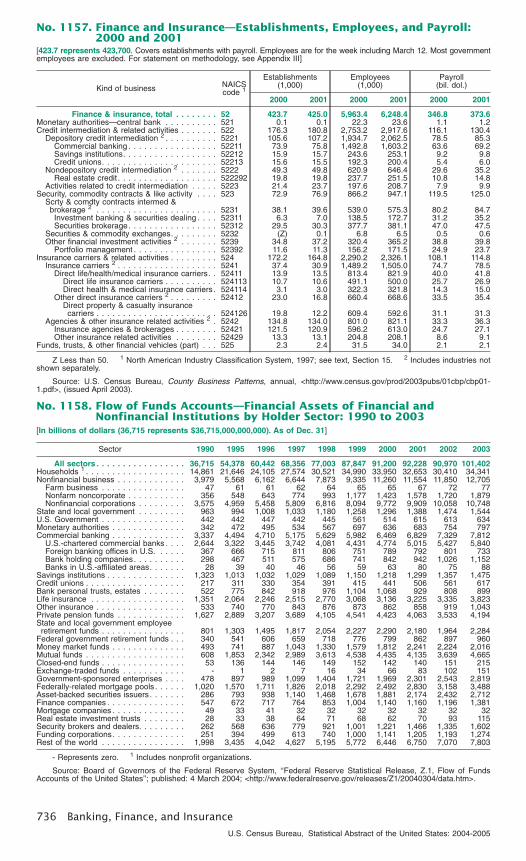
No. 1157. Finance and Insurance—Establishments, Employees, and Payroll:2000 and 2001
[423.7 represents 423,700. Covers establishments with payroll. Employees are for the week including March 12. Most governmentemployees are excluded. For statement on methodology, see Appendix III]
Kind of business NAICScode 1
Establishments(1,000)
Employees(1,000)
Payroll(bil. dol.)
2000 2001 2000 2001 2000 2001
Finance & insurance, total . . . . . . . . 52 423.7 425.0 5,963.4 6,248.4 346.8 373.6Monetary authorities—central bank . . . . . . . . . . 521 0.1 0.1 22.3 23.6 1.1 1.2Credit intermediation & related activities . . . . . . . 522 176.3 180.8 2,753.2 2,917.6 116.1 130.4
Depository credit intermediation 2 . . . . . . . . . . 5221 105.6 107.2 1,934.7 2,062.5 78.5 85.3Commercial banking . . . . . . . . . . . . . . . . . 52211 73.9 75.8 1,492.8 1,603.2 63.6 69.2Savings institutions. . . . . . . . . . . . . . . . . . 52212 15.9 15.7 243.6 253.1 9.2 9.8Credit unions. . . . . . . . . . . . . . . . . . . . . . 52213 15.6 15.5 192.3 200.4 5.4 6.0
Nondepository credit intermediation 2 . . . . . . . 5222 49.3 49.8 620.9 646.4 29.6 35.2Real estate credit . . . . . . . . . . . . . . . . . . . 522292 19.8 19.8 237.7 251.5 10.8 14.8
Activities related to credit intermediation . . . . . 5223 21.4 23.7 197.6 208.7 7.9 9.9Security, commodity contracts & like activity . . . . 523 72.9 76.9 866.2 947.1 119.5 125.0
Scrty & comdty contracts intermed &brokerage 2 . . . . . . . . . . . . . . . . . . . . . . . 5231 38.1 39.6 539.0 575.3 80.2 84.7Investment banking & securities dealing . . . . 52311 6.3 7.0 138.5 172.7 31.2 35.2Securities brokerage. . . . . . . . . . . . . . . . . 52312 29.5 30.3 377.7 381.1 47.0 47.5
Securities & commodity exchanges. . . . . . . . . 5232 (Z) 0.1 6.8 6.5 0.5 0.6Other financial investment activities 2 . . . . . . . 5239 34.8 37.2 320.4 365.2 38.8 39.8
Portfolio management . . . . . . . . . . . . . . . . 52392 11.6 11.3 156.2 171.5 24.9 23.7Insurance carriers & related activities . . . . . . . . . 524 172.2 164.8 2,290.2 2,326.1 108.1 114.8
Insurance carriers 2 . . . . . . . . . . . . . . . . . . . 5241 37.4 30.9 1,489.2 1,505.0 74.7 78.5Direct life/health/medical insurance carriers. . 52411 13.9 13.5 813.4 821.9 40.0 41.8
Direct life insurance carriers . . . . . . . . . . 524113 10.7 10.6 491.1 500.0 25.7 26.9Direct health & medical insurance carriers . 524114 3.1 3.0 322.3 321.8 14.3 15.0
Other direct insurance carriers 2 . . . . . . . . . 52412 23.0 16.8 660.4 668.6 33.5 35.4Direct property & casualty insurancecarriers . . . . . . . . . . . . . . . . . . . . . . . 524126 19.8 12.2 609.4 592.6 31.1 31.3
Agencies & other insurance related activities 2 . 5242 134.8 134.0 801.0 821.1 33.3 36.3Insurance agencies & brokerages . . . . . . . . 52421 121.5 120.9 596.2 613.0 24.7 27.1Other insurance related activities . . . . . . . . 52429 13.3 13.1 204.8 208.1 8.6 9.1
Funds, trusts, & other financial vehicles (part) . . . 525 2.3 2.4 31.5 34.0 2.1 2.1
Z Less than 50. 1 North American Industry Classification System, 1997; see text, Section 15. 2 Includes industries notshown separately.
Source: U.S. Census Bureau, County Business Patterns, annual, <http://www.census.gov/prod/2003pubs/01cbp/cbp01-1.pdf>, (issued April 2003).
No. 1158. Flow of Funds Accounts—Financial Assets of Financial andNonfinancial Institutions by Holder Sector: 1990 to 2003
[In billions of dollars (36,715 represents $36,715,000,000,000). As of Dec. 31]
Sector 1990 1995 1996 1997 1998 1999 2000 2001 2002 2003
All sectors . . . . . . . . . . . . . . . . . 36,715 54,378 60,442 68,356 77,003 87,847 91,200 92,228 90,970 101,402Households 1 . . . . . . . . . . . . . . . . . . . 14,861 21,646 24,105 27,574 30,521 34,990 33,950 32,653 30,410 34,341Nonfinancial business . . . . . . . . . . . . . 3,979 5,568 6,162 6,644 7,873 9,335 11,260 11,554 11,850 12,705
Farm business . . . . . . . . . . . . . . . . 47 61 61 62 64 65 65 67 72 77Nonfarm noncorporate . . . . . . . . . . . 356 548 643 774 993 1,177 1,423 1,578 1,720 1,879Nonfinancial corporations . . . . . . . . . 3,575 4,959 5,458 5,809 6,816 8,094 9,772 9,909 10,058 10,748
State and local government . . . . . . . . . 963 994 1,008 1,033 1,180 1,258 1,296 1,388 1,474 1,544U.S. Government . . . . . . . . . . . . . . . . 442 442 447 442 445 561 514 615 613 634Monetary authorities . . . . . . . . . . . . . . 342 472 495 534 567 697 636 683 754 797Commercial banking . . . . . . . . . . . . . . 3,337 4,494 4,710 5,175 5,629 5,982 6,469 6,829 7,329 7,812
U.S.-chartered commercial banks . . . . 2,644 3,322 3,445 3,742 4,081 4,431 4,774 5,015 5,427 5,840Foreign banking offices in U.S. . . . . . 367 666 715 811 806 751 789 792 801 733Bank holding companies. . . . . . . . . . 298 467 511 575 686 741 842 942 1,026 1,152Banks in U.S.-affiliated areas. . . . . . . 28 39 40 46 56 59 63 80 75 88
Savings institutions . . . . . . . . . . . . . . . 1,323 1,013 1,032 1,029 1,089 1,150 1,218 1,299 1,357 1,475Credit unions . . . . . . . . . . . . . . . . . . . 217 311 330 354 391 415 441 506 561 617Bank personal trusts, estates . . . . . . . . 522 775 842 918 976 1,104 1,068 929 808 899Life insurance . . . . . . . . . . . . . . . . . . 1,351 2,064 2,246 2,515 2,770 3,068 3,136 3,225 3,335 3,823Other insurance . . . . . . . . . . . . . . . . . 533 740 770 843 876 873 862 858 919 1,043Private pension funds . . . . . . . . . . . . . 1,627 2,889 3,207 3,689 4,105 4,541 4,423 4,063 3,533 4,194State and local government employeeretirement funds . . . . . . . . . . . . . . . . 801 1,303 1,495 1,817 2,054 2,227 2,290 2,180 1,964 2,284
Federal government retirement funds . . . 340 541 606 659 718 776 799 862 897 960Money market funds . . . . . . . . . . . . . . 493 741 887 1,043 1,330 1,579 1,812 2,241 2,224 2,016Mutual funds . . . . . . . . . . . . . . . . . . . 608 1,853 2,342 2,989 3,613 4,538 4,435 4,135 3,639 4,665Closed-end funds . . . . . . . . . . . . . . . . 53 136 144 146 149 152 142 140 151 215Exchange-traded funds . . . . . . . . . . . . - 1 2 7 16 34 66 83 102 151Government-sponsored enterprises . . . . 478 897 989 1,099 1,404 1,721 1,969 2,301 2,543 2,819Federally-related mortgage pools . . . . . . 1,020 1,570 1,711 1,826 2,018 2,292 2,492 2,830 3,158 3,488Asset-backed securities issuers. . . . . . . 286 793 938 1,140 1,468 1,678 1,881 2,174 2,432 2,712Finance companies . . . . . . . . . . . . . . . 547 672 717 764 853 1,004 1,140 1,160 1,196 1,381Mortgage companies . . . . . . . . . . . . . . 49 33 41 32 32 32 32 32 32 32Real estate investment trusts . . . . . . . . 28 33 38 64 71 68 62 70 93 115Security brokers and dealers. . . . . . . . . 262 568 636 779 921 1,001 1,221 1,466 1,335 1,602Funding corporations. . . . . . . . . . . . . . 251 394 499 613 740 1,000 1,141 1,205 1,193 1,274Rest of the world . . . . . . . . . . . . . . . . 1,998 3,435 4,042 4,627 5,195 5,772 6,446 6,750 7,070 7,803
- Represents zero. 1 Includes nonprofit organizations.
Source: Board of Governors of the Federal Reserve System, ‘‘Federal Reserve Statistical Release, Z.1, Flow of FundsAccounts of the United States’’; published: 4 March 2004; <http://www.federalreserve.gov/releases/Z1/20040304/data.htm>.
736 Banking, Finance, and Insurance
U.S. Census Bureau, Statistical Abstract of the United States: 2004-2005
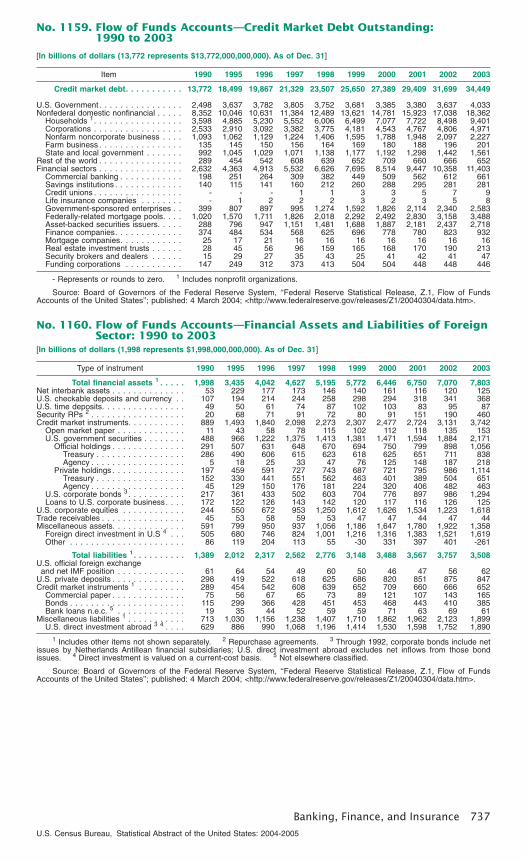
No. 1159. Flow of Funds Accounts—Credit Market Debt Outstanding:1990 to 2003
[In billions of dollars (13,772 represents $13,772,000,000,000). As of Dec. 31]
Item 1990 1995 1996 1997 1998 1999 2000 2001 2002 2003
Credit market debt. . . . . . . . . . . 13,772 18,499 19,867 21,329 23,507 25,650 27,389 29,409 31,699 34,449
U.S. Government . . . . . . . . . . . . . . . . 2,498 3,637 3,782 3,805 3,752 3,681 3,385 3,380 3,637 4,033Nonfederal domestic nonfinancial . . . . . 8,352 10,046 10,631 11,384 12,489 13,621 14,781 15,923 17,038 18,362
Households 1. . . . . . . . . . . . . . . . . 3,598 4,885 5,230 5,552 6,006 6,499 7,077 7,722 8,498 9,401Corporations . . . . . . . . . . . . . . . . . 2,533 2,910 3,092 3,382 3,775 4,181 4,543 4,767 4,806 4,971Nonfarm noncorporate business . . . . 1,093 1,062 1,129 1,224 1,406 1,595 1,788 1,948 2,097 2,227Farm business . . . . . . . . . . . . . . . . 135 145 150 156 164 169 180 188 196 201State and local government . . . . . . . 992 1,045 1,029 1,071 1,138 1,177 1,192 1,298 1,442 1,561
Rest of the world . . . . . . . . . . . . . . . . 289 454 542 608 639 652 709 660 666 652Financial sectors . . . . . . . . . . . . . . . . 2,632 4,363 4,913 5,532 6,626 7,695 8,514 9,447 10,358 11,403
Commercial banking . . . . . . . . . . . . 198 251 264 309 382 449 509 562 612 661Savings institutions . . . . . . . . . . . . . 140 115 141 160 212 260 288 295 281 281Credit unions . . . . . . . . . . . . . . . . . - - - 1 1 3 3 5 7 9Life insurance companies . . . . . . . . - 1 2 2 2 3 2 3 5 8Government-sponsored enterprises . . 399 807 897 995 1,274 1,592 1,826 2,114 2,340 2,583Federally-related mortgage pools. . . . 1,020 1,570 1,711 1,826 2,018 2,292 2,492 2,830 3,158 3,488Asset-backed securities issuers. . . . . 288 796 947 1,151 1,481 1,688 1,887 2,181 2,437 2,718Finance companies. . . . . . . . . . . . . 374 484 534 568 625 696 778 780 823 932Mortgage companies. . . . . . . . . . . . 25 17 21 16 16 16 16 16 16 16Real estate investment trusts . . . . . . 28 45 56 96 159 165 168 170 190 213Security brokers and dealers . . . . . . 15 29 27 35 43 25 41 42 41 47Funding corporations . . . . . . . . . . . 147 249 312 373 413 504 504 448 448 446
- Represents or rounds to zero. 1 Includes nonprofit organizations.
Source: Board of Governors of the Federal Reserve System, ‘‘Federal Reserve Statistical Release, Z.1, Flow of FundsAccounts of the United States’’; published: 4 March 2004; <http://www.federalreserve.gov/releases/Z1/20040304/data.htm>.
No. 1160. Flow of Funds Accounts—Financial Assets and Liabilities of ForeignSector: 1990 to 2003
[In billions of dollars (1,998 represents $1,998,000,000,000). As of Dec. 31]
Type of instrument 1990 1995 1996 1997 1998 1999 2000 2001 2002 2003
Total financial assets 1 . . . . . 1,998 3,435 4,042 4,627 5,195 5,772 6,446 6,750 7,070 7,803Net interbank assets . . . . . . . . . . . . . . 53 229 177 173 146 140 161 116 120 125U.S. checkable deposits and currency . . 107 194 214 244 258 298 294 318 341 368U.S. time deposits. . . . . . . . . . . . . . . . 49 50 61 74 87 102 103 83 95 87Security RPs 2 . . . . . . . . . . . . . . . . . . 20 68 71 91 72 80 91 151 190 460Credit market instruments. . . . . . . . . . . 889 1,493 1,840 2,098 2,273 2,307 2,477 2,724 3,131 3,742
Open market paper . . . . . . . . . . . . . 11 43 58 78 115 102 112 118 135 153U.S. government securities . . . . . . . . 488 966 1,222 1,375 1,413 1,381 1,471 1,594 1,884 2,171
Official holdings . . . . . . . . . . . . . . 291 507 631 648 670 694 750 799 898 1,056Treasury . . . . . . . . . . . . . . . . . 286 490 606 615 623 618 625 651 711 838Agency . . . . . . . . . . . . . . . . . . 5 18 25 33 47 76 125 148 187 218
Private holdings . . . . . . . . . . . . . . 197 459 591 727 743 687 721 795 986 1,114Treasury . . . . . . . . . . . . . . . . . 152 330 441 551 562 463 401 389 504 651Agency . . . . . . . . . . . . . . . . . . 45 129 150 176 181 224 320 406 482 463
U.S. corporate bonds 3 . . . . . . . . . . . 217 361 433 502 603 704 776 897 986 1,294Loans to U.S. corporate business. . . . 172 122 126 143 142 120 117 116 126 125
U.S. corporate equities . . . . . . . . . . . . 244 550 672 953 1,250 1,612 1,626 1,534 1,223 1,618Trade receivables . . . . . . . . . . . . . . . . 45 53 58 59 53 47 47 44 47 44Miscellaneous assets. . . . . . . . . . . . . . 591 799 950 937 1,056 1,186 1,647 1,780 1,922 1,358
Foreign direct investment in U.S 4 . . . 505 680 746 824 1,001 1,216 1,316 1,383 1,521 1,619Other . . . . . . . . . . . . . . . . . . . . . . 86 119 204 113 55 -30 331 397 401 -261
Total liabilities 1. . . . . . . . . . 1,389 2,012 2,317 2,562 2,776 3,148 3,488 3,567 3,757 3,508U.S. official foreign exchangeand net IMF position . . . . . . . . . . . . . 61 64 54 49 60 50 46 47 56 62
U.S. private deposits . . . . . . . . . . . . . . 298 419 522 618 625 686 820 851 875 847Credit market instruments 1 . . . . . . . . . 289 454 542 608 639 652 709 660 666 652
Commercial paper . . . . . . . . . . . . . . 75 56 67 65 73 89 121 107 143 165Bonds . . . . . . . . . . . . . . . . . . . . . . 115 299 366 428 451 453 468 443 410 385Bank loans n.e.c. 5 . . . . . . . . . . . . . 19 35 44 52 59 59 71 63 69 61
Miscellaneous liabilities 1 . . . . . . . . . . . 713 1,030 1,156 1,238 1,407 1,710 1,862 1,962 2,123 1,899U.S. direct investment abroad 3 4 . . . . 629 886 990 1,068 1,196 1,414 1,530 1,598 1,752 1,890
1 Includes other items not shown separately. 2 Repurchase agreements. 3 Through 1992, corporate bonds include netissues by Netherlands Antillean financial subsidiaries; U.S. direct investment abroad excludes net inflows from those bondissues. 4 Direct investment is valued on a current-cost basis. 5 Not elsewhere classified.
Source: Board of Governors of the Federal Reserve System, ‘‘Federal Reserve Statistical Release, Z.1, Flow of FundsAccounts of the United States’’; published: 4 March 2004; <http://www.federalreserve.gov/releases/Z1/20040304/data.htm>.
Banking, Finance, and Insurance 737
U.S. Census Bureau, Statistical Abstract of the United States: 2004-2005
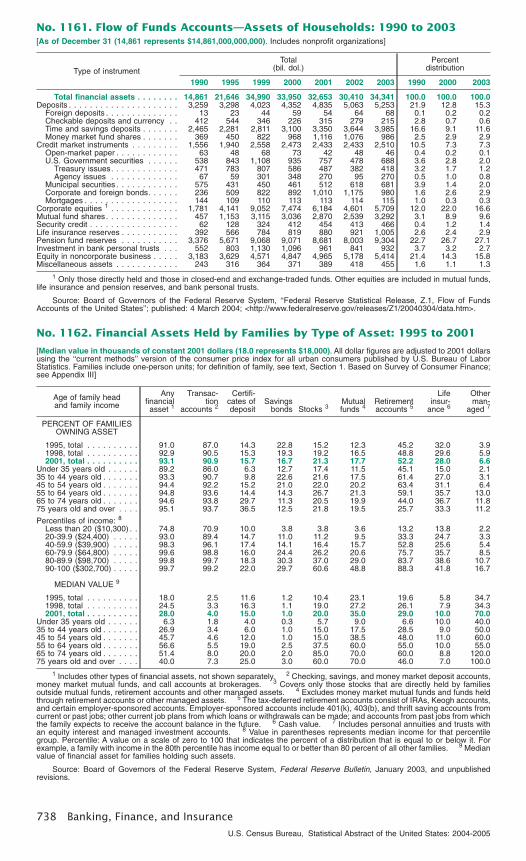
No. 1161. Flow of Funds Accounts—Assets of Households: 1990 to 2003[As of December 31 (14,861 represents $14,861,000,000,000). Includes nonprofit organizations]
Type of instrumentTotal
(bil. dol.)Percent
distribution
1990 1995 1999 2000 2001 2002 2003 1990 2000 2003
Total financial assets . . . . . . . . 14,861 21,646 34,990 33,950 32,653 30,410 34,341 100.0 100.0 100.0Deposits . . . . . . . . . . . . . . . . . . . . . 3,259 3,298 4,023 4,352 4,835 5,063 5,253 21.9 12.8 15.3
Foreign deposits . . . . . . . . . . . . . . 13 23 44 59 54 64 68 0.1 0.2 0.2Checkable deposits and currency . . 412 544 346 226 315 279 215 2.8 0.7 0.6Time and savings deposits . . . . . . . 2,465 2,281 2,811 3,100 3,350 3,644 3,985 16.6 9.1 11.6Money market fund shares . . . . . . . 369 450 822 968 1,116 1,076 986 2.5 2.9 2.9
Credit market instruments . . . . . . . . . 1,556 1,940 2,558 2,473 2,433 2,433 2,510 10.5 7.3 7.3Open-market paper . . . . . . . . . . . . 63 48 68 73 42 48 46 0.4 0.2 0.1U.S. Government securities . . . . . . 538 843 1,108 935 757 478 688 3.6 2.8 2.0
Treasury issues. . . . . . . . . . . . . 471 783 807 586 487 382 418 3.2 1.7 1.2Agency issues . . . . . . . . . . . . . 67 59 301 348 270 95 270 0.5 1.0 0.8
Municipal securities . . . . . . . . . . . . 575 431 450 461 512 618 681 3.9 1.4 2.0Corporate and foreign bonds. . . . . . 236 509 822 892 1,010 1,175 980 1.6 2.6 2.9Mortgages . . . . . . . . . . . . . . . . . . 144 109 110 113 113 114 115 1.0 0.3 0.3
Corporate equities 1 . . . . . . . . . . . . . 1,781 4,141 9,052 7,474 6,184 4,601 5,709 12.0 22.0 16.6Mutual fund shares. . . . . . . . . . . . . . 457 1,153 3,115 3,036 2,870 2,539 3,292 3.1 8.9 9.6Security credit . . . . . . . . . . . . . . . . . 62 128 324 412 454 413 466 0.4 1.2 1.4Life insurance reserves . . . . . . . . . . . 392 566 784 819 880 921 1,005 2.6 2.4 2.9Pension fund reserves . . . . . . . . . . . 3,376 5,671 9,068 9,071 8,681 8,003 9,304 22.7 26.7 27.1Investment in bank personal trusts . . . 552 803 1,130 1,096 961 841 932 3.7 3.2 2.7Equity in noncorporate business . . . . . 3,183 3,629 4,571 4,847 4,965 5,178 5,414 21.4 14.3 15.8Miscellaneous assets . . . . . . . . . . . . 243 316 364 371 389 418 455 1.6 1.1 1.3
1 Only those directly held and those in closed-end and exchange-traded funds. Other equities are included in mutual funds,life insurance and pension reserves, and bank personal trusts.
Source: Board of Governors of the Federal Reserve System, ‘‘Federal Reserve Statistical Release, Z.1, Flow of FundsAccounts of the United States’’; published: 4 March 2004; <http://www.federalreserve.gov/releases/Z1/20040304/data.htm>.
No. 1162. Financial Assets Held by Families by Type of Asset: 1995 to 2001
[Median value in thousands of constant 2001 dollars (18.0 represents $18,000). All dollar figures are adjusted to 2001 dollarsusing the ‘‘current methods’’ version of the consumer price index for all urban consumers published by U.S. Bureau of LaborStatistics. Families include one-person units; for definition of family, see text, Section 1. Based on Survey of Consumer Finance;see Appendix III]
Age of family headand family income
Anyfinancialasset 1
Transac-tion
accounts 2
Certifi-cates ofdeposit
Savingsbonds Stocks 3
Mutualfunds 4
Retirementaccounts 5
Lifeinsur-
ance 6
Otherman-
aged 7
PERCENT OF FAMILIESOWNING ASSET
1995, total . . . . . . . . . . 91.0 87.0 14.3 22.8 15.2 12.3 45.2 32.0 3.91998, total . . . . . . . . . . 92.9 90.5 15.3 19.3 19.2 16.5 48.8 29.6 5.92001, total . . . . . . . . . . 93.1 90.9 15.7 16.7 21.3 17.7 52.2 28.0 6.6
Under 35 years old . . . . . . 89.2 86.0 6.3 12.7 17.4 11.5 45.1 15.0 2.135 to 44 years old . . . . . . . 93.3 90.7 9.8 22.6 21.6 17.5 61.4 27.0 3.145 to 54 years old . . . . . . . 94.4 92.2 15.2 21.0 22.0 20.2 63.4 31.1 6.455 to 64 years old . . . . . . . 94.8 93.6 14.4 14.3 26.7 21.3 59.1 35.7 13.065 to 74 years old . . . . . . . 94.6 93.8 29.7 11.3 20.5 19.9 44.0 36.7 11.875 years old and over . . . . 95.1 93.7 36.5 12.5 21.8 19.5 25.7 33.3 11.2
Percentiles of income: 8
Less than 20 ($10,300) . . 74.8 70.9 10.0 3.8 3.8 3.6 13.2 13.8 2.220-39.9 ($24,400) . . . . . 93.0 89.4 14.7 11.0 11.2 9.5 33.3 24.7 3.340-59.9 ($39,900) . . . . . 98.3 96.1 17.4 14.1 16.4 15.7 52.8 25.6 5.460-79.9 ($64,800) . . . . . 99.6 98.8 16.0 24.4 26.2 20.6 75.7 35.7 8.580-89.9 ($98,700) . . . . . 99.8 99.7 18.3 30.3 37.0 29.0 83.7 38.6 10.790-100 ($302,700) . . . . . 99.7 99.2 22.0 29.7 60.6 48.8 88.3 41.8 16.7
MEDIAN VALUE 9
1995, total . . . . . . . . . . 18.0 2.5 11.6 1.2 10.4 23.1 19.6 5.8 34.71998, total . . . . . . . . . . 24.5 3.3 16.3 1.1 19.0 27.2 26.1 7.9 34.32001, total . . . . . . . . . . 28.0 4.0 15.0 1.0 20.0 35.0 29.0 10.0 70.0
Under 35 years old . . . . . . 6.3 1.8 4.0 0.3 5.7 9.0 6.6 10.0 40.035 to 44 years old . . . . . . . 26.9 3.4 6.0 1.0 15.0 17.5 28.5 9.0 50.045 to 54 years old . . . . . . . 45.7 4.6 12.0 1.0 15.0 38.5 48.0 11.0 60.055 to 64 years old . . . . . . . 56.6 5.5 19.0 2.5 37.5 60.0 55.0 10.0 55.065 to 74 years old . . . . . . . 51.4 8.0 20.0 2.0 85.0 70.0 60.0 8.8 120.075 years old and over . . . . 40.0 7.3 25.0 3.0 60.0 70.0 46.0 7.0 100.0
1 Includes other types of financial assets, not shown separately. 2 Checking, savings, and money market deposit accounts,money market mutual funds, and call accounts at brokerages. 3 Covers only those stocks that are directly held by familiesoutside mutual funds, retirement accounts and other managed assets. 4 Excludes money market mutual funds and funds heldthrough retirement accounts or other managed assets. 5 The tax-deferred retirement accounts consist of IRAs, Keogh accounts,and certain employer-sponsored accounts. Employer-sponsored accounts include 401(k), 403(b), and thrift saving accounts fromcurrent or past jobs; other current job plans from which loans or withdrawals can be made; and accounts from past jobs from whichthe family expects to receive the account balance in the future. 6 Cash value. 7 Includes personal annuities and trusts withan equity interest and managed investment accounts. 8 Value in parentheses represents median income for that percentilegroup. Percentile: A value on a scale of zero to 100 that indicates the percent of a distribution that is equal to or below it. Forexample, a family with income in the 80th percentile has income equal to or better than 80 percent of all other families. 9 Medianvalue of financial asset for families holding such assets.
Source: Board of Governors of the Federal Reserve System, Federal Reserve Bulletin, January 2003, and unpublishedrevisions.
738 Banking, Finance, and Insurance
U.S. Census Bureau, Statistical Abstract of the United States: 2004-2005
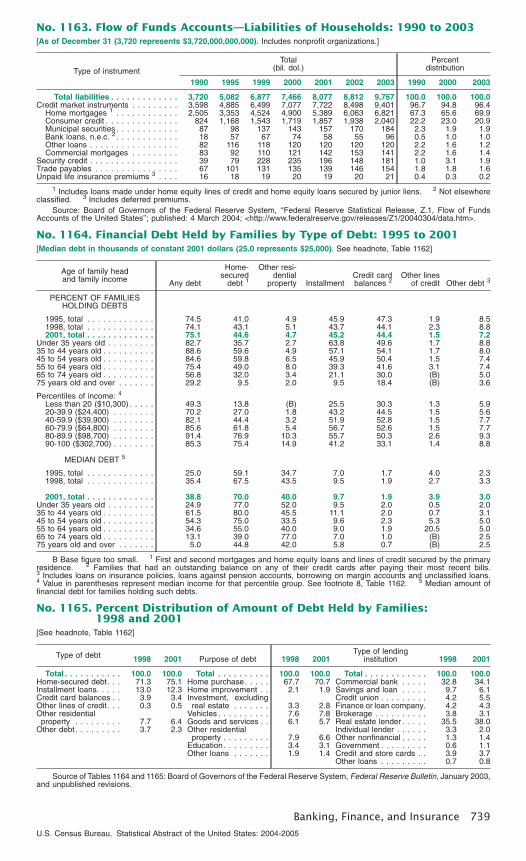
No. 1163. Flow of Funds Accounts—Liabilities of Households: 1990 to 2003[As of December 31 (3,720 represents $3,720,000,000,000). Includes nonprofit organizations.]
Type of instrumentTotal
(bil. dol.)Percent
distribution
1990 1995 1999 2000 2001 2002 2003 1990 2000 2003
Total liabilities . . . . . . . . . . . . . 3,720 5,082 6,877 7,466 8,077 8,812 9,757 100.0 100.0 100.0Credit market instruments . . . . . . . . . 3,598 4,885 6,499 7,077 7,722 8,498 9,401 96.7 94.8 96.4
Home mortgages 1 . . . . . . . . . . . . 2,505 3,353 4,524 4,900 5,389 6,063 6,821 67.3 65.6 69.9Consumer credit . . . . . . . . . . . . . . 824 1,168 1,543 1,719 1,857 1,938 2,040 22.2 23.0 20.9Municipal securities . . . . . . . . . . . . 87 98 137 143 157 170 184 2.3 1.9 1.9Bank loans, n.e.c. 2 . . . . . . . . . . . . 18 57 67 74 58 55 96 0.5 1.0 1.0Other loans . . . . . . . . . . . . . . . . . 82 116 118 120 120 120 120 2.2 1.6 1.2Commercial mortgages . . . . . . . . . 83 92 110 121 142 153 141 2.2 1.6 1.4
Security credit . . . . . . . . . . . . . . . . . 39 79 228 235 196 148 181 1.0 3.1 1.9Trade payables . . . . . . . . . . . . . . . . 67 101 131 135 139 146 154 1.8 1.8 1.6Unpaid life insurance premiums 3 . . . . 16 18 19 20 19 20 21 0.4 0.3 0.2
1 Includes loans made under home equity lines of credit and home equity loans secured by junior liens. 2 Not elsewhereclassified. 3 Includes deferred premiums.
Source: Board of Governors of the Federal Reserve System, ‘‘Federal Reserve Statistical Release, Z.1, Flow of FundsAccounts of the United States’’; published: 4 March 2004; <http://www.federalreserve.gov/releases/Z1/20040304/data.htm>.
No. 1164. Financial Debt Held by Families by Type of Debt: 1995 to 2001[Median debt in thousands of constant 2001 dollars (25.0 represents $25,000). See headnote, Table 1162]
Age of family headand family income Any debt
Home-secured
debt 1
Other resi-dential
property InstallmentCredit cardbalances 2
Other linesof credit Other debt 3
PERCENT OF FAMILIESHOLDING DEBTS
1995, total . . . . . . . . . . . . . 74.5 41.0 4.9 45.9 47.3 1.9 8.51998, total . . . . . . . . . . . . . 74.1 43.1 5.1 43.7 44.1 2.3 8.82001, total . . . . . . . . . . . . . 75.1 44.6 4.7 45.2 44.4 1.5 7.2
Under 35 years old . . . . . . . . . 82.7 35.7 2.7 63.8 49.6 1.7 8.835 to 44 years old . . . . . . . . . . 88.6 59.6 4.9 57.1 54.1 1.7 8.045 to 54 years old . . . . . . . . . . 84.6 59.8 6.5 45.9 50.4 1.5 7.455 to 64 years old . . . . . . . . . . 75.4 49.0 8.0 39.3 41.6 3.1 7.465 to 74 years old . . . . . . . . . . 56.8 32.0 3.4 21.1 30.0 (B) 5.075 years old and over . . . . . . . 29.2 9.5 2.0 9.5 18.4 (B) 3.6
Percentiles of income: 4
Less than 20 ($10,300) . . . . . 49.3 13.8 (B) 25.5 30.3 1.3 5.920-39.9 ($24,400) . . . . . . . . 70.2 27.0 1.8 43.2 44.5 1.5 5.640-59.9 ($39,900) . . . . . . . . 82.1 44.4 3.2 51.9 52.8 1.5 7.760-79.9 ($64,800) . . . . . . . . 85.6 61.8 5.4 56.7 52.6 1.5 7.780-89.9 ($98,700) . . . . . . . . 91.4 76.9 10.3 55.7 50.3 2.6 9.390-100 ($302,700) . . . . . . . . 85.3 75.4 14.9 41.2 33.1 1.4 8.8
MEDIAN DEBT 5
1995, total . . . . . . . . . . . . . 25.0 59.1 34.7 7.0 1.7 4.0 2.31998, total . . . . . . . . . . . . . 35.4 67.5 43.5 9.5 1.9 2.7 3.3
2001, total . . . . . . . . . . . . . 38.8 70.0 40.0 9.7 1.9 3.9 3.0Under 35 years old . . . . . . . . . 24.9 77.0 52.0 9.5 2.0 0.5 2.035 to 44 years old . . . . . . . . . . 61.5 80.0 45.5 11.1 2.0 0.7 3.145 to 54 years old . . . . . . . . . . 54.3 75.0 33.5 9.6 2.3 5.3 5.055 to 64 years old . . . . . . . . . . 34.6 55.0 40.0 9.0 1.9 20.5 5.065 to 74 years old . . . . . . . . . . 13.1 39.0 77.0 7.0 1.0 (B) 2.575 years old and over . . . . . . . 5.0 44.8 42.0 5.8 0.7 (B) 2.5
B Base figure too small. 1 First and second mortgages and home equity loans and lines of credit secured by the primaryresidence. 2 Families that had an outstanding balance on any of their credit cards after paying their most recent bills.3 Includes loans on insurance policies, loans against pension accounts, borrowing on margin accounts and unclassified loans.4 Value in parentheses represent median income for that percentile group. See footnote 8, Table 1162. 5 Median amount offinancial debt for families holding such debts.
No. 1165. Percent Distribution of Amount of Debt Held by Families:1998 and 2001
[See headnote, Table 1162]
Type of debt 1998 2001 Purpose of debt 1998 2001Type of lending
institution 1998 2001
Total . . . . . . . . . . . 100.0 100.0 Total . . . . . . . . . . 100.0 100.0 Total . . . . . . . . . . . . 100.0 100.0Home-secured debt. . . 71.3 75.1 Home purchase. . . . . 67.7 70.7 Commercial bank . . . . . 32.8 34.1Installment loans. . . . . 13.0 12.3 Home improvement . . 2.1 1.9 Savings and loan . . . . . 9.7 6.1Credit card balances . . 3.9 3.4 Investment, excluding Credit union . . . . . . . . . 4.2 5.5Other lines of credit. . . 0.3 0.5 real estate . . . . . . . 3.3 2.8 Finance or loan company. 4.2 4.3Other residential Vehicles . . . . . . . . . . 7.6 7.8 Brokerage . . . . . . . . . . 3.8 3.1property . . . . . . . . . 7.7 6.4 Goods and services . . 6.1 5.7 Real estate lender . . . . . 35.5 38.0
Other debt . . . . . . . . . 3.7 2.3 Other residential Individual lender . . . . . . 3.3 2.0property . . . . . . . . . 7.9 6.6 Other nonfinancial . . . . . 1.3 1.4
Education. . . . . . . . . 3.4 3.1 Government . . . . . . . . . 0.6 1.1Other loans . . . . . . . 1.9 1.4 Credit and store cards . . 3.9 3.7
Other loans . . . . . . . . . 0.7 0.8
Source of Tables 1164 and 1165: Board of Governors of the Federal Reserve System, Federal Reserve Bulletin, January 2003,and unpublished revisions.
Banking, Finance, and Insurance 739
U.S. Census Bureau, Statistical Abstract of the United States: 2004-2005
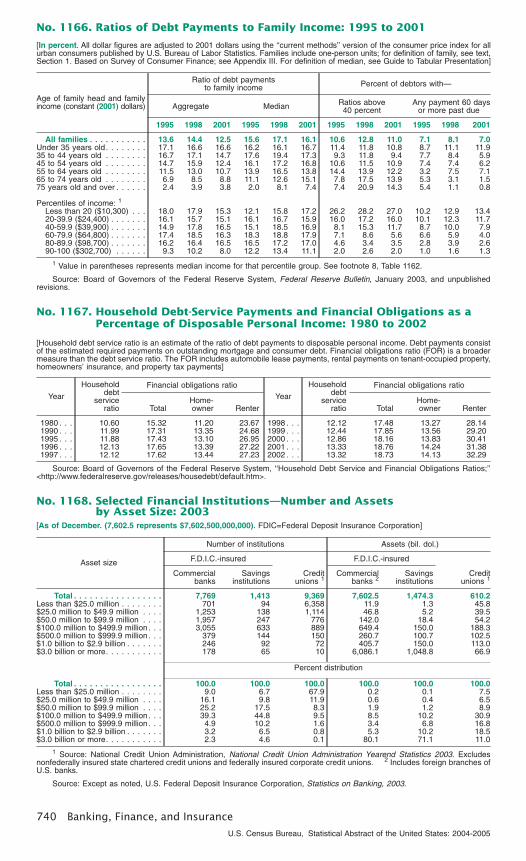
No. 1166. Ratios of Debt Payments to Family Income: 1995 to 2001
[In percent. All dollar figures are adjusted to 2001 dollars using the ‘‘current methods’’ version of the consumer price index for allurban consumers published by U.S. Bureau of Labor Statistics. Families include one-person units; for definition of family, see text,Section 1. Based on Survey of Consumer Finance; see Appendix III. For definition of median, see Guide to Tabular Presentation]
Age of family head and familyincome (constant (2001) dollars)
Ratio of debt paymentsto family income Percent of debtors with—
Aggregate Median Ratios above40 percent
Any payment 60 daysor more past due
1995 1998 2001 1995 1998 2001 1995 1998 2001 1995 1998 2001
All families . . . . . . . . . . . 13.6 14.4 12.5 15.6 17.1 16.1 10.6 12.8 11.0 7.1 8.1 7.0Under 35 years old . . . . . . . . 17.1 16.6 16.6 16.2 16.1 16.7 11.4 11.8 10.8 8.7 11.1 11.935 to 44 years old . . . . . . . . 16.7 17.1 14.7 17.6 19.4 17.3 9.3 11.8 9.4 7.7 8.4 5.945 to 54 years old . . . . . . . . 14.7 15.9 12.4 16.1 17.2 16.8 10.6 11.5 10.9 7.4 7.4 6.255 to 64 years old . . . . . . . . 11.5 13.0 10.7 13.9 16.5 13.8 14.4 13.9 12.2 3.2 7.5 7.165 to 74 years old . . . . . . . . 6.9 8.5 8.8 11.1 12.6 15.1 7.8 17.5 13.9 5.3 3.1 1.575 years old and over . . . . . . 2.4 3.9 3.8 2.0 8.1 7.4 7.4 20.9 14.3 5.4 1.1 0.8
Percentiles of income: 1
Less than 20 ($10,300) . . . 18.0 17.9 15.3 12.1 15.8 17.2 26.2 28.2 27.0 10.2 12.9 13.420-39.9 ($24,400) . . . . . . . 16.1 15.7 15.1 16.1 16.7 15.9 16.0 17.2 16.0 10.1 12.3 11.740-59.9 ($39,900) . . . . . . . 14.9 17.8 16.5 15.1 18.5 16.9 8.1 15.3 11.7 8.7 10.0 7.960-79.9 ($64,800) . . . . . . . 17.4 18.5 16.3 18.3 18.8 17.9 7.1 8.6 5.6 6.6 5.9 4.080-89.9 ($98,700) . . . . . . . 16.2 16.4 16.5 16.5 17.2 17.0 4.6 3.4 3.5 2.8 3.9 2.690-100 ($302,700) . . . . . . 9.3 10.2 8.0 12.2 13.4 11.1 2.0 2.6 2.0 1.0 1.6 1.3
1 Value in parentheses represents median income for that percentile group. See footnote 8, Table 1162.
Source: Board of Governors of the Federal Reserve System, Federal Reserve Bulletin, January 2003, and unpublishedrevisions.
No. 1167. Household Debt-Service Payments and Financial Obligations as aPercentage of Disposable Personal Income: 1980 to 2002
[Household debt service ratio is an estimate of the ratio of debt payments to disposable personal income. Debt payments consistof the estimated required payments on outstanding mortgage and consumer debt. Financial obligations ratio (FOR) is a broadermeasure than the debt service ratio. The FOR includes automobile lease payments, rental payments on tenant-occupied property,homeowners’ insurance, and property tax payments]
Year
Householddebt
serviceratio
Financial obligations ratio
TotalHome-owner Renter
1980 . . . 10.60 15.32 11.20 23.671990 . . . 11.99 17.31 13.35 24.681995 . . . 11.88 17.43 13.10 26.951996 . . . 12.13 17.65 13.39 27.221997 . . . 12.12 17.62 13.44 27.23
Year
Householddebt
serviceratio
Financial obligations ratio
TotalHome-owner Renter
1998 . . . 12.12 17.48 13.27 28.141999 . . . 12.44 17.85 13.56 29.202000 . . . 12.86 18.16 13.83 30.412001 . . . 13.33 18.76 14.24 31.382002 . . . 13.32 18.73 14.13 32.29
Source: Board of Governors of the Federal Reserve System, ‘‘Household Debt Service and Financial Obligations Ratios;’’<http://www.federalreserve.gov/releases/housedebt/default.htm>.
No. 1168. Selected Financial Institutions—Number and Assetsby Asset Size: 2003
[As of December. (7,602.5 represents $7,602,500,000,000). FDIC=Federal Deposit Insurance Corporation]
Asset size
Number of institutions Assets (bil. dol.)
F.D.I.C.-insured
Creditunions 1
F.D.I.C.-insured
Creditunions 1
Commercialbanks
Savingsinstitutions
Commercialbanks 2
Savingsinstitutions
Total . . . . . . . . . . . . . . . . . 7,769 1,413 9,369 7,602.5 1,474.3 610.2Less than $25.0 million . . . . . . . . 701 94 6,358 11.9 1.3 45.8$25.0 million to $49.9 million . . . . 1,253 138 1,114 46.8 5.2 39.5$50.0 million to $99.9 million . . . . 1,957 247 776 142.0 18.4 54.2$100.0 million to $499.9 million . . . 3,055 633 889 649.4 150.0 188.3$500.0 million to $999.9 million . . . 379 144 150 260.7 100.7 102.5$1.0 billion to $2.9 billion . . . . . . . 246 92 72 405.7 150.0 113.0$3.0 billion or more. . . . . . . . . . . 178 65 10 6,086.1 1,048.8 66.9
Percent distribution
Total . . . . . . . . . . . . . . . . . 100.0 100.0 100.0 100.0 100.0 100.0Less than $25.0 million . . . . . . . . 9.0 6.7 67.9 0.2 0.1 7.5$25.0 million to $49.9 million . . . . 16.1 9.8 11.9 0.6 0.4 6.5$50.0 million to $99.9 million . . . . 25.2 17.5 8.3 1.9 1.2 8.9$100.0 million to $499.9 million . . . 39.3 44.8 9.5 8.5 10.2 30.9$500.0 million to $999.9 million . . . 4.9 10.2 1.6 3.4 6.8 16.8$1.0 billion to $2.9 billion . . . . . . . 3.2 6.5 0.8 5.3 10.2 18.5$3.0 billion or more. . . . . . . . . . . 2.3 4.6 0.1 80.1 71.1 11.0
1 Source: National Credit Union Administration, National Credit Union Administration Yearend Statistics 2003. Excludesnonfederally insured state chartered credit unions and federally insured corporate credit unions. 2 Includes foreign branches ofU.S. banks.
Source: Except as noted, U.S. Federal Deposit Insurance Corporation, Statistics on Banking, 2003.
740 Banking, Finance, and Insurance
U.S. Census Bureau, Statistical Abstract of the United States: 2004-2005
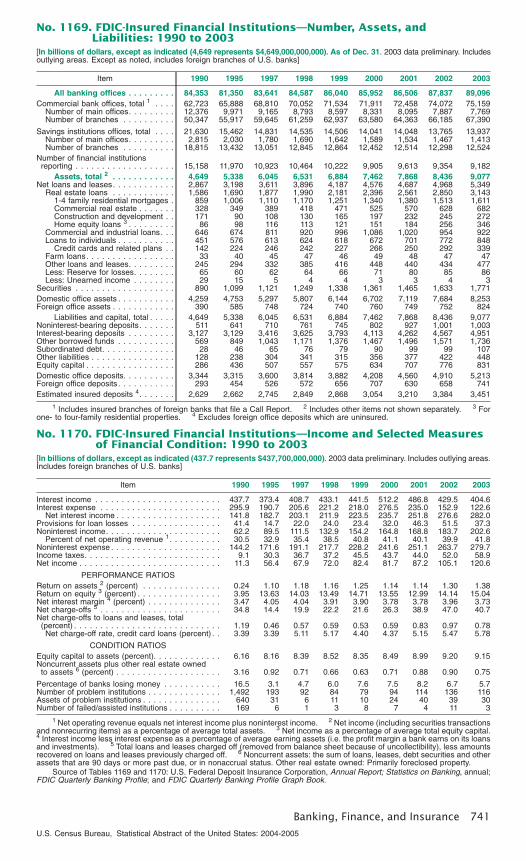
No. 1169. FDIC-Insured Financial Institutions—Number, Assets, andLiabilities: 1990 to 2003
[In billions of dollars, except as indicated (4,649 represents $4,649,000,000,000). As of Dec. 31. 2003 data preliminary. Includesoutlying areas. Except as noted, includes foreign branches of U.S. banks]
Item 1990 1995 1997 1998 1999 2000 2001 2002 2003
All banking offices . . . . . . . . . 84,353 81,350 83,641 84,587 86,040 85,952 86,506 87,837 89,096Commercial bank offices, total 1 . . . . 62,723 65,888 68,810 70,052 71,534 71,911 72,458 74,072 75,159
Number of main offices. . . . . . . . . 12,376 9,971 9,165 8,793 8,597 8,331 8,095 7,887 7,769Number of branches . . . . . . . . . . 50,347 55,917 59,645 61,259 62,937 63,580 64,363 66,185 67,390
Savings institutions offices, total . . . . 21,630 15,462 14,831 14,535 14,506 14,041 14,048 13,765 13,937Number of main offices. . . . . . . . . 2,815 2,030 1,780 1,690 1,642 1,589 1,534 1,467 1,413Number of branches . . . . . . . . . . 18,815 13,432 13,051 12,845 12,864 12,452 12,514 12,298 12,524
Number of financial institutionsreporting . . . . . . . . . . . . . . . . . . . 15,158 11,970 10,923 10,464 10,222 9,905 9,613 9,354 9,182
Assets, total 2 . . . . . . . . . . . . 4,649 5,338 6,045 6,531 6,884 7,462 7,868 8,436 9,077Net loans and leases. . . . . . . . . . . . 2,867 3,198 3,611 3,896 4,187 4,576 4,687 4,968 5,349
Real estate loans . . . . . . . . . . . . 1,586 1,690 1,877 1,990 2,181 2,396 2,561 2,850 3,1431-4 family residential mortgages . 859 1,006 1,110 1,170 1,251 1,340 1,380 1,513 1,611Commercial real estate . . . . . . . 328 349 389 418 471 525 570 628 682Construction and development . . 171 90 108 130 165 197 232 245 272Home equity loans 3 . . . . . . . . . 86 98 116 113 121 151 184 256 346
Commercial and industrial loans. . . 646 674 811 920 996 1,086 1,020 954 922Loans to individuals . . . . . . . . . . . 451 576 613 624 618 672 701 772 848
Credit cards and related plans . . 142 224 246 242 227 266 250 292 339Farm loans. . . . . . . . . . . . . . . . . 33 40 45 47 46 49 48 47 47Other loans and leases. . . . . . . . . 245 294 332 385 416 448 440 434 477Less: Reserve for losses. . . . . . . . 65 60 62 64 66 71 80 85 86Less: Unearned income . . . . . . . . 29 15 5 4 4 3 3 4 3
Securities . . . . . . . . . . . . . . . . . . . 890 1,099 1,121 1,249 1,338 1,361 1,465 1,633 1,771Domestic office assets . . . . . . . . . . . 4,259 4,753 5,297 5,807 6,144 6,702 7,119 7,684 8,253Foreign office assets . . . . . . . . . . . . 390 585 748 724 740 760 749 752 824
Liabilities and capital, total . . . . . 4,649 5,338 6,045 6,531 6,884 7,462 7,868 8,436 9,077Noninterest-bearing deposits. . . . . . . 511 641 710 761 745 802 927 1,001 1,003Interest-bearing deposits . . . . . . . . . 3,127 3,129 3,416 3,625 3,793 4,113 4,262 4,567 4,951Other borrowed funds . . . . . . . . . . . 569 849 1,043 1,171 1,376 1,467 1,496 1,571 1,736Subordinated debt. . . . . . . . . . . . . . 28 46 65 76 79 90 99 99 107Other liabilities . . . . . . . . . . . . . . . . 128 238 304 341 315 356 377 422 448Equity capital . . . . . . . . . . . . . . . . . 286 436 507 557 575 634 707 776 831Domestic office deposits. . . . . . . . . . 3,344 3,315 3,600 3,814 3,882 4,208 4,560 4,910 5,213Foreign office deposits . . . . . . . . . . . 293 454 526 572 656 707 630 658 741Estimated insured deposits 4. . . . . . . 2,629 2,662 2,745 2,849 2,868 3,054 3,210 3,384 3,451
1 Includes insured branches of foreign banks that file a Call Report. 2 Includes other items not shown separately. 3 Forone- to four-family residential properties. 4 Excludes foreign office deposits which are uninsured.
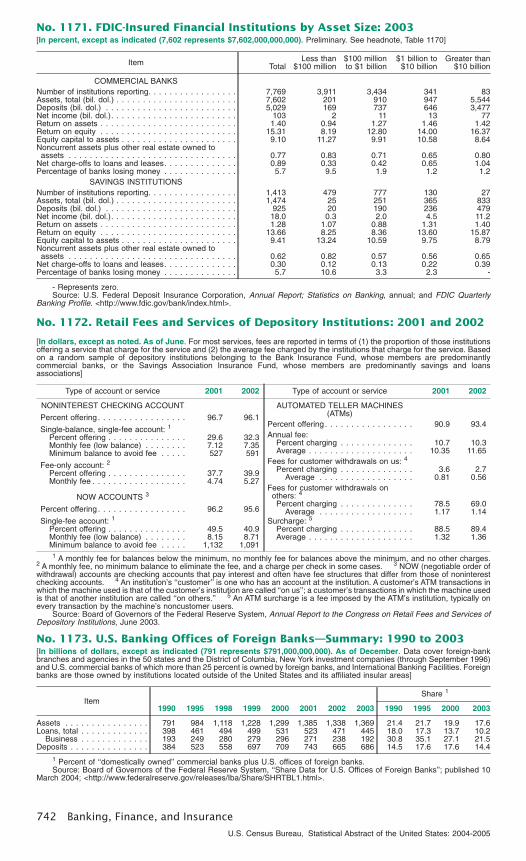
No. 1170. FDIC-Insured Financial Institutions—Income and Selected Measuresof Financial Condition: 1990 to 2003
[In billions of dollars, except as indicated (437.7 represents $437,700,000,000). 2003 data preliminary. Includes outlying areas.Includes foreign branches of U.S. banks]
Item 1990 1995 1997 1998 1999 2000 2001 2002 2003
Interest income . . . . . . . . . . . . . . . . . . . . . . . . 437.7 373.4 408.7 433.1 441.5 512.2 486.8 429.5 404.6Interest expense . . . . . . . . . . . . . . . . . . . . . . . 295.9 190.7 205.6 221.2 218.0 276.5 235.0 152.9 122.6
Net interest income . . . . . . . . . . . . . . . . . . . . 141.8 182.7 203.1 211.9 223.5 235.7 251.8 276.6 282.0Provisions for loan losses . . . . . . . . . . . . . . . . . 41.4 14.7 22.0 24.0 23.4 32.0 46.3 51.5 37.3Noninterest income. . . . . . . . . . . . . . . . . . . . . . 62.2 89.5 111.5 132.9 154.2 164.8 168.8 183.7 202.6
Percent of net operating revenue 1. . . . . . . . . . 30.5 32.9 35.4 38.5 40.8 41.1 40.1 39.9 41.8Noninterest expense . . . . . . . . . . . . . . . . . . . . . 144.2 171.6 191.1 217.7 228.2 241.6 251.1 263.7 279.7Income taxes. . . . . . . . . . . . . . . . . . . . . . . . . . 9.1 30.3 36.7 37.2 45.5 43.7 44.0 52.0 58.9Net income . . . . . . . . . . . . . . . . . . . . . . . . . . . 11.3 56.4 67.9 72.0 82.4 81.7 87.2 105.1 120.6
PERFORMANCE RATIOSReturn on assets 2 (percent) . . . . . . . . . . . . . . . 0.24 1.10 1.18 1.16 1.25 1.14 1.14 1.30 1.38Return on equity 3 (percent) . . . . . . . . . . . . . . . . 3.95 13.63 14.03 13.49 14.71 13.55 12.99 14.14 15.04Net interest margin 4 (percent) . . . . . . . . . . . . . . 3.47 4.05 4.04 3.91 3.90 3.78 3.78 3.96 3.73Net charge-offs 5 . . . . . . . . . . . . . . . . . . . . . . . 34.8 14.4 19.9 22.2 21.6 26.3 38.9 47.0 40.7Net charge-offs to loans and leases, total(percent) . . . . . . . . . . . . . . . . . . . . . . . . . . . . 1.19 0.46 0.57 0.59 0.53 0.59 0.83 0.97 0.78Net charge-off rate, credit card loans (percent) . . 3.39 3.39 5.11 5.17 4.40 4.37 5.15 5.47 5.78
CONDITION RATIOSEquity capital to assets (percent). . . . . . . . . . . . . 6.16 8.16 8.39 8.52 8.35 8.49 8.99 9.20 9.15Noncurrent assets plus other real estate ownedto assets 6 (percent) . . . . . . . . . . . . . . . . . . . . 3.16 0.92 0.71 0.66 0.63 0.71 0.88 0.90 0.75
Percentage of banks losing money . . . . . . . . . . . 16.5 3.1 4.7 6.0 7.6 7.5 8.2 6.7 5.7Number of problem institutions . . . . . . . . . . . . . . 1,492 193 92 84 79 94 114 136 116Assets of problem institutions . . . . . . . . . . . . . . . 640 31 6 11 10 24 40 39 30Number of failed/assisted institutions . . . . . . . . . . 169 6 1 3 8 7 4 11 3
1 Net operating revenue equals net interest income plus noninterest income. 2 Net income (including securities transactionsand nonrecurring items) as a percentage of average total assets. 3 Net income as a percentage of average total equity capital.4 Interest income less interest expense as a percentage of average earning assets (i.e. the profit margin a bank earns on its loansand investments). 5 Total loans and leases charged off (removed from balance sheet because of uncollectibility), less amountsrecovered on loans and leases previously charged off. 6 Noncurrent assets: the sum of loans, leases, debt securities and otherassets that are 90 days or more past due, or in nonaccrual status. Other real estate owned: Primarily foreclosed property.
Source of Tables 1169 and 1170: U.S. Federal Deposit Insurance Corporation, Annual Report; Statistics on Banking, annual;FDIC Quarterly Banking Profile; and FDIC Quarterly Banking Profile Graph Book.
Banking, Finance, and Insurance 741
U.S. Census Bureau, Statistical Abstract of the United States: 2004-2005
No. 1171. FDIC-Insured Financial Institutions by Asset Size: 2003[In percent, except as indicated (7,602 represents $7,602,000,000,000). Preliminary. See headnote, Table 1170]
Item TotalLess than
$100 million$100 millionto $1 billion
$1 billion to$10 billion
Greater than$10 billion
COMMERCIAL BANKSNumber of institutions reporting. . . . . . . . . . . . . . . . . 7,769 3,911 3,434 341 83Assets, total (bil. dol.) . . . . . . . . . . . . . . . . . . . . . . . 7,602 201 910 947 5,544Deposits (bil. dol.) . . . . . . . . . . . . . . . . . . . . . . . . . 5,029 169 737 646 3,477Net income (bil. dol.). . . . . . . . . . . . . . . . . . . . . . . . 103 2 11 13 77Return on assets . . . . . . . . . . . . . . . . . . . . . . . . . . 1.40 0.94 1.27 1.46 1.42Return on equity . . . . . . . . . . . . . . . . . . . . . . . . . . 15.31 8.19 12.80 14.00 16.37Equity capital to assets . . . . . . . . . . . . . . . . . . . . . . 9.10 11.27 9.91 10.58 8.64Noncurrent assets plus other real estate owned toassets . . . . . . . . . . . . . . . . . . . . . . . . . . . . . . . . 0.77 0.83 0.71 0.65 0.80
Net charge-offs to loans and leases. . . . . . . . . . . . . . 0.89 0.33 0.42 0.65 1.04Percentage of banks losing money . . . . . . . . . . . . . . 5.7 9.5 1.9 1.2 1.2
SAVINGS INSTITUTIONSNumber of institutions reporting. . . . . . . . . . . . . . . . . 1,413 479 777 130 27Assets, total (bil. dol.) . . . . . . . . . . . . . . . . . . . . . . . 1,474 25 251 365 833Deposits (bil. dol.) . . . . . . . . . . . . . . . . . . . . . . . . . 925 20 190 236 479Net income (bil. dol.). . . . . . . . . . . . . . . . . . . . . . . . 18.0 0.3 2.0 4.5 11.2Return on assets . . . . . . . . . . . . . . . . . . . . . . . . . . 1.28 1.07 0.88 1.31 1.40Return on equity . . . . . . . . . . . . . . . . . . . . . . . . . . 13.66 8.25 8.36 13.60 15.87Equity capital to assets . . . . . . . . . . . . . . . . . . . . . . 9.41 13.24 10.59 9.75 8.79Noncurrent assets plus other real estate owned toassets . . . . . . . . . . . . . . . . . . . . . . . . . . . . . . . . 0.62 0.82 0.57 0.56 0.65
Net charge-offs to loans and leases. . . . . . . . . . . . . . 0.30 0.12 0.13 0.22 0.39Percentage of banks losing money . . . . . . . . . . . . . . 5.7 10.6 3.3 2.3 -
- Represents zero.Source: U.S. Federal Deposit Insurance Corporation, Annual Report; Statistics on Banking, annual; and FDIC Quarterly
Banking Profile. <http://www.fdic.gov/bank/index.html>.
No. 1172. Retail Fees and Services of Depository Institutions: 2001 and 2002
[In dollars, except as noted. As of June. For most services, fees are reported in terms of (1) the proportion of those institutionsoffering a service that charge for the service and (2) the average fee charged by the institutions that charge for the service. Basedon a random sample of depository institutions belonging to the Bank Insurance Fund, whose members are predominantlycommercial banks, or the Savings Association Insurance Fund, whose members are predominantly savings and loansassociations]
Type of account or service 2001 2002
NONINTEREST CHECKING ACCOUNT
Percent offering . . . . . . . . . . . . . . . . . 96.7 96.1
Single-balance, single-fee account: 1
Percent offering . . . . . . . . . . . . . . . 29.6 32.3Monthly fee (low balance) . . . . . . . . 7.12 7.35Minimum balance to avoid fee . . . . . 527 591
Fee-only account: 2
Percent offering . . . . . . . . . . . . . . . 37.7 39.9Monthly fee . . . . . . . . . . . . . . . . . . 4.74 5.27
NOW ACCOUNTS 3
Percent offering . . . . . . . . . . . . . . . . . 96.2 95.6
Single-fee account: 1
Percent offering . . . . . . . . . . . . . . . 49.5 40.9Monthly fee (low balance) . . . . . . . . 8.15 8.71Minimum balance to avoid fee . . . . . 1,132 1,091
Type of account or service 2001 2002
AUTOMATED TELLER MACHINES(ATMs)
Percent offering . . . . . . . . . . . . . . . . . 90.9 93.4Annual fee:
Percent charging . . . . . . . . . . . . . . 10.7 10.3Average . . . . . . . . . . . . . . . . . . . . 10.35 11.65
Fees for customer withdrawals on us: 4
Percent charging . . . . . . . . . . . . . . 3.6 2.7Average . . . . . . . . . . . . . . . . . . 0.81 0.56
Fees for customer withdrawals onothers: 4
Percent charging . . . . . . . . . . . . . . 78.5 69.0Average . . . . . . . . . . . . . . . . . . 1.17 1.14
Surcharge: 5
Percent charging . . . . . . . . . . . . . . 88.5 89.4Average . . . . . . . . . . . . . . . . . . . . 1.32 1.36
1 A monthly fee for balances below the minimum, no monthly fee for balances above the minimum, and no other charges.2 A monthly fee, no minimum balance to eliminate the fee, and a charge per check in some cases. 3 NOW (negotiable order ofwithdrawal) accounts are checking accounts that pay interest and often have fee structures that differ from those of noninterestchecking accounts. 4 An institution’s ‘‘customer’’ is one who has an account at the institution. A customer’s ATM transactions inwhich the machine used is that of the customer’s institution are called ‘‘on us’’; a customer’s transactions in which the machine usedis that of another institution are called ‘‘on others.’’ 5 An ATM surcharge is a fee imposed by the ATM’s institution, typically onevery transaction by the machine’s noncustomer users.
Source: Board of Governors of the Federal Reserve System, Annual Report to the Congress on Retail Fees and Services ofDepository Institutions, June 2003.
No. 1173. U.S. Banking Offices of Foreign Banks—Summary: 1990 to 2003[In billions of dollars, except as indicated (791 represents $791,000,000,000). As of December. Data cover foreign-bankbranches and agencies in the 50 states and the District of Columbia, New York investment companies (through September 1996)and U.S. commercial banks of which more than 25 percent is owned by foreign banks, and International Banking Facilities. Foreignbanks are those owned by institutions located outside of the United States and its affiliated insular areas]
Item1990 1995 1998 1999 2000 2001 2002 2003
Share 1
1990 1995 2000 2003
Assets . . . . . . . . . . . . . . . . 791 984 1,118 1,228 1,299 1,385 1,338 1,369 21.4 21.7 19.9 17.6Loans, total . . . . . . . . . . . . . 398 461 494 499 531 523 471 445 18.0 17.3 13.7 10.2
Business . . . . . . . . . . . . . 193 249 280 279 296 271 238 192 30.8 35.1 27.1 21.5Deposits . . . . . . . . . . . . . . . 384 523 558 697 709 743 665 686 14.5 17.6 17.6 14.4
1 Percent of ‘‘domestically owned’’ commercial banks plus U.S. offices of foreign banks.Source: Board of Governors of the Federal Reserve System, ‘‘Share Data for U.S. Offices of Foreign Banks’’; published 10
March 2004; <http://www.federalreserve.gov/releases/Iba/Share/SHRTBL1.html>.
742 Banking, Finance, and Insurance
U.S. Census Bureau, Statistical Abstract of the United States: 2004-2005
No. 1174. FDIC-Insured Financial Institutions—Number and Assets by State:2003
[In billions of dollars, except as indicated (9,076.8 represents $9,076,800,000,000). As of Dec. 31. Information is obtainedprimarily from the Federal Financial Institutions Examination Council (FFIEC) Call Reports and the Office of Thrift Supervision’sThrift Financial Reports. Data are based on the location of each reporting institution’s main office. Reported data may includeassets located outside of the reporting institution’s home state]
State Numberof insti-tutions
Assets by asset size of bank
Total
Lessthan
$1 bil.
$1 bil.to
$10 bil.
Greaterthan
$10 bil.
Total . . . . 9,182 9,076.8 1,386.2 1,312.6 6,377.9
AL . . . . . . . 162 214.8 23.5 5.3 185.9AK . . . . . . . 7 3.9 1.7 2.2 -AZ . . . . . . . 50 60.7 6.8 5.5 48.5AR . . . . . . . 170 38.2 27.5 10.7 -CA . . . . . . . 318 962.9 62.1 130.0 770.8CO . . . . . . . 180 35.3 26.5 8.8 -CT . . . . . . . 63 55.9 15.5 14.3 26.1DE . . . . . . . 34 216.2 4.5 29.5 182.2DC . . . . . . . 5 0.8 0.8 - -FL . . . . . . . 304 110.7 55.0 55.7 -GA . . . . . . . 345 214.1 53.3 36.3 124.5HI. . . . . . . . 8 31.9 0.9 31.0 -ID. . . . . . . . 18 4.7 4.7 - -IL . . . . . . . . 769 575.5 115.0 68.6 391.8IN. . . . . . . . 206 117.4 37.6 37.3 42.5IA. . . . . . . . 422 55.9 44.5 11.4 -KS . . . . . . . 380 53.1 35.0 18.1 -KY . . . . . . . 243 47.5 32.2 15.2 -LA . . . . . . . 170 53.7 23.7 11.5 18.5ME . . . . . . . 40 40.3 12.2 1.6 26.4MD . . . . . . . 122 42.7 23.7 19.0 -MA . . . . . . . 209 214.2 52.6 52.8 108.7MI . . . . . . . 178 197.4 30.8 19.8 146.7MN . . . . . . . 486 108.7 44.6 3.9 60.2MS . . . . . . . 103 40.1 14.8 14.9 10.3MO. . . . . . . 377 86.8 47.2 27.6 12.1MT . . . . . . . 80 13.5 9.7 3.9 -NE . . . . . . . 270 45.6 22.0 11.4 12.2
State Numberof insti-tutions
Assets by asset size of bank
Total
Lessthan
$1 bil.
$1 bil.to
$10 bil.
Greaterthan
$10 bil.
NV . . . . . . . 37 59.2 6.9 33.4 19.0NH . . . . . . . 31 29.7 7.1 8.8 13.8NJ . . . . . . . 146 152.2 31.4 76.5 44.3NM . . . . . . . 60 20.5 8.6 12.0 -NY . . . . . . . 206 1,733.6 42.7 125.5 1,565.4NC . . . . . . . 104 1,101.9 25.6 6.8 1,069.5ND . . . . . . . 104 20.8 10.5 10.3 -OH . . . . . . . 304 648.2 46.2 35.8 566.2OK . . . . . . . 278 56.8 27.3 18.4 11.1OR . . . . . . . 38 21.4 6.7 14.7 -PA . . . . . . . 270 297.1 61.1 69.3 166.7RI. . . . . . . . 15 216.5 2.5 11.5 202.5SC . . . . . . . 97 40.7 14.4 26.3 -SD . . . . . . . 94 85.4 13.2 15.7 56.5TN . . . . . . . 208 118.6 35.1 4.8 78.7TX . . . . . . . 698 200.2 87.2 82.0 31.0UT . . . . . . . 64 150.9 10.3 8.1 132.6VT . . . . . . . 19 7.5 4.5 3.0 -VA . . . . . . . 141 181.6 33.9 12.8 134.9WA . . . . . . . 100 78.4 21.9 27.2 29.3WV. . . . . . . 74 19.0 9.7 9.3 -WI . . . . . . . 311 109.4 44.1 22.6 42.7WY. . . . . . . 46 5.6 5.6 - -
AS . . . . . . . 1 0.1 0.1 - -GU . . . . . . . 3 0.9 0.9 - -FM . . . . . . . 1 0.1 0.1 - -PR . . . . . . . 11 78.1 0.6 31.3 46.2VI . . . . . . . . 2 0.1 0.1 - -
- Represents zero.
Source: U.S. Federal Deposit Insurance Corporation, Statistics on Banking, annual.
No. 1175. FDIC-Insured Financial Institutions—Number of Offices andDeposits by State: 2003
[As of June 30 (5,132.1 represents $5,132,100,000,000). Includes insured U.S. branches of foreign banks. The term ‘‘offices’’includes both main offices and branches. ‘‘Banking office’’ is defined to include all offices and facilities that actually hold deposits,and does not include loan production offices, computer centers, and other nondeposit installations, such as automated tellermachines (ATMs). Several institutions have designated home offices that do not accept deposits; these have been included toprovide a more complete listing of all offices. The figures for each geographical area only include deposits of offices located withinthat area. Based on the Summary of Deposits survey]
State or otherarea Number of
offices
Totaldeposits(bil. dol.)
Total . . 87,792 5,132.1U.S. . . . . 87,151 5,087.9
AL . . . . . . . 1,431 60.3AK . . . . . . . 129 5.7AZ . . . . . . . 993 56.0AR . . . . . . . 1,302 37.7CA . . . . . . . 6,318 614.7CO . . . . . . . 1,345 61.1CT . . . . . . . 1,175 69.6DE . . . . . . . 246 96.8DC . . . . . . . 193 15.6FL . . . . . . . 4,732 268.2GA . . . . . . . 2,476 124.9HI. . . . . . . . 297 21.2ID. . . . . . . . 468 12.6IL . . . . . . . . 4,167 281.8IN. . . . . . . . 2,215 80.3IA. . . . . . . . 1,519 52.1KS . . . . . . . 1,461 44.9KY . . . . . . . 1,703 56.1
State or otherarea Number of
offices
Totaldeposits(bil. dol.)
LA . . . . . . . 1,511 52.6ME . . . . . . . 507 16.1MD . . . . . . . 1,689 77.9MA . . . . . . . 2,090 172.4MI . . . . . . . 2,975 137.1MN . . . . . . . 1,682 97.4MS . . . . . . . 1,113 32.9MO. . . . . . . 2,153 91.6MT . . . . . . . 360 11.3NE . . . . . . . 970 31.5NV . . . . . . . 445 31.9NH . . . . . . . 418 29.7NJ . . . . . . . 3,102 196.3NM . . . . . . . 486 16.7NY . . . . . . . 4,655 580.7NC . . . . . . . 2,462 147.0ND . . . . . . . 412 11.0OH . . . . . . . 3,915 211.0OK . . . . . . . 1,223 44.3OR . . . . . . . 999 37.3PA . . . . . . . 4,606 208.0
State or otherarea Number of
offices
Totaldeposits(bil. dol.)
RI. . . . . . . . 230 17.8SC . . . . . . . 1,261 44.9SD . . . . . . . 444 15.7TN . . . . . . . 2,029 86.7TX . . . . . . . 5,145 297.3UT . . . . . . . 574 85.0VT . . . . . . . 265 8.8VA . . . . . . . 2,429 129.7WA . . . . . . . 1,784 81.5WV. . . . . . . 642 22.3WI . . . . . . . 2,201 95.9WY. . . . . . . 204 7.8
AS . . . . . 5 0.1GU . . . . . 36 1.7MH . . . . . 3 (Z)FM . . . . . 6 0.1MP . . . . . 12 0.5PW . . . . . 3 0.1PR . . . . . 553 40.3VI . . . . . . 23 1.3
Z Less than $50 million.
Source: U.S. Federal Deposit Insurance Corporation, Bank and Thrift Branch Office Data Book, annual.
Banking, Finance, and Insurance 743
U.S. Census Bureau, Statistical Abstract of the United States: 2004-2005
No. 1176. Federal and State-Chartered Credit Unions—Summary: 1990 to 2003
[Except as noted, as of December 31 (36,241 represents 36,241,000).. Federal data include District of Columbia, Puerto Rico,Guam, and Virgin Islands. Excludes state-insured, privately-insured, and noninsured state-chartered credit unions and corporatecentral credit unions which have mainly other credit unions as members]
YearOperating credit
unionsNumberof failed
institu-tions 1
Members(1,000)
Assets(mil. dol.)
Loansoutstanding(mil. dol.)
Savings(mil. dol.)
Federal State Federal State Federal State Federal State Federal State
1990 . . . 8,511 4,349 164 36,241 19,454 130,073 68,133 83,029 44,102 117,892 62,0821995 . . . 7,329 4,358 26 42,163 24,927 193,781 112,860 120,514 71,606 170,300 99,8381996 . . . 7,152 4,240 19 43,546 25,652 206,695 120,193 134,127 79,661 180,969 105,7431997 . . . 6,981 4,257 16 43,491 27,921 215,104 136,074 140,104 92,117 187,822 119,3591998 . . . 6,814 4,181 17 43,865 29,674 231,890 156,811 144,849 100,890 202,651 137,3481999 . . . 6,566 4,062 23 44,076 31,308 239,316 172,086 155,578 116,366 207,614 149,3052000 . . . 6,336 3,980 29 43,883 33,705 242,881 195,363 163,851 137,485 210,188 169,0532001 . . . 6,118 3,866 22 43,817 35,560 270,123 231,432 170,326 152,112 235,201 201,9232002 . . . 5,953 3,735 15 44,600 36,300 301,238 255,837 181,768 160,881 261,819 222,3722003 . . . 5,776 3,593 13 46,153 36,287 336,611 273,572 202,898 173,236 291,484 236,856
1 1990 for year ending September 30; 1995 reflects 15-month period from October 1994 through December 1995; beginning1996 reflects calendar year. A failed institution is defined as a credit union which has ceased operation because it was involuntarilyliquidated or merged with assistance from the National Credit Union Share Insurance Fund.
Source: National Credit Union Administration, Annual Report of the National Credit Union Administration, and unpublisheddata.
No. 1177. Mortgage Debt Outstanding by Type of Property and Holder:1990 to 2003
[In billions of dollars (3,808 represents $3,808,000,000,000). As of Dec. 31. Includes Puerto Rico and Guam]
Type of property and holder 1990 1994 1995 1996 1997 1998 1999 2000 2001 2002 2003
Mortgage debt, total. . . . . . . . . . . 3,808 4,381 4,577 4,864 5,202 5,712 6,315 6,883 7,582 8,463 9,477
Residential nonfarm . . . . . . . . . . . . . . . . . 2,908 3,571 3,754 4,008 4,280 4,694 5,156 5,606 6,184 6,951 7,829One- to four-family homes. . . . . . . . . . . . 2,620 3,301 3,478 3,720 3,979 4,363 4,787 5,205 5,739 6,463 7,292
Savings institutions. . . . . . . . . . . . . . . 600 478 482 514 521 534 548 594 621 631 703Mortgage pools or trusts 1 . . . . . . . . . . 1,046 1,656 1,768 1,935 2,099 2,375 2,690 2,925 3,340 3,755 4,223
Government National MortgageAssociation . . . . . . . . . . . . . . . . . 392 441 461 494 523 522 565 593 569 512 445
Federal Home Loan Mortgage Corp . . 308 488 512 552 577 643 745 817 941 1,073 1,148Federal National Mortgage Assoc . . . 291 521 570 633 688 804 925 1,016 1,238 1,479 1,787Private mortgage conduits 2 . . . . . . . 55 206 224 256 311 405 455 500 591 692 843
Commercial banks . . . . . . . . . . . . . . . 430 590 647 678 746 797 880 966 1,024 1,222 1,347Individuals and others 3. . . . . . . . . . . . 377 341 343 367 393 432 456 492 507 558 635Federal and related agencies 4 . . . . . . . 153 228 229 220 213 218 208 223 242 291 380
Farmers Home Administration . . . . . . 19 18 18 17 17 17 17 16 16 15 14Federal National Mortgage Assoc . . . 94 159 164 155 150 148 141 144 155 176 215Federal Home Loan MortgageCorporation . . . . . . . . . . . . . . . . . 19 39 40 42 43 49 44 43 40 36 34
Life insurance companies . . . . . . . . . . 13 9 9 7 7 7 6 5 5 5 4Five or more units . . . . . . . . . . . . . . . . . 288 270 276 288 301 331 368 401 445 488 537
Nonfarm, nonresidential . . . . . . . . . . . . . . . 821 727 739 769 832 921 1,057 1,168 1,281 1,387 1,516Farm . . . . . . . . . . . . . . . . . . . . . . . . . . . 79 83 85 87 90 97 103 109 116 125 132
TYPE OF HOLDER
Savings institutions . . . . . . . . . . . . . . . . . . 802 596 597 628 632 644 668 723 758 781 871Commercial banks . . . . . . . . . . . . . . . . . . 849 1,013 1,090 1,145 1,245 1,337 1,495 1,660 1,790 2,058 2,256Life insurance companies. . . . . . . . . . . . . . 268 216 213 208 207 214 231 236 243 250 260Individuals and others 3 . . . . . . . . . . . . . . . 562 515 520 550 600 644 655 697 717 776 867
Mortgage pools or trusts 1 . . . . . . . . . . . . . 1,088 1,726 1,849 2,038 2,232 2,581 2,947 3,226 3,701 4,161 4,692Government National Mortgage Assoc. . . . 404 451 472 506 537 537 582 612 591 538 474Federal Home Loan Mortgage Corp . . . . . 316 491 515 554 579 646 749 822 948 1,082 1,157Federal National Mortgage Association . . . 300 530 583 651 710 835 961 1,058 1,290 1,538 1,857Private mortgage conduits. . . . . . . . . . . . 68 254 279 326 407 562 654 734 870 1,003 1,203
Federal and related agencies 4 . . . . . . . . . . 239 316 308 294 285 292 320 341 373 436 532Federal National Mortgage Association . . . 105 174 178 168 160 156 149 153 166 189 235Farmers Home Administration . . . . . . . . . 41 42 42 42 41 41 74 73 72 72 70Federal Land Banks. . . . . . . . . . . . . . . . 29 29 28 30 31 33 34 36 41 46 50Federal Home Loan Mortgage Corp . . . . . 22 42 44 47 48 57 57 59 63 64 60Federal Housing and Veterans Admin . . . . 9 11 10 6 4 4 4 4 3 4 4Resolution Trust Corporation . . . . . . . . . . 33 10 2 (X) (X) (X) (X) (X) (X) (X) (X)Federal Home Loan Bank . . . . . . . . . . . . - - - - (Z) 1 2 16 28 61 113
- Represents zero. X Not applicable. Z Less than $500 million. 1 Outstanding principal balances of mortgage poolsbacking securities insured or guaranteed by the agency indicated. Includes other pools not shown separately. 2 Includessecuritized home equity loans. 3 Includes mortgage companies, real estate investment trusts, state and local retirement funds,noninsured pension funds, state and local credit agencies, credit unions, and finance companies. 4 Includes other agencies notshown separately.
Source: Board of Governors of the Federal Reserve System, Statistical Supplement to the Federal Reserve Bulletin, monthly.
744 Banking, Finance, and Insurance
U.S. Census Bureau, Statistical Abstract of the United States: 2004-2005
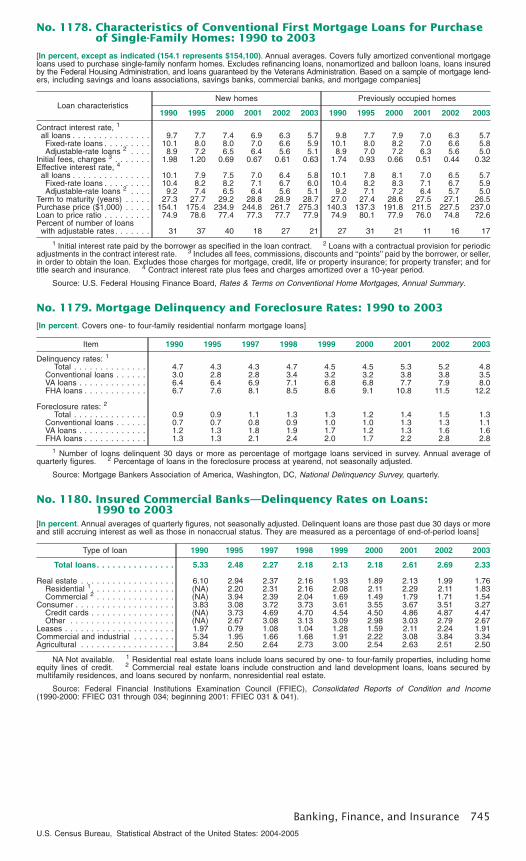
No. 1178. Characteristics of Conventional First Mortgage Loans for Purchaseof Single-Family Homes: 1990 to 2003
[In percent, except as indicated (154.1 represents $154,100). Annual averages. Covers fully amortized conventional mortgageloans used to purchase single-family nonfarm homes. Excludes refinancing loans, nonamortized and balloon loans, loans insuredby the Federal Housing Administration, and loans guaranteed by the Veterans Administration. Based on a sample of mortgage lend-ers, including savings and loans associations, savings banks, commercial banks, and mortgage companies]
Loan characteristicsNew homes Previously occupied homes
1990 1995 2000 2001 2002 2003 1990 1995 2000 2001 2002 2003
Contract interest rate, 1
all loans . . . . . . . . . . . . . . . 9.7 7.7 7.4 6.9 6.3 5.7 9.8 7.7 7.9 7.0 6.3 5.7Fixed-rate loans . . . . . . . . . 10.1 8.0 8.0 7.0 6.6 5.9 10.1 8.0 8.2 7.0 6.6 5.8Adjustable-rate loans 2 . . . . 8.9 7.2 6.5 6.4 5.6 5.1 8.9 7.0 7.2 6.3 5.6 5.0
Initial fees, charges 3 . . . . . . . 1.98 1.20 0.69 0.67 0.61 0.63 1.74 0.93 0.66 0.51 0.44 0.32Effective interest rate, 4
all loans . . . . . . . . . . . . . . . 10.1 7.9 7.5 7.0 6.4 5.8 10.1 7.8 8.1 7.0 6.5 5.7Fixed-rate loans . . . . . . . . . 10.4 8.2 8.2 7.1 6.7 6.0 10.4 8.2 8.3 7.1 6.7 5.9Adjustable-rate loans 2 . . . . 9.2 7.4 6.5 6.4 5.6 5.1 9.2 7.1 7.2 6.4 5.7 5.0
Term to maturity (years) . . . . . 27.3 27.7 29.2 28.8 28.9 28.7 27.0 27.4 28.6 27.5 27.1 26.5Purchase price ($1,000) . . . . . 154.1 175.4 234.9 244.8 261.7 275.3 140.3 137.3 191.8 211.5 227.5 237.0Loan to price ratio . . . . . . . . . 74.9 78.6 77.4 77.3 77.7 77.9 74.9 80.1 77.9 76.0 74.8 72.6Percent of number of loanswith adjustable rates. . . . . . . 31 37 40 18 27 21 27 31 21 11 16 17
1 Initial interest rate paid by the borrower as specified in the loan contract. 2 Loans with a contractual provision for periodicadjustments in the contract interest rate. 3 Includes all fees, commissions, discounts and ‘‘points’’ paid by the borrower, or seller,in order to obtain the loan. Excludes those charges for mortgage, credit, life or property insurance; for property transfer; and fortitle search and insurance. 4 Contract interest rate plus fees and charges amortized over a 10-year period.
Source: U.S. Federal Housing Finance Board, Rates & Terms on Conventional Home Mortgages, Annual Summary.
No. 1179. Mortgage Delinquency and Foreclosure Rates: 1990 to 2003
[In percent. Covers one- to four-family residential nonfarm mortgage loans]
Item 1990 1995 1997 1998 1999 2000 2001 2002 2003
Delinquency rates: 1
Total . . . . . . . . . . . . . . 4.7 4.3 4.3 4.7 4.5 4.5 5.3 5.2 4.8Conventional loans . . . . . . 3.0 2.8 2.8 3.4 3.2 3.2 3.8 3.8 3.5VA loans . . . . . . . . . . . . . 6.4 6.4 6.9 7.1 6.8 6.8 7.7 7.9 8.0FHA loans . . . . . . . . . . . . 6.7 7.6 8.1 8.5 8.6 9.1 10.8 11.5 12.2
Foreclosure rates: 2
Total . . . . . . . . . . . . . . 0.9 0.9 1.1 1.3 1.3 1.2 1.4 1.5 1.3Conventional loans . . . . . . 0.7 0.7 0.8 0.9 1.0 1.0 1.3 1.3 1.1VA loans . . . . . . . . . . . . . 1.2 1.3 1.8 1.9 1.7 1.2 1.3 1.6 1.6FHA loans . . . . . . . . . . . . 1.3 1.3 2.1 2.4 2.0 1.7 2.2 2.8 2.8
1 Number of loans delinquent 30 days or more as percentage of mortgage loans serviced in survey. Annual average ofquarterly figures. 2 Percentage of loans in the foreclosure process at yearend, not seasonally adjusted.
Source: Mortgage Bankers Association of America, Washington, DC, National Delinquency Survey, quarterly.
No. 1180. Insured Commercial Banks—Delinquency Rates on Loans:1990 to 2003
[In percent. Annual averages of quarterly figures, not seasonally adjusted. Delinquent loans are those past due 30 days or moreand still accruing interest as well as those in nonaccrual status. They are measured as a percentage of end-of-period loans]
Type of loan 1990 1995 1997 1998 1999 2000 2001 2002 2003
Total loans. . . . . . . . . . . . . . . 5.33 2.48 2.27 2.18 2.13 2.18 2.61 2.69 2.33
Real estate . . . . . . . . . . . . . . . . . . 6.10 2.94 2.37 2.16 1.93 1.89 2.13 1.99 1.76Residential 1 . . . . . . . . . . . . . . . . (NA) 2.20 2.31 2.16 2.08 2.11 2.29 2.11 1.83Commercial 2 . . . . . . . . . . . . . . . (NA) 3.94 2.39 2.04 1.69 1.49 1.79 1.71 1.54
Consumer . . . . . . . . . . . . . . . . . . . 3.83 3.08 3.72 3.73 3.61 3.55 3.67 3.51 3.27Credit cards . . . . . . . . . . . . . . . . (NA) 3.73 4.69 4.70 4.54 4.50 4.86 4.87 4.47Other . . . . . . . . . . . . . . . . . . . . (NA) 2.67 3.08 3.13 3.09 2.98 3.03 2.79 2.67
Leases . . . . . . . . . . . . . . . . . . . . . 1.97 0.79 1.08 1.04 1.28 1.59 2.11 2.24 1.91Commercial and industrial . . . . . . . . 5.34 1.95 1.66 1.68 1.91 2.22 3.08 3.84 3.34Agricultural . . . . . . . . . . . . . . . . . . 3.84 2.50 2.64 2.73 3.00 2.54 2.63 2.51 2.50
NA Not available. 1 Residential real estate loans include loans secured by one- to four-family properties, including homeequity lines of credit. 2 Commercial real estate loans include construction and land development loans, loans secured bymultifamily residences, and loans secured by nonfarm, nonresidential real estate.
Source: Federal Financial Institutions Examination Council (FFIEC), Consolidated Reports of Condition and Income(1990-2000: FFIEC 031 through 034; beginning 2001: FFIEC 031 & 041).
Banking, Finance, and Insurance 745
U.S. Census Bureau, Statistical Abstract of the United States: 2004-2005
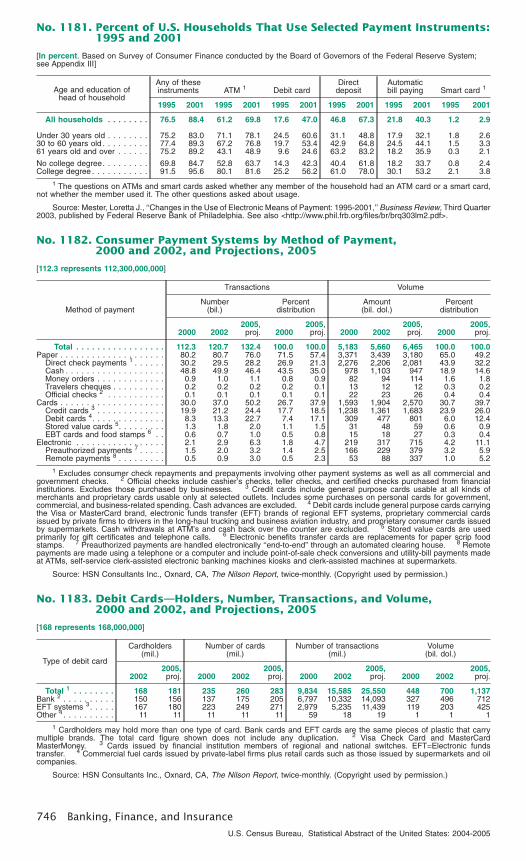
No. 1181. Percent of U.S. Households That Use Selected Payment Instruments:1995 and 2001
[In percent. Based on Survey of Consumer Finance conducted by the Board of Governors of the Federal Reserve System;see Appendix III]
Age and education ofhead of household
Any of theseinstruments ATM 1 Debit card
Directdeposit
Automaticbill paying Smart card 1
1995 2001 1995 2001 1995 2001 1995 2001 1995 2001 1995 2001
All households . . . . . . . . 76.5 88.4 61.2 69.8 17.6 47.0 46.8 67.3 21.8 40.3 1.2 2.9
Under 30 years old . . . . . . . . 75.2 83.0 71.1 78.1 24.5 60.6 31.1 48.8 17.9 32.1 1.8 2.630 to 60 years old . . . . . . . . . 77.4 89.3 67.2 76.8 19.7 53.4 42.9 64.8 24.5 44.1 1.5 3.361 years old and over . . . . . . 75.2 89.2 43.1 48.9 9.6 24.6 63.2 83.2 18.2 35.9 0.3 2.1
No college degree. . . . . . . . . 69.8 84.7 52.8 63.7 14.3 42.3 40.4 61.8 18.2 33.7 0.8 2.4College degree . . . . . . . . . . . 91.5 95.6 80.1 81.6 25.2 56.2 61.0 78.0 30.1 53.2 2.1 3.8
1 The questions on ATMs and smart cards asked whether any member of the household had an ATM card or a smart card,not whether the member used it. The other questions asked about usage.
Source: Mester, Loretta J., ‘‘Changes in the Use of Electronic Means of Payment: 1995-2001,’’ Business Review, Third Quarter2003, published by Federal Reserve Bank of Philadelphia. See also <http://www.phil.frb.org/files/br/brq303lm2.pdf>.
No. 1182. Consumer Payment Systems by Method of Payment,2000 and 2002, and Projections, 2005
[112.3 represents 112,300,000,000]
Method of payment
Transactions Volume
Number(bil.)
Percentdistribution
Amount(bil. dol.)
Percentdistribution
2000 20022005,
proj. 20002005,
proj. 2000 20022005,
proj. 20002005,
proj.
Total . . . . . . . . . . . . . . . . . 112.3 120.7 132.4 100.0 100.0 5,183 5,660 6,465 100.0 100.0Paper . . . . . . . . . . . . . . . . . . . . 80.2 80.7 76.0 71.5 57.4 3,371 3,439 3,180 65.0 49.2
Direct check payments 1 . . . . . . 30.2 29.5 28.2 26.9 21.3 2,276 2,206 2,081 43.9 32.2Cash . . . . . . . . . . . . . . . . . . . 48.8 49.9 46.4 43.5 35.0 978 1,103 947 18.9 14.6Money orders . . . . . . . . . . . . . 0.9 1.0 1.1 0.8 0.9 82 94 114 1.6 1.8Travelers cheques . . . . . . . . . . 0.2 0.2 0.2 0.2 0.1 13 12 12 0.3 0.2Official checks 2 . . . . . . . . . . . 0.1 0.1 0.1 0.1 0.1 22 23 26 0.4 0.4
Cards . . . . . . . . . . . . . . . . . . . . 30.0 37.0 50.2 26.7 37.9 1,593 1,904 2,570 30.7 39.7Credit cards 3 . . . . . . . . . . . . . 19.9 21.2 24.4 17.7 18.5 1,238 1,361 1,683 23.9 26.0Debit cards 4. . . . . . . . . . . . . . 8.3 13.3 22.7 7.4 17.1 309 477 801 6.0 12.4Stored value cards 5. . . . . . . . . 1.3 1.8 2.0 1.1 1.5 31 48 59 0.6 0.9EBT cards and food stamps 6 . . 0.6 0.7 1.0 0.5 0.8 15 18 27 0.3 0.4
Electronic . . . . . . . . . . . . . . . . . 2.1 2.9 6.3 1.8 4.7 219 317 715 4.2 11.1Preauthorized payments 7 . . . . . 1.5 2.0 3.2 1.4 2.5 166 229 379 3.2 5.9Remote payments 8 . . . . . . . . . 0.5 0.9 3.0 0.5 2.3 53 88 337 1.0 5.2
1 Excludes consumer check repayments and prepayments involving other payment systems as well as all commercial andgovernment checks. 2 Official checks include cashier’s checks, teller checks, and certified checks purchased from financialinstitutions. Excludes those purchased by businesses. 3 Credit cards include general purpose cards usable at all kinds ofmerchants and proprietary cards usable only at selected outlets. Includes some purchases on personal cards for government,commercial, and business-related spending. Cash advances are excluded. 4 Debit cards include general purpose cards carryingthe Visa or MasterCard brand, electronic funds transfer (EFT) brands of regional EFT systems, proprietary commercial cardsissued by private firms to drivers in the long-haul trucking and business aviation industry, and proprietary consumer cards issuedby supermarkets. Cash withdrawals at ATM’s and cash back over the counter are excluded. 5 Stored value cards are usedprimarily for gift certificates and telephone calls. 6 Electronic benefits transfer cards are replacements for paper scrip foodstamps. 7 Preauthorized payments are handled electronically ‘‘end-to-end’’ through an automated clearing house. 8 Remotepayments are made using a telephone or a computer and include point-of-sale check conversions and utility-bill payments madeat ATMs, self-service clerk-assisted electronic banking machines kiosks and clerk-assisted machines at supermarkets.
Source: HSN Consultants Inc., Oxnard, CA, The Nilson Report, twice-monthly. (Copyright used by permission.)
No. 1183. Debit Cards—Holders, Number, Transactions, and Volume,2000 and 2002, and Projections, 2005
[168 represents 168,000,000]
Type of debit card
Cardholders(mil.)
Number of cards(mil.)
Number of transactions(mil.)
Volume(bil. dol.)
20022005,
proj. 2000 20022005,
proj. 2000 20022005,
proj. 2000 20022005,
proj.
Total 1 . . . . . . . . 168 181 235 260 283 9,834 15,585 25,550 448 700 1,137Bank 2 . . . . . . . . . . 150 156 137 175 205 6,797 10,332 14,093 327 496 712EFT systems 3. . . . . 167 180 223 249 271 2,979 5,235 11,439 119 203 425Other 4 . . . . . . . . . . 11 11 11 11 11 59 18 19 1 1 1
1 Cardholders may hold more than one type of card. Bank cards and EFT cards are the same pieces of plastic that carrymultiple brands. The total card figure shown does not include any duplication. 2 Visa Check Card and MasterCardMasterMoney. 3 Cards issued by financial institution members of regional and national switches. EFT=Electronic fundstransfer. 4 Commercial fuel cards issued by private-label firms plus retail cards such as those issued by supermarkets and oilcompanies.
Source: HSN Consultants Inc., Oxnard, CA, The Nilson Report, twice-monthly. (Copyright used by permission.)
746 Banking, Finance, and Insurance
U.S. Census Bureau, Statistical Abstract of the United States: 2004-2005
No. 1184. Consumer Credit Outstanding and Finance Rates: 1990 to 2003
[In billions of dollars, except percent (808 represents $808,000,000,000). Covers most short- and intermediate-term credit extendedto individuals, excluding loans secured by real estate. Estimated amounts of seasonally adjusted credit outstanding as of end ofyear; finance rates, annual averages]
Type of credit 1990 1995 1996 1997 1998 1999 2000 2001 2002 2003
Total . . . . . . . . . . . . . . . . . . . . . 808 1,141 1,242 1,305 1,400 1,513 1,686 1,822 1,903 2,002Revolving . . . . . . . . . . . . . . . . . . . 239 443 499 522 563 590 659 704 717 745Nonrevolving 1 . . . . . . . . . . . . . . . . 570 698 743 783 837 922 1,027 1,118 1,186 1,257
FINANCE RATES (percent)
Commercial banks:New automobiles (48 months) . . . . 11.78 9.57 9.05 9.02 8.73 8.44 9.34 8.50 7.62 6.93Other consumer goods(24 months) . . . . . . . . . . . . . . . 15.46 13.94 13.54 13.90 13.76 13.39 13.90 13.22 12.54 11.95
Credit-card plans. . . . . . . . . . . . . 18.17 15.90 15.63 15.77 15.71 15.21 15.71 14.89 13.42 12.74
Finance companies:New automobiles. . . . . . . . . . . . . 12.54 11.19 9.84 7.12 6.30 6.66 6.61 5.65 4.29 3.40Used automobiles . . . . . . . . . . . . 15.99 14.48 13.53 13.27 12.64 12.60 13.55 12.18 10.74 9.72
1 Comprises automobile loans and all other loans not included in revolving credit, such as loans for mobile homes, education,boats, trailers, or vacations. These loans may be secured or unsecured.
Source: Board of Governors of the Federal Reserve System, Statistical Supplement to the Federal Reserve Bulletin, monthly.
No. 1185. Credit Cards—Holders, Number, Spending, and Debt, 2000 and2002, and Projections, 2005
[159 represents 159,000,000]
Type of credit card
Cardholders(mil.)
Number of cards(mil.)
Credit card spending(bil. dol.)
Credit card debt out-standing (bil. dol.)
2000 20022005,
proj. 2000 20022005,
proj. 2000 20022005,
proj. 2000 20022005,
proj.
Total 1 . . . . . . . . . . . . . . . 159 163 173 1,425 1,452 1,430 1,458 1,638 2,022 680 764 922Bank 2 . . . . . . . . . . . . . . . . 107 112 120 455 525 580 938 1,095 1,359 480 560 683Phone. . . . . . . . . . . . . . . . . 125 126 128 181 182 184 21 20 22 3 2 3Store . . . . . . . . . . . . . . . . . 114 115 118 597 547 464 120 127 147 92 91 97Oil company. . . . . . . . . . . . . 76 75 73 98 97 90 50 54 71 5 5 7Other 3 . . . . . . . . . . . . . . . . 7 7 7 94 100 111 330 342 423 101 105 133
1 Cardholders may hold more than one type of card. 2 Visa and MasterCard credit cards. Excludes debit cards. 3 IncludesUniversal Air Travel Plan (UATP), also known as Air Travel Card; automobile rental, and miscellaneous cards. Except for data oncardholders, also includes Discover, American Express, and Diners Club.
Source: HSN Consultants Inc., Oxnard, CA, The Nilson Report, twice-monthly. (Copyright used by permission.)
No. 1186. Usage of General Purpose Credit Cards by Families: 1992 to 2001
[General purpose credit cards include Mastercard, Visa, Optima, and Discover cards. Excludes cards used only for businesspurposes. All dollar figures are given in constant 2001 dollars based on consumer price index data as published by U.S. Bureauof Labor Statistics. Families include one-person units; for definition of family, see text, Section 1, Population. Based on Survey ofConsumer Finance; see Appendix III. For definition of median, see Guide to Tabular Presentation]
Age of family headand family income
Percenthaving ageneral
purposecredit card
Mediannumber of
cards
Mediannew
chargeson last
month’sbills (dol.)
Percenthaving abalance
after lastmonth’s
bills
Medianbalance(dol.) 1
Percent of cardholding familieswho—
Almostalways
pay off thebalance
Some-times pay
off the bal-ance
Hardly everpay off the
balance
1992, total . . . . . . . . . . 62.4 2 100 52.6 1,200 53.0 19.6 27.41995, total . . . . . . . . . . 66.5 2 200 56.0 1,700 52.4 20.1 27.51998, total . . . . . . . . . . 67.5 2 200 54.7 2,000 53.8 19.3 26.9
2001, total . . . . . . . . . . 72.7 2 200 53.7 1,800 55.3 19.1 25.6
Under 35 years old . . . . . . 64.2 2 100 68.2 1,800 40.6 24.1 35.435 to 44 years old. . . . . . . 76.9 2 200 62.9 2,000 47.0 22.8 30.245 to 54 years old. . . . . . . 80.0 2 200 57.3 2,000 54.3 19.3 26.455 to 64 years old. . . . . . . 76.0 2 300 48.2 2,000 59.8 17.8 22.365 to 74 years old. . . . . . . 76.5 2 200 30.0 1,100 75.8 11.0 13.275 years old and over . . . . 59.7 2 200 24.2 700 81.2 9.3 9.4
Less than $10,000 . . . . . . 28.5 1 - 67.4 1,000 45.3 23.0 31.7$10,000 to $24,999 . . . . . . 56.1 2 100 57.0 1,000 49.5 19.9 30.6$25,000 to $49,999 . . . . . . 76.1 2 100 61.3 1,700 46.7 19.7 33.6$50,000 to $99,999 . . . . . . 87.9 2 200 53.9 2,000 55.2 20.8 24.0$100,000 and more. . . . . . 95.8 2 1,000 36.1 3,000 75.2 13.9 10.9
- Represents zero. 1 Among families having a balance.
Source: Board of Governors of the Federal Reserve System, unpublished data.
Banking, Finance, and Insurance 747
U.S. Census Bureau, Statistical Abstract of the United States: 2004-2005
No. 1187. Money Stock: 1980 to 2003
[In billions of dollars (408 represents $408,000,000,000). As of December. Seasonally adjusted averages of daily figures]
Item 1980 1985 1987 1988 1989 1990 1991 1992 1993 1994 1995 1996 1997 1998 1999 2000 2001 2002 2003
M1, total . . . . . . . . . . . . . . . . . 408 620 750 787 793 825 897 1,025 1,130 1,151 1,127 1,079 1,073 1,096 1,124 1,088 1,177 1,215 1,293Currency 1 . . . . . . . . . . . . . . . . . . . . . 115 168 197 212 222 246 267 292 322 354 372 394 425 460 518 532 582 627 664Travelers checks 2 . . . . . . . . . . . . . . . . 3 6 7 7 7 8 8 8 8 9 9 9 8 9 9 8 8 8 8Demand deposits 3 . . . . . . . . . . . . . . . 261 267 288 287 279 277 290 340 386 384 389 401 394 378 355 310 330 301 312Other checkable deposits 4 . . . . . . . . . . 28 180 259 281 285 294 332 385 415 404 357 275 245 249 243 238 257 279 310
M2, total . . . . . . . . . . . . . . . . . 1,600 2,496 2,831 2,994 3,158 3,278 3,378 3,432 3,484 3,496 3,640 3,815 4,031 4,384 4,649 4,933 5,453 5,806 6,071M1 . . . . . . . . . . . . . . . . . . . . . . . . . . 408 620 750 787 793 825 897 1,025 1,130 1,151 1,127 1,079 1,073 1,096 1,124 1,088 1,177 1,215 1,293Non-M1 components in M2 . . . . . . . . . . 1,192 1,876 2,081 2,208 2,365 2,453 2,481 2,407 2,354 2,346 2,513 2,736 2,958 3,288 3,525 3,845 4,276 4,591 4,778
Money market funds, retail . . . . . . . . . 64 175 223 244 320 357 371 352 353 380 448 516 591 732 833 925 993 928 810Savings deposits (including MMDAs 5) . 400 815 937 926 894 923 1,044 1,187 1,219 1,149 1,134 1,273 1,399 1,604 1,738 1,876 2,309 2,769 3,159
Commercial banks. . . . . . . . . . . . . 186 457 535 542 541 582 665 754 785 752 775 906 1,022 1,187 1,287 1,422 1,736 2,053 2,328Thrift institutions . . . . . . . . . . . . . . 215 359 403 384 353 342 380 433 434 397 359 367 377 417 451 454 573 716 831
Small time deposits 6 . . . . . . . . . . . . 729 886 921 1,037 1,151 1,173 1,066 868 782 816 931 947 968 952 954 1,044 973 894 809Commercial banks. . . . . . . . . . . . . 286 386 392 451 534 611 602 508 468 503 575 593 625 626 635 700 634 591 536Thrift institutions . . . . . . . . . . . . . . 442 499 529 586 618 563 463 360 314 314 357 354 343 326 319 345 339 302 272
M3, total . . . . . . . . . . . . . . . . . 1,996 3,208 3,687 3,929 4,077 4,153 4,206 4,217 4,278 4,360 4,625 4,972 5,446 6,036 6,535 7,102 8,012 8,541 8,814M2 . . . . . . . . . . . . . . . . . . . . . . . . . . 1,600 2,496 2,831 2,994 3,158 3,278 3,378 3,432 3,484 3,496 3,640 3,815 4,031 4,384 4,649 4,933 5,453 5,806 6,071Non-M2 components in M3 . . . . . . . . . . 396 713 855 935 919 875 828 785 794 864 985 1,157 1,415 1,653 1,886 2,169 2,559 2,735 2,743
Large time deposits 7 . . . . . . . . . . . . 260 422 462 512 528 480 415 350 332 370 428 509 618 669 744 820 785 794 859Commercial banks 8 . . . . . . . . . . . 215 270 299 338 366 358 331 283 270 305 354 431 533 581 652 717 670 677 739Thrift institutions . . . . . . . . . . . . . . 45 152 163 175 161 121 83 67 62 65 74 78 85 88 92 103 115 117 120
Repurchase agreements 9 . . . . . . . . . 58 121 178 197 169 151 131 142 173 196 199 211 254 294 337 366 379 481 505Eurodollars 9 . . . . . . . . . . . . . . . . . . 61 104 121 132 109 103 92 80 73 86 94 115 147 150 170 194 209 228 280Money market funds, institution only . . 16 65 94 94 112 140 190 214 217 211 265 323 396 539 635 788 1,187 1,232 1,099
1 Currency outside U.S. Treasury, Federal Reserve Banks and the vaults of depository institutions. 2 Outstanding amount of nonbank issuers. 3 At commercial banks and foreign-related institutions.4 Consists of negotiable order of withdrawal (NOW) and automatic transfer service (ATS) accounts at all depository institutions, credit union share draft balances, and demand deposits at thrift institutions. 5 Moneymarket deposit accounts (MMDA). 6 Issued in amounts of less than $100,000. Excludes individual retirement accounts (IRA’s) and Keogh accounts. 7 Issued in amounts of $100,000 or more. Excludes those bookedat international banking facilities. 8 Excludes those held by money market mutual funds, depository institutions, U.S. Government, foreign banks and official institutions.9 Excludes those held by depository institutions and money market mutual funds.
Source: Board of Governors of the Federal Reserve System, Statistical Supplement to the Federal Reserve Bulletin, monthly, and Money Stock Measures, Federal Reserve Statistical Release H.6, weekly.
74
8Ban
king,Fin
ance,
and
Insu
ranceU
.S.
Census
Bureau,
StatisticalA
bstractof
theU
nitedS
tates:2004-2005
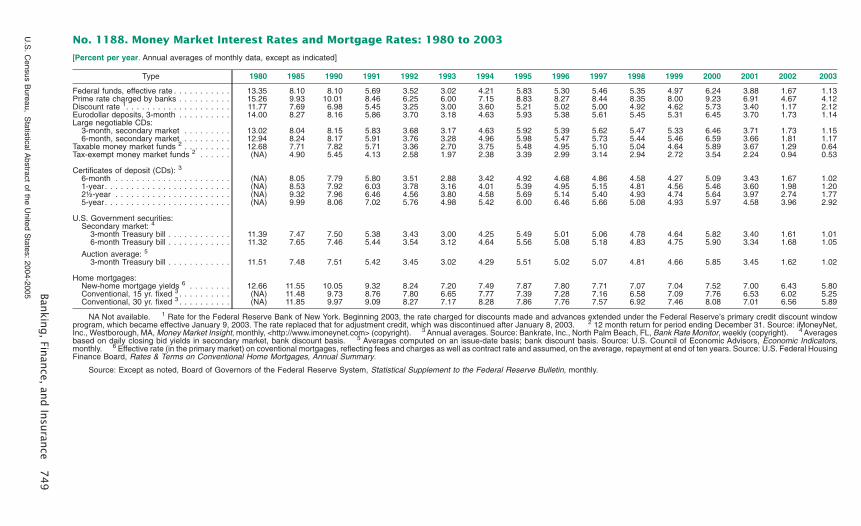
No. 1188. Money Market Interest Rates and Mortgage Rates: 1980 to 2003
[Percent per year. Annual averages of monthly data, except as indicated]
Type 1980 1985 1990 1991 1992 1993 1994 1995 1996 1997 1998 1999 2000 2001 2002 2003
Federal funds, effective rate . . . . . . . . . . . 13.35 8.10 8.10 5.69 3.52 3.02 4.21 5.83 5.30 5.46 5.35 4.97 6.24 3.88 1.67 1.13Prime rate charged by banks . . . . . . . . . . 15.26 9.93 10.01 8.46 6.25 6.00 7.15 8.83 8.27 8.44 8.35 8.00 9.23 6.91 4.67 4.12Discount rate 1. . . . . . . . . . . . . . . . . . . . 11.77 7.69 6.98 5.45 3.25 3.00 3.60 5.21 5.02 5.00 4.92 4.62 5.73 3.40 1.17 2.12Eurodollar deposits, 3-month . . . . . . . . . . 14.00 8.27 8.16 5.86 3.70 3.18 4.63 5.93 5.38 5.61 5.45 5.31 6.45 3.70 1.73 1.14Large negotiable CDs:
3-month, secondary market . . . . . . . . . 13.02 8.04 8.15 5.83 3.68 3.17 4.63 5.92 5.39 5.62 5.47 5.33 6.46 3.71 1.73 1.156-month, secondary market . . . . . . . . . 12.94 8.24 8.17 5.91 3.76 3.28 4.96 5.98 5.47 5.73 5.44 5.46 6.59 3.66 1.81 1.17
Taxable money market funds 2 . . . . . . . . . 12.68 7.71 7.82 5.71 3.36 2.70 3.75 5.48 4.95 5.10 5.04 4.64 5.89 3.67 1.29 0.64Tax-exempt money market funds 2 . . . . . . (NA) 4.90 5.45 4.13 2.58 1.97 2.38 3.39 2.99 3.14 2.94 2.72 3.54 2.24 0.94 0.53
Certificates of deposit (CDs): 3
6-month . . . . . . . . . . . . . . . . . . . . . . (NA) 8.05 7.79 5.80 3.51 2.88 3.42 4.92 4.68 4.86 4.58 4.27 5.09 3.43 1.67 1.021-year . . . . . . . . . . . . . . . . . . . . . . . . (NA) 8.53 7.92 6.03 3.78 3.16 4.01 5.39 4.95 5.15 4.81 4.56 5.46 3.60 1.98 1.202½-year . . . . . . . . . . . . . . . . . . . . . . (NA) 9.32 7.96 6.46 4.56 3.80 4.58 5.69 5.14 5.40 4.93 4.74 5.64 3.97 2.74 1.775-year . . . . . . . . . . . . . . . . . . . . . . . . (NA) 9.99 8.06 7.02 5.76 4.98 5.42 6.00 6.46 5.66 5.08 4.93 5.97 4.58 3.96 2.92
U.S. Government securities:Secondary market: 4
3-month Treasury bill . . . . . . . . . . . . 11.39 7.47 7.50 5.38 3.43 3.00 4.25 5.49 5.01 5.06 4.78 4.64 5.82 3.40 1.61 1.016-month Treasury bill . . . . . . . . . . . . 11.32 7.65 7.46 5.44 3.54 3.12 4.64 5.56 5.08 5.18 4.83 4.75 5.90 3.34 1.68 1.05
Auction average: 5
3-month Treasury bill . . . . . . . . . . . . 11.51 7.48 7.51 5.42 3.45 3.02 4.29 5.51 5.02 5.07 4.81 4.66 5.85 3.45 1.62 1.02
Home mortgages:New-home mortgage yields 6 . . . . . . . . 12.66 11.55 10.05 9.32 8.24 7.20 7.49 7.87 7.80 7.71 7.07 7.04 7.52 7.00 6.43 5.80Conventional, 15 yr. fixed 3 . . . . . . . . . . (NA) 11.48 9.73 8.76 7.80 6.65 7.77 7.39 7.28 7.16 6.58 7.09 7.76 6.53 6.02 5.25Conventional, 30 yr. fixed 3 . . . . . . . . . . (NA) 11.85 9.97 9.09 8.27 7.17 8.28 7.86 7.76 7.57 6.92 7.46 8.08 7.01 6.56 5.89
NA Not available. 1 Rate for the Federal Reserve Bank of New York. Beginning 2003, the rate charged for discounts made and advances extended under the Federal Reserve’s primary credit discount windowprogram, which became effective January 9, 2003. The rate replaced that for adjustment credit, which was discontinued after January 8, 2003. 2 12 month return for period ending December 31. Source: iMoneyNet,Inc., Westborough, MA, Money Market Insight, monthly, <http://www.imoneynet.com> (copyright). 3 Annual averages. Source: Bankrate, Inc., North Palm Beach, FL, Bank Rate Monitor, weekly (copyright). 4 Averagesbased on daily closing bid yields in secondary market, bank discount basis. 5 Averages computed on an issue-date basis; bank discount basis. Source: U.S. Council of Economic Advisors, Economic Indicators,monthly. 6 Effective rate (in the primary market) on coventional mortgages, reflecting fees and charges as well as contract rate and assumed, on the average, repayment at end of ten years. Source: U.S. Federal HousingFinance Board, Rates & Terms on Conventional Home Mortgages, Annual Summary.
Source: Except as noted, Board of Governors of the Federal Reserve System, Statistical Supplement to the Federal Reserve Bulletin, monthly.
Bankin
g,Fin
ance,
and
Insu
rance
74
9
U.S
.C
ensusB
ureau,S
tatisticalAbstract
ofthe
United
States:
2004-2005
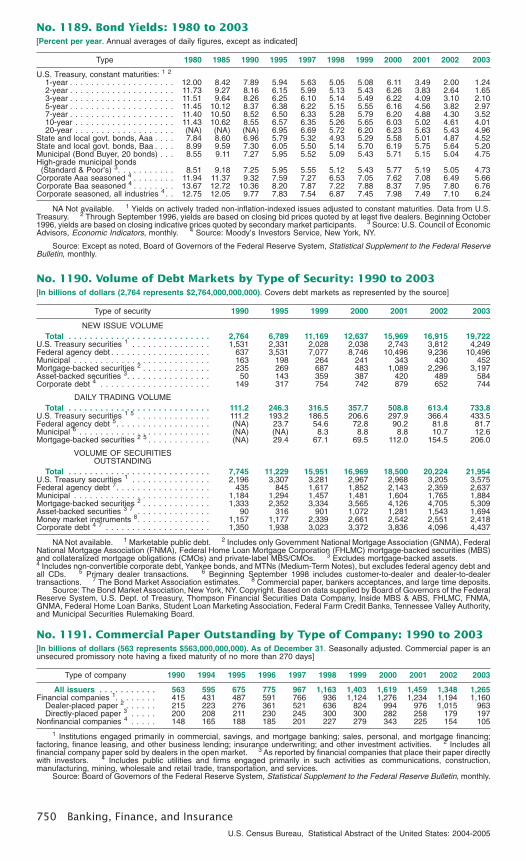
No. 1189. Bond Yields: 1980 to 2003[Percent per year. Annual averages of daily figures, except as indicated]
Type 1980 1985 1990 1995 1997 1998 1999 2000 2001 2002 2003
U.S. Treasury, constant maturities: 1 2
1-year . . . . . . . . . . . . . . . . . . . . 12.00 8.42 7.89 5.94 5.63 5.05 5.08 6.11 3.49 2.00 1.242-year . . . . . . . . . . . . . . . . . . . . 11.73 9.27 8.16 6.15 5.99 5.13 5.43 6.26 3.83 2.64 1.653-year . . . . . . . . . . . . . . . . . . . . 11.51 9.64 8.26 6.25 6.10 5.14 5.49 6.22 4.09 3.10 2.105-year . . . . . . . . . . . . . . . . . . . . 11.45 10.12 8.37 6.38 6.22 5.15 5.55 6.16 4.56 3.82 2.977-year . . . . . . . . . . . . . . . . . . . . 11.40 10.50 8.52 6.50 6.33 5.28 5.79 6.20 4.88 4.30 3.5210-year . . . . . . . . . . . . . . . . . . . 11.43 10.62 8.55 6.57 6.35 5.26 5.65 6.03 5.02 4.61 4.0120-year . . . . . . . . . . . . . . . . . . . (NA) (NA) (NA) 6.95 6.69 5.72 6.20 6.23 5.63 5.43 4.96
State and local govt. bonds, Aaa . . . . 7.84 8.60 6.96 5.79 5.32 4.93 5.29 5.58 5.01 4.87 4.52State and local govt. bonds, Baa . . . . 8.99 9.59 7.30 6.05 5.50 5.14 5.70 6.19 5.75 5.64 5.20Municipal (Bond Buyer, 20 bonds) . . . 8.55 9.11 7.27 5.95 5.52 5.09 5.43 5.71 5.15 5.04 4.75High-grade municipal bonds(Standard & Poor’s) 3. . . . . . . . . . . 8.51 9.18 7.25 5.95 5.55 5.12 5.43 5.77 5.19 5.05 4.73
Corporate Aaa seasoned 4 . . . . . . . . 11.94 11.37 9.32 7.59 7.27 6.53 7.05 7.62 7.08 6.49 5.66Corporate Baa seasoned 4 . . . . . . . . 13.67 12.72 10.36 8.20 7.87 7.22 7.88 8.37 7.95 7.80 6.76Corporate seasoned, all industries 4 . . 12.75 12.05 9.77 7.83 7.54 6.87 7.45 7.98 7.49 7.10 6.24
NA Not available. 1 Yields on actively traded non-inflation-indexed issues adjusted to constant maturities. Data from U.S.Treasury. 2 Through September 1996, yields are based on closing bid prices quoted by at least five dealers. Beginning October1996, yields are based on closing indicative prices quoted by secondary market participants. 3 Source: U.S. Council of EconomicAdvisors, Economic Indicators, monthly. 4 Source: Moody’s Investors Service, New York, NY.
Source: Except as noted, Board of Governors of the Federal Reserve System, Statistical Supplement to the Federal ReserveBulletin, monthly.
No. 1190. Volume of Debt Markets by Type of Security: 1990 to 2003[In billions of dollars (2,764 represents $2,764,000,000,000). Covers debt markets as represented by the source]
Type of security 1990 1995 1999 2000 2001 2002 2003
NEW ISSUE VOLUMETotal . . . . . . . . . . . . . . . . . . . . . . . . . . . 2,764 6,789 11,169 12,637 15,969 16,915 19,722
U.S. Treasury securities 1 . . . . . . . . . . . . . . . 1,531 2,331 2,028 2,038 2,743 3,812 4,249Federal agency debt . . . . . . . . . . . . . . . . . . . 637 3,531 7,077 8,746 10,496 9,236 10,496Municipal . . . . . . . . . . . . . . . . . . . . . . . . . . 163 198 264 241 343 430 452Mortgage-backed securities 2 . . . . . . . . . . . . . 235 269 687 483 1,089 2,296 3,197Asset-backed securities 3. . . . . . . . . . . . . . . . 50 143 359 387 420 489 584Corporate debt 4 . . . . . . . . . . . . . . . . . . . . . 149 317 754 742 879 652 744
DAILY TRADING VOLUMETotal . . . . . . . . . . . . . . . . . . . . . . . . . . . 111.2 246.3 316.5 357.7 508.8 613.4 733.8
U.S. Treasury securities 1 5 . . . . . . . . . . . . . . 111.2 193.2 186.5 206.6 297.9 366.4 433.5Federal agency debt 5. . . . . . . . . . . . . . . . . . (NA) 23.7 54.6 72.8 90.2 81.8 81.7Municipal 6 . . . . . . . . . . . . . . . . . . . . . . . . . (NA) (NA) 8.3 8.8 8.8 10.7 12.6Mortgage-backed securities 2 5 . . . . . . . . . . . . (NA) 29.4 67.1 69.5 112.0 154.5 206.0
VOLUME OF SECURITIESOUTSTANDING
Total . . . . . . . . . . . . . . . . . . . . . . . . . . . 7,745 11,229 15,951 16,969 18,500 20,224 21,954U.S. Treasury securities 1 . . . . . . . . . . . . . . . 2,196 3,307 3,281 2,967 2,968 3,205 3,575Federal agency debt 7. . . . . . . . . . . . . . . . . . 435 845 1,617 1,852 2,143 2,359 2,637Municipal . . . . . . . . . . . . . . . . . . . . . . . . . . 1,184 1,294 1,457 1,481 1,604 1,765 1,884Mortgage-backed securities 2 . . . . . . . . . . . . . 1,333 2,352 3,334 3,565 4,126 4,705 5,309Asset-backed securities 3 7 . . . . . . . . . . . . . . 90 316 901 1,072 1,281 1,543 1,694Money market instruments 8. . . . . . . . . . . . . . 1,157 1,177 2,339 2,661 2,542 2,551 2,418Corporate debt 4 7 . . . . . . . . . . . . . . . . . . . . 1,350 1,938 3,023 3,372 3,836 4,096 4,437
NA Not available. 1 Marketable public debt. 2 Includes only Government National Mortgage Association (GNMA), FederalNational Mortgage Association (FNMA), Federal Home Loan Mortgage Corporation (FHLMC) mortgage-backed securities (MBS)and collateralized mortgage obligations (CMOs) and private-label MBS/CMOs. 3 Excludes mortgage-backed assets.4 Includes non-convertible corporate debt, Yankee bonds, and MTNs (Medium-Term Notes), but excludes federal agency debt andall CDs. 5 Primary dealer transactions. 6 Beginning September 1998 includes customer-to-dealer and dealer-to-dealertransactions. 7 The Bond Market Association estimates. 8 Commercial paper, bankers acceptances, and large time deposits.
Source: The Bond Market Association, New York, NY. Copyright. Based on data supplied by Board of Governors of the FederalReserve System, U.S. Dept. of Treasury, Thompson Financial Securities Data Company, Inside MBS & ABS, FHLMC, FNMA,GNMA, Federal Home Loan Banks, Student Loan Marketing Association, Federal Farm Credit Banks, Tennessee Valley Authority,and Municipal Securities Rulemaking Board.
No. 1191. Commercial Paper Outstanding by Type of Company: 1990 to 2003[In billions of dollars (563 represents $563,000,000,000). As of December 31. Seasonally adjusted. Commercial paper is anunsecured promissory note having a fixed maturity of no more than 270 days]
Type of company 1990 1994 1995 1996 1997 1998 1999 2000 2001 2002 2003
All issuers . . . . . . . . . . . 563 595 675 775 967 1,163 1,403 1,619 1,459 1,348 1,265Financial companies 1. . . . . . . . 415 431 487 591 766 936 1,124 1,276 1,234 1,194 1,160
Dealer-placed paper 2 . . . . . . 215 223 276 361 521 636 824 994 976 1,015 963Directly-placed paper 3 . . . . . 200 208 211 230 245 300 300 282 258 179 197
Nonfinancial companies 4 . . . . . 148 165 188 185 201 227 279 343 225 154 105
1 Institutions engaged primarily in commercial, savings, and mortgage banking; sales, personal, and mortgage financing;factoring, finance leasing, and other business lending; insurance underwriting; and other investment activities. 2 Includes allfinancial company paper sold by dealers in the open market. 3 As reported by financial companies that place their paper directlywith investors. 4 Includes public utilities and firms engaged primarily in such activities as communications, construction,manufacturing, mining, wholesale and retail trade, transportation, and services.
Source: Board of Governors of the Federal Reserve System, Statistical Supplement to the Federal Reserve Bulletin, monthly.
750 Banking, Finance, and Insurance
U.S. Census Bureau, Statistical Abstract of the United States: 2004-2005
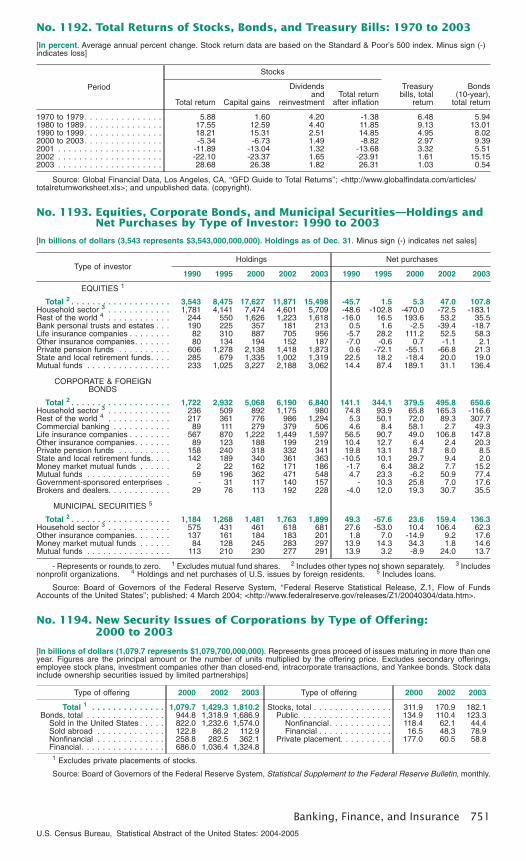
No. 1192. Total Returns of Stocks, Bonds, and Treasury Bills: 1970 to 2003
[In percent. Average annual percent change. Stock return data are based on the Standard & Poor’s 500 index. Minus sign (-)indicates loss]
Period
Stocks
Treasurybills, total
return
Bonds(10-year),
total returnTotal return Capital gains
Dividendsand
reinvestmentTotal return
after inflation
1970 to 1979. . . . . . . . . . . . . . . 5.88 1.60 4.20 -1.38 6.48 5.941980 to 1989. . . . . . . . . . . . . . . 17.55 12.59 4.40 11.85 9.13 13.011990 to 1999. . . . . . . . . . . . . . . 18.21 15.31 2.51 14.85 4.95 8.022000 to 2003. . . . . . . . . . . . . . . -5.34 -6.73 1.49 -8.82 2.97 9.392001 . . . . . . . . . . . . . . . . . . . . -11.89 -13.04 1.32 -13.68 3.32 5.512002 . . . . . . . . . . . . . . . . . . . . -22.10 -23.37 1.65 -23.91 1.61 15.152003 . . . . . . . . . . . . . . . . . . . . 28.68 26.38 1.82 26.31 1.03 0.54
Source: Global Financial Data, Los Angeles, CA, ‘‘GFD Guide to Total Returns’’; <http://www.globalfindata.com/articles/totalreturnworksheet.xls>; and unpublished data. (copyright).
No. 1193. Equities, Corporate Bonds, and Municipal Securities—Holdings andNet Purchases by Type of Investor: 1990 to 2003
[In billions of dollars (3,543 represents $3,543,000,000,000). Holdings as of Dec. 31. Minus sign (-) indicates net sales]
Type of investorHoldings Net purchases
1990 1995 2000 2002 2003 1990 1995 2000 2002 2003
EQUITIES 1
Total 2 . . . . . . . . . . . . . . . . . . . 3,543 8,475 17,627 11,871 15,498 -45.7 1.5 5.3 47.0 107.8Household sector 3 . . . . . . . . . . . . 1,781 4,141 7,474 4,601 5,709 -48.6 -102.8 -470.0 -72.5 -183.1Rest of the world 4 . . . . . . . . . . . . 244 550 1,626 1,223 1,618 -16.0 16.5 193.6 53.2 35.5Bank personal trusts and estates . . . 190 225 357 181 213 0.5 1.6 -2.5 -39.4 -18.7Life insurance companies . . . . . . . . 82 310 887 705 956 -5.7 28.2 111.2 52.5 58.3Other insurance companies. . . . . . . 80 134 194 152 187 -7.0 -0.6 0.7 -1.1 2.1Private pension funds . . . . . . . . . . 606 1,278 2,138 1,418 1,873 0.6 -72.1 -55.1 -66.8 21.3State and local retirement funds. . . . 285 679 1,335 1,002 1,319 22.5 18.2 -18.4 20.0 19.0Mutual funds . . . . . . . . . . . . . . . . 233 1,025 3,227 2,188 3,062 14.4 87.4 189.1 31.1 136.4
CORPORATE & FOREIGNBONDS
Total 2 . . . . . . . . . . . . . . . . . . . 1,722 2,932 5,068 6,190 6,840 141.1 344.1 379.5 495.8 650.6Household sector 3 . . . . . . . . . . . . 236 509 892 1,175 980 74.8 93.9 65.8 165.3 -116.6Rest of the world 4 . . . . . . . . . . . . 217 361 776 986 1,294 5.3 50.1 72.0 89.3 307.7Commercial banking . . . . . . . . . . . 89 111 279 379 506 4.6 8.4 58.1 2.7 49.3Life insurance companies . . . . . . . . 567 870 1,222 1,449 1,597 56.5 90.7 49.0 106.8 147.8Other insurance companies. . . . . . . 89 123 188 199 219 10.4 12.7 6.4 2.4 20.3Private pension funds . . . . . . . . . . 158 240 318 332 341 19.8 13.1 18.7 8.0 8.5State and local retirement funds. . . . 142 189 340 361 363 -10.5 10.1 29.7 9.4 2.0Money market mutual funds . . . . . . 2 22 162 171 186 -1.7 6.4 38.2 7.7 15.2Mutual funds . . . . . . . . . . . . . . . . 59 196 362 471 548 4.7 23.3 -6.2 50.9 77.4Government-sponsored enterprises . - 31 117 140 157 - 10.3 25.8 7.0 17.6Brokers and dealers. . . . . . . . . . . . 29 76 113 192 228 -4.0 12.0 19.3 30.7 35.5
MUNICIPAL SECURITIES 5
Total 2 . . . . . . . . . . . . . . . . . . . 1,184 1,268 1,481 1,763 1,899 49.3 -57.6 23.6 159.4 136.3Household sector 3 . . . . . . . . . . . . 575 431 461 618 681 27.6 -53.0 10.4 106.4 62.3Other insurance companies. . . . . . . 137 161 184 183 201 1.8 7.0 -14.9 9.2 17.6Money market mutual funds . . . . . . 84 128 245 283 297 13.9 14.3 34.3 1.8 14.6Mutual funds . . . . . . . . . . . . . . . . 113 210 230 277 291 13.9 3.2 -8.9 24.0 13.7
- Represents or rounds to zero. 1 Excludes mutual fund shares. 2 Includes other types not shown separately. 3 Includesnonprofit organizations. 4 Holdings and net purchases of U.S. issues by foreign residents. 5 Includes loans.
Source: Board of Governors of the Federal Reserve System, ‘‘Federal Reserve Statistical Release, Z.1, Flow of FundsAccounts of the United States’’; published: 4 March 2004; <http://www.federalreserve.gov/releases/Z1/20040304/data.htm>.
No. 1194. New Security Issues of Corporations by Type of Offering:2000 to 2003
[In billions of dollars (1,079.7 represents $1,079,700,000,000). Represents gross proceed of issues maturing in more than oneyear. Figures are the principal amount or the number of units multiplied by the offering price. Excludes secondary offerings,employee stock plans, investment companies other than closed-end, intracorporate transactions, and Yankee bonds. Stock datainclude ownership securities issued by limited partnerships]
Type of offering 2000 2002 2003
Total 1 . . . . . . . . . . . . . . 1,079.7 1,429.3 1,810.2Bonds, total . . . . . . . . . . . . . . . 944.8 1,318.9 1,686.9
Sold in the United States . . . . . 822.0 1,232.6 1,574.0Sold abroad . . . . . . . . . . . . . 122.8 86.2 112.9Nonfinancial . . . . . . . . . . . . . 258.8 282.5 362.1Financial. . . . . . . . . . . . . . . . 686.0 1,036.4 1,324.8
Type of offering 2000 2002 2003
Stocks, total . . . . . . . . . . . . . . . 311.9 170.9 182.1Public. . . . . . . . . . . . . . . . . . 134.9 110.4 123.3
Nonfinancial . . . . . . . . . . . . 118.4 62.1 44.4Financial . . . . . . . . . . . . . . 16.5 48.3 78.9
Private placement. . . . . . . . . . 177.0 60.5 58.8
1 Excludes private placements of stocks.
Source: Board of Governors of the Federal Reserve System, Statistical Supplement to the Federal Reserve Bulletin, monthly.
Banking, Finance, and Insurance 751
U.S. Census Bureau, Statistical Abstract of the United States: 2004-2005
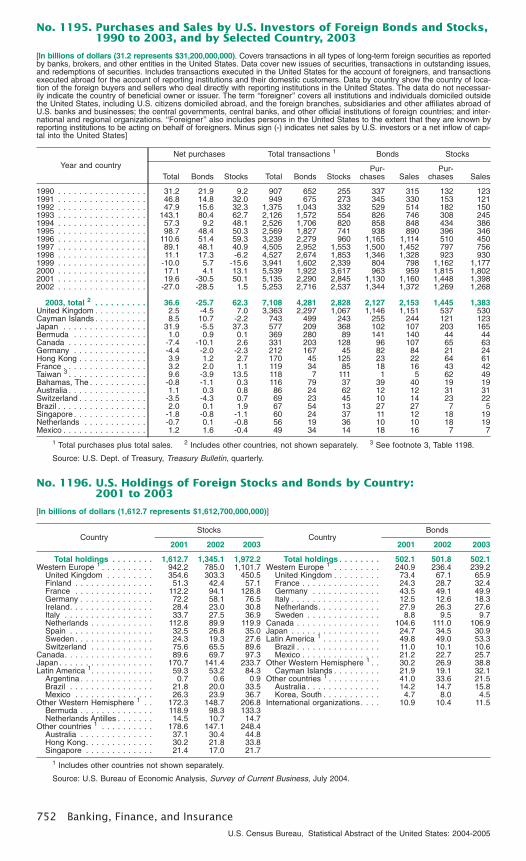
No. 1195. Purchases and Sales by U.S. Investors of Foreign Bonds and Stocks,1990 to 2003, and by Selected Country, 2003
[In billions of dollars (31.2 represents $31,200,000,000). Covers transactions in all types of long-term foreign securities as reportedby banks, brokers, and other entities in the United States. Data cover new issues of securities, transactions in outstanding issues,and redemptions of securities. Includes transactions executed in the United States for the account of foreigners, and transactionsexecuted abroad for the account of reporting institutions and their domestic customers. Data by country show the country of loca-tion of the foreign buyers and sellers who deal directly with reporting institutions in the United States. The data do not necessar-ily indicate the country of beneficial owner or issuer. The term ‘‘foreigner’’ covers all institutions and individuals domiciled outsidethe United States, including U.S. citizens domiciled abroad, and the foreign branches, subsidiaries and other affiliates abroad ofU.S. banks and businesses; the central governments, central banks, and other official institutions of foreign countries; and inter-national and regional organizations. ‘‘Foreigner’’ also includes persons in the United States to the extent that they are known byreporting institutions to be acting on behalf of foreigners. Minus sign (-) indicates net sales by U.S. investors or a net inflow of capi-tal into the United States]
Year and countryNet purchases Total transactions 1 Bonds Stocks
Total Bonds Stocks Total Bonds StocksPur-
chases SalesPur-
chases Sales
1990 . . . . . . . . . . . . . . . . . 31.2 21.9 9.2 907 652 255 337 315 132 1231991 . . . . . . . . . . . . . . . . . 46.8 14.8 32.0 949 675 273 345 330 153 1211992 . . . . . . . . . . . . . . . . . 47.9 15.6 32.3 1,375 1,043 332 529 514 182 1501993 . . . . . . . . . . . . . . . . . 143.1 80.4 62.7 2,126 1,572 554 826 746 308 2451994 . . . . . . . . . . . . . . . . . 57.3 9.2 48.1 2,526 1,706 820 858 848 434 3861995 . . . . . . . . . . . . . . . . . 98.7 48.4 50.3 2,569 1,827 741 938 890 396 3461996 . . . . . . . . . . . . . . . . . 110.6 51.4 59.3 3,239 2,279 960 1,165 1,114 510 4501997 . . . . . . . . . . . . . . . . . 89.1 48.1 40.9 4,505 2,952 1,553 1,500 1,452 797 7561998 . . . . . . . . . . . . . . . . . 11.1 17.3 -6.2 4,527 2,674 1,853 1,346 1,328 923 9301999 . . . . . . . . . . . . . . . . . -10.0 5.7 -15.6 3,941 1,602 2,339 804 798 1,162 1,1772000 . . . . . . . . . . . . . . . . . 17.1 4.1 13.1 5,539 1,922 3,617 963 959 1,815 1,8022001 . . . . . . . . . . . . . . . . . 19.6 -30.5 50.1 5,135 2,290 2,845 1,130 1,160 1,448 1,3982002 . . . . . . . . . . . . . . . . . -27.0 -28.5 1.5 5,253 2,716 2,537 1,344 1,372 1,269 1,268
2003, total 2 . . . . . . . . . . 36.6 -25.7 62.3 7,108 4,281 2,828 2,127 2,153 1,445 1,383United Kingdom . . . . . . . . . . 2.5 -4.5 7.0 3,363 2,297 1,067 1,146 1,151 537 530Cayman Islands . . . . . . . . . . 8.5 10.7 -2.2 743 499 243 255 244 121 123Japan . . . . . . . . . . . . . . . . 31.9 -5.5 37.3 577 209 368 102 107 203 165Bermuda . . . . . . . . . . . . . . 1.0 0.9 0.1 369 280 89 141 140 44 44Canada . . . . . . . . . . . . . . . -7.4 -10.1 2.6 331 203 128 96 107 65 63Germany . . . . . . . . . . . . . . -4.4 -2.0 -2.3 212 167 45 82 84 21 24Hong Kong . . . . . . . . . . . . . 3.9 1.2 2.7 170 45 125 23 22 64 61France . . . . . . . . . . . . . . . . 3.2 2.0 1.1 119 34 85 18 16 43 42Taiwan 3 . . . . . . . . . . . . . . . 9.6 -3.9 13.5 118 7 111 1 5 62 49Bahamas, The . . . . . . . . . . . -0.8 -1.1 0.3 116 79 37 39 40 19 19Australia . . . . . . . . . . . . . . . 1.1 0.3 0.8 86 24 62 12 12 31 31Switzerland . . . . . . . . . . . . . -3.5 -4.3 0.7 69 23 45 10 14 23 22Brazil . . . . . . . . . . . . . . . . . 2.0 0.1 1.9 67 54 13 27 27 7 5Singapore . . . . . . . . . . . . . . -1.8 -0.8 -1.1 60 24 37 11 12 18 19Netherlands . . . . . . . . . . . . -0.7 0.1 -0.8 56 19 36 10 10 18 19Mexico . . . . . . . . . . . . . . . . 1.2 1.6 -0.4 49 34 14 18 16 7 7
1 Total purchases plus total sales. 2 Includes other countries, not shown separately. 3 See footnote 3, Table 1198.
Source: U.S. Dept. of Treasury, Treasury Bulletin, quarterly.
No. 1196. U.S. Holdings of Foreign Stocks and Bonds by Country:2001 to 2003
[In billions of dollars (1,612.7 represents $1,612,700,000,000)]
CountryStocks
CountryBonds
2001 2002 2003 2001 2002 2003
Total holdings . . . . . . . . 1,612.7 1,345.1 1,972.2 Total holdings . . . . . . . . 502.1 501.8 502.1Western Europe 1 . . . . . . . . . . 942.2 785.0 1,101.7 Western Europe 1 . . . . . . . . . 240.9 236.4 239.2
United Kingdom . . . . . . . . . 354.6 303.3 450.5 United Kingdom . . . . . . . . . 73.4 67.1 65.9Finland . . . . . . . . . . . . . . . 51.3 42.4 57.1 France . . . . . . . . . . . . . . . 24.3 28.7 32.4France . . . . . . . . . . . . . . . 112.2 94.1 128.8 Germany . . . . . . . . . . . . . 43.5 49.1 49.9Germany . . . . . . . . . . . . . . 72.2 58.1 76.5 Italy . . . . . . . . . . . . . . . . . 12.5 12.6 18.3Ireland. . . . . . . . . . . . . . . . 28.4 23.0 30.8 Netherlands. . . . . . . . . . . . 27.9 26.3 27.6Italy . . . . . . . . . . . . . . . . . 33.7 27.5 36.9 Sweden . . . . . . . . . . . . . . 8.8 9.5 9.7Netherlands . . . . . . . . . . . . 112.8 89.9 119.9 Canada . . . . . . . . . . . . . . . . 104.6 111.0 106.9Spain . . . . . . . . . . . . . . . . 32.5 26.8 35.0 Japan . . . . . . . . . . . . . . . . . 24.7 34.5 30.9Sweden . . . . . . . . . . . . . . . 24.3 19.3 27.6 Latin America 1 . . . . . . . . . . . 49.8 49.0 53.3Switzerland . . . . . . . . . . . . 75.6 65.5 89.6 Brazil . . . . . . . . . . . . . . . . 11.0 10.1 10.6
Canada. . . . . . . . . . . . . . . . . 89.6 69.7 97.3 Mexico . . . . . . . . . . . . . . . 21.2 22.7 25.7Japan . . . . . . . . . . . . . . . . . . 170.7 141.4 233.7 Other Western Hemisphere 1 . . 30.2 26.9 38.8Latin America 1. . . . . . . . . . . . 59.3 53.2 84.3 Cayman Islands . . . . . . . . . 21.9 19.1 32.1
Argentina . . . . . . . . . . . . . . 0.7 0.6 0.9 Other countries 1 . . . . . . . . . . 41.0 33.6 21.5Brazil . . . . . . . . . . . . . . . . 21.8 20.0 33.5 Australia . . . . . . . . . . . . . . 14.2 14.7 15.8Mexico . . . . . . . . . . . . . . . 26.3 23.9 36.7 Korea, South . . . . . . . . . . . 4.7 8.0 4.5
Other Western Hemisphere 1 . . 172.3 148.7 206.8 International organizations. . . . 10.9 10.4 11.5Bermuda . . . . . . . . . . . . . . 118.9 98.3 133.3Netherlands Antilles . . . . . . . 14.5 10.7 14.7
Other countries 1 . . . . . . . . . . 178.6 147.1 248.4Australia . . . . . . . . . . . . . . 37.1 30.4 44.8Hong Kong. . . . . . . . . . . . . 30.2 21.8 33.8Singapore . . . . . . . . . . . . . 21.4 17.0 21.7
1 Includes other countries not shown separately.
Source: U.S. Bureau of Economic Analysis, Survey of Current Business, July 2004.
752 Banking, Finance, and Insurance
U.S. Census Bureau, Statistical Abstract of the United States: 2004-2005
No. 1197. Foreign Purchases and Sales of U.S. Securities by Type of Security,1990 to 2003, and by Selected Country, 2003
[In billions of dollars (18.7 represents $18,700,000,000). Covers transactions in all types of long-term domestic securities by for-eigners as reported by banks, brokers, and other entities in the United States (except nonmarketable U.S. Treasury notes, foreignseries; and nonmarketable U.S. Treasury bonds and notes, foreign currency series). See headnote, Table 1195. Minus sign (-) indi-cates net sales by foreigners or a net outflow of capital from the United States]
Year and country
Net purchases Total transactions 4
Total
Trea-sury
bondsand
notes 1
U.S.Govt.
corpora-tions 2
bonds
Corpo-rate
bonds 3
Corpo-rate
stocks Total
Trea-sury
bondsand
notes 1
U.S.Govt.
corpora-tions 2
bonds
Corpo-rate
bonds 3
Corpo-rate
stocks
1990 . . . . . . . . . . . . . . 18.7 17.9 6.3 9.7 -15.1 4,204 3,620 104 117 3621991 . . . . . . . . . . . . . . 58.1 19.9 10.2 16.9 11.1 4,706 4,016 124 155 4111992 . . . . . . . . . . . . . . 73.2 39.3 18.3 20.8 -5.1 5,282 4,444 204 187 4481993 . . . . . . . . . . . . . . 111.1 23.6 35.4 30.6 21.6 6,314 5,195 263 239 6181994 . . . . . . . . . . . . . . 140.4 78.8 21.7 38.0 1.9 6,562 5,343 297 222 6991995 . . . . . . . . . . . . . . 231.9 134.1 28.7 57.9 11.2 7,243 5,828 222 278 9151996 . . . . . . . . . . . . . . 370.2 232.2 41.7 83.7 12.5 8,965 7,134 241 422 1,1691997 . . . . . . . . . . . . . . 388.0 184.2 49.9 84.4 69.6 12,759 9,546 469 617 2,1261998 . . . . . . . . . . . . . . 277.8 49.0 56.8 121.9 50.0 14,989 10,259 992 641 3,0971999 . . . . . . . . . . . . . . 350.2 -10.0 92.2 160.4 107.5 14,617 8,586 880 577 4,5742000 . . . . . . . . . . . . . . 457.8 -54.0 152.8 184.1 174.9 16,910 7,795 1,305 775 7,0362001 . . . . . . . . . . . . . . 520.8 18.5 164.0 222.0 116.4 20,003 10,517 2,239 1,260 5,9862002 . . . . . . . . . . . . . . 547.6 119.9 195.1 182.3 50.2 25,498 14,409 3,261 1,459 6,369
2003, total 5 . . . . . . . 744.5 273.0 162.9 271.1 37.5 30,707 18,216 4,488 1,810 6,193United Kingdom . . . . . . . 164.4 30.5 25.2 108.0 0.7 8,833 6,542 338 693 1,260Cayman Islands . . . . . . . 37.0 -10.4 12.6 32.9 1.9 6,574 2,225 2,516 480 1,353Bermuda . . . . . . . . . . . 44.0 25.4 8.4 14.3 -4.0 2,613 1,363 369 99 783France . . . . . . . . . . . . . 4.0 -6.8 0.9 3.6 6.2 1,558 1,004 12 31 511Japan . . . . . . . . . . . . . 181.3 148.9 22.4 12.2 -2.2 1,343 1,015 179 49 100Canada . . . . . . . . . . . . 27.9 10.8 -1.4 6.9 11.7 1,311 904 45 39 323Norway. . . . . . . . . . . . . 20.7 8.3 1.6 5.8 5.0 805 747 27 8 23Bahamas, The . . . . . . . . 1.1 -6.0 4.8 2.1 0.1 763 475 75 52 161Ireland . . . . . . . . . . . . . 25.1 3.8 4.1 9.5 7.8 726 526 39 40 122China 6. . . . . . . . . . . . . 64.7 30.5 29.6 4.6 -0.1 695 505 176 10 4Netherlands Antilles . . . . 7.3 6.8 -1.0 0.7 0.8 543 299 103 8 133Germany . . . . . . . . . . . 9.7 7.9 -1.1 3.8 -0.9 440 299 22 31 88Netherlands . . . . . . . . . 1.4 0.2 -0.1 1.3 0.1 412 279 49 13 71Hong Kong . . . . . . . . . . 23.3 6.0 11.9 4.5 0.9 325 248 46 12 19Singapore . . . . . . . . . . . 6.1 -1.3 0.7 3.3 3.4 289 170 26 23 69
1 Marketable bonds and notes. 2 Includes federally-sponsored agencies. 3 Includes transactions in directly placed issuesabroad by U.S. corporations and issues of states and municipalities. 4 Total purchases plus total sales. 5 Includes othercountries, not shown separately. 6 See footnote 3, Table 1198.
Source: U.S. Dept. of Treasury, Treasury Bulletin, quarterly.
No. 1198. Foreign Holdings of U.S. Securities by Country: 2001 to 2003
[In billions of dollars (1,063.1 represents $1,063,100,000,000). Covers only private holdings of U.S. securities, except as noted]
CountryU.S. Treasury
securities 1Country
Corporate andagency bonds Corporate stocks
2001 2002 2003 2001 2002 2003 2001 2002 2003
Total holdings 2 . 1,063.1 1,254.1 1,499.2 Total holdings . 1,343.1 1,600.4 1,853.0 1,478.3 1,186.2 1,538.1Japan . . . . . . . . . . 330.1 385.3 542.2 Europe 2 . . . . . . . . 935.7 1,086.0 1,225.9 915.9 714.5 929.7China 3. . . . . . . . . . 89.7 124.3 168.1 United Kingdom. . 593.2 648.2 749.2 289.2 213.4 269.3Korea, South . . . . . . 29.1 48.0 61.9 France . . . . . . . . 14.3 17.5 22.6 44.3 35.2 51.4United Kingdom . . . . 28.6 67.0 58.3 Germany . . . . . . 34.4 31.5 33.3 84.1 58.3 72.5Taiwan 3 . . . . . . . . . 37.9 40.5 50.4 Italy . . . . . . . . . . 4.0 5.2 7.6 34.4 26.9 34.4Hong Kong . . . . . . . 47.7 44.4 48.9 Netherlands . . . . 25.8 29.0 28.7 111.3 93.8 118.7Switzerland . . . . . . . 28.6 37.7 45.3 Canada . . . . . . . . . 30.6 37.1 49.4 165.0 142.3 192.5Germany . . . . . . . . 42.9 38.0 43.8 Japan . . . . . . . . . . 136.9 174.1 169.3 126.9 109.9 136.4Bermuda . . . . . . . . 11.6 12.6 39.3 Latin America . . . . . 12.3 16.6 28.2 30.2 23.3 29.2
Mexico . . . . . . . . . . 22.1 27.5 31.9Other WesternHemisphere . . . . . 159.4 191.7 260.0 148.0 109.2 134.9
Other countries . . . . 68.2 94.9 120.2 92.3 87.0 115.4
1 Includes foreign official holdings. 2 Includes other countries not shown separately. 3 With the establishment of diplomaticrelations with China on January 1, 1979, the U.S. government recognized the People’s Republic of China as the sole legalgovernment of China and acknowledged the Chinese position that there is only one China and that Taiwan is part of China.
Source: U.S. Bureau of Economic Analysis, Survey of Current Business, July 2004.
Banking, Finance, and Insurance 753
U.S. Census Bureau, Statistical Abstract of the United States: 2004-2005
No. 1199. Stock Prices and Yields: 1990 to 2003
[Closing values as of end of December, except as noted]
Index 1990 1995 1999 2000 2001 2002 2003
STOCK PRICES
Standard & Poor’s indices: 1
S&P 500 composite (1941-43=10) . . . . . . . . . . . 330.2 615.9 1,469.3 1,320.3 1,148.1 879.8 1,111.9S&P 400 MidCap Index (1982=100) . . . . . . . . . . 100.0 217.8 444.7 516.7 508.3 429.8 576.0S&P 600 Small Cap Index (Dec. 31, 1993=100) . . (NA) 121.1 197.8 219.6 232.2 196.6 270.4S&P 500/Barra Value Index (Dec. 31, 1974=35) . . 177.7 325.1 610.6 636.2 552.0 428.0 551.9S&P 500/Barra Growth Index (Dec. 31, 1974=35) . 159.9 302.0 887.3 687.6 594.6 448.8 555.9
Russell indices: 2
Russell 1000 (Dec. 31, 1986=130) . . . . . . . . . . . 171.2 328.9 768.0 700.1 604.9 466.2 594.6Russell 2000 (Dec. 31, 1986=135) . . . . . . . . . . . 132.2 316.0 504.8 483.5 488.5 383.1 556.9Russell 3000 (Dec. 31, 1986=140) . . . . . . . . . . . 180.9 351.9 793.3 725.8 634.2 489.5 630.1
N.Y. Stock Exchange common stock index:Composite (Dec. 31, 2002=5000). . . . . . . . . . . . 1,908.5 3,484.2 6,876.1 6,945.6 6,236.4 5,000.0 6,440.3
Yearly high . . . . . . . . . . . . . . . . . . . . . . . 2,126.7 3,501.7 7,011.7 7,164.6 7,048.1 6,445.0 6,469.5Yearly low . . . . . . . . . . . . . . . . . . . . . . . . 1,715.1 2,651.2 6,092.3 6,094.9 5,331.4 4,452.5 4,418.6
American Stock Exchange Composite Index(Dec. 29, 1995=550) . . . . . . . . . . . . . . . . . . . . . (NA) 550.0 877.0 897.8 847.6 824.4 1,173.6
NASDAQ composite index (Feb. 5, 1971=100) . . . . 373.8 1,052.1 4,069.3 2,470.5 1,950.4 1,335.5 2,003.4Nasdaq-100 (Jan. 31, 1985=125). . . . . . . . . . . . 200.5 576.2 3,708.0 2,341.7 1,577.1 984.4 1,467.9Industrial (Feb. 5, 1971=100) . . . . . . . . . . . . . . 406.1 964.7 2,239.0 1,483.0 1,389.2 1,029.7 1,603.7Banks (Feb. 5, 1971=100) . . . . . . . . . . . . . . . . 254.9 1,009.4 1,691.3 1,939.5 2,134.9 2,231.3 2,899.2Computers (Oct. 29, 1993=200). . . . . . . . . . . . . (NA) 366.1 2,325.4 1,295.0 980.5 622.6 934.9Transportation (Feb. 5, 1971=100) . . . . . . . . . . . 417.1 816.4 999.1 1,160.4 1,285.0 1,297.6 1,754.4Telecommunications (October 29, 1993=200) . . . . 84.0 208.4 1,015.4 463.4 236.6 108.8 183.6Biotech (Oct. 29, 1993=200) . . . . . . . . . . . . . . . (NA) 304.3 881.8 1,084.5 908.8 496.9 724.1
Dow-Jones and Co., Inc.:Composite (65 stocks) . . . . . . . . . . . . . . . . . . . 920.6 1,693.2 3,214.4 3,317.4 2,892.2 2,375.0 3,000.8
Industrial (30 stocks) . . . . . . . . . . . . . . . . . . 2,633.7 5,117.1 11,497.1 10,786.9 10,021.5 8,341.6 10,453.9Transportation (20 stocks) . . . . . . . . . . . . . . . 910.2 1,981.0 2,977.2 2,946.6 2,640.0 2,310.0 3,007.1Utility (15 stocks) . . . . . . . . . . . . . . . . . . . . . 209.7 225.4 283.4 412.2 293.9 215.2 266.9
Wilshire 5000 Total Market Index 3
(Dec. 31, 1980=1404.596) . . . . . . . . . . . . . . . . . 3,101.4 6,057.2 13,812.7 12,175.9 10,818.6 8,343.2 10,799.4
COMMON STOCK YIELDS (percent)Standard & Poor’s composite index (500 stocks): 4
Dividend-price ratio 5 . . . . . . . . . . . . . . . . . . . . 3.61 2.56 1.25 1.15 1.32 1.61 1.77Earnings-price ratio 6 . . . . . . . . . . . . . . . . . . . . 6.47 6.09 3.17 3.63 2.95 2.92 3.85
NA Not available. 1 Standard & Poor’s Indices are market-value weighted and are chosen for market size, liquidity, andindustry group representation. The S&P 500 index represents the 500 largest publicly traded companies. The S&P MidCap Indextracks mid-cap companies. The S&P SmallCap Index consists of 600 domestic small-cap stocks. 2 The Russell 1000 and 3000indices show respectively the 1000 and 3000 largest capitalization stocks in the United States. The Russell 2000 index shows the2000 largest capitalization stocks in the United States after the first 1000. 3 The Wilshire 5000 Total Market Index measures theperformance of all U.S. headquartered equity securities with readily available prices. 4 Source: U.S. Council of EconomicAdvisors, Economic Report of the President, annual. 5 Aggregate cash dividends (based on latest known annual rate) dividedby aggregate market value based on Wednesday closing prices. Averages of monthly figures. 6 Averages of quarterly ratioswhich are ratio of earnings (after taxes) for 4 quarters ending with particular quarter to price index for last day of that quarter.
Source: Except as noted, Global Financial Data, Los Angeles, CA, <http://www.globalfindata.com/trial/index2.html>; (copy-right).
No. 1200. Dow-Jones U.S. Equity Market Index by Industry: 1995 to 2003
[As of end of year]
Industry 1995 1998 1999 2000 2001 2002 2003
U.S. Equity Market Index, total . . . . . . . 147.49 281.61 341.57 306.88 266.71 204.51 262.68Basic materials . . . . . . . . . . . . . . . . . . . . 139.19 150.23 187.16 154.49 153.22 136.97 181.10Consumer, cyclical . . . . . . . . . . . . . . . . . . 140.36 282.76 341.88 277.68 278.19 209.66 278.49Consumer, noncyclical. . . . . . . . . . . . . . . . 134.03 246.00 244.64 215.56 217.96 204.19 242.73Energy . . . . . . . . . . . . . . . . . . . . . . . . . . 134.54 186.15 219.71 272.96 236.74 200.29 246.08Financial . . . . . . . . . . . . . . . . . . . . . . . . . 176.60 356.05 354.55 440.91 404.50 346.36 445.96Healthcare . . . . . . . . . . . . . . . . . . . . . . . 127.77 277.52 263.62 360.18 310.76 242.87 286.04Industrial. . . . . . . . . . . . . . . . . . . . . . . . . 156.39 245.89 308.19 276.11 245.14 179.78 235.69Technology . . . . . . . . . . . . . . . . . . . . . . . 229.18 648.08 1,188.60 749.01 535.89 327.84 493.02Telecommunications . . . . . . . . . . . . . . . . . 154.84 305.76 356.97 210.38 180.62 115.04 119.12Utilities . . . . . . . . . . . . . . . . . . . . . . . . . . 109.07 141.84 118.12 177.80 127.04 95.75 114.54
Source: Dow Jones & Company, Inc., New York, NY, Dow Jones Indexes, (copyright).
754 Banking, Finance, and Insurance
U.S. Census Bureau, Statistical Abstract of the United States: 2004-2005
No. 1201. Sales of Stocks on Registered Exchanges: 1990 to 2003
[1,752 represents $1,752,000,000,000. Excludes over-the-counter trading]
Exchange Unit 1990 1995 1996 1997 1998 1999 2000 2001 2002 2003
Market value of all sales,all exchanges 1 2 . . . . . . . Bil. dol . . 1,752 3,690 4,735 6,879 8,698 11,220 14,552 13,315 13,715 14,670
New York . . . . . . . . . . . . . . . Bil. dol . . . 1,394 3,078 4,013 5,848 7,275 9,087 11,217 10,738 10,793 10,050American . . . . . . . . . . . . . . . Bil. dol . . . 65 105 131 204 355 543 915 884 730 682Chicago . . . . . . . . . . . . . . . . Bil. dol . . . 74 114 136 213 326 540 1,038 702 526 448CBOE 3 . . . . . . . . . . . . . . . . Bil. dol . . . 81 107 130 179 214 271 330 197 157 159Pacific . . . . . . . . . . . . . . . . . Bil. dol . . . 53 94 108 151 182 255 248 96 69 1,441Philadelphia . . . . . . . . . . . . . Bil. dol . . . 41 59 68 89 97 103 165 130 86 116
STOCKS 4
Shares sold, all exchanges 2 . . Billion . . . 53.3 106.4 125.7 159.7 206.4 244.1 317.7 371.1 479.5 568.9New York. . . . . . . . . . . . . . Billion . . . 43.8 90.1 108.2 138.8 178.9 207.7 265.7 313.4 376.7 379.3American. . . . . . . . . . . . . . Billion . . . 3.1 4.8 5.3 6.2 7.6 8.7 11.9 15.3 17.3 19.9Chicago . . . . . . . . . . . . . . Billion . . . 2.5 3.9 4.2 6.0 9.5 14.4 24.1 27.3 24.0 24.2Pacific. . . . . . . . . . . . . . . . Billion . . . 1.7 2.7 3.0 3.2 4.0 4.9 4.1 1.5 1.1 63.8
Market value, all exchanges 2 . . Bil. dol . . . 1,612 3,507 4,511 6,559 8,307 10,680 13,691 12,721 13,230 14,131New York. . . . . . . . . . . . . . Bil. dol . . . 1,390 3,076 4,011 5,847 7,274 9,087 11,216 10,737 10,793 10,050American. . . . . . . . . . . . . . Bil. dol . . . 36 73 86 139 280 446 758 807 684 644Chicago . . . . . . . . . . . . . . Bil. dol . . . 74 114 136 213 326 540 1,038 702 526 448Pacific. . . . . . . . . . . . . . . . Bil. dol . . . 45 79 92 123 148 206 163 46 47 1,422
1 Includes market value of stocks, rights, warrants, and options trading. 2 Includes other registered exchanges, not shownseparately. 3 Chicago Board Options Exchange, Inc. 4 Includes voting trust certificates, American Depository Receipts, andcertificate of deposit for stocks.
Source: U.S. Securities and Exchange Commission, Annual Report.
No. 1202. Volume of Trading on New York Stock Exchange: 1990 to 2003
[39,946 represents 39,946,000,000. Round lot: A unit of trading or a multiple thereof. On the NYSE the unit of trading is generally100 shares in stocks. For some inactive stocks, the unit of trading is 10 shares. Odd lot: An amount of stock less than theestablished 100-share unit or 10-share unit of trading]
Item Unit 1990 1995 1997 1998 1999 2000 2001 2002 2003
Shares traded . . . . . . . Million . 39,946 87,873 134,404 171,188 206,299 265,499 311,290 369,069 356,767Round lots . . . . . . . . . . . . . Million . . 39,665 87,218 133,312 169,745 203,914 262,478 307,509 363,135 352,398
Average daily shares . . . . . Million . . 157 346 527 674 809 1,042 1,240 1,441 1,398High day . . . . . . . . . . . . . Million . . 292 653 1,201 1,216 1,350 1,560 2,368 2,813 1,886Low day . . . . . . . . . . . . . Million . . 57 118 155 247 312 403 414 462 360
Odd lots . . . . . . . . . . . . . . . Million . . 282 656 1,091 1,443 2,384 3,021 3,781 5,934 4,370
Value of shares traded . Bil. dol . 1,336 3,110 5,833 7,395 9,073 11,205 10,645 10,491 9,846Round lots . . . . . . . . . . . . . Bil. dol. . 1,325 3,083 5,778 7,318 8,945 11,060 10,489 10,278 9,692Odd lots . . . . . . . . . . . . . . . Bil. dol. . 11 27 56 77 128 145 155 213 154
Bond volume 1. . . . . . . Mil. dol . 10,893 6,979 5,046 3,838 3,221 2,328 2,668 3,625 2,503Daily average . . . . . Mil. dol . 43.1 27.7 19.9 15.2 12.8 9.2 10.8 14.4 9.9
1 Par value.
Source: New York Stock Exchange, Inc., New York, NY, Fact Book, annual (copyright).
No. 1203. Securities Listed on New York Stock Exchange: 1990 to 2003
[As of December 31, except cash dividends are for calendar year (1,689 represents $1,689,000,000,000)]
Item Unit 1990 1994 1995 1996 1997 1998 1999 2000 2001 2002 2003
BONDS
Number of issuers . . . . . Number . 743 583 564 563 533 474 416 392 369 343 340Number of issues . . . . . . Number . 2,912 2,141 2,097 2,064 1,965 1,858 1,736 1,627 1,447 1,323 1,300Face value . . . . . . . . . . Bil. dol . . 1,689 2,526 2,773 2,845 2,625 2,554 2,402 2,125 1,654 1,378 1,350
STOCKS
Companies . . . . . . . . . . Number . 1,774 2,570 2,675 2,907 3,047 3,114 3,025 2,862 2,798 2,783 2,750Number of issues . . . . . . Number . 2,284 3,060 3,126 3,285 3,358 3,382 3,286 3,072 2,984 2,966 2,943Shares listed . . . . . . . . . Billions . . 90.7 142.3 154.7 176.9 207.1 239.3 280.9 313.9 341.5 349.9 359.7Market value . . . . . . . . . Bil. dol . . 2,820 4,448 6,013 7,300 9,413 10,864 12,296 12,372 11,714 9,603 12,200Average price . . . . . . . . Dollars . . 31.08 31.26 38.86 41.26 45.45 45.40 43.77 42.14 34.11 28.39 27.50
Source: New York Stock Exchange, Inc., New York, NY, Fact Book, annual (copyright).
Banking, Finance, and Insurance 755
U.S. Census Bureau, Statistical Abstract of the United States: 2004-2005
No. 1204. Stock Ownership by Age of Head of Family and Family Income:1995 to 2001
[Median value in thousands of constant 2001 dollars (16.9 represents $16,900). Constant dollar figures are based on consumerprice index data published by U.S. Bureau of Labor Statistics. Families include one-person units; for definition of family, see text,Section 1. Based on Survey of Consumer Finance; see Appendix III. For definition of median, see Guide to Tabular Presentation]
Age of family head and family income(constant (2001) dollars)
Families having direct orindirect stock holdings 1
(percent)
Median value amongfamilies with holdings
Stock holdings’ share ofgroup’s financial assets
(percent)
1995 1998 2001 1995 1998 2001 1995 1998 2001
All families . . . . . . . . . . . . . . . . 40.4 48.9 51.9 16.9 27.2 34.3 39.9 53.9 56.0
Under 35 years old . . . . . . . . . . . . . 36.6 40.8 48.9 5.9 7.6 7.0 27.2 44.8 52.635 to 44 years old. . . . . . . . . . . . . . 46.4 56.7 59.5 11.6 21.8 27.5 39.5 54.6 57.345 to 54 years old. . . . . . . . . . . . . . 48.9 58.6 59.2 30.0 41.4 50.0 42.6 55.7 59.155 to 64 years old. . . . . . . . . . . . . . 40.0 55.9 57.1 35.8 51.2 81.2 44.2 58.4 56.165 to 74 years old. . . . . . . . . . . . . . 34.4 42.7 39.2 39.3 61.0 150.0 35.8 51.3 55.175 years old and over . . . . . . . . . . . 27.9 29.4 34.2 23.1 65.3 120.0 39.8 48.7 51.4
Percentiles of income: 2
Less than 20 ($10,300). . . . . . . . . 6.5 10.0 12.4 4.3 5.4 7.0 14.2 20.4 36.920-39.9 ($24,400) . . . . . . . . . . . . 24.7 30.8 33.5 7.3 10.9 7.5 26.7 29.7 34.940-59.9 ($39,900) . . . . . . . . . . . . 41.5 50.2 52.1 7.2 13.1 15.0 28.4 37.9 46.460-79.9 ($64,800) . . . . . . . . . . . . 54.3 69.3 75.7 14.6 20.4 28.5 35.6 45.7 51.780-89.9 ($98,700) . . . . . . . . . . . . 69.7 77.9 82.0 28.9 49.0 64.6 41.3 50.4 57.490-100 ($302,700) . . . . . . . . . . . . 80.0 90.4 89.6 69.3 146.5 247.7 45.4 62.5 60.4
1 Indirect holdings are those in mutual funds, retirement accounts, and other managed assets. 2 See footnote 8, Table 1162.Source: Board of Governors of the Federal Reserve System, Federal Reserve Bulletin, January 2003, and unpublished data.
No. 1205. Household Ownership of Equities: 2002
[52.7 represents 52,700,000. Based on a national probability sample of 4,009 household financial decision-makers. Furtherquestions about equity ownership were asked of those 1,986 decision-makers who indicated they owned equities]
Type of holdingHouseholds owning equities Number of
individualinvestors
(mil.)Number
(mil.)Percent of all
households
Any type of equity (net) 1. . . . . . . . . . . . . . . . . . . . . . . . . . . . . . . . 52.7 49.5 84.3Any equity inside employer-sponsored retirement plans . . . . . . . . . . 36.2 34.0 57.9Any equity outside employer-sponsored retirement plans . . . . . . . . . 35.9 33.7 57.4
Individual stock (net) 1 . . . . . . . . . . . . . . . . . . . . . . . . . . . . . . . . . 25.4 23.9 38.1Individual stock inside employer-sponsored retirement plans. . . . . . . 8.8 8.3 12.3Individual stock outside employer-sponsored retirement plans. . . . . . 21.0 19.7 31.5
Stock mutual funds (net) 1 . . . . . . . . . . . . . . . . . . . . . . . . . . . . . . . 47.0 44.2 70.5Stock mutual funds inside employer-sponsored retirement plans . . . . 33.2 31.2 46.5Stock mutual funds outside employer-sponsored retirement plans . . . 28.7 27.0 43.1
1 Multiple responses included.
No. 1206. Characteristics of Equity Owners: 2002
[In percent, except as indicated. See headnote, Table 1205. For definition of median, see Guide to Tabular Presentation]
Item
Total
Age Household income
18 to34
yearsold
35 to44
yearsold
45 to54
yearsold
55 to64
yearsold
65years
old andover
Lessthan
$50,000
$50,000to
$99,999
$100,000andover
Median age of owner (years) . . . . . . . . . . 47 29 40 50 59 73 46 44 47Median household income (dol.) . . . . . . . . 62,500 60,000 70,000 68,000 62,500 45,000 34,000 70,000 125,000Median household financial assets 1 (dol.) . 100,000 32,500 99,100 136,800 274,300 415,100 37,500 100,000 421,500Equity investments owned:
Individual stock (net) 2 . . . . . . . . . . . . . 49 41 49 50 50 56 39 48 64Inside retirement plans 3 . . . . . . . . . . 17 18 21 18 16 6 11 18 22Outside retirement plans 3. . . . . . . . . 41 33 40 42 44 50 31 40 57
Stock mutual funds (net) 2 . . . . . . . . . . 89 85 90 93 93 83 88 90 91Inside retirement plans 3 . . . . . . . . . . 66 67 76 77 61 28 57 73 73Outside retirement plans 3. . . . . . . . . 56 47 54 52 67 67 50 50 67
Non-equity investments owned: 2
Savings accounts, MMDAs, or CDs 4 . . . 86 88 87 84 82 86 78 89 87Bond investments (net) 2 . . . . . . . . . . . 36 28 31 35 44 48 26 35 43
Individual bonds . . . . . . . . . . . . . . . 17 13 15 16 21 28 13 15 21Bond mutual funds. . . . . . . . . . . . . . 26 19 23 25 31 34 17 25 31
Fixed or variable annuities . . . . . . . . . . 23 13 19 25 31 33 21 23 24Hybrid mutual funds . . . . . . . . . . . . . . 52 43 51 55 60 52 43 51 61Money market mutual funds . . . . . . . . . 35 27 35 35 43 36 25 33 44Investment real estate . . . . . . . . . . . . . 24 15 20 29 32 30 17 22 40
Have retirement plan coverage 3 . . . . . . . . 79 81 87 84 78 58 75 87 83Have Individual Retirement Account (IRA). . 57 46 56 62 66 55 43 58 72
1 Includes assets in employer-sponsored retirement plans but excludes value of primary residence. 2 Multiple responsesincluded. 3 Employer-sponsored. 4 MMDA=money market deposit account; CD=certificate of deposit.
Source of Tables 1205 and 1206: Investment Company Institute, Washington, DC, and Securities Industry Association, NewYork, NY, Equity Ownership in America, Fall 2002 (copyright).
756 Banking, Finance, and Insurance
U.S. Census Bureau, Statistical Abstract of the United States: 2004-2005
No. 1207. Households Owning Mutual Funds by Age and Income:2000 and 2003
[In percent. Includes money market, stock, bond and hybrid, variable annuity, IRA, Keogh, and employer-sponsored retirementplan fund owners. In 2003, an estimated 53,300,000 households own mutual funds. Based on a sample survey of 3,000households; for details, see source]
Age of household headand household income
Percentdistri-
bution,2003
As percentof all households
2000 2003
Total . . . . . . . . . . 100 49 48Less than 25 years old . 4 23 2725 to 34 years old. . . . . 16 49 4435 to 44 years old. . . . . 26 58 5445 to 54 years old. . . . . 25 59 5755 to 64 years old. . . . . 16 54 5965 years old and over . . 13 32 34
Age of household headand household income
Percentdistri-
bution,2003
As percentof all households
2000 2003
Less than $25,000 . . . . 7 17 15$25,000 to $34,999 . . . . 9 37 33$35,000 to $49,999 . . . . 14 49 41$50,000 to $74,999 . . . . 29 66 59$75,000 to $99,999 . . . . 18 77 77$100,000 and over . . . . 23 79 83
Source: Investment Company Institute, Washington, DC, Fundamentals, Investment Company Institute Research in Brief,Vol. 9, No. 4, August 2000 and Vol. 12, No. 4, October 2003 (copyright).
No. 1208. Characteristics of Mutual Fund Owners: 2001[In percent, except as indicated. Mutual fund ownership includes holdings of money market, stock, bond, and hybrid mutualfunds; and funds owned through variable annuities, Individual Retirement Accounts (IRAs), Keoghs, and employer-sponsoredretirement plans. Based on a national probability sample of 2,592 primary financial decisionmakers in households with mutualfund investments. For definition of median, see Guide to Tabular Presentation]
Characteristic
Total
Age Household income
Under 40years old
40 to 64years old
65 yearsold and
over
Lessthan
$50,000
$50,000to
$100,000Over
$100,000
Median age (years) . . . . . . . . . . . . . . . . . . . . . 46 33 49 72 43 45 46Median household income (dol.) . . . . . . . . . . . . 62,100 60,000 70,000 50,000 32,500 65,000 130,000Median household financial assets 1 (dol.). . . . . . 100,000 50,000 150,000 243,000 40,000 100,000 300,000Own an IRA. . . . . . . . . . . . . . . . . . . . . . . . . . 60 59 60 58 51 60 66Household has a defined contribution retirementplan(s), net 2 . . . . . . . . . . . . . . . . . . . . . . . . 81 87 84 58 75 88 86401(k) plan. . . . . . . . . . . . . . . . . . . . . . . . . 64 75 67 20 55 68 72403(b) plan . . . . . . . . . . . . . . . . . . . . . . . . 11 12 11 10 9 12 13State, local, or federal government plan. . . . . . 35 31 36 42 34 38 38
Median mutual fund assets (dol.) . . . . . . . . . . . . 40,000 20,000 60,000 59,500 17,500 44,800 120,000Median number of mutual funds owned . . . . . . . 4 4 4 3 3 4 6Own: 2
Equity funds . . . . . . . . . . . . . . . . . . . . . . . . 88 90 89 80 86 87 96Bond funds . . . . . . . . . . . . . . . . . . . . . . . . 37 31 39 41 31 34 44Hybrid funds. . . . . . . . . . . . . . . . . . . . . . . . 34 33 34 34 33 32 43Money market mutual funds . . . . . . . . . . . . . 48 41 52 50 44 44 53
Own mutual funds bought: 2
Outside employer-sponsored retirement plan(s). 69 59 71 89 60 60 75Inside employer-sponsored retirement plan(s) . . 62 71 66 24 57 69 76
1 Includes assets in employer-sponsored retirement plans but excludes value of primary residence. 2 Multiple responsesincluded.
Source: Investment Company Institute, Washington, DC, 2001 Profile of Mutual Fund Shareholders, 2001 (copyright).
No. 1209. Mutual Funds—Summary: 1990 to 2003[Number of funds and assets as of December 31 (1,065 represents $1,065,000,000,000). A mutual fund is an open-endinvestment company that continuously issues and redeems shares that represent an interest in a pool of financial assets. Excludesdata for funds that invest in other mutual funds. Minus sign (-) indicates net redemptions]
Type of fund Unit 1990 1995 1997 1998 1999 2000 2001 2002 2003
Number of funds, total . . . . . . . Number. . 3,079 5,725 6,684 7,314 7,791 8,155 8,305 8,244 8,126Equity funds . . . . . . . . . . . . . . . . Number . . 1,099 2,139 2,951 3,513 3,952 4,385 4,716 4,748 4,601Hybrid funds . . . . . . . . . . . . . . . . Number . . 193 412 501 525 532 523 483 474 509Bond funds . . . . . . . . . . . . . . . . . Number . . 1,046 2,177 2,219 2,250 2,262 2,208 2,091 2,033 2,043Money market funds, taxable 1 . . . . Number . . 506 674 682 685 702 703 689 679 661Money market funds, tax-exempt 2. . Number . . 235 323 331 341 343 336 326 310 312
Assets, total . . . . . . . . . . . . . . Bil. dol . . 1,065 2,811 4,468 5,525 6,846 6,965 6,975 6,390 7,414Equity funds . . . . . . . . . . . . . . . . Bil. dol . . . 240 1,249 2,368 2,978 4,042 3,962 3,418 2,663 3,685Hybrid funds . . . . . . . . . . . . . . . . Bil. dol . . . 36 210 317 365 379 346 346 330 437Bond funds . . . . . . . . . . . . . . . . . Bil. dol . . . 291 599 724 831 812 811 925 1,125 1,241Money market funds, taxable 1 . . . . Bil. dol . . . 415 630 898 1,163 1,409 1,607 2,013 1,997 1,763Money market funds, tax-exempt 2. . Bil. dol . . . 84 123 161 189 204 238 272 275 288Equity, hybrid and bond funds:
Sales . . . . . . . . . . . . . . . . . . . Bil. dol . . . 149 475 869 1,058 1,274 1,630 1,383 1,434 1,430Redemptions . . . . . . . . . . . . . . Bil. dol . . . 98 313 541 748 1,021 1,330 1,177 1,228 1,148Net sales . . . . . . . . . . . . . . . . . Bil. dol . . . 51 163 328 310 252 300 206 206 282
Money market funds, taxable: 1
Sales . . . . . . . . . . . . . . . . . . . Bil. dol . . . 1,219 2,729 4,395 5,534 7,083 8,691 10,701 11,011 10,149Redemptions . . . . . . . . . . . . . . Bil. dol . . . 1,183 2,617 4,265 5,289 6,866 8,499 10,314 11,075 10,401Net sales . . . . . . . . . . . . . . . . . Bil. dol . . . 36 112 129 244 217 192 387 -64 -252
Money market funds, tax-exempt: 2
Sales . . . . . . . . . . . . . . . . . . . Bil. dol . . . 197 396 536 639 687 788 783 750 873Redemptions . . . . . . . . . . . . . . Bil. dol . . . 190 385 518 612 675 757 751 736 866Net sales . . . . . . . . . . . . . . . . . Bil. dol . . . 7 11 18 27 12 31 31 14 7
1 Funds invest in short-term, high-grade securities sold in the money market. 2 Funds invest in municipal securities withrelatively short maturities.
Source: Investment Company Institute, Washington, DC, Mutual Fund Fact Book, annual (copyright).
Banking, Finance, and Insurance 757
U.S. Census Bureau, Statistical Abstract of the United States: 2004-2005
No. 1210. Mutual Fund Shares—Holdings and Net Purchases by Type ofInvestor: 1990 to 2003
[In billions of dollars (608 represents $608,000,000,000). Holdings as of Dec. 31. Minus sign (-) indicates net sales]
Type ofinvestor
Holdings Net purchases
1990 1995 2000 2002 2003 1990 1995 2000 2002 2003
Total . . . . . . . . . . . . . . . . . 608 1,853 4,435 3,639 4,665 53.7 147.4 235.0 182.7 288.2Households, nonprofitorganizations . . . . . . . . . . . . . . 457 1,153 3,036 2,539 3,292 22.5 75.5 171.6 118.8 293.1
Nonfinancial corporate business. . . 10 46 123 90 128 -1.0 4.6 5.0 9.3 9.3State and local governments . . . . . 5 35 26 33 31 3.3 5.9 0.8 2.0 -3.0Commercial banking . . . . . . . . . . 2 2 15 20 17 -0.3 0.3 2.5 1.7 -6.2Credit unions . . . . . . . . . . . . . . . 1 3 2 4 4 0.2 0.2 -0.3 -0.2 0.5Bank personal trusts and estates . . 63 254 397 339 391 9.7 11.9 48.5 37.3 -15.0Life insurance companies . . . . . . . 31 33 102 81 107 12.6 3.9 5.7 2.8 7.6Private pension funds . . . . . . . . . 40 327 734 533 696 6.6 45.0 1.2 11.0 1.9
Source: Board of Governors of the Federal Reserve System, ‘‘Federal Reserve Statistical Release, Z.1, Flow of FundsAccounts of the United States’’; published: 4 March 2004; <http://www.federalreserve.gov/releases/Z1/20040304/data.htm>.
No. 1211. Mutual Fund Retirement Assets: 1990 to 2003
[In billions of dollars, except percent (206 represents $206,000,000,000). Based on data from the Institute’s AnnualQuestionnaire for Retirement Statistics. The 2003 survey gathered data from 14,059 mutual fund share classes representingapproximately 83 percent of mutual fund industry assets. Assets were estimated for all non-reporting funds. Estimates of retirementassets in street name and omnibus accounts were derived from data reported on the Annual Questionnaire for RetirementStatistics and the Annual Institutional Survey]
Type of account 1990 1995 1998 1999 2000 2001 2002 2003
Mutual fund retirement assets . . . 206 913 1,948 2,535 2,478 2,342 2,078 2,662Percent of total retirement assets . 5 13 19 22 21 21 20 22
Individual retirement accounts (IRAs) . . . 139 470 968 1,259 1,230 1,160 1,032 1,306Employer-sponsored definedcontribution retirement plans . . . . . . . . 67 443 980 1,276 1,248 1,182 1,046 1,356401(k) plans 1 . . . . . . . . . . . . . . . . . 35 266 619 814 820 799 711 922
Percent of total 401(k) assets 2 . . . . 9 31 40 45 46 47 47 49403(b) plans 3 . . . . . . . . . . . . . . . . . 15 119 233 289 264 238 200 263457 plans 4 . . . . . . . . . . . . . . . . . . . 2 8 24 40 38 37 31 38Other defined contribution plans 5 . . . . 15 50 104 133 127 109 105 133
Percent of all mutual funds:Mutual fund retirement assets . . . . . . 19 32 35 37 36 34 33 36
Individual retirement accounts (IRAs) . . . 13 17 18 18 18 17 16 18Employer-sponsored retirement plans . . . 6 16 18 19 18 17 16 18
1 A 401(k) plan is a qualified retirement plan that allows participants to have a portion of their compensation (otherwise payablein cash) contributed pretax to a retirement account on their behalf. Predominantly 401(k) assets, but may also include someprofit-sharing plan assets that do not have a 401(k) feature. 2 Beginning 2000 percents are estimated. 3 Section 403(b) of theInternal Revenue Code permits employees of certain charitable organizations, nonprofit hospitals, universities, and public schoolsto establish tax-sheltered retirement programs. These plans may invest in either annuity contracts or mutual fund shares.4 These plans are deferred compensation arrangements for government employees and employees of certain tax-exemptorganizations. 5 Includes Keoghs; target benefit plans; thrift savings plans, stock bonus plans, and money purchase planswithout a 401(k) feature; and all other defined contribution plans not specified elsewhere.
Source: Investment Company Institute, Washington, DC, Fundamentals, Investment Company Institute Research in Brief,‘‘Mutual Funds and the Retirement Market in 2003’’; Vol. 13, No. 2, June 2004; <http://www.ici.org> (copyright).
No. 1212. Individual Retirement Accounts (IRA) Plans—Value by Institution:1990 to 2003
[As of December 31 (637 represents $637,000,000,000). Estimated]
InstitutionAmount(bil. dol.)
Percentdistribution
1990 1995 1998 1999 2000 2001 2002 2003 1990 2000 2003
Total IRA assets . . . . . . . . . 637 1,288 2,150 2,651 2,629 2,619 2,445 3,007 100 100 100
Bank and thrift deposits 1 . . . . . 266 261 249 244 252 255 263 268 42 10 9Life insurance companies 2 . . . . 40 81 156 202 202 210 267 315 6 8 10Mutual funds . . . . . . . . . . . . . . 139 470 968 1,259 1,230 1,160 1,032 1,306 22 47 43Securities heldin brokerage accounts 3. . . . . . 191 477 776 947 945 994 883 1,117 30 36 37
1 Includes Keogh deposits. 2 Annuities held by IRAs, excluding variable annuity mutual fund IRA assets. 3 Excludesmutual fund assets held through brokerage accounts, which are included in mutual funds.
Source: Investment Company Institute, Washington, DC, Fundamentals, Investment Company Institute Research in Brief,‘‘Mutual Funds and the Retirement Market in 2003’’; Vol. 13, No. 2, June 2004; <http://www.ici.org> (copyright).
758 Banking, Finance, and Insurance
U.S. Census Bureau, Statistical Abstract of the United States: 2004-2005
No. 1213. Assets of Private and Public Pension Funds by Type of Fund:1990 to 2003
[In billions of dollars (3,337 represents $3,337,000,000,000). As of end of year. Except for corporate equities, represents bookvalue. Excludes social security trust funds, see Table 526]
Type of pension fund 1990 1995 1997 1998 1999 2000 2001 2002 2003
Total, all types . . . . . . . . . . . 3,337 5,614 7,251 8,125 8,975 8,968 8,569 7,885 9,181Private funds . . . . . . . . . . . . . . . . . . 2,197 3,769 4,775 5,353 5,972 5,879 5,528 5,024 5,937
Insured 1 . . . . . . . . . . . . . . . . . . . 570 881 1,086 1,248 1,431 1,456 1,465 1,492 1,743Noninsured 2 3 . . . . . . . . . . . . . . . 1,627 2,889 3,689 4,105 4,541 4,423 4,063 3,533 4,194
Credit market instruments 3 . . . . . 464 608 647 621 635 666 673 701 701U.S. Government securities 3 . . 255 335 330 280 288 301 303 309 304
Agency . . . . . . . . . . . . . . . 133 214 211 195 209 225 237 242 237Corporate and foreign bonds . . 158 240 277 298 299 318 324 332 341
Corporate equities . . . . . . . . . . . 606 1,278 1,667 1,948 2,269 2,138 1,860 1,418 1,873Mutual fund shares . . . . . . . . . . 40 327 570 668 754 734 652 533 696Unallocated insurance contracts 4. 215 332 382 385 393 378 369 363 398
State and local pension funds 3 . . . . . 801 1,303 1,817 2,054 2,227 2,290 2,180 1,964 2,284Credit market instruments 3 . . . . . . 402 530 632 705 751 806 788 802 815
U.S. Government securities . . . . . 231 291 340 360 376 399 366 364 367Corporate and foreign bonds . . . . 142 189 245 280 310 340 351 361 363
Corporate equities. . . . . . . . . . . . . 285 679 1,085 1,234 1,343 1,335 1,222 1,002 1,319Federal government retirement funds 5. 340 541 659 718 776 799 862 897 960
1 Annuity reserves held by life insurance companies, excluding unallocated contracts held by private pension funds.2 Private defined benefit plans and defined contribution plans (including 401(k) type plans). 3 Includes other types of assets notshown separately. 4 Assets held at life insurance companies (e.g., guaranteed investment contracts (GICs), variableannuities). 5 Includes the Federal Employees Thrift Savings Plan, the National Railroad Retirement Investment Trust, andnonmarketable government securities held by federal government retirement funds.
Source: Board of Governors of the Federal Reserve System, ‘‘Federal Reserve Statistical Release, Z.1, Flow of FundsAccounts of the United States’’; published: 4 March 2004; <http://www.federalreserve.gov/releases/Z1/20040304/data.htm>.
No. 1214. Annual Revenues of Selected Securities Industries: 1999 to 2002
[In millions of dollars (285,317 represents $285,317,000,000). Covers taxable employer firms only. Based on the NorthAmerican Industry Classification System (NAICS), 1997; see text, Section 15. Based on Service Annual Survey; see Appendix III]
Kind of business NAICScode 1999 2000 2001 2002
Total . . . . . . . . . . . . . . . . . . . . . . . . . . 523x 285,317 331,497 288,417 256,879
Securities and commodity contractsintermediation and brokerage . . . . . . . . . . . . 5231 193,759 227,841 191,007 163,080Investment banking & securities dealing . . . . 52311 104,154 116,244 97,479 79,083Securities brokerage . . . . . . . . . . . . . . . . . 52312 85,050 106,933 88,757 79,257Commodity contracts dealing . . . . . . . . . . . 52313 1,807 1,920 1,980 1,985Commodity contracts brokerage . . . . . . . . . 52314 2,748 2,744 2,791 2,754
Other financial investment activities 1 . . . . . . . . 5239x 91,558 103,656 97,410 93,799Portfolio management . . . . . . . . . . . . . . . . 52392 76,275 86,395 81,855 77,247Investment advice . . . . . . . . . . . . . . . . . . . 52393 15,283 17,261 15,555 16,553
1 Excludes NAICS 52391 (miscellaneous intermediation) and NAICS 52399 (all other financial investment activities).
Source: U.S. Census Bureau, Service Annual Survey: 2002.
No. 1215. Securities Industry—Financial Summary: 1990 to 2002
[In billions of dollars, except as indicated (71.4 represents $71,400,000,000)]
Type 1990 1995 1996 1997 1998 1999 2000 2001 2002
Number of firms . . . . . . . . . . . . . 8,437 7,722 7,774 7,796 7,685 7,461 7,258 7,002 6,768Revenues, total . . . . . . . . . . . 71.4 143.4 172.4 207.2 235.0 266.8 349.5 280.1 221.8
Commissions . . . . . . . . . . . . . . . 12.0 23.2 27.9 32.7 36.7 45.9 54.1 44.8 45.0Trading/investment gains . . . . . . . 15.7 29.0 30.8 36.0 32.8 55.5 70.8 39.0 24.2Underwriting profits . . . . . . . . . . . 3.7 8.9 12.6 14.6 16.2 17.8 18.7 16.9 14.7Margin interest . . . . . . . . . . . . . . 3.2 6.5 7.4 10.6 12.7 15.2 24.5 13.9 6.4Mutual fund sales . . . . . . . . . . . . 3.2 7.4 10.1 12.4 14.8 16.7 19.4 16.4 15.7Other . . . . . . . . . . . . . . . . . . . . 33.4 68.5 83.7 101.0 121.7 115.7 161.9 149.1 115.8
Expenses, total . . . . . . . . . . . 70.6 132.1 155.4 187.3 217.8 237.7 310.4 260.7 206.5Interest expense . . . . . . . . . . . . . 28.1 56.9 64.7 80.7 98.1 87.5 131.9 98.9 56.4Compensation . . . . . . . . . . . . . . 22.9 41.5 51.0 58.6 65.0 81.7 95.2 83.5 74.9Commissions/clearance paid . . . . . 3.0 5.7 7.4 8.9 10.3 13.5 15.5 14.0 15.0Other . . . . . . . . . . . . . . . . . . . . 16.6 28.0 32.3 39.2 44.3 55.0 67.8 64.2 60.3
Net income, pretax . . . . . . . 0.8 11.3 17.0 20.0 17.2 29.1 39.1 19.4 15.3Pre-tax profit margin (percent) . . . . 1.1 7.9 9.8 9.6 7.3 10.9 11.2 6.9 6.9Pre-tax return on equity (percent) . . 2.2 20.1 27.3 27.1 19.4 27.8 31.1 13.8 10.7
Assets. . . . . . . . . . . . . . . . . . . . 657 1,494 1,748 2,079 2,187 2,537 2,866 3,371 3,261Liabilities . . . . . . . . . . . . . . . . . . 623 1,435 1,682 1,997 2,092 2,423 2,728 3,227 3,119Ownership equity . . . . . . . . . . . . 34 59 66 82 95 114 138 144 142
Source: U.S. Securities and Exchange Commission, Annual Report.
Banking, Finance, and Insurance 759
U.S. Census Bureau, Statistical Abstract of the United States: 2004-2005
No. 1216. Life Insurance in Force and Purchases in the United States—Summary: 1990 to 2002
[As of December 31 or calendar year, as applicable (389 represents 389,000,000). Covers life insurance with life insurance com-panies only. Represents all life insurance in force on lives of U.S. residents whether issued by U.S. or foreign companies]
Year
Life insurance in force Life insurance purchases 2
Numberof
policies,total
(mil.)
Value(bil. dol.)
Number(1,000)
Amount(bil. dol.)
Total 1 Individual Group Total Individual Group Total Individual Group
1990 . . . . . 389 9,393 5,391 3,754 28,791 14,199 14,592 1,529 1,070 4591994 . . . . . 366 11,081 6,449 4,443 32,225 13,835 18,390 1,617 1,057 5601995 . . . . . 370 11,696 6,890 4,605 31,999 12,595 19,404 1,577 1,039 5381996 . . . . . 355 12,704 7,426 5,068 30,783 12,022 18,761 1,704 1,089 6151997 . . . . . 351 13,364 7,873 5,279 31,707 11,734 19,973 1,892 1,204 6891998 . . . . . 358 14,471 8,523 5,735 31,891 11,559 20,332 2,064 1,325 7401999 . . . . . 367 15,496 9,172 6,110 38,584 11,673 26,912 2,367 1,400 9672000 . . . . . 369 15,953 9,376 6,376 34,882 13,345 21,537 2,515 1,594 9212001 . . . . . 377 16,290 9,346 6,765 40,095 14,059 26,036 2,773 1,600 1,1722002 . . . . . 396 16,346 9,312 6,876 38,713 14,692 24,020 2,767 1,753 1,014
1 Includes other types of policy not shown separately. 2 Excludes revivals, increases, dividend additions, and reinsuranceacquired. Includes long-term credit insurance (life insurance on loans of more than 10 years’ duration).
Source: American Council of Life Insurers, Washington, DC, Life Insurers Fact Book, annual (copyright).
No. 1217. U.S. Life Insurance Companies—Summary: 1990 to 2002
[As of December 31 or calendar year, as applicable (402.2 represents $402,200,000,000). Covers domestic and foreignbusiness of U.S. companies. Beginning 1994 includes annual statement data for companies that primarily are health insurancecompanies]
Item Unit 1990 1994 1995 1996 1997 1998 1999 2000 2001 2002
U.S. companies 1 . . . . . . . . . . . . Number . 2,195 2,136 2,079 1,679 1,620 1,563 1,470 1,269 1,225 1,171Income . . . . . . . . . . . . . . . . . . Bil. dol. . 402.2 492.6 528.1 561.1 610.6 663.4 726.9 811.5 724.4 734.0
Life insurance premiums . . . . . Bil. dol.. . 76.7 98.9 102.8 107.6 115.0 119.9 120.3 130.6 125.3 134.5Annuity considerations 2. . . . . . Bil. dol.. . 129.1 153.0 158.4 178.4 197.5 229.5 270.2 306.7 251.3 269.3Health insurance premiums. . . . Bil. dol.. . 58.3 86.2 90.0 92.2 92.7 94.9 100.0 105.6 103.4 108.7Investment and other . . . . . . . . Bil. dol.. . 138.2 154.5 176.9 182.9 205.3 219.1 236.4 268.5 244.5 221.5
Payments under life insuranceand annuity contracts . . . . . . . . Bil. dol.. . 88.4 200.8 227.6 246.9 276.6 301.8 355.3 375.2 304.9 301.3Payments to life insurancebeneficiaries. . . . . . . . . . . . . Bil. dol.. . 24.6 32.6 34.5 36.3 37.5 40.1 41.4 44.1 46.5 48.2
Surrender values under lifeinsurance 3 . . . . . . . . . . . . . Bil. dol.. . 18.0 18.0 19.5 24.5 24.0 26.8 32.8 27.2 30.7 32.9
Surrender values under annuitycontracts 3 4 . . . . . . . . . . . . . Bil. dol.. . (NA) 92.8 105.4 115.7 140.8 154.5 198.3 214.0 151.3 142.9
Policyholder dividends . . . . . . . Bil. dol.. . 12.0 15.9 17.8 18.1 18.0 18.9 19.1 20.0 20.0 21.0Annuity payments . . . . . . . . . . Bil. dol.. . 32.6 40.4 48.5 51.1 55.1 60.4 62.5 68.7 55.2 55.0Matured endowments . . . . . . . Bil. dol.. . 0.7 0.6 1.0 0.7 0.6 0.6 0.5 0.6 0.5 0.6Other payments . . . . . . . . . . . Bil. dol.. . 0.6 0.5 0.9 0.6 0.6 0.6 0.6 0.6 0.6 0.6
Health insurance benefitpayments . . . . . . . . . . . . . . . . Bil. dol.. . 40.0 60.1 64.7 66.7 67.4 70.0 74.5 78.8 76.3 78.7
BALANCE SHEETAssets. . . . . . . . . . . . . . . . . . . Bil. dol. . 1,408 1,942 2,144 2,328 2,579 2,827 3,071 3,182 3,269 3,380
Government bonds . . . . . . . . . Bil. dol.. . 211 396 409 411 391 379 362 364 377 481Corporate securities . . . . . . . . Bil. dol.. . 711 1,072 1,241 1,416 1,658 1,898 2,180 2,238 2,263 2,266
Percent of total assets . . . Percent . 50 55 58 61 64 67 71 70 69 67Bonds . . . . . . . . . . . . . . . . Bil. dol.. . 583 791 869 962 1,060 1,140 1,190 1,241 1,354 1,475Stocks . . . . . . . . . . . . . . . . Bil. dol.. . 128 282 372 454 598 758 990 997 909 791
Mortgages . . . . . . . . . . . . . . . Bil. dol.. . 270 215 212 212 210 216 230 237 244 251Real estate . . . . . . . . . . . . . . Bil. dol.. . 43 54 52 50 46 41 38 36 32 33Policy loans . . . . . . . . . . . . . . Bil. dol.. . 63 85 96 102 105 105 99 102 104 105Other . . . . . . . . . . . . . . . . . . Bil. dol.. . 110 120 133 137 169 187 163 204 248 244
Interest earned on assets 5 . . . . . Percent . 8.89 7.14 7.41 7.25 7.35 6.95 6.71 7.05 6.31 5.38Obligations and surplus funds 6 . . Bil. dol.. . 1,408 1,942 2,144 2,328 2,579 2,826 3,071 3,182 3,269 3,380
Policy reserves . . . . . . . . . . . Bil. dol. . 1,197 1,644 1,812 1,966 2,165 2,377 2,610 2,712 2,446 2,507Annuities 7 . . . . . . . . . . . . . Bil. dol.. . 798 1,095 1,213 1,312 1,455 1,608 1,781 1,841 1,516 1,550
Group . . . . . . . . . . . . . . Bil. dol.. . 516 612 619 690 762 845 907 960 571 570Individual . . . . . . . . . . . . Bil. dol.. . 282 482 594 622 693 763 874 881 945 980
Supplementary contracts 8 . . Bil. dol.. . 17 23 25 28 28 31 32 34 13 14Life insurance . . . . . . . . . . . Bil. dol.. . 349 468 511 556 606 656 705 742 816 833Health insurance . . . . . . . . . Bil. dol.. . 33 58 63 70 75 82 92 96 101 111
Liabilities for deposit-typecontracts 9 . . . . . . . . . . . . . . Bil. dol.. . 18 20 20 20 20 21 21 21 338 364
Capital and surplus . . . . . . . . . Bil. dol.. . 91 137 151 147 160 173 181 188 191 202
NA Not available. 1 Beginning 1994 includes life insurance companies that sell accident and health insurance.2 Beginning 2001 excludes certain deposit-type funds from income due to codification. 3 Beginning with 1994, ‘‘surrender values’’include annuity withdrawals of funds, which were not included in prior years. 4 Beginning 2001 excludes payments underdeposit-type contracts. 5 Net rate. 6 Includes other obligations not shown separately. 7 Beginning 2001, excludes reservesfor guaranteed interest contracts (GICs). 8 Through 2000 includes reserves for contracts with and without life contingencies;beginning 2001 includes only reserves for contracts with life contingencies. 9 Policyholder dividend accumulations for all years.Beginning 2001 also includes liabilities for guaranteed interest contracts, supplementary contracts without life contingencies, andpremium and other deposits.
Source: American Council of Life Insurers, Washington, DC, Life Insurers Fact Book, annual (copyright).
760 Banking, Finance, and Insurance
U.S. Census Bureau, Statistical Abstract of the United States: 2004-2005
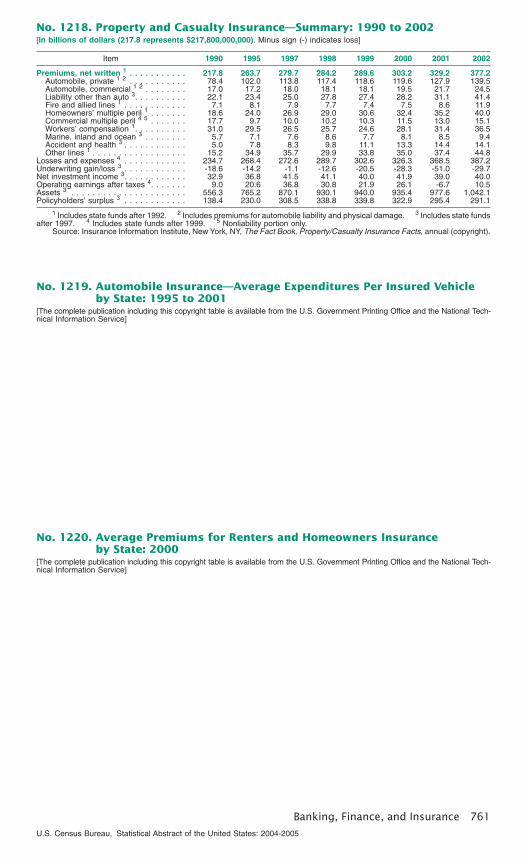
No. 1218. Property and Casualty Insurance—Summary: 1990 to 2002[In billions of dollars (217.8 represents $217,800,000,000). Minus sign (-) indicates loss]
Item 1990 1995 1997 1998 1999 2000 2001 2002
Premiums, net written 1 . . . . . . . . . . . 217.8 263.7 279.7 284.2 289.6 303.2 329.2 377.2Automobile, private 1 2 . . . . . . . . . . . 78.4 102.0 113.8 117.4 118.6 119.6 127.9 139.5Automobile, commercial 1 2 . . . . . . . . 17.0 17.2 18.0 18.1 18.1 19.5 21.7 24.5Liability other than auto 3. . . . . . . . . . 22.1 23.4 25.0 27.8 27.4 28.2 31.1 41.4Fire and allied lines 1 . . . . . . . . . . . . 7.1 8.1 7.9 7.7 7.4 7.5 8.6 11.9Homeowners’ multiple peril 1 . . . . . . . 18.6 24.0 26.9 29.0 30.6 32.4 35.2 40.0Commercial multiple peril 4 5 . . . . . . . 17.7 9.7 10.0 10.2 10.3 11.5 13.0 15.1Workers’ compensation 1. . . . . . . . . . 31.0 29.5 26.5 25.7 24.6 28.1 31.4 36.5Marine, inland and ocean 3 . . . . . . . . 5.7 7.1 7.6 8.6 7.7 8.1 8.5 9.4Accident and health 3 . . . . . . . . . . . . 5.0 7.8 8.3 9.8 11.1 13.3 14.4 14.1Other lines 1 . . . . . . . . . . . . . . . . . . 15.2 34.9 35.7 29.9 33.8 35.0 37.4 44.8
Losses and expenses 4 . . . . . . . . . . . . 234.7 268.4 272.6 289.7 302.6 326.3 368.5 387.2Underwriting gain/loss 3 . . . . . . . . . . . . -18.6 -14.2 -1.1 -12.6 -20.5 -28.3 -51.0 -29.7Net investment income 3. . . . . . . . . . . . 32.9 36.8 41.5 41.1 40.0 41.9 39.0 40.0Operating earnings after taxes 4. . . . . . . 9.0 20.6 36.8 30.8 21.9 26.1 -6.7 10.5Assets 3 . . . . . . . . . . . . . . . . . . . . . . 556.3 765.2 870.1 930.1 940.0 935.4 977.6 1,042.1Policyholders’ surplus 3 . . . . . . . . . . . . 138.4 230.0 308.5 338.8 339.8 322.9 295.4 291.1
1 Includes state funds after 1992. 2 Includes premiums for automobile liability and physical damage. 3 Includes state fundsafter 1997. 4 Includes state funds after 1999. 5 Nonliability portion only.
Source: Insurance Information Institute, New York, NY, The Fact Book, Property/Casualty Insurance Facts, annual (copyright).
No. 1219. Automobile Insurance—Average Expenditures Per Insured Vehicleby State: 1995 to 2001
[The complete publication including this copyright table is available from the U.S. Government Printing Office and the National Tech-nical Information Service]
No. 1220. Average Premiums for Renters and Homeowners Insuranceby State: 2000
[The complete publication including this copyright table is available from the U.S. Government Printing Office and the National Tech-nical Information Service]
Banking, Finance, and Insurance 761
U.S. Census Bureau, Statistical Abstract of the United States: 2004-2005
No. 1221. Real Estate, Rental, and Leasing—Nonemployer Establishments andReceipts by Kind of Business: 1997 to 2002
[1,397 represents 1,397,000. Includes only firms subject to federal income tax. Nonemployers are businesses with no paid employ-ees. Data originate chiefly from administrative records of the Internal Revenue Service; see Appendix III. Based on the North Ameri-can Industry Classification System 1997 (NAICS), see text, Section 15]
Kind of business NAICScode
Establishments(1,000)
Receipts(mil. dol.)
1997 2000 2002 1997 2000 2002
Real estate & rental & leasing,total . . . . . . . . . . . . . . . . . . . . . . . 53 1,397 1,696 1,880 101,704 133,398 161,790
Real estate . . . . . . . . . . . . . . . . . . . . . . . 531 1,336 1,616 1,799 98,845 127,862 156,150Lessors of real estate . . . . . . . . . . . . . . 5311 572 714 (NA) 68,718 86,934 (NA)Offices of real estate agents & brokers . . . 5312 530 522 (NA) 17,556 22,623 (NA)Activities related to real estate . . . . . . . . . 5313 235 380 (NA) 12,571 18,305 (NA)
Rental & leasing services. . . . . . . . . . . . . . 532 60 79 80 2,806 5,440 5,519Automotive equipment rental & leasing . . . 5321 15 19 (NA) 591 995 (NA)Consumer goods rental . . . . . . . . . . . . . 5322 14 17 (NA) 521 766 (NA)General rental centers . . . . . . . . . . . . . . 5323 1 3 (NA) 53 252 (NA)Commercial/industrial equip rental &leasing . . . . . . . . . . . . . . . . . . . . . . . 5324 31 41 (NA) 1,641 3,426 (NA)
Lessors of other nonfinancial intangibleassets. . . . . . . . . . . . . . . . . . . . . . . . . . 533 (Z) 1 1 53 96 121
NA Not available. Z Less than 500.
Source: U.S. Census Bureau, ‘‘Nonemployer Statistics’’; <http://www.census.gov/epcd/nonemployer/> and 2002 EconomicCensus: Advance Nonemployer Statistics; published 21 May 2004; <http://www.census.gov/epcd/nonemployer/2002/us/US000.HTM>.
No. 1222. Real Estate, Rental and Leasing—Establishments, Employees, andPayroll: 2000 and 2001
[300.2 represents 300,200. Covers establishments with payroll. Employees are for the week including March 12. Most governmentemployees are excluded. For statement on methodology, see Appendix III]
Kind of business NAICScode 1
Establishments(1,000)
Employees(1,000)
Payroll(bil. dol.)
2000 2001 2000 2001 2000 2001
Real estate & rental & leasing, total . . 53 300.2 307.0 1,942 2,014 59.2 64.0Real estate . . . . . . . . . . . . . . . . . . . . . . . 531 234.9 241.1 1,280 1,335 40.4 44.4
Lessors of real estate . . . . . . . . . . . . . . . 5311 108.2 108.0 501 513 12.5 13.9Offices of real estate agents & brokers . . . 5312 65.1 68.9 271 284 10.6 11.1Activities related to real estate . . . . . . . . . 5313 61.6 64.2 507 538 17.3 19.5
Rental & leasing services . . . . . . . . . . . . . . 532 63.2 63.8 636 653 17.2 18.0Automotive equipment rental & leasing . . . 5321 11.1 12.1 182 189 5.1 5.3
Passenger car rental & leasing . . . . . . . 53211 5.2 5.5 129 136 3.4 3.6Truck, utility trailer & RV rental &leasing . . . . . . . . . . . . . . . . . . . . . . 53212 5.8 6.6 53 53 1.7 1.8
Consumer goods rental 2. . . . . . . . . . . . . 5322 33.1 32.3 255 256 4.2 4.4Video tape & disk rental. . . . . . . . . . . . 53223 19.6 18.6 152 150 1.6 1.6
General rental centers . . . . . . . . . . . . . . 5323 6.4 6.4 42 41 1.2 1.2Commercial/industrial equip rental &leasing . . . . . . . . . . . . . . . . . . . . . . . . 5324 12.6 13.0 157 166 6.7 7.0
Lessors of other nonfinancial intangibleassets . . . . . . . . . . . . . . . . . . . . . . . . . . 533 2.1 2.1 26 26 1.6 1.6
1 North American Industry Classification System, 1997; see text, Section 15. 2 Includes other kinds of business not shownseparately.
Source: U.S. Census Bureau, County Business Patterns, annual; <http://www.census.gov/prod/2003pubs/01cbp/cbp01-1.pdf> (issued April 2003).
No. 1223. Rental and Leasing Services—Revenue by Kind of Business:2000 to 2002
[In millions of dollars (106,628 represents $106,628,000,000). Based on the North American Industry Classification System(NAICS) 1997; see text, Section 15. Estimates have been adjusted using the results of the 1997 Economic Census. Based onService Annual Survey; see Appendix III]
Kind of business NAICScode
Employer and nonemployerfirms Employer firms
2000 2001 2002 2000 2001 2002
Rental & leasing services . . . . . . . . . . . 532 106,628 104,794 106,081 101,188 99,126 100,507Automotive equipment rental & leasing. . . . . . . 5321 37,496 36,373 36,203 36,501 35,367 35,174
Passenger car rental & leasing . . . . . . . . . . 53211 24,357 23,882 24,121 23,769 23,288 23,500Truck, utility trailer, & RV rental & leasing . . . 53212 13,139 12,491 12,081 12,732 12,079 11,674
Consumer goods rental 1 . . . . . . . . . . . . . . . . 5322 18,794 19,233 19,079 18,029 18,445 18,265Video tape & disk rental . . . . . . . . . . . . . . . 53223 9,427 9,431 9,240 9,159 9,174 8,962
General rental centers. . . . . . . . . . . . . . . . . . 5323 5,504 5,094 5,176 5,252 4,819 4,892Commercial/industrial equip rental & leasing . . . 5324 44,833 44,094 45,624 41,407 40,495 42,176
1 Includes other kinds of business not shown separately.
Source: U.S. Census Bureau, Service Annual Survey: 2002.
762 Banking, Finance, and Insurance
U.S. Census Bureau, Statistical Abstract of the United States: 2004-2005