section 3: material properties - aac...
TRANSCRIPT

MATERIAL PROPERTIES - 3 1
Section 3: Material Properties 3.1 Thermal Insulation .................................................................................................................................................3
3.2 Thermal Resistance (R-value) ...............................................................................................................................3
3.3 Coefficient of Heat Transmission...........................................................................................................................4
3.4 Dynamic Thermal Performance .............................................................................................................................6
3.5 Thermal Bridges....................................................................................................................................................14
3.6 Moisture Resistance ............................................................................................................................................15
3.7 Resistance to Pelting Rain...................................................................................................................................15
3.8 Resistance to Condensation Moisture .................................................................................................................16
3.9 Diffusion Behavior................................................................................................................................................16
3.10 Water Absorption ...............................................................................................................................................17
3.11 Mold Growth Prevention Plan ............................................................................................................................18
3.12 Fire Resistance Properties ................................................................................................................................20
3.13 Requirements of Standards and Model Codes..................................................................................................21
3.14 Test Results .......................................................................................................................................................21
3.15 Acoustic Properties ............................................................................................................................................23
3.16 Relationship Between Sound Transmission Class and Sound Reduction Index (R’w) ......................................27
3.17 Code Requirements ...........................................................................................................................................27
3.18 Acoustic Performance of AAC ...........................................................................................................................28
3.19 Design for Sound Insulation Based on Tables ..................................................................................................28
3.20 Surrounding Noise .............................................................................................................................................30
3.21 References.........................................................................................................................................................31

2

MATERIAL PROPERTIES - 3 3
3.1 Thermal Insulation
Thermal Conductivity ”k” (Btu in/h ft2 °F) is a measure of the material conductivity as tested in a laboratory
procedure that measures the heat flow through a building material under steady and constant climate conditions. It
is important to remember that these laboratory conditions do not reflect the normal climate cycles (see DBMS).
This issue is discussed in further detail in the thermal mass section. Based on the above definition, it is obvious
that the lower the “k” value the higher the insulation value. Table 3.1 gives the “k” values for AAC and other
materials.
Table 3.1: Thermal conductivity k of AAC and Other Materials
Designation Thermal Conductivity k (Btu in/h Ft2 F)
AAC-2/400 (25 pcf) 0.80 (1)
AAC-4/500 (31 pcf) 0.97 (1)
Concrete Density 150 pcf 9.98 (2)
Insulation Board (Polystyrene) 0.20 (2)
Steel 329.0
Water 4.15 (1) Based on ESR 2447 in accordance with ASTM C 1386
(2) ASHRAE ( American Society of Heating, Refrigerating and Air-conditioning Engineers)
The figures for AAC in Table 3.1 consider the typical moisture content of AAC during the lifespan. The moisture
content at equilibrium for AAC depends on the bulk density and climate conditions. Usually the moisture content
ranges from 3 to 5% if the surrounding conditions are 73.4 °F (23°C) and 80% relative humidity. The conversion
factor between a dry value of AAC and the equilibrium value (as shown in Table 3.1) is about 1.05, i.e. in order to
calculate a dry value the value in Table 3.1 has to divided by 1.05.
3.2 Thermal Resistance (R-value)
Defined as the inverse of the time rate of heat flow through a body from one of its bounding surfaces to the other
surface for a unit temperature difference between the two surfaces, under steady state conditions, per unit area (h
ft² °F/Btu) [(m² · K)/W].
To that effect the Thermal Resistance “R” (h ft² °F/Btu) is the opposite of the thermal conductivity and it is the
resistance of a material to conduct or allow heat flow. Thermal resistance measures how well a material or series
of materials retards heat flow. Thermal resistance (insulation) is rated using R-values. As the R-value of an
element or assembly increases, the heat loss or gain through that element or assembly decreases. Table 3.2
shows the thermal resistance calculated based on equation 1 for AAC.
R = (1 / k) x Wall Thickness (inch) (1)

4
Table 3.2: Thermal Resistance of AAC
Designation Thermal Resistance “R” (h.ft2.°F/Btu)
8” AAC-2/400 Wall 10.00
10” AAC-2/400 Wall 12.50
12” AAC-2/400 Wall 15.00
8” AAC-4/500 Wall 8.25
10” AAC-4/500 Wall 10.31
12” AAC-4/500 Wall 12.37
In order to achieve an RT-value (total assembly R-value) for AAC construction the additional resistances of the wall
assembly are added together. Table 3.3 shows an example calculation of a single-wythe wall of AAC with render
and stucco.
Table 3.3: Calculation of RT-value of a Single-wythe Wall with AAC-4/500 (31 pcf)
Material Thickness (inch)
Thermal Conductivity k (Btu.in/h.ft2.°F)
R-value (h ft2 °F/Btu)
surface inside 0.68
plaster inside 0.19 6.74 0.028
Hebel AAC-4/500 10.00 0.97 10.31
stucco 0.63 2.40 0.26
surface outside 0.17
ΣR = RT-value 11.45
3.3 Coefficient of Heat Transmission
U-Factor (Thermal Transmittance) The U-factor is defined as the coefficient of heat transmission (air to air) through a building component or assembly,
equal to the time rate of heat flow per unit area and unit temperature difference between the warm side and cold
side air films (Btu/h · ft² · °F) [W/(m² · K)].
Thermal transmittance, U-factor, is a measure of how well a material or series of materials conducts heat. Low U-
values represent high insulation.
valueRU
T −=
1 (2)
MATERIAL PROPERTIES - 3 5
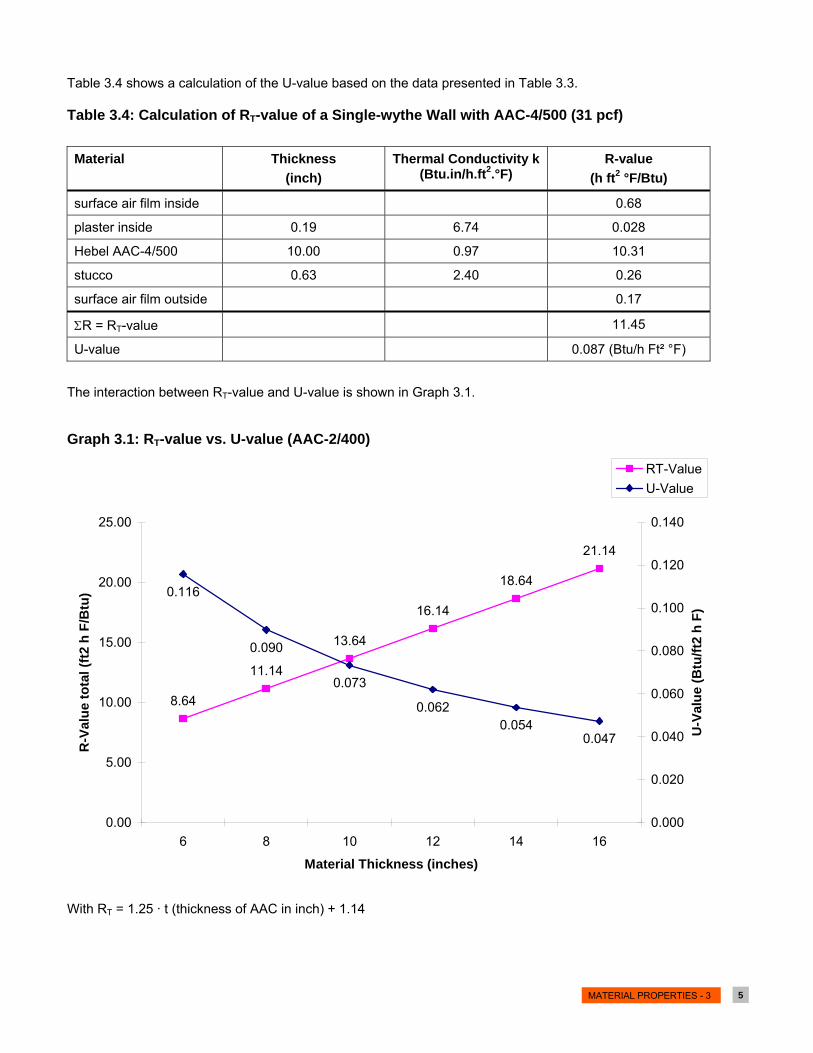
Table 3.4 shows a calculation of the U-value based on the data presented in Table 3.3.
Table 3.4: Calculation of RT-value of a Single-wythe Wall with AAC-4/500 (31 pcf) Material Thickness
(inch) Thermal Conductivity k
(Btu.in/h.ft2.°F) R-value
(h ft2 °F/Btu)
surface air film inside 0.68
plaster inside 0.19 6.74 0.028
Hebel AAC-4/500 10.00 0.97 10.31
stucco 0.63 2.40 0.26
surface air film outside 0.17
ΣR = RT-value 11.45
U-value 0.087 (Btu/h Ft² °F)
The interaction between RT-value and U-value is shown in Graph 3.1.
Graph 3.1: RT-value vs. U-value (AAC-2/400)
8.64
11.14
13.64
16.14
18.64
21.14
0.116
0.090
0.073
0.0620.054
0.047
0.00
5.00
10.00
15.00
20.00
25.00
6 8 10 12 14 16
Material Thickness (inches)
R-V
alue
tota
l (ft2
h F
/Btu
)
0.000
0.020
0.040
0.060
0.080
0.100
0.120
0.140
U-V
alue
(Btu
/ft2
h F)
RT-ValueU-Value
With RT = 1.25 · t (thickness of AAC in inch) + 1.14

6
Graph 3.2: RT-value vs. U-value (AAC-4/500)
7.32
9.40
11.45
13.51
15.57
17.63
0.137
0.106
0.087
0.0740.064
0.057
0.00
2.00
4.00
6.00
8.00
10.00
12.00
14.00
16.00
18.00
20.00
6 8 10 12 14 16
Material Thickness (inches)
R-V
alue
tota
l (ft2
h F
/Btu
)
0.000
0.020
0.040
0.060
0.080
0.100
0.120
0.140
0.160
U-V
alue
(Btu
/ft2
h F)
RT-ValueU-Value
With RT = 1.03 · t + 1.14
3.4 Dynamic Thermal Performance
The above mentioned definitions describe only one kind of heat transport through a material or wall assembly
based on temperature difference at the surfaces. What about the real behavior of the wall assembly under
permanent changing internal and external conditions in winter or summer? Does the thermal mass of the wall
assembly have an influence on the heat flux and room temperature? The thermal protection requirements for the
external wall elements (as specified in the energy codes) of buildings are generally categorized into two groups,
either summer or winter. In both cases the most important property of the material is a low thermal conductivity (or
high R-value) combined with heat storage capacity. Both properties lead to a lower heat flux through the wall and
therefore to a lower heating and cooling demand. Diagram 3.1 shows the fundamental behavior of a mass wall for
this context.

MATERIAL PROPERTIES - 3 7
Diagram 3.1: Phase Difference within the Wall for a 24 Hour Period
The phase difference expresses the time lag between the external and internal amplitude of temperature.
Example: Outside temperature: 86° F, Amplitude: 68 °F (difference from low to high temperature), around 12
o’clock. Inside: The amplitude occurs after around 12 hours on the surface. The damping of the incoming
amplitude leads to the second fundamental behavior of a massive wall: temperature damping.
Due to high heat capacity of massive walls like Hebel AAC, the heat transport from one side to the other side of the
wall assembly is linked to heat dissipation. Diagram 3.2 describes this occurrence as the damping process which is
responsible for a lower heat transport. Especially in summer the damping process guarantees a lower internal
temperature and consequently a lower cooling demand for the building.

8
Diagram 3.2: Temperature Damping with the wall for a 24 Hour Period
Example: Outside temperature: 86° F, Amplitude: 68 °F (difference from low to high temperature), around 12
o’clock. Inside: The amplitude occurs after around 12 hours on the surface. The maximum increase of the surface
temperature amounts to about 2 °F.
General properties of Hebel AAC: Phase difference: 10 to 15 hours (depending on bulk density and thermal conductivity)
Temperature damping: 2 to 4 % (depending on bulk density and thermal conductivity)
Temperature damping of 2 to 4 % means the following:
If the amplitude of temperature changing outside is 68 °F the amplitude inside will be 68 ·0.04 = 2.7 °F. This is very
low and negligible.
And what about non massive walls like wooden frame construction? Usually, the phase difference of wooden
frame construction is from 3 to 6 hours and the damping is 25 – 35 %, according to calculation standards. This
leads to the situation that the maximum amplitude comes in within 3-6 hours and is only damped with 65 – 75 %
(94 – 98 % in case of massive walls).
MATERIAL PROPERTIES - 3 9
But what is defined as massive wall?
The 2006 IECC defines mass walls as follows:
◊ Chapter 4 – Residential – section 402.2.3 Mass Walls: “Mass walls for the purpose of this Chapter shall
be considered walls of concrete block, concrete… and solid timber/logs.”
◊ Chapter 5 – Commercial Energy Efficiency – section 502.2.3 Above-grade walls: “…’Mass walls’ shall
include walls weighing at least (1) 35 pounds per square foot (170 kg/m2) of wall surface area or (2) 25
pounds per square foot (120 kg/m2) of wall surface area if the material weight is not more than 120
pounds per cubic foot (1900 kg/m3).”
◊ ASHRAE Standard 90.1-2007 references mass walls as “walls with HC exceeding (1) 7 Btu/ft2 F or (2)
5 Btu/ft2 F, provided that the wall has a material unit weight not greater than 120 lb/ft3.”
In general terms, the heat capacity is a measure of how well a material stores heat. The higher the heat capacity of
a material the greater the amount of heat that can be stored in the material.
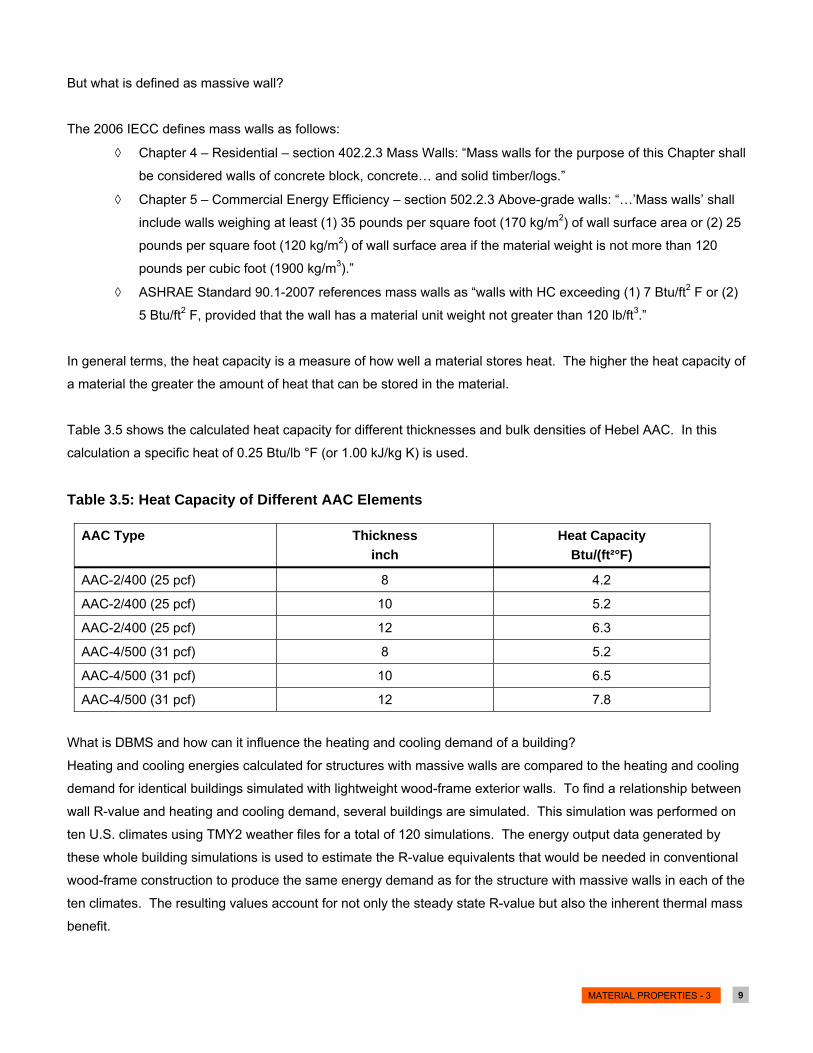
Table 3.5 shows the calculated heat capacity for different thicknesses and bulk densities of Hebel AAC. In this
calculation a specific heat of 0.25 Btu/lb °F (or 1.00 kJ/kg K) is used.
Table 3.5: Heat Capacity of Different AAC Elements
AAC Type Thickness inch
Heat Capacity Btu/(ft²°F)
AAC-2/400 (25 pcf) 8 4.2
AAC-2/400 (25 pcf) 10 5.2
AAC-2/400 (25 pcf) 12 6.3
AAC-4/500 (31 pcf) 8 5.2
AAC-4/500 (31 pcf) 10 6.5
AAC-4/500 (31 pcf) 12 7.8
What is DBMS and how can it influence the heating and cooling demand of a building?
Heating and cooling energies calculated for structures with massive walls are compared to the heating and cooling
demand for identical buildings simulated with lightweight wood-frame exterior walls. To find a relationship between
wall R-value and heating and cooling demand, several buildings are simulated. This simulation was performed on
ten U.S. climates using TMY2 weather files for a total of 120 simulations. The energy output data generated by
these whole building simulations is used to estimate the R-value equivalents that would be needed in conventional
wood-frame construction to produce the same energy demand as for the structure with massive walls in each of the
ten climates. The resulting values account for not only the steady state R-value but also the inherent thermal mass
benefit.

10
To enable simple comparisons of dynamic energy performances of wall systems, ORNL’s BTC introduced in 1995
the Dynamic Benefit for Massive Systems model (DBMS) [Kosny at al 1998]. DBMS is a dimensionless multiplier
of steady-state R-value. The product of DBMS and steady-state R-value is called “Dynamic R-value Equivalent for
Massive Systems.” It should be used only as an answer to the question: “What wall R-value should a structure with
wood frame walls need to obtain the same space heating and cooling energy consumption as a similar structure
containing massive walls?”
Table 3.6 and Table 3.7 contain the results of a simulation carried out by AZ path dated July 2002, “A Comparison
of Innovative Exterior Wall Construction Techniques”, Del E Webb School of Construction at Arizona State
University.

MATERIAL PROPERTIES - 3 11
Table 3.6: DBMS and Equivalent R-values for AAC-2/400 (25 pcf)
8” AAC 10” AAC
R DBMS Requiv R DBMS Requiv
Phoenix 10.85 2.48 26.9 13.35 2.51 33.5
Flagstaff 10.85 1.99 21.6 13.35 1.99 26.6
Los Angeles 10.85 1.54 16.7 13.35 1.57 21.0
Sacramento 10.85 2.44 26.5 13.35 2.44 32.6
San Diego 10.85 1.42 15.4 13.35 1.44 19.2
San Francisco 10.85 1.78 19.3 13.35 1.79 23.9
Denver 10.85 1.9 20.6 13.35 1.92 25.6
Miami 10.85 1.73 18.8 13.35 1.76 23.5
Atlanta 10.85 1.93 20.9 13.35 1.94 25.9
Minneapolis 10.85 1.48 16.1 13.35 1.5 20.0
Albuquerque 10.85 2.06 22.4 13.35 2.09 27.9
Santa Fe 10.85 2.14 23.2 13.35 2.17 29.0
Las Vegas 10.85 2.46 26.7 13.35 2.49 33.2
Reno 10.85 2. 05 22.2 13.35 2.06 27.5
Eugene 10.85 2.14 23.2 13.35 2.16 28.8
El Paso 10.85 2.31 25.1 13.35 2.34 31.2
Salt Lake City 10.85 2.11 22.9 13.35 2.11 28.2
Washington D.C. 10.85 1.7 18.4 13.35 1.72 23.0
Seattle 10.85 1.39 15.1 13.35 1.41 18.8
Spokane 10.85 1.85 20.1 13.35 1.86 24.8
Example:
In order to obtain the same heating and/or cooling demand for a building with AAC-2/400 (8´´) in Miami the wooden
frame construction has to have an R-value 18.8 h.ft².°F/Btu.
12
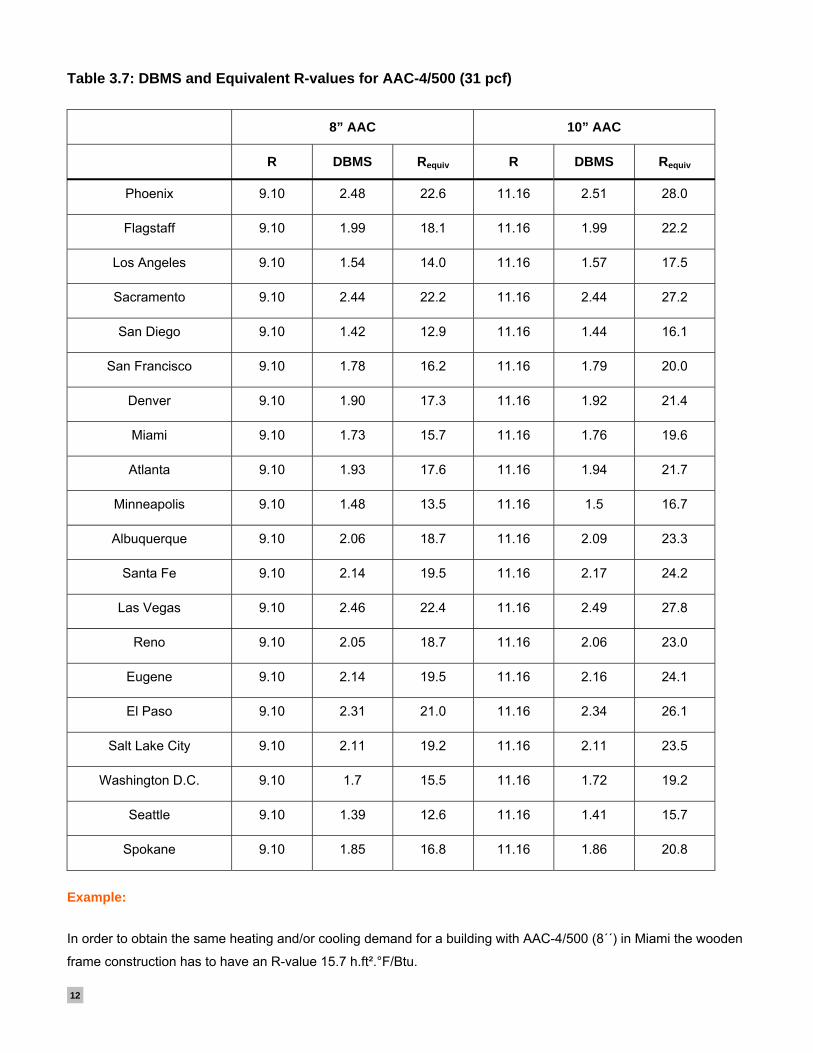
Table 3.7: DBMS and Equivalent R-values for AAC-4/500 (31 pcf)
8” AAC 10” AAC
R DBMS Requiv R DBMS Requiv
Phoenix 9.10 2.48 22.6 11.16 2.51 28.0
Flagstaff 9.10 1.99 18.1 11.16 1.99 22.2
Los Angeles 9.10 1.54 14.0 11.16 1.57 17.5
Sacramento 9.10 2.44 22.2 11.16 2.44 27.2
San Diego 9.10 1.42 12.9 11.16 1.44 16.1
San Francisco 9.10 1.78 16.2 11.16 1.79 20.0
Denver 9.10 1.90 17.3 11.16 1.92 21.4
Miami 9.10 1.73 15.7 11.16 1.76 19.6
Atlanta 9.10 1.93 17.6 11.16 1.94 21.7
Minneapolis 9.10 1.48 13.5 11.16 1.5 16.7
Albuquerque 9.10 2.06 18.7 11.16 2.09 23.3
Santa Fe 9.10 2.14 19.5 11.16 2.17 24.2
Las Vegas 9.10 2.46 22.4 11.16 2.49 27.8
Reno 9.10 2.05 18.7 11.16 2.06 23.0
Eugene 9.10 2.14 19.5 11.16 2.16 24.1
El Paso 9.10 2.31 21.0 11.16 2.34 26.1
Salt Lake City 9.10 2.11 19.2 11.16 2.11 23.5
Washington D.C. 9.10 1.7 15.5 11.16 1.72 19.2
Seattle 9.10 1.39 12.6 11.16 1.41 15.7
Spokane 9.10 1.85 16.8 11.16 1.86 20.8
Example:
In order to obtain the same heating and/or cooling demand for a building with AAC-4/500 (8´´) in Miami the wooden
frame construction has to have an R-value 15.7 h.ft².°F/Btu.
MATERIAL PROPERTIES - 3 13
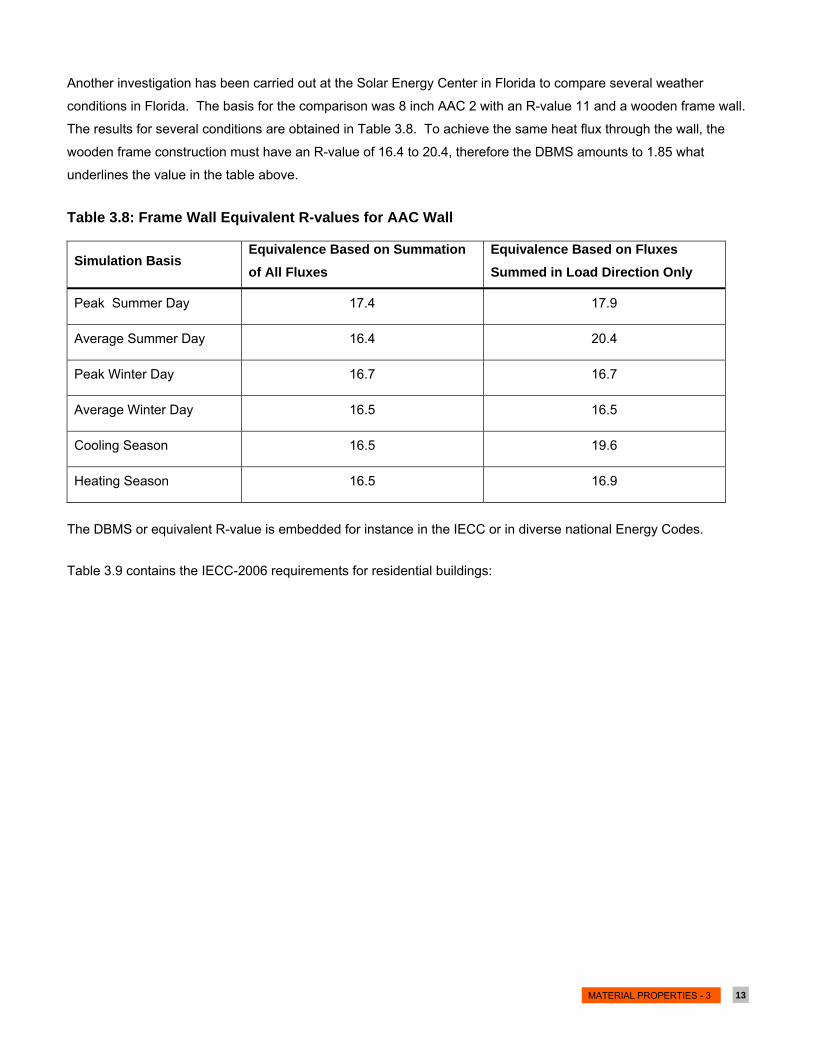
Another investigation has been carried out at the Solar Energy Center in Florida to compare several weather
conditions in Florida. The basis for the comparison was 8 inch AAC 2 with an R-value 11 and a wooden frame wall.
The results for several conditions are obtained in Table 3.8. To achieve the same heat flux through the wall, the
wooden frame construction must have an R-value of 16.4 to 20.4, therefore the DBMS amounts to 1.85 what
underlines the value in the table above.
Table 3.8: Frame Wall Equivalent R-values for AAC Wall
Simulation Basis Equivalence Based on Summation of All Fluxes
Equivalence Based on Fluxes Summed in Load Direction Only
Peak Summer Day 17.4 17.9
Average Summer Day 16.4 20.4
Peak Winter Day 16.7 16.7
Average Winter Day 16.5 16.5
Cooling Season 16.5 19.6
Heating Season 16.5 16.9
The DBMS or equivalent R-value is embedded for instance in the IECC or in diverse national Energy Codes.
Table 3.9 contains the IECC-2006 requirements for residential buildings:

14
Table 3.9: Insulation and Fenestration Requirements by Component (Extract)
Climate Zone
Fenestration U-Factor
Ceiling R-Value
Wood Frame Wall R-Value
Mass Wall R-Value
Floor R-Value
Basement Wall R-Value
Slab R-Value & Depth
1 1.20 30 13 3 13 0 0
2 0.75 30 13 4 13 0 0
3 0.65 30 13 5 19 0 0
4 except Marine
0.40 38 13 5 19 10 / 13 10.2 ft
5 and Marine
4 0.35 38 19 or 13+5 13 30f 10 / 13 10.2 ft
6 0.35 49 19 or 13+5 15 30f 10 / 13 10.4ft
7 and 8 0.35 49 21 19 30f 10 / 13 10.4ft
The requirement for the massive wall of a residential building in climate zone 3 is R 5. This requirement is satisfied
when using AAC-4/500 at 6” thickness. To enable the same amount of energy demand for a building erected with
wooden frame construction, the requirement is R 13. Please consider that the reverse direction is not allowed, i.e.
if the requirement for a massive wall R 13 it is required to use the static R-value as expressed in table 2.
3.5 Thermal Bridges
A thermal bridge is created when materials that are poor insulators come in contact, allowing heat to flow through
the path created. Insulation around a bridge is of little help in preventing heat loss or gain due to thermal bridging;
the bridging has to be eliminated, rebuilt with a reduced cross-section or with materials that have better insulating
properties, or with an additional insulating component (a thermal break). Thermal or heat bridges in buildings are
often (incorrectly) called "Cold Bridge".
Thermal bridges are characterized by multi-dimensional heat flow, and therefore by the fact that they cannot be
adequately approximated by the one-dimensional models of calculation typically used in standards for the thermal
performance of buildings (U-values). Surface moisture due to condensation (typically occurring in such regions as
floor-wall connections, window installations, etc.) as well as mold growth in humid environments can also be
effectively prevented by means of multi-dimensional evaluation during planning and detail design.
MATERIAL PROPERTIES - 3 15
Typical thermal bridges are:
Geometrical thermal bridges (for instance corners);
Changing of material regarding thermal conductivity (for instance rafters, concrete columns,
concrete slab – exterior wall);
Connection of wall to roof (normally combination of first two points);
Connection of wall to floor slab (normally combination of first two points):
Window and door connections (reveal, lintel, parapet);
Break of the thermal insulation (for instance balcony);
Based on the fact that Hebel AAC has the same thermal conductivity in all directions thermal bridges are greatly
reduced in buildings with Hebel AAC walls and panels. Calculations and testimonials show that it is possible to
reduce the energy demand by more than 20% when using Hebel AAC.
3.6 Moisture Resistance
Moisture resistance is needed for protecting a building against water to ensure a long life cycle and a healthy indoor
climate. Moisture can get into a structure in various ways. It can be a result of the manufacturing process of
building components as well as storage, transportation and installation (i.e. rain during construction) of materials.
People, animals and plants increase humidity inside a building. Another possibility for the appearance of moisture
inside a structure is condensation on cold surfaces of building materials. Although building components can absorb
a certain amount of moisture it’s important to protect them against humidity to avoid damage.
3.7 Resistance to Pelting Rain
Building components have to be protected against climate influences like pelting rain. Therefore appropriate
measures like rendering, coating, flashing, or cladding are necessary to secure the quality of a building. Minimum
thicknesses for weather coverings on unit masonry are defined in the International Building Code, section 1405.2.
If stucco or exterior Portland cement plaster is used then a minimum thickness of 0.625 inches is required for a
three-coat application and 0.5 inches for a two-coat application.
In general it is important for the rendering and coating to use materials which are suitable for the use on the
material on which they are applied. This refers to mechanical and physical properties like compressive strength
and vapor permeability. That means that the materials shall have similar properties so they will react in a similar
way to climate conditions like rain and temperature variations. Otherwise the surface treatment can be damaged
by these influences and moisture can penetrate the structure of buildings.
The manufacturers of renderings, coatings and stuccos give recommendations for the use of their products which
should be kept to create damage-free facades.
16
3.8 Resistance to Condensation Moisture
The amount of water vapor which can be absorbed by air depends on the air temperature. The warmer the air the
more water vapor can be absorbed. When air reaches 100 % humidity at a certain temperature this is called dew
point. If this air is cooled down from this condition fog develops. If this air meets a cold surface condensation
forms there.
We would like to know the temperature in the middle of the wall.
T = Tw - (q · R1)
Where:
T temperature on the wanted point in °F
Tw temperature on the warmest side (in this case outside)
R1 thermal resistance – sum from the warmest side to the desired point
The R1 is: 0.17 (air film outside) + 6.25 (½ R width of the wall) = 6.42
T = 90°F – (1.5 · 6.42) = 80.37 °F or 26.9 °C > dew point
Conclusion: The condensation within the wall under extreme summer conditions occurs in the second half of the
wall.
In the case of condensation within the Hebel AAC there is no need for worry because AAC has a tremendous
capability to storing water. AAC can compensate extreme conditions from both sides of the surface. This leads to
a good interior climate and to a lower demand of dehumidification and humidification provided by the air-
conditioning systems. This is the primary reason that vapor barriers are not needed in most applications.
3.9 Diffusion Behavior
For all load carrying components made of mineral materials, AAC has the lowest vapor diffusion resistance.
Monolithic AAC walls don’t need additional layers with thermal insulation. This fact helps to build simple,
permanently insulated wall assemblies. Basic rules which help to get good diffusion behavior of building materials
are listed below:
permeability of a material must increase from inside to outside (sd value must decrease from inside to
outside)
penetrated moisture must be able to diffuse out
for multi-layered construction assemblies, the outer layer should be ventilated
MATERIAL PROPERTIES - 3 17
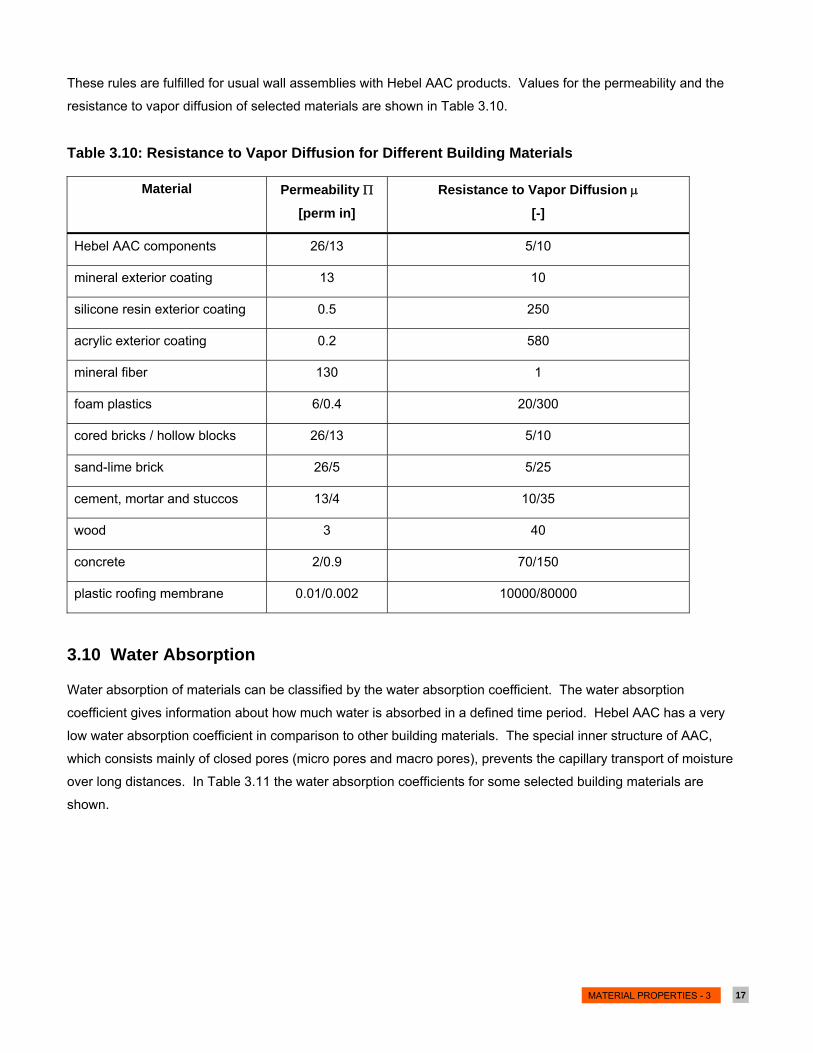
These rules are fulfilled for usual wall assemblies with Hebel AAC products. Values for the permeability and the
resistance to vapor diffusion of selected materials are shown in Table 3.10.
Table 3.10: Resistance to Vapor Diffusion for Different Building Materials
Material Permeability Π
[perm in]
Resistance to Vapor Diffusion μ
[-]
Hebel AAC components 26/13 5/10
mineral exterior coating 13 10
silicone resin exterior coating 0.5 250
acrylic exterior coating 0.2 580
mineral fiber 130 1
foam plastics 6/0.4 20/300
cored bricks / hollow blocks 26/13 5/10
sand-lime brick 26/5 5/25
cement, mortar and stuccos 13/4 10/35
wood 3 40
concrete 2/0.9 70/150
plastic roofing membrane 0.01/0.002 10000/80000
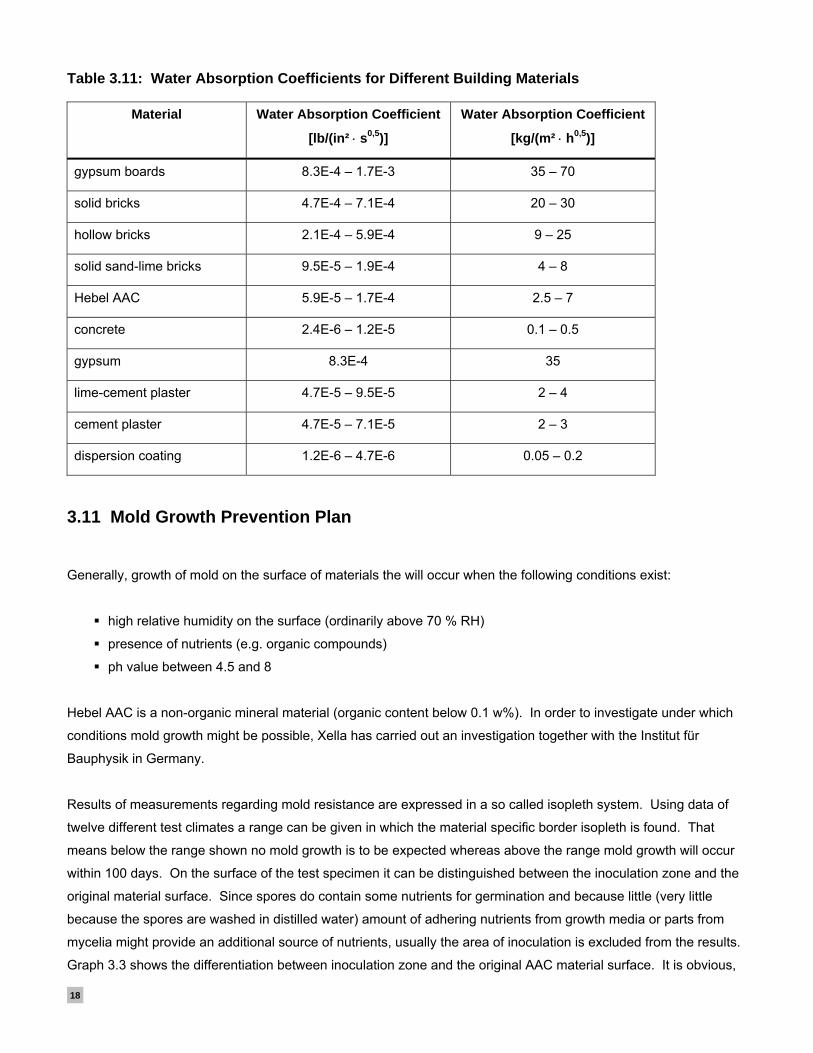
3.10 Water Absorption
Water absorption of materials can be classified by the water absorption coefficient. The water absorption
coefficient gives information about how much water is absorbed in a defined time period. Hebel AAC has a very
low water absorption coefficient in comparison to other building materials. The special inner structure of AAC,
which consists mainly of closed pores (micro pores and macro pores), prevents the capillary transport of moisture
over long distances. In Table 3.11 the water absorption coefficients for some selected building materials are
shown.
18
Table 3.11: Water Absorption Coefficients for Different Building Materials
Material Water Absorption Coefficient
[lb/(in² ⋅ s0,5)]
Water Absorption Coefficient
[kg/(m² ⋅ h0,5)]
gypsum boards 8.3E-4 – 1.7E-3 35 – 70
solid bricks 4.7E-4 – 7.1E-4 20 – 30
hollow bricks 2.1E-4 – 5.9E-4 9 – 25
solid sand-lime bricks 9.5E-5 – 1.9E-4 4 – 8
Hebel AAC 5.9E-5 – 1.7E-4 2.5 – 7
concrete 2.4E-6 – 1.2E-5 0.1 – 0.5
gypsum 8.3E-4 35
lime-cement plaster 4.7E-5 – 9.5E-5 2 – 4
cement plaster 4.7E-5 – 7.1E-5 2 – 3
dispersion coating 1.2E-6 – 4.7E-6 0.05 – 0.2
3.11 Mold Growth Prevention Plan
Generally, growth of mold on the surface of materials the will occur when the following conditions exist:
high relative humidity on the surface (ordinarily above 70 % RH)
presence of nutrients (e.g. organic compounds)
ph value between 4.5 and 8
Hebel AAC is a non-organic mineral material (organic content below 0.1 w%). In order to investigate under which
conditions mold growth might be possible, Xella has carried out an investigation together with the Institut für
Bauphysik in Germany.
Results of measurements regarding mold resistance are expressed in a so called isopleth system. Using data of
twelve different test climates a range can be given in which the material specific border isopleth is found. That
means below the range shown no mold growth is to be expected whereas above the range mold growth will occur
within 100 days. On the surface of the test specimen it can be distinguished between the inoculation zone and the
original material surface. Since spores do contain some nutrients for germination and because little (very little
because the spores are washed in distilled water) amount of adhering nutrients from growth media or parts from
mycelia might provide an additional source of nutrients, usually the area of inoculation is excluded from the results.
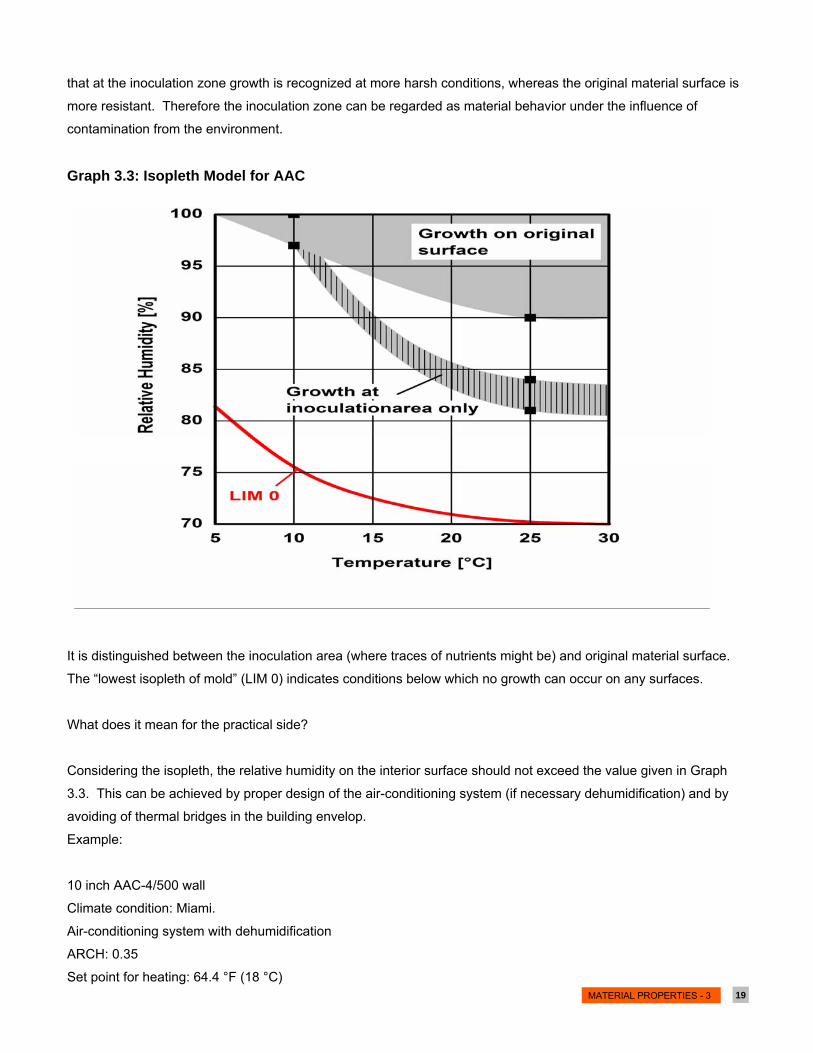
Graph 3.3 shows the differentiation between inoculation zone and the original AAC material surface. It is obvious,
MATERIAL PROPERTIES - 3 19
that at the inoculation zone growth is recognized at more harsh conditions, whereas the original material surface is
more resistant. Therefore the inoculation zone can be regarded as material behavior under the influence of
contamination from the environment.
Graph 3.3: Isopleth Model for AAC
It is distinguished between the inoculation area (where traces of nutrients might be) and original material surface.
The “lowest isopleth of mold” (LIM 0) indicates conditions below which no growth can occur on any surfaces.
What does it mean for the practical side?
Considering the isopleth, the relative humidity on the interior surface should not exceed the value given in Graph
3.3. This can be achieved by proper design of the air-conditioning system (if necessary dehumidification) and by
avoiding of thermal bridges in the building envelop.
Example:
10 inch AAC-4/500 wall
Climate condition: Miami.
Air-conditioning system with dehumidification
ARCH: 0.35
Set point for heating: 64.4 °F (18 °C)
20
Set point for cooling: 71.6 °F (22 °C)
RH control set point: 60 % RH
Conclusion: Under these conditions, mold growth on the surface will not occur because the maximum RH is under
80 % and therefore not sufficient.
3.12 Fire Resistance Properties
Hebel AAC is a non-combustible material which provides a safer structure in the case of fire. AAC structures
provide a high level of fire containment to delay the spread of fire to other areas of the building. For example, a
wall with a thickness of 8 inch made out of Hebel AAC provides a fire rating of four hours. During a fire, no toxic
gases or vapors are emitted by AAC. By using fire resistive materials like AAC, the owner of buildings qualify for a
reduction in fire insurance premiums.
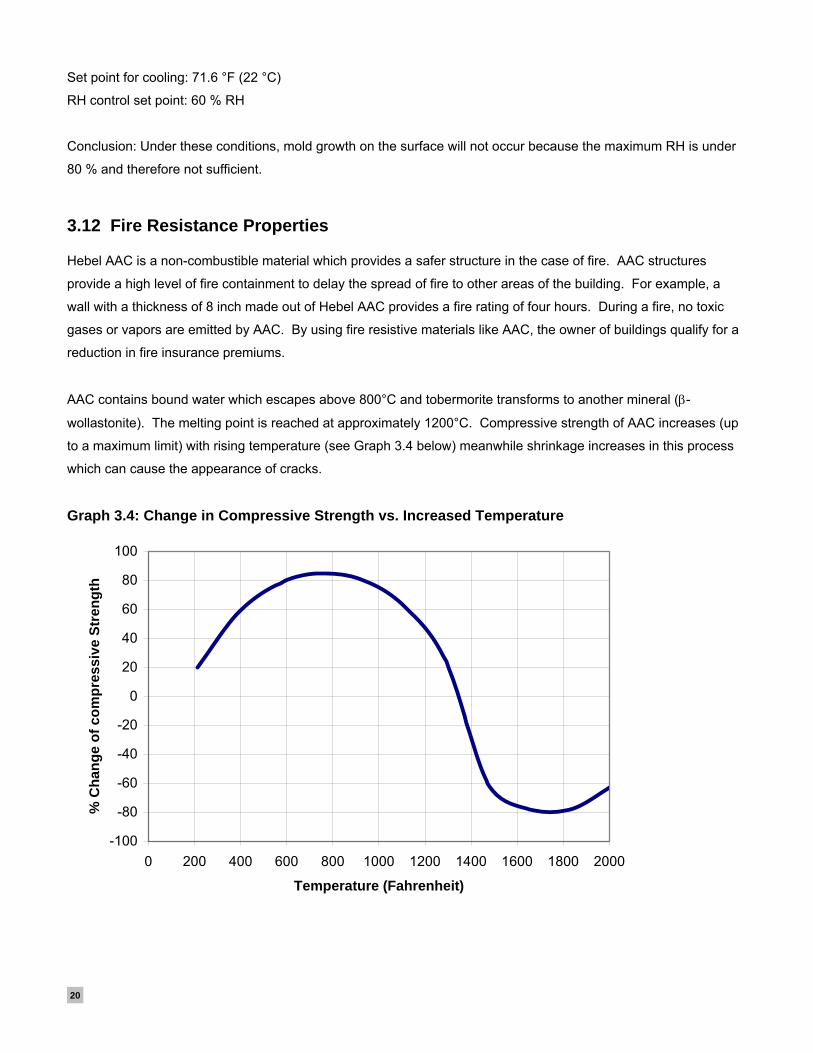
AAC contains bound water which escapes above 800°C and tobermorite transforms to another mineral (β-
wollastonite). The melting point is reached at approximately 1200°C. Compressive strength of AAC increases (up
to a maximum limit) with rising temperature (see Graph 3.4 below) meanwhile shrinkage increases in this process
which can cause the appearance of cracks.
Graph 3.4: Change in Compressive Strength vs. Increased Temperature
-100
-80
-60
-40
-20
0
20
40
60
80
100
0 200 400 600 800 1000 1200 1400 1600 1800 2000
Temperature (Fahrenheit)
% C
hang
e of
com
pres
sive
Str
engt
h

MATERIAL PROPERTIES - 3 21
3.13 Requirements of Standards and Model Codes
In the International Building Code 2006 (IBC 2006) the most important terms for fire rated assemblies are defined
as follows:
Fire walls are fire-resistance-rated walls having protected openings, which restrict the spread of fire, with
sufficient structural stability under fire conditions to allow collapse of construction on either side without
collapse of the wall. Fire-resistance ratings for fire walls are defined in table 705.4 in IBC 2006.
Fire-resistance rating is the period of time a building element, component or assembly maintains the
ability to confine a fire, continues to perform a given structural function, or both, as determined by tests.
The proof for the material properties regarding fire-resistance is done by testing. The requirements for testing the
fire resistance of building materials are defined in ASTM E 119.
3.14 Test Results
Fire endurance testing of Hebel AAC material in accordance with ASTM E 119 (ANSI UL 263) was performed at
Underwriters Laboratories (UL) and was witnessed by a Factory Mutual Research Co. (FMRC) representative.
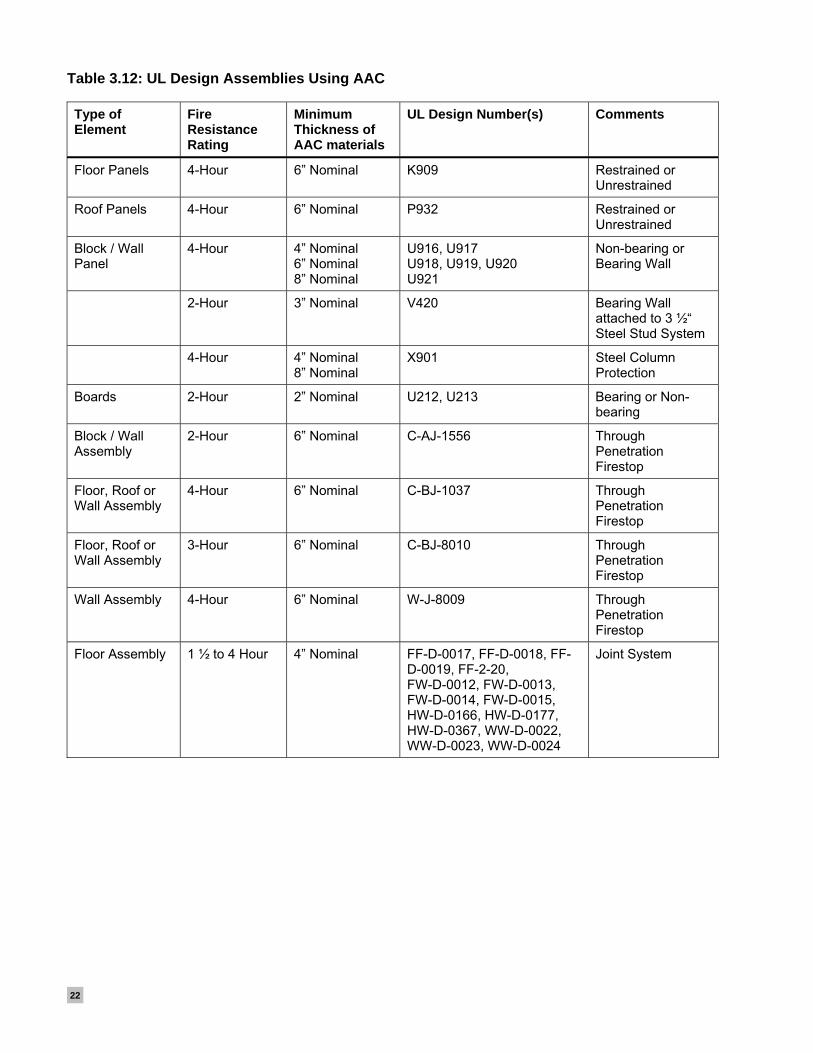
Testing included non-load bearing walls, load bearing walls and slab panel assemblies. Results of these tests
generated the fire ratings presented in Table 3.12 which are included in UL 1998 fire resistance directory. UL
classification and FMRC listing agreements enrolled Hebel AAC into a follow up service program focused on quality
assurance of AAC material.
22
Table 3.12: UL Design Assemblies Using AAC Type of Element
Fire Resistance Rating
Minimum Thickness of AAC materials
UL Design Number(s) Comments
Floor Panels 4-Hour 6” Nominal K909 Restrained or Unrestrained
Roof Panels 4-Hour 6” Nominal P932 Restrained or Unrestrained
Block / Wall Panel
4-Hour 4” Nominal 6” Nominal 8” Nominal
U916, U917 U918, U919, U920 U921
Non-bearing or Bearing Wall
2-Hour 3” Nominal V420 Bearing Wall attached to 3 ½“ Steel Stud System
4-Hour 4” Nominal 8” Nominal
X901 Steel Column Protection
Boards 2-Hour 2” Nominal U212, U213 Bearing or Non-bearing
Block / Wall Assembly
2-Hour 6” Nominal C-AJ-1556 Through Penetration Firestop
Floor, Roof or Wall Assembly
4-Hour 6” Nominal C-BJ-1037 Through Penetration Firestop
Floor, Roof or Wall Assembly
3-Hour 6” Nominal C-BJ-8010 Through Penetration Firestop
Wall Assembly 4-Hour 6” Nominal W-J-8009 Through Penetration Firestop
Floor Assembly 1 ½ to 4 Hour 4” Nominal FF-D-0017, FF-D-0018, FF-D-0019, FF-2-20, FW-D-0012, FW-D-0013, FW-D-0014, FW-D-0015, HW-D-0166, HW-D-0177, HW-D-0367, WW-D-0022, WW-D-0023, WW-D-0024
Joint System

MATERIAL PROPERTIES - 3 23
3.15 Acoustic Properties
Noise control in buildings is of great significance for the health and well-being of the occupants, especially in
residential dwellings, since they must provide an environment that is restful and relaxing. The building envelope
must also maintain privacy for the occupants. Noise control is also an important factor in other types of buildings
such as schools, hospitals, and offices.
Hebel AAC, a porous concrete material, provides a sound insulation value of up to 7 dB greater than other building
materials of the same weight (mass per area). Hebel’s surface mass coupled with the mechanical vibration energy
damping within its porous structure produces a building material with exceptional sound insulation properties.
In addition to using a wall material with superior sound insulation properties in relation to its mass per area, it is
always essential to construct the wall in a manner that closes off air leaks and paths by which noise can go around
or through the assembly. Hairline cracks or small holes will increase the sound transmission through the wall at the
higher frequencies. Hebel’s simple construction methods and details help to eliminate these cracks and holes in
the walls, thus providing a final wall assembly, which offers superior sound insulation characteristics for the
occupant.
The sound pressure level is the most important physical value to describe or quantify airborne noise inside and
outside buildings. It is defined as the ratio between a base sound pressure in our atmosphere (ca. 20 μPa) and the
sound pressure caused by noise. The threshold of pain corresponds to a sound pressure of approximately
100,000,000 μPa, similar to a jet plane taking off at a distance of approximately 50 yards. The relationship of
sound pressure to sound level is represented using a logarithmic scale.

24
Diagram 3.3: Relationship of Sound Pressure vs. Sound Pressure Level
In fact, the logarithmic scale of the sound level is appropriate because the perception of loudness by the human ear
is also logarithmic. Therefore, a 10 dB increase in the sound pressure is perceived as a doubling of the sound
loudness.
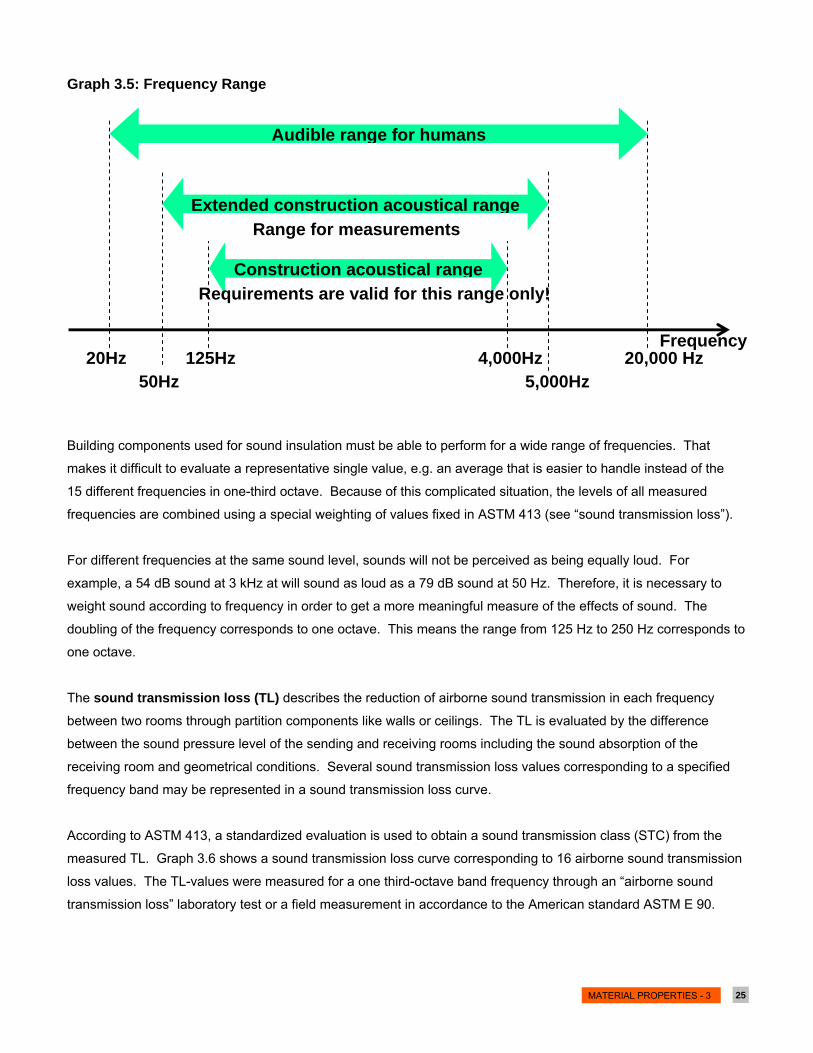
The frequency range of human beings depends on the individual state of health. The range of human acoustic
perception starts approximately at 20 Hz and ends at 20 kHz. STC measurements in buildings normally reference
frequencies between 50 Hz and 5 kHz. In the USA, requirements for STC values are determined by the frequency
range between 125 Hz and 4 kHz.
MATERIAL PROPERTIES - 3 25
Graph 3.5: Frequency Range
Building components used for sound insulation must be able to perform for a wide range of frequencies. That
makes it difficult to evaluate a representative single value, e.g. an average that is easier to handle instead of the
15 different frequencies in one-third octave. Because of this complicated situation, the levels of all measured
frequencies are combined using a special weighting of values fixed in ASTM 413 (see “sound transmission loss”).
For different frequencies at the same sound level, sounds will not be perceived as being equally loud. For
example, a 54 dB sound at 3 kHz at will sound as loud as a 79 dB sound at 50 Hz. Therefore, it is necessary to
weight sound according to frequency in order to get a more meaningful measure of the effects of sound. The
doubling of the frequency corresponds to one octave. This means the range from 125 Hz to 250 Hz corresponds to
one octave.
The sound transmission loss (TL) describes the reduction of airborne sound transmission in each frequency
between two rooms through partition components like walls or ceilings. The TL is evaluated by the difference
between the sound pressure level of the sending and receiving rooms including the sound absorption of the
receiving room and geometrical conditions. Several sound transmission loss values corresponding to a specified
frequency band may be represented in a sound transmission loss curve.
According to ASTM 413, a standardized evaluation is used to obtain a sound transmission class (STC) from the
measured TL. Graph 3.6 shows a sound transmission loss curve corresponding to 16 airborne sound transmission
loss values. The TL-values were measured for a one third-octave band frequency through an “airborne sound
transmission loss” laboratory test or a field measurement in accordance to the American standard ASTM E 90.
Audible range for humans
Frequency20,000 Hz20Hz
Construction acoustical range
4,000Hz125Hz
Requirements are valid for this range only!
Extended construction acoustical range
50Hz 5,000Hz
Range for measurements

26
Graph 3.6: TL-values of a Partition Component
The sound transmission class is a single number rating providing a convenient way to describe the sound
transmission loss (TL) values. It provides an estimation of the performance of the wall or floor in certain common
sound insulation conditions. The STC is determined by comparing its sound transmission curve with a standard
reference curve. The reference curve is superimposed over the sound transmission loss curve and shifted upwards
or downwards, relative to the TL-curve, taking in consideration certain conditions of ASTM 413. The sound
transmission class (STC) is taken to be the transmission loss value, measured in decibels (dB), corresponding to
the intersection of the reference curve and the 500 Hz frequency line.
Between neighboring rooms there is a transport of sound straight through the partition assembly. In massive
buildings there is in addition to this sound transmission, bypass noise transportation along flanking components
called flanking sound transmission. The lower the flanking sound transmission the higher the TL. It is very
important to regard this flanking sound transmission as well because there might be a large influence on the result
of the TL.

MATERIAL PROPERTIES - 3 27
3.16 Relationship Between Sound Transmission Class and Sound Reduction Index (R’
w)
In European countries there are two important terms to describe the acoustic performance of assemblies. Rw [dB]
is the abbreviation for TL or sound reduction index (SRI) without flanking sound transmission (e. g. in laboratories).
When describing the sound reduction of partition components in buildings it is necessary to describe the complete
sound transmission (direct and bypass) using R’w [dB].
The difference between STC and Rw is not very wide. The approximate relationship between the two can be
expressed by the equation STC = Rw + 1 [dB]. The safest calculation is to set STC = Rw [dB]. The small difference
between these two parameters is caused by the discrepancy of the range of frequencies considered.
Sounds generated by pedestrian foot traffic in buildings in adjacent rooms are referred to as impact noise. This
type of noise is easily perceived by occupants of space beneath the space where the impact occurs. The most
important value to interpret a floor/ceiling construction is the impact insulation class (IIC).
The equivalent of IIC according to the European standards is L’n, w [dB]. The calculation of IIC according to
ASTM E 989 (edition 1989) is in general synonymous with building L’n, w [dB] according to ISO 717-2 (edition 2006).
So it is acceptable to work with the following relationship:
IIC ≈ L’n, w.
3.17 Code Requirements
Building regulations governing acoustic performance are sometimes only recommendations and not usually
enforceable by law. In addition to the requirements for design of the building elements, the overall design of the
building, the quality of construction and workmanship can have marked effects on the actual sound insulation within
a building.
In general the acoustic performance of walls and ceilings between neighboring dwellings in apartment houses must
have a STC ≥ 45. In areas with high noise, e. g. between a living unit and public space or service areas, the
requirement increases up to STC ≥ 50 dB. In some buildings and regions in the USA the required acoustic
performance is satisfied if a field sound transmission class (FSTC) of 5 dB below the code required STC is
measured.

28
3.18 Acoustic Performance of AAC
The most important character of a solid homogenous single wythe partition element is to describe its acoustical
performance is the mass per area or surface-related mass (thickness time’s density). The higher the mass per
area of a wall assembly the higher the STC will be.
AAC has been shown to provide better insulation to sound transmitted by air than other building materials, for
example concrete under comparable conditions. The inner damping of AAC is one of the significant reasons for the
high sound insulating performance of AAC. In comparison with other materials of the same mass per area, AAC
has up to a 7 dB higher STC. The German standard DIN 4109 (1989) allows a 2 dB increase in sound insulation
for AAC walls, with a surface-related mass in the range of 85 - 250 kg/m² (17 - 51 lbs/ft²).
3.19 Design for Sound Insulation Based on Tables
Table 3.13: Surface-related Mass vs. Sound Insulation is valid for all single wythe wall assemblies made of AAC.
Regarding the SRI there is no difference between single layer walls (inside and outside), ceilings or roof
assemblies. An AAC roof and wall score the same SRI in the case that the components have the identical surface-
related mass.

MATERIAL PROPERTIES - 3 29
Table 3.13: Surface-related Mass vs. Sound Insulation
Mass per Area For AAC (incl. AAC Bonus)
m’ (kg/m2) W (lb/ft2)
For All
Massive
Materials R’w
According to
DIN 4109
(dB)
R’w
According to
DIN 4109
(dB)
Rw According
to new DIN
4109 (dB)
For CMU Walls
STC = 23*(w)0.2
According to
NCMA TEK 13-
1
80 16 33 35 40 40
85 17 34 36 40 41
90 18 35 37 41 41
95 19 35 37 42 42
105 21 37 39 43 42
115 23 38 40 45 43
125 26 39 41 46 44
135 28 40 42 47 45
150 31 41 43 48 46
160 33 42 44 49 46
175 36 43 45 50 47
190 39 44 46 51 48
210 43 45 47 52 49
230 47 46 48 53 50
250 51 47 49 54 51
Legend:
R’w: Sound transmission loss with flanking sound transmission along bypasses in buildings.
Rw; Sound transmission loss without flanking sound transmission along bypasses in buildings.
Note: Plaster should also be included in the calculation of surface-related mass.
Table 3.14: Sound Transmission Class of Single Wythe AAC Components
Thickness Dry Bulk Density STC
[mm] [in] [kg/m³] [lbs/ft³] [dB]
200 8 500 31 42
250 10 500 31 44
300 12 500 31 46
30
3.20 Surrounding Noise
Increasing noise levels caused by road traffic or industry is an increasing problem for existing and new building
sites. Facades, windows, and outside walls also have to work as sound barriers.
Traffic noise, caused by cars, trucks, busses, trains or aircrafts; generate high occurrences of low frequencies. The
STC primarily is defined for noise spectra caused by common behavior of people in buildings and human speech,
lower frequencies are not considered in the calculation of STC.
To address the lower frequencies from outside noise an additional ranking has been established. The single-
number rating of the outdoor-indoor transmission class (OITC) includes lower frequencies.
The sound reduction in lower frequencies of nearly all materials is usually smaller at higher frequencies. The
weighting of sound transmission loss (TL) according to ASTM E 1332 transforms the STC to OITC.
The “rule of thumb” is as follows: OITC usually is 5 – 10 dB less than STC.

MATERIAL PROPERTIES - 3 31
3.21 References
International Building Code 2006; International Code Council
NCMA TEK 13-1 (1990) National Concrete Masonry Association; “Sound Transmission Class Ratings for Concrete
Masonry Walls“
NCMA TEK 13-2 (1983) National Concrete Masonry Association; „Noise control with concrete masonry in multi-
family housing“
ASTM E 90 – 90 „Standard Test Method for Laboratory Measurement of Airborne Sound Transmission Loss of
Building Partitions
NCMA TEK 69A (1978) National Concrete Masonry Association; „New Data on Sound Reduction with Concrete
Masonry Walls“
ASTM E 989 – 2006 „Standard Classification for Determination of Impact Insulation Class (IIC)”
ASTM E 492 “Single-number rating is called impact insulation class (IIC)”
ASTM E 1007 “Single-number rating is called field impact insulation class (FIIC)”
Hebel-Manual USA; approximately end of 1997
www.stcratings.com/assemblies.html
Recommendations for constructions of ceilings developed by Mr. Bestel (Hebel) approximately in 2002
DISCLAIMER. This document is not intended to replace the knowledge, experience and judgment of design professionals. Xella Aircrete North America, Inc. is not responsible for ensuring weather-tightness, overall functionality or fitness for use of the panels, nor compliance with federal, state, or local laws, ordinances or regulations, including building, environmental and other codes. WARNING. Property damage, personal injury or death may result from improper design, use, or installation. Licensed design and construction professionals, who maintain good standing with the governing authority and have the necessary knowledge, experience and judgment of the specific building system and its components, should be retained to ensure a proper design, use, and installation. MODIFICATIONS. Xella Aircrete North America, Inc. reserves the right to change its Technical Manual, Design Guide, safe working loads, panel dimensions or installation techniques at any time without prior notice. Last modified: 1/7/2010. WARRANTY/DAMAGES. This document and all further technical advice are based upon Xella Aircrete North America, Inc.’s present knowledge and experience. However, Xella Aircrete North America, Inc. assumes no liability for providing such information and advice. Xella Aircrete North America, Inc. disclaims all CONDITIONS AND WARRANTIES, WHETHER EXPRESS OR IMPLIED, INCLUDING THE IMPLIED WARRANTIES OF FITNESS FOR A PARTICULAR PURPOSE OR MERCHANTABILITY. XELLA AIRCRETE NORTH AMERICA, INC. SHALL NOT BE RESPONSIBLE FOR CONSEQUENTIAL, INDIRECT OR INCIDENTAL DAMAGES (INCLUDING LOSS OF PROFITS or USE) OF ANY KIND.

32