section 3.0 verification and validation of the 3mra … load across this network and retrieving...
TRANSCRIPT


Section 3.0 Verification and Validation of the 3MRA Modeling System
3-1
Integrated System Testing
Version Control
Model Validation throughTRIM Comparison
Sensitivity and UncertaintyAnalysis
Figure 3-1. Overall approach to ensure thequality of the 3MRA modeling system
technology.
3.0 Ensuring Quality of the 3MRA Modeling SystemThis section addresses the ensurance of the quality of the 3MRA Modeling System at the
system level. Figure 3-1 provides a broad overview of the system verification and validation.
3.1 Verification of the Modeling System
Verification of the 3MRA modelingsystem requires that the software components ofthe system function according to their individualand collective design. Verification of the 3MRAmodeling system implies that the science-basedmodules and data processors are codified insoftware form correctly. This section describesthe key aspects of the software development andverification protocols followed for the 3MRAmodeling system.
The 3MRA modeling system representsthe integration of more than twenty-fiveindependent software components developed byfive different software development groupslocated across the country and possessingdifferent levels of expertise with respect tosystem software development. Because of thistechnically diverse and geographically disperseddevelopment team, there was a need to formulatea comprehensive and rigorous approach forexecuting and managing software developmentand quality assurance. Four key elementscontributed to the successful development,testing, and delivery of the 3MRA modelingsystem: (1) open and regular teamcommunications, (2) a documented top-downapproach to software design, (3) a rigorousimplementation of software quality assurance and testing, and (4) a sound strategy for archivingthe software. The following sections describe the manner in which each of these elements wasimplemented for the 3MRA modeling system.

Section 3.0 Verification and Validation of the 3MRA Modeling System
3-2
3.1.1 Development Team Communications
The day-to-day management of the 3MRA modeling system development requiredcommunication methods that bridged the geographic distribution of team members on a regularbasis. A combination of e-mail, tele- and video- conferencing, and face-to-face meetings wereused to satisfy the communication requirements. Rapid reporting of problems and transfer of thescience modules was facilitated by the e-mail communications. Regular periodic and on as-needed basis teleconferences were scheduled as e-mail traffic indicated the need for a teamconsultation. During the critical stages of development, teleconferences were held as often astwice a week. A detailed agenda was developed and distributed to team members before eachcall. Project status, technical problems, and technical decisions were discussed.
Periodically (i.e., on the order of two to three times per year), an all-hands meeting washeld to address issues that required extensive and focused discussion. For example, early in thedevelopment process, after the system design had been documented, teleconference discussionsindicated inconsistent interpretations of the design. Attempts to resolve these issues throughteleconferences were deemed unsuccessful when efforts to link the first components failed due todata interchange conflicts. Therefore, an all-hands meeting was held when multiple groups wereready to attempt linkages between their modules. The convergence to a common understandingof the system design with respect to the proper operation of the system was facilitated by theintense discussions occurring during attempts to link modules.
3.1.2 Top-Down Design Approach
The foundation of the technical approach was the “software system life cycle” processapplied with modern object-oriented system design principles. Two elements applied early inthe process proved to be critical to the success of the effort. First was the documentation of thesystem design, especially the specification of the science modules and databases. Second wasthe relationship among these modeling components, in the form of data representation andinterchange. The use of an Applications Programming Interface (API) that both provided astandard data representation scheme and established a required protocol for data interchangeproved to be critical. The API, in addition to minimizing the occurrence of data conflictsbetween modules, also served as a focal point for technical discussions.
3.1.3 Quality Assurance and Testing Strategy
The objectives of software testing are three-fold and include the following:
1. To uncover errors in requirements, design, and programming; 2. To identify or confirm limitations of the system; and 3. To verify the capabilities of the system.
The single most significant factor in the successful development of the 3MRA modelingsystem was the establishment and steadfast adherence to a rigorous testing strategy. Given thetechnically diverse and geographically dispersed nature of the 3MRA modeling systemdevelopment team and the size of the software system to be developed, it was imperative toestablish a rigorous software testing strategy. The strategy for testing the 3MRA modeling

Section 3.0 Verification and Validation of the 3MRA Modeling System
3-3
system included a procedure for components in a standalone mode and a procedure for systemsintegration testing.
The software development occurred at the component level first. When sufficientinfrastructure and science-based components (modules and databases) were available, system-level integration was initiated. When component developers had completed a first version of thesoftware, they could test it both as a standalone executable and also in the context of the systemsoftware. Often, component software that ran without error in a standalone mode wouldexperience significant difficulty when integrated into the system. Typically, this was due to dataconflicts with other components that were either sending data to the module or receiving outputsfrom the module.
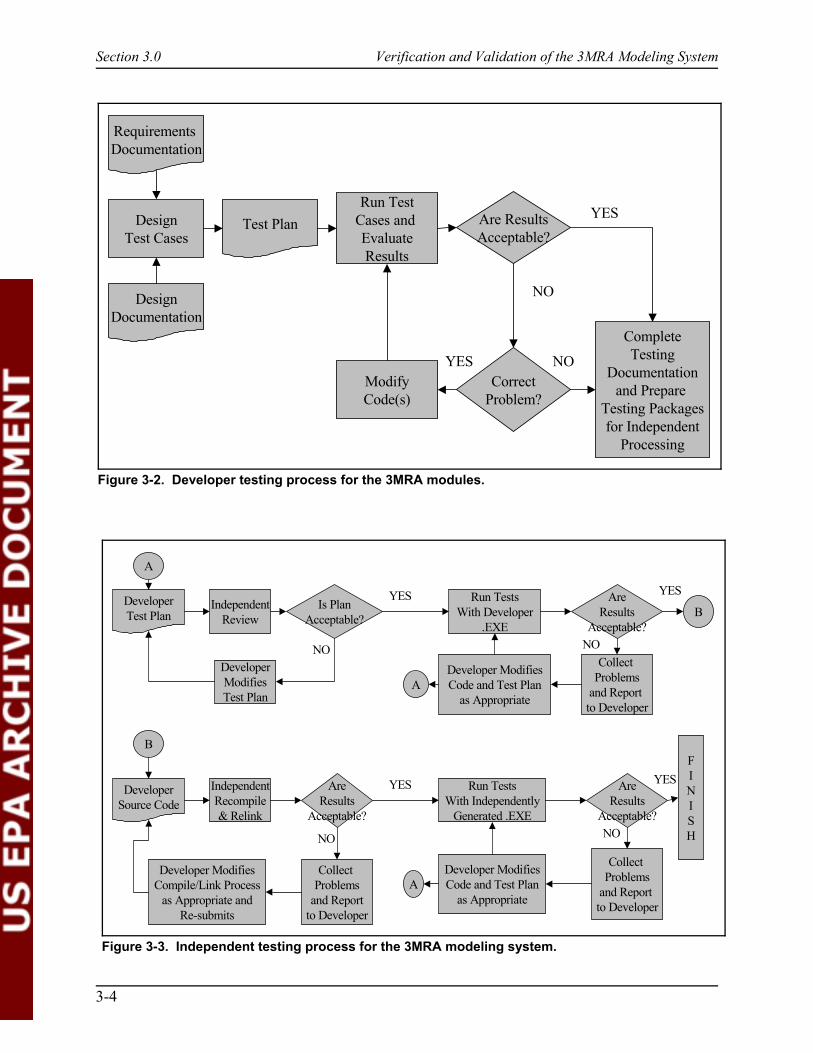
As components were developed, the developers also established and documented formaltest plans. Software testing for the 3MRA modeling system was requirements based; that is,specific tests were designed to ensure that each of the requirements associated with the softwaredesign was correctly implemented. While the developer had primary responsibility for the testplan and its successful execution, it was also required that the test plans be reviewed and thetests re-executed by independent developers (i.e., software engineers and modelers not directlyinvolved in developing the component software). Thus, all 3MRA modeling system softwarewas required to undergo two levels of formal testing. Figure 3-2 illustrates the testing protocolfor the developer and Figure 3-3 illustrates the protocol followed for independent testing, at thecomponent level. To facilitate the independent testing, the developers constructed test packagesthat included all documentation, source code, and test files associated with a component. As canbe seen in Figure 3-3, the independent tester first reviewed the test plan for completeness, todetermine if sufficient tests had been designed to verify the implementation of all requirements. The independent tester was free to add tests to the test plan. Once the test plan was approved,the independent tester executed all the tests using the developer’s executable version of thesoftware. When this was successful, the independent tester then recompiled the componentsoftware and re-executed the tests a second time. This second level of independent testingproved invaluable in identifying issues related to compilation and also ensured that the completeset of software related to the component was provided.
After the 3MRA modeling system components satisfied all tests, it was necessary toplace them into the complete 3MRA modeling system to confirm their functionality in thiscontext. The system integration tests required that components operate error free whileexecuting within the full system context (i.e., running the full set of site/WMU combinations forthe contaminants of interest and the iterations of the Monte Carlo simulation). System-leveltesting uncovered not only programming errors such as data conflicts, but also several science-based errors. The 3MRA modeling system representative national dat set of 201 sites executedwithin a Monte Carlo simulation provided a testbed that stressed the numerical solutions ofscience models in a manner not previously possible. For example, even legacy codes that hadmore than a decade of wide use experienced environmental conditions that resulted in unstablenumerical solutions.
Section 3.0 Verification and Validation of the 3MRA Modeling System
3-4
DeveloperTest Plan
IndependentReview
Is PlanAcceptable?
DeveloperModifiesTest Plan
Collect Problems
and Report to Developer
AreResults
Acceptable?
Run TestsWith Independently
Generated .EXE
AreResults
Acceptable?
Run TestsWith Developer
.EXE
Developer ModifiesCode and Test Plan
as Appropriate
Collect Problems
and Report to Developer
Developer ModifiesCode and Test Plan
as Appropriate
IndependentRecompile& Relink
AreResults
Acceptable?
Collect Problems
and Reportto Developer
Developer ModifiesCompile/Link Process
as Appropriate andRe-submits
DeveloperSource Code
B
BFINISH
A
A
A
YES
YESYES
YES
NO NO
NONO
Figure 3-3. Independent testing process for the 3MRA modeling system.
Requirements Documentation
DesignDocumentation
DesignTest Cases
Test PlanRun Test
Cases and EvaluateResults
Are ResultsAcceptable?
CorrectProblem?
ModifyCode(s)
CompleteTesting
Documentationand Prepare
Testing Packagesfor Independent
Processing
YES
NO
NOYES
Figure 3-2. Developer testing process for the 3MRA modules.

Section 3.0 Verification and Validation of the 3MRA Modeling System
3-5
The system integration tests were initially conducted on single PCs. Computation timefor the 3MRA modeling system was typically on the order of a few minutes per site-basedsimulation. Thus, a single PC might run continuously for several days before completing asimulation for all combinations related to a single contaminant. When runs for multiplecontaminants were required, several PCs were used, each running a subset of the full list ofrequired simulations. Recently, EPA has constructed a PC-based cluster that includesapproximately 160 PCs networked together and developed software for distributing thecomputational load across this network and retrieving output files. While this configuration ofPCs (named the Super-computer for Model Uncertainty and Sensitivity Evaluation[SuperMUSE]) was intended as a research tool for investigating uncertainty and sensitivityrelated to the 3MRA modeling system, it also serves as a final testing ground for the softwareitself. Before Version 1.0 of the 3MRA modeling system was released, the SuperMUSE hadsuccessfully executed on the order of one million individual 3MRA modeling systemsimulations.
3.1.4 Software Archiving and Distribution
The 3MRA modeling system is a large and complex software system. It is composed ofover 100 binary, configuration, and data files. In addition, the test packages included over 200source code files and numerous files. More than 15 software engineers and scientists from fivegeographically distributed groups contributed to the development of the 3MRA modeling systemand it is likely that additional software engineers will contribute to its future development. Coordinating all the changes among these entities in order to assure the quality andreproducibility of the final release required formal archiving and release procedures.
The first step to establishing these procedures was to set up a version control system. Version control software is used to archive files and track changes. Several commercialsoftware packages that could handle this task were reviewed. Microsoft’s Visual SourceSafewas selected because it provided a robust functionality, licenses were available, and the internaldevelopment team had previous experience using it. The Visual SourceSafe software runslocally on a user’s machine. However, the actual file repository is kept on a network drive. Thisdrive is fully backed up every week and incrementally backed up each evening. Two of theprimary functions of the software package are keeping track of file versions and preventingmultiple developers from modifying the same file at the same time. When a developer wants toupdate a file, the file is “checked out,” which locks the file and prevents others from updating it. The file is modified and then “checked backed in.” This updates the file in the version controlsystem. The previous version of the file is not lost, as all versions are archived. This allows thereconstruction of any version of the components or the entire system.
Individual projects in Visual SourceSafe were created for each system component (e.g.,science module). The baseline version of all components and the system in general is referred toVersion 1.0.
The initial compilation of the Version 1.0 archive was actually the last step of the testingprotocol. For reference, a system component is compiled in the form of a binary file such as anexecutable file or a dynamic link library (dll) file. On the Microsoft Windows platform, an

Section 3.0 Verification and Validation of the 3MRA Modeling System
3-6
executable is a file that has an “.exe” extension. A dll file has a “.dll” extension. Eachdeveloper was required to provide a package of files that were to be associated with the Version1.0 release. The package was to include the following:
# All necessary source code and libraries needed to compile the specified module;
# All test packages, including test data and auxiliary files (e.g. batch files, scriptfiles) required to run the test suites; and
# All documentation describing the purpose of each test case and how to execute itand the expected results.
As the individual module packages were received, they were then compiled. Compilation is the step whereby source code, computer instructions written in higher-levellanguages such as FORTRAN or C++, is converted into machine-readable binary files. Thereare a wide variety of compiler types, brands, and versions available. For instance, to compileC++ code, EPA used the compilers included with Borland C++ Builder and Microsoft VisualC++. Each of these has six or more versions in existence. The compiler originally used by eachdeveloper was used whenever possible. When not possible, a version as close to the developer’sversion as possible was used. This resulted in a standard set of compilers now used by EPA forarchiving.
All tests included in the packages were then executed. Accompanying documentationprovided step-by-step instructions on how execute the individual test suites. In cases where testswere not successfully executed, the developer was informed and required to resolve any issues(e.g., out-of-date test package, errors in source code).
After successful completion of all tests, the resulting materials were entered into VisualSourceSafe. This completed the component level testing and verification process. The next stepwas to perform system testing. The PCs in the SuperMUSE are currently configured withdifferent versions of Microsoft Windows. SuperMUSE has custom software that allows it to runstand-alone models such as the 3MRA modeling system on the PC cluster. The software allowsfor the distribution of various scenarios and subsequent data collection. Running the software onSuperMUSE enables EPA to complete hundreds of thousands of runs. This would not befeasible if all system testing were done on individual PCs. Any component-specific errors thatwere discovered were referred back to the developer as described above. The development teamaddressed system-level errors and the system was retested. Any file changes that were requiredto fix component or system errors were updated into Visual SourceSafe.
After final testing was completed and the archive was populated with a complete set ofsystem software and related documentation, the materials were made available to the public. Procedures are under development for distributing the software to the public, providing technicalassistance, and accepting new or updated models. It is not currently clear how version controlwill work when the 3MRA modeling system is distributed to the public. All materials, includingsource code, will be made available. EPA is currently reviewing various open-source licensingagreements and anticipates including such an agreement requirement whenever the source codeis requested. It is understood that EPA is the designated owner of the “official” 3MRA modeling
Section 3.0 Verification and Validation of the 3MRA Modeling System
3-7
system software. EPA keeps all the files necessary to compile, test, document, and execute the3MRA modeling system. Although the public will be free to modify the software, the alteredsoftware will not be considered official unless it is processed by EPA through the proceduresdescribed above.
3.2 Validation of the System
In the context of a national regulation, a complete approach to demonstrating that the3MRA modeling system produces results consistent with field observations would necessarilyrequire field data comparisons of the 3MRA modeling system for numerous contaminant releasescenarios covering the range of environmental conditions where waste disposal is possible.However, as pointed out earlier, no such data are currently available to validate the system.Therefore, EPA had to resort to alternative approaches to ensure the quality of the modelingsystem.
The approach undertaken here, as a first step, involves the application of the 3MRAmodeling system to a single site and the comparison of results with (1) available fieldobservations, and (2) compare with the results of the application of a second modeling system tothe same site.
This approach was implemented through a collaborative effort with the modeling teamdeveloping the Total Risk Integrated Methodology (TRIM), a multimedia model designed toserve a similar purpose in support of EPA’s Office of Air Quality Planning and Standards(OAQPS). Although TRIM supports the development of air regulations, as opposed to the3MRA modeling system’s focus on land-based disposal of solid wastes, the two models share aneed to simulate the fate and transport of contaminants in all media, not just the media in which acontaminant is first released. The 3MRA modeling system and TRIM take very differentapproaches to simulating the multimedia system of physical/chemical/biological processes andthus a model comparison study provides an opportunity to gain experience applying eachapproach and confidence that model predictions are reasonable.
There are five primary steps to modeling a site: problem definition, siteconceptualization, collection/organization of modeling data, model execution, and interpretationof results. Problem definition includes site selection, a statement of an assessment problem, andspecific modeling goals to be achieved. Site conceptualization is the process of delineating thephysical features of a site in a manner consistent with model design. The inter-connectivity ofthe features must also be specified (e.g., watershed connectivity to stream segments). Datarepresenting contaminant source terms, environmental conditions related to the physical featuresof the site, chemical properties (physical/chemical/biological constants/rates), and contaminantdistribution in each of the media must be collected and organized for use by the model. Modelexecution is a mechanical step that applies the model to achieve the stated modeling goals. Interpretation of results for this study includes both a comparison of results with available fieldobservations as well as an inter-model comparison. The following sections provide a moredetailed description of these steps for this model comparison study.

Section 3.0 Verification and Validation of the 3MRA Modeling System
1 http://www.state.nc.us/dep/rwm/holtrachem/index.htm
3-8
3.2.1 Problem Definition
3.2.1.1 Site selection. Establishing criteria for site selection is fundamentally a functionof model purpose and design. The purpose of both the 3MRA modeling system and TRIM is toestimate the potential human and ecological exposure and associated health risks associated withthe release of contaminants from regulated industrial sources. As such, a site selected for thisstudy must contain a source of contaminant released to the environment. The contaminant, atleast for initial comparisons, should be a multimedia contaminant, that is, subsequent to release itshould be distributed throughout the environment. Further, data must be available that describethe environmental setting as it is represented in the models. In the case of both TRIM and the3MRA modeling system, the environmental setting includes all media: air, soil, vadose zone,ground water, surface water, sediment, and biota. Data that vary as a function of time (e.g.,meteorology) must be available for a time period relevant to the simulation. For example, if afacility operated for thirty years, then time series data should be available for those thirty years,and for a period of time following facility closure. The 3MRA modeling system and TRIMestimate long-term average exposures extending over periods of several years to a lifetime. Eachmodel simulates these periods with time steps that may be as short as an hour or as long as ayear; thus, time-varying data must be available for decades and at intervals as short as an hour. Finally, data must be available that reflects the impact of the source on the health of the humanand ecological receptors occupying an area near the source, generally to two or more miles fromthe source. These data include time series of concentrations in each of the modeled media andintermedia contaminant fluxes. These concentrations and fluxes should be available at severallocations within the area of interest.
In response to comments of the EPA Science Advisory Board related to a review ofTRIM, an extensive review of the literature was conducted in an effort to locate data sets for usein evaluating the performance of TRIM.Fate. The conclusion reached by the TRIM modelingteam is that “[N]one of the studies identified during EPA’s literature review provides completeand concurrent information on contaminant concentrations in the five major environmentalmedia (i.e., air, water, sediment, soil, biota) along with the associated source terms(s) andhistorical environmental characteristics (e.g., meteorology, hydrology, landscape properties).” Given this limitation it is necessary to scale back on the site selection criteria and choose a sitewhere the amount of available information is maximized.
Of the sites reviewed, the TRIM modeling team selected the HoltraChem Manufacturingsite in Orrington, Maine, and selected mercury as a case study contaminant of concern. Thefollowing description of the HoltraChem site is taken from the Maine Department ofEnvironmental Protection website1.
The HoltraChem Manufacturing Company in Orrington, Maine… islocated on a 235-acre property on the banks of the Penobscot River. Approximately 50 acres are developed and include the manufacturing facility,five landfills, a surface impoundment and a waste pile. The immediate plant areais approximately 12 acres. The property is west of Route 15 and it abuts the
Section 3.0 Verification and Validation of the 3MRA Modeling System
3-9
PERC waste-to-energy plant on the north and west. It opened in 1967 andmanufactured chlorine, caustic soda (sodium hydroxide) and chlorine bleach(sodium hypochlorite) used by paper mills. The plant also manufacturedhydrochloric acid and the pesticide chloropicrin. The plant closed in September,2000.
The plant used a chlor-alkali process to separate sodium and chlorinefrom salt water. In this process, elemental mercury was used as a cathode tocollect the sodium from the water. The chlor-alkali process is an oldertechnology and has been replaced by mercury-free production techniques atnewer plants and some converted older plants. When it stopped operations lastfall, HoltraChem was one of 13 chlor-alkali plants left in the country. There wereas many as 30 chlor-alkali plants in the United States at one time.
A site investigation determined that the HoltraChem property, includingparts of the Penobscot River, is contaminated with mercury, chloropicrin andseveral volatile organic compounds. Additional investigation will be done intothe presence of additional areas of mercury contamination and polychlorinatedbiphenols (PCBs).
Specifically, the following contaminants at a minimum are present on site:
# Soils: chloropicrin, ethylbenzene, xylenes, arsenic, barium,cadmium, chromium, lead and mercury.
# Ground water: 1,1 dichloroethane, acetone,bromodichloromethane, bromoform, carbon disulfide, carbontetrachloride, chlorobenzene, chloroform, chloromethane,chloropicrin, dibromochloromethane, methylene chloride,trichloroethene, mercury, potassium, and sodium.
# Surface Water: carbon tetrachloride, chloroform and mercury.
# Sediment: mercury
# Biological samples: mercury
The developed part of the property can be subdivided into threephysiographically distinct areas: 1, the bedrock ridge, 2, the plant area, and 3,the river area. The northeast trending bedrock ridge is north and northwest of theplant area and separated from the plant by an abrupt scrap. The elevation of thecrest of the ridge varies from 80 ft. to 145 ft. The plant is constructed on arelatively flat surface about 65 ft. elevation, about 500 feet east of the Penobscotshoreline. The river area slopes steeply from the plant area to the river. Thenorthwest side of the bedrock ridge is drained directly to the river by a smallintermittent stream. The western part of the plant area drains west through theriver area by way of the Northern Stormwater Drainage Ditch. The eastern part
Section 3.0 Verification and Validation of the 3MRA Modeling System
3-10
of the plant area is drained south to the Penobscot by the Southerly Stream. TheNorthern Stormwater Drainage Ditch and the Southerly Stream are perennialstreams that flow all year long and derive some of their water from ground waterdischarge.
The overburden deposits at the site can be grouped into four types.Glacial till is a silty sand that contains abundant clay and gravel as well. Till isdeposited directly from glacial ice without appreciable sorting by water. Glacialoutwash is made up of moderately sorted sand and gravel that tends to be poor insilt and clay. Outwash is quite permeable, and where thick deposits occur belowthe water table it can be an excellent aquifer resource. Fine grained marinesediments in coastal Maine are referred to as the Presumpscot Formation. ThePresumpscot Formation is made up largely of silty clay that was carried out ofthe glacier by meltwater and settled out in the ocean. Finally, there are depositsof fill on the site that include till, outwash and marine sediments that wereredistributed during construction at the plant, and brine and wastewater sludgestabilized with sand in the hazardous waste landfills.
The geology of the site varies from place to place. The bedrock ridge ismade up of tough metamorphic rock covered by a thin layer of glacial till. Thereare thick deposits of man-made fill on the ridge, including three hazardous wastelandfills. The plant area is developed on thick overburden that is mostly compactglacial till, but a shallow wedge of sandy outwash occurs all along the southernedge of the bedrock ridge. The shallow sandy outwash thickens west toward theriver so that the river area is underlain by a thick sequence of sand and gravel.
Ground water flows in bedrock fractures on the bedrock ridge. It flowsnorth directly to the Penobscot on the north side of the ridge, but it flows southtoward the plant on the south side of the ridge. The thick compact glacial tillunder the plant area is not very permeable, so most of the ground water under theplant area flows in shallow fill and outwash sand over the top of the till surface.Ground water from the southern part of the plant area discharges to theSoutherly Stream. Ground water from the rest of the plant area flows west to thePenobscot River through the river area.
While ownership has changed several times, Mallinckrodt, Hanlin andHoltraChem have each worked to advance the cleanup. Several of the actionswhich HoltraChem and Mallinckrodt have taken to control and clean uppollution at the plant are listed below:
# Relined a lagoon to stop waste from discharging to ground waterwhich flows into the Penobscot River;
# Installed riprap on the riverbank next to one of the plant landfillsto prevent erosion and river contamination;

Section 3.0 Verification and Validation of the 3MRA Modeling System
3-11
# Installed a ground water collection system to capture a portion ofcontaminated ground water discharging from the site fortreatment, and
# Instituted measures to prevent contaminated sediment fromreaching the river.
3.2.1.2 Problem statement and modeling goals. As described, the HoltraChem siteincludes a host of contaminant release problems, ranging from chemical spills to disposal ofwaste in landfills, a surface impoundment, and a waste pile to fugitive emissions from chemicalprocessing. Contaminants present at the site include several metals, volatile organic compounds,and PCBs.
Mercury will serve as the initial focus of model application and comparison because(1) mercury is a contaminant of concern to both OAQPS and OSW, (2) mercury is a pollutantwhose fate, transport, and bioaccumulation involve all media, and (3) mercury levels have beenmonitored in a number of media and locations at the HoltraChem site. Table 3-1 summarizes theavailable mercury monitoring data.
Various limitations in data availability and differences between TRIM and the 3MRAmodeling system constrain the application and the interpretation of results. With respect to dataavailability the following limitations exist:
# The source term for mercury emissions is based on based on the characteristics ofthe chlor-alkali facility operations and not specific measurements at HoltraChem;
# Monitoring data provides more of a snapshot of mercury in the surroundingenvironment than a continuous measure of its presence during the period ofHoltraChem operations; and
# Contributions from other sources of mercury (both on-site and off-site) are notexplicitly accounted for in this initial assessment.
With respect to differences between the 3MRA modeling system and TRIM the followinglimitations in the model comparison are noted:
# Currently, TRIM simulates only multimedia fate and transport; human andecological exposure and risk are currently being added.
# The 3MRA modeling system does not simulate subsurface fate and transport foratmospherically deposited contaminants. Thus, no vadose zone or aquifersimulation of mercury movement is conducted for the 3MRA modeling systemruns.
# TRIM does not simulate land-based disposal units and thus the landfills, surfaceimpoundment, and waste pile are not simulated.

Section 3.0 Verification and Validation of the 3MRA Modeling System
3-12
Table 3-1. Site Sampling Data for HoltraChem Facility and Nearby Areas and Water Bodies
All data sampled between 1993 - 1997 Minimum Maximum Mean Std Dev Median
On-site
Surface Soil (THg* mg/kg, dry wgt) 0.18 10.3 5.05 3.47 4.8
Surface Soil (THg mg/kg, dry wgt) 0.14 310 30.1 47.6 13
Surface Soil (THg mg/kg, dry wgt) 0.2 310 5.37 11.4 1.2
Surface Soil (THg mg/kg, dry wgt) 4.5 126.9 23.8 41.8
SubSurface Soil (THg mg/kg, dry wgt) 0.1 80 12.4 16.3 6.2
Deer Mouse (THg mg/kg, ww, whole body) 75%moisture 0.06 0.198 0.1 0.063
Earthworm (THg mg/kg, ww, 85% moisture) 0.087 2.82 0.982 0.79
Off-site
Ambient Air (THg ng/m3) [1500m SE] 0.834 157 9.96 15.52
Ambient Air (THg ng/m3) [4300m NNW] 0.993 25.8 2.46 2.15
Ambient Air (THg ng/m3) [6400m NNW] 0.565 14.8 1.85 1.66
Surface Water (THg ug/L unfiltered Upstream ofFacility 0.00359 0.00529 0.004 0.001 0.004
Surface Water (THg ug/L unfiltered Downstreamof Facility 0.000646 0.0703 0.034 0.033 0.027
Surface Water (THg ug/L unfiltered RiverAdjacent to Facility 0.0041 0.173 0.015 0.0377
Sediment Swetts Pond (THg mg/kg dw) 0.319
Sediment Thurston Pond (THg mg/kg dw) 0.157
Sediment Brewer Lake (THg mg/kg dw) 0.201
Sediment Fields Pond (THg mg/kg dw) 0.132
Juvenile Loon Swetts Pond (blood THg conc ppmww) 1.3
Loon Egg Brewer Lake (Hg conc ppm ww) 1.6 1.8 1.73 0.11
Deer Mouse Dorethea Dix Park (THg mg/kg, ww,whole body) 75% moisture 0.016 0.087 0.0515 0.05
Earthworm Dorethea Dix Park (THg mg/kg, ww,85% moisture 0.044 0.044 0.044
(continued)

Table 3-1. (continued)
Section 3.0 Verification and Validation of the 3MRA Modeling System
All data sampled between 1993 - 1997 Minimum Maximum Mean Std Dev Median
3-13
Short Tail Shrew Dorethea Dix Park (THg mg/kg, 0.064
Eel (THg mg/kg ww 80% moisture RiverUpstream of Facility) 0.271 0.876 0.53 0.2
Eel (THg mg/kg ww 81% moisture RiverDownstream of Facility) 0.259 0.678 0.46 0.14
River Minnow (THg mg/kg dw whole bodyDownstream of Facility) 0.447
White Perch Swetts Pond (mg/kg ww) 0.5 1.31 0.98 0.25
White Perch Fields Pond (mg/kg ww) 0.28 0.72 0.45 0.14
White Perch Thurston Pond (mg/kg ww) 0.6 2.2 1.07 0.43
White Perch Brewer Lake (mg/kg ww) 0.32 0.53 0.41 0.08
State of Maine averages
State Avg Loon Egg Hg Conc (ppm ww 43samples) 0.93 0.55
State Avg Juvenile Loon THg BloodConc (ppmww 52 samples) 0.22 0.29
State Avg Adult Male Loon Hg Conc (ppm ww 6locations) 0.61 3.71 2.62 1.23
State Avg Adult Male Loon Hg Conc (ppm ww 67 samples) 2.5 1.1
State Avg Adult Female Loon Hg Conc (ppm ww 64 samples) 2.1 1.5
*THg = Total mercury.
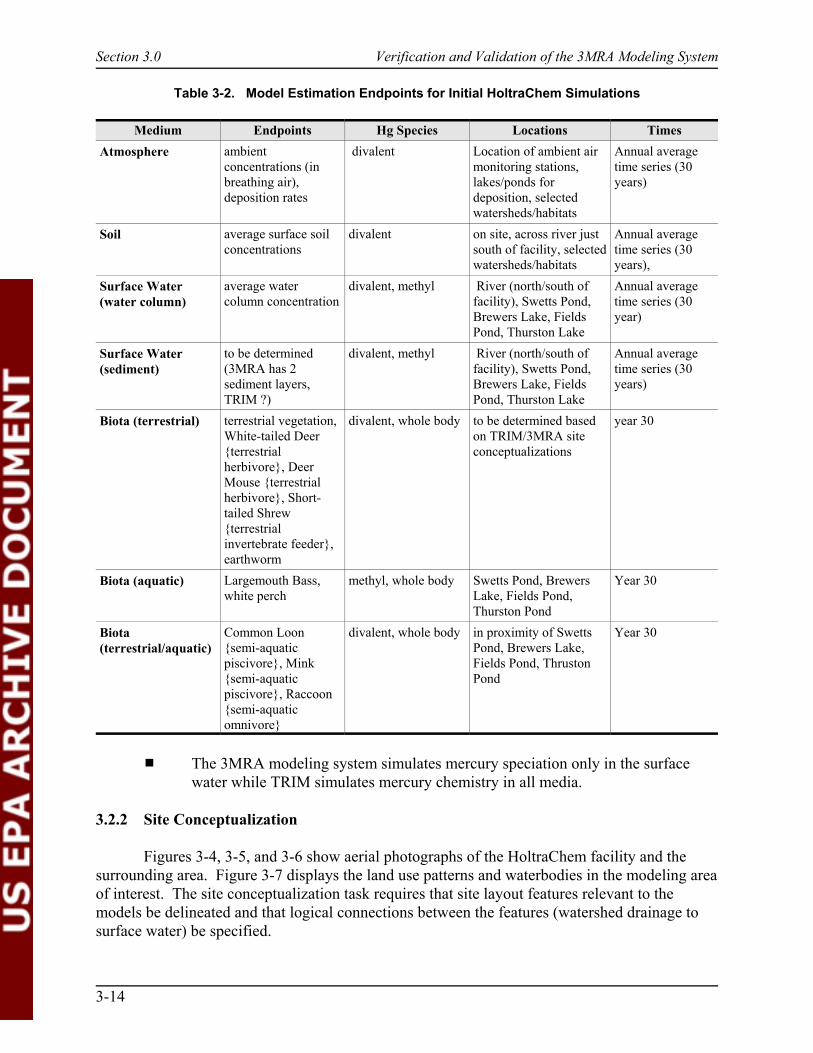
For these reasons, the initial model simulations for comparison focus only on the fugitiveemission of divalent mercury over the thirty year period of facility operations (3MRA simulatesdivalent mercury, while the surface water module of 3MRA does speciate mercury. Themonitoring data is for total mercury). The criteria for selecting specific endpoints, locations, andtimes are designed to ensure that each media is included, as well as a representative cross sectionof terrestrial and aquatic species as a function of both food source and trophic level. Locationsare a function of both model site conceptualizations (e.g., habitat delineation) and locationswhere monitoring data have been collected. Table 3-2 lists the endpoints for the initial modelruns.
Section 3.0 Verification and Validation of the 3MRA Modeling System
3-14
Table 3-2. Model Estimation Endpoints for Initial HoltraChem Simulations
Medium Endpoints Hg Species Locations TimesAtmosphere ambient
concentrations (inbreathing air),deposition rates
divalent Location of ambient airmonitoring stations,lakes/ponds fordeposition, selectedwatersheds/habitats
Annual averagetime series (30years)
Soil average surface soilconcentrations
divalent on site, across river justsouth of facility, selectedwatersheds/habitats
Annual averagetime series (30years),
Surface Water(water column)
average watercolumn concentration
divalent, methyl River (north/south offacility), Swetts Pond,Brewers Lake, FieldsPond, Thurston Lake
Annual averagetime series (30year)
Surface Water(sediment)
to be determined(3MRA has 2sediment layers,TRIM ?)
divalent, methyl River (north/south offacility), Swetts Pond,Brewers Lake, FieldsPond, Thurston Lake
Annual averagetime series (30years)
Biota (terrestrial) terrestrial vegetation,White-tailed Deer{terrestrialherbivore}, DeerMouse {terrestrialherbivore}, Short-tailed Shrew{terrestrialinvertebrate feeder},earthworm
divalent, whole body to be determined basedon TRIM/3MRA siteconceptualizations
year 30
Biota (aquatic) Largemouth Bass,white perch
methyl, whole body Swetts Pond, BrewersLake, Fields Pond,Thurston Pond
Year 30
Biota(terrestrial/aquatic)
Common Loon{semi-aquaticpiscivore}, Mink{semi-aquaticpiscivore}, Raccoon{semi-aquaticomnivore}
divalent, whole body in proximity of SwettsPond, Brewers Lake,Fields Pond, ThrustonPond
Year 30
# The 3MRA modeling system simulates mercury speciation only in the surfacewater while TRIM simulates mercury chemistry in all media.
3.2.2 Site Conceptualization
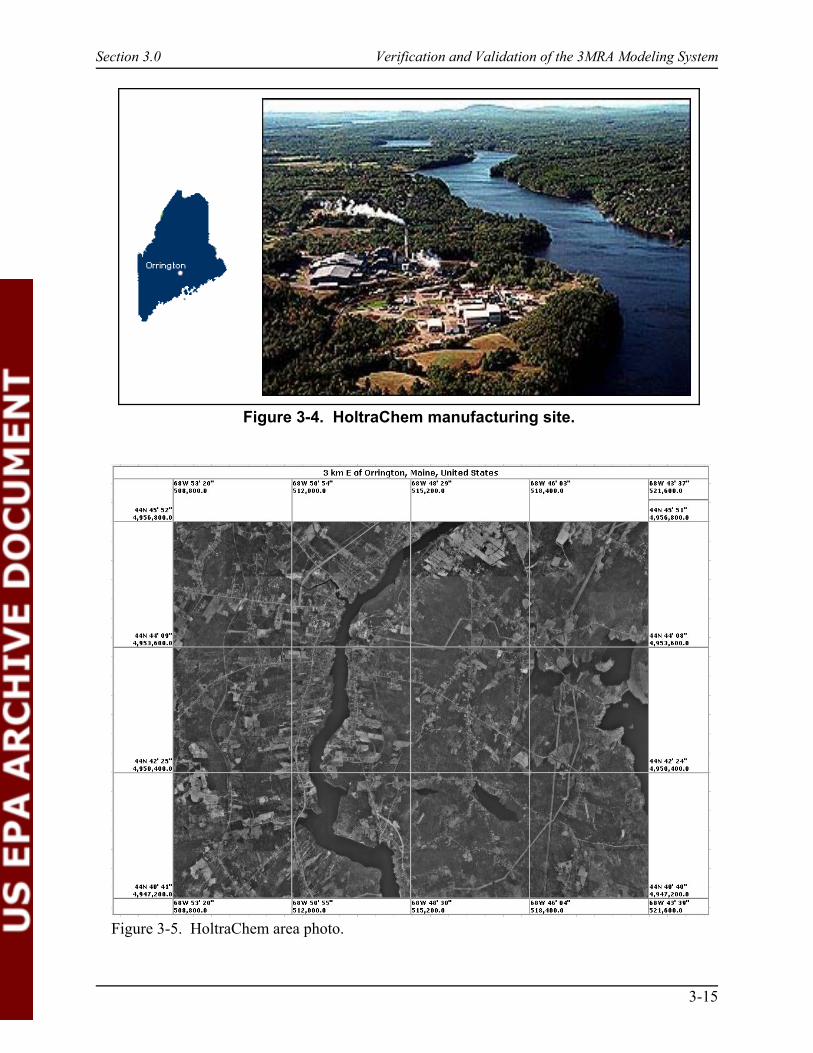
Figures 3-4, 3-5, and 3-6 show aerial photographs of the HoltraChem facility and thesurrounding area. Figure 3-7 displays the land use patterns and waterbodies in the modeling areaof interest. The site conceptualization task requires that site layout features relevant to themodels be delineated and that logical connections between the features (watershed drainage tosurface water) be specified.
Section 3.0 Verification and Validation of the 3MRA Modeling System
3-15
Figure 3-4. HoltraChem manufacturing site.
Figure 3-5. HoltraChem area photo.

Section 3.0 Verification and Validation of the 3MRA Modeling System
3-16
Figure 3-6. Aerial view of HoltraChem facility.
Figure 3-7. Land use and surface water around HoltraChem facility.
Section 3.0 Verification and Validation of the 3MRA Modeling System
3-17
The number and extent associated with each of the site features depends on the initialproblem statement, which specifies endpoints of concern. In the case of the HoltraChem sitethere is interest in the potential transport of mercury to lakes southeast of the site (Brewers Lake,Thruston Lake, Fields Pond) because these lakes lie in the primary downwind direction from thefacility. The interest in potential mercury impacts in these lakes defined the aerial extent for themodeling for each model. Within the area of interest, each model simulates contaminant fate andtransport in all media, including watershed soils; streams, rivers, ponds, and lakes; airsheds;unsaturated zone; aquifer; and biota associated with the terrestrial and aquatic foodwebs. Thedelineation of aerial extent and depth associated with each of these features is conceptualizeddifferently between the two models.
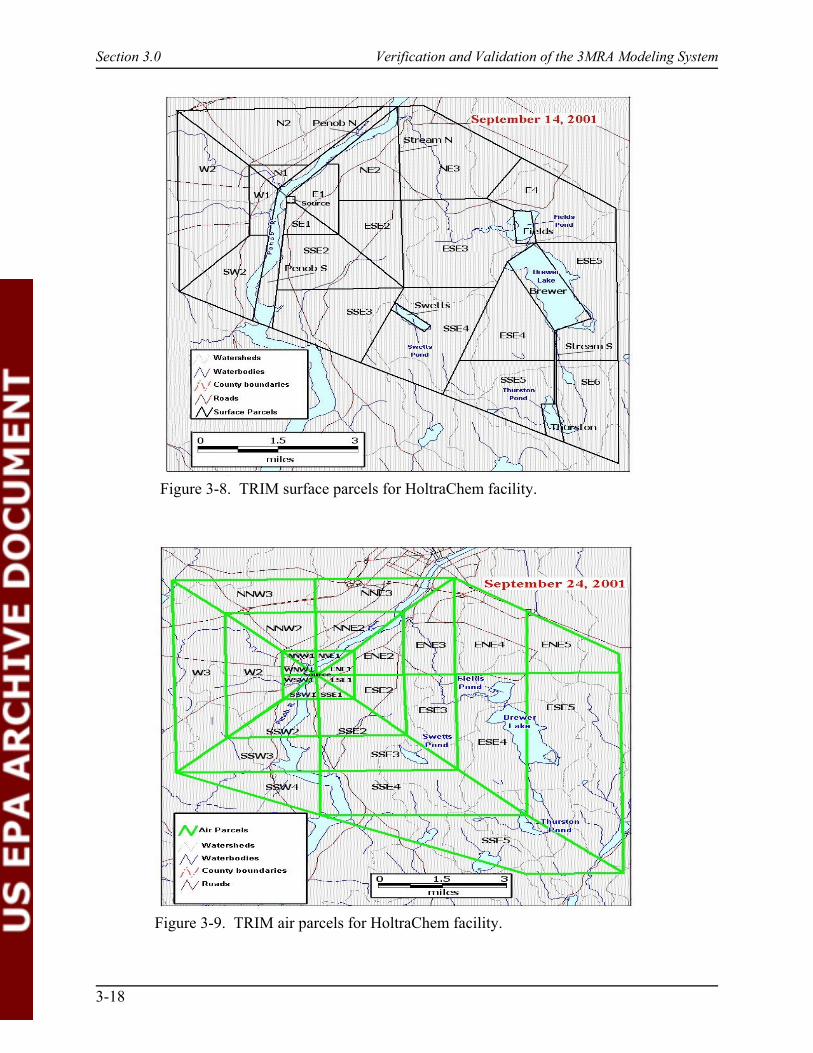
TRIM conceptualizes a site as a set of surface parcels and air parcels. The parcels are 2-dimensional areas of assumed homogeneous environmental conditions. The air parcels areplaced such that they conform first to a need to estimate ambient air concentrations anddepositions as a function of radial distance from the source and, secondly, to the degree possible,so they align with the surface parcels. The surface parcels are placed considering together thecombination of watersheds, habitats, surface water segments, vadose zone, and ground wateraquifer. When depth is assigned to each of the parcels, the result is a volume element thatrepresents the unit of analysis for the TRIM model. Figures 3-8 and 3-9 illustrate the surface andair parcels that define the basis of the site conceptualization for the HoltraChem surroundingarea.
The 3MRA modeling system conceptualizes a site by delineating the actual 2-dimensional area associated with each unit of the physical features. Site conceptualization isachieved by delineating areas directly from GIS-based maps of the site. For the HoltraChemsite, the site features considered in 3MRA modeling system runs include several watersheds, asurface water network, a single airshed, and several ecological habitats. The unsaturated zonebelow the root zone and the ground water aquifer were not modeled.
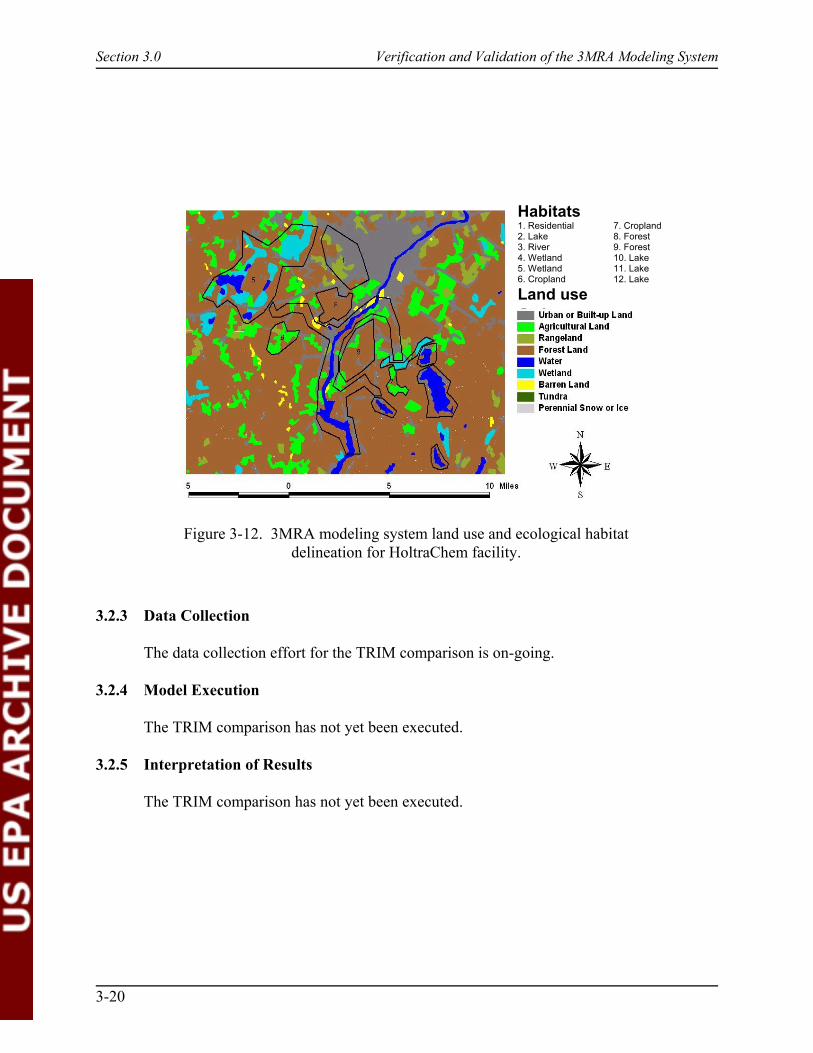
Figure 3-10 illustrates the surface water network that is modeled by the 3MRA modelingsystem for the HoltraChem site. The surface water network consists of the Penobscot River,tributaries in the vicinity of the HoltraChem facility, wetlands, and lakes. For modelingpurposes, the network was configured as a interconnected series of fourteen reaches. Directlyconnected to specific surface water network reaches are individual watershed subbasins. Watershed subbasins that drain to the segment of the Penobscot river lying between the extentsof the tributaries containing the lakes of interest are included. Figure 3-11 illustrates theeighteen watershed subbasins included in the 3MRA modeling system runs for the HoltraChemsite. Figure 3-12 illustrates the ecological habitats that are delineated principally as a function ofland use. Twelve habitat areas are defined, including two cropland habitats, two forest habitats,four lake habitats, one residential habitat, two wetland habitats, and one river habitat. Within the3MRA modeling system, each habitat type includes a list of species that are both of interest andnative to the area of the country being modeled. Each species within a habitat is assigned ahome range, specifying the sub-area extent occupied by the species.4
Section 3.0 Verification and Validation of the 3MRA Modeling System
3-18
Figure 3-8. TRIM surface parcels for HoltraChem facility.
Figure 3-9. TRIM air parcels for HoltraChem facility.

Section 3.0 Verification and Validation of the 3MRA Modeling System
3-19
Figure 3-11. 3MRA modeling system watershed subbasin delineation forHoltraChem facility.
Figure 3-10. 3MRA modeling system surface water reach network for HoltraChem facility.
Section 3.0 Verification and Validation of the 3MRA Modeling System
3-20
Figure 3-12. 3MRA modeling system land use and ecological habitatdelineation for HoltraChem facility.
3.2.3 Data Collection
The data collection effort for the TRIM comparison is on-going.
3.2.4 Model Execution
The TRIM comparison has not yet been executed.
3.2.5 Interpretation of Results
The TRIM comparison has not yet been executed.
Habitats1. Residential 7. Cropland2. Lake 8. Forest3. River 9. Forest4. Wetland 10. Lake5. Wetland 11. Lake6. Cropland 12. Lake
Land use