section 4 worldwide asic market
TRANSCRIPT

INTRODUCTION
The use of ASIC devices has increased as their functionality has improved. Greater sophisticationof ASIC products has made their use more widespread throughout the world. The worldwideASIC market shows promise of continued expansion in terms of dollars and design starts in 1996and through the year 2001.
In recent years, ASIC devices have made their way into numerous low-voltage applicationsincluding notebook and laptop PCs, cellular phones, and pagers. Design and manufacturingimprovements have advanced to the point where an ASIC can be quickly developed and imple-mented into a new system so that it can be delivered quickly to market. Other factors such as anincrease in successful first-time design rates, better design tools, and improved test capabilitieshave all contributed to the overall development and progress of the ASIC market.
As the semiconductor market matures, the "system on a chip" concept will become more of a real-ity. Shrinking silicon die sizes, increasing functionality, and economic necessity will pave the wayfor ASICs to be a key element of this concept.
THE LOGIC MARKET
An analysis of the logic market provides a good background to the study of the ASIC market sincea vast majority of ASIC products perform some basic logic function within a system. Figure 4-1shows the logic trends by technology. The most obvious trend shown on the graph is the tremen-dous growth of CMOS logic. In the time span shown, CMOS technology has grown from a minor-ity process to the dominant process used in making logic devices.
On the other hand, older technologies such as NMOS and bipolar are quickly being phased out.Also, ECL technology, after maintaining about eight percent of the logic marketshare for severalyears, is forecast to be account for a very small percentage of the logic market by the year 2001.
INTEGRATED CIRCUIT ENGINEERING CORPORATION 4-1
4 WORLDWIDE ASIC MARKET

Many of the excellent performance characteristics of ECL and other older technologies have beenreplicated in CMOS and BiCMOS technologies in recent years. These two technologies will dom-inate not only the logic market, but all digital IC production in the foreseeable future.
Displayed in Figure 4-2 is the average selling price (ASP) for logic devices during the past sever-al years. The percent change in ASPs from year to year is shown in Figure 4-3. The TTL SSI/MSIsegment of logic devices has remained essentially flat since the late-1980’s. Meanwhile, MOS logicASPs swelled in the mid-1980’s, stayed flat for several years, then took off again beginning in 1994due to increased sophistication and greater implementation of logic products in systems. ASPs forthe total logic market mirrored the MOS logic segment.
PROS AND CONS OF ASICs
Figure 4-4 shows several advantages and disadvantages of using ASIC devices in a system.Designers must weigh several options. Costs, delivery time, functionality, quality, and overallcustomer satisfaction are but a few of the inputs that must be weighed carefully in selectingwhether to incorporate an ASIC device in the host system.
Worldwide ASIC Market
INTEGRATED CIRCUIT ENGINEERING CORPORATION4-2
0
10
20
30
40
50
60
70
80
90
100
2001 $56.6B
1995 $24.3B
1996 $25.4B
1987 $11.6B
1982 $3.3B
Per
cen
t o
f T
ota
l Lo
gic
Mar
ket
*Includes 1% for GaAs
51%
8%
18%
23%
27%
8%
10%
55%
8% 5%
3% 4%<1%
3% 3%
6%1%
1%
86%
88%
<1%
92%
12875P
TTL and Other Bipolar
ECL
NMOSCMOS
BiCMOS
Source: ICE, "ASIC 1997"
Figure 4-1. Logic Market Trends

Worldwide ASIC Market
INTEGRATED CIRCUIT ENGINEERING CORPORATION 4-3
0
0.20
0.40
0.60
0.80
1.00
1.20
1.40
1.60
1.80
2.00
1996 (FCST)
1995199419931992199119901989198819871986198519841983
TTL SSI/MSI
MOS Logic
Total Logic
AS
P (
$)
20197B
Year
Source: WSTS/ICE, "ASIC 1997
Figure 4-2. Average Selling Price for Logic Devices
Figure 4-3. ASP Percent Change
–20
–10
0
10
20
30
40
50
1996 (FCST)
199519941993199219911990198919881987198619851984
Year
Per
cen
t C
han
ge
20196ASource: WSTS/ICE, "ASIC 1997"
TTL SSI/MSI
MOS Logic
Total Logic

ASIC MARKET FORECAST
ICE segments the ASIC market into three areas—semicustom (MOS and bipolar gate arrays andlinear arrays), custom (MOS and bipolar cell-based and full custom devices), and programmablelogic devices (including FPGAs). A detailed look at the five-year history of these segments is pro-vided in Figure 4-5.
The ASIC marketshare of the semicustom, custom, and PLD segments remained about the samethrough the first half of the decade. However, within each of these segments, different productsgained or lost marketshare. For instance, within the total custom segment, standard cell and fullcustom devices swapped marketshare position. And, within the total PLD segment, bipolar PLDslost considerable marketshare to complex PLDs.
Figure 4-6 extends the ASIC market review through the year 2001. ICE believes that in 1996, theASIC market will grow 20 percent. The catalyst for ASIC growth will be strong PLD and MOSstandard cell sales. With few exceptions, growth in most product areas appears promisingthrough the year 2001. However, the mainstream IC market has moved away from bipolar-basedICs toward MOS-based technology. As a result, bipolar gate arrays, standard cells, and PLDs areforecast to be the poorest performing of all ASIC segments.
Even with the forecast calling for sustained growth, the ASIC market will decline to represent 14percent of the worldwide IC market in the year 2001, as displayed in Figure 4-7. Fast growth inother IC segments such as DRAMs and microprocessors will outpace growth in the ASIC marketin the long run. Therefore, even as the ASIC market increases, its percentage of the overall IC mar-ket will slightly lessen.
Worldwide ASIC Market
INTEGRATED CIRCUIT ENGINEERING CORPORATION4-4
Lower final system costs
Product security
Unique features
Lower number of components (Increased system reliability and decreased system size)
High integration can lower power
consumption and increase performance
12879C
Higher initial costs of development*
Length of time needed for development and circuit
approval*
Difficult to fine tune system in latter development stages
Source: ICE, "ASIC 1997"
*Compared to standard products
ADVANTAGES
DISADVANTAGES
Figure 4-4. Major Advantages and Disadvantages of ASICs

Worldwide ASIC Market
INTEGRATED CIRCUIT ENGINEERING CORPORATION 4-5
MOS Gate Arrays
Bipolar Gate Arrays
Total Gate Arrays
Linear Arrays
Total Semicustom
MOS Standard Cell
Bipolar Standard Cell
Total Standard Cell
Full Custom
Total Custom
Bipolar PLDs
Simple MOS PLDs
Complex MOS PLDs
FPGAs
Total MOS PLDs
Total PLDs
Total ASIC
WW IC Market
ASIC % of WW IC Mkt
2,845
1,000
3,845
165
4,010
2,065
55
2,120
2,625
4,745
335
310
90
170
570
905
9,660�
46,315�
21%
2%
–10%
–1%
12%
0%
10%
18%
11%
1%
5%
–16%
0%
44%
32%
17%
4%
3%�
12%
2,915
905
3,820
185
4,005
2,280
65
2,345
2,650
4,995
280
310
130
225
665
945
9,945�
51,875�
19%
22%
–13%
14%
11%
14%
20%
15%
20%
2%
11%
–18%
27%
69%
53%
44%
26%
13%�
31%
3,555
790
4,345
205
4,550
2,745
75
2,820
2,700
5,520
230
395
220
345
960
1,190
11,260�
67,950�
17%
26%
–20%
18%
7%
17%
31%
20%
30%
1%
16%
–33%
–9%
36%
33%
17%
7%
16%�
33%
4,480�
635�
5,115�
220�
5,335�
3,585�
90�
3,675�
2,725�
6,400�
155�
360�
300�
460�
1,120�
1,275�
13,010�
90,295�
14%
23%�
2%�
20%�
7%�
20%�
36%�
–6%�
35%�
1%�
20%�
–26%�
7%�
83%�
55%�
47%�
38%�
22%�
43%
5,510�
650�
6,160�
235�
6,395�
4,860�
85�
4,945�
2,750�
7,695�
115�
385�
550�
715�
1,650�
1,765�
15,855�
128,680�
12%
18%�
–10%�
13%�
9%�
12%�
24%�
11%�
24%�
1%�
13%�
–23%�
6%�
57%�
43%�
30%�
18%�
13%�
29%
Segment
1991 ($M)
1992/1991 Percent Change
1992 ($M)
1993/1992 Percent Change
1993 ($M)
1994/1993 Percent Change
1994 ($M)
1995/1994 Percent Change
1995 ($M)
1991-1995 CAGR (%)
20198BSource: ICE, "ASIC 1997"
Figure 4-5. 1991-1995 ASIC Market
MOS Gate Arrays
Bipolar Gate Arrays
Total Gate Arrays
Linear Arrays
Total Semicustom
MOS Standard Cell
Bipolar Standard Cell
Total Standard Cell
Full Custom
Total Custom
Bipolar PLDs
Simple MOS PLDs
Complex MOS PLDs
FPGAs
Total MOS PLDs
Total PLDs
Total ASIC
WW IC Market
ASIC % of WW IC Mkt
Segment
16%�
–23%�
13%�
2%�
13%�
20%�
–6%�
20%�
2%�
14%�
–29%�
–3%�
26%�
24%�
20%�
18%�
14%�
13%
1997/1996 Percent Change
1997 ($M)
7,600�
385�
7,985�
245�
8,230�
7,350�
75�
7,425�
2,850�
10,275�
50�
370�
925�
1,155�
2,450�
2,500�
21,005�
138,806�
15%
1998/1997 Percent Change
15%�
–22%�
13%�
4%�
13%�
22%�
–7%�
22%�
2%�
16%�
–20%�
–5%�
29%�
26%�
22%�
22%�
16%�
17%
1998 ($M)
8,750�
300�
9,050�
255�
9,305�
9,000�
70�
9,070�
2,900�
11,970�
40�
350�
1,190�
1,460�
3,000�
3,040�
24,315�
162,052�
15%
1999/1998 Percent Change
17%�
–22%�
16%�
4%�
16%�
23%�
–7%�
23%�
2%�
18%�
–20%�
–6%�
30%�
28%�
25%�
24%�
18%�
18%
1999 ($M)
10,250�
235�
10,485�
265�
10,750�
11,050�
65�
11,115�
2,950�
14,065�
32�
330�
1,550�
1,870�
3,750�
3,782�
28,597�
191,675�
15%
2000/1999 Percent Change
18%�
–21%�
17%�
4%�
17%�
25%�
–8%�
25%�
2%�
20%�
–19%�
–8%�
31%�
29%�
27%�
27%�
20%�
21%
2000 ($M)
12,100�
185�
12,285�
275�
12,560�
13,800�
60�
13,860�
3,000�
16,860�
26�
305�
2,035�
2,420�
4,760�
4,786�
34,206�
232,043�
15%
2001/2000 Percent Change
19%�
–22%�
18%�
4%�
18%�
27%�
–8%�
26%�
2%�
22%�
–23%�
–8%�
32%�
30%�
28%�
28%�
21%�
26%
2001 ($M)
14,400�
145�
14,545�
285�
14,830�
17,475�
55�
17,530�
3,075�
20,605�
20�
280�
2,680�
3,140�
6,100�
6,120�
41,555�
292,876�
14%
1991-2001 CAGR (%)
18%�
–18%�
14%�
6%�
14%�
24%�
0%�
24%�
2%�
16%�
–25%�
–1%�
40%�
34%�
27%�
21%�
16%
20%
1996-2001 CAGR (%)
17%�
–22%�
16%�
3%�
15%�
23%�
–7%�
23%�
2%�
18%�
–22%�
–6%�
30%�
27%�
24%�
24%�
18%
19%
20199BSource: ICE, "ASIC 1997"
6,550�
500�
7,050�
240�
7,290�
6,100�
80�
6,180�
2,800�
8,980�
70�
380�
735�
935�
2,050�
2,120�
18,390�
122,408�
15%
1996 ($M)
19%�
–23%�
14%�
2%�
14%�
26%�
–6%�
25%�
2%�
17%�
–39%�
–1%�
34%�
31%�
24%�
20%�
16%�
–5%
1996/1995 Percent Change
Figure 4-6. 1996-2001 ASIC Market Forecast

Projected growth of each major ASIC market during the 1996-2001 period is shown in Figure 4-8.A closer look at the cumulative annual growth rates of specific segments is displayed in Figure 4-9. Here, the "hot" markets such as complex PLDs, FPGAs, MOS standard cells, and MOS gatearrays are exposed. At the same time, the demise of bipolar ASICs is evident as well.
Worldwide ASIC Market
INTEGRATED CIRCUIT ENGINEERING CORPORATION4-6
WW IC Market ($M)
ASIC % of WW IC Market
WW IC Market ($M)
ASIC % of WW IC Market
WW
IC M
arke
t ($
M)
AS
IC %
of W
W IC
Mar
ket
46,315�
21%
51,875�
19%
67,950�
17%
90,295�
14%
128,680�
12%
122,408�
15%
138,806�
15%
162,052�
15%
232,043�
15%
292,876�
14%
191,675�
15%
45,000
70,000
95,000
120,000
145,000
170,000
195,000
220,000
245,000
270,000
295,000
200120001999199819971996199519941993199219910
10
20
30
40
50
60
70
80
90
100
Year
Source: ICE, "ASIC 1997" 21035
Figure 4-7. ASIC Share of Worldwide Market
21036Source: ICE, "ASIC 1997"
Total Semicustom
Total Custom
Total PLDs
Total ASIC
7,290�
8,980�
2,120�
18,390
14,830�
20,605�
6,120�
41,555
2x�
2.3x�
2.9x�
2.3x
1996�($M)
2001�($M)
Market Growth
Figure 4-8. ASIC Growth Projections

The total ASIC market is forecast to grow at a healthy 18 percent CAGR through the end of thedecade, with four categories equaling or bettering that performance and six categories not grow-ing at the same rate as the overall ASIC market.
Shown in Figure 4-10 is the evolving ASIC product marketshare. In 1986, full custom productsaccounted for more than half of ASIC marketshare. Now, though this segment is growing ever soslightly in terms of dollars, it is losing marketshare to devices such as standard cells. Full customASICs are forecast to represent only seven percent of total ASIC product marketshare in the year2001. Supercomputer manufacturers and the military are the best examples of full custom users.Since overall military spending is down and with supercomputer power available in desktop sys-tems, it stands to reason that there will be less demand for full custom devices. Meanwhile, stan-dard cell devices, which are forecast to hold 34 percent ASIC marketshare in 1996, are forecast toaccount for 42 percent in the year 2001.
Figure 4-11 forecasts the market for several logic technologies. By the size of the various marketsshown in the graphs, it is evident that most designers (and users) have made the switch to MOStechnologies to achieve the desired performance from their ASIC devices. Of the non-MOS seg-ments, only TTL/Other Logic still shows some signs of life. This mainstream technology of a fewyears ago was used in numerous applications and remains a rather large market even in 1996. Dueto its shear size and relatively widespread use, this market segment will be the slowest to decline.
Quarterly market size for the MOS gate array, MOS standard cell, MOS PLD, and bipolar PLD seg-ments are displayed in the next several charts. In Figure 4-12, the MOS gate array market is shownas a gradually upward sloping curve. Recent history shows this market performing best in thesecond half of the year.
Worldwide ASIC Market
INTEGRATED CIRCUIT ENGINEERING CORPORATION 4-7
Product1991-2001 CAGR (%)
1991-1995 CAGR (%)
1996-2001 CAGR (%)
Complex PLDs
FPGAs
MOS Standard Cell
MOS Gate Arrays
Total ASIC
Bipolar Standard Cell
Linear Arrays
Full Custom
Simple PLDs
Bipolar PLDs
Bipolar Gate Arrays
40�
34�
24�
18�
16�
0�
6�
2�
–1�
–25�
–18
57�
43�
24�
18�
13�
11�
9�
1�
6�
–23�
–10
30�
27�
23�
17�
18�
7�
3�
2�
–6�
–22�
–22
20195BSource: ICE, "ASIC 1997"
Figure 4-9. ASIC Product CAGRs

The MOS standard cell market is shown on a quarterly basis in Figure 4-13. While the market forMOS standard cells dipped in 1Q95, overall it has been characterized by solid growth during thepast few years. Besides being in used in a broad range of applications, the sizable market increasefor standard cells might be explained in the fact that in recent years, many companies have reclass-ified their full custom devices as standard cell products.
Figure 4-14 portrays the rise in quarterly MOS PLD sales dating back to 1989. Flexibility and quicktime-to-market—two key issues for systems designers—have helped propel the MOS PLD market.
Meanwhile, the trend for bipolar PLDs is shown in Figure 4-15. Since 2Q90, the bipolar PLD mar-ket has dropped steeply. This market shows a tendency to rebound slightly in the first or secondquarter of each year compared to the previous fourth quarter, but overall, the trend is still down.
ICE’s forecast of ASIC design activity for 1996 and 2001 is shown in Figure 4-16. Clearly, the designstart trend over the next five years is away from bipolar digital arrays and cells and full customproducts. However, even gate array designs are forecast to drop 15 percent through 2001. Standardcell designs will be the most prolific of all ASIC segments through the turn of the century.Compared to 1996, new standard cell designs are forecast to increase 28 percent by the year 2001.Overall, ASIC design starts are forecast to decrease three percent from the 1996 to 2001 time period.
Worldwide ASIC Market
INTEGRATED CIRCUIT ENGINEERING CORPORATION4-8
Gate and Linear Arrays
30%
Standard Cell 11%
Full Custom 52%
PLDs 7%
Gate and Linear Arrays
40%
Standard Cell 34%
Full Custom 15%
PLDs* 11%
Gate and Linear Arrays
36%
Standard Cell 42%
Full Custom 7%
PLDs* 15%
1986 $4.7B
1996 $18.4B
2001 $41.6B
16278K
*FPGAs 5% in 1996, 8% in 2001.Source: ICE, "ASIC 1997"
Figure 4-10. ASIC Product Marketshare Trends

Worldwide ASIC Market
INTEGRATED CIRCUIT ENGINEERING CORPORATION 4-9
0
500
1,000
1,500
2,000
199619951994199319921991
YearTTL/Other Standard Logic Market
Mill
ion
s o
f D
olla
rs
0
200
400
600
800
1,000
199619951994199319921991
1,000
905
YearBipolar Gate Array Market
Mill
ion
s o
f D
olla
rs
0
100
200
300
400
199619951994199319921991
335
280
230
155
115
–16%
–18%
–26%70
–39%
–33%
YearBipolar PLD Market
Mill
ion
s o
f D
olla
rs
0
1,000
2,000
3,000
4,000
5,000
6,000
7,000
199619951994199319921991
2,065 2,2802,745
3,585
4,860
6,100
10%20%
26%
31%
36%
YearMOS* Standard Cell Market
Mill
ion
s o
f D
olla
rs
0
1,000
2,000
3,000
4,000
5,000
6,000
7,000
199619951994199319921991
2,845 2,9153,555
4,480
5,510
6,550
2% 22%
26%
23%
19%
YearMOS* Gate Array Market
Mill
ion
s o
f D
olla
rs
0
20
40
60
80
100
199619951994199319921991
55
65
7585
80
90
18%
15%
20%–6%
–6%
YearBipolar Standard Cell Market
Mill
ion
s o
f D
olla
rs
18928ESource: ICE, "ASIC 1997"
*Includes BiCMOS and GaAs
1,505 1,455
1,7301,630 1,575
–3% 19%–6% –3%
1,260–20%
(FCST) (FCST)
(FCST)(FCST)
(FCST) (FCST)
790
635 650
–10%
–13%
–20% 2%500
–23%
Figure 4-11. Selected 1991-1996 Logic Markets

Worldwide ASIC Market
INTEGRATED CIRCUIT ENGINEERING CORPORATION4-10
19961990 1991 1992
Do
llars
(M
illio
ns)
Year17778KSource: WSTS/ICE, "ASIC 1997"
1993
1994
1995
500
600
700
800
900
1,000
1,100
1,200
1,300
1,400
1,500
1,600
4Q3Q2Q1Q4Q3Q2Q1Q4Q3Q2Q1Q4Q3Q2Q1Q4Q3Q2Q1Q4Q3Q2Q1Q4Q3Q2Q1Q(FCST)
Figure 4-12. Quarterly MOS Gate Array Market (1990-1996)
Figure 4-13. Quarterly MOS Standard Cell Market (1992-1996)
250
350
450
550
650
750
850
950
1,050
1,150
1,250
4Q3Q2Q1Q4Q3Q2Q1Q4Q3Q2Q1Q4Q3Q2Q1Q4Q3Q2Q1Q
1992 1993 1994 1995 1996
YearSource: WSTS/ICE, "ASIC 1997" 18930F
Do
llars
(M
illio
ns)
(FCST)

Worldwide ASIC Market
INTEGRATED CIRCUIT ENGINEERING CORPORATION 4-11
0
50
100
150
200
250
300
350
400
450
500
550
4Q3Q2Q1Q4Q3Q2Q1Q4Q3Q2Q1Q4Q3Q2Q1Q4Q3Q2Q1Q4Q3Q2Q1Q4Q3Q2Q1Q
1994 1995 19961993199219911990
Source: WSTS/ICE, "ASIC 1997" 18929F
Do
llars
(M
illio
ns)
Year
(FCST)
Figure 4-14. Quarterly MOS PLD Market (1990-1996)
Figure 4-15. Quarterly Bipolar PLD Market (1990-1996)
1990 1991 1992 1993Year
17777L
Do
llars
(M
illio
ns)
Source: WSTS/ICE, "ASIC 1997"
1994 1995 1996
10
20
30
40
50
60
70
80
90
100
110
120
130
4Q3Q2Q1Q4Q3Q2Q1Q4Q3Q2Q1Q4Q3Q2Q1Q4Q3Q2Q1Q4Q3Q2Q1Q4Q3Q2Q1Q(FCST)

1996 ASIC DESIGN AND UNIT VOLUME ANALYSIS
The complex relationship that exits between NREs, gate densities, ASPs, and designs is portrayedin Figure 4-17. MOS and bipolar digital arrays are covered, as are the standard cell and full cus-tom segments. In all cases, the figures used are calculated based on the number of usable gates.
1996 Gate Array Estimate
The total gate array market has been divided into MOS and bipolar categories. In the MOS digi-tal array section, extremely high-density (≥ 1 million gates) gate arrays from IBM, LSI Logic,Mitsubishi, (and several others in the three-quarter million gate range) grabbed many headlines.Despite the headlines, many more applications implemented gate arrays with substantially fewerusable gates. ICE forecasts the average number of usable gates per design to be 25,000 gates in1996. With device sales of $6.2 billion and an average selling price of $10, approximately 615 mil-lion gate array units are forecast to be sold in 1996.
Design starts for MOS arrays were 55 percent more than standard cell devices and more thanseven times greater than bipolar arrays and cells combined. The fact that MOS array designs farexceeded bipolar designs shows that customers are solidly committed to products based on MOS
Worldwide ASIC Market
INTEGRATED CIRCUIT ENGINEERING CORPORATION4-12
������������������������������
������������������������������������������������������������������������������������������
��
���
���
���
���
���
���
���
���
���
���
���
���
���
���
���
���
���
���
���
���
���
���
���
���
���
���
���
������������������������������������������������
���
���
���
���
���
���
���
���
���
���
���
���
���
���
���
���
���
���
���
���
���
���
���
���
���
���
���
���
Full Custom 800 4%
Full Custom 775 4%
20,975 1996
20,250 2001
17779D
Bipolar Digital Arrays
and Cells 1,590 7%
Bipolar Digital Arrays
and Cells 555 3%
Gate Arrays 11,285 54%
Gate Arrays 9,585�47%
Standard Cell 9,335 46%
Standard Cell 7,300 35%
Source: ICE, "ASIC 1997"
Figure 4-16. 1996 Versus 2001 Design Starts

technology. BiCMOS will continue to play a greater role in the gate array market as it gains accep-tance among many systems manufacturers. For 1996, however, BiCMOS design starts are includ-ed in the MOS category.
1996 Standard Cell Estimate
Interest in MOS standard cell devices has quickened since 1990. The MOS standard cell market isforecast to grow 26 percent in 1996 (-6 percent bipolar-based) and is expected to remain strongthrough the end of the decade. ICE estimates that there were an average of 29,000 usable gatesper standard cell device sold. Design starts (7,300 forecast for 1996), though still far less than dig-ital MOS arrays, are accounting for a larger percentage of the total number of ASIC design startseach year.
Quickly adding to the cost of standard cell products are advanced functions such as DSPs andMPUs, and the need to customize each mask layer. As evidenced by the average NRE, standardcell devices carry a charge that is exceeded only by full custom devices.
1996 Full Custom Estimate
Last among the groups in the ASIC analysis is full custom devices. Because of the extraordinari-ly long design effort and specialized nature of the devices, full custom ASICs naturally have high-er NREs. For this reason, a customer will often pursue the full-custom option when it has a spe-cific requirement in large volumes. In this way, it can justify and better amortize the substantialNRE charges.
Worldwide ASIC Market
INTEGRATED CIRCUIT ENGINEERING CORPORATION 4-13
Figure 4-17. 1996 ASIC Design and Unit Volume Analysis
29K Gates
$2,800M
– $140M
$2,660M
÷ $14.00
200M
(6%) (94%) 29K Gates (0.04¢/Gate)
$6,100M
– $365M
$5,735M
÷ $11.50
500M
1.3K Gates
$395M
÷ $35K
11,285
25K Usable Gates
NRE REVENUE ÷ AVERAGE NRE DESIGNS STARTED
$6,550M
– $395M
$6,155M
÷ $10.00
615M
(6%) (94%) 25K Usable Gates (0.04¢/Gate)
TOTAL MARKET – NRE CHARGES DEVICE SALES ÷ ASP UNITS SHIPPED
$580M
– $35M
$545M
÷ $20
27M
(6%) (94%) 1.3K Gates (1.9¢/Gate)
$35M
÷ $22K
1,590
(5%) (95%) ASP
FULL CUSTOM
$365M
÷ $50K
7,300
$140M
÷ $175K
800
MOS STANDARD CELL
BIPOLAR DIGITAL ARRAYS AND CELLS
MOS DIGITAL ARRAYS
CATEGORY
12882H
Note: MOS arrays and standard cell figures include BiCMOS and GaAs devices.
Source: ICE, "ASIC 1997"

Full custom NRE charges may be high, but due to the (usually) large number of units produced,NRE charges can be rather small when expressed as a percentage of the total sale. Also, the fullcustom device often makes very efficient use of space, which results in a full custom IC ASP thatis less than a gate array or standard cell device of similar density.
A review of design sales, units and ASPs for several ASIC product segments is provided in Figure4-18. The data excludes NRE charges. It is clear that MOS ASIC devices will ship the largest num-ber of units in 1996. Also, it is interesting to note that bipolar gate array/standard cell deviceshave the highest ASPs. Specialty requirements of military/aerospace applications in the U.S. andmainframe/supercomputer applications in Japan account for the high ASPs of these devices.
2001 ASIC DESIGN AND UNIT VOLUME ANALYSIS
Figure 4-19 displays the ASIC design and unit volume analysis for the year 2001. The chart is for-matted to provide an easy comparison between 1996 and the year 2001.
2001 Gate Array Forecast
The MOS digital array forecast for the year 2001 shows the total market increasing to $14.4 billion,device sales growing to $13.8 billion, a 50 percent increase in unit shipments, and design starts thatwill taper off by 15 percent. Total NRE revenue is forecast to increase to $575 million while the priceper gate is expected to decline to 0.03¢. ASPs for MOS digital arrays are forecast to be $15 in theyear 2001, and the average gate count per device is forecast to more than double to 60,000 gates.
In 2001, the bipolar digital array market is forecast to be less than half its 1996 size. Total NRE revenueis forecast to drop to $10 million, while the price per gate declines to 1.4¢. ICE anticipates bipolar arrayand cell unit shipments to be 11 million in 2001, less than half the number of units shipped in 1996.
Worldwide ASIC Market
INTEGRATED CIRCUIT ENGINEERING CORPORATION4-14
MOS Gate Array
MOS Standard Cell
MOS PLD
Bipolar Gate Array/Standard Cell
Bipolar PLD
Full Custom
Total**
6,155�
5,735�
2,050�
545�
70�
2,660�
17,215
615�
500�
455�
27�
51�
200�
1,848
10.00�
11.50�
4.50�
20.00�
1.37�
13.30�
9.32
ProductDevice Sales*
($M)Units (M) ASP ($)
*Does not include NREs **Total does not include analog arrays
Source: ICE, "ASIC 1997" 21037
Figure 4-18. 1996 ASIC Market

2001 Standard Cell Forecast
ICE forecasts the standard cell market to more than double its 1996 size by the year 2001. Bigincreases are anticipated in device sales, unit shipments, the number of gates per design, and thenumber of design starts. Like MOS arrays, the ASP for standard cell devices is also expected toincrease (up 49 percent) in the year 2001 compared to the 1996 figure.
2001 Full Custom Forecast
The full custom design and unit volume analysis for the year 2001 shows this market size increas-ing 10 percent compared to its 1996 value. "Off-the-shelf" commercial devices available in an arrayor cell-based format will meet the needs in a greater number of applications, thus requiring fewerfull custom chips.
ASIC VENDOR SALES
Overview
Before listing any ASIC vendor sales, it should be noted that ICE’s ASIC sales estimates do notinclude standard products designed from standard cell libraries or with silicon compilers. Onlygate and linear arrays, full custom, and standard cell devices sold to only one customer, as well asPLDs, are considered ASICs.
Worldwide ASIC Market
INTEGRATED CIRCUIT ENGINEERING CORPORATION 4-15
1.5K Gates
NRE REVENUE ÷ AVERAGE ASIC NRE DESIGNS STARTED
$14,400M
– $575M
$13,825M
÷ $15
920M
(4%) (96%) 60K Gates (0.03¢/Gate)
TOTAL MARKET – NRE CHARGES DEVICE SALES ÷ ASP UNITS SHIPPED
$200M
– $10M
$190M
÷ $17
11M
(5%) (95%) 1.5K Gates (1.4¢/Gate)
$10M
÷ $18K
555
BIPOLAR DIGITAL ARRAYS AND CELLS
MOS DIGITAL ARRAYS*
CATEGORY
Note: MOS arrays include BiCMOS, gate counts are usable gates.
75K Gates
$3,075M
– $155M
$2,920M
÷ $20.00M
146M
(4%) (96%) 75K Gates (0.03¢/Gate)
(5%) (95%)
FULL CUSTOM
$700M
÷ $75K
9,335
$155M
÷ $200K
775
MOS STANDARD CELL*
12884HSource: ICE, "ASIC 1997"
$17,475M
– $700M
$16,775M
÷ $17
985M
ASP
$575M
÷ $60K
9,585
60K Gates
*Including GaAs
Figure 4-19. 2001 ASIC Design and Unit Volume Analysis

Figure 4-20 provides a list of the top 10 ASIC (not including full custom) suppliers for 1995. Withtotal ASIC sales of nearly $1.3 billion, NEC retained its position as the leading supplier of ASICdevices. NEC strengthened all segments of its ASIC sales during 1995. In doing so, it capturedjust about 10 percent of the total ASIC market.
LSI Logic, the number two supplier in 1995, has been the preeminent North American gate arrayvendor for many years. However, it is now a world leader in sales of standard cell devices as well.Fujitsu, formerly the leading ASIC supplier, posted sales of about $1.2 billion.
Lucent and TI were members of the top ten list due to their strong sales of standard cell devices.They are number one and three, respectively, in worldwide sales of standard cell devices. Xilinx,the leading supplier of PLDs, was at the number eight position for total ASIC sales in 1995 whileAltera captured the number 10 spot. Overall, the top ten ASIC suppliers had sales that accountedfor 63 percent of the total ASIC market in 1995.
Gate Array Suppliers
Displayed in Figure 4-21 are the top gate array manufacturers and their sales for 1994 and 1995.The top five companies, who each had 1995 gate array sales of at least $500 million, accounted for59 percent of the total gate array market of $6.2 billion in 1995. The top ten gate array suppliers
Worldwide ASIC Market
INTEGRATED CIRCUIT ENGINEERING CORPORATION4-16
1�
2�
3�
4�
5�
6�
7�
8�
9�
10
NEC
LSI Logic
Fujitsu
Toshiba
TI
Lucent
Hitachi
Xilinx
VLSI Technology
Altera
Top Ten Total
Other Suppliers
Total Market*
Top Ten Marketshare
1,265�
1,181�
1,165�
933�
923�
848�
638�
495�
440�
382�
8,270�
4,835�
13,105�
63%
895�
605�
940�
678�
455�
50�
538�
—�
130�
—�
4,291�
1,869�
6,160�
70%
30�
—
—
—
—
50�
—
—
—
—
80�
155�
235�
34%
340�
576�
225�
243�
430�
670�
100�
—�
310�
—�
2,894�
2,051�
4,945�
59%
—
—
—
12�
38�
78�
—
495�
—
382�
1,005�
760�
1,765�
57%
9.7%�
9.0%�
8.9%�
7.1%�
7.0%�
6.5%�
4.9%�
3.8%�
3.4%�
2.9%�
63.1%�
36.9%�
100.0%�
63%
1995 Rank
Company
*Not including full custom **Includes FPGA Sales
Percent Of Total ASIC
Market*
Gate Array Sales ($M)
Standard Cell Sales
($M)
PLD** Sales ($M)
Linear Array Sales ($M)
20194BSource: ICE, "ASIC 1997"
Total ASIC Sales
($M)
Figure 4-20. 1995 Top Ten ASIC* Leaders

accounted for 79 percent of sales. With the exception of Samsung, each of the top ten suppliershas been a steady player in the gate array business for many years. In 1995, six of the top ten sup-pliers increased their sales faster than the growth of the overall gate array market (20 percent).This represents a big change from 1994 when NEC (with a 12 percent increase) was the only topten company to experienced double-digit gate array growth.
Worldwide ASIC Market
INTEGRATED CIRCUIT ENGINEERING CORPORATION 4-17
1995 Rank
Company1994 Sales ($M) 1995 Sales ($M)
MOS Bipolar Total MOS Bipolar Total
1995/1994 Percent Change
1995 Percent
Marketshare
13636Q
*Phasing out bipolar gate arrays **GaAs
Source: ICE, "ASIC 1997"
1�2�3�4�5�6�7�8�9�
10�11�12�13�14�15�16�17�18�19�20�21�22�23�24�25�26�27�28�29�30�31�32�33�34�35�36
Fujitsu NEC Toshiba LSI Logic Hitachi TI Motorola Mitsubishi IBM Samsung S-MOS/Seiko VLSI Technology GEC Plessey SGS-Thomson Oki AMI Lucent (ex AT&T) Siemens Matsushita National ROHM AMCC Kawasaki Steel Sanyo Sharp Vitesse** Symbios Orbit MHS Atmel Ricoh Sony* Chip Express UTMC LG Semicon IMS Other Total
550�685�525�575�307�335�182�139�
80�90�
136�108�
93�80�70�38�50�
5�44�39�36�12�20�28�30�25�35�12�22�
6�19�15�10�14�10�
9�46�
4,480
800�735�525�575�475�335�267�139�
80�90�
136�108�101�
80�70�38�60�30�44�39�36�40�20�28�30�25�35�12�22�
6�19�20�10�14�10�
9�52�
5,115
18�22�29�
5�13�36�–6�44�
100�72�11�20�20�11�19�63�
–17�60�
2�5�
11�–15�
65�11�— 20�
–23�125�
18�250�
11�— 80�
7�— 11�37�20
15.3�14.5�11.0�
9.8�8.7�7.4�4.1�3.2�2.6�2.5�2.5�2.1�2.0�1.4�1.3�1.0�0.8�0.8�0.7�0.7�0.6�0.6�0.5�0.5�0.5�0.5�0.4�0.4�0.4�0.3�0.3�0.3�0.3�0.2�0.2�0.2�1.2�
100.0
645�830�678�605�375�455�195�200�160�155�151�130�121�
89�83�62�45�18�45�41�40�10�33�31�30�30�27�27�26�21�21�20�18�15�10�10�58�
5,510
295�65�— —
163�— 55�— — — — — — — — — 5�
30�— — — 24�— — — — — — — — — — — — — — 13�
650
940�895�678�605�538�455�250�200�160�155�151�130�121�
89�83�62�50�48�45�41�40�34�33�31�30�30�27�27�26�21�21�20�18�15�10�10�71�
6,160
250�50�— —
168�—�85�— — — — — 8�
— — — 10�25�— — — 28�— — — — — — — — — 5�
— — — — 6�
635
Figure 4-21. Merchant Gate Array Leaders

Gate arrays continue to infiltrate the market for small, electronic systems with advanced func-tions. Speed and low power, two of the most preferred performance characteristics in ICs, areespecially desired in gate arrays. Manufacturers have been quick to respond these needs whileadding density as well. Typically, 0.5-0.8-micron technology is used to manufacture the majorityof gate arrays. However, 0.35-micron technology has been used for several of the million-plusgate arrays that have been built in limited production.
As recently as five years ago, the average gate array density was in the 10,000-gate range. In 1996,ICE believes that 90 percent of all gates arrays will have at least 10,000 gates. More specifically,ICE believes that 45 percent of gate arrays will be shipped with between 20,000 and 50,000 gatesin 1996 (Figure 4-22). By the year 2001, ICE anticipates that MOS gate arrays will have an averageusable gate count of at least 60,000 gates.
Placing large numbers of gates on a gate array has not been an insurmountable hurdle. IBM, LSILogic, and Mitsubishi are a few of the firms that have developed gate arrays with over one mil-lion available gates. At these densities, it becomes increasingly possible to incorporate large-scalecircuitry on a single chip. Circuit density and manufacturing have brought gate arrays to a high-er level of acceptance and integration. The biggest challenges facing designers of these "mega"gate arrays are test and packaging issues.
The gate array market by geographic sector is shown in Figure 4-23. Japan continues to lead asthe largest consuming region of both bipolar and MOS gate arrays. In 1996, ICE estimates Japanwill capture 41 percent of the total gate array market, while the North American region is esti-mated to hold 36 percent in 1996.
Worldwide ASIC Market
INTEGRATED CIRCUIT ENGINEERING CORPORATION4-18
≤10K Gates 10%
10K - 20K Gates 35%
20K - 50K Gates 45%
>50K Gates 10%
1996 $6.2B
Source: ICE, "ASIC 1997"
* Not including NREs
≤10K Gates 25% 10K - 20K
Gates 39%
20K - 50K Gates 33%
>50K Gates 3%
1996 615M Units
18931E
Figure 4-22. 1996 MOS Gate Array Market* and Unit Shipments by Gate Count (Usable)

In the year 2001, ICE expects the Japanese and North American markets to remain the largest forgate array devices. Pacific Rim countries, excluding Japan but including Korea, Taiwan, and oth-ers will garner a increasing percentage of marketshare at the expense of all other worldwideregions.
The trend toward MOS technology (CMOS and BiCMOS) will continue in the gate array market(Figure 4-24). In some cases, designers and manufacturers will take advantage of the low powerconsumption and high speed characteristics of BiCMOS technology in the coming five years.However, CMOS technology continues to be refined to the point where it can sometimes performat a level equal to or exceeding BiCMOS. Therefore, it will continue to expand as the preferredtechnology when building gate arrays.
Worldwide ASIC Market
INTEGRATED CIRCUIT ENGINEERING CORPORATION 4-19
Europe 16%
Japan 41%
North America
36%
ROW 7%
1996
Total Market = $7.1B
Europe 18%
Japan 37%
North America
34%
ROW 11%
2001
Total Market = $14.5B
8881YSource: ICE, "ASIC 1997"
Europe 16%
Japan 40%
North America
37%
ROW 7%
1996
Europe 18%
Japan 37%
North America
34%
ROW 11%
2001
Europe 13%
Japan 55%
North America
26%
ROW 6%
1996
Europe 15%
Japan 62%
North America
20%
ROW 3%
2001
Total MOS Market = $6.6B Total MOS Market = $14.4B
Total Bipolar Market = $500M Total Bipolar Market = $145M
Figure 4-23. Worldwide Digital Gate Array Market by Region
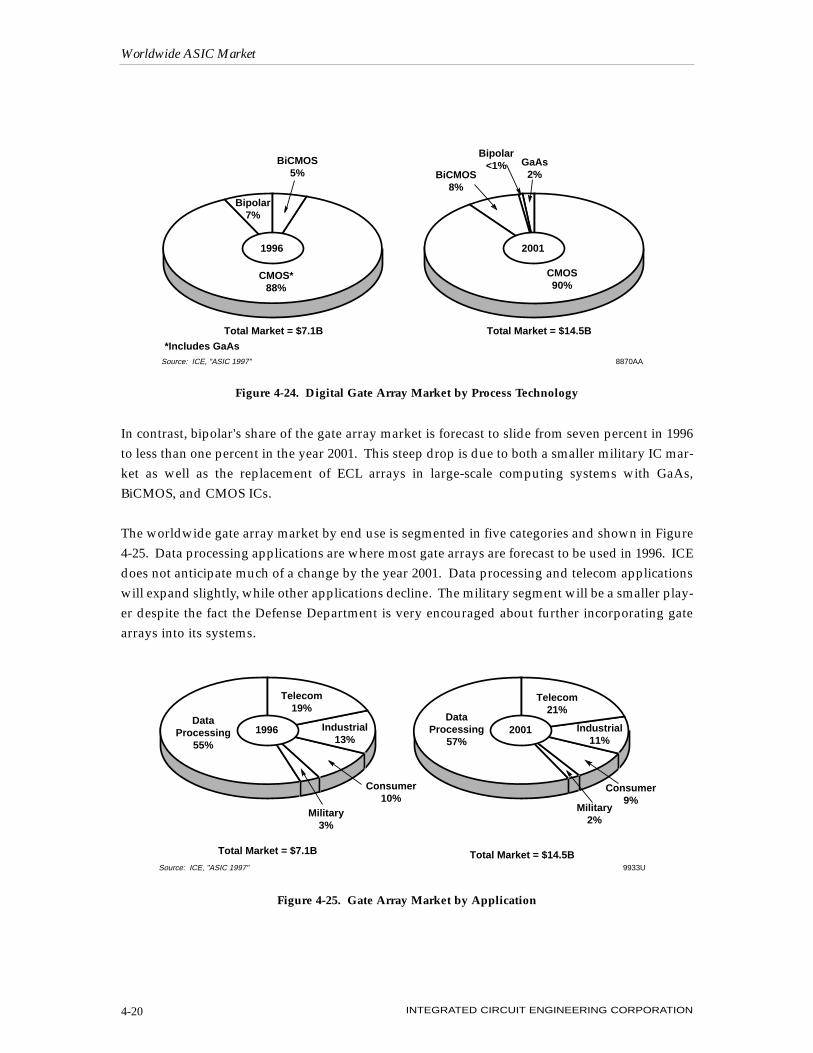
In contrast, bipolar's share of the gate array market is forecast to slide from seven percent in 1996to less than one percent in the year 2001. This steep drop is due to both a smaller military IC mar-ket as well as the replacement of ECL arrays in large-scale computing systems with GaAs,BiCMOS, and CMOS ICs.
The worldwide gate array market by end use is segmented in five categories and shown in Figure4-25. Data processing applications are where most gate arrays are forecast to be used in 1996. ICEdoes not anticipate much of a change by the year 2001. Data processing and telecom applicationswill expand slightly, while other applications decline. The military segment will be a smaller play-er despite the fact the Defense Department is very encouraged about further incorporating gatearrays into its systems.
Worldwide ASIC Market
INTEGRATED CIRCUIT ENGINEERING CORPORATION4-20
BiCMOS 5%
CMOS* 88%
Bipolar 7%
1996
BiCMOS 8%
CMOS 90%
Bipolar <1%
2001
GaAs 2%
Total Market = $7.1B Total Market = $14.5B
8870AASource: ICE, "ASIC 1997"
*Includes GaAs
Figure 4-24. Digital Gate Array Market by Process Technology
Data Processing
55%
1996
Telecom 19%
Industrial 13%
Consumer 10%
Military 3%
2001 Industrial 11%
Telecom 21%
Consumer 9%
Military 2%
Data Processing
57%
Total Market = $14.5B9933USource: ICE, "ASIC 1997"
Total Market = $7.1B
Figure 4-25. Gate Array Market by Application

Linear Array Suppliers
Linear arrays put the functions of several linear ICs and discrete products onto a single chip. Mostlinear arrays consist of bipolar transistors and resistors, but can also include capacitors, junctionfield-effect transistors, and Schottky diodes.
Linear arrays have had a difficult time gaining significant market acceptance. One reason for thisis design difficulties. Other concerns include noise isolation, isolating the substrate, interfacingthe chip with external circuitry, and keeping NRE costs low and schedules short. Also, the lack ofstandardized test methods has traditionally been a stumbling block for linear ASICs.
The leading linear array manufacturers and their sales are provided in Figure 4-26. Lucent (for-merly AT&T), with 1995 sales of $50 million in 1995, took over as the leading supplier of lineararray devices. This market is small compared with other segments and will become a signifi-cantly smaller portion of the total ASIC market in the year 2001. In fact, some suppliers on the1995 list will likely join Raytheon and Micro Linear in phasing out linear arrays from their prod-uct portfolio.
Standard Cell Suppliers
Leading standard cell ASIC manufacturers and their 1994 and 1995 sales numbers are shown inFigure 4-27. Overall, the standard cell market grew 35 percent to over $4.9 billion in 1995, and isforecast to continue to grow at a strong pace through the balance of the decade.
Worldwide ASIC Market
INTEGRATED CIRCUIT ENGINEERING CORPORATION 4-21
Company1993 Sales ($M)
13649RSource: ICE, "ASIC 1997"
1994 Sales ($M)
1995 Sales ($M)
1995/1994 Percent Change
1995�Percent
Marketshare
1994/1993 Percent Change
1995 Rank
1�
2�
3�
4�
5�
6�
7�
8�
9�
10
Lucent (ex AT&T)
Maxim
SGS-Thomson
NEC
GEC Plessey
Ricoh
Universal
Gennum
Exar
Cherry
Others
Total
22�
32�
30�
20�
22�
12�
11�
7�
8�
7�
34�
205
26�
38�
35�
25�
18�
15�
12�
10�
9�
8�
24�
220
18�
19�
17�
25�
–18�
25�
9�
43�
13�
14�
–29�
7
50�
42�
35�
30�
20�
15�
12�
11�
9�
8�
3�
235
92�
11�
—�
20�
11�
—
—
10
—
—
–88�
7
21�
18�
15�
13�
9�
6�
5�
5�
4�
3�
1�
100
Figure 4-26. Analog Array Leaders

With 1995 sales of $670 million, Lucent retained its top ranking among standard cell suppliers. Itshould be noted that as a former "captive" supplier, Lucent did a lot of internal business. ICE esti-mates that Lucent’s internal business accounted for approximately 25 percent of its total standardcell sales in 1995.
Worldwide ASIC Market
INTEGRATED CIRCUIT ENGINEERING CORPORATION4-22
1995 Rank
Company1994 Sales ($M) 1995 Sales ($M)
MOS Bipolar Total MOS Bipolar Total
1995/1994 Percent Change
1995 Percent
Marketshare
1 2 3 4 5 6 7 8 9
10 11 12 13 14 15 16 17 18 19 20 21 22 23 24 25 26 27 28 29 30 31 32 33 34 35 36 37
Lucent (Ex AT&T) LSI Logic TI NEC VLSI Technology Symbios Toshiba Fujitsu SGS-Thomson Alcatel Mietec Motorola IBM Hitachi AMS Exar GEC Plessey Harris Oki Matsushita Sharp LG Semicon National IMP Ricoh ES2*** Atmel Mitsubishi Dialog MHS Samsung Hughes Sanyo Triquint** AMI Siemens* Elex ABB HAFO Others Total
600�248�345�260�262�238�173�180�110�159�
58�40�85�75�74�30�60�41�68�50�18�58�—�40�36�—�31�27�22�15�20�20�15�17�20�11�
9�70�
3,585
— — — — — — — 5
— — — — — — — 65�15 — — — — — — — — — — — — — — — — — — — — 5
90
600�248�345�260�262�238�173�185�110�159�
58�40�85�75�74�95�75�41�68�50�18�58�—�40�36�—�31�27�22�15�20�20�15�17�20�11�
9�75�
3,675
670�576�430�340�310�292�243�220�189�166�125�100�100�
97�95�33�54�76�70�55�53�51�50�49�48�44�35�30�26�25�24�24�23�22�17�14�11�73�
4,860
— — — — — — —�5
— — — — —�— — 49�26 — — — — — — — — —�— — — — — — — — — — — 5�
85
670�576�430�340�310�292�243�225�189�166�125�100�100�
97�95�82�80�76�70�55�53�51�50�49�48�44�35�30�26�25�24�24�23�22�17�14�11�78�
4,945
12�132�
25�31�18�23�40�22�72�
4�116�150�
18�29�28�
–14�7�
85�3�
10�194�–12�N/A�
23�33�
N/A�13�11�18�67�20�20�53�29�
–15�27�22�
4�35
13.5�11.6�
8.7�6.9�6.3�5.9�4.9�4.6�3.8�3.4�2.5�2.0�2.0�2.0�1.9�1.7�1.6�1.5�1.4�1.1�1.1�1.0�1.0�1.0�1.0�0.9�0.7�0.6�0.5�0.5�0.5�0.5�0.5�0.4�0.3�0.3�0.2�1.6�
100.0�
13638P
1Includes mixed-signal *Phasing out of standard cell business **GaAs ***Purchased by Atmel in 1995Source: ICE, "ASIC 1997"
Figure 4-27. Standard Cell IC Leaders1

Meanwhile, LSI Logic with sales of $576 million (an increase of 132 percent), replaced TI at thenumber two position. LSI Logic took several steps to improve its product line up including amove into the mixed-signal arena. The company has more plans for 1996 and 1997, including theintroduction of 0.25-micron-based interface cores for several “gigabit-plus” data transfer technol-ogy products. Besides LSI Logic, three other companies increased their standard cell sales bytriple-digit amounts in 1995.
Motorola’s FlexCore program helped boost its standard cell business 116 percent in 1995.FlexCore combines a standard product with functions desired by a user to create a quasi-applica-tion specific chip. FlexCore takes Motorola's 68000-family core processor and allows a designer tointegrate desired features such as up to 100,000 gates of user-defined logic, memory, and periph-eral modules. It is a feature that is very attractive and very well understood by the design com-munity. Customers get what looks like an ASIC device built using industry-standard third-partydesign tools. The bottom line for Motorola was a very nice gain in standard cell sales.
As shown in Figure 4-28, CMOS technology dominates the standard cell market and is forecast tocontinue that way through the year 2001. Much like the gate array market, there will be margin-al increases in the use of BiCMOS technology. Even GaAs technology may see a small increase inuse throughout the industry. However, CMOS devices will dominate.
The worldwide standard cell market by geographic sector is displayed in Figure 4-29. In 1996,Japan's share of the standard cell market is forecast to be 36 percent; 34 percent for the NorthAmerican region. In 1995, North America’s share of the market increased four percentage points.Projecting out to the year 2001, ICE forecasts that the ROW region will gain additional market-share, mostly at the expense of the Japanese segment.
Worldwide ASIC Market
INTEGRATED CIRCUIT ENGINEERING CORPORATION 4-23
CMOS 93%
BiCMOS 4%Bipolar
2%
1996
CMOS 91%
BiCMOS 6%
Bipolar <1%GaAs
2%
GaAs 1%
Total Market $17.5BTotal Market $6.2B12907QSource: ICE, "ASIC 1997"
2001
Figure 4-28. Standard Cell Market by Process Technology
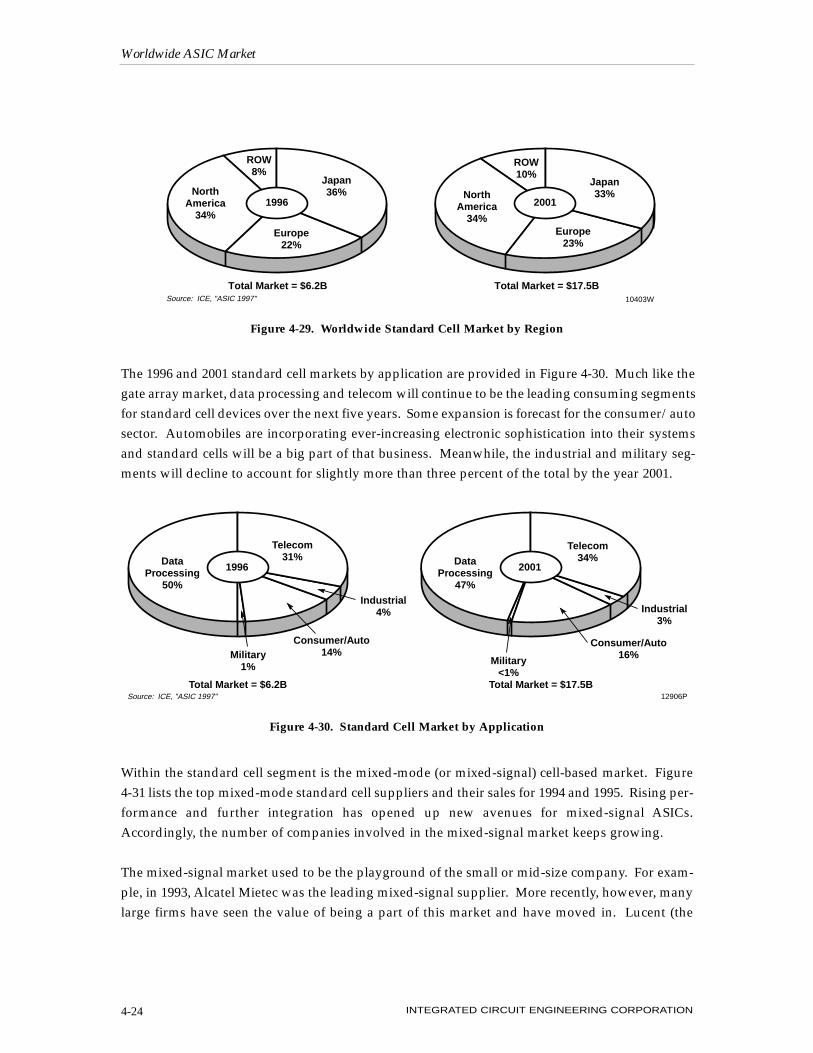
The 1996 and 2001 standard cell markets by application are provided in Figure 4-30. Much like thegate array market, data processing and telecom will continue to be the leading consuming segmentsfor standard cell devices over the next five years. Some expansion is forecast for the consumer/autosector. Automobiles are incorporating ever-increasing electronic sophistication into their systemsand standard cells will be a big part of that business. Meanwhile, the industrial and military seg-ments will decline to account for slightly more than three percent of the total by the year 2001.
Within the standard cell segment is the mixed-mode (or mixed-signal) cell-based market. Figure4-31 lists the top mixed-mode standard cell suppliers and their sales for 1994 and 1995. Rising per-formance and further integration has opened up new avenues for mixed-signal ASICs.Accordingly, the number of companies involved in the mixed-signal market keeps growing.
The mixed-signal market used to be the playground of the small or mid-size company. For exam-ple, in 1993, Alcatel Mietec was the leading mixed-signal supplier. More recently, however, manylarge firms have seen the value of being a part of this market and have moved in. Lucent (the
Worldwide ASIC Market
INTEGRATED CIRCUIT ENGINEERING CORPORATION4-24
Japan 36%
Europe 22%
North America
34%
ROW 8%
1996
Japan 33%
Europe 23%
North America
34%
ROW 10%
2001
Total Market = $6.2B Total Market = $17.5B10403WSource: ICE, "ASIC 1997"
Figure 4-29. Worldwide Standard Cell Market by Region
Figure 4-30. Standard Cell Market by Application
Telecom 31%Data
Processing 50%
1996
Military 1%
Consumer/Auto 14%
Industrial 4%
Telecom 34%Data
Processing 47%
2001
Military <1%
Consumer/Auto 16%
Industrial 3%
12906PSource: ICE, "ASIC 1997"Total Market = $17.5BTotal Market = $6.2B

largest supplier in 1994 and 1995), Texas Instruments, SGS-Thomson, GEC Plessey, and Harris arelarge corporations that saw their mixed-mode sales increase nicely in 1995. Overall, the mixed-signal market grew 48 percent in 1995.
The mixed-mode standard cell market forecast is shown in Figure 4-32. In 1996, mixed-modedevices are forecast to account for 31 percent of the $6.2 billion standard cell market. By the year2001, mixed-mode devices are forecast to represent 35 percent of the $17.5 billion standard cellmarket. That amounts to a 33 percent cumulative annual growth rate over this five-year period.
Worldwide ASIC Market
INTEGRATED CIRCUIT ENGINEERING CORPORATION 4-25
Company1995 Sales
1994 Sales
1995/1994 Percent Change
1995 Percent Marketshare
Lucent (Ex AT&T)
TI
Alcatel Mietec
Symbios
SGS-Thomson
GEC Plessey
AMS
Exar
Harris
IMP
NEC
Dialog
Others
Total
262�
159�
130�
111�
83�
78�
74�
72�
48�
48�
45�
30�
325�
1,465
90�
85�
—�
66�
80�
–9�
28�
50�
33�
N/A�
80�
11�
34�
48
1995 Total Standard
Cell
670�
430�
166�
292�
189�
82�
97�
95�
80�
50�
340�
30�
2,424�
4,945
Mixed-Signal Percent Of Total
39�
37�
78�
38�
44�
95�
76�
76�
60�
96�
13�
100�
13�
30
18�
11�
9�
7�
6�
5�
5�
5�
3�
3�
3�
2�
22�
100
15430LSource: ICE, "ASIC 1997"
138�
86�
130�
67�
46�
86�
58�
48�
36�
—�
25�
27�
243�
990
1995 Rank
1
2
3
4
5
6
7
8
9
10�
11�
12
Figure 4-31. Mixed-Signal Standard Cell Leaders ($M)
Figure 4-32. Mixed-Mode Standard Cell Market Forecast
15431MSource: ICE, "ASIC 1997"
Digital 69%
Mixed-Mode 31%
1996 $6.2B
2001 $17.5B
Digital 65%
Mixed-Mode 35%

PLD Suppliers
The market for programmable logic devices (PLDs) is forecast to continue growing at a healthypace through the year 2001. PLD suppliers will make available additional high-density productswith greater complexity in order to meet a growing list of applications. PLD vendors will alsopush gate counts higher through 1996 and into 1997 (Altera shipped its 100,000-gate FLEX devicein 2Q96) as PLDs encroach on the gate array market.
The top players in the PLD market and their sales are shown in Figure 4-33. Sales figures do notinclude software and development system sales. There are several small-to-medium size com-panies that vigorously compete for PLD marketshare. Firms such as Xilinx (which took over theleadership position in 1994), Altera, Lattice, and Actel have all displayed leadership in this fastgrowing market.
One the major benefits driving PLD usage continues to be fast time-to-market. Of three prof-itability factors (rapid time-to-market, production costs, and development cost overrun), time-to-market is often the most critical in an electronics industry where market windows seem to be con-tinuously shrinking.
Density and performance of programmable logic devices are sufficient for most applications.However, improved efficiencies are rapidly driving down costs. With their rapid time-to-market(Figure 4-34) and reconfigurability benefits, PLDs are a strong candidate to replace gate arrays inmany applications.
Worldwide ASIC Market
INTEGRATED CIRCUIT ENGINEERING CORPORATION4-26
1995 ($M)1994 ($M)
305�
181�
270�
120�
68�
43�
55�
83�
21
15�
114�
1,275
495�
382�
260�
158�
98�
78�
55�
5�
5�
18�
96�
1,650
495�
382�
323�
158�
98�
78�
55�
38�
23�
18�
97�
1,765
Xilinx
Altera
AMD
Lattice
Actel
Lucent (Ex AT&T)
Cypress
TI
Philips
Atmel
Others
Total
305�
181�
178�
120�
68�
43�
55�
40�
3
15�
112�
1,120
—
—
63
—
—�
—
—
33
18�
—
1�
115
COMPANYMOS TOTAL BIPOLARBIPOLAR MOS TOTAL
13601Q
—�
—
92
—
—�
—
—
43�
18
—
2
155
Source: ICE, "ASIC 1997"
1995/1994 PERCENT CHANGE
62�
111�
20�
32�
44�
81�
—�
–54�
10�
20�
–15�
38
1995 PERCENT
MARKETSHARE
28�
22�
18�
9�
6�
4�
3�
2�
1�
1�
5�
100
1995 RANK
1
2
3
4
5
6
7
8
9
10
1Does not include software and development system sales.
Figure 4-33. PLD Sales Leaders1

Lively competition in the PLD market has resulted in several "marginal" players exiting the mar-ket in recent years. National Semiconductor announced that it stopped taking new orders for pro-grammable logic. Intel sold its programmable logic business to Altera for $50 million in cash andstocks. Actel declared that it purchased the FPGA business of its second-source partner, TexasInstruments. And, although they have no plans to exit the PLD market, AMD and Philips turnedtheir respective PLD divisions into wholly-owned subsidiaries to keep up with changes in the fast-paced PLD market.
PLD suppliers continued to battle for increased marketshare by adding special features or mak-ing devices faster and more complex. The fierce competition resulted in a steep decline in prices.For example, in 2Q96, Altera significantly lowered the price of its FLEX 8000 PLD family (Figure4-35) and Xilinx cut prices on its XC5200 FPGA series as the company moved from its 0.6µm triple-layer metal (TLM) CMOS process to a 0.5µm process.
With falling prices, the PLD market will be weakened through the remainder of 1996 and into1997. However, compared to the overall semiconductor industry, it will be a strong performer.Moreover, the forecast through the end of the decade calls for greater market expansion.
Worldwide ASIC Market
INTEGRATED CIRCUIT ENGINEERING CORPORATION 4-27
Design Simulation Prototypes Verification Production
Gate Array
Programmable Logic
Development Time (Weeks)
Source: Atmel/"ASIC 1997" 21038
Figure 4-34. PLDs Shorten Time to Market
Figure 4-35. Altera Drops FLEX 8000 Prices
21039Source: Altera
Part NumberPre-2Q96 Unit Price
2Q96 Unit Price
End '96 Price Projection
Percent Change
EPF8282ALC84-4�
EPF8452ALC84-4�
EPF8636ALC84-4�
EPF8820AQC160-4�
EPF81188AQC208-4�
EPF81500ARC240-4
$17.50�
$38.00�
$58.00�
$75.00�
$89.00�
$149.00
$11.00�
$17.00�
$25.00�
$37.00�
$55.00�
$79.00
$5.00�
$7.50�
$13.00�
$19.00�
$29.00�
$49.00
35%�
55%�
55%�
50%�
35%�
45%

Complex PLDs (CPLDs) and FPGAs will contribute the most to the expected growth of the pro-grammable logic sector. CPLDs and FPGAs often target the same applications, including datacommunications and telecommunications equipment, PC peripherals and add-in cards, and elec-tronic games.
CPLDs are being turned to more often because of their low cost, compared with less-dense sim-ple PLDs. For essentially no added expense, designers can consolidate several simple PLDdesigns into one complex PLD.
Why haven’t simple PLD prices dropped as well? As small process geometries reduce die size andcost, PLD prices are more influenced by the package. This means that, for a simple PLD, a cus-tomer may pay more for the package than the silicon. With smaller process geometries reducingcosts, designers can save board space and lower the total system cost by using CPLDs.
CPLDs vendors include AMD, Cypress, Lattice, and Philips. In 1996, Lattice introduced its in-sys-tem programmable (isp) ispLSI 6192xx family that incorporates memory and a register/countermodule onto a CPLD. Meanwhile, Philips formed a new business unit for CPLDs that will targetlow-voltage, high-speed applications.
Several PLD suppliers are listed in Figure 4-36 with the circuitry-type they use to build their pro-grammable logic products. As with other ASIC devices, CMOS is the main process technologyused for manufacturing PLDs.
PLD marketshare for 1995 is displayed in Figure 4-37. Xilinx, which took over as the leading PLDsupplier in 1994, increased its PLD marketshare from 24 percent in 1994 to 28 percent in 1995.Xilinx's growth has come through aggressive market introduction of many, very well acceptednew products.
AMD, which held 46 percent of the total PLD marketshare in 1988, secured only 18 percent in1995. Its grip on the PLD market loosened quickly due to aggressive competition from manysmaller, but very aggressive suppliers. In addition, up until around 1990, AMD emphasized bipo-lar PLDs. In fact, 1993 was the first year AMD produced a greater percentage of CMOS PLDs thanbipolar PLDs. AMD is still the leading bipolar PLD supplier, but that segment is dwindling. AMDnow vigorously pursues CMOS technology. Its CMOS-based complex PLDs, fast, low-voltagePLDs, and PLDs characterized for the "green computer” environment have been successful.
Figure 4-38 shows the CMOS and bipolar markets segmented by type. In 1995, 44 percent of PLDswere based on EEPROM technology and 34 percent were SRAM-based.
Worldwide ASIC Market
INTEGRATED CIRCUIT ENGINEERING CORPORATION4-28

Worldwide ASIC Market
INTEGRATED CIRCUIT ENGINEERING CORPORATION 4-29
SUPPLIERCMOS
BIPOLAROTHEREPROM EEPROM SRAM
Actel
Altera
AMD5
AMI
Atmel
Crosspoint Solutions
Cypress6
Exel
Fujitsu
Hyundai
IBM
ICT
Lattice
Lucent (Ex AT&T)
Motorola
Peregrine11
Philips12
QuickLogic13
Ricoh
SGS-Thomson
TI
Toshiba
Xilinx
Zycad
X1�
X1,2�
X2�
�
X2�
X1�
X1,2�
�
X1�
�
�
�
�
�
�
�
�
X1�
�
�
�
�
X1
X2
�
X�
�
X�
�
�
X�
�
�
�
�
�
�
�
�
�
X�
�
X�
X�
X�
�
X
�
X�
X�
X�
�
�
�
X�
X�
X�
X�
X�
X�
�
�
�
�
�
�
X�
�
X�
�
X�
�
�
X�
�
�
�
�
�
X7�
�
�
X�
X10�
X�
�
�
�
�
�
X�
X
�
�
X�
�
�
�
�
�
�
�
�
�
�
�
�
�
X�
�
�
�
X�
�
No3
Yes4
Yes
Yes
Yes
No
Yes
No
Yes
Yes
Yes
No8
No9
Yes
Yes
No
Yes
No
Yes
Yes
Yes
Yes
No
No
FABRICATION CAPABILITY
12905SSource: ICE, "ASIC 1997"
Antifuse. Flash-based. Foundry agreements with Matsushita and Samsung. Purchased TI's antifuse PLD business. "Owns" 18 percent stake in Cypress' Texas facility. Foundry agreement with Sharp. Building new fab with TSMC in Camas, WA. Production slated for mid-1998. Spun off PLD business into wholly-owned subsidiary. Product development agreement with QuickLogic. Second sourcing Atmel's product line. Also developing its own SRAM-based FPGA family. Uses Chartered Semiconductor and Rohm Corporation for foundry services. Foundry agreement with Seiko Epson. FPGA line based on technology licensed from Pilkington Microelectronics Ltd. of the U.K. Licensed Xilinx PLD technology and can sell only 3.3V versions. IBM will fabricate the ICs for Peregrine. Formed Complex PLD business unit. Manufacturing agreement with Cypress.
1
2
3
4
5
6
7
8
9
10
11
12
13
Figure 4-36. Sampling of PLD Suppliers

Worldwide ASIC Market
INTEGRATED CIRCUIT ENGINEERING CORPORATION4-30
AMD 18%
Lucent 4%
Altera 22%
Lattice 9%
Xilinx 28%
Cypress 3%
Other 10%
$1,765M
Altera 23%
Lattice 10%
Xilinx 30%
Cypress 3%
AMD 16%
Other 7%
$1,650M
BIPOLARCMOS
TOTAL PLD MARKET
13602QSource: ICE, "ASIC 1997"
Actel 6%
Actel 6%
Lucent 5%
AMD 55%TI
29%
Philips 16%
Other <1%
$115M
Figure 4-37. 1995 PLD Marketshare
Figure 4-38. The 1995 PLD Market Segmented by Type
Antifuse 7%
EPLD 7%
EEPLD 44%
SRAM 34%
Bipolar 7%
17112JSource: ICE, "ASIC 1997"
Flash 1%
CMOS 93%
$1,765M

It is interesting to note that less than 20 percent of PLD consumption came from the combinedregions of Japan and the ROW (Figure 4-39). In part, the Japanese and ROW regions have beenslow to adopt PLDs into system designs because of their emphasis on high-volume consumer elec-tronics. Most of the current usage of PLDs in these regions is for prototyping eventual gate arrayand standard cell designs.
FPGA Suppliers
Field programmable gate arrays (FPGAs)—a type of PLD—are sometimes used to provide a quickway to determine if a particular ASIC design will work well in a system. FPGAs are attractivebecause they offer design flexibility, no NRE costs, and, perhaps, most important, provide turn-around times that are several weeks faster than standard gate array devices. And, fast turnaroundleads to quick time-to-market.
However, the fast FPGA turnaround times are accompanied by a higher price per gate comparedwith a standard CMOS gate array (although the difference is narrowing). Nevertheless, many endusers believe the cost penalty is worth paying for in order to get their product to market faster.
Worldwide ASIC Market
INTEGRATED CIRCUIT ENGINEERING CORPORATION 4-31
North American
60%
North American
56%
North American
60%
ROW 6%
ROW 4%
ROW 6%
Japan 12%
Japan 14%
Japan 12%
Europe 22%
Europe 26%
Europe 22%
$2,050M
$70M $2,120M
MOS PLD Market
Bipolar PLD Market Total PLD Market19513CSource: ICE, "ASIC 1997"
Figure 4-39. 1996 PLD Markets by Region

As big gate array vendors move toward devices with gate counts in excess of 100,000 gates, theyare often times leaving the market for low-volume, low-density devices to FPGA vendors. ManyFPGA suppliers have captured significant business in the low-density gate count arena. Thesevendors continue to increase the densities of their FPGAs such that they now compete againstmid-range density gate array devices. Figure 4-40 shows a sample of some of the high-densityFPGA families that were available in 1996.
Major semiconductor manufacturers have become more involved in this market as customer inter-est in FPGAs has increased. In recent years, large companies such as Motorola and IBM licensedothers' technology to become players in the FPGA business. However, the FPGA market is clear-ly controlled by Xilinx (Figure 4-41).
Worldwide ASIC Market
INTEGRATED CIRCUIT ENGINEERING CORPORATION4-32
Company Device FamilyDensity Range
(Gates)Highest Density Available Now
Altera
Actel
Atmel
Crosspoint Solutions
Cypress
Gatefield
Lucent Technologies
Motorola
Quicklogic
Xilinx
Flex 10K
3200DX
AT6000
Cross Fire
Ultra38000
GF100K
ORCA Series
MPA1000
pASIC1
XC4000
10,000 - 100,000�
6,500 - 40,000�
2,000 - 20,000�
20,000 - 100,000�
7,000 - 20,000�
9,000 - 100,000�
3,500 - 40,000�
3,500 - 22,000�
1,000 - 8,000�
28,000 - 125,000
EPF10K50 (50,000)
32200DX (20,000)
AT6010 (20,000)
N/A
CY7C38007 (7,000)
GF51K (51,000)
ATT2C40 (40,000)
MPA1100 (22,000)
QL24X32 (8,000)
XC4028 (28,000)
Source: Computer Design/ICE, "ASIC 1997" 21040
Figure 4-40. Representative Selection of High-Density FPGAs
Figure 4-41. FPGA Sales* Leaders
1995 Rank
Company1994 Sales
($M)1995 Percent Marketshare
Xilinx
Actel*
Lucent (Ex AT&T)
Cypress
Quicklogic
Others
Total
1
2
3
4
5
300�
68�
43�
2�
5�
42�
460
66�
14�
11�
3�
2�
4�
100
1995 Sales ($M)
1995/1994 Percent Change
475�
98�
78�
24�
12�
28�
715
58�
44�
81�
1,100�
140�
–33�
55
*Purchased TI's antifuse FPGA business in 1995.15432MSource: ICE, "ASIC 1997"

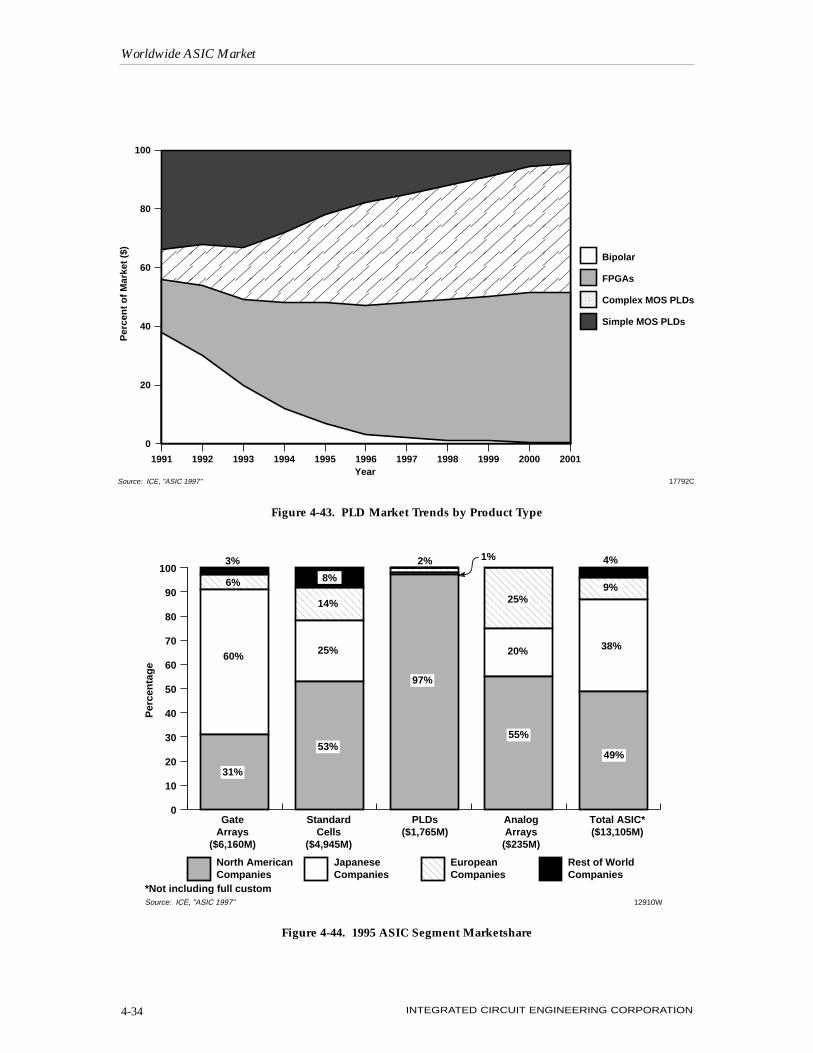
The PLD market forecast through the year 2001 is shown in Figure 4-42. The CPLD and FPGAsegments will contribute most to growth in the PLD market. Marketshares for each of these seg-ments is forecast to increase several points through the end of the decade. On the other hand,bipolar's share will rapidly decrease. Figure 4-43 provides another perspective of the growingdollar volume of MOS PLDs and FPGAs.
ASIC MARKETSHARE
The 1995 ASIC market by regional production is displayed in Figure 4-44. The areas includeNorth America, Japan, Europe, and the Rest of the World (ROW). A company's sales are classifiedinto one of the categories based on the location of its headquarters. So, even though a companysuch as Texas Instruments has fabs located around the world, its headquarters are in NorthAmerica and therefore all sales are credited to that region.
When it comes to ASIC devices, North American manufacturers control three of the four majorASIC segments. With the exception of gate arrays, North American manufacturers dominatedproduction in each ASIC category in 1995.
Worldwide ASIC Market
INTEGRATED CIRCUIT ENGINEERING CORPORATION 4-33
0
1,000
2,000
3,000
4,000
5,000
6,000
7,000
��������
��������
���������
������������
��������
��������
������
��������
��������
��������
������
20012000199919981997199619951994199319921991
Mill
ion
s o
f D
olla
rs
FPGAs
Simple MOS PLDs
Bipolar PLDs
$905M
$945M$1,190M $1,275M
$1,765M
$2,120M
$2,500M
$3,040M
$3,782M
$4,786M
$6,120M
Year13603NSource: ICE, "ASIC 1997"
������
Complex MOS PLDs
19%41%
51%
10%
34%37%
31%
22%
6%
44%
5%<1%
Figure 4-42. PLD Market Forecast by Product Type
Worldwide ASIC Market
INTEGRATED CIRCUIT ENGINEERING CORPORATION4-34
17792CSource: ICE, "ASIC 1997"
Bipolar
FPGAs
����������������
Complex MOS PLDs
Year
Per
cen
t o
f M
arke
t ($
)
0
20
40
60
80
100
������������������������������������������������������������������������������������������������������������������������������������������������������������������������
Simple MOS PLDs
1991 1992 1993 1994 1995 1996 1997 1998 1999 2000 2001
Figure 4-43. PLD Market Trends by Product Type
0
10
20
30
40
50
60
70
80
90
100
���������������������������������
������������������������������������������������������������������
�����������
���������������������������������������������������������������������������������������������������
��������������������������������������������
Gate Arrays
($6,160M)
Standard Cells
($4,945M)
PLDs ($1,765M)
Analog Arrays ($235M)
Total ASIC* ($13,105M)
Per
cen
tag
e
31%
60%
53%
25%
14%
97%
55%
25%
49%
38%
9%
3% 1% 4%
North American Companies
Japanese Companies
��������������������European
CompaniesRest of World Companies
*Not including full custom12910WSource: ICE, "ASIC 1997"
20%
8%
2%
6%
Figure 4-44. 1995 ASIC Segment Marketshare

Japanese companies have been most successful in the gate array market. Figure 4-45 shows thatapproximately three-fourths of Japanese companies' ASIC sales are gate arrays. North AmericanASIC sales in 1995 were led by standard cell devices, followed roughly by a split between the gatearray and PLD segments. European and ROW companies both emphasized standard cell products.
Figure 4-46 provides a breakdown of ASIC vendors by region and product category. The majori-ty of players in the ASIC market are manufacturers of MOS standard cells and MOS gate arrays.Each geographic region has more major vendors in these two segments than any other.
Worldwide ASIC Market
INTEGRATED CIRCUIT ENGINEERING CORPORATION 4-35
Gate Arrays 74%
Standard Cells 25%
PLDs <1% Analog Arrays 1%
$5.0B
Japanese Companies
European Companies
Gate Arrays 30%
Standard Cells 41%
PLDs 27%
Analog Arrays 2%
$6.4B
Standard Cells 60%
Gate Arrays 32%
Analog Arrays 5%
PLDs 3%
$1.2B
North American Companies
17794GSource: ICE, "ASIC 1997"
*Not including full custom
$0.6BStandard
Cells 68%
Gate Arrays
32%
ROW Companies
Figure 4-45. 1995 ASIC* Sales by Product Type

Worldwide ASIC Market
INTEGRATED CIRCUIT ENGINEERING CORPORATION4-36
MOS Gate Arrays**
Bipolar Gate Arrays
MOS Standard Cells**
Bipolar Standard Cells
Analog Arrays
Mixed-Mode Standard Cells
MOS PLDs
Bipolar PLDs
Product Category
36�
6�
37�
2�
8�
15�
13�
3
15�
2�
15�
1�
4�
8�
11�
2
4�
1�
9�
1�
2�
5�
1�
1
14�
3�
10�
—�
2�
1�
1�
—
3�
—�
3�
—�
—�
1�
—�
—
Total Number of Suppliers
North American Suppliers
European Suppliers
Japanese Suppliers
ROW Suppliers
17793ESource: ICE, "ASIC 1997"
≥$10M in product category sales. Includes GaAs suppliers.
* **
Figure 4-46. 1995 Major* ASIC Vendor Analysis