section 5. risk assessment - new...
TRANSCRIPT

State of New Jersey 2014 Hazard Mitigation Plan
Page 5.9-1 Section 5.9. Nor’Easter
Section 5. Risk Assessment
5.9 Nor’Easters
2014 Plan Update Changes
Previous occurrences were updated.
Potential change in climate and its impacts on the flood hazard is discussed.
The vulnerability assessment is a new addition for the Nor’Easter hazard.
As for all hazards, the vulnerability assessment now directly follows the hazard profile.
Environmental impacts is a new subsection.
For the 2014 Plan update, information was updated to reflect the best available data related to Nor’Easters as
they pertain to New Jersey. The location and extent of the hazard was updated and enhanced to reflect areas of
the state that are vulnerable to the hazard. An updated discussion of past occurrences was included to reflect
recent incidents such as the November 2012 Nor’Easter which impacted the State following Superstorm Sandy
as well as other significant incidents impacting New Jersey. In addition, future climate change implications
related to Nor’Easters were added to the profile. Finally, the exposure and vulnerability assessment was
updated to reflect newly available data.
5.9.1 Profile
Hazard Description
A Nor’Easter is a cyclonic storm that moves along the East Coast of North America. It is called a Nor’Easter
because the damaging winds over coastal areas blow from a northeasterly direction. Nor’Easters can occur any
time of the year, but are most frequent and strongest between September and April. These storms usually
develop between Georgia and New Jersey within 100 miles of the coastline and typically move from southwest
to northeast along the Atlantic Coast of the United States (National Oceanic and Atmospheric Administration
[NOAA] 2013).
In order to be called a Nor’Easter, a storm must have the following conditions, as per the Northeast Regional
Climate Center (NRCC):
Must persist for at least a 12-hour period
Have a closed circulation
Be located within the quadrilateral bounded at 45°N by 65° and 70°W and at 30°N by 85°W and
75°W
Show general movement from the south-southwest to the north-northeast
Contain wind speeds greater than 23 miles per hour (mph)
A Nor’Easter event can cause storm surges, waves, heavy rain, heavy snow, wind, and coastal flooding.
Nor’Easters have diameters that can span 1,200 miles, impacting large areas of coastline. The forward speed
of a Nor’Easter is usually much slower than a hurricane, so with the slower speed, a Nor’Easter can linger for
days and cause tremendous damage to those areas impacted. Approximately 20 to 40 Nor’Easters occur in the
northeastern United States every year, with at least two considered severe (Storm Solution, 2013). The
intensity of a Nor’Easter can rival that of a tropical cyclone in that, on occasion, it may flow or stall off the
mid-Atlantic coast resulting in prolonged episodes of precipitation, coastal flooding, and high winds.
State of New Jersey 2014 Hazard Mitigation Plan
Page 5.9-2 Section 5.9. Nor’Easter
Nor’Easters are a common winter occurrence in New Jersey. New Jersey may be impacted by 10 to 20
Nor’Easters each year, with approximately five to 10 of those having significant impact to the State. These
storms repeatedly result in flooding, wave and erosion damage to structures, and erosion of natural resources,
such as beaches, dunes, and coastal bluffs. The erosion of coastal features commonly results in greater
potential for damage to shoreline development from future storms.
Details regarding erosion can be found in Section 5.2 (Coastal Erosion), and details regarding hurricanes,
tropical storms, and storm surge can be found in Section 5.8 (Hurricane and Tropical Storms).
Location
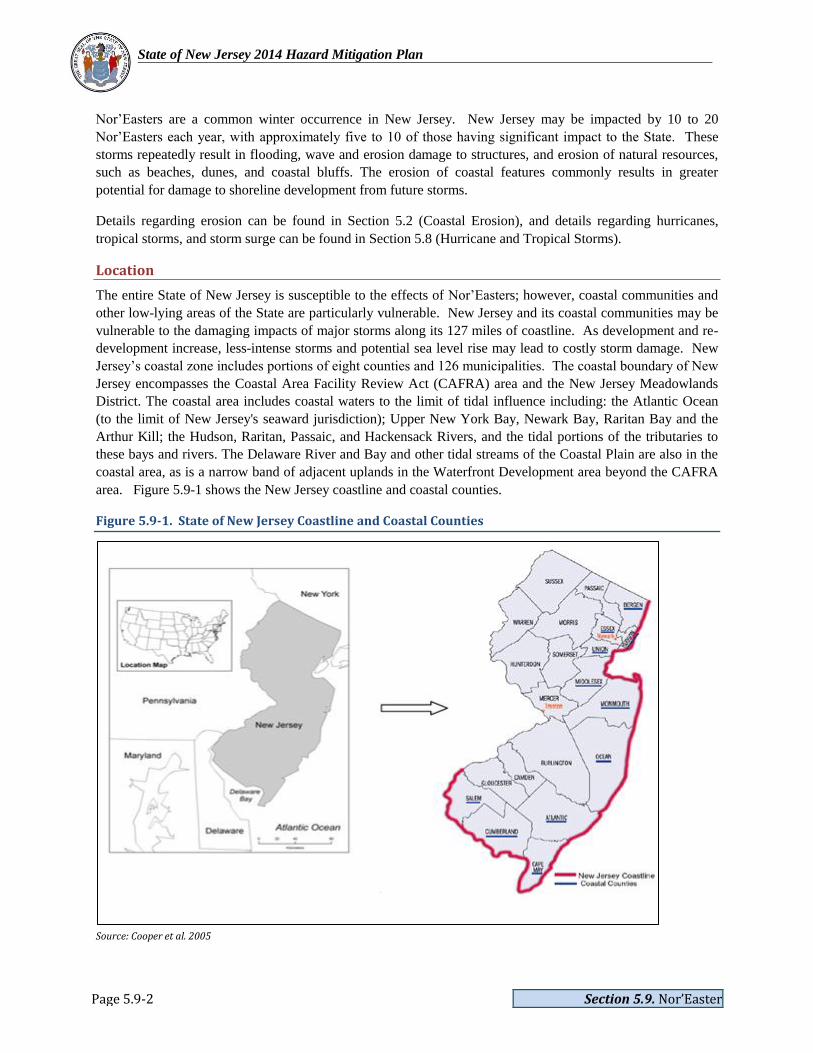
The entire State of New Jersey is susceptible to the effects of Nor’Easters; however, coastal communities and
other low-lying areas of the State are particularly vulnerable. New Jersey and its coastal communities may be
vulnerable to the damaging impacts of major storms along its 127 miles of coastline. As development and re-
development increase, less-intense storms and potential sea level rise may lead to costly storm damage. New
Jersey’s coastal zone includes portions of eight counties and 126 municipalities. The coastal boundary of New
Jersey encompasses the Coastal Area Facility Review Act (CAFRA) area and the New Jersey Meadowlands
District. The coastal area includes coastal waters to the limit of tidal influence including: the Atlantic Ocean
(to the limit of New Jersey's seaward jurisdiction); Upper New York Bay, Newark Bay, Raritan Bay and the
Arthur Kill; the Hudson, Raritan, Passaic, and Hackensack Rivers, and the tidal portions of the tributaries to
these bays and rivers. The Delaware River and Bay and other tidal streams of the Coastal Plain are also in the
coastal area, as is a narrow band of adjacent uplands in the Waterfront Development area beyond the CAFRA
area. Figure 5.9-1 shows the New Jersey coastline and coastal counties.
Figure 5.9-1. State of New Jersey Coastline and Coastal Counties
Source: Cooper et al. 2005

State of New Jersey 2014 Hazard Mitigation Plan
Page 5.9-3 Section 5.9. Nor’Easter
Extent
The extent of a Nor’Easter can be classified by meteorological measurements and by evaluating its societal
impacts. NOAA’s National Climatic Data Center (NCDC) is currently producing the Regional Snowfall Index
(RSI) for significant snowstorms that impact the eastern two-thirds of the United States. The RSI ranks
snowstorm impacts on a scale from one to five. It is based on the spatial extent of the storm, the amount of
snowfall, and the interaction of the extent and snowfall totals with population (based on the 2000 Census).
The NCDC has analyzed and assigned RSI values to over 500 storms since 1900 (NOAA-NCDC 2011). Table
5.9-1 presents the five categories.
Table 5.9-1. RSI Ranking Categories
Category Description RSI Value
1 Notable 1-3
2 Significant 3-6
3 Major 6-10
4 Crippling 10-18
5 Extreme 18.0+
Source: NOAA-NCDC 2011
RSI Regional Snowfall Index
Coastal Storm Frequency Caveats
Similar to flood and hurricanes, NOAA categorizes storms based on by return frequencies (e.g., this was a 100-
year storm, etc.). However, there are several shortcomings related to trying to categorize storms by return
frequencies. First, the historical record of storms is relatively short to accurately assess the true long-term
frequency of long period events. Most records only go back about 100 years. It is a little like sampling 20
ocean waves and making a conclusion of the full range of wave amplitudes in that part of the ocean. Second,
when it comes to coastal flood impacts, it is not a level playing field. Potential sea level rise changes the
vulnerability such that storms previously calculated at an average 100-year frequency will occur considerably
more often. Determining how well that can be quantified is dependent on the accuracy of sea level rise
predictions. Third, coastal flood impacts can vary significantly from one locality to another depending upon
such factors as onshore wind component and incidence of wave activity to the coastline. Fourth, a storm may
have been a 100-year storm for coastal flooding but a 10-year storm for wind, snowfall or rainfall. Also, the
impact of a storm can be compounded if it has multiple severe dimensions (e.g., major coastal flooding in
addition to very heavy snow and extreme winds) or if it impacts such a large area that mutual aid cannot be
exercised. Fifth, development along the coastline or in other vulnerable areas can significantly increase the
impact of a storm. Thus, the same storm in 1950 might not have generated the same amount of damage as now
with the increased coastal development.
In addition, there is a great deal of misunderstanding surrounding the reference to a “100-year storm” or a
return frequency of 100 years. Similar to the flood events, a 100-year storm event does not mean that one
should expect such a storm (or a storm of greater intensity) once every 100 years. Instead, a 100-year storm, to
use that frequency as an example, is best described as a 1% chance of a storm that magnitude occurring in any
given year. There might be two or three such storms in one, hundred year period and then no more for the next
200 or 300 years.

State of New Jersey 2014 Hazard Mitigation Plan
Page 5.9-4 Section 5.9. Nor’Easter
Previous Occurrences and Losses
New Jersey has a long history of Nor’Easters affecting the coastal communities and the rest of the State. Many
sources provided information regarding previous occurrences and losses in New Jersey associated with
Nor’Easter events. With so many sources reviewed for the purpose of this hazard mitigation plan (HMP), loss
and impact information for many events could vary depending on the source. Therefore, the accuracy of
monetary figures discussed is based only on the available information identified during research for this HMP.
The 2011 Plan discussed specific Nor’Easter events that occurred in New Jersey through 2007. For this 2014
Plan update, flood events were summarized for those that occurred between January 1, 2010, and December
31, 2012. Table 5.9-2 includes events discussed in the 2011 Plan and events that occurred between 2010 and
2012.
State of New Jersey 2014 Hazard Mitigation Plan
Page 5.9-5 Section 5.9. Nor’Easter
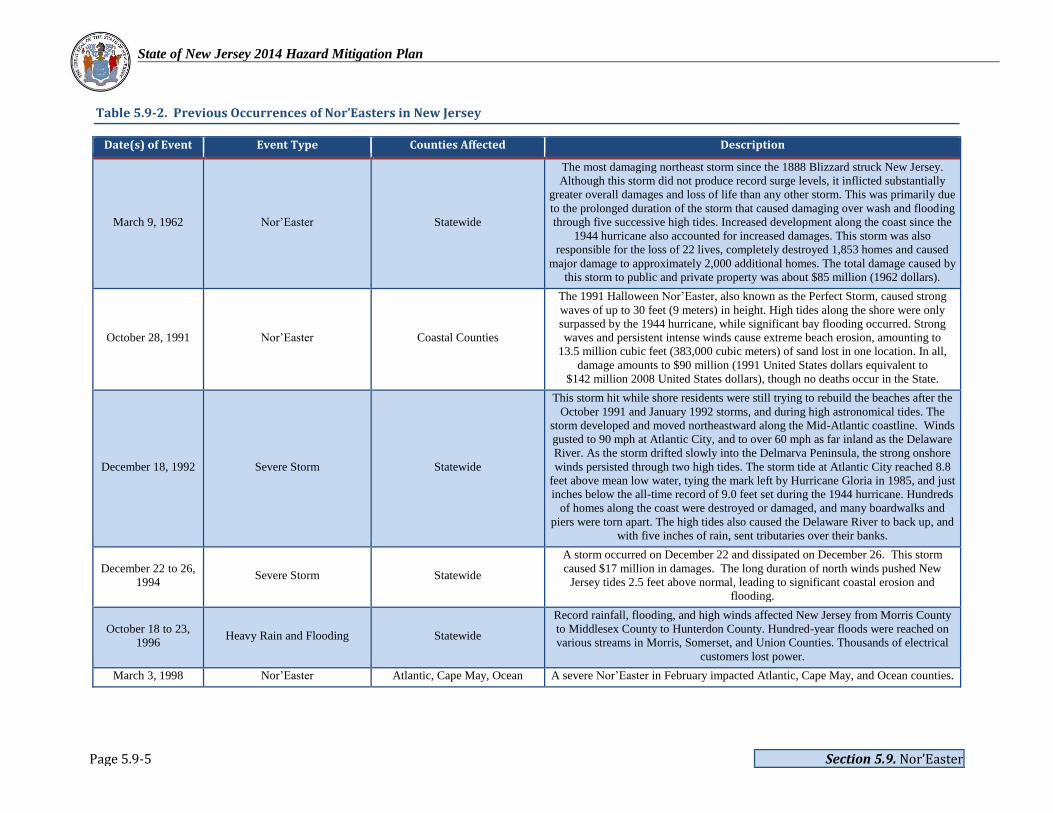
Table 5.9-2. Previous Occurrences of Nor’Easters in New Jersey
Date(s) of Event Event Type Counties Affected Description
March 9, 1962 Nor’Easter Statewide
The most damaging northeast storm since the 1888 Blizzard struck New Jersey.
Although this storm did not produce record surge levels, it inflicted substantially
greater overall damages and loss of life than any other storm. This was primarily due
to the prolonged duration of the storm that caused damaging over wash and flooding
through five successive high tides. Increased development along the coast since the
1944 hurricane also accounted for increased damages. This storm was also
responsible for the loss of 22 lives, completely destroyed 1,853 homes and caused
major damage to approximately 2,000 additional homes. The total damage caused by
this storm to public and private property was about $85 million (1962 dollars).
October 28, 1991 Nor’Easter Coastal Counties
The 1991 Halloween Nor’Easter, also known as the Perfect Storm, caused strong
waves of up to 30 feet (9 meters) in height. High tides along the shore were only
surpassed by the 1944 hurricane, while significant bay flooding occurred. Strong
waves and persistent intense winds cause extreme beach erosion, amounting to
13.5 million cubic feet (383,000 cubic meters) of sand lost in one location. In all,
damage amounts to $90 million (1991 United States dollars equivalent to
$142 million 2008 United States dollars), though no deaths occur in the State.
December 18, 1992 Severe Storm Statewide
This storm hit while shore residents were still trying to rebuild the beaches after the
October 1991 and January 1992 storms, and during high astronomical tides. The
storm developed and moved northeastward along the Mid-Atlantic coastline. Winds
gusted to 90 mph at Atlantic City, and to over 60 mph as far inland as the Delaware
River. As the storm drifted slowly into the Delmarva Peninsula, the strong onshore
winds persisted through two high tides. The storm tide at Atlantic City reached 8.8
feet above mean low water, tying the mark left by Hurricane Gloria in 1985, and just
inches below the all-time record of 9.0 feet set during the 1944 hurricane. Hundreds
of homes along the coast were destroyed or damaged, and many boardwalks and
piers were torn apart. The high tides also caused the Delaware River to back up, and
with five inches of rain, sent tributaries over their banks.
December 22 to 26,
1994 Severe Storm Statewide
A storm occurred on December 22 and dissipated on December 26. This storm
caused $17 million in damages. The long duration of north winds pushed New
Jersey tides 2.5 feet above normal, leading to significant coastal erosion and
flooding.
October 18 to 23,
1996 Heavy Rain and Flooding Statewide
Record rainfall, flooding, and high winds affected New Jersey from Morris County
to Middlesex County to Hunterdon County. Hundred-year floods were reached on
various streams in Morris, Somerset, and Union Counties. Thousands of electrical
customers lost power.
March 3, 1998 Nor’Easter Atlantic, Cape May, Ocean A severe Nor’Easter in February impacted Atlantic, Cape May, and Ocean counties.

State of New Jersey 2014 Hazard Mitigation Plan
Page 5.9-6 Section 5.9. Nor’Easter
Table 5.9-2. Previous Occurrences of Nor’Easters in New Jersey
Date(s) of Event Event Type Counties Affected Description
October 16, 2002 Nor’Easter Monmouth, Ocean
A strong northeaster caused minor to locally moderate tidal flooding along the New
Jersey coast and in the back bays, wind gusts to around 50 mph and beach erosion.
Tides, winds and erosion were worse in Ocean and Monmouth Counties than farther
south. Inland the heavy rain on the 16th coupled with the heavy rains on the 10th and
11th softened the ground and wind gusts of around 45 mph pushed over several trees.
The trees subsequently pulled down wires and about 6,200 Jersey Central Power and
Light and Conectiv Power Delivery customers lost power.
November 22, 2005 High Wind Statewide
The northwest flow around an intensifying northeaster brought strong and in a few
instances high winds to New Jersey during the late morning and early afternoon on
November 22. Peak wind gusts averaged around 45 mph inland and 50 to 60 mph
along the ocean and southern parts of Delaware Bay. Downed tree limbs in East
Brunswick (Middlesex County) caused outages to around 500 homes and caused
travel disruptions because of non-working street lights.
March 16 to 17, 2007 Nor’Easter Atlantic, Burlington, Cape May,
Ocean, Monmouth
The combination of a strong high pressure system to the north and a Nor’Easter low
pressure system that passed to the east of New Jersey, produced strong to high winds
along coastal areas from Ocean County southward. It also caused heavy rain to fall
during the afternoon and evening on the 16th across southeast New Jersey and minor
tidal flooding during the morning high tide on the 17th. Storm totals averaged 1.5 to
3.0 inches across southeast New Jersey.
April 16, 2007 Nor’Easter Statewide
In the wake of the departing Nor’Easter, the combination of strong winds, snow on
tree limbs and heavy rain loosening the ground caused many tree limbs, trees and
wires to be knocked down on April 16. The strong winds caused about 120,000
homes and businesses in the state to lose power.
May 12, 2008 Nor’Easter Atlantic, Cape May, Cumberland,
Middlesex, Monmouth, Ocean
The Nor’Easter on May 12 downed trees and wires, and flooded streets in dozens of
beach municipalities. Tidal flooding forced the closure of schools and roads in parts
of coastal New Jersey on May 12 and 13. In Stafford (Ocean County), a truck that
was buffeted by the winds got stuck on the Route 72 causeway bridge and blocked
traffic. In Ocean County, widespread problems were reported from Stafford
Township to Bass River Township due to downed power lines and trees on May 12,
most of which were considered nuisances and annoyances. Tidal flooding was
widespread along the New Jersey Shore, in the minor to moderate range.
November 12 to 13,
2009 Nor’Easter Statewide
A powerful Nor’Easter produced wind gusts to nearly 60 mph, widespread moderate
tidal flooding, heavy rain and severe beach erosion along the New Jersey coast from
November 12th through the 14th. Initial damage estimates were placed at $180
million. By several measures this was one of the worst Nor’Easters to affect New
Jersey since 1990.
State of New Jersey 2014 Hazard Mitigation Plan
Page 5.9-7 Section 5.9. Nor’Easter
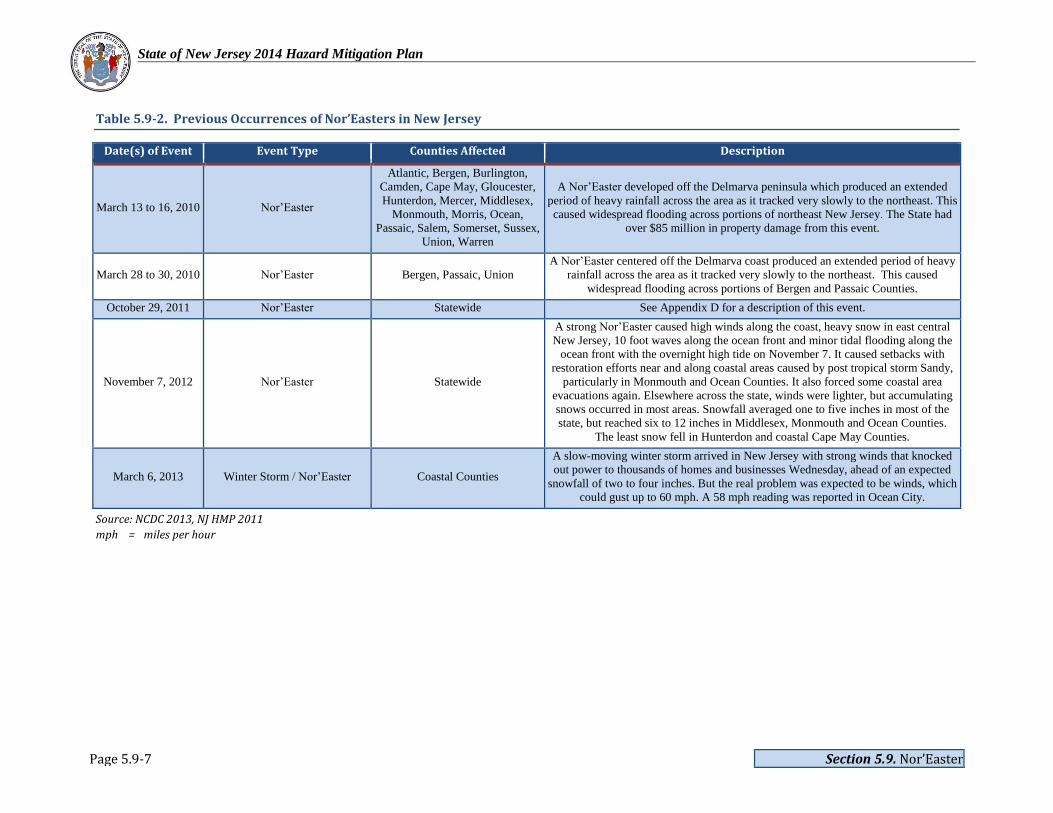
Table 5.9-2. Previous Occurrences of Nor’Easters in New Jersey
Date(s) of Event Event Type Counties Affected Description
March 13 to 16, 2010 Nor’Easter
Atlantic, Bergen, Burlington,
Camden, Cape May, Gloucester,
Hunterdon, Mercer, Middlesex,
Monmouth, Morris, Ocean,
Passaic, Salem, Somerset, Sussex,
Union, Warren
A Nor’Easter developed off the Delmarva peninsula which produced an extended
period of heavy rainfall across the area as it tracked very slowly to the northeast. This
caused widespread flooding across portions of northeast New Jersey. The State had
over $85 million in property damage from this event.
March 28 to 30, 2010 Nor’Easter Bergen, Passaic, Union
A Nor’Easter centered off the Delmarva coast produced an extended period of heavy
rainfall across the area as it tracked very slowly to the northeast. This caused
widespread flooding across portions of Bergen and Passaic Counties.
October 29, 2011 Nor’Easter Statewide See Appendix D for a description of this event.
November 7, 2012 Nor’Easter Statewide
A strong Nor’Easter caused high winds along the coast, heavy snow in east central
New Jersey, 10 foot waves along the ocean front and minor tidal flooding along the
ocean front with the overnight high tide on November 7. It caused setbacks with
restoration efforts near and along coastal areas caused by post tropical storm Sandy,
particularly in Monmouth and Ocean Counties. It also forced some coastal area
evacuations again. Elsewhere across the state, winds were lighter, but accumulating
snows occurred in most areas. Snowfall averaged one to five inches in most of the
state, but reached six to 12 inches in Middlesex, Monmouth and Ocean Counties.
The least snow fell in Hunterdon and coastal Cape May Counties.
March 6, 2013 Winter Storm / Nor’Easter Coastal Counties
A slow-moving winter storm arrived in New Jersey with strong winds that knocked
out power to thousands of homes and businesses Wednesday, ahead of an expected
snowfall of two to four inches. But the real problem was expected to be winds, which
could gust up to 60 mph. A 58 mph reading was reported in Ocean City.
Source: NCDC 2013, NJ HMP 2011
mph = miles per hour
State of New Jersey 2014 Hazard Mitigation Plan
Page 5.9-8 Section 5.9. Nor’Easter
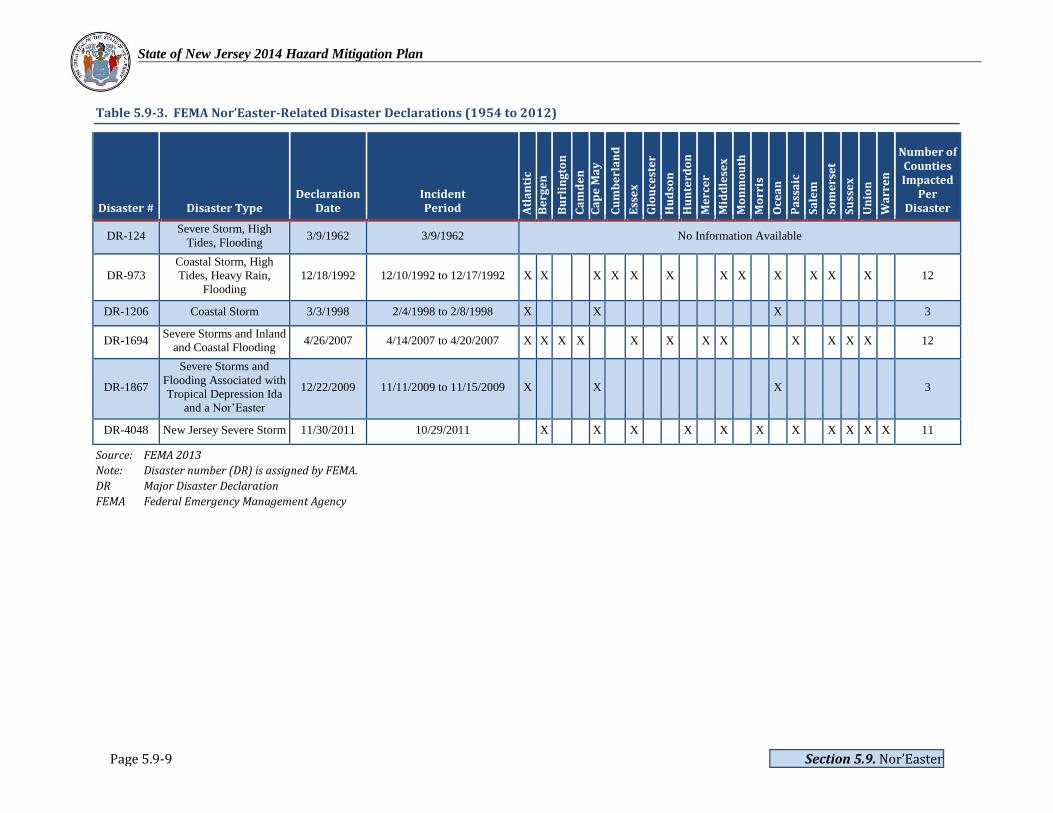
FEMA Disaster Declarations
Between 1954 and 2012, FEMA declared that the State of New Jersey experienced six Nor’Easter-related
disasters (DR) or emergencies (EM) classified as one or a combination of the following disaster types: severe
storm, high tide, flooding, coastal storm, heavy rain, inland and coastal flooding, and tropical depression.
Generally, these disasters cover a wide region of the State; therefore, they can impact many counties.
However, not all counties were included in the disaster declarations as determined by FEMA (FEMA 2013).
Table 5.9-3 identifies known flooding events that have affected New Jersey and were declared a FEMA
disaster. This table provides information on the FEMA disaster declarations for Nor’Easters, including the
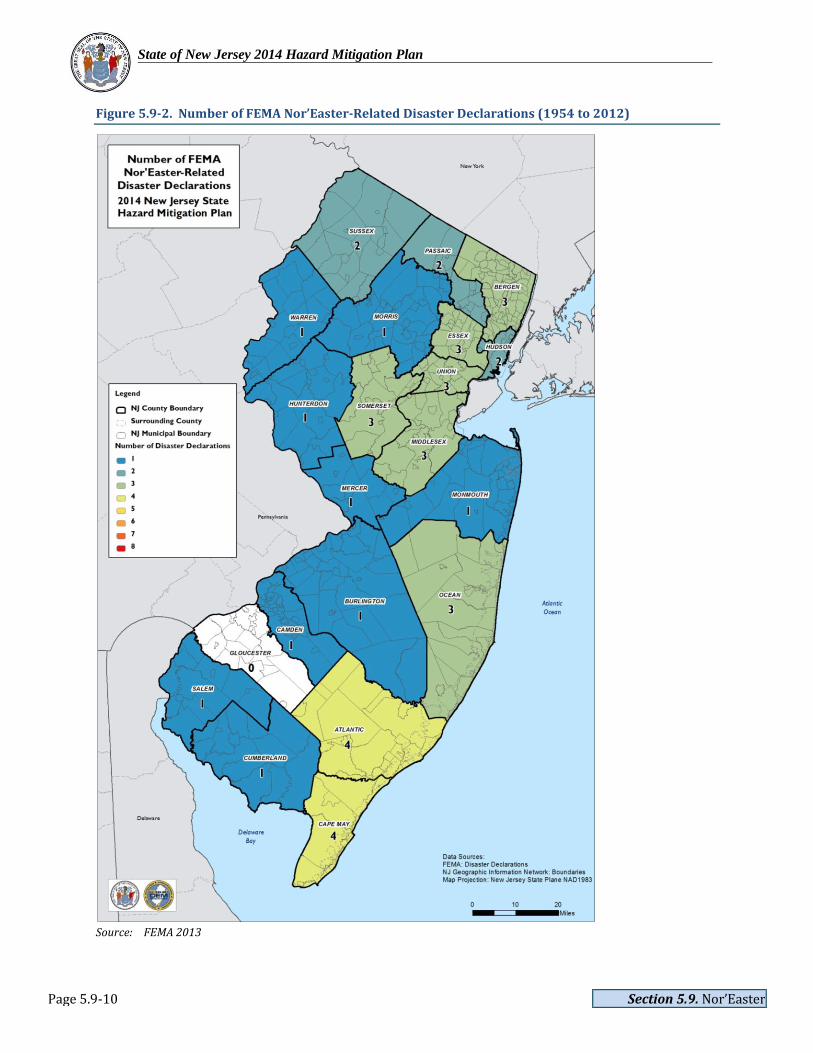
disaster number, disaster type, declaration and incident dates, and counties included in the declaration.
Figure 5.9-2 illustrates the number of FEMA declared disasters by county.
Detailed information about the declared disasters is provided in Appendix D of this Plan.
State of New Jersey 2014 Hazard Mitigation Plan
Page 5.9-9 Section 5.9. Nor’Easter
Table 5.9-3. FEMA Nor’Easter-Related Disaster Declarations (1954 to 2012)
Disaster # Disaster Type
Declaration Date
Incident Period A
tla
nti
c
Be
rge
n
Bu
rlin
gto
n
Ca
md
en
Ca
pe
Ma
y
Cu
mb
erl
an
d
Ess
ex
Glo
uce
ste
r
Hu
dso
n
Hu
nte
rdo
n
Me
rce
r
Mid
dle
sex
Mo
nm
ou
th
Mo
rris
Oce
an
Pa
ssa
ic
Sa
lem
So
me
rse
t
Su
sse
x
Un
ion
Wa
rre
n
Number of Counties Impacted
Per Disaster
DR-124 Severe Storm, High
Tides, Flooding 3/9/1962 3/9/1962 No Information Available
DR-973
Coastal Storm, High
Tides, Heavy Rain,
Flooding
12/18/1992 12/10/1992 to 12/17/1992 X X X X X X X X X X X X 12
DR-1206 Coastal Storm 3/3/1998 2/4/1998 to 2/8/1998 X X X 3
DR-1694 Severe Storms and Inland
and Coastal Flooding 4/26/2007 4/14/2007 to 4/20/2007 X X X X X X X X X X X X 12
DR-1867
Severe Storms and
Flooding Associated with
Tropical Depression Ida
and a Nor’Easter
12/22/2009 11/11/2009 to 11/15/2009 X X X 3
DR-4048 New Jersey Severe Storm 11/30/2011 10/29/2011 X X X X X X X X X X X 11
Source: FEMA 2013
Note: Disaster number (DR) is assigned by FEMA.
DR Major Disaster Declaration
FEMA Federal Emergency Management Agency
State of New Jersey 2014 Hazard Mitigation Plan
Page 5.9-10 Section 5.9. Nor’Easter
Figure 5.9-2. Number of FEMA Nor’Easter-Related Disaster Declarations (1954 to 2012)
Source: FEMA 2013
State of New Jersey 2014 Hazard Mitigation Plan
Page 5.9-11 Section 5.9. Nor’Easter
Probability of Future Occurrences
As with any weather phenomenon, it is nearly impossible to assign probabilities to Nor’Easters, except over
the long-term. High activity seasons are when storm activity exceeds the historical 75th
percentile. This means
that seasons with this number of storms are expected to occur during one out of four years. Lower activity
seasons are defined as when storm activity falls below the historical 75th percentile; meaning this number of
storms are expected to occur during three out of four years (East Coast Winter Storms, 2013).
Severity
Nor’Easters have the potential to impact society to a greater extent than hurricanes and tornadoes. These
storms often have a diameter three to four times larger than a hurricane and therefore, impact much larger
areas. More homes and properties become susceptible to damage as the size and strength of a Nor’Easter
intensifies (Storm Solution, 2013). The severity of a Nor’Easter depends on several factors including a
region’s climatological susceptibility to snowstorms, snowfall amounts, snowfall rates, wind speeds,
temperatures, visibility, storm duration, topography, time of occurrence during the day (e.g., weekday versus
weekend), and time of season.
Warning Time
Meteorologists can often predict the likelihood of a Nor’Easter event. The NWS monitors potential Nor’Easter
events and provides forecasts and information between five and seven days in advance of the storm in order to
help prepare for the incident.
Secondary Hazards
Nor’Easters bring winds, high tides, beach erosion, flooding, freezing and heavy rain, or snow (NOAA 2013).
Nor’Easters are common in winter in New Jersey and the greater Mid-Atlantic region. They repeatedly result
in flooding, various degrees of wave and erosion damage to structures, and erosion of natural resources, such
as beaches, dunes, and coastal bluffs. The erosion of coastal features commonly results in greater potential for
damage to shoreline development from future storms.
Perhaps the greatest concern in New Jersey is coastal erosion from Nor’Easters. Several of the recent
Nor’Easters have done tremendous damage to the New Jersey shore. An example of this was the 1991
Halloween Nor’Easter which caused extreme beach erosion in excess of 13.5 million cubic feet of sand loss.
Coastal communities spend millions of dollars to mitigate coastal erosion resulting from Nor’Easters. Another
issue of concern is the destruction of dune and other protection structures at beaches. In the case of the 2012
Nor’Easter, several coastal communities were evacuated because the dunes were destroyed during Superstorm
Sandy.
Another secondary effect is the potential for extensive coastal and inland flooding due to strong winds and
heavy precipitation. This secondary effect was evident during the April 2007 Nor’Easter when heavy flooding
occurred throughout the State. Flooding may also cause environmental contamination issues when facilities
producing or storing hazardous materials are flooded.
Widespread utility failure is another potential secondary effect of Nor’Easters. The high winds and often
heavy wet snow associated with these storms have the potential to cause power outages and other service
interruptions. Due to the size and intensity of Nor’Easters, power outages are often widespread and demand to
restore power is great following cold-weather storms. In the event of extended service interruptions, another
cascading event is the effect of extreme cold temperatures on vulnerable populations in the State and the
potential for loss of life.

State of New Jersey 2014 Hazard Mitigation Plan
Page 5.9-12 Section 5.9. Nor’Easter
Climate Change Impacts
Providing projections of future climate change for a specific region is challenging. Shorter term projections are
more closely tied to existing trends making longer term projections even more challenging. The further out a
prediction reaches, the more subject to changing dynamics it becomes.
The New Jersey Climate Adaptation Alliance is a network of policymakers, public and private-sector
practitioners, academics, non-governmental organizations (NGO), and business leaders aligned to build
climate change preparedness in the state of New Jersey. The Alliance is facilitated by Rutgers University,
which provides science and technical support, facilitates the Alliance’s operations and advances its
recommendations. A document titled Change in New Jersey: Trends and Projections were developed to
identify recommendations for State and local public policy that will be designed to enhance climate change
preparedness and resilience in New Jersey (Rutgers 2013).
Temperatures in the Northeast United States have increased 1.5 degrees Fahrenheit (°F) on average since 1900.
Most of this warming has occurred since 1970. The State of New Jersey, for example, has observed an increase
in average annual temperatures of 1.2°F between the period of 1971-2000 and the most recent decade of 2001-
2010 (ONJSC, 2011). Winter temperatures across the Northeast have seen an increase in average temperature
of 4°F since 1970 (Northeast Climate Impacts Assessment [NECIA] 2007). By the 2020s, the average annual
temperature in New Jersey is projected to increase by 1.5°F to 3°F above the statewide baseline (1971 to
2000), which was 52.7°F. By 2050, the temperature is projected to increase 3°F to 5°F (Sustainable Jersey
Climate Change Adaptation Task Force 2013).
Precipitation measurements indicate both northern and southern New Jersey have become wetter over the past
century. Northern New Jersey’s 1971-2000 precipitation average was over five inches (12%) greater than the
average from 1895-1970. Southern New Jersey became two inches (5%) wetter late in the 20th century (Office
of New Jersey State Climatologist). Average annual precipitation is projected to increase in the region by 5%
by the 2020s and up to 10% by the 2050s. Most of the additional precipitation is expected to come during the
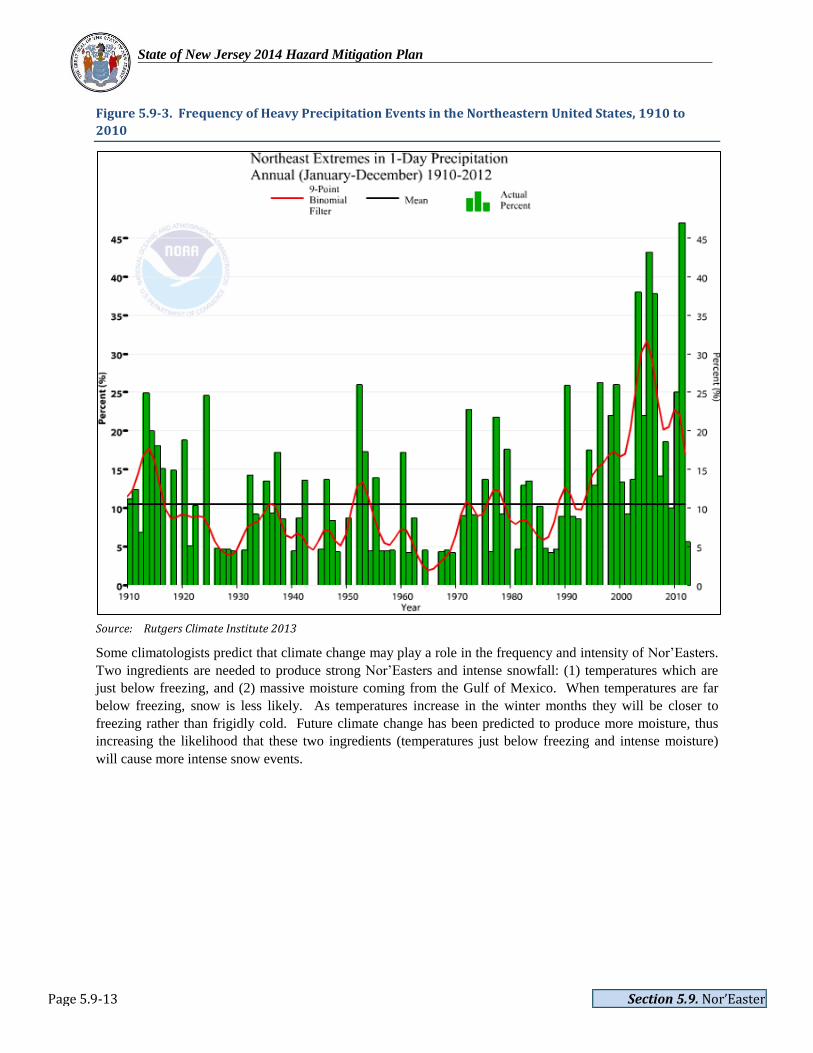
winter months (New York City Panel on Climate Change [NYCPCC] 2009). Figure 5.9-3 shows the frequency
of heavy precipitation events in the northeastern United States.
State of New Jersey 2014 Hazard Mitigation Plan
Page 5.9-13 Section 5.9. Nor’Easter
Figure 5.9-3. Frequency of Heavy Precipitation Events in the Northeastern United States, 1910 to
2010
Source: Rutgers Climate Institute 2013
Some climatologists predict that climate change may play a role in the frequency and intensity of Nor’Easters.
Two ingredients are needed to produce strong Nor’Easters and intense snowfall: (1) temperatures which are
just below freezing, and (2) massive moisture coming from the Gulf of Mexico. When temperatures are far
below freezing, snow is less likely. As temperatures increase in the winter months they will be closer to
freezing rather than frigidly cold. Future climate change has been predicted to produce more moisture, thus
increasing the likelihood that these two ingredients (temperatures just below freezing and intense moisture)
will cause more intense snow events.
State of New Jersey 2014 Hazard Mitigation Plan
Page 5.9-14 Section 5.9. Nor’Easter
5.9.2 Vulnerability Assessment
To understand risk, the assets exposed to the hazard areas are identified. For the Nor’Easter hazard, the entire
State of New Jersey is exposed, specifically to the wind and rain/snow associated with these events. However,
certain areas (such as along the coast), and types of building and infrastructure (based on construction) could
be at greater risk than others. Storm surges from a Nor’Easter pose one of the greatest risks to residents and
property.
There are many similarities between Nor’Easter and hurricane events. Both types of events can bring high
winds and surge inundation resulting in similar impacts on the population, structures, and the economy. Refer
to Section 5.8 for a detailed and quantitative assessment on the wind and storm surge hazards using Hazards
U.S. Multi-hazard (HAZUS-MH). The section below discusses Nor’Easter events in a qualitative nature.
Assessing Vulnerability by Jurisdiction
The impact of a Nor’Easter on life, health and safety is dependent upon several factors including the severity of
the event and whether or not adequate warning time was provided to residents. Typically, a Nor’Easter has a
longer duration (potentially lasting days) than a hurricane or tropical storm event, which normally pass through
an area in a matter of hours. It is assumed that the entire State’s population could be exposed to this hazard
(wind and rain/snow) associated with a Nor’Easter. Refer to Figures 5.8-5 and 5.8-6 in Section 5.8 (Hurricane
and Tropical Storm) which display the peak gust wind speeds of the 100- and 500-year mean return period
probabilistic wind events modeled in HAZUS-MH.
A Nor’Easter surge inundation zone does not exist to estimate the population and assets exposed for this
hazard. To estimate the population and area exposed to storm surge, the Sea, Lake, and Overland Surges from
Hurricanes (SLOSH) model Category 1 through 4 zones were overlaid upon the 2010 Census block population
data in geographic information systems (GIS) (United States Census 2010). Census blocks do not follow the
boundaries of the SLOSH model. The Census blocks with their centroid in the SLOSH boundaries were used
to calculate the estimated population exposed to the hurricane surge hazard. Refer to Section 5.8 (Hurricane
and Tropical Storm) which summarizes the 2010 Census population and area located in the Category 1 through
4 SLOSH zones by county. As discussed in Section 5.8, 15 of the 21 counties have population exposed and
potentially vulnerable to storm surge: Atlantic, Bergen, Burlington, Camden, Cape May, Cumberland, Essex,
Gloucester, Hudson, Mercer, Middlesex, Monmouth, Ocean, Salem, and Union Counties. Cape May County
has the greatest percent of area in the inundation zones, ranging from 40% (Category 1) to greater than 75%
(Category 4). Vulnerability to the wind and storm surge impacts of Nor’Easters in New Jersey is
geographically comparable with the vulnerability to hurricanes.
Assessing Vulnerability to State Facilities
All state-owned and -leased buildings are exposed to the wind and/or rain/snow from the Nor’Easter hazard.
State buildings, critical facilities, and infrastructure at greatest risk are those that may be impacted by a storm
surge. Refer to Tables 5.8-8 through 5.8-20 in Section 5.8 (Hurricane and Tropical Storms) which summarize
the State’s facilities, critical facilities, and infrastructure located in Category 1 through 4 zones. A total of 594
state-owned or -leased structures, or approximately 20%, are located within the SLOSH inundation zones. The
Department of Corrections has the highest number of potentially vulnerable structures (300) located in the
Category 4 zone. However, it should be noted that the Department of Corrections also has the highest number
of state buildings (refer to Table 5.1-8 in Section 5.1).
State of New Jersey 2014 Hazard Mitigation Plan
Page 5.9-15 Section 5.9. Nor’Easter
Estimating Potential Losses by Jurisdiction
In addition to threatening life and safety, Nor’Easter events can greatly impact the economy, including: loss of
business function, damage to inventory (utility outages), relocation costs, wage loss, and rental loss due to the
repair/replacement of buildings. Damages to buildings can impact a community’s economy and tax base.
Further, residents may be displaced or require temporary to long-term sheltering. Refer to Section 5.8
(Hurricane and Tropical Storm) for estimated potential loss statistics by county as a result of wind and surge
events. In summary, HAZUS-MH estimates Cape May, Atlantic and Cumberland Counties will experience the
greatest potential building damage as a result of a 100-year probabilistic wind event. As a result of a 500-year
wind event, HAZUS-MH estimates Cape May and Cumberland Counties will experience the greatest estimated
potential building damage. In terms of storm surge, the following counties have buildings at risk to damage
from storm surge: Atlantic, Bergen, Burlington, Cape May, Cumberland, Essex, Gloucester, Hudson,
Middlesex, Monmouth, Ocean, Passaic, Salem and Union.
Estimating Potential Losses to State Facilities
As discussed above, Nor’Easter events can impact structures and the economy. Damages to buildings and
infrastructure, utility outages, and roadways impassable due to snow or flood/surge can lead to closures of
State buildings. These closures impact the services they provide and hinder response time for critical
emergency services. Refer to Section 5.8 (Hurricane and Tropical Storm) for a detailed discussion on potential
losses to state buildings, critical facilities, and infrastructure due to winds and storm-surge flooding.
Environmental Impacts
A Nor’Easter’s environmental impacts are similar to that of a hurricane or tropical storm event. Refer to
Section 5.8 (Hurricane and Tropical Storm) for additional information. However, because these events tend to
be longer in duration their impacts may be greater. In addition, depending upon the time of year, the
precipitation that accompanies a Nor’Easter may be snow or ice. Snow or ice accumulation may down
vegetation and damage landscaping and habitat. Further, snowmelt will recharge groundwater but may
contribute to localized flooding. Refer to Section 5.11 (Severe Winter Weather) for additional information.