section a - fin.gov.on.ca
TRANSCRIPT

FISCAL REVIEW
ONTARIO ECONOMIC OUTLOOK A N D
2011
BACKGROUND PAPERS
The Honourable D W I G H T D U N C A NMinister of Finance


FISCAL REVIEW
ONTARIO ECONOMIC OUTLOOK A N D
2011
BACKGROUND PAPERS
The Honourable D W I G H T D U N C A NMinister of Finance
For general inquiries regarding the 2011 Ontario Economic Outlook and Fiscal Review, Background Papers, please call:
Toll-free English & French inquiries: 1-800-337-7222Teletypewriter (TTY): 1-800-263-7776
For electronic copies of this document, visit our website atwww.fin.gov.on.ca
A printed copy of this publication can be ordered:Online at: www.serviceontario.ca/publicationsBy phone through the ServiceOntario Contact CentreMonday to Friday, 8:30 AM to 5:00 PM416 326-5300 416 325-3408 (TTY) 1 800 668-9938 Toll-free across Canada 1 800 268-7095 TTY Toll-free across Ontario
© Queen’s Printer for Ontario, 2011ISSN 1483-5967 (Print)ISSN 1496-2829 (PDF/HTML)
Ce document est disponible en français sous le titre :Perspectives économiques et revue financière de l’Ontario de 2011, Documents d’information

Table of Contents
iii
Contents
Foreword ..................................................................................................................... xi Producing Results ............................................................................................... xii Jobs and the Economy........................................................................................ xii Slower Global Economic Growth........................................................................ xiii Lower Rate of Spending Growth ........................................................................ xiii Meeting the Challenge Through Reform ............................................................ xiv Healthy Homes Renovation Tax Credit ............................................................... xv
Conclusion.................................................................................................................. xv
Chapter I: Creating Ontario Jobs in an Uncertain Global Economy
Highlights......................................................................................................................3
Overview ......................................................................................................................6 Ontario’s Performance Affected by Global Developments ....................................7
Changes in the Economy .............................................................................................8
Building Ontario’s Clean Energy Future .....................................................................11
The Tax Plan for Jobs and Growth.............................................................................12
Auto Sector.................................................................................................................14
Infrastructure ..............................................................................................................15
Financial Services ......................................................................................................15
Mining and Opportunities in Ontario’s Ring of Fire.....................................................16
Producing Results ......................................................................................................17 Preparing Ontarians for Jobs ..............................................................................17 Health Care .........................................................................................................21

2011 Ontario Economic Outlook and Fiscal Review
iv
Chapter II: Ontario’s Economic Outlook
Highlights ...................................................................................................................25
Overview ....................................................................................................................27
Recent Economic Developments ...............................................................................29
The Challenging Global Economic Environment ........................................................32 European Sovereign Debt...................................................................................32 Global Economic Outlook Weakening.................................................................34 U.S. Economy .....................................................................................................35 Oil Prices.............................................................................................................38 The Canadian Dollar ...........................................................................................40 Financial Markets................................................................................................41
Outlook for Ontario Economic Growth........................................................................44 Details of the Ontario Economic Outlook ............................................................51 Private-Sector Forecasts.....................................................................................52 Comparison to the 2011 Ontario Budget.............................................................53
Chapter III: Fiscal Outlook
Highlights ...................................................................................................................57
Section A: Overview
Section B: 2011–12 Fiscal Performance
2011–12 Revenue Changes Since the 2011 Budget .................................................63 Details of 2011–12 In-Year Revenue Changes...................................................63
2011–12 Expense Changes Since the 2011 Budget..................................................65 Details of 2011–12 In-Year Expense Changes ...................................................65
Section C: Ontario’s Medium-Term Fiscal Outlook
Medium-Term Revenue Outlook ................................................................................67 Medium-Term Revenue Changes Since the 2011 Budget ..................................69
Medium-Term Expense Outlook.................................................................................70
Medium-Term Fiscal Outlook .....................................................................................71

Table of Contents
v
Section D: Federal–Provincial Fiscal Arrangements
Section E: Details of Ontario’s Finances
Chapter IV: Borrowing and Debt Management
Highlights....................................................................................................................89
Long-Term Public Borrowing......................................................................................90
Debt............................................................................................................................95
Total Debt Composition..............................................................................................95
Debt-to-GDP Ratios ...................................................................................................96
Cost of Debt ...............................................................................................................99
Risk Exposure ............................................................................................................99
Chapter V: Taxation and Pensions
Highlights..................................................................................................................105
Creating Jobs and Helping Ontarians.......................................................................106
Healthy Homes Renovation Tax Credit ....................................................................107
Tax Relief for Businesses.........................................................................................109 Strengthening Accountability and Transparency of Tax Expenditures ..............110 Federal Support for Research and Development ..............................................111
Securing Our Retirement Future ..............................................................................113
Chapter VI: Pre-Budget Consultations
How to Participate in the 2012 Pre-Budget Consultations........................................117 Written Submissions .........................................................................................117 Online Submissions ..........................................................................................118

2011 Ontario Economic Outlook and Fiscal Review
vi
Tables
Chapter I: Creating Ontario Jobs in an Uncertain Global Economy
Table 1. Global Financial Centres Index Ranking: Toronto Enters the Top 10.............................................................16
Chapter II: Ontario’s Economic Outlook
Table 1. Ontario Economic Outlook.............................................................28
Table 2. Tracking Ontario’s Economic Recovery.........................................30
Table 3. Outlook for External Factors ..........................................................42
Table 4. Impacts of Sustained Changes in Key External Factors on Ontario’s Real GDP Growth......................................................43
Table 5. The Ontario Economy, 2009 to 2014.............................................51
Table 6. Private-Sector Forecasts for Ontario Real GDP Growth................52
Table 7. Changes in Key Economic Forecast Assumptions 2011 Fall Economic Statement Compared to 2011 Budget ...........53
Chapter III: Fiscal Outlook
Table 1. 2011–12 In-Year Fiscal Performance ............................................62
Table 2. Summary of Revenue Changes Since the Budget ........................63
Table 3. Summary of Expense Changes Since the Budget.........................65
Table 4. Summary of Medium-Term Revenue Outlook ...............................67
Table 5. Summary of Medium-Term Revenue Changes Since the Budget ...........................................................................69
Table 6. Medium-Term Fiscal Plan and Outlook .........................................77
Table 7. Revenue ........................................................................................78
Table 8. Total Expense................................................................................79
Table 9. Other Expense...............................................................................80
Table of Contents
vii
Table 10. 2011–12 Infrastructure Expenditures.............................................81
Table 11. Ten-Year Review of Selected Financial and Economic Statistics........................................................................82
Chapter IV: Borrowing and Debt Management
Table 1. 2011–12 Borrowing Program: Province and Ontario Electricity Financial Corporation (OEFC) .......................................................93
Table 2. Medium-Term Borrowing Outlook: Province and Ontario Electricity Financial Corporation (OEFC) .......................................................94

2011 Ontario Economic Outlook and Fiscal Review
viii
Charts
Chapter I: Creating Ontario Jobs in an Uncertain Global Economy
Chart 1. Global Economic Growth Forecasts Weakening .............................7
Chart 2. 10-Year Government Bond Yields ...................................................9
Chart 3. Sustained Gains in Business Machinery and Equipment Spending .....................................................................13
Chart 4. Ontario Vehicle Production ............................................................14
Chart 5. Percentage of Grade 3 and 6 Students Achieving Provincial Standard in Reading, Writing and Math ........................18
Chart 6. More Adults Have Postsecondary Credentials ..............................20
Chapter II: Ontario’s Economic Outlook
Chart 1. Private-Sector Economic Forecasts for Ontario Softening...........................................................................27
Chart 2. Job Recovery in Ontario ................................................................31
Chart 3. European Debt ..............................................................................32
Chart 4. Weakening Global Economic Growth Forecasts ...........................34
Chart 5. U.S. Recession Deeper and Recovery Slower ..............................35
Chart 6. U.S. Light Motor Vehicle Sales Continue to Grow .........................37
Chart 7. Continued High Oil Prices Expected..............................................39
Chart 8. Canadian Dollar to Remain Close to Parity ...................................40
Chart 9. Interest Rates to Rise ....................................................................41
Chart 10. Contributions to Real GDP Growth in 2011 ...................................44
Chart 11. Ontario Real GDP Growth .............................................................45
Chart 12. Increasing Employment .................................................................46
Chart 13. Lower Unemployment Rate ...........................................................46
Chart 14. Sustained Gains in Household Spending ......................................47

Table of Contents
ix
Chart 15. Sustained Gains in Business Machinery and Equipment Spending .....................................................................48
Chart 16. Housing Starts to Remain Strong ..................................................49
Chapter III: Fiscal Outlook
Chart 1. Ontario’s Medium-Term Fiscal Outlook .........................................60
Chart 2. Net Cost of Equalization to Ontarians (2011–12) ..........................74
Chart 3. Ontario’s Medium-Term Fiscal Outlook .........................................77
Chart 4. Composition of Revenue, 2011–12................................................84
Chart 5. Composition of Total Expense, 2011–12 .......................................85
Chart 6. Composition of Program Expense, 2011–12 .................................85
Chapter IV: Borrowing and Debt Management
Chart 1. 2011–12 Borrowing — Canadian Dollar Market ............................91
Chart 2. 2011–12 Borrowing — International Markets.................................92
Chart 3. Total Debt Composition as at September 30, 2011 .......................96
Chart 4. Net Debt-to-GDP ...........................................................................97
Chart 5. Accumulated Deficit-to-GDP..........................................................98
Chart 6. Effective Interest Rate (Weighted Average) on Total Debt .................................................................................99
Chart 7. Net Interest Rate Resetting Exposure .........................................100
Chart 8. Foreign Exchange Exposure .......................................................101

2011 Ontario Economic Outlook and Fiscal Review
x

Foreword
xi
Foreword
Ontarians are witnessing a time of significant global change, upheaval and uncertainty in countries around the world. The extraordinary challenges facing the global economy require extraordinary efforts from everyone both at home and abroad. These are serious times and they call for a serious plan.
Job loss is hard on families. When an economy shrinks, or grows by less than forecast, real people are affected. Some of Ontario’s families are going through a hard time in today’s economic uncertainty. Building a stronger, more competitive economy is about more than improving forecasts and numbers. It is about helping people get good, high-paying jobs. It is also about building an economy that supports strong schools and hospitals.
Ontario has made tremendous progress over the last eight years in building the world’s best-educated workforce. Working together, Ontarians now need to ensure that workers can get the good, high-paying jobs they deserve. This includes youth who are graduating from Ontario’s world-class education system. That is why the McGuinty government continues its focus on strengthening Ontario’s economy and job creation.
In spite of global economic uncertainty, Ontario has experienced moderate economic growth for most of the last two years. In many ways, Ontario has recovered from the global economic recession, while other places continue to be subjected to much greater volatility. The European economy continues to present new challenges while growth in the United States, Ontario’s largest trading partner, remains vulnerable to setbacks.
Around the world, people are worried about jobs and the global economy. Here in Ontario, the impact on families of the continuing global economic uncertainty remains a concern.
2011 Ontario Economic Outlook and Fiscal Review
xii
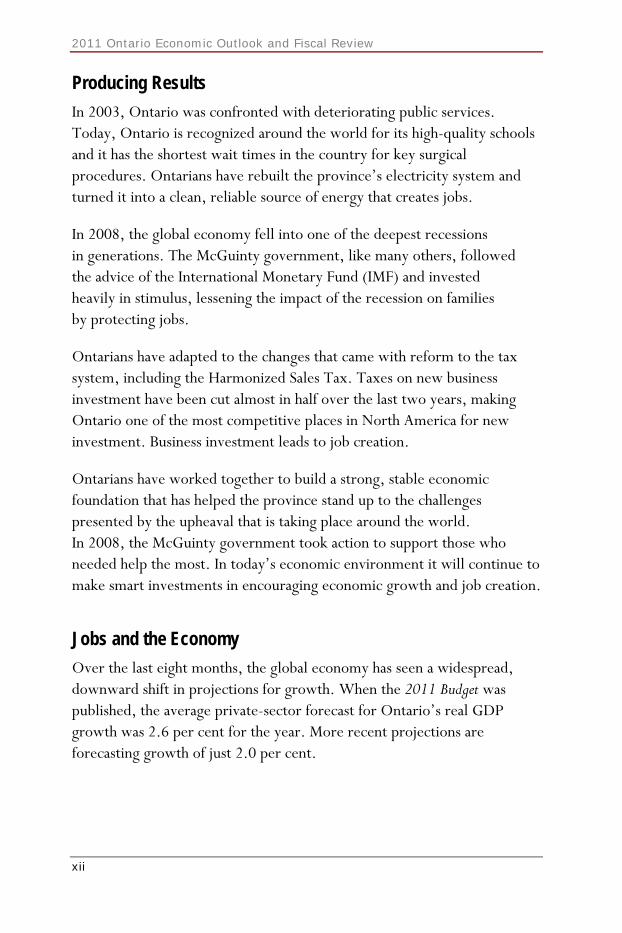
Producing Results
In 2003, Ontario was confronted with deteriorating public services. Today, Ontario is recognized around the world for its high-quality schools and it has the shortest wait times in the country for key surgical procedures. Ontarians have rebuilt the province’s electricity system and turned it into a clean, reliable source of energy that creates jobs.
In 2008, the global economy fell into one of the deepest recessions in generations. The McGuinty government, like many others, followed the advice of the International Monetary Fund (IMF) and invested heavily in stimulus, lessening the impact of the recession on families by protecting jobs.
Ontarians have adapted to the changes that came with reform to the tax system, including the Harmonized Sales Tax. Taxes on new business investment have been cut almost in half over the last two years, making Ontario one of the most competitive places in North America for new investment. Business investment leads to job creation.
Ontarians have worked together to build a strong, stable economic foundation that has helped the province stand up to the challenges presented by the upheaval that is taking place around the world. In 2008, the McGuinty government took action to support those who needed help the most. In today’s economic environment it will continue to make smart investments in encouraging economic growth and job creation.
Jobs and the Economy
Over the last eight months, the global economy has seen a widespread, downward shift in projections for growth. When the 2011 Budget was published, the average private-sector forecast for Ontario’s real GDP growth was 2.6 per cent for the year. More recent projections are forecasting growth of just 2.0 per cent.

Foreword
xiii
As a result of pressures from outside Ontario, the provincial economy continues to face enormous challenges. The era of slower growth in much of the world is expected to continue for an extended period. This means that, for the foreseeable future, modest economic growth will be the new normal here in Ontario, as elsewhere.
Slower Global Economic Growth
The McGuinty government will achieve its goals in the context of the new global economic reality of slower growth. It will strengthen the economy while giving priority to those parts of its plan that best address the immediate needs of Ontario families.
As new challenges present themselves and as the government moves forward to address changing needs and priorities, it is committed to meeting the targets outlined in its balanced budget plan. To ensure those targets are met, any new spending or unforeseen expenditures will come from savings in other areas.
The way governments of all political stripes over the last generation have accumulated debt cannot continue as Ontario faces many years of more modest economic growth.
Lower Rate of Spending Growth
Ontario is confronting the challenge to protect world-class public services and balance the budget in a time of slow economic growth. To meet these goals, the government set a target in the 2011 Budget of holding growth in overall program spending to 1.4 per cent. Given the current global economic uncertainty, the Commission on the Reform of Ontario’s Public Services is expected to recommend that the target for spending growth should be one per cent. The government will consider this and other advice as it prepares the 2012 Budget.

2011 Ontario Economic Outlook and Fiscal Review
xiv
Ontario has had success in meeting this challenge in the very recent past by lowering growth in program spending from about seven per cent to about four per cent last year. There is more work to be done. The government will receive a report in the next few months from the Commission on the Reform of Ontario’s Public Services, chaired by economist Don Drummond, which will make recommendations on ways to transform public services while eliminating the deficit and ensure that Ontario is able to continue supporting strong schools and hospitals.
Strong financial management and a competitive economy are the foundation of quality schools and hospitals, and strong public services contribute to a greater quality of life. Past experience has shown here in Ontario and elsewhere around the world that deep, arbitrary, across-the-board cuts do not work. They do not deliver true fiscal sustainability. They would also unravel the progress Ontarians have made in improving schools and hospitals and preparing Ontario for the economy of tomorrow. It is also perfectly clear that new tax cuts beyond those announced in the Tax Plan for Jobs and Growth are unaffordable, as are demands for large spending increases in today’s economic circumstances.
Meeting the Challenge Through Reform
The McGuinty government has an established record of meeting its targets. The 2011 Budget forecast a deficit of $16.3 billion for 2011–12 and this economic update shows that — at $16.0 billion — the government is projecting it will be slightly ahead of that forecast target, despite the global economic uncertainty and volatility.
Ontario will meet the challenge of lower economic growth through long-term, fundamental reforms to the way government works. The McGuinty government will build on its track record of reforms to education, health care, taxes and the electricity system. The government will focus more than ever on how to get the best value and the best services for Ontario families.

Foreword
xv
Healthy Homes Renovation Tax Credit
Meeting the challenge of extended, modest economic growth demands a government that is open to change and innovation — the kind of innovation that Ontarians display time and time again. One example is the proposed Healthy Homes Renovation Tax Credit. This credit would help seniors stay in their homes longer and benefit taxpayers by relieving pressures on long-term care home costs. In addition, the tax credit would support jobs and economic activity. To continue to meet fiscal targets, the cost of this program would be offset by savings in other areas.
Conclusion
Over the last several years, Ontarians have made tremendous accomplishments by working together. The McGuinty government will continue to make smart investments that encourage economic growth. It will balance the budget while encouraging job creation and protecting schools and hospitals.

2011 Ontario Economic Outlook and Fiscal Review
xvi

CHAPTER ICREATing OnTARiO JObs in An UnCERTAin glObAl ECOnOmy


Chapter I: Creating Ontario Jobs in an Uncertain Global Economy
3
Highlights
Jobs and the Economy
A proposed Healthy Homes Renovation Tax Credit that would support $800 million of economic activity and 10,500 jobs.
With more than 150 trades and occupations, Ontario supports the largest apprenticeship system in Canada.
Building Ontario’s Clean Energy Future
The government is promoting job creation across the province through investments in clean and green energy. The Green Energy and Green Economy Act, 2009, has helped create over 20,000 jobs to date and is on track to create 50,000 jobs.
Tax Plan for Jobs and Growth
Ontario real machinery and equipment investment spending has risen by over 22 per cent, or $9.0 billion, since July 2010, following the implementation of the Tax Plan for Jobs and Growth. New business investment means new jobs.
Since the Harmonized Sales Tax was introduced, Ontario has created 63,100 jobs.
Auto Sector
Restructuring of this important sector continues as Ontario strengthens its competitiveness and position as the number one province or state in North America in vehicle assembly.
Ontario is investing in hybrid and electric vehicle technology to secure Ontario’s position and jobs for the future.

2011 Ontario Economic Outlook and Fiscal Review
4
Infrastructure
In June of this year, the government released Building Together, the Province’s long-term infrastructure plan. Through this plan, the government will continue investing in infrastructure, creating and preserving more than 300,000 jobs over the next three years.
Financial Services
Ontario’s sound and competitive financial services sector is supporting economic growth, employing around 360,000 people.
Promoting Mining and Economic Development in Ontario’s North
Ontario’s Ring of Fire promises to be a major mining and development opportunity. The government is working with Aboriginal communities and stakeholders to help usher in a new era of sustainable economic development and growth in Ontario’s north.
Employment in northern Ontario’s mining sector increased by over 1,500 jobs between 2010 and 2011.
Preparing Ontarians for Jobs
Full-day kindergarten is helping Ontario’s children get the best possible start in their education. At full implementation, in 2014, 247,000 children and their families will benefit from the program.
More students are achieving the provincial standards in provincewide tests — 69 per cent in 2010–11, compared to 54 per cent in 2002–03. Since 2003–04, the high school graduation rate has increased from 68 per cent to 81 per cent.
About 200,000 more students are currently enrolled in postsecondary education or learning a trade than in 2002–03. The government is creating another 60,000 postsecondary spaces over the next five years.

Chapter I: Creating Ontario Jobs in an Uncertain Global Economy
5
Employment Ontario is serving over one million people a year with career counselling, training and help in looking for a new job. The Second Career program has helped more than 50,000 laid-off workers train for new careers since 2008.
Increasing Access to Care and Preventing Illness
The government has invested $1.5 billion to provide more surgeries, more MRI and CT scans, improve patient flow and publicly track results, and that has improved wait times. Ontario now has the shortest wait times in Canada for key surgical procedures.
There are nearly 2,900 more doctors practising in the province and over 12,000 nursing positions have been created since 2003, which means about 1.3 million more Ontarians now have access to a family doctor.

2011 Ontario Economic Outlook and Fiscal Review
6
Overview
We live in uncertain times. Ontarians are watching the economic crisis unfold around the world. Growth in the global economy is modest. Pressures on the U.S. economy are significant and persistent, including a depressed housing market, stubbornly high unemployment and political paralysis.
This turmoil is taking place against the backdrop of globalization and increasing competition from emerging economies. These trends put pressure on the ability of Ontario’s economy to create jobs. They also put pressure on governments to meet fiscal targets while protecting public services such as schools and hospitals.
In spite of global economic uncertainty, Ontario has experienced moderate economic growth for most of the last two years. In many ways, Ontario has recovered from the recent global recession. Since the low point of the recession in May 2009, employment in Ontario has increased by almost 267,000 net new jobs, equal to nearly half of all the new jobs created in Canada. The vast majority of net job gains over the past two years are among employees who receive above-average wages. The Province’s unemployment rate has fallen from a peak of 9.4 per cent during the recession to 8.1 per cent recently.
Ontario and Canada have fared better than many other places for a variety of reasons. The financial system is well regulated and supervised. Ontario, the federal government and other provinces had strong fiscal positions when the downturn began. This allowed both levels of governments to lessen the impact of the recession by stimulating economic growth and protecting and creating jobs.

Chapter I: Creating Ontario Jobs in an Uncertain Global Economy
CHART 1. Global Economic Growth Forecasts Weakening
4.44.5 4.5
4.0 4.0
4.5
2011p 2012p 2013p
April Projection September Projection
p = IMF projection.Source: International Monetary Fund (April and September 2011).
Projections for Global Real GDP Growth (Per Cent Change)
Ontario’s Performance Affected by Global Developments
Around the world, economies are increasingly dependent on each other. Economic performance in Ontario depends on global markets and is vulnerable to uncertainty elsewhere. Ontario’s exporters rely on strong U.S. demand. The U.S. economy is experiencing weak growth, which lowers the amount of manufactured goods that Ontario exports. The tragic earthquake and tsunami in Japan in March of this year created economic shocks that caused Ontario’s economic output to decline in the second quarter of 2011, in large part because of disruptions to the supply of auto parts. While most signs point to renewed growth in the third quarter, in times like these it is more important than ever to have a serious plan for the future that reflects current economic circumstances.
7

2011 Ontario Economic Outlook and Fiscal Review
8
Changes in the Economy
Ontario’s economy has enjoyed success for several decades. Economic strength was driven largely by three key factors:
• the strength of the U.S. economy;
• the lower value of the Canadian dollar; and
• cheap oil.
Given changes in the global economy, those factors cannot be relied on anymore. The structure of the global economy — and Ontario’s economy — has changed and is continuing to change.
Much of the world is entering an era of more modest economic growth. That means the Province must now focus, more than ever, on managing spending growth. Financial and economic developments in Europe are a stark lesson in the importance of a serious and sustainable fiscal plan. From 2007 through 2009, the interest rates on Spanish and Italian government bonds were similar to those paid by Ontario. By early November of this year, those countries pay from 2.4 to 3.2 percentage points higher on 10-year government bonds. That means more tax dollars are going to service debt instead of protecting schools and hospitals. Disciplined fiscal management will keep this from happening in Ontario.

Chapter I: Creating Ontario Jobs in an Uncertain Global Economy
1
2
3
4
5
6
7
Nov-05
Feb-06
May-06
Aug-06
Nov-06
Feb-07
May-07
Aug-07
Nov-07
Feb-08
May-08
Aug-08
Nov-08
Feb-09
May-09
Aug-09
Nov-09
Feb-10
May-10
Aug-10
Nov-10
Feb-11
May-11
Aug-11
Nov-11
Note: November 2011 data is based on daily average to November 7.Sources: Bloomberg, PC Bond and Ontario Financing Authority.
CHART 2. 10-Year Government Bond Yields
Per Cent
Italy
Spain
Ontario
Canada
Ontario’s finances must be put on a long-term, sustainable path. The government remains committed to achieving the targets outlined in its balanced budget plan while protecting health care and education. Past experience has shown that deep, arbitrary, across-the-board cuts do not work. They do not deliver true fiscal sustainability and they would unravel the progress Ontarians have made in improving schools and hospitals and preparing Ontario for the economy of tomorrow.
The 2011 Budget outlined a plan to hold average annual growth in program expense to 1.4 per cent until the budget is balanced in 2017–18. Given the continuing slow rate of growth expected in both the global and Ontario economies, the Commission on the Reform of Ontario’s Public Services is expected to recommend that the target for spending growth should be one per cent. The government will consider this and other advice as it prepares for the 2012 Budget.
9

2011 Ontario Economic Outlook and Fiscal Review
10
The McGuinty government will build on its track record of innovative reforms to education, health care, taxes and the electricity system. The government will focus more than ever on getting the best value and the best outcomes in everything the Ontario public sector does. Building on reforms already introduced, including in health care and in the 2011 Budget, overlap and duplication will be eliminated, new forms of service delivery will be introduced and the government will ensure the value of public assets is maximized.
Meeting the challenge requires a government that is innovative and open to change. Just because a particular department is delivering a program today does not mean it should deliver that program tomorrow. Government must pursue innovation, open up the provision of government services to new forms of competition and pursue new partnerships within the public, private and voluntary sectors.
As part of meeting the needs of Ontarians in innovative ways, the government is proposing a new Healthy Homes Renovation Tax Credit, effective October 1, 2011. This tax credit would make it easier and safer for seniors to stay in their own or their families’ homes by helping with the costs of renovations such as walk-in bathtubs or wheelchair ramps. The tax credit, worth up to $1,500 per year, would support about $800 million in home renovation activity and around 10,500 jobs throughout the Ontario economy annually.
The Healthy Homes Renovation Tax Credit would help seniors stay healthy and live with dignity and independence in the comfort of their own homes. It costs taxpayers more to provide care in a long-term care home than to a senior who lives in their own home or that of a family member. In addition, supporting seniors living at home frees up health resources for those patients occupying costly beds in hospitals but who would be best cared for in a long-term care home.

Chapter I: Creating Ontario Jobs in an Uncertain Global Economy
11
Building Ontario’s Clean Energy Future
When this government took office in 2003, it inherited an electricity system with no long-term plan. There was not enough generation to meet demand reliably. Transmission lines were aging and some assets were in poor condition. Ontario relied heavily on coal, which causes pollution. For years, health experts have been urging governments to shut down coal plants because doing so would drastically improve air quality and public health — and save money on hospital visits.
Ontario is on track to phase out coal-fired electricity by 2014. The government has already shut down eight coal-fired units and is fast-tracking the closure of two more units by the end of 2011. It is also exploring accelerating the closure of the remaining six units at Lambton and Nanticoke.
Through the Green Energy and Green Economy Act, 2009 (GEA), Ontario is promoting private-sector investments to create a new generation of clean energy jobs, while protecting the environment. The GEA has helped create over 20,000 jobs to date and is on track to create 50,000 jobs.
Since 2009, more than 30 businesses have announced they are setting up or expanding plants in Ontario to manufacture parts for the solar and wind industries. More than 2,000 mid-size and large-scale renewable energy projects have been announced under the Feed-in Tariff program, representing more than $16 billion in private-sector investment.
With the changes Ontarians have made together, Ontario now has a cleaner and reliable electricity system that is creating jobs and making Ontario a world leader in clean energy. These investments have been absolutely necessary — and they are increasing costs.
To help with this transition to a clean, reliable system, the McGuinty government introduced the Ontario Clean Energy Benefit, which reduces monthly electricity bills for most residential and small business consumers by 10 per cent.

2011 Ontario Economic Outlook and Fiscal Review
12
The Tax Plan for Jobs and Growth
In 2009, the government announced the Tax Plan for Jobs and Growth, which is transforming the Province’s tax system to make Ontario’s economy more competitive. This plan has cut income taxes for people and has cut the marginal effective tax rate on new business investment almost in half.
Forbes Takes Note of Ontario’s Tax Changes
“Canada ranks No. 1 in our annual look at the Best Countries for Business… Canada moves up from
No. 4 in last year’s ranking thanks to its improved tax standing. It ranks ninth overall for tax burden
compared to No. 23 in 2010. Credit a reformed tax structure with a Harmonized Sales Tax introduced in
Ontario and British Columbia in 2010. The goal is to make Canadian businesses more competitive.
Canada’s tax status also improved thanks to reduced corporate and employee tax rates.”
Kurt Badenhausen, “The Best Countries for Business,” Forbes.com, October 3, 2011.
Despite the ongoing global economic uncertainty, businesses continue to increase investments in the province — and that means job creation.
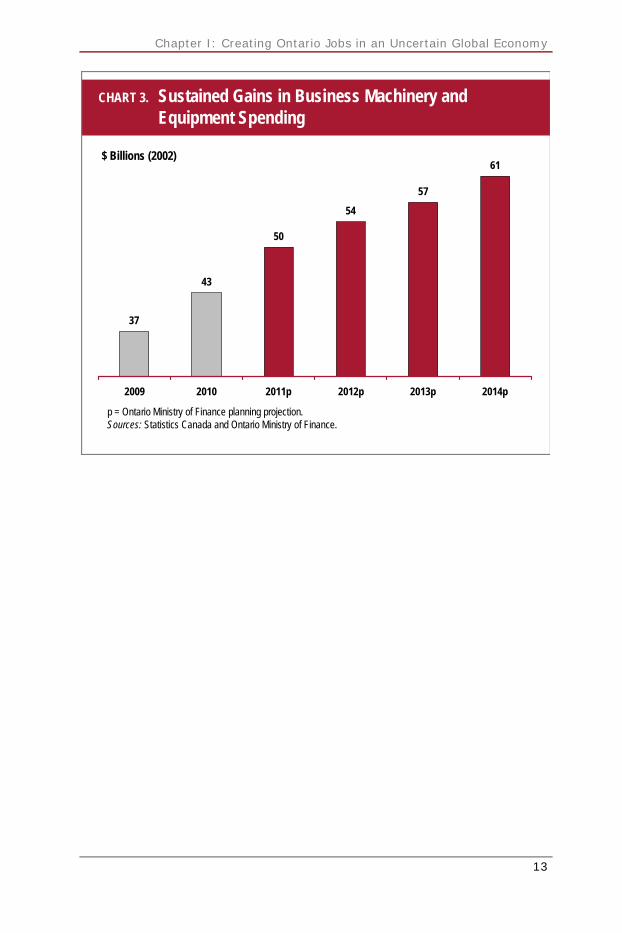
Ontario real machinery and equipment (M&E) investment spending has risen by over 22 per cent, or $9.0 billion, since July 2010, following the implementation of the Tax Plan for Jobs and Growth. The forecast is for strong, continued growth in M&E investment spending, rising 63 per cent from $37 billion in 2009 to over $60 billion by 2014.
These healthy investments in new machinery and equipment will support stronger growth in productivity over the next several years, lead to job creation and promote a more competitive and prosperous Ontario economy.
Chapter I: Creating Ontario Jobs in an Uncertain Global Economy
CHART 3. Sustained Gains in Business Machinery andEquipment Spending
37
43
50
54
57
61
2009 2010 2011p 2012p 2013p 2014p
p = Ontario Ministry of Finance planning projection.Sources: Statistics Canada and Ontario Ministry of Finance.
$ Billions (2002)
13

2011 Ontario Economic Outlook and Fiscal Review
Auto Sector
The auto industry continues to be a key sector of Ontario’s economy, with five major vehicle assemblers and more than 400 parts manufacturing plants in communities across the province. Restructuring of this important sector continues as Ontario strengthens its competitiveness and its position as the number one auto assembler and a major parts producer in North America.
1,490
2,068 2,117
2,576
2009 2010 2011p 2012p
p = Ward’s projection.Source: Ward’s Automotive Reports.
CHART 4. Ontario Vehicle Production (000s)
14

Chapter I: Creating Ontario Jobs in an Uncertain Global Economy
15
In 2009, Ontario made about $4.8 billion in total support available to General Motors (GM) and Chrysler Canada Inc. to help maintain Ontario’s share of North American vehicle production in the province and to protect the hundreds of thousands of jobs supported by the automotive sector. Both GM and Chrysler have now repaid the loan portion of Ontario’s investment. Ontario no longer holds any investment in Chrysler and will sell its remaining interest in GM at an appropriate time in the future.
Infrastructure
Modern and efficient public infrastructure is essential to both Ontario’s economic growth and competitiveness, and to Ontarians’ quality of life. Infrastructure investments in Ontario also help support business-sector productivity growth by reducing business costs and travel times while improving public services. In this time of economic uncertainty, investments in infrastructure become even more important. On average, the Province’s infrastructure investments have created or preserved close to 100,000 jobs in each of the past six years.
Financial Services
Ontario’s financial services sector continues to support job creation and a diverse economy. Employment in the sector grew in 2009 despite the global recession, and, while it dipped slightly in 2010, employment growth resumed in 2011, helping to support growth in the rest of the economy.
Toronto is home to the nation’s banks — ranked the soundest in the world over the last four years —
and globally successful insurers, investment firms and pension funds. Toronto has now risen to
number 10 on the Global Financial Centres Index.

2011 Ontario Economic Outlook and Fiscal Review
16
The government is working with the financial services sector to stimulate future growth, while modernizing financial regulation to support globally competitive markets and investor protection. The Province has partnered with the Financial Services Leadership Council and the Toronto Financial Services Alliance to advance the financial services strategy to improve the sector’s competitiveness, create thousands of high-paying jobs and establish the Global Risk Institute in Financial Services.
TABLE 1. Global Financial Centres Index Ranking: Toronto Enters the Top 10
Year Toronto’s Rank 2011 10 2010 12 2009 13
Source: Z/Yen Group Ltd. Annual figures as of September 2011.
Mining and Opportunities in Ontario’s Ring of Fire
The mining sector is a major employer in many areas of northern Ontario as well as Ontario’s second-largest source of merchandise exports, after autos. Employment in northern Ontario’s mining sector (excluding oil and gas) increased by over 1,500 jobs between 2010 and 2011 (year to date).
Ontario’s Ring of Fire, an area of the Far North with potentially large deposits of important minerals such as chromite, nickel, copper and platinum, presents a unique mining and economic development opportunity. The Ring of Fire Coordinator is actively working with industry and residents of northern Ontario to facilitate sustainable development of this resource. A number of companies continue to move forward with advanced planning for mines and infrastructure. At the same time, the government is working directly with First Nations communities to improve community relationships and engage in capacity building.

Chapter I: Creating Ontario Jobs in an Uncertain Global Economy
17
Producing Results
The McGuinty government was elected in 2003 with a mandate to rebuild schools and hospitals after the previous government had made deep, across-the-board cuts. This government hired nurses and teachers, and invested in infrastructure and public services.
The Province is building the most educated workforce in the world. Ontario’s schools are world leaders at preparing students for their entry into the competitive job market. The government must now focus more than ever on making sure they get the jobs they are prepared for.
At 16.5 per cent, youth unemployment in Ontario is stubbornly high. While other parts of the world have reached much higher levels, the province’s youth are worried about being left behind. Lack of employment opportunities affects their pocketbooks. In turn, this affects families when unemployed young Ontarians may be less willing or able to leave home. This is just one of the reasons why the McGuinty government is focused on jobs and the economy.
Preparing Ontarians for Jobs
Building the best-educated workforce in the world is the most important thing Ontarians can do to generate jobs and prosperity. A well-educated workforce attracts business investment and creates the opportunity for Ontario businesses to find the skilled, knowledgeable people they need to grow.
Implemented in 2010, full-day kindergarten is helping Ontario’s children get the best possible start to their education. Students who achieve early success are more likely to perform well in school and go on to postsecondary education. As of September 2011, nearly 800 Ontario schools are offering the program, benefiting about 50,000 children. The program will be fully implemented in September 2014, benefiting 247,000 children and their families.

2011 Ontario Economic Outlook and Fiscal Review
The government reduced primary class sizes and, by 2008–09, all primary classes had 23 or fewer students. In 2003–04, only 64 per cent of primary classes had 23 or fewer students.
The government is also investing in programs to help students improve their reading, writing and math skills. Education Quality and Accountability Office (EQAO) provincial test scores from the 2010–11 school year show that 69 per cent of Ontario Grade 3 and 6 students are meeting or exceeding the provincial standard in reading, writing and math. This is a 15 percentage point increase from 54 per cent in 2002–03.
54
58
6968
6765
6364
62
50
55
60
65
70
2002–03 2003–04 2004–05 2005–06 2006–07 2007–08 2008–09 2009–10 2010–11
Per Cent
CHART 5. Percentage of Grade 3 and 6 Students Achieving Provincial Standard in Reading, Writing and Math
Source: Ontario Ministry of Education.
18

Chapter I: Creating Ontario Jobs in an Uncertain Global Economy
19
The Economist and McKinsey & Company Cite Ontario’s Education System as One of the Best in the World
“The Canadian province has a high proportion of immigrants, many without English as a first language,
yet it now has one of the world’s best-performing schools systems, after bringing in what one of its
architects calls ‘reform without rancour.’”
“Reforming Education: The Great Schools Revolution,” The Economist, September 17, 2011.
“Ontario … is among the world’s highest-performing school systems. It consistently achieves top-
quartile mathematics scores and top-decile reading scores in PISA*.”
“How the World’s Most Improved School Systems Keep Getting Better,” McKinsey & Company,
November 2010.
*Programme for International Student Assessment (PISA).
In today’s competitive global economy, a postsecondary education is more critical than ever. That is why the McGuinty government created 200,000 more postsecondary and apprenticeship spaces. The latest international comparable data (2009) showed 63 per cent of adults aged 25 to 64 in Ontario completed postsecondary education, higher than all Organisation for Economic Co-operation and Development (OECD) countries. University and college enrolment in Ontario has grown by 36 per cent since 2002–03. This year, Ontario had the most first-year undergraduate students confirm entry to university ever. The government is creating another 60,000 postsecondary spaces over the next five years.

2011 Ontario Economic Outlook and Fiscal Review
5355
57 58 59 6162 63 63 64
56
30
35
40
45
50
55
60
65
70
2000 2001 2002 2003 2004 2005 2006 2007 2008 2009 2010
CHART 6. More Adults Have Postsecondary Credentials
Total postsecondary education is defined as completed university or college education, including college-based apprenticeship and short training programs. Source: Statistics Canada, Labour Force Survey (special tabulation for Ontario).
Per Cent
Through Employment Ontario, the Province supports a variety of employment and training services to help Ontarians find and keep their jobs. Additional investments were made to help workers and communities affected by the recent global recession. One example is the Second Career program that has helped more than 50,000 laid-off workers train for new careers in occupations with demonstrated labour-market prospects.
Ontario has also taken steps to expand and modernize its apprenticeship programs. With more than 150 trades and occupations, Ontario has the largest apprenticeship system in Canada. The establishment of the Ontario College of Trades, an industry-driven governing body, is expected to further modernize the province’s apprenticeship and skilled trades system.
20

Chapter I: Creating Ontario Jobs in an Uncertain Global Economy
21
Those with high skills will be needed as the new clean energy sector creates 50,000 jobs, and as the Province’s tax reforms help create almost 600,000 net new jobs by 2020.1
Health Care
The government has built a health care system that provides Ontarians with better access to a family doctor and shorter wait times, while promoting health and preventing illness.
The government focused on reducing wait times, where previously this measurement had never been taken. The 2011 report card by the Wait Time Alliance gave Ontario straight As for the third consecutive year for reducing wait times for hip, knee, cancer, cataract and cardiac surgeries, making it the highest-performing province.
Since 2003, about 1.3 million more Ontarians have access to a family doctor, with nearly 2,900 more doctors practising in the province.
The government has supported the creation of more than 12,000 nursing positions since 2003, and has more than doubled the number of primary health care nurse practitioner education spaces from 75 to 176. The Province also guarantees a full-time job opportunity for every new nursing graduate.
Ontario was the first province to introduce nurse practitioner-led clinics and, by 2011–12, 25 clinics will be operational and helping to improve access to care for more than 40,000 Ontarians.
Since 2005, the government has increased access to doctors and nurses by creating 200 Family Health Teams, including 42 Teams in northern Ontario. Teams are made up of a range of health care professionals who work collaboratively to provide comprehensive primary care to almost three million Ontarians.
1 Jack M. Mintz, “Ontario’s Bold Move to Create Jobs and Growth,” School of Public Policy, University of
Calgary, November 2009.

2011 Ontario Economic Outlook and Fiscal Review
22
Through the Ontario Diabetes Strategy, the Province has expanded diabetes programs and services to improve health care and health outcomes for Ontarians living with the disease or at risk of developing it. Since June 2010, all Ontarians with diabetes who wished to have a primary care provider now have one. Ontario was also the first province to fully fund insulin pumps for children and youth with type 1 diabetes, saving families up to $18,300 per child in the first five years.
Since 2003, Ontario has added five vaccines to its publicly funded vaccine program, saving families about $1,400 per child.

CHAPTER I IOnTARiO’s ECOnOmiC OUTlOOK


Chapter II: Ontario’s Economic Outlook
25
Highlights
Private-sector average projected 2011 real GDP growth:
• 2011 Budget — 2.6 per cent.
• Current — 2.0 per cent.
Private-sector average projected 2012 real GDP growth — 1.9 per cent.
Private-sector average projected 2013 real GDP growth — 2.6 per cent.
Net new jobs created since recessionary low in May 2009 — 266,800.
• The majority of these net new jobs are full-time, paying above-average wages.

2011 Ontario Economic Outlook and Fiscal Review
26

Chapter II: Ontario’s Economic Outlook
Overview
Because of strong leadership, the Ontario economy weathered the global recession of 2008–09. A weak U.S. economy, European sovereign debt concerns, higher oil prices and disruptions from the Japanese tsunami crisis have all combined to slow Ontario’s economic growth during 2011. As a result of these global economic challenges, the Ontario economy is expected to grow at a more modest pace than previously forecast.
Over the last eight months, the global economy has seen a widespread, downward shift in projections for economic growth. In March, when the government published the 2011 Budget, the average private-sector forecast for Ontario’s economy was real gross domestic product (GDP) growth of 2.6 per cent for 2011. This has declined to 2.0 per cent.
2.62.8 2.8 2.7
2.0 1.9
2.6 2.7
2011p 2012p 2013p 2014p
March 2011 Projection Current Projection
p = private-sector survey average. Source: Ontario Ministry of Finance Survey of Forecasts.
Projections for Ontario Real GDP Growth(Per Cent Change)
CHART 1. Private-Sector Economic Forecasts for Ontario Softening
27

2011 Ontario Economic Outlook and Fiscal Review
28
This drop in the rate of growth has an impact on Ontarians, creating uncertainty. It also has a direct impact on government revenues and how the government manages its planning, particularly when it comes to balancing the implementation of new programs and protecting public services with meeting its targets for eliminating the deficit.
The degree of change is even greater for 2012. In March 2011, the average private-sector forecast placed GDP growth at 2.8 per cent, but by November, those forecasts had fallen to 1.9 per cent. In the face of such volatility, the government must plan and react accordingly.
The Ministry of Finance is projecting real GDP growth of 1.8 per cent in 2011, 1.8 per cent in 2012, 2.5 per cent in 2013 and 2.6 per cent in 2014.1 Solid household spending and robust business capital investment will contribute to growth.
TABLE 1. Ontario Economic Outlook
(Per Cent)
2008 2009 2010 2011p 2012p 2013p 2014p Real GDP Growth (0.6) (3.2) 3.0 1.8 1.8 2.5 2.6 Nominal GDP Growth 0.5 (0.9) 5.3 4.0 3.7 4.4 4.5 Employment Growth 1.6 (2.5) 1.7 1.8 1.1 1.4 1.5 CPI Inflation 2.3 0.4 2.5 3.2 2.0 2.0 2.0 p = Ontario Ministry of Finance planning projection.
Sources: Statistics Canada and Ontario Ministry of Finance.
1 Based on information available up to November 8, 2011.

Chapter II: Ontario’s Economic Outlook
29
Recent Economic Developments
Following seven consecutive quarters of growth over which GDP advanced 5.6 per cent, Ontario real GDP edged down 0.3 per cent in the second quarter of 2011. Real GDP also edged down for Canada as a whole (–0.1 per cent) and Quebec (–0.2 per cent) in the quarter. A number of temporary factors slowed the economy in the quarter, including the disruption of global supply chains triggered by the devastating earthquake and tsunami in Japan as well as the spike in oil prices precipitated by political unrest in the Middle East and North Africa.
Recent economic data indicate that economic growth resumed in the third quarter of 2011. International merchandise exports increased 3.8 per cent in the third quarter, reflecting gains in machinery and equipment and industrial goods and materials. As well, manufacturing sales have increased 5.5 per cent from a low in June. Quarterly forecasts by private-sector economists are all projecting steady but modest economic growth over the final two quarters of this year.
Despite the recent easing in the pace of growth, the Ontario economy has largely recovered from the global recession of 2008–09. As of the second quarter of 2011, Ontario real GDP was just 0.1 per cent below the pre-recession level. Solid growth in consumer spending, a strong rebound in business investment and government actions all supported Ontario’s recovery from the global recession. However, external trade has lagged domestic demand. Merchandise exports have risen 39.5 per cent from a recessionary low, but remain 8.2 per cent below their pre-recession level.

2011 Ontario Economic Outlook and Fiscal Review
30
TABLE 2. Tracking Ontario’s Economic Recovery
(Key Economic Indicators for Ontario)
Pre-
Recession Level
Change During
Recession
Recovery to Date
Comparison to Pre-
Recession Level
Jobs (000s) 6,709 (257) 267 10 +0.1%
Real GDP1 ($ Billions, 2002)
532.4 (26.7) 26.3 (0.4) (0.1%)
Merchandise Exports ($ Billions)
14.3 (4.9) 3.7 (1.2) (8.2%)
Manufacturing Sales ($ Billions)
24.0 (7.1) 4.6 (2.5) (10.3%)
Retail Sales ($ Billions)
12.9 (1.2) 1.7 0.5 +4.0%
Unemployment Rate (Level)
6.4
Up 3.0 to 9.4
Down 1.3 to 8.1
Up 1.7
1 Based on Ontario Economic Accounts, October 2011.
Sources: Statistics Canada and Ontario Ministry of Finance.
Over the past two years, 266,800 net jobs have been created from the recessionary low in May 2009. Full-time employment rose 237,900 over this period while part-time employment increased 28,900. The vast majority of net new job gains over the past two years are among employees who receive above-average wages. As of October 2011, employment was 10,000 jobs above the pre-recession peak in September 2008. Ontario’s unemployment rate has also moved lower, falling from a recessionary high of 9.4 per cent in May 2009 to 8.1 per cent in October 2011.

Chapter II: Ontario’s Economic Outlook
Sources: Statistics Canada and U.S. Bureau of Labor Statistics.
U.S. Employment(Thousands)
CHART 2. Job Recovery in Ontario
5,200
5,400
5,600
5,800
6,000
6,200
6,400
6,600
6,800
7,000
2000 2001 2002 2003 2004 2005 2006 2007 2008 2009 2010 2011
124,000
126,000
128,000
130,000
132,000
134,000
136,000
138,000
140,000Ontario U.S.
Ontario: 266,800 jobs added since recession10,000 jobs (0.1%) above pre-recession peak
U.S.: 2.3 million jobs added since recession6.5 million jobs (4.7%) below pre-recession peak
Ontario Employment(Thousands)
Statistics Canada reports that Ontario employment has fallen in three of the last four months. Despite this, Ontario has created 128,400 net new jobs so far this year, accounting for over 45 per cent of all the jobs created across Canada. Full-time employment has increased by 133,100 jobs this year while part-time employment has edged down by 4,700. The pace of job creation in Ontario is ahead of that of the United States and most of the G7 nations.
31

2011 Ontario Economic Outlook and Fiscal Review
The Challenging Global Economic Environment
European Sovereign Debt
Concern over the sovereign debt of several euro zone countries has been among the most prominent global economic issues of the past two years. While the risks associated with Greece’s public debt are the most acute, there are also challenges related to the debt financing of other European Union (EU) member states. The EU and International Monetary Fund (IMF) rescue plans for Greece, Ireland and Portugal, and a recently strengthened European Financial Stability Facility, may help to contain the problem. However, the outcome is highly uncertain.
CHART 3. European Debt
97
50 5364 60 61
127
83
6553
116
79 74
166
106 109
67
121
87 83
115
Greece Portugal Ireland Spain Italy France Germany
1998 2009 2011p
p = IMF projection.Source: International Monetary Fund (September 2011).
Per Cent of GDP
32

Chapter II: Ontario’s Economic Outlook
33
The direct impact of the euro zone debt crisis on Ontario is unclear. Ontario’s exports to Europe, although growing in recent years, account for just over 10 per cent of total international merchandise exports. Canadian banks have little direct exposure to the troubled euro zone economies. However, Europe’s debt challenges could hurt Ontario indirectly through increased volatility in financial markets and by weakening business and consumer confidence.

2011 Ontario Economic Outlook and Fiscal Review
Global Economic Outlook Weakening
The pace of economic recovery in North America, Europe and Japan has slowed significantly from last year. This is largely due to the sharp slowdown in U.S. growth over the first half of 2011 as well as the impact of the tsunami disaster in Japan. Weakness in European economies as a result of the sovereign debt crisis has also contributed to the general slowdown. The outlook for emerging economies continues to be more positive, although weaker export demand, volatile commodity prices and geopolitical tensions remain key risks.
CHART 4. Weakening Global Economic Growth Forecasts
4.44.5 4.5
4.0 4.0
4.5
2011p 2012p 2013p
April Projection September Projection
p = IMF projection.Source: International Monetary Fund (April and September 2011).
Projections for Global Real GDP Growth (Per Cent Change)
34

Chapter II: Ontario’s Economic Outlook
U.S. Economy
The United States faces a number of significant challenges to its economic outlook. In particular, job creation has been very weak, with only 26 per cent of the jobs lost in the global recession recovered to date. As well, the U.S. unemployment rate remains at 9.0 per cent compared to a pre-recession level of 4.7 per cent. Housing activity also remains severely depressed.
Based on revised estimates from the U.S. Bureau of Economic Analysis, the U.S. economy suffered a deeper recession and slower recovery than previously reported. At the same time, private-sector forecasts for U.S. economic growth have been revised downward over the past several months. As a result, the U.S. economic recovery is significantly less robust than was anticipated a few months ago. After expanding 3.0 per cent in 2010, private-sector forecasters are projecting modest real GDP growth of 1.8 per cent in 2011 and 2.1 per cent in 2012.
CHART 5. U.S. Recession Deeper and Recovery Slower
0.0
(2.6)
2.83.1 3.3 3.2 3.13.0
1.82.1
2.8 2.9
(3.5)
(0.3)
2008 2009 2010 2011p 2012p 2013p 2014p
2011 Budget Current
p = private-sector survey average.Sources: U.S. Bureau of Economic Analysis and Blue Chip Economic Indicators (March, October and November 2011).
Real GDP Growth (Per Cent Change)
35

2011 Ontario Economic Outlook and Fiscal Review
36
The outlook for both U.S. motor vehicle sales and housing starts remains relatively positive, with renewed growth from current low levels. Growth in these markets should help support a broader, sustained economic expansion. Solid growth in retail sales and industrial production so far this year also provides evidence of slowly improving economic conditions in the United States.
Although the share of Ontario exports to the United States has trended lower in recent years, the United States remains Ontario’s largest trading partner by far. It is the destination for nearly 80 per cent of Ontario’s international merchandise exports. Ontario exports of motor vehicles and parts to the United States totalled $45.4 billion in 2010 and accounted for nearly 40 per cent of the province’s U.S.-bound exports.
In the United States, sales of light motor vehicles are projected to increase from 10.4 million units in 2009 and 11.6 million units in 2010 to 12.7 million units in 2011, and to grow steadily to 14.7 million by 2014. Ontario’s auto exports will continue to strengthen over the next several years. However, despite the solid recovery, U.S. motor vehicle sales are expected to remain below pre-recession levels, which exceeded 16 million units.

Chapter II: Ontario’s Economic Outlook
CHART 6. U.S. Light Motor Vehicle Sales Continue to Grow
16.1
13.2
10.4
11.6
12.7
13.514.1
14.7
16.5
2006 2007 2008 2009 2010 2011p 2012p 2013p 2014p
p = private-sector survey average.Sources: U.S. Bureau of Economic Analysis and Blue Chip Economic Indicators (October and November 2011).
Millions of Units
The risks for the U.S. economy remain high. Over the next year, U.S. fiscal policy measures are likely to have a significant influence on growth. Additional political uncertainty, similar to the summer debate on the U.S. debt ceiling, could further undermine consumer and business confidence. The U.S. economy is also vulnerable to further external shocks, such as any financial turbulence arising from developments in Europe.
37

2011 Ontario Economic Outlook and Fiscal Review
38
Oil Prices
Oil prices have been very volatile over the past year, reflecting geopolitical uncertainty in many oil-producing states, supply constraints and shifting economic conditions. West Texas Intermediate (WTI) crude oil traded close to $114 US per barrel at the end of April, reflecting tight supply conditions due to political instability in the Middle East and North Africa. Oil prices trended lower through the summer, then averaged $86 US per barrel in October. Based on futures market contracts, traders expect the price for WTI oil to average approximately $90 US per barrel in December.
Softer demand is expected to restrain oil prices in the short term, although upward pressure remains due to supply uncertainty and reduced inventories in some parts of the world. There is a wide range of views on the path of oil prices, with most forecasts for WTI falling within the range of $84 US to $99 US per barrel in 2012.
Based on recent average prices for crude oil futures contracts, the price for WTI oil is expected to average $90 US per barrel in 2012, down from $94 US per barrel in 2011. Brent crude oil, an alternative benchmark, is expected to average $111 US per barrel in 2011 and decline to $106 US per barrel in 2012.
Oil prices are expected to trend lower from their 2011 highs. However, strong growth in oil demand from emerging economies combined with more moderate supply growth will keep oil prices at relatively high levels. By 2014, the price for WTI oil is forecast to average $89 US per barrel while the Brent standard is projected to average $97 US per barrel.

Chapter II: Ontario’s Economic Outlook
0
20
40
60
80
100
120
2000 2002 2004 2006 2008 2010 2012p 2014p
WTI Brent
CHART 7. Continued High Oil Prices Expected
p = Ontario Ministry of Finance planning projection.Sources: New York Mercantile Exchange, IntercontinentalExchange and Ontario Ministry of Finance.
Oil Price: West Texas Intermediate (WTI) and Brent($ US Per Barrel)
39

2011 Ontario Economic Outlook and Fiscal Review
The Canadian Dollar
The Canadian dollar appreciated relative to the U.S. dollar through mid-summer, averaging 104.7 cents US in July 2011. In August, intensification of European debt concerns combined with a weaker global outlook and falling commodity prices caused the Canadian dollar to slip back to below parity. Private-sector forecasters expect that, over the next four years, as global economic conditions improve and commodity prices strengthen, the Canadian dollar will average just above parity.
60
70
80
90
100
110
1990 1992 1994 1996 1998 2000 2002 2004 2006 2008 2010 2012p 2014p
CHART 8. Canadian Dollar to Remain Close to Parity
p = Ontario Ministry of Finance planning projection.Sources: Bank of Canada and Ontario Ministry of Finance.
Cents US
A higher dollar makes it more challenging for Ontario’s exporters to compete internationally and for domestic firms to compete with foreign producers. However, a strong dollar also lowers the cost of importing productivity-enhancing machinery and equipment, which improves the competitive position of Ontario businesses.
40
Chapter II: Ontario’s Economic Outlook
Financial Markets
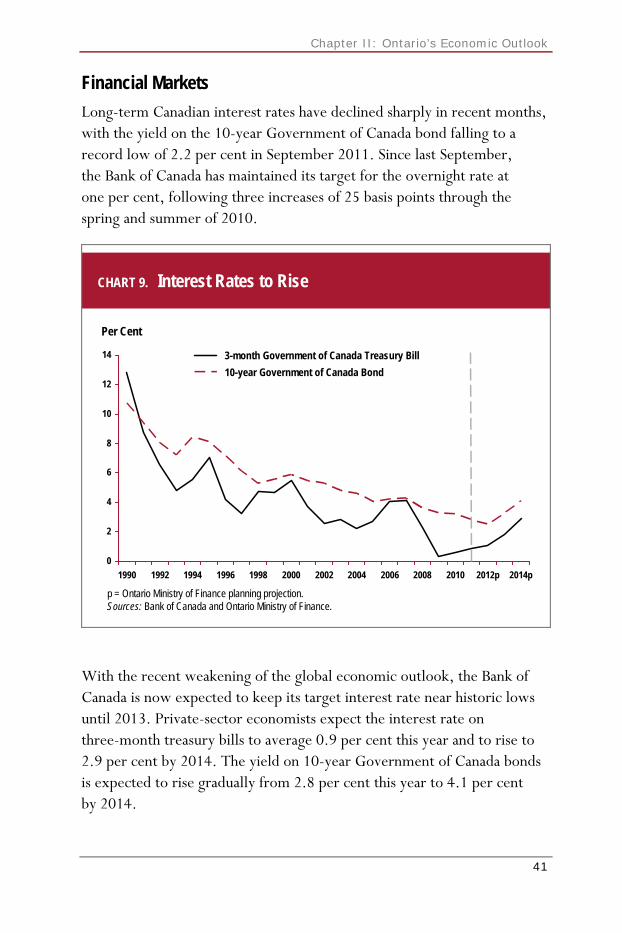
Long-term Canadian interest rates have declined sharply in recent months, with the yield on the 10-year Government of Canada bond falling to a record low of 2.2 per cent in September 2011. Since last September, the Bank of Canada has maintained its target for the overnight rate at one per cent, following three increases of 25 basis points through the spring and summer of 2010.
0
2
4
6
8
10
12
14
1990 1992 1994 1996 1998 2000 2002 2004 2006 2008 2010 2012p 2014p
3-month Government of Canada Treasury Bill
10-year Government of Canada Bond
CHART 9. Interest Rates to Rise
p = Ontario Ministry of Finance planning projection.Sources: Bank of Canada and Ontario Ministry of Finance.
Per Cent
With the recent weakening of the global economic outlook, the Bank of Canada is now expected to keep its target interest rate near historic lows until 2013. Private-sector economists expect the interest rate on three-month treasury bills to average 0.9 per cent this year and to rise to 2.9 per cent by 2014. The yield on 10-year Government of Canada bonds is expected to rise gradually from 2.8 per cent this year to 4.1 per cent by 2014.
41

2011 Ontario Economic Outlook and Fiscal Review
42
Forecasts for key external factors are summarized in the table below. These are used as the basis for the Ministry of Finance forecast for Ontario’s economic growth.
TABLE 3. Outlook for External Factors
2009 2010 2011p 2012p 2013p 2014p World Real GDP Growth (Per Cent) (0.7) 5.1 4.0 4.0 4.5 4.7 U.S. Real GDP Growth (Per Cent) (3.5) 3.0 1.8 2.1 2.8 2.9 West Texas Intermediate Oil1 ($US/bbl.) 61.7 79.4 93.6 89.7 89.5 89.2 Brent Oil1 ($US/bbl.) 61.5 79.5 111.3 106.0 101.3 96.9 Canadian Dollar (Cents US) 87.6 97.1 101.1 100.1 101.4 101.4 Three-Month Treasury Bill Rate2
(Per Cent) 0.3 0.6 0.9 1.1 1.8 2.9
10-Year Government Bond Rate2
(Per Cent) 3.3 3.2 2.8 2.5 3.3 4.1
p = Ontario Ministry of Finance planning projection based on external sources. 1 Based on crude oil futures contracts over the two-week period ending October 28, 2011. 2 Government of Canada interest rates.
Sources: U.S. Bureau of Economic Analysis, Blue Chip Economic Indicators (October and November 2011), IMF World Economic Outlook (September 2011), New York Mercantile Exchange, IntercontinentalExchange and Ontario Ministry of Finance Survey of Forecasts (November 8, 2011).

Chapter II: Ontario’s Economic Outlook
43
Table 4 provides the current estimate of the impact of changes in key external factors on the growth of Ontario’s real GDP, assuming that other external factors remain stable. The relatively wide ranges of the impacts reflect uncertainty in estimates of how the economy would respond to changing external conditions.
TABLE 4. Impacts of Sustained Changes in Key External Factors on Ontario’s Real GDP Growth
(Percentage Point Change)
First Year Second Year Canadian Dollar Appreciates by Five Cents US
−0.1 to −0.8 −0.5 to −1.2
Crude Oil Prices Increase by $10 US per Barrel
−0.1 to −0.3 −0.1 to −0.3
U.S. Real GDP Growth Increases by One Percentage Point
+0.3 to +0.7 +0.4 to +0.8
Canadian Interest Rates Increase by One Percentage Point
–0.1 to –0.5 –0.2 to –0.6
Source: Ontario Ministry of Finance.

2011 Ontario Economic Outlook and Fiscal Review
Outlook for Ontario Economic Growth
For 2011 as a whole, the Ministry of Finance is projecting growth of 1.8 per cent in Ontario real GDP. Rising consumer and business investment spending will support growth this year while net trade is expected to lag the overall economy.
CHART 10. Contributions to Real GDP Growth in 2011
1.8
1.0
0.1
1.7
(1.0)
Gross DomesticProduct
PersonalExpenditure
Government BusinessInvestment
Net Trade
Source: Ontario Ministry of Finance.
Per Cent Change Contributions to GDP Growth (Percentage Points)
Employment is forecast to increase by 1.8 per cent in 2011, or 120,000 net new jobs. Strong employment gains and higher personal incomes have supported increases in household spending. Retail sales are projected to grow 3.4 per cent this year while housing starts are expected to increase 12.7 per cent. Business investment is expected to increase by a strong 15.7 per cent this year, benefiting from the higher exchange rate and Ontario’s improved tax competitiveness.
44

Chapter II: Ontario’s Economic Outlook
However, a challenging external environment and, in particular, the weak U.S. economy are expected to contribute to a small 2.8 per cent gain in Ontario exports this year. Imports are projected to grow by 4.2 per cent in 2011. As a result, net external trade will detract from growth.
The Ministry of Finance is projecting continued growth in Ontario’s economy. Real GDP is projected to grow by 1.8 per cent in 2012, 2.5 per cent in 2013 and 2.6 per cent in 2014. Domestic demand is projected to remain a source of strength, supported by gains in household spending, a solid housing market and strong business capital investment. Growth in international demand, particularly from the United States, is expected to be modest, limiting gains to Ontario’s net trade position over the forecast period.
CHART 11. Ontario Real GDP Growth
3.0
1.8 1.8
2.5 2.6
(3.2)
2009 2010 2011p 2012p 2013p 2014p
p = Ontario Ministry of Finance planning projection.Sources: Statistics Canada and Ontario Ministry of Finance.
Per Cent Change
45

2011 Ontario Economic Outlook and Fiscal Review
Over the 2012–14 period, employment growth is expected to average 1.3 per cent annually. The unemployment rate is expected to continue trending lower from an annual average of 7.9 per cent in 2011 to 6.9 per cent by 2014.
CHART 12. Increasing Employment
6,502
6,610
6,730
6,806
6,900
7,004
2009 2010 2011p 2012p 2013p 2014p
p = Ontario Ministry of Finance planning projection.Sources: Statistics Canada and Ontario Ministry of Finance.
Employment(Thousands)
CHART 13. Lower Unemployment Rate
9.08.7
7.97.7
7.36.9
2009 2010 2011p 2012p 2013p 2014p
p = Ontario Ministry of Finance planning projection.Sources: Statistics Canada and Ontario Ministry of Finance.
Unemployment Rate(Per Cent)
46

Chapter II: Ontario’s Economic Outlook
Labour income is expected to increase on average by 4.1 per cent annually over the 2012 to 2014 period. Similarly, personal income growth is projected to average 4.1 per cent annually over the same period.
Job gains, personal income growth and relatively low interest rates will support continuing gains in household spending over the forecast period. Real consumer spending is expected to rise by 2.3 per cent this year and in 2012.
CHART 14. Sustained Gains in Household Spending
321
333340
348
357
367
2009 2010 2011p 2012p 2013p 2014p
$ Billions, 2002
p = Ontario Ministry of Finance planning projection.Sources: Statistics Canada and Ontario Ministry of Finance.
A rise in gasoline pump prices, driven by higher oil costs, was largely responsible for pushing Ontario’s consumer price index (CPI) higher in 2011. However, this is expected to reverse in 2012, with lower average gasoline prices contributing to more moderate consumer price inflation. Ontario’s CPI is forecast to increase by an average of 2.0 per cent per year over the 2012 to 2014 period, the mid-point of the Bank of Canada’s target range for Canadian CPI inflation.
47

2011 Ontario Economic Outlook and Fiscal Review
Rising corporate profits and improved tax competitiveness from Ontario’s Tax Plan for Jobs and Growth — including the Harmonized Sales Tax (HST) — are supporting strong growth in business investment. Corporate profits rose 19.1 per cent in 2010 and are projected to increase by a further 7.3 per cent in 2011. Ontario’s businesses have responded by increasing real investment in machinery and equipment by 15.2 per cent in 2010 and by an estimated 17 per cent in 2011. Real business investment in plant and equipment is forecast to increase by an average annual rate of 6.2 per cent over the 2012 to 2014 period.
CHART 15. Sustained Gains in Business Machinery andEquipment Spending
37
43
50
54
57
61
2009 2010 2011p 2012p 2013p 2014p
p = Ontario Ministry of Finance planning projection.Sources: Statistics Canada and Ontario Ministry of Finance.
$ Billions, 2002
Continuing steady gains in U.S. auto sales and relatively strong growth in demand from emerging markets will support Ontario exports. Real exports are projected to rise by 2.8 per cent in 2011 and 2.6 per cent in 2012.
48

Chapter II: Ontario’s Economic Outlook
The Ontario housing market remains well balanced, supported by healthy fundamentals and record low mortgage rates. Home resales are expected to moderate in 2012 and 2013 from the strong levels experienced in 2010 and 2011. House price gains are also expected to be more subdued, increasing by an average of nearly three per cent per year from 2011 to 2014.
Demand for new homes in Ontario will continue to be sustained by population growth, which is projected to average 1.2 per cent annually over the next three years, consistent with recent experience. This will mean an additional 490,000 people living in the province by 2014. Housing starts are projected to exceed 70,000 units per year by 2014.
CHART 16. Housing Starts to Remain Strong
50
60
68
65 66
70
2009 2010 2011p 2012p 2013p 2014p
p = Ontario Ministry of Finance planning projection.Sources: Canada Mortgage and Housing Corporation and Ontario Ministry of Finance.
Thousands
49

2011 Ontario Economic Outlook and Fiscal Review
50
The rising level of household debt remains a key risk for the outlook. Record low interest rates have allowed households to increase debt levels over the past several years. With interest rates expected to remain near record lows into 2013, debt servicing costs should remain affordable in the near term. However, rising debt levels may place some households in a vulnerable position when interest rates eventually begin to rise to more historically normal levels.

Chapter II: Ontario’s Economic Outlook
Details of the Ontario Economic Outlook
The following table provides details of the Ministry of Finance’s economic outlook for 2011 to 2014.
TABLE 5. The Ontario Economy, 2009 to 2014
(Per Cent Change)
Actual Projection 2009 2010 2011 2012 2013 2014 Real Gross Domestic Product (3.2) 3.0 1.8 1.8 2.5 2.6 Personal Consumption 0.2 3.6 2.3 2.3 2.6 2.7 Residential Construction (8.7) 8.3 3.8 1.8 2.1 1.8 Non-residential Construction (11.4) (1.6) 11.0 3.9 5.6 5.4 Machinery and Equipment (18.5) 15.2 17.0 7.6 6.0 5.9 Exports (12.6) 7.5 2.8 2.6 4.0 3.8 Imports (10.4) 13.3 4.2 1.6 3.2 3.0 Nominal Gross Domestic Product (0.9) 5.3 4.0 3.7 4.4 4.5 Other Economic Indicators Retail Sales (2.5) 5.4 3.4 4.0 3.9 4.3 Housing Starts (000s) 50.4 60.4 68.1 65.3 66.1 70.3 Personal Income 0.2 4.2 3.3 3.1 4.5 4.7 Labour Income (0.6) 3.9 3.7 3.6 4.3 4.4 Corporate Profits (14.9) 19.1 7.3 6.0 5.5 4.8 Consumer Price Index 0.4 2.5 3.2 2.0 2.0 2.0 Employment (2.5) 1.7 1.8 1.1 1.4 1.5 Job Creation (000s) (164) 108 120 76 94 105 Unemployment Rate (Per Cent) 9.0 8.7 7.9 7.7 7.3 6.9 Key External Variables U.S. Real Gross Domestic Product (3.5) 3.0 1.8 2.1 2.8 2.9 WTI Crude Oil ($ US per Barrel) 61.7 79.4 93.6 89.7 89.5 89.2 Canadian Dollar (Cents US) 87.6 97.1 101.1 100.1 101.4 101.4 3-month Treasury Bill Rate* 0.3 0.6 0.9 1.1 1.8 2.9 10-year Government Bond Rate* 3.3 3.2 2.8 2.5 3.3 4.1 * Government of Canada interest rates (per cent).
Sources: Statistics Canada, Canada Mortgage and Housing Corporation, Bank of Canada, U.S. Bureau of Economic Analysis, Blue Chip Economic Indicators (October and November 2011), New York Mercantile Exchange and Ontario Ministry of Finance.
51

2011 Ontario Economic Outlook and Fiscal Review
52
Private-Sector Forecasts
The Ministry of Finance consults with private-sector economists and tracks their forecasts in order to inform the government’s planning assumptions. In the process of preparing the Ontario Economic Outlook and Fiscal Review, the Minister of Finance met with private-sector economists to hear their views on the economy. These forecasters included members of the Ontario Economic Forecast Council, established by the Fiscal Transparency and Accountability Act, 2004. All of these private-sector economists are forecasting continued growth for the Ontario economy over the rest of 2011 and the next three years. On average, private-sector forecasters are projecting growth of 1.9 per cent in 2012, 2.6 per cent in 2013 and 2.7 per cent in 2014.
TABLE 6. Private-Sector Forecasts for Ontario Real GDP Growth
(Per Cent)
2011 2012 2013 2014 BMO Capital Markets (November) 2.1 1.9 – – Central 1 Credit Union (November) 2.1 1.8 2.6 3.3 Centre for Spatial Economics (November) 2.3 2.1 2.2 1.7 CIBC World Markets (November) 2.0 1.8 2.3 – Conference Board of Canada (October) 1.8 2.2 3.3 2.7 Desjardins Group (October/September) 2.0 1.9 2.5 2.5 IHS Global Insight (November) 2.0 1.8 2.5 2.8 Laurentian Bank Securities (September) 1.8 1.9 – – National Bank (October) 2.1 1.6 – – RBC Financial Group (September) 2.3 2.4 – – Scotiabank Group (November) 2.0 1.5 – – TD Bank Financial Group (September) 2.3 2.1 2.7 – University of Toronto (October) 1.8 1.8 3.0 3.2 Private-Sector Survey Average 2.0 1.9 2.6 2.7 Ontario’s Planning Assumption 1.8 1.8 2.5 2.6 Sources: Ontario Ministry of Finance Survey of Forecasts (November 8, 2011) and Ontario Ministry of Finance.

Chapter II: Ontario’s Economic Outlook
53
Comparison to the 2011 Ontario Budget
Forecasts for growth are lower than projected at the time of the 2011 Budget. The slower projected growth for Ontario reflects a weaker U.S. economic recovery as well as increased uncertainty surrounding the prospects for the global economy.
TABLE 7. Changes in Key Economic Forecast Assumptions 2011 Fall Economic Statement Compared to 2011 Budget
(Per Cent Change)
2011 2012 2013
2011 Budget
2011 FES
2011 Budget
2011 FES
2011 Budget
2011 FES
Real Gross Domestic Product 2.4 1.8 2.7 1.8 2.7 2.5 Nominal Gross Domestic Product 4.6 4.0 5.1 3.7 4.8 4.4 Retail Sales 4.1 3.4 4.3 4.0 4.0 3.9 Housing Starts (000s) 58.6 68.1 63.8 65.3 66.5 66.1 Personal Income 4.2 3.3 4.4 3.1 4.6 4.5 Labour Income 4.3 3.7 4.7 3.6 4.8 4.3 Corporate Profits 12.2 7.3 9.2 6.0 5.9 5.5 Employment 1.7 1.8 1.8 1.1 1.8 1.4 Job Creation (000s) 116 120 118 76 126 94 Key External Variables WTI Crude Oil ($ US per Barrel) 99.7 93.6 102.2 89.7 100.6 89.5 U.S. Real Gross Domestic Product 3.1 1.8 3.3 2.1 3.2 2.8 Canadian Dollar (Cents US) 100.0 101.1 99.7 100.1 99.3 101.4 3-month Treasury Bill Rate* (Per Cent)
1.4 0.9 2.6 1.1 3.7 1.8
10-year Government Bond Rate* (Per Cent)
3.5 2.8 4.1 2.5 4.7 3.3
* Government of Canada interest rates.
Sources: New York Mercantile Exchange, Blue Chip Economic Indicators (March, October and November 2011) and Ontario Ministry of Finance.

2011 Ontario Economic Outlook and Fiscal Review
54

CHAPTER I I IFisCAl OUTlOOK


Chapter III: Fiscal Outlook
57
Highlights
The Province remains on track to meet its fiscal targets, while making smart investments to encourage economic growth and job creation.
2011–12 deficit outlook— $16.0 billion, $0.3 billion ahead of the 2011 Budget forecast target.
The 2011 Budget outlined a plan to hold average annual growth in program expense to 1.4 per cent until the budget is balanced in 2017–18. Given the extended period of modest economic growth expected, the Commission on the Reform of Ontario’s Public Services is expected to recommend that the target for spending growth should be one per cent.
The proposed Healthy Homes Renovation Tax Credit would be funded using reductions in other programs.

2011 Ontario Economic Outlook and Fiscal Review
58
Chapter III: Fiscal Outlook
59
Section A: Overview
Over the last eight months, the global economy has seen a widespread, downward shift in projections for economic growth. As a result of pressures from outside Ontario, the Province continues to face economic challenges. This means a modest pace of economic growth, which directly impacts how the government will manage fiscal planning. This is particularly relevant when it comes to balancing the implementation of new programs and protecting public services while meeting the targets for eliminating the deficit.
The 2011 Budget outlined a plan to hold average annual growth in program expense to 1.4 per cent until the budget is balanced in 2017–18. Given the extended period of modest economic growth expected, the Commission on the Reform of Ontario’s Public Services is expected to recommend that the target for spending growth should be one per cent. The government will consider this and other advice as it prepares for the 2012 Budget.
Consistent with this, any new spending initiatives will be paid for through offsetting savings from other areas or through the reform of public service delivery. The proposed Healthy Homes Renovation Tax Credit, if passed by the legislature, would help support jobs and economic activity while helping seniors live with independence and dignity in their own home. It also costs taxpayers less for care to be provided at home than in a long-term care facility. This new measure would be funded using reductions in other programs.
Eliminating the deficit by 2017–18 and maintaining balanced budgets beyond that time as demographic trends exert increasing pressure on government programs will require fundamental reform of the delivery of public services. The Commission on the Reform of Ontario’s Public Services will make recommendations for the government’s consideration in time for the 2012 Budget.

2011 Ontario Economic Outlook and Fiscal Review
60
The Province remains on track to meet the fiscal targets projected in the 2011 Budget and the First Quarter Ontario Finances. This includes a $16.0 billion deficit in 2011–12 and steadily declining deficits of $15.2 billion in 2012–13 and $13.3 billion in 2013–14.
This chapter outlines Ontario’s fiscal outlook for 2011–12 and the medium-term forecast for 2012–13 and 2013–14.
(14.0)(13.3)
(15.2)(16.0)
(20.0)
(15.0)
(10.0)
(5.0)
0.0
2010–11 2011–12 2012–13 2013–14
Fiscal Balance($ Billions)
(16.7) (16.3)
Medium-Term OutlookCurrent OutlookActual
CHART 1. Ontario’s Medium-Term Fiscal Outlook
2011 Ontario BudgetFall 2011 Ontario EconomicOutlook and Fiscal Review

Chapter III: Fiscal Outlook
61
Section B: 2011–12 Fiscal Performance
The 2011–12 deficit is currently projected to be $16.0 billion, an improvement of $0.3 billion compared with the 2011 Budget and consistent with the outlook presented in the First Quarter Ontario Finances.
The Province’s total revenue for 2011–12 is projected to be $443 million lower than the 2011 Budget forecast. Excluding the impact of the one-time loan repayment from Chrysler Canada Inc. and other first-quarter changes, the revenue forecast is $778 million lower than in the 2011 Budget, mainly reflecting the impact of slower economic growth on Ontario’s revenue.
The 2011 Budget Plan included a $700 million reserve in 2011–12 to protect against the potential impact of events that could deteriorate the Province’s fiscal performance. The reserve for 2011–12 has been reduced by $500 million to counter the impact of slower economic growth on Ontario’s fiscal performance. This amount is less than the $778 million decrease in revenue since the first quarter.
Program expense has been maintained at 2011 Budget levels. Total expense is projected to decrease primarily due to lower interest on debt expense resulting from lower interest rates than projected at the time of the Budget and the lower deficit in 2010–11.

2011 Ontario Economic Outlook and Fiscal Review
62
TABLE 1. 2011–12 In-Year Fiscal Performance1 ($ Millions)
Budget Plan
Current Outlook
Change Since Budget
Revenue2 108,717 108,275 (443) Expense Programs 114,043 113,971 (72) Interest on Debt 10,290 10,097 (193)
Total Expense 124,333 124,068 (264) Reserve 700 200 (500)
Surplus/(Deficit) (16,316) (15,994) 322 1 Budget plan revenue and expense have been restated from what was shown in the 2011 Budget to reflect a fiscally
neutral accounting change. See note at the bottom of Table 11 for more information. 2 Excluding the impact of the one-time loan repayment from Chrysler and other first-quarter changes, total revenue
declined by $778 million. Note: Numbers may not add due to rounding.

Chapter III: Fiscal Outlook
63
2011–12 Revenue Changes Since the 2011 Budget
The 2011–12 revenue projection at $108,275 million is $443 million lower than the 2011 Budget outlook as a result of slower economic growth. The revenue decline in 2011–12 is mitigated by the Chrysler loan repayment previously announced in the First Quarter Ontario Finances.
TABLE 2. Summary of Revenue Changes Since the Budget1 ($ Millions)
2011–12
Taxation Personal Income Tax (721) Corporations Tax 30 Ontario Health Premium (129) Land Transfer Tax 125 Other Taxes 59 Electricity Payments-in-Lieu of Taxes (14)
Total Taxation (650) Government of Canada (175) Government Business Enterprises (39) Other Non-Tax Revenue Chrysler Loan Repayment 468 Other Non-Tax Revenue (46)
Total Other Non-Tax Revenue 422
Total Revenue Changes Since the Budget (443) 1 See note at the bottom of Table 11 for more information regarding the fiscally neutral accounting change. Note: Numbers may not add due to rounding.
Details of 2011–12 In-Year Revenue Changes
Key revenue changes since the 2011 Budget forecast include:
• Personal Income Tax (PIT) revenue is projected to be $721 million, or 2.8 per cent, lower due to slower 2011 and 2012 economic growth and weaker 2010 results based on tax returns processed since the 2011 Budget. The PIT change also reflects a positive $27 million impact in 2011–12 due to the 2011 federal budget measures as previously announced in the First Quarter Ontario Finances.

2011 Ontario Economic Outlook and Fiscal Review
64
• Corporations Tax (CT) revenue is up $30 million, reflecting the impact of the 2011 federal budget measures as previously announced in the First Quarter Ontario Finances.
• Ontario Health Premium revenue is projected to be $129 million, or 4.2 per cent, lower due to slower economic growth in 2011 and 2012 and weaker 2010 results based on tax returns processed since the 2011 Budget.
• Land Transfer Tax revenue is expected to be $125 million, or 10.0 per cent, higher consistent with recent strength in the Ontario housing market.
• Other Taxes are forecast to be $59 million higher due to stronger 2011 instalment payments and prior-year reassessments of Mining Tax.
• Electricity Payments-in-Lieu of Taxes are $14 million lower due to the Ontario Energy Board’s March 10, 2011 decision with respect to Ontario Power Generation Inc.’s rate application for 2011 and 2012, previously reported in the First Quarter Ontario Finances.
• Government of Canada transfers are projected to decrease by $175 million, or 0.8 per cent, largely due to a $150 million downward revision to Ontario’s Equalization entitlement for 2011–12. This is a result of the federal government calculation error as previously reported in the First Quarter Ontario Finances. In addition, there is a $36 million reduction in infrastructure revenue related to the federal Residential Rehabilitation Assistance Program funding that will now flow directly from the federal government to municipalities rather than through the Province. These decreases are partially offset by an $11 million increase for approved projects under the Ontario Small Town and Rural Development Infrastructure Initiative as previously announced in the First Quarter Ontario Finances.
• The $39 million decrease in net income from Government Business Enterprises reflects the Ontario Energy Board decision noted above.

Chapter III: Fiscal Outlook
65
• Other Non-Tax Revenue is projected to increase by $422 million, largely reflecting:
• a $468 million gain from Chrysler’s repayment of an Ontario loan as previously announced in the First Quarter Ontario Finances; and
• a $46 million fiscally neutral net decrease in Non-Tax Revenue reflecting revenue changes that have been offset by lower 2011–12 expense.
2011–12 Expense Changes Since the 2011 Budget
Total expense has decreased by $264.4 million primarily due to lower interest on debt expense resulting from lower interest rates than forecast at the time of the 2011 Budget and the lower deficit in 2010–11.
TABLE 3. Summary of Expense Changes Since the Budget1 ($ Millions)
2011–12 Program Expense Changes Proposed Healthy Homes Renovation Tax Credit 60.0 Savings in business support programs and tax-related expenditures (60.0) Emergency forest firefighting 175.0 Pan/Parapan American Games athletes’ village 52.0 Other program expenses 9.6 Contingency funds (308.1)
Total Program Expense Changes (71.6) Interest on Debt (192.9)
Total Expense Changes Since the Budget (264.4) 1 See note at the bottom of Table 11 for more information regarding the fiscally neutral accounting change. Note: Numbers may not add due to rounding.
Details of 2011–12 In-Year Expense Changes
Key 2011–12 expense changes from the 2011 Budget forecast include:
• An increase of $60.0 million for the proposed Healthy Homes Renovation Tax Credit.

2011 Ontario Economic Outlook and Fiscal Review
66
• $60.0 million in savings in business support programs and tax-related expenditures, identified from lower spending on existing business support programs in the Ministry of Economic Development and Trade, as well as lower-than-forecast costs for tax-related expenditures in the Ministry of Revenue. These savings fully offset the cost of the proposed Healthy Homes Renovation Tax Credit in 2011–12.
• An increase of $175.0 million for emergency forest firefighting, to provide additional resources during the 2011 fire season, the second-largest fire season for hectares burned since recordkeeping began in 1917.
• An increase of $52.0 million for the Pan/Parapan American Games athletes’ village to support initial construction work at the site of the village. The work will move forward construction costs that were planned for future years, and will help ensure Ontario is ready for the Games in 2015 without increasing the total cost of the village.
• A net increase of $9.6 million in other program expenses, including Disaster Relief Assistance for the Town of Goderich, the surrounding area and victims impacted by the August 2011 tornado; and for Ontario Bridge Training programs.
• A net decrease of $308.1 million in the contingency funds, reflecting the balance of changes in program expense.
Interest on Debt expense is $192.9 million lower than forecast in the 2011 Budget. This reduction primarily reflects the impact of lower interest rates than those projected at the time of the Budget, and the lower deficit in 2010–11.

Chapter III: Fiscal Outlook
67
Section C: Ontario’s Medium-Term Fiscal Outlook
Medium-Term Revenue Outlook
The medium-term revenue forecast reflects the Ministry of Finance’s economic outlook and the estimated impact of government policy measures.
TABLE 4. Summary of Medium-Term Revenue Outlook1 ($ Billions)
Actual Projected Outlook
Revenue 2010–11 2011–12 2012–13 2013–14 Taxation Revenue 71.1 74.6 77.8 81.1
Government of Canada 23.0 21.6 21.6 22.8
Income from Government Business Enterprises
4.6 4.5 4.8 5.2
Other Non-Tax Revenue 7.9 7.6 7.2 7.2
Total Revenue 106.7 108.3 111.3 116.3 1 See note at the bottom of Table 11 for more information regarding the fiscally neutral accounting change. Note: Numbers may not add due to rounding.
The medium-term Taxation Revenue outlook reflects current revenue information and projections for the Province’s economic growth as outlined in Chapter II: Ontario’s Economic Outlook.
The forecast for Government of Canada transfers is based on existing federal–provincial funding arrangements. The decline from 2010–11 to 2011–12 is largely due to the decline in federal transitional assistance related to the introduction of the Harmonized Sales Tax and lower stimulus funding for infrastructure and labour market programs.

2011 Ontario Economic Outlook and Fiscal Review
68
The outlook for Income from Government Business Enterprises (GBEs) is based on projections from the GBEs. Revenue is projected to decline slightly in 2011–12, largely due to the Ontario Lottery and Gaming Corporation’s strong performance in 2010–11, and Ontario First Nations’ receipt, beginning in 2011, of 1.7 per cent of gross gaming revenues under the Gaming Revenue Sharing and Financial Agreement, projected at $117 million in 2011–12. Over the forecast period, revenue is projected to grow at an average annual rate of 4.4 per cent. The forecast for GBEs includes $200 million in efficiencies by 2013–14 that the government has instructed its agencies to deliver.
The forecast for Other Non-Tax Revenue is based on projections provided by government ministries and provincial agencies. The decrease in 2011–12 reflects the government’s previously announced decision to upload the municipal share of Ontario Disability Support Program costs and the full-year impact of the replacement of certain alcohol charges, including Beer and Wine Fees, with taxes beginning on July 1, 2010. The further decline in 2012–13 reflects one-time factors that boosted Non-Tax Revenues in each of 2010–11 and 2011–12. These included, in 2010–11, the sale of a portion of the Province’s General Motors shares and the Province’s share of civil agreements with certain tobacco manufacturers and, in 2011–12, receipts from the repayment of an Ontario loan by Chrysler, as discussed in the First Quarter Ontario Finances.

Chapter III: Fiscal Outlook
69
Medium-Term Revenue Changes Since the 2011 Budget
TABLE 5. Summary of Medium-Term Revenue Changes Since the Budget1
($ Billions)
Source of Change 2011–12 2012–13 2013–14 Taxation Revenue (0.7) (0.5) (0.6) Equalization Payments (0.2) (0.2) (0.3) Other Revenue 0.4 0.0 0.0
Total Revenue Changes (0.4) (0.8) (0.9) 1 See note at the bottom of Table 11 for more information regarding the fiscally neutral accounting change. Note: Numbers may not add due to rounding.
The lower medium-term revenue outlook is largely due to lower taxation revenue and a downward revision to Ontario’s Equalization entitlement for 2011–12 as a result of a federal government calculation error.
The outlook for Taxation Revenue is lower due to slower economic growth and a lower estimated 2010 tax base indicated by tax returns processed since the 2011 Budget. There is an additional one-time impact in 2011–12 reflecting variances from the 2010–11 Public Accounts.
Equalization Payments are lower over the medium term due to a downward revision to Ontario’s entitlement for 2011–12 as a result of a federal government calculation error. This revision impacted the forecast going forward.
The $0.4 billion increase in Other Revenue in 2011–12 largely reflects Chrysler’s repayment of its Ontario loan discussed above. The forecast for Other Revenue also reflects fiscally neutral revenue changes referenced in Section B of this chapter.

2011 Ontario Economic Outlook and Fiscal Review
70
Medium-Term Expense Outlook
Total expense is projected to grow to $128.7 billion by 2013–14 — below the forecast included in the 2011 Budget — primarily due to lower interest on debt expense.
Program expense over the medium term is consistent with the 2011 Budget Plan. This includes the impact of the proposed Healthy Homes Renovation Tax Credit announced in this Ontario Economic Outlook and Fiscal Review to help support jobs and economic activity, which has been accommodated without increasing overall program spending.
The government is committed to balancing the implementation of new programs and protecting public services while meeting the targets for eliminating the deficit.

Chapter III: Fiscal Outlook
71
Medium-Term Fiscal Outlook
Despite forecasts of slower economic growth, the Province is on track to meet the fiscal targets laid out in the 2011 Budget. Ontario’s fiscal outlook continues to project steadily declining deficits of $16.0 billion in 2011–12, $15.2 billion in 2012–13 and $13.3 billion in 2013–14.
Provincial revenue is now projected to grow at a slower rate than forecast, primarily due to lower economic growth projections for Ontario.
Total expense is now forecast to be lower than projected at the time of the 2011 Budget, primarily due to lower interest on debt expense.
A $1.0 billion reserve has been maintained for 2012–13 and 2013–14, recognizing ongoing global economic uncertainty and the significant volatility that could cause variances to both the Province’s revenue and expense outlooks.
To continue the progress Ontarians have made in building strong public health care and education, the Province must now sharpen its focus on managing growth in spending. Ontario has had success in meeting this challenge in the very recent past by lowering growth in program spending from about seven per cent to approximately four per cent last year.
The government remains committed to the fiscal targets laid out in the 2011 Budget. At that time the government presented a plan to hold average annual growth in program expense to 1.4 per cent until the budget is balanced in 2017–18. The Province will have to find better, more efficient ways to invest in key priority areas. Given the current economic uncertainty, the Commission on the Reform of Ontario’s Public Services is expected to recommend that the target for spending growth should be one per cent. The government will consider this and other advice as it prepares for the 2012 Budget.

2011 Ontario Economic Outlook and Fiscal Review
72

Chapter III: Fiscal Outlook
73
Section D: Federal–Provincial Fiscal Arrangements
Over the last few years, the Province has worked with the federal government to promote economic growth and job creation to meet the challenge of a global recession, including providing financial support to the auto industry. The Province has also urged the federal government to address unfair treatment of Ontarians in the Canadian federation. Progress has been made on both these fronts, including recent federal legislation to increase the number of Ontario’s representatives in the federal House of Commons by 15 to 121. But more work remains to be done.
Historically, Ontario has been Canada’s economic engine, supporting investments in other provinces and the delivery of vital public services across the country. While Ontario’s economy has in many respects recovered from the global recession, continuing global economic uncertainty requires ongoing and enhanced investment in the foundation for sustained economic growth and job creation.
A key component of sustained economic growth and job creation is a strong workforce. Although the Province continues to invest in the tools that Ontarians need to prosper in the new economy, the federal Employment Insurance program is still failing to meet the needs of Ontario’s unemployed workers and the modern labour market.
The federal government supports industries like the oil industry. Ontario looks to the federal government to invest in the province’s future as a leader in green energy.
Ontario welcomes the federal government’s commitment to a six per cent annual increase in the Canada Health Transfer for the duration of the next health accord. The Province has called on the federal government to begin discussions with provincial and territorial governments on a new Ten-Year Health Accord, which would also include additional funding for seniors’ care and home care. These discussions must start as soon as possible in order to complete a new accord by the end of 2012.

2011 Ontario Economic Outlook and Fiscal Review
74
In 2011–12, the Ontario government expects to receive $2.2 billion in Equalization payments, while Ontarians will contribute about $5.8 billion to the program. The $3.6 billion difference between what Ontarians pay into the Equalization program and the Province receives back from the program enables other provinces to reduce taxes, build roads and deliver public services to the people who live there.
Ontario is the only province that receives Equalization payments and that also sees its taxpayers pay more into the program than their government receives. Although the Province will receive 15 per cent of Equalization payments this year, Ontario taxpayers will contribute almost 40 per cent of the program’s cost. That is unfair. Equalization to other provinces costs each Ontarian about $270 this year.
(500)
0
500
1,000
1,500
2,000
2,500
ON QC NS MB NB PEI
Net Contribution represents Equalization payments received less taxpayer contributions through federal revenue. Source: Ontario Ministry of Finance.
$ Per Capita
CHART 2. Net Cost of Equalization to Ontarians (2011–12)

Chapter III: Fiscal Outlook
75
Canada’s transfer system should help — not hinder — the Ontario government’s ability to invest in the provincial economy. Reform of the federal transfer system must include more than the Canada Health Transfer. Increases in the Canada Health Transfer must not come at the expense of other important transfers such as the Canada Social Transfer and those that support services and programs like labour-market training, reducing health care wait times and infrastructure.
Federal initiatives should not undermine the ability of provincial governments to fund and deliver services that their taxpayers require, like health care and education, by forcing scarce resources to be diverted elsewhere. Accordingly, Ontario recently joined the Quebec government in asking the federal government to provide additional funding to address any provincial costs that may result from proposed changes to the criminal justice system. Ontario is also calling on the federal government to ensure that proposed measures such as income splitting and Tax-Free Savings Accounts do not adversely affect the Province’s capacity to fund core public services.
Ontarians demand that their federal and provincial governments work together. They also rightly demand that, as taxpayers, they be treated fairly.
The Ontario government looks forward to working with the federal government and other provincial and territorial governments to realize a comprehensive, equitable and efficient system of federal transfers that supports the sustainable delivery of quality services like health care across the country.

2011 Ontario Economic Outlook and Fiscal Review
76

Chapter III: Fiscal Outlook
77
Section E: Details of Ontario’s Finances This section provides information on the Province’s current fiscal outlook, historical financial performance and key fiscal indicators.
TABLE 6. Medium-Term Fiscal Plan and Outlook ($ Billions)
Actual Projected Outlook
2010–111 2011–12 2012–13 2013–14 Revenue 106.7 108.3 111.3 116.3 Expense Programs 111.2 114.0 114.9 117.0 Interest on Debt2 9.5 10.1 10.6 11.7
Total Expense 120.7 124.1 125.5 128.7 Reserve – 0.2 1.0 1.0
Surplus/(Deficit) (14.0) (16.0) (15.2) (13.3)
Net Debt 214.5 238.4 261.8 281.8 Accumulated Deficit 144.6 160.6 175.7 189.1 1 In the 2011 Budget, the interim projection for the 2010–11 deficit was $16.7 billion. 2 Interest on Debt expense is net of interest capitalized during construction of tangible capital assets of $0.2 billion in
2010–11, $0.3 billion in 2011–12, $0.3 billion in 2012–13 and $0.4 billion in 2013–14. Note: Numbers may not add due to rounding.
CHART 3. Ontario’s Medium-Term Fiscal Outlook
(14.0)(13.3)
(15.2)(16.0)
(20.0)
(15.0)
(10.0)
(5.0)
0.0
2010–11 2011–12 2012–13 2013–14
Fiscal Balance($ Billions)
(16.7) (16.3)
Medium-Term OutlookCurrent OutlookActual
2011 Ontario BudgetFall 2011 Ontario EconomicOutlook and Fiscal Review

2011 Ontario Economic Outlook and Fiscal Review
78
TABLE 7. Revenue ($ Millions)
2008–09 2009–10 Actual
2010–11
Current Outlook 2011–12
Taxation Revenue Personal Income Tax 25,738 23,393 23,624 24,779 Sales Tax1 17,021 17,059 18,813 20,134 Corporations Tax 6,748 5,615 8,383 8,904 Education Property Tax2 5,696 5,626 5,913 5,727 Employer Health Tax 4,617 4,545 4,733 4,991 Ontario Health Premium 2,776 2,763 2,934 2,945 Gasoline Tax 2,323 2,336 2,358 2,392 Land Transfer Tax 1,013 1,015 1,247 1,374 Tobacco Tax 1,044 1,083 1,160 1,142 Fuel Tax 698 658 702 721 Beer and Wine Tax (replacing Fees)3 – – 397 538 Electricity Payments-In-Lieu of Taxes 830 516 321 518 Other Taxes 352 322 562 455
68,856 64,931 71,147 74,620 Government of Canada Canada Health Transfer 8,942 9,791 10,184 10,713 Canada Social Transfer 4,079 4,204 4,330 4,460 Equalization – 347 972 2,200 Infrastructure Programs 151 990 1,712 513 Labour Market Programs 797 1,253 1,201 891 Social Housing 520 498 493 482 Wait Times Reduction Fund 235 97 97 97 Other Federal Payments 1,867 1,440 4,052 2,200
16,591 18,620 23,041 21,556 Government Business Enterprises Ontario Lottery and Gaming Corporation 1,921 1,924 1,956 1,738 Liquor Control Board of Ontario 1,410 1,440 1,562 1,641 Ontario Power Generation Inc./Hydro One Inc. 713 854 1,048 1,092 Other Government Enterprises (2) (23) – –
4,042 4,195 4,566 4,471 Other Non-Tax Revenue Reimbursements 1,379 1,429 1,036 791 Vehicle and Driver Registration Fees 1,034 1,057 1,080 1,084 Electricity Debt Retirement Charge 970 907 944 931 Power Supply Contract Recoveries 953 1,409 1,288 1,351 Sales and Rentals 733 647 1,015 1,021 Other Fees and Licences 683 717 715 788 Beer and Wine Fees (replaced by Tax)3 459 451 181 – Net Reduction of Power Purchase Contract Liability 373 348 339 317 Royalties 205 228 145 218 Miscellaneous Other Non-Tax Revenue 655 854 1,161 1,127
7,444 8,047 7,904 7,628
Total Revenue 96,933 95,793 106,658 108,275 1 Sales Tax in 2010–11 includes Retail Sales Tax (RST) and Harmonized Sales Tax (HST). The RST was replaced with a value-added tax
and combined with the federal Goods and Services Tax to create a federally administered HST. Sales Tax revenue includes the Ontario Sales Tax Credit and the energy component of the Ontario Energy and Property Tax Credit.
2 Education Property Tax revenue includes the property tax credit component of the Ontario Energy and Property Tax Credit. 3 Beer and Wine Tax replaces reduced Beer and Wine Fees and the reduced sales tax on alcohol. There is no net new revenue for the Province. Note: Numbers may not add due to rounding.

Chapter III: Fiscal Outlook
79
TABLE 8. Total Expense ($ Millions)
Ministry Expense 2008–09 2009–10 Actual
2010–11
Current Outlook 2011–12
Aboriginal Affairs 55 67 71 77.1
Agriculture, Food and Rural Affairs1 877 1,265 888 1,244.3
Attorney General 1,749 1,663 1,737 1,907.9
Board of Internal Economy 188 187 194 293.9
Children and Youth Services 3,223 3,588 3,835 3,947.5
Citizenship and Immigration 89 101 106 114.5
Community and Social Services 7,992 8,621 9,148 9,770.0
Community Safety and Correctional Services 2,121 2,201 2,610 2,755.5
Consumer Services 18 17 18 20.4
Economic Development and Trade 245 223 267 343.1
Education1 20,471 21,177 21,850 23,212.0
Energy1 326 469 700 335.5
Environment1 379 375 521 526.1
Executive Offices 35 34 32 32.4
Finance1 602 492 496 552.0
Francophone Affairs, Office of 5 5 5 5.5
Government Services1 945 1,113 973 1,081.5
Health and Long-Term Care 40,352 42,725 44,085 47,128.5
Health Promotion and Sport1 382 385 385 398.4
Infrastructure2 (75) (178) (246) (72.7)
Labour 177 179 187 190.8
Municipal Affairs and Housing1 725 664 672 608.8
Natural Resources 605 624 676 822.9
Northern Development, Mines and Forestry 645 653 823 846.2
Research and Innovation1 295 333 349 369.5
Revenue1 635 1,129 900 904.2
Tourism and Culture1 566 668 793 900.5
Training, Colleges and Universities1 6,081 6,479 6,501 6,998.3
Transportation1 2,033 2,092 2,263 2,348.4
Interest on Debt3 8,566 8,719 9,480 10,096.9
Other Expense1 3,035 8,985 10,350 7,383.2
Year-End Savings4 – – – (1,075.0)
Total Expense 103,342 115,055 120,669 124,068.1 1 Details on other ministry expense can be found in Table 9, Other Expense. 2 Credit expense amounts are a result of adjustments between the Ministry of Infrastructure and other ministries to reflect
consolidated net spending on realty assets for the year. 3 Interest on debt is net of interest capitalized during construction of tangible capital assets of $203 million in 2010–11 and
$268 million in 2011–12. 4 As in past years, the Year-End Savings provision reflects anticipated underspending that has historically arisen at year-end due to
factors such as program efficiencies and changes in project start-ups and implementation plans. Notes: Future updates will reflect the impact of recently announced ministry restructuring.
Numbers may not add due to rounding.

2011 Ontario Economic Outlook and Fiscal Review
80
TABLE 9. Other Expense ($ Millions)
Ministry Expense 2008–09 2009–10 Actual
2010–11
Current Outlook 2011–12
Agriculture, Food and Rural Affairs
Time-Limited Investments in Infrastructure – 618 1,496 293.4
Time-Limited Assistance 13 27 9 –
Education
Teachers’ Pension Plan1 50 255 522 526.0
Energy
Ontario Clean Energy Benefit – – 300 1,135.0
Environment
One-Time Investments 68 37 – –
Finance
One-Time Automotive Sector Support2 75 3,022 – –
Ontario Municipal Partnership Fund 905 781 684 623.7
Operating Contingency Fund – – – 359.5
Pension Benefit Guarantee Fund – 500 – –
Power Supply Contract Costs 953 1,409 1,288 1,351.0
Government Services
Pension and Other Employee Future Benefits 971 949 1,182 1,341.0
Health Promotion and Sport
Time-Limited Investments in Infrastructure – 48 288 44.2
Time-Limited Investments to Support Pan/Parapan Am Games
– – 15 28.3
Infrastructure
Capital Contingency Fund – – – 32.3
Municipal Affairs and Housing
Time-Limited Investments in Municipal Social and Affordable Housing Stock
– 585 668 58.7
One-Time Assistance – – 21 –
Research and Innovation
One-Time Investments – 5 – –
Revenue
Harmonized Sales Tax Transitional Support – – 3,039 1,440.6
Tourism and Culture
One-Time Investments – – 22 3.1
Training, Colleges and Universities
Time-Limited Investments – 559 816 146.3
Transportation
One-Time Transit and Infrastructure Investments – 190 – –
Total Other Expense 3,035 8,985 10,350 7,383.2 1 Numbers reflect PSAB pension expense. Ontario's matching contributions to the plan grow from $1,070 million in 2008–09 to
$1,381 million in 2011–12. 2 Reflects the fiscal impact of Ontario's $4.6 billion in support to the automotive industry. Notes: Future updates will reflect the impact of recently announced ministry restructuring details.
Numbers may not add due to rounding.

Chapter III: Fiscal Outlook
81
TABLE 10. 2011–12 Infrastructure Expenditures ($ Millions)
2011–12 Current Outlook
Sector
Total Infrastructure Expenditures
2010–11 Actual
Investment in Capital
Assets1
Transfers and Other
Infrastructure Expenditures2
Total Infrastructure Expenditures
Transportation
Transit 1,735 2,093 391 2,483
Provincial Highways 1,925 2,114 – 2,114
Other Transportation3 769 712 92 804
Health
Hospitals 2,625 2,620 10 2,630
Other Health 439 120 171 291
Education 1,714 2,092 30 2,121
Postsecondary
Colleges 344 168 – 168
Universities 105 – 107 107
Water/Environment 245 41 249 290
Municipal and Local Infrastructure 514 134 183 316
Justice 613 851 52 903
Other 583 707 18 725
Short-Term Stimulus Investments 3,598 42 451 493
Subtotal 15,209 11,692 1,754 13,447
Less: Other Partner Funding4 597 674 – 674
Total Excluding Partner Funding 14,612 11,019 1,754 12,773
Less: Flow-Throughs5 340 96 578 673
Total Provincial Expenditure6 14,272 10,923 1,177 12,100 1 Investment in Capital Assets includes interest capitalized during construction of tangible capital assets of
$268 million. 2 Mainly consists of transfers for capital purposes to municipalities and universities, and expenditures for
capital repairs. 3 Other Transportation includes planning activities, property acquisition, highway service centres and other
infrastructure programs (e.g., municipal/ local roads, remote airports). 4 Third-party contributions to capital investment in the consolidated sectors (schools, colleges and hospitals). 5 Mostly federal government transfers for capital investments. 6 Total Provincial Infrastructure Expenditure includes Investment in Capital Assets of $9.8 billion for 2010–11.
This includes a one-time adjustment of $0.3 billion for consolidation of a number of agencies. This also includes adjustments for the net book value of assets disposed of during the year, as well as changes in valuation.
Note: Numbers may not add due to rounding.

2011 Ontario Economic Outlook and Fiscal Review
82
TABLE 11. Ten-Year Review of Selected Financial and Economic Statistics1
($ Millions)
2002–032 2003–04 2004–05 Financial Transactions Revenue 74,675 74,269 83,861 Expense Programs 64,864 70,148 76,048 Interest on Debt4 9,694 9,604 9,368
Total Expense 74,558 79,752 85,416 Reserve – – –
Surplus/(Deficit) 117 (5,483) (1,555)
Net Debt5 132,647 138,816 140,921 Accumulated Deficit 118,705 124,188 125,743
Gross Domestic Product (GDP) at Market Prices 477,763 493,081 516,106 Personal Income 369,420 381,127 400,994
Population — July (000s) 12,091 12,242 12,391 Net Debt per Capita (dollars) 10,971 11,339 11,373 Personal Income per Capita (dollars) 30,553 31,133 32,362
Interest on Debt as a per cent of Revenue 13.0 12.9 11.2 Net Debt as a per cent of GDP 27.8 28.2 27.3 Accumulated Deficit as a per cent of GDP 24.8 25.2 24.4 1 Revenue and expense have been restated to reflect a fiscally neutral accounting change for the revised
presentation of education property taxes, as described in the 2010 Ontario Budget. 2 Starting in 2002–03, investments in major tangible capital assets owned by the Province (land, buildings and
transportation infrastructure) have been capitalized and amortized to expense over their useful lives. Starting in 2009–10, investments in minor tangible capital assets owned by the Province were capitalized and amortized to expense. All capital assets owned by consolidated organizations are being accounted for in a similar manner.
3 Starting in 2005–06, the Province’s financial reporting was expanded to include hospitals, school boards and colleges. Total expense prior to 2005–06 has not been restated to reflect expanded reporting.
4 Interest on Debt is net of interest capitalized during construction of tangible capital assets of $148 million in 2009–10, $203 million in 2010–11 and $268 million in 2011–12.
5 Starting in 2009–10, Net Debt includes the net debt of hospitals, school boards and colleges consistent with Public Sector Accounting Board standards. For comparative purposes, Net Debt has been restated from 2005–06 to 2008–09 to conform with this revised presentation. Net Debt has also been restated from 2003–04 to 2005–06 to reflect the value of hydro corridor lands transferred to the Province from Hydro One Inc.
Sources: Ontario Ministry of Finance and Statistics Canada.

Chapter III: Fiscal Outlook
83
2005–063 2006–07 2007–08 2008–09 2009–102 Actual
2010–11
Current Outlook 2011–12
90,305 96,640 103,579 96,933 95,793 106,658 108,275
80,988 85,540 94,065 94,776 106,336 111,189 113,971 9,019 8,831 8,914 8,566 8,719 9,480 10,097
90,007 94,371 102,979 103,342 115,055 120,669 124,068 – – – – – – 200
298 2,269 600 (6,409) (19,262) (14,011) (15,994)
152,702 153,742 156,616 169,585 193,589 214,511 238,368 109,155 106,776 105,617 113,238 130,957 144,573 160,567
537,383 560,576 583,946 587,055 581,635 612,494 636,996 419,457 442,736 466,051 479,217 480,061 500,048 516,550
12,528 12,665 12,793 12,934 13,073 13,228 13,373 12,189 12,139 12,242 13,112 14,808 16,216 17,825 33,482 34,957 36,430 37,051 36,722 37,802 38,626
10.0 9.1 8.6 8.8 9.1 8.9 9.3 28.4 27.4 26.8 28.9 33.3 35.0 37.4 20.3 19.0 18.1 19.3 22.5 23.6 25.2
Note: Revenue and expense from the 2011 Budget and First Quarter Ontario Finances have both increased by identical amounts ($0.3 billion) from the original presentation to reflect a fiscally neutral reclassification of three government agencies (Algonquin Forestry Authority, Niagara Parks Commission and Ontario Clean Water Agency) from government business enterprises to other government organizations since they no longer meet the criteria for classification as government business enterprises. As well, three other government organizations (Forestry Renewal Trust, Ontario Arts Council and Ottawa Convention Centre) have recently crossed the threshold for consolidation. Although the consolidation of these organizations resulted in a one-time increase to revenue in the 2010–11 Public Accounts ($0.2 billion), these changes are not expected to impact the Province’s annual forecasted surplus/deficit.

2011 Ontario Economic Outlook and Fiscal Review
84
CHART 4. Composition of Revenue, 2011–12
Education Property Tax5% $5.7B
Personal Income Tax23% $24.8B
Employer Health Tax5% $5.0B
Corporations Tax8% $8.9B
Gasoline and Fuel Taxes3% $3.1B
Other Taxes4% $4.0B
Other Non-Tax Revenue7% $7.6B
Income fromGovernment Enterprises
4% $4.5BOntario Health Premium3% $2.9B
Federal Payments
20% $21.6B
Sales Tax19% $20.1B
Note: Numbers may not add due to rounding.

Chapter III: Fiscal Outlook
85
Postsecondary and Training Sector
6% $7.1B
Interest on Debt8% $10.1B
Justice Sector4% $4.7B
Children’s and Social Services Sector
11% $13.7B
Other Programs14% $17.6B
Education Sector1
19% $23.2B
Health Sector38% $47.6B
1 Excludes Teachers’ Pension Plan.Note: Numbers may not add due to rounding.
CHART 5. Composition of Total Expense, 2011–12
Postsecondary and Training Sector
6% $7.1BJustice Sector
4% $4.7B
Health Sector42% $47.6B
Other Programs15% $17.6B
Education Sector2
20% $23.2B
1 Program expense equals total expenseminus interest on debt.
2 Excludes Teachers’ Pension Plan.Note: Numbers may not add due to rounding.
Children’s and Social Services Sector
12% $13.7B
CHART 6. Composition of Program Expense1, 2011–12

2011 Ontario Economic Outlook and Fiscal Review
86

CHAPTER IVbORROWing AnD
DEbT mAnAgEmEnT


Chapter IV: Borrowing and Debt Management
89
Highlights
The total long-term public borrowing requirement over the forecast period has been reduced by $3.6 billion compared to the 2011 Budget, primarily because of the lower deficit recorded in the 2010–11 Public Accounts and the lower projected deficit in 2011–12.
Long-term public borrowing for 2011–12 will remain at the Budget forecast of $35 billion to smooth the borrowing program over the next three years while taking advantage of historically low interest rates and robust demand for Ontario long-term debt.
Interest on debt (IOD) expense in 2011–12, at $10,097 million, is $193 million less than forecast in the 2011 Budget. This reduction in IOD primarily reflects the impact of lower interest rates and the lower deficit in 2010–11.
Total debt is projected to be $257.3 billion as at March 31, 2012.
Net debt is projected to be $238.4 billion as at March 31, 2012.

2011 Ontario Economic Outlook and Fiscal Review
90
Long-Term Public Borrowing
The forecast long-term public borrowing requirement for 2011–12 is $35.0 billion. As at November 15, 2011, $24.3 billion, or 70 per cent, of the long-term borrowing requirement was completed. This figure includes Ontario Savings Bond sales of $0.6 billion.
The Province has been able to continue to extend the term to maturity of its debt while locking in interest rates below the forecast used in the 2011 Budget. The weighted-average term to maturity of long-term provincial debt issued so far in 2011–12 is 11.6 years, compared to 12.8 years for 2010–11 and 8.1 years for 2009–10. This term to maturity extension reduces refinancing risks and helps offset the impact of expected higher interest rates in future years on the Province’s interest on debt (IOD) costs.
The IOD expense in 2011–12, at $10,097 million, is $193 million less than forecast in the 2011 Budget. This reduction in IOD primarily reflects the impact of lower interest rates and the lower deficit in 2010–11.
So far this year, Ontario has issued $18.2 billion (almost 75 per cent) in the Canadian dollar market, well above the 60 per cent target set out in the 2011 Budget. The Province now expects to end the year with more than 70 per cent of its borrowing in this market.

Chapter IV: Borrowing and Debt Management
Source: Ontario Financing Authority.
CHART 1. 2011–12 Borrowing — Canadian Dollar Market
C$18.2 Billion Issued
Ontario Savings Bonds$0.6B
3%
Floating Rate Notes$3.1B17%
Syndicated Issues$14.5B
80%
Canadian dollar borrowing has been completed through a number of instruments:
• syndicated issues
• floating rate notes
• Ontario Savings Bonds.
91

2011 Ontario Economic Outlook and Fiscal Review
Note: Numbers may not add due to rounding.Source: Ontario Financing Authority.
CHART 2. 2011–12 Borrowing — International Markets
C$6.2 Billion Issued
Norwegian kroner$0.1B
1%
Australian dollar$0.2B
4%
Global/U.S. dollar$5.8B95%
International markets have remained an important source of funding for Ontario this year. About $6.2 billion, or over 25 per cent, of borrowing has been completed in foreign currencies:
• three Global bonds in U.S. dollars
• two Euro Medium-Term Notes (EMTNs) in Norwegian kroner
• a Kangaroo bond in Australian dollars.
92

Chapter IV: Borrowing and Debt Management
93
TABLE 1. 2011–12 Borrowing Program: Province and Ontario Electricity Financial Corporation (OEFC)
($ Billions)
Budget
Plan Current Outlook
In-Year Change
Deficit 16.3 16.0 (0.3) Investment in Capital Assets 10.9 10.9 – Non-Cash Adjustments (3.6) (3.6) – Net Loans/Investments 2.7 2.4 (0.3) Debt Maturities 13.9 13.9 – Debt Redemptions 0.5 0.3 (0.2) Total Funding Requirement 40.7 40.0 (0.7) Canada Pension Plan Borrowing (1.1) (1.1) – Decrease/(Increase) in Short-Term Borrowing – 0.7 0.7 Increase/(Decrease) in Cash and Cash Equivalents (4.6) (7.8)
(3.2)
Provision for Debt Buy-Backs – 3.2 3.2 Total Long-Term Public Borrowing 35.0 35.0 – Note: Numbers may not add due to rounding.
The lower deficit in 2010–11 resulted in the Province beginning 2011–12 with higher cash reserves than forecast at the time of the 2011 Budget. Still, long-term public borrowing will remain at the Budget forecast of $35 billion this fiscal year. This will allow the Province to smooth the borrowing program over the next three years, while taking advantage of historically low interest rates and robust demand for Ontario long-term debt.
The Province plans to buy back debt maturing over the next two fiscal years, as reflected in a new line in Tables 1 and 2, “Provision for Debt Buy-Backs,” if the opportunity arises. These debt buy-backs would result in the Province reducing Cash and Cash Equivalents by $3.2 billion more than forecast at the time of the Budget, while still ending fiscal 2011–12 with the same level of cash reserves as was targeted in the Budget.

2011 Ontario Economic Outlook and Fiscal Review
94
TABLE 2. Medium-Term Borrowing Outlook: Province and Ontario Electricity Financial Corporation (OEFC)
($ Billions)
2011–12 2012–13 2013–14 Deficit 16.0 15.2 13.3 Investment in Capital Assets 10.9 11.5 10.5 Non-Cash Adjustments (3.6) (3.4) (3.9) Net Loans/Investments 2.4 1.2 1.0 Debt Maturities 13.9 17.3 23.8 Debt Redemptions 0.3 0.3 0.3 Total Funding Requirement 40.0 42.1 45.1 Canada Pension Plan Borrowing (1.1) (0.8) – Decrease/(Increase) in Short-Term Borrowing 0.7 (3.0) (3.0) Increase/(Decrease) in Cash and Cash Equivalents (7.8) – – Provision for Debt Buy-Backs 3.2 (1.2) (2.0) Total Long-Term Public Borrowing 35.0 37.2 40.0 Note: Numbers may not add due to rounding.
The total long-term public borrowing requirement over the forecast period has been reduced by $3.6 billion compared to the 2011 Budget, primarily because of the lower deficit recorded in the 2010–11 Public Accounts and the lower projected deficit in 2011–12.
The availability of debt to buy back at fair prices with the appropriate accounting treatment will determine whether the Province proceeds with the planned debt buy-backs. If it is not cost effective to buy back debt, the Province will finish the year with higher cash reserves than targeted in the Budget. Either buying back debt, or retaining higher cash reserves, will have the same impact of decreasing the Province’s net debt from the Budget forecast.

Chapter IV: Borrowing and Debt Management
95
Debt
Total debt, which represents all borrowing without offsetting financial assets, is projected to be $257.3 billion as at March 31, 2012, compared to $236.6 billion as at March 31, 2011.
Ontario’s net debt is the difference between total liabilities and total financial assets. It is projected to be $238.4 billion as at March 31, 2012, compared to $241.5 billion forecast in the 2011 Budget. Net debt was $214.5 billion as at March 31, 2011.
Total Debt Composition
Total debt is composed of bonds issued in both the short- and long-term public capital markets and non-public debt.
Ontario had total debt of $251.9 billion as at September 30, 2011. Public debt totalled $236.8 billion, primarily consisting of bonds issued in the long-term markets in Canadian dollars, and internationally in U.S. dollars and nine other currencies. The Province also had $15.1 billion outstanding in non-public debt issued in Canadian dollars. Non-public debt mainly consists of debt instruments issued to public-sector pension funds in Ontario and the Canada Pension Plan Investment Board. This debt is not marketable and cannot be traded.

2011 Ontario Economic Outlook and Fiscal Review
Source: Ontario Financing Authority.
CHART 3. Total Debt Composition as at September 30, 2011
C$251.9 Billion
International bonds
• Canadian dollar
• U.S. dollar
• Euro
• Japanese yen
• New Zealand dollar
• Norwegian kroner
• Swiss franc
• U.K. sterling
• Australian dollar
• South African rand
• Hong Kong dollar
Domestic bonds
• Syndicated bonds
• Floating rate notes
• Ontario Savings Bonds
• Bond auctions
Treasury Bills and U.S. Commercial
Paper$15.1B
6%
Non-Public Debt$15.1B
6%
International Bonds$68.5B
27%
Domestic Bonds$153.2B
61%
Debt-to-GDP Ratios
The Province’s debt-to-GDP ratios are expected to increase due to the projected deficits. The ratios will stabilize and begin to decline as the deficit is eliminated.
96

Chapter IV: Borrowing and Debt Management
CHART 4. Net Debt-to-GDP
Net Debt has been restated to include Broader Public Sector Net Debt, starting in 2005–06.Source: Ontario Ministry of Finance.
29.2
32.230.4
27.428.9
40.9 41.3 41.1 40.339.039.6
37.4
27.8
13.6
17.4
27.5
30.9 31.4 32.9
29.1 28.2 28.426.8
33.3
21.6
30.1
27.3
35.0
10
15
20
25
30
35
40
45
1990
–91
1991
–92
1992
–93
1993
–94
1994
–95
1995
–96
1996
–97
1997
–98
1998
–99
1999
–00
2000
–01
2001
–02
2002
–03
2003
–04
2004
–05
2005
–06
2006
–07
2007
–08
2008
–09
2009
–10
2010
–11
2011
–12
2012
–13
2013
–14
2014
–15
2015
–16
2016
–17
2017
–18
Actual Outlook
Per Cent
97

2011 Ontario Economic Outlook and Fiscal Review
CHART 5. Accumulated Deficit-to-GDP
Source: Ontario Ministry of Finance.
29.2
32.230.4
27.7 27.6 27.025.9
27.426.625.2
23.6
19.319.0
24.8
13.6
17.4
27.5
30.9 31.4 32.9
29.1
25.2
20.3
18.1
22.521.6
30.1
24.4
10
15
20
25
30
35
40
45
50
1990
–91
1991
–92
1992
–93
1993
–94
1994
–95
1995
–96
1996
–97
1997
–98
1998
–99
1999
–00
2000
–01
2001
–02
2002
–03
2003
–04
2004
–05
2005
–06
2006
–07
2007
–08
2008
–09
2009
–10
2010
–11
2011
–12
2012
–13
2013
–14
2014
–15
2015
–16
2016
–17
2017
–18
Actual Outlook
Per Cent
98

Chapter IV: Borrowing and Debt Management
Cost of Debt
The effective interest rate (on a weighted-average basis) on total debt was 4.43 per cent as at September 30, 2011 (March 31, 2011, 4.54 per cent).
CHART 6. Effective Interest Rate (Weighted Average) on Total Debt
Sources: Ontario Public Accounts (1991–2011) and Ontario Financing Authority.
Per Cent
8.69.0
9.8
4.44.5
5.2
6.0
7.2
10.9 10.7
9.5 9.49.0
8.4
7.6
6.7
6.15.8
4.6
10.1
8.2
6.4
4
6
8
10
12
1990
–91
1991
–92
1992
–93
1993
–94
1994
–95
1995
–96
1996
–97
1997
–98
1998
–99
1999
–00
2000
–01
2001
–02
2002
–03
2003
–04
2004
–05
2005
–06
2006
–07
2007
–08
2008
–09
2009
–10
2010
–11
2011
–12
Risk Exposure
The Province limits itself to a maximum net interest rate resetting exposure of 35 per cent of debt issued for Provincial purposes and a maximum foreign exchange exposure of five per cent of debt issued for Provincial purposes. As at September 30, 2011, the net interest rate resetting exposure was 5.8 per cent and foreign exchange exposure was 1.1 per cent.
All exposures have remained well below policy limits in 2011–12.
99

2011 Ontario Economic Outlook and Fiscal Review
As a Percentage of Debt Issued for Provincial Purposes(Interest Rate Exposure Limit Set at 35 Per Cent)
CHART 7. Net Interest Rate Resetting Exposure
Excludes OEFC debt.Source: Ontario Financing Authority.
15.6
11.5 11.4
8.3
5.8
0
3
6
9
12
15
18
March 31, 2008 March 31, 2009 March 31, 2010 March 31, 2011 Sept. 30, 2011
100
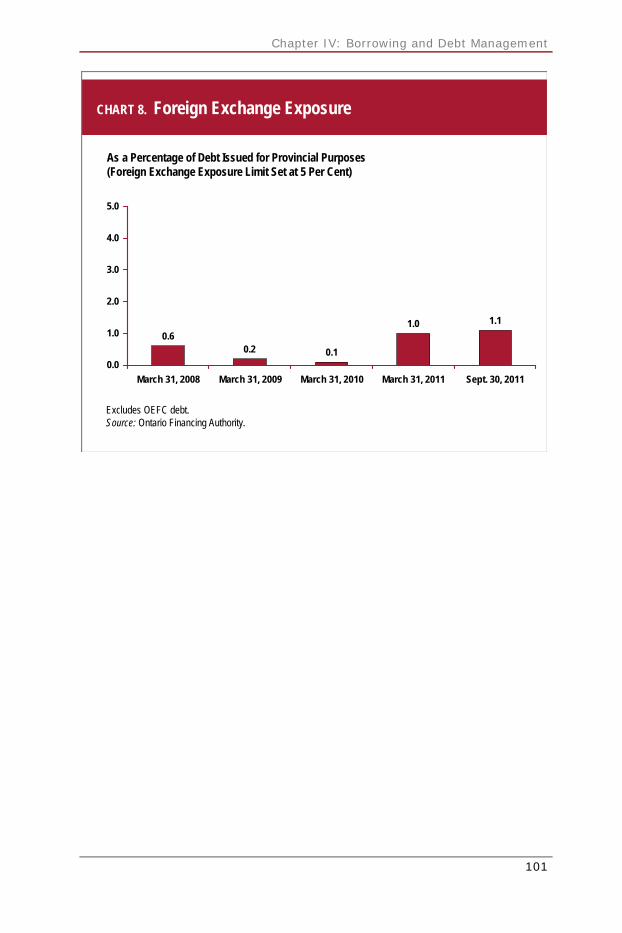
Chapter IV: Borrowing and Debt Management
As a Percentage of Debt Issued for Provincial Purposes(Foreign Exchange Exposure Limit Set at 5 Per Cent)
CHART 8. Foreign Exchange Exposure
Excludes OEFC debt.Source: Ontario Financing Authority.
0.60.2 0.1
1.0 1.1
0.0
1.0
2.0
3.0
4.0
5.0
March 31, 2008 March 31, 2009 March 31, 2010 March 31, 2011 Sept. 30, 2011
101

2011 Ontario Economic Outlook and Fiscal Review
102

CHAPTER VTAXATiOn AnD PEnsiOns


Chapter V: Taxation and Pensions
105
Highlights
Ontario’s Tax Plan for Jobs and Growth is providing $12 billion in tax relief for people and more than $4.8 billion in business tax relief over three years, beginning in 2010–11.
The proposed Healthy Homes Renovation Tax Credit would allow seniors or family members who are sharing a home with a senior to claim a refundable tax credit for permanent modifications that improve accessibility or help a senior be more functional or mobile at home.
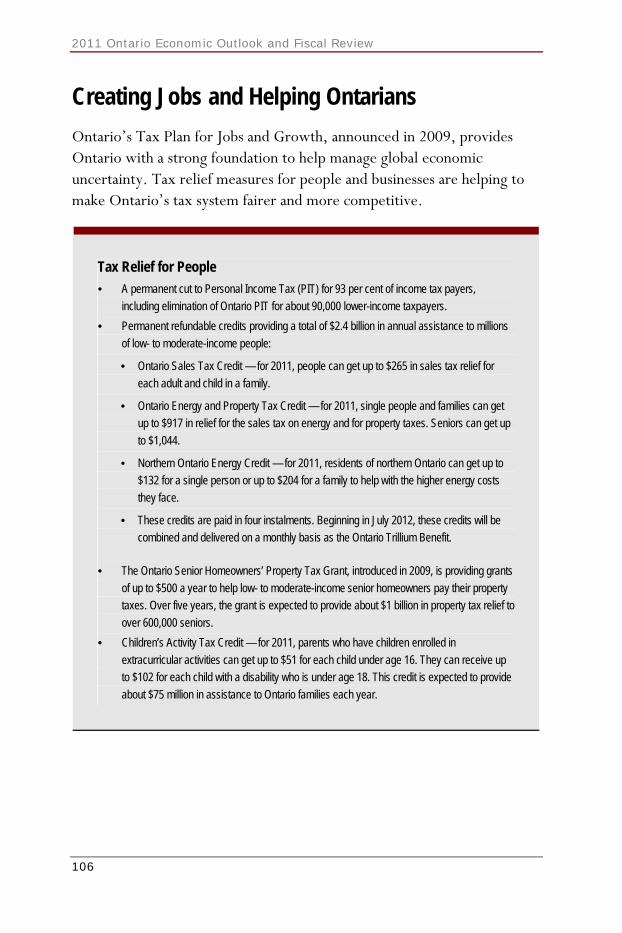
2011 Ontario Economic Outlook and Fiscal Review
106
Creating Jobs and Helping Ontarians
Ontario’s Tax Plan for Jobs and Growth, announced in 2009, provides Ontario with a strong foundation to help manage global economic uncertainty. Tax relief measures for people and businesses are helping to make Ontario’s tax system fairer and more competitive.
Tax Relief for People
• A permanent cut to Personal Income Tax (PIT) for 93 per cent of income tax payers,
including elimination of Ontario PIT for about 90,000 lower-income taxpayers.
• Permanent refundable credits providing a total of $2.4 billion in annual assistance to millions
of low- to moderate-income people:
• Ontario Sales Tax Credit — for 2011, people can get up to $265 in sales tax relief for
each adult and child in a family.
• Ontario Energy and Property Tax Credit — for 2011, single people and families can get
up to $917 in relief for the sales tax on energy and for property taxes. Seniors can get up
to $1,044.
• Northern Ontario Energy Credit — for 2011, residents of northern Ontario can get up to
$132 for a single person or up to $204 for a family to help with the higher energy costs
they face.
• These credits are paid in four instalments. Beginning in July 2012, these credits will be
combined and delivered on a monthly basis as the Ontario Trillium Benefit.
• The Ontario Senior Homeowners’ Property Tax Grant, introduced in 2009, is providing grants
of up to $500 a year to help low- to moderate-income senior homeowners pay their property
taxes. Over five years, the grant is expected to provide about $1 billion in property tax relief to
over 600,000 seniors.
• Children’s Activity Tax Credit — for 2011, parents who have children enrolled in
extracurricular activities can get up to $51 for each child under age 16. They can receive up
to $102 for each child with a disability who is under age 18. This credit is expected to provide
about $75 million in assistance to Ontario families each year.

Chapter V: Taxation and Pensions
107
Healthy Homes Renovation Tax Credit
The government is proposing a new Healthy Homes Renovation Tax Credit. If passed, this tax credit could stimulate economic growth through home renovation activity, and would also support around 10,500 jobs throughout the Ontario economy annually. Helping seniors stay in their homes, or in their families’ homes, frees up health resources for patients occupying costly beds in hospitals but who could be best cared for in a long-term care home.
Effective October 1, 2011, senior homeowners and tenants, and people who share a home with a senior relative, would be allowed to claim a refundable tax credit of up to $1,500 for expenses related to permanent modifications to the home.
Expenses would be eligible only to the extent that they improve accessibility or help a senior be more functional or mobile at home.
Expenses would not be eligible if their primary purpose is to increase the value of a home (for example, repairs to a roof, redecorating, new windows, new flooring, landscaping, general plumbing or electrical repairs, heating/air conditioning systems or insulation).
Expenses that would be eligible are illustrated by the list below.
To claim the tax credit, seniors or their family members would have to get receipts from suppliers and contractors, helping to ensure that these amounts are reported by vendors for tax purposes.
The credit would be calculated as 15 per cent of up to $10,000 in total eligible expenses for a senior’s principal residence in Ontario for a calendar year, for a maximum credit of $1,500 each year. The credit would be claimed on the Personal Income Tax return.
For the 2012 tax year only, the $10,000 maximum would apply to expenses paid or payable from October 1, 2011 to December 31, 2012.

2011 Ontario Economic Outlook and Fiscal Review
108
Examples of Eligible Expenses*
• Certain renovations to permit first-floor occupancy or secondary suites (“granny flats” or
“in-law suites”)
• Grab bars and related reinforcements around the toilet, bathtub and shower
• Hand rails in corridors
• Wheelchair ramps, stair/wheelchair lifts and elevators
• Bath lifts, walk-in bathtubs and wheel-in showers
• Widening passage doors
• Lowering existing counters/cupboards or installing adjustable counters/cupboards
• Light switches and electrical outlets placed in accessible locations
• Door locks that are easy to operate
• Lever handles on doors and taps instead of knobs
• Pull-out shelves under counter to enable work from a seated position
• Non-slip bathroom flooring
• A hand-held shower on adjustable rod or high-low mounting brackets
• Additional light fixtures throughout the home and exterior entrances
• Swing-clear hinges on doors to widen doorways
• Creation of knee space under the basin to enable use from a seated position (and insulation
of any hot-water pipes)
• Relocation of tap to front or side of a sink for easier access
• Hands-free taps
• Motion-activated lighting
• Touch-and-release drawers and cupboards and drawers that pull out fully
• Modular or removable versions of a permanent fixture, such as modular ramps and non-fixed
bath lifts
* Rules for eligibility would be set out in legislation. This list is not complete.
The tax credit is projected to cost the Province $60 million in 2011–12, which would be offset by savings in business support programs and tax-related expenditures.

Chapter V: Taxation and Pensions
109
Tax Relief for Businesses
Ontario’s Tax Plan for Jobs and Growth supports job creation and economic growth.
Tax Competitiveness
Ontario will reduce the general statutory Corporate Income Tax (CIT) rate to 10 per cent in 2013.
• The general CIT rate was reduced to 11.5 per cent effective July 1, 2011 and will be further
reduced to 11 per cent on July 1, 2012 and to 10 per cent on July 1, 2013.
• The CIT rate on income from manufacturing and processing, mining, logging, farming and fishing
has been reduced to 10 per cent.
• The small business CIT rate has been reduced to 4.5 per cent.
• The small business deduction surtax has been eliminated.
• The Corporate Minimum Tax (CMT) rate has been reduced to 2.7 per cent and more small and
medium-sized business have been exempted from the CMT.
The CIT rate reductions, along with other measures described below, will increase Ontario’s
competitiveness within Canada, with the province’s largest trading partner, the United States, and with
other jurisdictions around the world. In 2009, prior to the plan, Ontario’s general statutory CIT rate of
14 per cent was the second-highest provincial CIT rate in Canada. When Ontario’s general CIT rate
reaches 10 per cent in 2013, it will be among the lowest provincial rates in the country. Ontario’s tax
advantage over the average combined federal–state rate in the United States will widen from just over
six percentage points in 2009 to over 14 percentage points when the CIT rate reductions are fully
implemented. Ontario’s CIT rate reductions will put Ontario in line with the average CIT rate of
Organisation for Economic Co-operation and Development (OECD) member countries.
In addition to the CIT rate reductions in the Tax Plan, the Province has:
• introduced the Harmonized Sales Tax (HST), which, when fully implemented, removes
about $4.5 billion of embedded sales tax paid by business each year, allowing businesses to
lower prices;
• eliminated the Capital Tax on July 1, 2010, providing more than $1.6 billion of tax relief annually;
• moved to a single HST administration and a single corporate tax administration, providing
compliance cost savings to business of more than $635 million per year; and
• reduced Business Education Tax (BET) rates, saving businesses $540 million per year when
fully implemented in 2014.

2011 Ontario Economic Outlook and Fiscal Review
110
Strengthening Accountability and Transparency of Tax Expenditures
Public Sector Accounting Standard for Tax Revenue Reporting
The Public Sector Accounting Board (PSAB) of the Canadian Institute of Chartered Accountants published a standard for tax revenue after consultation with federal, provincial and territorial governments.
The PSAB standard for tax revenue distinguishes between tax expenditures that provide:
• relief to taxpayers of taxes paid or owing to the government (i.e., tax concessions), such as non-refundable tax credits; and
• financial benefits regardless of whether a recipient has paid or owes taxes, such as certain refundable tax credits.
Tax concessions would be netted against related tax revenue. Transfers made through a tax system would be reported as expenses, and appropriations approved by the legislature would be required.
As part of its continuing efforts to strengthen financial management, transparency and accountability for the spending of taxpayer dollars, the government will adopt the PSAB standard for tax revenue and begin to treat transfers made through the tax system as expenses.
Reviewing Business Tax Expenditures
Ontario’s tax plan has significantly enhanced tax competitiveness for businesses. Ontario will review business tax expenditures for effectiveness and administrative efficiency.

Chapter V: Taxation and Pensions
111
Since 2005, the Ontario government has been reporting tax expenditures as part of its fall economic
updates. The Fiscal Transparency and Accountability Act, 2004, stipulates that the mid-year review of
the fiscal plan must include information about the estimated cost of expenditures made through the tax
system. The Transparency in Taxation, 2011 report, which provides the most current estimates of
revenue forgone with respect to tax expenditures, can be found at:
www.fin.gov.on.ca/en/budget/fallstatement/2011/transparency.html
Strengthening the Integrity of the Tax System
Ontario’s ability to maintain a competitive tax system depends on the integrity and overall fairness of its business tax base. Ontario will continue to work with the federal government and other provinces to address tax loopholes and aggressive tax planning.
In addition, Ontario is calling on the federal government to strengthen the integrity of the corporate tax system by ensuring that tax losses are applied in a fair and reasonable manner and do not distort the principles of inter-provincial income allocation. Ontario continues to support the federal government’s review of corporate group taxation in Canada. As stated in the 2011 Ontario Budget, “Provincial governments have responsibility for key programs such as health and education, and are entitled to tax the economic activity taking place within their jurisdictions. The focus of any changes should be to increase the efficiency and competitiveness of the Canadian corporate tax system and ensure that provinces receive the revenues to which they are entitled.”
Federal Support for Research and Development
The federally appointed panel leading the Review of Federal Support for Research and Development (R&D) submitted its final report to the federal government in October 2011. The report makes a series of recommendations relating to federal direct spending and the Scientific Research and Experimental Development (SR&ED) tax incentive program.

2011 Ontario Economic Outlook and Fiscal Review
112
Ontario shares the federal government’s interest in enhancing business innovation and welcomes efforts to improve the effectiveness and administration of federal programs. Ontario parallels the base of the federal SR&ED tax incentives and will be reviewing any federal changes that would impact R&D tax support for businesses in Ontario.
Ontario’s innovative businesses benefit from federal direct spending and the SR&ED tax incentive program. Any changes to federal R&D assistance should focus on greater effectiveness and fairness and should be done in consultation with the provinces.

Chapter V: Taxation and Pensions
113
Securing Our Retirement Future
Ontario is modernizing its pension legislation and actively representing Ontarians in national discussions about improving Canada’s retirement income system. This comprehensive approach includes:
• reforming Ontario’s employment pension system while balancing the interests of active pension plan members, pensioners and plan sponsors;
• protecting members and pensioners by responding to the effects of economic uncertainty on pensions;
• further enhancing the sustainability of the Pension Benefits Guarantee Fund; and
• strengthening Canada’s retirement income system by supporting a modest, phased-in, fully funded enhancement to the Canada Pension Plan (CPP) as well as innovative ideas to improve employment pension coverage in a cost-effective manner.
In 2010, the Ontario legislature unanimously approved the Pension Benefits Amendment Act, 2010 and the Securing Pension Benefits Now and for the Future Act, 2010. These two bills marked the most significant reform of the Pension Benefits Act in more than 20 years. The government is now working on the regulatory amendments required to implement many of these new provisions and other proposed amendments announced by the minister.
Since the release of the Province’s discussion paper, “Securing Our Retirement Future: Consulting with Ontarians on Canada’s Retirement Income System” in October 2010, the government has received over 1,000 responses from business, labour groups and individual stakeholders. In the paper, CPP expansion and Pooled Registered Pension Plans (PRPPs) are presented as options for improving retirement income security for Ontarians. The government is working with its federal, provincial and territorial partners to assess approaches to CPP expansion and consider the framework for PRPPs.

2011 Ontario Economic Outlook and Fiscal Review
114

CHAPTER VIHOW TO PARTiCiPATE in THE
2012 PRE-bUDgET COnsUlTATiOns

Chapter VI: How to Participate in the 2012 Pre-Budget Consultations
117
How to Participate in the 2012 Pre-Budget Consultations
The Minister of Finance will be hosting pre-budget consultations with people, organizations, associations and other stakeholders as part of the McGuinty government’s ongoing dialogue with the citizens of Ontario.
Through the use of modern technology, including virtual town halls, the Minister of Finance will reach a broader audience in communities throughout the province.
In particular, the Minister of Finance is interested in hearing Ontarians’ views regarding what more the government can do to create jobs and improve services for people, while eliminating the deficit.
Below is information on how you can share your views and ideas for the upcoming 2012 Ontario Budget.
Written Submissions
Individuals and organizations can mail, email or fax submissions directly to the Minister of Finance.
Mailing Address
The Honourable Dwight Duncan Minister of Finance c/o Budget Secretariat Frost Building North, 3rd Floor 95 Grosvenor Street Toronto, ON M7A 1Z1
Email Address

2011 Ontario Economic Outlook and Fiscal Review
118
Fax
416-325-0969
Online Submissions
Individuals can also submit ideas for the 2012 Budget by completing a form on the Ministry of Finance website at www.fin.gov.on.ca. Click on the “Pre-Budget Consultations” item in the Ontario’s Fiscal Cycle menu.


© QUEEN ’S PRINTER FOR ONTARIO, 2011
ISSN 1483-5967 (PRINT ) | ISSN 1496-2829 (PDF/HTML)
2011