section: behavioral/systems/cognitive...
TRANSCRIPT
1
Section: Behavioral/Systems/Cognitive Neuroscience
Senior Editor: John H. R. Maunsell
Title: Working Memory and Visual Perception Compete for Attention: An ERP/EEG
Study
Abbreviated Title: Working Memory and Perception
Authors: Yigal Agam & Robert Sekuler, Volen Center for Complex Systems, Brandeis
University, 415 South St., Waltham MA 02454, USA
Corresponding Author: Yigal Agam, [email protected]
Number of figures: 4
Number of Tables: 0
Number of Pages: 20
Keywords: Working Memory, Perception, Attention, Working Memory Models, EEG,
ERP
Acknowledgements: This study was supported by in part by National Science Foundation
grant SBE-0354378 and National Institute of Health grant R01MH-068404.
Page 1 of 25
ScholarOne, 375 Greenbrier Drive, Charlottesville, VA, 22901
The Journal of NeuroscienceFor Peer Review Only
2
Abstract
How do visual memory and visual perception interact with each other? Recent theories of
working memory have suggested that they are closely linked, and in fact share certain brain
mechanisms. In most studies of working memory, perception is separated in time from
memory maintenance, which typically is probed during the delay period. This temporal
separation makes it difficult to directly study interactions between the two processes. Here
we take a different approach, using a sequential motion imitation task for a direct, online
examination of memory load’s influence on the processing of visual stimuli. Based on
event-related potentials (ERPs) and frequency analysis of the electroencephalogram (EEG),
we show that the processing of successive incoming visual stimuli becomes less and less
effective as additional items have to be held in working memory. Using a task in which
subjects tried to reproduce random motion sequences from memory, we found a systematic
decrease in ERP amplitude with each additional motion segment that was viewed and
memorized for later imitation. High-frequency (>20 Hz) oscillatory activity exhibited a
similar position-dependent decrease. As both ERP amplitude and high-frequency
oscillations are known to reflect visual processing and selective attention, our results
suggest that visual working memory harnesses cognitive resources that might otherwise be
used in visual perception. Such a tradeoff between memory and perception may underlie
fundamental properties of working memory, such as limited capacity and primacy effects.
Page 2 of 25
ScholarOne, 375 Greenbrier Drive, Charlottesville, VA, 22901
The Journal of NeuroscienceFor Peer Review Only
3
The interplay between working memory, i.e., the short-term storage of information, and
perception, has been the subject of considerable debate. Even though working memory has
received much attention from researchers in psychology and cognitive neuroscience, little is
known about the mechanisms that give rise to this ability, and, more specifically, it is
unclear to what degree the short-term storage of sensory information overlaps with sensory
processing. One approach conceptualizes working memory as a set of specialized buffers
for the storage of information (Baddeley, 2003), which are controlled by an attention-based
structure, the central executive. The multi-component, modular model emphasizes limited
amounts of activation and temporal decay in the buffers as the sources of capacity
limitations in working memory (Baddeley and Logie, 1999). Physiological demonstrations
of activity in the prefrontal cortex (PFC) during the memory retention period have lead to
the identification of the PFC as the neural substrate for the proposed storage buffers
(Goldman-Rakic, 1987; Postle, 2006). An alternative view treats working memory not as a
separate module, but as an emergent property, which harnesses existing neural mechanisms
specialized for sensory perception and long-term memory representations (Cowan, 1999;
Jonides et al., 2005; Pasternak and Greenlee, 2005; Postle, 2006). By this account, after the
visual stimulus has disappeared from sight, visuospatial working memory is achieved by
prolonged activations, via attention, of the same occipital and parietal regions that are
thought to mediate visual perception (Postle et al., 2003; Todd and Marois, 2004; Vogel
and Machizawa, 2004). The prefrontal cortex, in turn, is said to mediate attentional control
of the sensory reactivation process (Curtis and D'Esposito, 2003; Lebedev et al., 2004;
Postle, 2005), rather than provide the actual substrate for memory storage. This “emergent
Page 3 of 25
ScholarOne, 375 Greenbrier Drive, Charlottesville, VA, 22901
The Journal of NeuroscienceFor Peer Review Only
4
property” approach emphasizes attentional control as a limiting factor in working memory
capacity (Cowan, 1999).
The majority of working memory studies has focused on neural activity during the retention
period, in the absence of incoming stimuli. Although this approach provides valuable
information related to the maintenance of information, it is unsuitable to address the
interactions between working memory and perception, as the two processes are separated in
time. A different approach would be to gauge perceptual responses in the presence of
varying working memory loads. This can be done with a procedure in which items of visual
information are presented sequentially, so that subjects have to keep early items in working
memory while encoding subsequently presented items. Under these conditions, by
recording neural responses to each additional item, one could measure the consequences of
the growth in the amount of stored information (Grune et al., 1996; Sederberg et al., 2006).
Scalp EEG recordings provide a good basis for such an analysis: First, they provide
excellent temporal resolution, essential for evaluating differences between responses to
closely-spaced stimuli. Second, ERP and EEG markers provide valuable information about
visual perception: ERP amplitude is known to correlate with attentive visual processing
(Hillyard and Muente, 1984; Hillyard et al., 1998), as does activity in the high-frequency
(beta and gamma) bands of the EEG (Gruber et al., 1999; Müller et al., 2000; Tallon-
Baudry et al., 2005). Thus, we used those markers to track changes in subjects’ processing
of incoming visual motion information while they were attempting to hold previously seen
material in working memory.
Page 4 of 25
ScholarOne, 375 Greenbrier Drive, Charlottesville, VA, 22901
The Journal of NeuroscienceFor Peer Review Only
5
We recorded scalp EEG from human adults who performed a sequential imitation task
(Agam et al., 2005). Fig. 1a shows a schematic diagram of the experimental paradigm. On
each trial, subjects viewed a moving disc, whose trajectory comprised five randomly
oriented, connected linear segments. Then, several seconds later, subjects used a stylus and
a graphic tablet to reproduce the trajectory from working memory (see also supplementary
video clips). We focused on the period during which subjects were viewing the moving
disc, the idea being that as the disc progresses, there is more that the subject has to hold in
memory of what he or she has already seen. The result is that we would be measuring
responses to the disc’s motion under conditions of varying load in working memory. In a
control condition, meant to distinguish between effects of memory load and visual effects,
such as habituation, subjects viewed similar stimulus trajectories, but did not have to
remember the trajectory’s multiple segments. Instead, they were asked to detect changes in
the speed of the disc or matches between the directions of motion and a predefined
directional cue (see methods).
Another source of theoretical motivation came from a previous study (Agam et al., 2005),
in which we have proposed that memory for sequential material, such as the motions of a
disc, is carried out using “competitive queuing” (Bullock and Rhodes, 2003), a system that
exploits a magnitude code, or a “primacy gradient” (Page and Norris, 1998) to represent
remembered items’ serial order. In this scheme, serial order if implicitly represented by a
monotonously decreasing gradient of activation strengths. Such a pattern has in fact been
demonstrated in ensembles of single neurons in non-human primate PFC (Averbeck et al.,
2002). One unsolved puzzle is the origin of the primacy gradient; In this study, we sought
Page 5 of 25
ScholarOne, 375 Greenbrier Drive, Charlottesville, VA, 22901
The Journal of NeuroscienceFor Peer Review Only

6
clues as to how such a gradient may be generated while subjects view and encode the
motion sequences for later imitation.
Materials and Methods
Subjects and Procedure. Seventeen right-handed subjects (8 male, 9 female, age range 18-
26) participated after providing written informed consent. Each of the observers performed
between 200 and 240 trials of the imitation task (memory condition). As this task has been
previously described in detail (Agam et al., 2005), only a brief outline is given here: Each
stimulus model comprised a novel set of five directed motion segments, each 1.5 degrees
visual angle long, whose orientations varied quasi-randomly. The angular difference
between the orientations of each two adjacent segments was between 30 and 150 degrees.
The moving disc took 525 ms to traverse each segment; Successive segments were
separated by a 225 ms pause, in which the disc remained stationary. Subjects had to knit
together the directed components in their mind’s eye, and hold the trajectory in memory for
3.75 seconds. They then tried to reproduce it with a stylus on a graphic tablet (Wacom,
Vancouver, WA). The accuracy of the imitation was assessed by an automatic segmentation
algorithm (Agam et al., 2005), which used temporal and spatial criteria to decompose the
imitation into individual segments. After segmentation the orientations of each reproduced
segments was compared to the orientation of the corresponding segment in the stimulus
model. The difference between the corresponding orientations provided the main measure
of error in imitation.
Page 6 of 25
ScholarOne, 375 Greenbrier Drive, Charlottesville, VA, 22901
The Journal of NeuroscienceFor Peer Review Only
7
All seventeen subjects also performed a control task, in which stimuli were visually
identical to those in the imitation task. For nine subjects, on one third of 240 trials (which
were subsequently excluded from the analysis), the speed of the disc through one motion
segment changed relative to the normal speed by up to 25%. Subjects had to indicate
whether such a speed change happened on a given trial. The eight remaining subjects
performed a different control task: At the onset of every one of 100 trials, an arrow pointed
to a random direction. Subjects were asked to count on how many, out of fifteen segments,
the direction of motion matched the direction of the arrow. Only the first five segments,
which were visually identical to the stimuli in the memory condition, were included in the
analysis.
Electrophysiological Recordings and Analysis. We recorded from 129 electrode sites at
250 Hz using an Electrical Geodesics (Eugene, OR) system. Data were cleaned of bad
channels, re-referenced to the grand average and reduced to a standard 27-electrode
montage using BESA (MEGIS Software GmbH, Munich), then averaged and analyzed
using MATLAB (The Mathworks, Natick, MA). Blink artifacts were eliminated by
rejecting epochs in which the difference between the maximum and minimum voltage at
any electrode exceeded 100 µV. Data were notch-filtered at 60 Hz and high-pass filtered at
1 Hz. To calculate the energy of the ERP signal, the ERP trace at each electrode was
squared, summed and divided by the sample rate. For ERP analysis, an additional low-pass
filter was applied at 30 Hz. To calculate the energy of the ERP signal, the ERP trace at each
electrode was squared, summed and divided by the sample rate. For EEG analysis, energy
spectra were computed using a 512-point (Hann-windowed) Fourier transform on each
Page 7 of 25
ScholarOne, 375 Greenbrier Drive, Charlottesville, VA, 22901
The Journal of NeuroscienceFor Peer Review Only
8
segment. Oscillatory energy was summed across evenly-spaced points within each
frequency band (0.1 octave frequency steps), multiplied by 2 (to include negative
frequencies) and divided by the number of FFT points and by the sample rate. The total
energy in each band was log-transformed to correct for non-normality due to lower
bounding at zero.
Correcting for multiple comparisons. For each measure (ERP and EEG), we performed
108 comparisons: 27 electrode locations x 4 time bins or frequency bands. To correct for
the resulting inflated risk of false statistical inferences due to multiple comparisons
(Ludbrook, 1998), we used a random permutation procedure, which provides an empirical
estimate, given existing correlations in the data, of the probability of a Type I error, i.e.,
false rejection of the null hypothesis (Hwang et al., 2005; Sederberg et al., 2006). To
determine the appropriate significance threshold for the ANOVA tests, we randomized the
order of segments within each trial in every condition, so that correlations between nearby
electrodes and time points within a segment remained intact, but the effect of serial position
was abolished (Fig. 2a). This process was repeated 1,000 times, to produce a set of 1,000
random permutations. We then averaged the trials in each permutation and performed the
same statistical tests as we would perform on the real, unshuffled data. The number of
significant differences seen for a particular significance threshold, divided by 1,000,
provided the probability of a Type I error. For example, if half the permutations produced a
significant difference (Fig. 2b), then the global probability of a type I error would be 0.5,
much higher than the desired value of 0.05, meaning that the threshold for each individual
comparison needs to be reduced. Finally, we chose the significance threshold for individual
comparisons, so that the number of permutations that produced any false positives did not
Page 8 of 25
ScholarOne, 375 Greenbrier Drive, Charlottesville, VA, 22901
The Journal of NeuroscienceFor Peer Review Only
9
exceed 50 out of the 1,000 permutations, i.e., a global 0.05 probability of a Type I error
(Fig. 2c).
Results
To score the accuracy of each imitation, an automatic segmentation algorithm used
temporal and spatial criteria to break down each drawn path into individual segments. The
error for each segment was defined by the absolute difference in orientation between that
segment and the corresponding segment in the stimulus. Behaviorally, the results
demonstrated a pronounced primacy effect and a modest, one-item recency effect (Fig. 1b),
confirming previous findings with this paradigm (Agam et al., 2005).
Fig. 1c shows representative event-related potentials (ERPs) at five midline electrode
locations, time-locked to the onset of the disc’s first motion segment, and encompassing the
entire 3.75-second period in which subjects viewed the moving disc during the memory
task. The figure shows that every motion segment elicits a distinct electrical signature. To
examine changes across successive segments, we superimposed traces corresponding to
individual segments within each trial, and tested the averaged ERPs and energy spectra for
differences between segments in the memory and control conditions. As can be appreciated
from Fig. 1c, The ERP associated with the first segment is somewhat different from the
other segments’ ERPs, making a direct comparison difficult. This may be due to the onset
of the disc’s motion, which entails not only a change in the visual scene, but also a change
in context and in the subject’s arousal level. Such attentional transients are also known to
Page 9 of 25
ScholarOne, 375 Greenbrier Drive, Charlottesville, VA, 22901
The Journal of NeuroscienceFor Peer Review Only
10
be accompanied by a strong decrease in oscillatory activity, particularly in alpha band
(Klimesch, 1996). Indeed, both conditions produced highly significant differences between
segments in both time and frequency, in which the first segment was clearly an outlier. To
obtain more meaningful observations related to the effects of memory load per se, we
excluded the first segment from further analysis, and focused on segments 2 through 5.
Analysis of segment-by-segment ERPs focused on epochs of interest identified by visual
inspection of the data. We chose four temporal epochs that encompassed the most notable
features of the ERPs (Fig. 1c): The early, brief occipital peak at around 200 ms after the
onset of each segment, the large frontal peak at 300 ms, the smaller peak following it at
central electrodes, and the slower, final phase (450-750 ms), most notable at frontal and
occipital locations. The ERPs within each epoch were then averaged and subjected to a
repeated measures ANOVA at each of 27 electrode sites. Due to the large number of
statistical tests, we used a random permutation procedure to correct for multiple
comparisons and adjust the significance threshold for each individual test (see Methods).
Fig. 3a-d demonstrates the segment-by-segment differences between ERPs in the memory
and control conditions. The memory condition produced widely-distributed, significant
differences between successive segments of the trajectory. Specifically, as each successive
segment was seen, ERP amplitude decreased. No significant differences whatsoever
appeared in the perceptual control condition, indicating that differences among segments in
the memory condition are not caused by visual processes alone, but arise from the
requirement to encode and maintain successive components of the seen trajectory in
Page 10 of 25
ScholarOne, 375 Greenbrier Drive, Charlottesville, VA, 22901
The Journal of NeuroscienceFor Peer Review Only
11
working memory. The decreasing ERP amplitude suggests that processing of the disc’s
motion becomes less and less effective as more of the trajectory’s segments have to be held
in working memory. Just as increased attention enhances the amplitude of ERP components
multiplicatively (Van Voorhis and Hillyard, 1977; Hillyard and Muente, 1984; Hillyard et
al., 1998), we believe that early motion segments benefit from increased attention
compared to later ones, whose processing is shared with the rehearsal of early segments.
If the effects of memory load were widely distributed and multiplicative, then the mean
energy of the averaged ERP signal across the entire scalp could provide a useful, compact
index of the magnitude of the effects. Fig. 3e shows ERP energy averaged across
electrodes, as a function of serial position. Even though position was a significant factor in
the control condition (p<0.02, ANOVA), energy did not decrease consistently, and in fact
increased at the fifth segment. Conversely, in the memory condition, the ERP decreased
monotonously in energy (p<0.0001). A two-way ANOVA confirmed a strong interaction
between factors condition and serial position (p<0.0015).
To complement the ERP analysis, we examined changes in oscillatory activity between
segments. we divided the frequency spectrum into four standard frequency bands: theta,
alpha, beta and gamma (Hwang et al., 2005; Sederberg et al., 2006). We calculated the
mean energy across frequencies within each of the four frequency bands. Changes in
oscillatory energy during the presentation of segments 2-5 were assessed using a repeated-
measures ANOVA for every electrode location and frequency band. A similar procedure
was used to correct for multiple comparisons.
Page 11 of 25
ScholarOne, 375 Greenbrier Drive, Charlottesville, VA, 22901
The Journal of NeuroscienceFor Peer Review Only
12
High-frequency oscillations in the EEG demonstrated effects analogous to those seen with
ERPs. As with the ERPs, significant differences between segments were widespread across
the scalp, and were expressed exclusively in the memory condition. As Fig. 4a-f shows,
segmentwise differences in the EEG reveal a loss of energy in the high frequencies (beta
and gamma bands) as a function of serial position. In addition to comparing oscillatory
activity in individual electrodes, we calculated the mean energy across the entire scalp in
each of the frequency bands. Fig. 4g shows mean energy in each band as a function of
segment serial position. The only cases where a one-way ANOVA yielded a significant
result were with the beta and gamma bands (p<0.0001 for both) in the memory (but not the
control) condition. Likewise, a two-way ANOVA indicated an interaction between
condition and serial position only in the high-frequency bands (p<0.0025, beta; p<0.04,
gamma). High-frequency (>20 Hz) oscillations are known to correlate with attentive visual
processing, as shown by EEG (Gruber et al., 1999; Müller et al., 2000), intracranial EEG
(Tallon-Baudry et al., 2005), MEG (Sokolov et al., 1999) and monkey single-unit
(Womelsdorf et al., 2006) experiments. Our EEG results therefore support the idea of a
declining amount of attention directed towards visual processing as working memory
demands increase throughout the stimulus presentation.
Discussion
The two electrophysiological measures presented here bring together memory, perception
and attention. As mentioned earlier, ERP amplitude and high-frequency oscillations in the
Page 12 of 25
ScholarOne, 375 Greenbrier Drive, Charlottesville, VA, 22901
The Journal of NeuroscienceFor Peer Review Only
13
EEG are electrophysiological hallmarks of selective attention. Our results, then, suggest a
competition for attentional resources between remembering the directions of motion
segments and encoding incoming motion information. Such a competition for processing
resources has some interesting implications: Without resorting to temporal decay or storage
buffer size, competition provides a simple explanation of why working memory is so
severely limited in capacity. We propose that working memory capacity limitations, at least
in the nonverbal domain, arise from a tradeoff between the processing of incoming visual
information and the need to keep remembered visual material active. Furthermore, the
serial ordering observed in our data suggests that the primacy effect, i.e., the better recall of
early items (Fig. 1b), could result from the uneven distribution of attentional resources
available to encode successive motion segments, so that earlier segments benefit from more
robust encoding (Sederberg et al., 2006). As we mentioned earlier, some models of memory
for serial order (Page and Norris, 1998) assume a “primacy gradient”, in which the internal
representation of the first item is most strongly active, and activation strength decreases
with each additional item, thereby providing a strength-based code for serial order. We
have previously proposed (Agam et al., 2005) that such a process underlies behavioral
performance in the imitation task described here. The results of the present study raise the
possibility that such a gradient of activation does not constitute a mechanism per se, but
could be an implicit consequence of limitations on processing serial information with
equivalent reliability across successive items.
Although EEG affords excellent temporal resolution, its limited spatial sensitivity precludes
direct conclusions as to whether working memory uses the same brain areas that are
Page 13 of 25
ScholarOne, 375 Greenbrier Drive, Charlottesville, VA, 22901
The Journal of NeuroscienceFor Peer Review Only
14
specialized for perception. Our findings indicate some tradeoff between memory and
perception, which is also implied by emergent property accounts of memory (Postle, 2006).
However, our results are not dispositive. For example, the multiple-component account of
working memory could be modified to include an explicit connection between the so-called
“central executive” and the “crystallized systems” – sensory representations and long-term
memory stores (Baddeley, 2003). In this scheme, a working memory model would exploit
information in the perceptual module, directing attention towards that information at the
cost of attending to the current visual input. With such a modification, the multi-component
model could, in principle, accommodate our basic result as well as could the emergent
property view. In any case, the emphasis on attention as a limiting factor in working
memory (Cowan, 1999) does seem to be entirely justified. The tight correlation in our
results between attention-based perceptual effects and serial position (i.e., memory load)
implies a more unitary framework than that provided by the current multi-component
model (Baddeley, 2003).
References
Agam Y, Bullock D, Sekuler R (2005) Imitating unfamiliar sequences of connected
linear motions. J Neurophysiol 94:2832-2843.
Averbeck BB, Chafee MV, Crowe DA, Georgopoulos AP (2002) Parallel processing of
serial movements in prefrontal cortex. Proc Natl Acad Sci U S A 99:13172-
13177.
Page 14 of 25
ScholarOne, 375 Greenbrier Drive, Charlottesville, VA, 22901
The Journal of NeuroscienceFor Peer Review Only
15
Baddeley A (2003) Working memory: looking back and looking forward. Nat Rev
Neurosci 4:829-839.
Baddeley AD, Logie RH (1999) Working memory: The multiple-component model.
In: Models of Working Memory: Mechanisms of Active Maintenance and
Executive Control (Miyake A, Shah P, eds), pp 28-61. Cambridge: Cambridge
University Press.
Bullock D, Rhodes B (2003) Competitive queuing for serial planning and
performance. In: Handbook of brain theory and neural networks, 2nd Edition
(Arbib M, ed), pp 241-244. Cambridge, MA: MIT Press.
Cowan N (1999) An embedded-process model of working memory. In: Models of
Working Memory: Mechanisms of Active Maintenance and Executive Control
(Miyake A, Shah P, eds), pp 62-101. Cambridge: Cambridge University Press.
Curtis CE, D'Esposito M (2003) Persistent activity in the prefrontal cortex during
working memory. Trends Cogn Sci 7:415-423.
Goldman-Rakic PS (1987) Cellular and circuit basis of working memory in prefrontal
cortex of nonhuman primates. In: Progress in Brain Research (Uylings HBM,
Van Eden CG, De Bruin JPC, Corner MA, Feenstra MGP, eds), pp 325-336.
Amsterdam: Elsevier.
Gruber T, Müller MM, Keil A, Elbert T (1999) Selective visual-spatial attention alters
induced gamma band responses in the human EEG. Clin Neurophysiol
110:2074-2085.
Page 15 of 25
ScholarOne, 375 Greenbrier Drive, Charlottesville, VA, 22901
The Journal of NeuroscienceFor Peer Review Only

16
Grune K, Metz AM, Hagendorf H, Fischer S (1996) Information processing in
working memory and event-related brain potentials. Int J Psychophysiol
23:111-120.
Hillyard SA, Muente TF (1984) Selective attention to color and locational cues: an
analysis with event-related brain potentials. Percept Psychophys 36:185-198.
Hillyard SA, Vogel EK, Luck SJ (1998) Sensory gain control (amplification) as a
mechanism of selective attention: electrophysiological and neuroimaging
evidence. Philos Trans R Soc Lond B Biol Sci 353:1257-1270.
Hwang G, Jacobs J, Geller A, Danker J, Sekuler R, Kahana MJ (2005) EEG
correlates of verbal and nonverbal working memory. Behav Brain Funct 1:20.
Jonides J, Lacey SC, Nee DE (2005) Processes of working memory in mind and brain.
Curr Direct Psychol Sci 14:2-5.
Klimesch W (1996) Memory processes, brain oscillations and EEG synchronization.
Int J Psychophysiol 24:61-100.
Lebedev MA, Messinger A, Kralik JD, Wise SP (2004) Representation of attended
versus remembered locations in prefrontal cortex. PLoS Biol 2:e365.
Loftus GR, Masson MEJ (1994) Using confidence intervals in within-subject designs.
Psychon Bull Rev 1:476-490.
Ludbrook J (1998) Multiple comparison procedures updated. Clin Exp Pharmacol
Physiol 25:1032-1037.
Müller MM, Gruber T, Keil A (2000) Modulation of induced gamma band activity in
the human EEG by attention and visual information processing. Int J
Psychophysiol 38:283-299.
Page 16 of 25
ScholarOne, 375 Greenbrier Drive, Charlottesville, VA, 22901
The Journal of NeuroscienceFor Peer Review Only
17
Page MP, Norris D (1998) The primacy model: a new model of immediate serial recall.
Psychol Rev 105:761-781.
Pasternak T, Greenlee MW (2005) Working memory in primate sensory systems. Nat
Rev Neurosci 6:97-107.
Postle BR (2005) Delay-period activity in the prefrontal cortex: one function is
sensory gating. J Cogn Neurosci 17:1679-1690.
Postle BR (2006) Working memory as an emergent property of the mind and brain.
Neuroscience 139:23-38.
Postle BR, Druzgal TJ, D'Esposito M (2003) Seeking the neural substrates of visual
working memory storage. Cortex 39:927-946.
Sederberg PB, Gauthier LV, Terushkin V, Miller JF, Barnathan JA, Kahana MJ
(2006) Oscillatory Correlates of the Primacy Effect in Episodic Memory.
Neuroimage 32:1422-1431.
Sokolov A, Lutzenberger W, Pavlova M, Preissl H, Braun C, Birbaumer N (1999)
Gamma-band MEG activity to coherent motion depends on task-driven
attention. Neuroreport 10:1997-2000.
Tallon-Baudry C, Bertrand O, Henaff MA, Isnard J, Fischer C (2005) Attention
modulates gamma-band oscillations differently in the human lateral occipital
cortex and fusiform gyrus. Cereb Cortex 15:654-662.
Todd JJ, Marois R (2004) Capacity limit of visual short-term memory in human
posterior parietal cortex. Nature 428:751-754.
Van Voorhis S, Hillyard SA (1977) Visual evoked-potentials and selective attention to
points in space. Percept Psychopys 22:54-62.
Page 17 of 25
ScholarOne, 375 Greenbrier Drive, Charlottesville, VA, 22901
The Journal of NeuroscienceFor Peer Review Only
18
Vogel EK, Machizawa MG (2004) Neural activity predicts individual differences in
visual working memory capacity. Nature 428:748-751.
Womelsdorf T, Fries P, Mitra PP, Desimone R (2006) Gamma-band synchronization
in visual cortex predicts speed of change detection. Nature 439:733-736.
Figure Legends
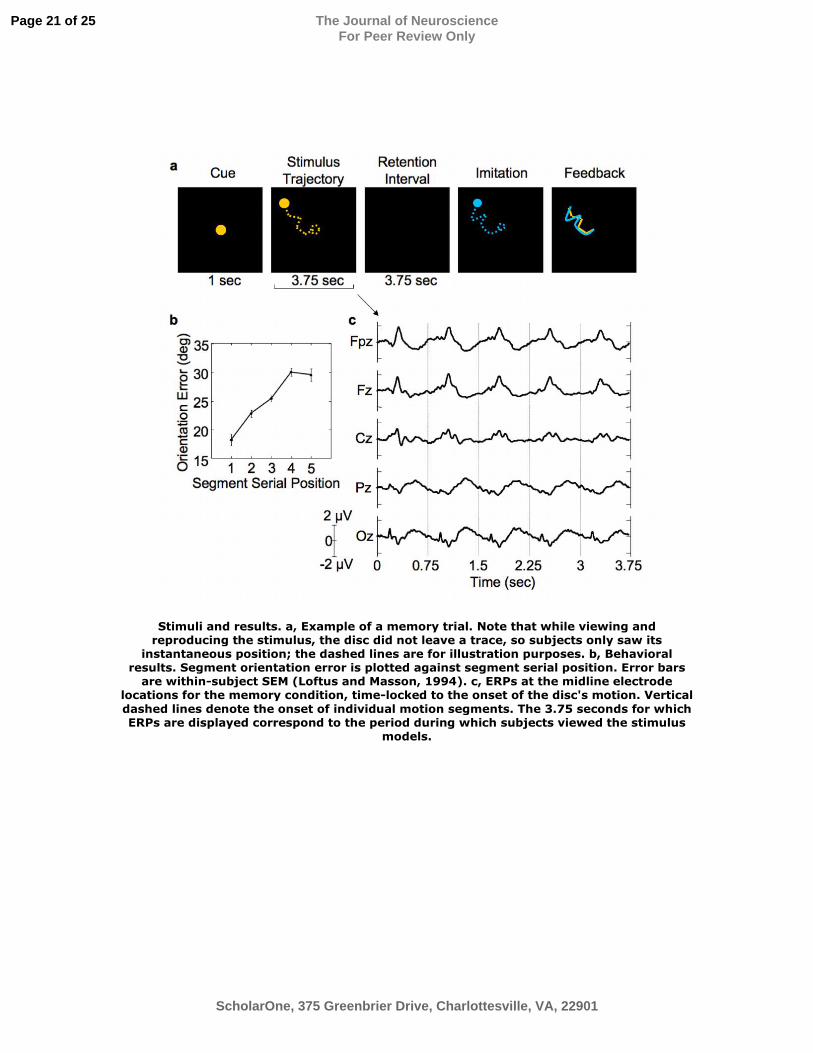
Figure 1: Stimuli and results. a, Example of a memory trial. Note that while viewing and
reproducing the stimulus, the disc did not leave a trace, so subjects only saw its
instantaneous position; the dashed lines are for illustration purposes. b, Behavioral results.
Segment orientation error is plotted against segment serial position. Error bars are within-
subject SEM (Loftus and Masson, 1994). c, ERPs at the midline electrode locations for the
memory condition, time-locked to the onset of the disc’s motion. Vertical dashed lines
denote the onset of individual motion segments. The 3.75 seconds for which ERPs are
displayed correspond to the period during which subjects viewed the stimulus models.
Figure 2: Schematic diagram of the random permutation procedure used to correct for
multiple comparisons. a, 1,000 random permutations of the data are created and subjected
to the same statistical tests as the real data. b, When using an arbitrary threshold t1 for each
individual test, about half the random permutation yield a significant difference, setting the
probability of a type I error at 0.5. c, With a lower threshold, t2, 950 of of 1,000
permutations yield no false positives, setting the type I error probability at its desired value
of 0.05.
Page 18 of 25
ScholarOne, 375 Greenbrier Drive, Charlottesville, VA, 22901
The Journal of NeuroscienceFor Peer Review Only
19
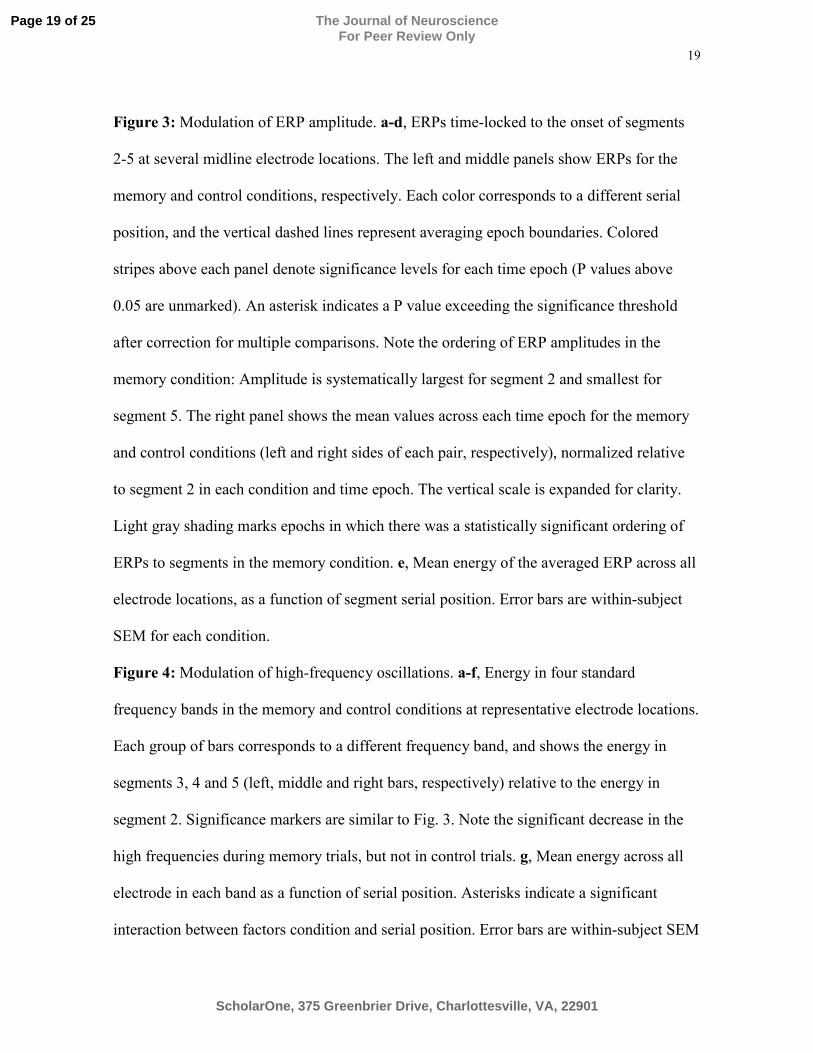
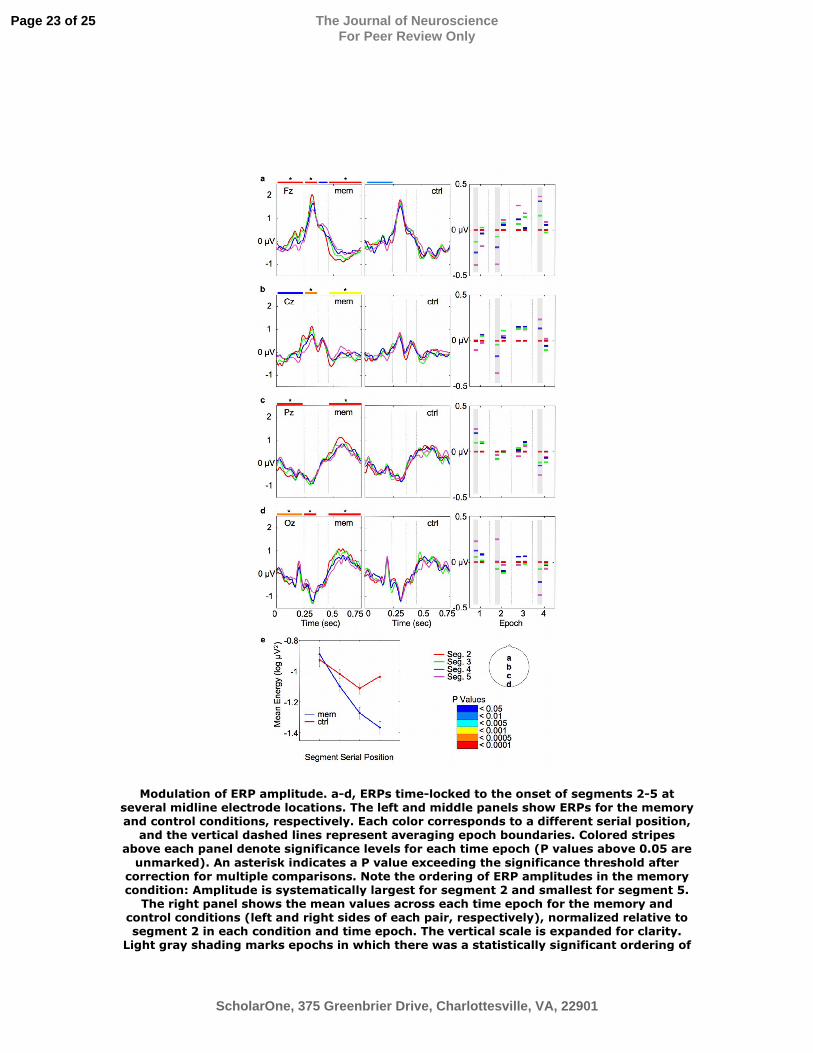
Figure 3: Modulation of ERP amplitude. a-d, ERPs time-locked to the onset of segments
2-5 at several midline electrode locations. The left and middle panels show ERPs for the
memory and control conditions, respectively. Each color corresponds to a different serial
position, and the vertical dashed lines represent averaging epoch boundaries. Colored
stripes above each panel denote significance levels for each time epoch (P values above
0.05 are unmarked). An asterisk indicates a P value exceeding the significance threshold
after correction for multiple comparisons. Note the ordering of ERP amplitudes in the
memory condition: Amplitude is systematically largest for segment 2 and smallest for
segment 5. The right panel shows the mean values across each time epoch for the memory
and control conditions (left and right sides of each pair, respectively), normalized relative
to segment 2 in each condition and time epoch. The vertical scale is expanded for clarity.
Light gray shading marks epochs in which there was a statistically significant ordering of
ERPs to segments in the memory condition. e, Mean energy of the averaged ERP across all
electrode locations, as a function of segment serial position. Error bars are within-subject
SEM for each condition.
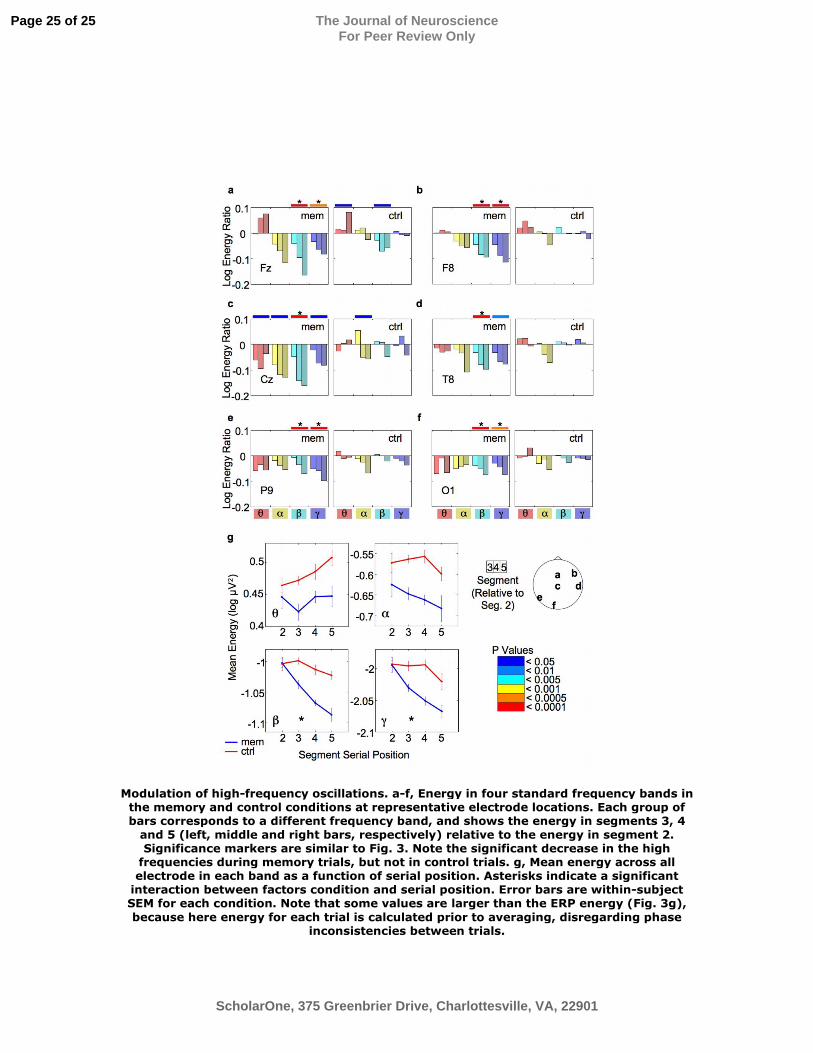
Figure 4: Modulation of high-frequency oscillations. a-f, Energy in four standard
frequency bands in the memory and control conditions at representative electrode locations.
Each group of bars corresponds to a different frequency band, and shows the energy in
segments 3, 4 and 5 (left, middle and right bars, respectively) relative to the energy in
segment 2. Significance markers are similar to Fig. 3. Note the significant decrease in the
high frequencies during memory trials, but not in control trials. g, Mean energy across all
electrode in each band as a function of serial position. Asterisks indicate a significant
interaction between factors condition and serial position. Error bars are within-subject SEM
Page 19 of 25
ScholarOne, 375 Greenbrier Drive, Charlottesville, VA, 22901
The Journal of NeuroscienceFor Peer Review Only

20
for each condition. Note that some values are larger than the ERP energy (Fig. 3g), because
here energy for each trial is calculated prior to averaging, disregarding phase
inconsistencies between trials.
Page 20 of 25
ScholarOne, 375 Greenbrier Drive, Charlottesville, VA, 22901
The Journal of NeuroscienceFor Peer Review Only
Stimuli and results. a, Example of a memory trial. Note that while viewing and reproducing the stimulus, the disc did not leave a trace, so subjects only saw its
instantaneous position; the dashed lines are for illustration purposes. b, Behavioral results. Segment orientation error is plotted against segment serial position. Error bars
are within-subject SEM (Loftus and Masson, 1994). c, ERPs at the midline electrode locations for the memory condition, time-locked to the onset of the disc's motion. Verticaldashed lines denote the onset of individual motion segments. The 3.75 seconds for which ERPs are displayed correspond to the period during which subjects viewed the stimulus
models.
Page 21 of 25
ScholarOne, 375 Greenbrier Drive, Charlottesville, VA, 22901
The Journal of NeuroscienceFor Peer Review Only
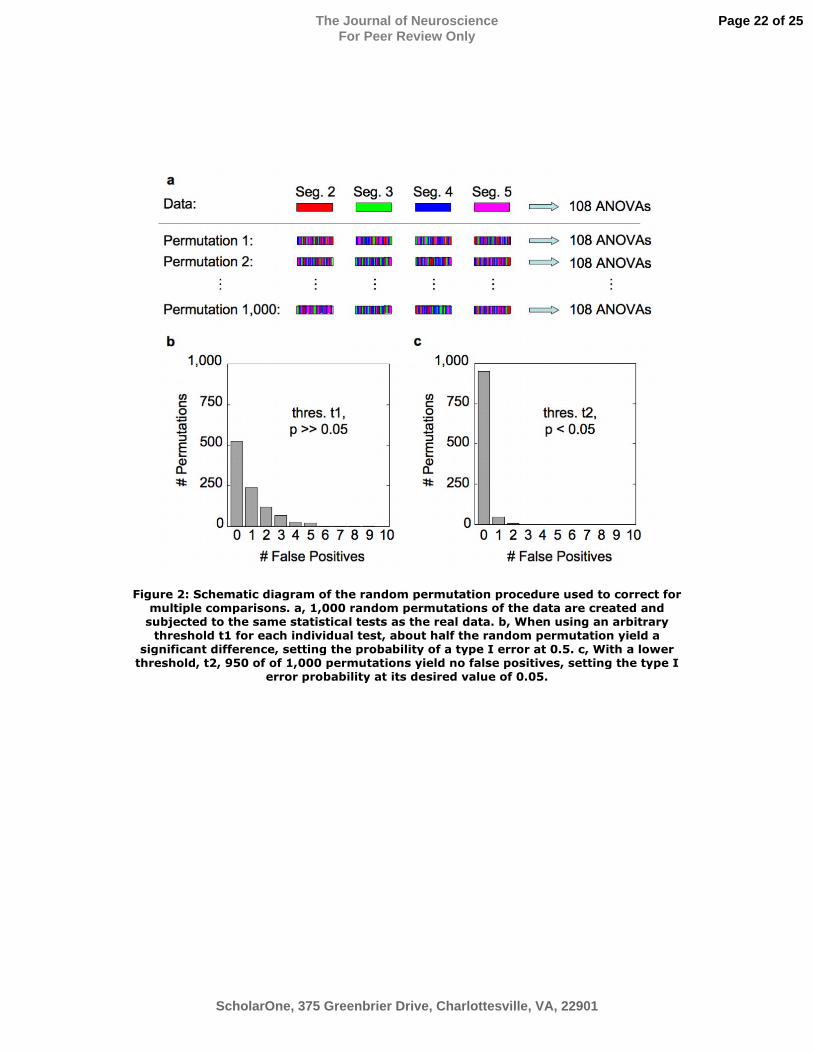
Figure 2: Schematic diagram of the random permutation procedure used to correct for multiple comparisons. a, 1,000 random permutations of the data are created and
subjected to the same statistical tests as the real data. b, When using an arbitrary threshold t1 for each individual test, about half the random permutation yield a
significant difference, setting the probability of a type I error at 0.5. c, With a lower threshold, t2, 950 of of 1,000 permutations yield no false positives, setting the type I
error probability at its desired value of 0.05.
Page 22 of 25
ScholarOne, 375 Greenbrier Drive, Charlottesville, VA, 22901
The Journal of NeuroscienceFor Peer Review Only
Modulation of ERP amplitude. a-d, ERPs time-locked to the onset of segments 2-5 at several midline electrode locations. The left and middle panels show ERPs for the memory and control conditions, respectively. Each color corresponds to a different serial position,
and the vertical dashed lines represent averaging epoch boundaries. Colored stripes above each panel denote significance levels for each time epoch (P values above 0.05 are
unmarked). An asterisk indicates a P value exceeding the significance threshold after correction for multiple comparisons. Note the ordering of ERP amplitudes in the memory condition: Amplitude is systematically largest for segment 2 and smallest for segment 5.
The right panel shows the mean values across each time epoch for the memory and control conditions (left and right sides of each pair, respectively), normalized relative to segment 2 in each condition and time epoch. The vertical scale is expanded for clarity.
Light gray shading marks epochs in which there was a statistically significant ordering of
Page 23 of 25
ScholarOne, 375 Greenbrier Drive, Charlottesville, VA, 22901
The Journal of NeuroscienceFor Peer Review Only

ERPs to segments in the memory condition. e, Mean energy of the averaged ERP across all electrode locations, as a function of segment serial position. Error bars are within-subject
SEM for each condition.
Page 24 of 25
ScholarOne, 375 Greenbrier Drive, Charlottesville, VA, 22901
The Journal of NeuroscienceFor Peer Review Only
Modulation of high-frequency oscillations. a-f, Energy in four standard frequency bands in the memory and control conditions at representative electrode locations. Each group of bars corresponds to a different frequency band, and shows the energy in segments 3, 4
and 5 (left, middle and right bars, respectively) relative to the energy in segment 2. Significance markers are similar to Fig. 3. Note the significant decrease in the high
frequencies during memory trials, but not in control trials. g, Mean energy across all electrode in each band as a function of serial position. Asterisks indicate a significant
interaction between factors condition and serial position. Error bars are within-subject SEM for each condition. Note that some values are larger than the ERP energy (Fig. 3g), because here energy for each trial is calculated prior to averaging, disregarding phase
inconsistencies between trials.
Page 25 of 25
ScholarOne, 375 Greenbrier Drive, Charlottesville, VA, 22901
The Journal of NeuroscienceFor Peer Review Only

Page 26 of 25
ScholarOne, 375 Greenbrier Drive, Charlottesville, VA, 22901
The Journal of NeuroscienceFor Peer Review Only
1
Description of Video Clips
Four video clips are provided, each depicting a different trial in the memory condition.
First, Subjects viewed the yellow disc moving along five randomly directed segment. Then,
following a brief retention interval, they tried to reproduce the disc’s trajectory with a
stylus on a graphic tablet. The blue disc’s motion on the display mirrored the motion of the
stylus on the tablet. Once finished reproducing the trajectory, subjects were shown their
imitation superimposed on the original stimulus model.
Page 27 of 25
ScholarOne, 375 Greenbrier Drive, Charlottesville, VA, 22901
The Journal of NeuroscienceFor Peer Review Only