sector intelligence: impact of covid-19
TRANSCRIPT

Sector Intelligence: Impact of COVID-19
LNG Industry
Updated: May 07, 2020

$9 trillion
Loss to global GDP 2020–21
Economic impact of 'great
lockdown’ (IMF)
$50+ billion
Reduction in CAPEX by oil &
gas majors, until March’20
~48%
Drop in average Brent price
(2020 vs 2019)
~9.1 MMT
Potential impact on LNG
demand in 2020 vs 2019 level
3.5%
(reduction in LNG demand from
2020 pre-COVID forecast)
(Scenario 1: Lockdown
extension until Q2’20)
$1.825/MMBTU
(Jun delivery)
New lows for JKM (on 28
Apr’20)
~60%
Drop in JKM price since early
2020
~$1.3/MMBTU
Lowest recorded tender price
(new low)
>110 MMT
Possible impact on FIDs in
2020
22+
Number of impacted
liquefaction projects
~87 MMT
Possible impact on supplies
(2020 vs 2030)
COVID-19: Potential Impact on LNG Industry
8%
(reduction in LNG demand from
2020 pre-COVID forecast)
(Scenario 2: Lockdown
extension until 2020-end)
COVID-19 could wipe off 13–30 MMT of LNG
demand in 2020. The industry is battling
depressed downstream demand, low prices,
high storage levels, and increased concerns
over the viability of projects and supply
cuts.
In the best-case scenario, Northeast Asia
will lead the demand recovery in H2’20, with
European storage space brimming with an
influx of cheaper LNG and piped gas.

3 © Evalueserve. All rights reserved.
Impact on LNG Demand
• Force majeure, DQT, and cargo deferment / cancellation requests
• Opportunistic buying and emergence of new buyers
• Demand recovery in China in H2’20
• Outline opportunistic versus strategic play frameworks for faster action
• Identify tier II and tier III players
• Develop China-focused strategy for expeditious Chinese player
Implication for Supply
• Threat to project viability amid low prices
• Cancellation of US cargoes and concerns over operability of US-based projects
• Depressed Asian demand and record storage levels in Europe
• Increased competition with dwindling demand
Outlook for Pricing
• Record fall in LNG pricing
• Tightened operational flexibility
• Eluding long-term contracts
Things to Watch Out For
• Market optimistic about Asia leading demand recovery in 2021
• Threats over projects financing and long-term commitment (s)
COVID-19: Implications and Way Ahead
The COVID-19 pandemic has led to demand destruction, record low pricing, and concerns over the viability of liquefaction projects. Global LNG trade is likely to register single digit or even negative growth in 2020 – compared with ~13% growth in 2019.
COVID-19: Evalueserve Recommendation
• Cut costs fast
• Consider LNG sourcing from other players
• Explore new sales horizon
• Review long-term capex plans in light of increased competition
• Optimize cross-basin sales
• Review shipping routes and storage space optimization
• Adopt innovative pricing mechanisms to secure greater term deals
• Engineer developments in markets for long-term plays
• Scout for activity in nascent markets and new buyers (including buyers
looking to switch from bunkering or coal fuels)
4 © Evalueserve. All rights reserved.
Japan
South Korea
India
ChinaSpain
Turkey
Italy
France
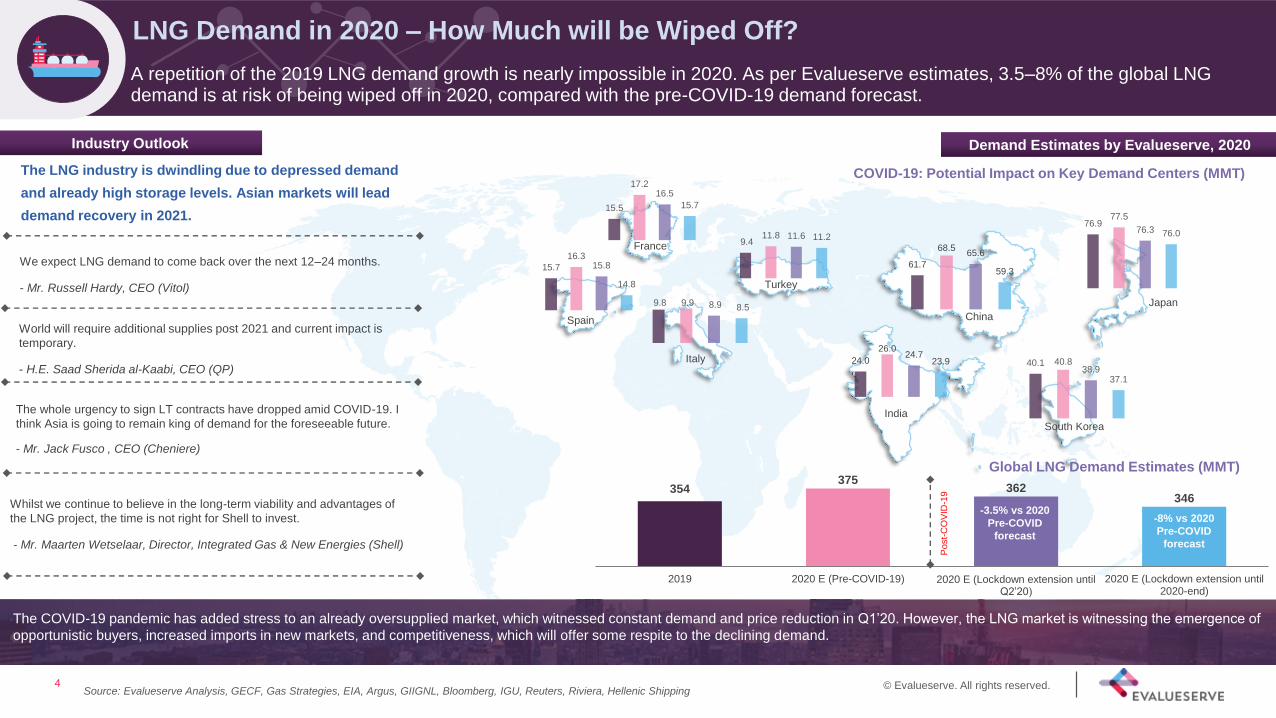
Industry Outlook
The LNG industry is dwindling due to depressed demand
and already high storage levels. Asian markets will lead
demand recovery in 2021.
Global LNG Demand Estimates (MMT)
We expect LNG demand to come back over the next 12–24 months.
- Mr. Russell Hardy, CEO (Vitol)
World will require additional supplies post 2021 and current impact is
temporary.
- H.E. Saad Sherida al-Kaabi, CEO (QP)
The whole urgency to sign LT contracts have dropped amid COVID-19. I
think Asia is going to remain king of demand for the foreseeable future.
- Mr. Jack Fusco , CEO (Cheniere)
Whilst we continue to believe in the long-term viability and advantages of
the LNG project, the time is not right for Shell to invest.
- Mr. Maarten Wetselaar, Director, Integrated Gas & New Energies (Shell)
354375
362346
2019 2020 E (Pre-COVID-19) 2020 E (Lockdown extension until Q2’20)
2020 E (Lockdown extension until2020-end)
COVID-19: Potential Impact on Key Demand Centers (MMT)
Demand Estimates by Evalueserve, 2020
Post-
CO
VID
-19
76.9 77.5
76.3 76.0
40.1 40.8 38.9
37.1
61.7
68.5 65.6
59.3
24.0
26.0 24.7
23.9
9.4 11.8 11.6 11.2
15.5
17.2 16.5
15.7
9.8 9.9 8.9 8.5
15.7
16.3 15.8
14.8
Source: Evalueserve Analysis, GECF, Gas Strategies, EIA, Argus, GIIGNL, Bloomberg, IGU, Reuters, Riviera, Hellenic Shipping
The COVID-19 pandemic has added stress to an already oversupplied market, which witnessed constant demand and price reduction in Q1’20. However, the LNG market is witnessing the emergence of
opportunistic buyers, increased imports in new markets, and competitiveness, which will offer some respite to the declining demand.
-3.5% vs 2020
Pre-COVID
forecast
-8% vs 2020
Pre-COVID
forecast
LNG Demand in 2020 – How Much will be Wiped Off?
A repetition of the 2019 LNG demand growth is nearly impossible in 2020. As per Evalueserve estimates, 3.5–8% of the global LNG demand is at risk of being wiped off in 2020, compared with the pre-COVID-19 demand forecast.

5 © Evalueserve. All rights reserved.
Macroeconomic Industrial Gas Market
Power Demand LNG Activities
1 2 1 2
Scenario 1: Lockdown extension until Q2’20
Scenario 2: Lockdown extension until 2020-end
1
2Low impact on LNG Demand
Medium impact on LNG Demand
Significant impact on LNG Demand
No
rth
east
Asia
No
rth
east
Asia
Eu
rop
e
Eu
rop
e
1 2 1 2
Ind
ian
Su
b
co
nti
nen
t
Scenario 1: Rapid recovery of power
demand from C&I sectors
Scenario 1 & 2: CCGTs to become
competitive to coal
Europe’s recovery to be the slowest in
both cases
India to become fastest growing major
economy in Scenario-1
China’s GDP growth rate may fall to 1%
in Scenario-2
Scenario 1: Best for economic revival
Modest recovery in both scenarios
Scenario 1: High productivity after
lockdown
Industrial production very less
Scenario 1 & 2: Power generation to
remain abundant with high share of
nuclear & renewables
Scenario 2: Delay in LNG-to-Power
projects
Scenario 2: Prolonged high storage
levels
Scenario 1: Rise in Tender activity (vs
Mar’20) with increased LNG viability
Caribbean and Brazil to offer some
respite
Scenario 1: Rapid recovery of power
demand from C&I sectorsScenario 1: Jump in industrial production
index
Scenario 2: Loss of industrial productivity Scenario 2: Coal-to-gas switching to be
delayed to sustain economy
Current Impact
on Demand,
by Region
No
rth
east
Asia
Ind
ian
Su
bco
nti
nen
tR
OW
RO
W
Demand Recovery Outlook
1 2
Lockdown until Q2’20 Lockdown until
2020-end
No
rth
east
Asia
No
rth
east
Asia
Eu
rop
e
Eu
rop
eIn
dia
n
Su
bco
nti
nen
t
Source: Evalueserve Analysis, IMF, Bloomberg, IEA, EIA, Argus, GIIGNL, GECF, IGU, Reuters, Riviera, Natural Gas Intel, Hellenic Shipping
The shaded portion indicates a
possible positive impact on demand
recovery.
Ind
ian
Su
bco
nti
nen
tR
OW
Eu
rop
eN
ort
heast
Asia
LNG Demand Recovery in 2020 - A Myth or Possibility?
LNG demand recovery in 2020 remains unlikely, unless normalcy returns by the end of Q2’20. Northeast Asian countries will likely absorb most of the excess LNG this year and the market will start rebalancing in 2021.
Scenario-1 (China) – Emergence of
new buyers with greater regas access
Opportunistic buying in both cases.
Cargoes deferral to Singapore/Thailand

6 © Evalueserve. All rights reserved.
These threats will add to the bearishness of European
gas prices, thereby offering cross-basin supply
opportunities for LNG suppliers
Threat from Piped Gas
Higher piped gas supply
may further pose risk to
LNG imports in 2020
Threats from Nuclear &
Renewables
Several European nations
may prefer to reduce gas-
based power output to
maintain grid balance
Near-full Storage Levels
(~96% in Aug’20)
LNG imports could be
lower than the earlier
estimate of 100 MMT in
2020
Declining Gas Demand
4–10% of Europe’s gas
demand may be impacted in
H1’20
Scenario #1: Lockdown extension until Q2’20
Scenario #2: Lockdown extension until 2020-end
THREATS TO EUROPEAN BACKSTOPS
European Storage Levels (Between Jan-Apr)
• 5-year average = 42.4%
• 2020 = 64.9%
European Gas Storage Levels vs Utilisation Forecast
Will Europe Continue to be the Preferred Backstop?
With record storage levels already achieved in Q1’20, the outlook for Europe absorbing excess LNG in 2020 remains ‘bleak’. However, opportunistic buying in Turkey and underutilized storage facilities in Ukraine may offer some respite.
Source: Evalueserve Analysis, GIE, EIA, Argus, GIIGNL, GECF, IGU, OIES Analysis, Naftogaz, Riviera, Natural Gas Intel, Hellenic Shipping
Note: Assuming storage injection average of 10 BCM/month. 1 BCM = 10.46 TWh
10
20
30
40
50
60
70
80
90
100
0
20
40
60
80
100
120
140
160
Jan Feb Mar Apr May Jun Jul Aug Sep Oct Nov Dec
in %BCM
Average Storage Levels (2018) Average Storage Levels (2019)
Average Storage Levels (2020) % Full (5-year average) (RHS)
% Full (2020) (RHS) % Full Storage Levels Forecast (Scenario 1) (RHS)
% Full Storage Levels Forecast (Scenario 2) (RHS)

7 © Evalueserve. All rights reserved.
Exporting nations (particularly dependent on petroleum exports) are facing tightened
finances with lower oil & gas prices
Double blow on economy
EXPORTING COUNTRIESIMPORTING COUNTRIES
Low LNG prices have raised concerns over the viability of multiple LNG projects
(both operational and proposed)
Supplies cuts and greenfield project deferrals / cancellation
Suppliers across the globe are facing competition and are looking to expand
beyond their traditional markets. NOCs need to market their cancelled cargoes in
the spot market
Increased competition for supplies
Most of the term deliveries across Asian countries are signed at a high Brent
slope. A fall in Brent prices could result in ~50% reduction in DES cost for
deliveries in H2’20.
Reduction in import bill
A drop in spot / term prices could significantly reduce the cost of electricity
generation using LNG across key demand centres such as India.
LNG becoming cost-competitive with other fuels
Lower LNG prices could mean that it is becoming increasingly viable as
feedstock across industries and for CGD use.
Greater LNG downstream demand
-
20
40
60
80
Q4 2019 Q1 2020 Q2 2020 Q3 2020 Q4 2020 Q1 2021 Q2 2021
$/BBL Brent Price Outlook
Note: Term contracts prices calculated based on 3-months average Brent prices
Source: Evalueserve Analysis, Bloomberg, Argus, GIIGNL, GECF, IGU, Reuters, Natural Gas Intel, Hellenic Shipping
0
5
10
15
Jan Mar May July Sep Nov Jan Mar May July Sep Nov Jan Mar May July Sep Nov Jan Mar May July Sep Nov
2018 2019 2020 2021
$/MMBTU Term vs Spot Price Forecast
14.5% Brent Slope (Term) JKM
What Does a Fall in LNG Prices Mean for the Market?
Lower LNG prices will increase LNG’s competitiveness to ‘coal’ and boost its relevance as ‘feedstock’. However, suppliers will need to undertake production curbs as well as defer planned projects, to ensure business continuity and initiate market re-balance.

8 © Evalueserve. All rights reserved.Source: Bloomberg, OilPrice, EIA, OIES Analysis, GIIGNL, Rystad, IGU, Reuters, CME Group, GECF
200
300
400
500
600
700
800
900
1000
2019 2020 2021 2022 2023 2024 2025 2026 2027 2028 2029 2030
MMT
Pre-COVID-19 Liquefaction Capacity Post-COVID-19 Liquefaction Capacity
Impact of COVID-19 & low oil price
~87 MMT lower liquefaction capacity
addition by 2030
Rising Concerns about:
Deferral / Cancellation of 2nd Wave of
US LNG projects
Viability of backfill Australian projects
New Greenfield investments
Bearish oil & gas indicators in 2020 (post COVID-19) have not only raised concerns
over the viability of operational projects but will also delay / defer most of the FIDs
in 2020
Covid-19: Potential Impact on LNG Supplies vs Capacity Additions
QatarDetermined to maintain its ‘Leader’ status
Set to achieve FID of ‘NFE’ project by early 2021
Russia
Strong government support
Government targeting greater LNG integration, will
support FIDs/operability of major LNG projects
Asia
Major threat to Brownfield expansion
Low oil prices to defer / delay most of the backfill LNG
projects (particularly across Australia)
US
Threat to Second Wave Projects
Lack in investor confidence and commitments, rising
concerns over viability of operational and planned
projects
Ne
t C
ost
of
LN
G o
f O
pera
tio
na
l P
roje
cts
Low
High
Category 1 Category 2
Category 1 Category 2
Category 1 Category 2
Category 1 Category 2
Net CLNG Range - GlobalNet CLNG Range - Region
Can Suppliers Maintain Liquefaction Capacity Growth?
Over 110 MMT of planned FIDs in 2020 are expected to be affected by the global pandemic. With gas prices facing headwinds, the viability of production from several US-based and a few Asian projects remains a concern.

9 © Evalueserve. All rights reserved.
Least Impacted Least Impacted
Threat - High net cost of LNG,
strategically focused on oil market,
and greater greenfield investments
Highest Impact Least ImpactHigh Impact Moderate Impact
Traders
Portfolio
PlayersLNG
Marketers NOCs
Strategy / Guidance
• Optimize finances & portfolio
management
• Manage LNG portfolio risk
• Optimize shipping and storage
space, cargo reshuffle
• Proceed only with marquee
projects while delay others
Strategy / Guidance
• Undertake ‘Production cuts’
• Be open to procuring LNG than to
producing themselves
• Target nearby markets
• Manage and restructure debt
Threat – Cargo cancellations (most
US players), greater dependence on
spot, and delay in term deals
Threat – ‘Tank-top’ or Force Majeure
requests
Threat – Low arbitrage
opportunities amid price drop, and
limited storage capabilities
Strategy / Guidance
• Explore new market while pushing
greater LNG to Europe
• Leverage the low cost of LNG to
market deferred cargoes on spot
basis
• Defer maintenance and maintain
high productivity
• Continue brownfield projects
Strategy / Guidance
• Optimize cross-basin sales
• Leverage trading prowess
• Explore alternative opportunities
such as storage space trading
Source: Bloomberg, IEA, EIA, Argus, GIIGNL, GECF, IGU, Reuters, Riviera, Natural Gas Intel, Hellenic Shipping
Note: Strategy / Guidance represents Evalueserve’s views on the steps that the value-chain players could take to sustain top line.
With LNG price markers continually recording new lows, LNG production cuts look eminent. High exposure to the oil market, coupled with greater net LNG costs, are putting portfolio players at the risk of giving up early to the dwindling LNG demand.
Impact on LNG Suppliers – Who will Blink First?

10 © Evalueserve. All rights reserved.Source: Evalueserve Analysis, IEA, Gas Strategies, Evalueserve Insights, GasMalaysia, IGU, LNG World News, Petroleum Economist, HC Processing, GIIGNL
Key Lookouts For LNG Suppliers That May Support Demand Growth
Emergence of non-NOC
players in China
Addition of new
geographies
LNG-to-Power
developments
Pipeline Connectivity in
Asian nations
Direct Procurement by
downstream LNG users
Snowball effect in
Bunkering
Asia Europe & Middle East
AmericasAfrica
POTENTIAL MARKET FOR EXPANSION / INCREASED LNG SUPPLY
Senegal Benin
Ghana Cote d’Ivoire
South Africa Mauritius
El Salvador Nicaragua
Ecuador Cote d’Ivoire
Puerto Rico Brazil
Philippines Vietnam
Singapore Thailand
Cambodia Bangladesh
Cyprus Bahrain
Hungary Bulgaria
Ukraine Slovenia
Emergence of Potential LNG Buyers
Northeast Asian Buyers Others
Third-party Access (China)
• Sanhe Penghao Gas Co., Ltd.
• Zhenhua Oil
• Shengli Oilfield Tianyuan
• Longkou Shenton Energy
• Shandong Zhongnuo
Others
• Zhejiang Energy
• Guangdong Yudean
• Gas Malaysia Energy
• ENN
• SBEE
• Ghana National Petroleum Company
• New Fortress Energy
Our Take:
Evalueserve has identified multiple other
gas value chain players that may secure
spot volumes in the short term and may
even sign term deals in the long run. The
cumulative objective is to promote cleaner
fuel use at competitive pricing.
In the long run, with increased availability and competitiveness of LNG with other fuels, new markets and new buyers are set to join the LNG game. COVID-19 provides the much-needed time for suppliers to re-strategize and gain an ‘early bird’ advantage to increase sales.
Is There Any Silver Lining?

11 © Evalueserve. All rights reserved.
Author (s)
Yashika Vats
Group Manager, Oil & Gas
Contact Yashika: [email protected]
Pritam Singh
Senior Analyst, Oil & Gas
Contact Pritam: [email protected]