sector ohio valley: intersection of km and organizational management
DESCRIPTION
Sector Ohio Valley.TRANSCRIPT

Coast Guard Knowledge Summit
18-20 February 2009

SOHV Integrated Management System
What is the Sector Ohio Valley Integrated Management System?
A system of gathering, tracking, and understanding information with the goal of achieving and sustaining operational excellence and meeting other Coast Guard goals.
information
information informationinformation
IMS
Knowledge
Performance!
Why Create a Knowledge Management System?
Our cutters, boats, and aircraft and integrated and mutually supportingOut command, control, and communications systems are getting thereOur management systems are …?
Why Create a Knowledge Management System?
High risk, complex, and dynamic environmentbring order to chaos, identify risk, and provide us with the tools to meet our goalsContinuity& sustained performance over time/PCS moves
Knowledge Management must have a goal•Mission – Maritime Safety, Security, Stewardship•Performance – deliver results•Competition – better than any alternatives•Change – cope with a dynamic world

The Goal of the SOHV IMS
Translate Strategic Direction into Sustained Performance Excellence
Continuous Improvement and Adaptation in a Dynamic Environment
Performance!
“Transparency of information breeds self-correcting behavior.”
Organizational Approach
“Mission execution is what we do.”“We must adapt and evolve into a
change-centric, learning organization.”
Organizational Goal
Sector Ohio Valley’s Approach
In order to remain goal focused, the SOHV IMS begins with our Strategic Business PlanTransparency of Information - goals, measures, targets, policies, etc are all clearly posted and visible to all SOHV membersTrust in the Command, in the IMS, and among the members and units within the Sector is criticalChange Centric CultureBroad participation across the Sector – all units and all levels

What is the SOHV Integrated Management System• Is Based on the Commandant’s Performance Excellence Criteria
• Implements Standard Operational Planning Process & Mission Management System
• Uses Enterprise Applications & Data
• Implements the Incident Command System in Daily Activities
• Includes Contingency Planning & Exercises
• Promotes Unity of Effort
• Employs a Tailored Dashboard System
SOHV Integrated Management System

MAJOR COMPONENTS
Strategic Business PlanSupporting Plans for outreach, training, etcUse of ICS for routine operationsLeadership InitiativesCommunication tools (Riverbend, Blog, etc)Balanced Scorecards with measures/targets
Mission PerformanceReadinessLeadershipPartnerships
Strategic Business Plan Components
Begins with strategic direction from COMDT concerning Safety, Security, & Stewardship missions.Links HQ goals with SOHV activities, and prioritizes those activitiesOrganized by mission, not department or unit to emphasize Unity of EffortHas specific measures and targets (Balanced Scorecard)Identifies long term (5 year) objectives

ESC “SBP Alignment” Review
SOHV Overall PREV RESP LOG NASH CINC PITT HUNT PADU OSAG OBIO CIMA CHEN CHIP OUAC DANASCC VTSPLAN
SOPP Effectiveness Asset Hours QualsDeployabilityWorkload SurveysDrills UpwardSafety
Achievements DashboardSBPSWOT ObjectivesMinutes Balanced Scorecard McDevan Initiatives
D8OPD RequiredGoals Area Measure Target Current Goals Area Measure Target Current
Deployability >90% 95.3% Mariners Saved ACGN 95% 0%Overweight(AD/R) <2% 2.6% Mariners Saved BCGN 88% 0%Competencies >75% 75% Property Saved 80% 0%HAZWOPER >90% 94% # Reportable CAG 208 34ICS - General >90% 89.6% # Mariner Deaths 2 0ICS - IMT 100% 52.5% # Mariner Injuries 16 8GMT (AD/R) >90% 81.0% # Passenger Deaths 4 0Update 100% 97% # Passenger Injuries 2 1Exercise 100% 100% Barge Break-aways 39 14Prevention 100% 100% Towing Vsl Insp 76 160Response 100% 92% LORAN Availability 99.90% 99.90%Plan 100% 100% Fixed ATON on time 97% 83%Command Center 100% 98% MTSA Vsl Breaches 0 0Logistics 100% 100% MTSA Fac Breaches 15 6WLR "C" 6854.4 4314 # Incidents @ Events 0 0RBS % Bravo 92% SafePort Spot Checks 100% 97.2%DART % Bravo 100% Facility ACE 100% 97.2%PPE 100% 100% # Pollution Incidents 97 17STE 100% 100% Spill Volume (gals) 2344 294.7Reserve Recall >90% 87.3% CT (Vsl cases > 30d) 20 10AWS >90% 78% CT (Fac cases > 30d) 7 1ERROR 100% 50% CT (Inv cases > 60d) 40 26SIPRNET 100% 81% CT (SAR cases > 30d) 0 0RFO 80 88.7 CT (Viol cases > 120d) 9 4STAN 40 43 Ex Survey - Prevention >4 4.7MLC Compliance Compliant Ex Survey - Response >4 4.6WLR SEOPS Compliance Compliant Ex Survey - Planning >4 4.7LORSTA QA 70 77.2 Ex Survey - VTS >4 4.5SCC >80% 0% Ex Survey - SCC >4 4.7VTS OPEVAL Compliance Pending Ex Survey - WLR >4 4.7
Evaluation CPEC Evaluation Bas Effective Bas Eff/Beg Goals Area Measure Target CurrentGoals Area Measure Target Current Voting Mbrs Attendance 50% 69%
Mishap (A,B) 0 0 AMSP Update 100% 100%Mishap (C,D) 14 3 MSRAM Update 100% 100%IDP (AD) 100% 81% RMMP Develop 100% 80%CPO Acad (AD/R) 100% 45% IJ Delays 0 0Plan (AD) 90% 93% OGA/CG Water Patrols >0.54 1.12AD Challenge 50% 82% OGA/CG Shore Patrols >2.29 6.34
Education AD Use of TA 25% 13% Benkert Applications 1 0CGI Assess AD Completed 25% 23% TBSIP Participants 2 2
Quality 0 Return 0 ACOE "Fleet Sweep" Insps 6 2Timeliness 100% 100% D8/ACOE/Ind WAP Update 100% 100%
Recognition Timeliness 100% 100% Marine Events 127 15Transition Sponsor Survey >4 4.25 Mission Count 1001 110
Internal Survey >4 4.1 Education Hours 1861 192.5D8 Workplace >4 4.5 JTTF Joint Responses 100% 100%
Incr
ease
Par
tner
ship
Equipment
Drills
InspectionAch
ieve
Ope
ratio
nal E
xcel
lenc
e
Redu
ce S
afet
y an
d Sec
urity
Ris
ks
Incr
ease
Env
ironm
enta
l Pro
tect
ion
Incr
ease
Cus
tom
er S
atis
fact
ion
Maritime Safety Commercial Vessels and
Facilities
SAR and Boating Safety
Casework
Maritime Security
Incr
ease
Em
ploy
ee
Sat
isfa
ctio
n
Safety
Satisfaction
Evaluation
Physical Fitness
Prof Dev
Sector Ohio Valley - Balanced Scorecard
Incr
ease
Rea
dine
ss
Impr
ove
Man
agem
ent &
Pro
cess
es
SOHV RequiredUSCG Required
Personnel
Training
Policies
Plans
Maritime Stewardship
Customer Service
CGAUX D8ER
Marine Industry
Local LE
AMSC

Goals Area Measure Target CurrentDeployability >90% 95.3%Overweight(AD/R) <2% 2.6%Competencies >75% 75%HAZWOPER >90% 94%ICS - General >90% 89.6%ICS - IMT 100% 52.5%GMT (AD/R) >90% 81.0%Update 100% 97%Exercise 100% 100%Prevention 100% 100%Response 100% 92%Plan 100% 100%Command Center 100% 98%Logistics 100% 100%WLR "C" 6854.4 4314RBS % Bravo 92%DART % Bravo 100%PPE 100% 100%STE 100% 100%Reserve Recall >90% 87.3%AWS >90% 78%ERROR 100% 50%SIPRNET 100% 75%RFO 80 88.7STAN 40 43MLC Compliance CompliantWLR SEOPS Compliance CompliantLORSTA QA 70 77.2SCC >80% 0%VTS OPEVAL Compliance Pending
Evaluation CPEC Evaluation Bas Effective Bas Eff/Beg
Equipment
Drills
Inspection
Sector Ohio Valley - Balanced Scorecard
Incr
ease
Rea
dine
ssIm
prov
e M
anag
emen
t & P
roce
sses
Personnel
Training
Policies
Plans
Readiness Metrics
Medical, Dental, ICS, and GMT for Sector are all well above D8 and CG averages, including reserve data.
Monthly competition between all Sector units

USCG Sector Ohio Valley McDevan Award Scoring Matrix & Summary
UnitRFO &
STAN (35%) Deploy (25%) ICS (10%)GMT &
IDP (10%)HAZWOPR & OMSEP (10%)
PRESFITNESS
(10%) Current OverallSOHV (Louisville) 83 95.0 94.9 87.4 65.0 20.4 79.6 80.1MSU Huntington 77 95.7 90.9 93.7 86.1 21.7 80.1 76.4MSU Paducah 83 95.6 90.6 93.7 24.6 14.8 75.3 75.2MSU Pittsburgh 95 97.2 97.2 91.8 91.0 22.8 87.8 85.6MSD Nashville 91 95.9 96.5 90.7 87.5 6.3 83.9 81.3MSD Cincinnati 77 96.0 100.0 96.3 100.0 17.5 82.3 81.4CGC CHENA 91 89.3 67.3 72.1 79.0 23.6 78.4 79.2CGC CHIPPEWA 98 92.8 80.4 61.9 100.0 25.0 84.2 83.2CGC CIMMARON 86 92.9 83.1 90.6 100.0 20.0 82.7 80.9CGC OBION 95 96.5 90.5 89.9 92.0 27.1 87.3 84.2CGC OSAGE 96 100.0 100.0 96.9 58.3 22.2 86.3 83.3CGC OUACHITA 94 92.9 84.8 64.2 100.0 23.8 83.4 78.8LORSTA Dana 1 77 100.0 100.0 95.3 100.0 30.0 84.6 77.2
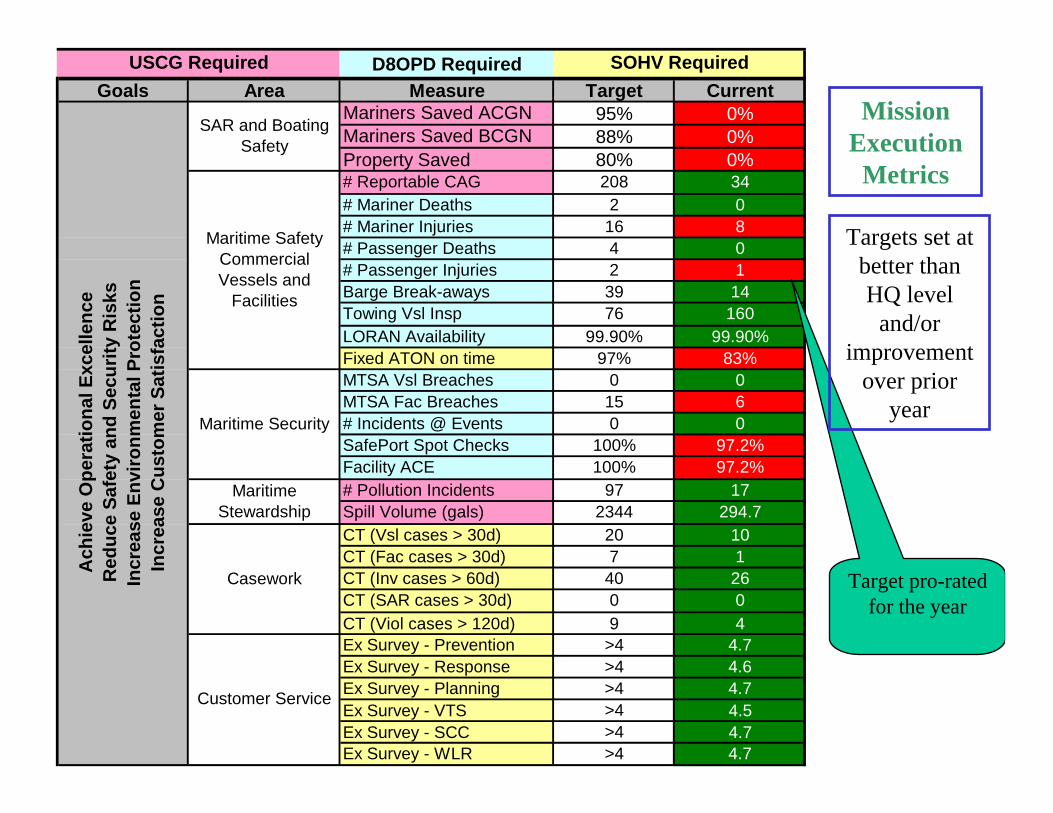
D8OPD RequiredGoals Area Measure Target Current
Mariners Saved ACGN 95% 0%Mariners Saved BCGN 88% 0%Property Saved 80% 0%# Reportable CAG 208 34# Mariner Deaths 2 0# Mariner Injuries 16 8# Passenger Deaths 4 0# Passenger Injuries 2 1Barge Break-aways 39 14Towing Vsl Insp 76 160LORAN Availability 99.90% 99.90%Fixed ATON on time 97% 83%MTSA Vsl Breaches 0 0MTSA Fac Breaches 15 6# Incidents @ Events 0 0SafePort Spot Checks 100% 97.2%Facility ACE 100% 97.2%# Pollution Incidents 97 17Spill Volume (gals) 2344 294.7CT (Vsl cases > 30d) 20 10CT (Fac cases > 30d) 7 1CT (Inv cases > 60d) 40 26CT (SAR cases > 30d) 0 0CT (Viol cases > 120d) 9 4Ex Survey - Prevention >4 4.7Ex Survey - Response >4 4.6Ex Survey - Planning >4 4.7Ex Survey - VTS >4 4.5Ex Survey - SCC >4 4.7Ex Survey - WLR >4 4.7
Ach
ieve
Ope
ratio
nal E
xcel
lenc
eR
educ
e Sa
fety
and
Sec
urity
Ris
ksIn
crea
se E
nviro
nmen
tal P
rote
ctio
nIn
crea
se C
usto
mer
Sat
isfa
ctio
n
Maritime Safety Commercial Vessels and
Facilities
SAR and Boating Safety
Casework
Maritime Security
SOHV RequiredUSCG Required
Maritime Stewardship
Customer Service
Target pro-rated for the year
Mission Execution
Metrics
Targets set at better than HQ level
and/or improvement
over prior year

Goals Area Measure Target CurrentMishap (A,B) 0 0Mishap (C,D) 14 3IDP (AD) 100% 80%CPO Acad (AD/R) 100% 45%Plan (AD) 90% 93%AD Challenge 50% 82%
Education AD Use of TA 25% 13%CGI Assess AD Completed 25% 23%
Quality 0 Return 0Timeliness 100% 100%
Recognition Timeliness 100% 100%Transition Sponsor Survey >4 4.25
Internal Survey >4 4.1D8 Workplace >4 4.5
Incr
ease
Em
ploy
eeSa
tisfa
ctio
n
Safety
Satisfaction
Evaluation
Physical Fitness
Prof Dev
Leadership and Employee Focused Metrics

Goals Area Measure Target CurrentVoting Mbrs Attendance 50% 69%AMSP Update 100% 100%MSRAM Update 100% 100%RMMP Develop 100% 80%IJ Delays 0 0OGA/CG Water Patrols >0.54 1.12OGA/CG Shore Patrols >2.29 6.34Benkert Applications 1 0TBSIP Participants 2 2
ACOE "Fleet Sweep" Insps 6 2D8/ACOE/Ind WAP Update 100% 100%
Marine Events 127 15Mission Count 1001 110Education Hours 1861 192.5
JTTF Joint Responses 100% 100%
Incr
ease
Par
tner
ship
CGAUX D8ER
Marine Industry
Local LE
AMSC
Partnerships and Externally Focused Metrics

SOHV Integrated Management System
Cascading “Balanced Scorecards” – Alignment & Balance

Current FY SBP Current FY Performance Plan
Measurement
Assessment
Adjustment
SOHV Integrated Management System
Next FY SBP
Year in Review
How Does It Work?Strategic Business Planning Cycle
(monthly review)
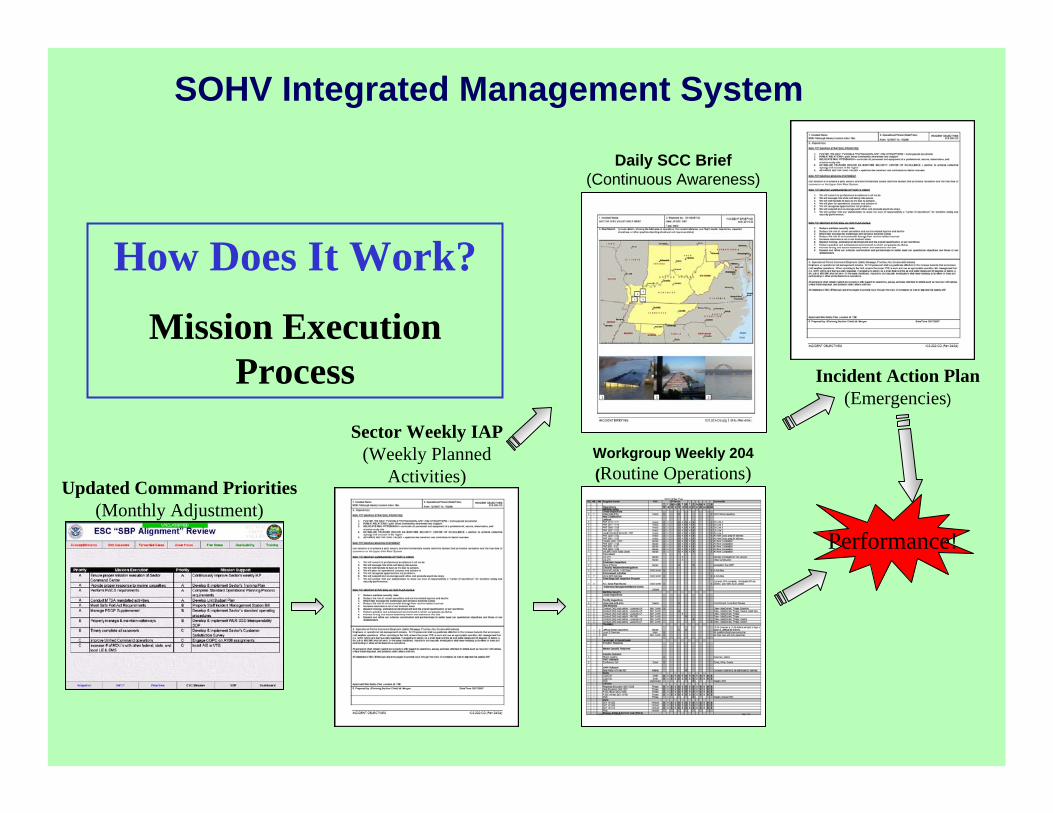
How Does It Work?Mission Execution
Process
Daily SCC Brief(Continuous Awareness)
Updated Command Priorities(Monthly Adjustment)
Sector Weekly IAP(Weekly Planned
Activities)
Incident Action Plan(Emergencies)
Workgroup Weekly 204(Routine Operations)
SOHV Integrated Management System
Performance!

Resource Availability
Incident Action PlanRoutine Operations
Required Deadlines
Readiness Measures
Resource Requirements(Monthly Update)
How Does It Work? Mission Support Process
Command Priorities

Bookshelf of IAP’sConsolidated Sector
Website
Best Practices
Sector’s SOP
Incident-specific IAPIndividual Sub-unit’s
Website
SOHV Integrated Management System
How Does It Work? Knowledge Management

D8 Workplace Assessment Sector-wideMay 0813.0
Customer & Stakeholder Survey ImplementedMay 0812.0
Change Management adoptedDec 0819.0
SOHV Reference SystemJul 0817.0
Sector NewsletterJul 0816.0
BSST Instruction DevelopedMay 0811.0
Mission Management System Fully CompliedMay 0810.0
D8 CPC AssessmentMay 0813.1
SOHV Major Incident Response Instruction ImplementedJun 0814.0
SOHV-Auxiliary Interoperability Optimized Jun 0815.0
Hamilton Application submittedFeb 0920.0
ImprovementDateVersion
SOHV Integrated Management System
How Does It Work? Continuous Improvement

High Personnel Readiness
Decreasing Case Work Cycle
Time
Increasing Competencies
Significantly Improved
Unity of Effort
SOHV Integrated Management System
Updated Plans
MeetingPerformance
Mandates
Greater Successin Acquiring
Resources
What Are the Results?Performance!
More Involved Work Force
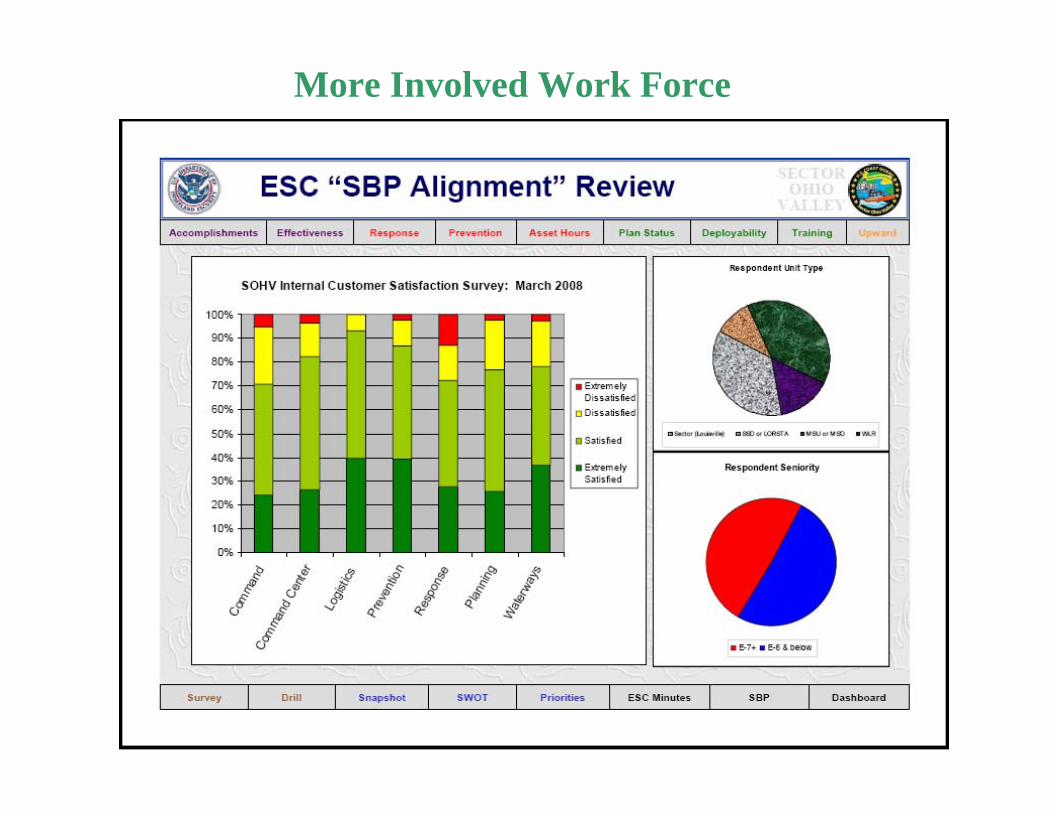
More Involved Work Force

High Personnel Readiness

Increasing Competencies and Quals

Updated Plans

USCG Sector Ohio Valley McDevan Award Scoring Matrix & Summary
UnitRFO &
STAN (35%) Deploy (25%) ICS (10%)GMT &
IDP (10%)HAZWOPR & OMSEP (10%)
PRESFITNESS
(10%) Current OverallSOHV (Louisville) 83 95.6 94.9 #VALUE! 65.0 20.4 #VALUE! 80.3MSU Huntington 77 95.9 90.9 68.7 86.0 21.7 77.7 75.1MSU Paducah 83 95.3 90.6 69.0 24.9 14.8 72.8 75.2MSU Pittsburgh 95 97.5 97.2 67.1 91.0 22.8 85.4 84.9MSD Nashville 91 94.5 96.5 90.7 87.5 6.3 83.6 80.4MSD Cincinnati 77 94.7 100.0 #VALUE! 100.0 17.5 #VALUE! 81.1CGC CHENA 91 93.3 67.3 73.6 79.0 23.6 79.5 79.4CGC CHIPPEWA 98 90.4 80.4 62.2 100.0 25.0 83.7 82.9CGC CIMMARON 86 88.9 83.1 90.6 100.0 20.0 81.7 80.3CGC OBION 95 97.8 90.5 89.9 92.0 27.1 87.6 83.2CGC OSAGE 96 98.6 100.0 96.9 58.3 22.2 86.0 82.3CGC OUACHITA 94 95.9 84.8 64.2 100.0 23.8 84.1 77.3LORSTA Dana 1 77 100.0 100.0 95.3 100.0 30.0 84.6 74.81 LORSTA RFO value is scaled equivalent NAVCEN OA

Professional Mariner Injuries
0
5
10
15
20
25
30
35
FY06 FY07 FY08 FY09
MSD Cincinnati MSD Nashville MSU Huntington MSU Paducah MSU Pittsburgh SOHV (Louisville) Target (95% of prev FY)

Features:
• Is Based on the Commandant’s Performance Excellence Criteria
• Incorporates the Incident Command System in Routine Operations
• Uses a System of Cascading “Balanced Scorecards” to Ensure Organizational Alignment & Activity Balance
• Institutionalizes Planning & Exercise Processes to Promote Continuous Improvement
• Employs a Tailored Dashboard System to Facilitate Transparency of Information
• Uses Enterprise Tools & Data
SOHV’s Solution
SOHV Integrated Management System
CATEGORY
TQM
CPEC
ICS
CGBI
MMS
SOPP
SOHVIMS
Strategic Planning X X X X
Measurement X X X X X
Analysis X X X X X
Knowledge Management
X X X X
Process Management X X X X X X
Performance Results X X X X X
Innovation X X X
Crisis Management X X
Organizational Alignment
X X X X X
Activity Balance X X X
Continuous Improvement
X X X X
TQM – Total Quality ManagementCPEC – Commandant’s Performance Excellence CriteriaSOPP – Standard Operational Planning ProcessCGBI – Coast Guard Business IntelligenceMMS – Mission Management SystemICS – Incident Command SystemSOHVIMS – SOHV Integrated Management System

SOHV Integrated Management System
Like the “Planning P”, the SOHV Q is our model for Readiness and Quality

SOHV Integrated Management System
ROUTINE OPERATIONS Tools CRISIS MANAGEMENT
Lead Purpose SOHV IMS INST
Purpose Lead
Sector Command Center Daily Brief ICS-201 Incident Briefing Initial Incident Commander
Executive Steering Committee Command Objectives ICS-202 Incident Objectives Planning Section Chief
Sector Duty Officer WQSB ICS-203 Org Assignment List Resources Unit Leader
Depts, MSUs, MSDs Work Plan ICS-204 Assignment List Resources Unit Leader
Sector Command Center Comms Plan ICS-205 Radio Comms Plan Communications Unit Leader
Sector Logistics Medical Plan ICS-206 Medical Plan Medical Unit Leader
Sector Duty Officer Duty List ICS-207 Organization Chart Resources Unit Leader
Sector Deputy Safety Plan ICS-208 Site Safety Plan Safety Officer
Sector Deputy Requests for Support ICS-215 Op Planning Worksheet
Operations Section Chief
Seamless Transition From “Q” to “P”

High Personnel Readiness
Better Management of Workload
Significantly ImprovedUnity of Effort
More Satisfied Work Force Up-to-date Plans
MeetingPerformance Mandates
Greater Successin Acquiring Resources
SOHV Integrated Management System
High Customer Satisfaction
“Minding P’s and Q’s” and SOHV Success
OPERATIONAL READINESS MISSION EXECUTION

SOHV Integrated Management System
Key to Successful Implementation
RESISTANCE & BARRIERS SOLUTIONS
Resistance to ChangeMisunderstandingLow Tolerance of ChangeDisagreement Over the Need for ChangeSelf Interest
Designate a Change Management TeamCAPT Nguyen—Executive SponsorCSC Wigman-Nilsson—Change Manager
EducationSOHV IMS BriefSOHV Commander’s UNREP SessionUnit’s Visits
OwnershipSOHV “Leadership Compact”Joint Development of Plans & SolutionsIncorporation of Useful Best Practices
RoutineUse of ICS FormsSOHV ERROR Exercise Program
RewardSOHV Semper Paratus AwardSOHVIMS Innovator AwardSOHV Recognition Coin

Next Steps and Wider Applicability?
Enterprise data and applications must be connected, easy to use, and performance orientedLeadership must be incorporated into all systemsSystems must be dynamic like our operating environmentSystems must be connected across all operational and support unitsRecognize that one unit’s outcome/output is another’s input