sector rotation strategies - · pdf filerequired disclaimers trading involves risk of loss and...
TRANSCRIPT

Sector Rotation Strategies
copy Own Mountain Trading Company 2012 1
Jackie Ann Patterson
Editor BackTesting Report
Required Disclaimers
Trading involves risk of loss and may not be suitable for everyone
The author actively trades stocks and ETFs She may or may not hold a position
in any instrument discussed
This presentation is for educational purposes and is not a recommendation to buy
or sell securities
HYPOTHETICAL OR SIMULATED PERFORMANCE RESULTS HAVE CERTAIN LIMITATIONS UNLIKE
AN ACTUAL PERFORMANCE RECORD SIMULATED RESULTS DO NOT REPRESENT ACTUAL
TRADING ALSO SINCE THE TRADES HAVE NOT BEEN EXECUTED THE RESULTS MAY HAVE
UNDER-OR-OVER COMPENSATED FOR THE IMPACT IF ANY OF CERTAIN MARKET FACTORS SUCH
AS LACK OF LIQUIDITY SIMULATED TRADING PROGRAMS IN GENERAL ARE ALSO SUBJECT TO
THE FACT THAT THEY ARE DESIGNED WITH THE BENEFIT OF HINDSIGHT NO REPRESENTATION IS
BEING MADE THAT ANY ACCOUNT WILL OR IS LIKELY TO ACHIEVE PROFIT OR LOSSES SIMILAR
TO THOSE SHOWN
The computer engineer who back-tests
trading strategies and indicators
Irsquom Jackie Ann Patterson ndash
Editor of BackTesting Report
Shout Out to Fidelity Investments
Funded my back-testing research that became the basis for this presentation
Published article at httpsguidancefidelitycomviewpointsbuy-and-hold-sector-rotation
Disclosure Independent contractor for Fidelity
Sector Rotation How to Get
Respectable Gains with Low Overhead
What does THAT mean
System Design Decisions
Timeframes
Applicable Markets
Types of Rotation
Selection Criteria
Example Sector Rotation Trading Plan
5
Sector Rotation Definitions
GOAL Get in areas of market poised to
deliver best performance
NOT intra-day trading
NOT Buy and Hold
6
Respectable Gains gt 10 annually
7
Minimal Overhead
Limited time effort
Limited no commissions
Limited no taxes
(in IRA see your accountant)
8
Note Differences
9
ldquoManagerdquo Risk
Historical drawdowns
Stop loss
10
System Design Decisions
Timeframe
Applicable Markets
Types of Rotation
Selection Criteria
copy BackTesting Report 2012 11
System Design Decisions
Timeframe
Applicable Markets
Types of Rotation
Selection Criteria
copy BackTesting Report 2012 12
Time Frame Monthly or Daily
From BackTesting with Wealth Lab Proreg
RSI Rotations worked better DAILY
RoC Rotations worked better MONTHLY
Personally I like to work 1 day per month
13
Wealth Lab Pro is a registered trademark of FMC LLC
System Design Decisions
Timeframe
Applicable Markets
Types of Rotation
Selection Criteria
copy BackTesting Report 2012 14
Applicable Markets
SPDR reg Sector ETFs
XLB XLE XLF XLI XLK XLP XLU XLV XLY
iSharesreg ETFs including
Styles (eg small cap growth to large cap value)
Fixed Income
International
Stocks eg Dow 30
15
SPDR is a registered trademark of SampP Financial Services LLC iShares is a registered trademark of Blackrock
System Design Decisions
Timeframe
Applicable Markets
Types of Rotation
Selection Criteria
copy BackTesting Report 2012 16
Types of Rotation
Follow Economic Cycle thru sector ETFs
httpstockchartscomfreechartsperfhtml5bSE
CT5b
Source Sam Stovallrsquos Chart on StockChartscom
17
Types of Rotation
Select beaten-down bargain ETFs
18
Types of Rotation
Select ETFs with highest momentum
19
System Design Decisions
Timeframe
Applicable Markets
Types of Rotation
Selection Criteria
copy BackTesting Report 2012 20
Selection Criteria
KISS
Rank-able and continuously available
Able to back-test
RSI vs RoC
Dividends for Dogs of Dow
21
Original Back-tests on Wealth-Lab Proreg for 2001 - 2011
SampP Sectors lagged in almost every test
iShares High RoC rocked
Dow Stocks with low RSI more
consistent due to daily trades
LongShort didnrsquot help
22
Wealth Lab Pro is a registered trademark of FMC LLC
Buy and Hold Baseline
23
Buy amp Hold
Comparison for
12312001 -
12312011
SPDRs 9
Select Sector
ETFs
iShares All
30 Fidelity
Commission-
Free ETFs
Dow - Equal
Weight of 30
Stocks
SampP500 (IVV
iShares ETF
tracking
fund)
Starting Capital $100000 $100000 $100000 $100000
Net Profit $60029 $52798 $62063 $30430
Net Profit 600 528 621 304
Annualized Gain 48 43 50 27
Total Commission ($72) ($231) ($239) ($8)
Dividends Received $23684 $21456 $27565 $20377
Number of Trades 9 29 30 1
Win Rate 889 828 600 1000
Maximum Drawdown ($84414) ($79755) ($76261) ($78159)
Sharpe Ratio 039 038 040 025
Source Wealth Lab Pro portfolio simulation for 2001-2011
1st Pass Performance Stats
24
Backtest 2001-2011 SPDR Sectors
14-Day RSI iShares High
30- day RoC Dow 30
14-Day RSI
Selection and Sizing 3 lowest 333
each 3 highest
333 each 3 lowest 333
each Starting Capital $100000 $100000 $100000
Net Profit $122130 $222150 $245147 Net Profit 122 222 245
Annualized Gain 8 12 13 Total Commission ($22220) $0 ($32126)
Dividends Received $32258 $43202 $39059
Number of Trades 1399 162 2022
Average Bars Held 634 465 469
Win Rate 59 62 61
Maximum Drawdown ($88087) ($67605) ($153644)
Sharpe Ratio 055 089 066
Source Wealth Lab Pro portfolio simulation for 2001-2011
Long Short Not Helpful
25
Long Short on 30-Day RoC
SPDR
Sectors
RoC (LS) iShares RoC
(LS) Dow 30 (LS)
Selection and Sizing for 2
Long and 1 Short 45 each
15 margin 45 each 15
margin 45 each 15
margin Starting Capital $100000 $100000 $100000
Net Profit ($153) $128881 ($25396) Net Profit 0 129 -25
Annualized Gain 0 9 -3 Total Commission ($2759) $0 ($3156)
Dividends Received $8498 $11753 $10969
Number of Trades 175 183 200
Average Bars Held 4312 4128 3786
Win Rate 50 51 48
Maximum Drawdown ($35207) ($42615) ($82881)
Sharpe Ratio 007 072 -002
Source Wealth Lab Pro portfolio simulation for 2001-2011
Dow 30 Survivorship Bias C and AIG Dropped from Index
26
Ideal Dow Now Real Dow with C AIG
Starting Capital $10000000 $10000000
Net Profit $39482470 $14384800
Net Profit 39482 14385
Annualized Gain 1735 933 Total Commission ($3266655) ($3182385)
Dividends Received $4672826 $3087434
Number of Trades 2056 2003
Average Bars Held 463 473
Win Rate 6060 5806
Maximum Drawdown ($12444149) ($10729636)
Sharpe Ratio 089 047
Source Wealth Lab Pro portfolio simulation for 2001-2011
30-Day RoC Not Resilient iShares High RoC Varying Start Dates
27
Source Wealth Lab Pro portfolio simulation for 2001-2011
Optimizing RoC and Stop Loss For Free iShares Rotation
28
Source Wealth Lab Pro portfolio simulation for 2001-2011
RoC Look-Back Period vs Profit iShares High Momentum
29
Source Wealth Lab Pro portfolio simulation for 2001-2011
Stop Loss vs Profit Wealth-Lab Pro Simulation
30
Longer RoC More Resilient Bigger Profits Too
31
Source Wealth Lab Pro portfolio simulation for 2001-2011
iShares ETFs with Top 2 70-day RoC and 15 Stop
What Irsquom Trading Now
Prune commission-free iShares ETFs ACWIACWXAGGDVYEEMEFAEMBHYG
IDVIJHIJJIJKIWBIWDIWFIWMIWNIWOIWVLQDMUBSCZTIP
70-day RoC
Monthly pick top 2 high RoC ETFs
Size 50 each
15 fixed stop loss
32
Historical Performance of My ETF Rotation System
33
Starting Capital $100000
Net Profit $278688 Net Profit 279
Annualized Gain 14 Total Commission $0
Dividends Received $47823
Number of Trades 81
Average Bars Held 5891
Win Rate 60
Maximum Drawdown ($91590)
Sharpe Ratio 091
Source Wealth Lab Pro portfolio simulation for 2001-2011
Simulated Equity Curve ETF Rotation vs SampP500 Hold
34
Source Wealth Lab Pro portfolio simulation for 2001-2011
ETF Options Rotation Manually Back-Tested Two+ Ways
Covered Calls
Calls as Leveraged Position
Basic Same number of shares with less $$
Aggressive Risk 15 of account on each position
Same basic strategy of
iShares with Top 2 70-day RoC
35
Options Difficulties
Thinly traded
Huge bidask spread
Sometimes no bid to sell covered calls
Sometimes no options for underlying ETF
Historical data spotty
36
Options Not Helpful Here
37
$-
$50000
$100000
$150000
$200000
$250000
$300000
$350000
$400000
ETFs Only
Options
Aggressive Options
Covered Calls
My Tools
38
What It Takes to Succeed With
ETF Rotation Plan
Simple numeric comparison counting
1 hour per month
A little bit of self-discipline
Show up for that hour per month
Enter automatic stop loss orders
Donrsquot mess with positions otherwise
Willingness to sell holdings on cue
Market cooperation
39
Survey Prize Drawing
Please complete survey to be entered in
drawing
Fill in email address legibly
Check YES or NO to receive more info
40
Thank You For more information seehellip
wwwbacktestingblogcomsignalsetfrotation
Published article at
httpsguidancefidelitycomviewpointsbuy-
and-hold-sector-rotation
41
jackiepback
testingreport
com

System Design Decisions
Timeframe
Applicable Markets
Types of Rotation
Selection Criteria
copy BackTesting Report 2012 12
Time Frame Monthly or Daily
From BackTesting with Wealth Lab Proreg
RSI Rotations worked better DAILY
RoC Rotations worked better MONTHLY
Personally I like to work 1 day per month
13
Wealth Lab Pro is a registered trademark of FMC LLC
System Design Decisions
Timeframe
Applicable Markets
Types of Rotation
Selection Criteria
copy BackTesting Report 2012 14
Applicable Markets
SPDR reg Sector ETFs
XLB XLE XLF XLI XLK XLP XLU XLV XLY
iSharesreg ETFs including
Styles (eg small cap growth to large cap value)
Fixed Income
International
Stocks eg Dow 30
15
SPDR is a registered trademark of SampP Financial Services LLC iShares is a registered trademark of Blackrock
System Design Decisions
Timeframe
Applicable Markets
Types of Rotation
Selection Criteria
copy BackTesting Report 2012 16
Types of Rotation
Follow Economic Cycle thru sector ETFs
httpstockchartscomfreechartsperfhtml5bSE
CT5b
Source Sam Stovallrsquos Chart on StockChartscom
17
Types of Rotation
Select beaten-down bargain ETFs
18
Types of Rotation
Select ETFs with highest momentum
19
System Design Decisions
Timeframe
Applicable Markets
Types of Rotation
Selection Criteria
copy BackTesting Report 2012 20
Selection Criteria
KISS
Rank-able and continuously available
Able to back-test
RSI vs RoC
Dividends for Dogs of Dow
21
Original Back-tests on Wealth-Lab Proreg for 2001 - 2011
SampP Sectors lagged in almost every test
iShares High RoC rocked
Dow Stocks with low RSI more
consistent due to daily trades
LongShort didnrsquot help
22
Wealth Lab Pro is a registered trademark of FMC LLC
Buy and Hold Baseline
23
Buy amp Hold
Comparison for
12312001 -
12312011
SPDRs 9
Select Sector
ETFs
iShares All
30 Fidelity
Commission-
Free ETFs
Dow - Equal
Weight of 30
Stocks
SampP500 (IVV
iShares ETF
tracking
fund)
Starting Capital $100000 $100000 $100000 $100000
Net Profit $60029 $52798 $62063 $30430
Net Profit 600 528 621 304
Annualized Gain 48 43 50 27
Total Commission ($72) ($231) ($239) ($8)
Dividends Received $23684 $21456 $27565 $20377
Number of Trades 9 29 30 1
Win Rate 889 828 600 1000
Maximum Drawdown ($84414) ($79755) ($76261) ($78159)
Sharpe Ratio 039 038 040 025
Source Wealth Lab Pro portfolio simulation for 2001-2011
1st Pass Performance Stats
24
Backtest 2001-2011 SPDR Sectors
14-Day RSI iShares High
30- day RoC Dow 30
14-Day RSI
Selection and Sizing 3 lowest 333
each 3 highest
333 each 3 lowest 333
each Starting Capital $100000 $100000 $100000
Net Profit $122130 $222150 $245147 Net Profit 122 222 245
Annualized Gain 8 12 13 Total Commission ($22220) $0 ($32126)
Dividends Received $32258 $43202 $39059
Number of Trades 1399 162 2022
Average Bars Held 634 465 469
Win Rate 59 62 61
Maximum Drawdown ($88087) ($67605) ($153644)
Sharpe Ratio 055 089 066
Source Wealth Lab Pro portfolio simulation for 2001-2011
Long Short Not Helpful
25
Long Short on 30-Day RoC
SPDR
Sectors
RoC (LS) iShares RoC
(LS) Dow 30 (LS)
Selection and Sizing for 2
Long and 1 Short 45 each
15 margin 45 each 15
margin 45 each 15
margin Starting Capital $100000 $100000 $100000
Net Profit ($153) $128881 ($25396) Net Profit 0 129 -25
Annualized Gain 0 9 -3 Total Commission ($2759) $0 ($3156)
Dividends Received $8498 $11753 $10969
Number of Trades 175 183 200
Average Bars Held 4312 4128 3786
Win Rate 50 51 48
Maximum Drawdown ($35207) ($42615) ($82881)
Sharpe Ratio 007 072 -002
Source Wealth Lab Pro portfolio simulation for 2001-2011
Dow 30 Survivorship Bias C and AIG Dropped from Index
26
Ideal Dow Now Real Dow with C AIG
Starting Capital $10000000 $10000000
Net Profit $39482470 $14384800
Net Profit 39482 14385
Annualized Gain 1735 933 Total Commission ($3266655) ($3182385)
Dividends Received $4672826 $3087434
Number of Trades 2056 2003
Average Bars Held 463 473
Win Rate 6060 5806
Maximum Drawdown ($12444149) ($10729636)
Sharpe Ratio 089 047
Source Wealth Lab Pro portfolio simulation for 2001-2011
30-Day RoC Not Resilient iShares High RoC Varying Start Dates
27
Source Wealth Lab Pro portfolio simulation for 2001-2011
Optimizing RoC and Stop Loss For Free iShares Rotation
28
Source Wealth Lab Pro portfolio simulation for 2001-2011
RoC Look-Back Period vs Profit iShares High Momentum
29
Source Wealth Lab Pro portfolio simulation for 2001-2011
Stop Loss vs Profit Wealth-Lab Pro Simulation
30
Longer RoC More Resilient Bigger Profits Too
31
Source Wealth Lab Pro portfolio simulation for 2001-2011
iShares ETFs with Top 2 70-day RoC and 15 Stop
What Irsquom Trading Now
Prune commission-free iShares ETFs ACWIACWXAGGDVYEEMEFAEMBHYG
IDVIJHIJJIJKIWBIWDIWFIWMIWNIWOIWVLQDMUBSCZTIP
70-day RoC
Monthly pick top 2 high RoC ETFs
Size 50 each
15 fixed stop loss
32
Historical Performance of My ETF Rotation System
33
Starting Capital $100000
Net Profit $278688 Net Profit 279
Annualized Gain 14 Total Commission $0
Dividends Received $47823
Number of Trades 81
Average Bars Held 5891
Win Rate 60
Maximum Drawdown ($91590)
Sharpe Ratio 091
Source Wealth Lab Pro portfolio simulation for 2001-2011
Simulated Equity Curve ETF Rotation vs SampP500 Hold
34
Source Wealth Lab Pro portfolio simulation for 2001-2011
ETF Options Rotation Manually Back-Tested Two+ Ways
Covered Calls
Calls as Leveraged Position
Basic Same number of shares with less $$
Aggressive Risk 15 of account on each position
Same basic strategy of
iShares with Top 2 70-day RoC
35
Options Difficulties
Thinly traded
Huge bidask spread
Sometimes no bid to sell covered calls
Sometimes no options for underlying ETF
Historical data spotty
36
Options Not Helpful Here
37
$-
$50000
$100000
$150000
$200000
$250000
$300000
$350000
$400000
ETFs Only
Options
Aggressive Options
Covered Calls
My Tools
38
What It Takes to Succeed With
ETF Rotation Plan
Simple numeric comparison counting
1 hour per month
A little bit of self-discipline
Show up for that hour per month
Enter automatic stop loss orders
Donrsquot mess with positions otherwise
Willingness to sell holdings on cue
Market cooperation
39
Survey Prize Drawing
Please complete survey to be entered in
drawing
Fill in email address legibly
Check YES or NO to receive more info
40
Thank You For more information seehellip
wwwbacktestingblogcomsignalsetfrotation
Published article at
httpsguidancefidelitycomviewpointsbuy-
and-hold-sector-rotation
41
jackiepback
testingreport
com

System Design Decisions
Timeframe
Applicable Markets
Types of Rotation
Selection Criteria
copy BackTesting Report 2012 14
Applicable Markets
SPDR reg Sector ETFs
XLB XLE XLF XLI XLK XLP XLU XLV XLY
iSharesreg ETFs including
Styles (eg small cap growth to large cap value)
Fixed Income
International
Stocks eg Dow 30
15
SPDR is a registered trademark of SampP Financial Services LLC iShares is a registered trademark of Blackrock
System Design Decisions
Timeframe
Applicable Markets
Types of Rotation
Selection Criteria
copy BackTesting Report 2012 16
Types of Rotation
Follow Economic Cycle thru sector ETFs
httpstockchartscomfreechartsperfhtml5bSE
CT5b
Source Sam Stovallrsquos Chart on StockChartscom
17
Types of Rotation
Select beaten-down bargain ETFs
18
Types of Rotation
Select ETFs with highest momentum
19
System Design Decisions
Timeframe
Applicable Markets
Types of Rotation
Selection Criteria
copy BackTesting Report 2012 20
Selection Criteria
KISS
Rank-able and continuously available
Able to back-test
RSI vs RoC
Dividends for Dogs of Dow
21
Original Back-tests on Wealth-Lab Proreg for 2001 - 2011
SampP Sectors lagged in almost every test
iShares High RoC rocked
Dow Stocks with low RSI more
consistent due to daily trades
LongShort didnrsquot help
22
Wealth Lab Pro is a registered trademark of FMC LLC
Buy and Hold Baseline
23
Buy amp Hold
Comparison for
12312001 -
12312011
SPDRs 9
Select Sector
ETFs
iShares All
30 Fidelity
Commission-
Free ETFs
Dow - Equal
Weight of 30
Stocks
SampP500 (IVV
iShares ETF
tracking
fund)
Starting Capital $100000 $100000 $100000 $100000
Net Profit $60029 $52798 $62063 $30430
Net Profit 600 528 621 304
Annualized Gain 48 43 50 27
Total Commission ($72) ($231) ($239) ($8)
Dividends Received $23684 $21456 $27565 $20377
Number of Trades 9 29 30 1
Win Rate 889 828 600 1000
Maximum Drawdown ($84414) ($79755) ($76261) ($78159)
Sharpe Ratio 039 038 040 025
Source Wealth Lab Pro portfolio simulation for 2001-2011
1st Pass Performance Stats
24
Backtest 2001-2011 SPDR Sectors
14-Day RSI iShares High
30- day RoC Dow 30
14-Day RSI
Selection and Sizing 3 lowest 333
each 3 highest
333 each 3 lowest 333
each Starting Capital $100000 $100000 $100000
Net Profit $122130 $222150 $245147 Net Profit 122 222 245
Annualized Gain 8 12 13 Total Commission ($22220) $0 ($32126)
Dividends Received $32258 $43202 $39059
Number of Trades 1399 162 2022
Average Bars Held 634 465 469
Win Rate 59 62 61
Maximum Drawdown ($88087) ($67605) ($153644)
Sharpe Ratio 055 089 066
Source Wealth Lab Pro portfolio simulation for 2001-2011
Long Short Not Helpful
25
Long Short on 30-Day RoC
SPDR
Sectors
RoC (LS) iShares RoC
(LS) Dow 30 (LS)
Selection and Sizing for 2
Long and 1 Short 45 each
15 margin 45 each 15
margin 45 each 15
margin Starting Capital $100000 $100000 $100000
Net Profit ($153) $128881 ($25396) Net Profit 0 129 -25
Annualized Gain 0 9 -3 Total Commission ($2759) $0 ($3156)
Dividends Received $8498 $11753 $10969
Number of Trades 175 183 200
Average Bars Held 4312 4128 3786
Win Rate 50 51 48
Maximum Drawdown ($35207) ($42615) ($82881)
Sharpe Ratio 007 072 -002
Source Wealth Lab Pro portfolio simulation for 2001-2011
Dow 30 Survivorship Bias C and AIG Dropped from Index
26
Ideal Dow Now Real Dow with C AIG
Starting Capital $10000000 $10000000
Net Profit $39482470 $14384800
Net Profit 39482 14385
Annualized Gain 1735 933 Total Commission ($3266655) ($3182385)
Dividends Received $4672826 $3087434
Number of Trades 2056 2003
Average Bars Held 463 473
Win Rate 6060 5806
Maximum Drawdown ($12444149) ($10729636)
Sharpe Ratio 089 047
Source Wealth Lab Pro portfolio simulation for 2001-2011
30-Day RoC Not Resilient iShares High RoC Varying Start Dates
27
Source Wealth Lab Pro portfolio simulation for 2001-2011
Optimizing RoC and Stop Loss For Free iShares Rotation
28
Source Wealth Lab Pro portfolio simulation for 2001-2011
RoC Look-Back Period vs Profit iShares High Momentum
29
Source Wealth Lab Pro portfolio simulation for 2001-2011
Stop Loss vs Profit Wealth-Lab Pro Simulation
30
Longer RoC More Resilient Bigger Profits Too
31
Source Wealth Lab Pro portfolio simulation for 2001-2011
iShares ETFs with Top 2 70-day RoC and 15 Stop
What Irsquom Trading Now
Prune commission-free iShares ETFs ACWIACWXAGGDVYEEMEFAEMBHYG
IDVIJHIJJIJKIWBIWDIWFIWMIWNIWOIWVLQDMUBSCZTIP
70-day RoC
Monthly pick top 2 high RoC ETFs
Size 50 each
15 fixed stop loss
32
Historical Performance of My ETF Rotation System
33
Starting Capital $100000
Net Profit $278688 Net Profit 279
Annualized Gain 14 Total Commission $0
Dividends Received $47823
Number of Trades 81
Average Bars Held 5891
Win Rate 60
Maximum Drawdown ($91590)
Sharpe Ratio 091
Source Wealth Lab Pro portfolio simulation for 2001-2011
Simulated Equity Curve ETF Rotation vs SampP500 Hold
34
Source Wealth Lab Pro portfolio simulation for 2001-2011
ETF Options Rotation Manually Back-Tested Two+ Ways
Covered Calls
Calls as Leveraged Position
Basic Same number of shares with less $$
Aggressive Risk 15 of account on each position
Same basic strategy of
iShares with Top 2 70-day RoC
35
Options Difficulties
Thinly traded
Huge bidask spread
Sometimes no bid to sell covered calls
Sometimes no options for underlying ETF
Historical data spotty
36
Options Not Helpful Here
37
$-
$50000
$100000
$150000
$200000
$250000
$300000
$350000
$400000
ETFs Only
Options
Aggressive Options
Covered Calls
My Tools
38
What It Takes to Succeed With
ETF Rotation Plan
Simple numeric comparison counting
1 hour per month
A little bit of self-discipline
Show up for that hour per month
Enter automatic stop loss orders
Donrsquot mess with positions otherwise
Willingness to sell holdings on cue
Market cooperation
39
Survey Prize Drawing
Please complete survey to be entered in
drawing
Fill in email address legibly
Check YES or NO to receive more info
40
Thank You For more information seehellip
wwwbacktestingblogcomsignalsetfrotation
Published article at
httpsguidancefidelitycomviewpointsbuy-
and-hold-sector-rotation
41
jackiepback
testingreport
com

Applicable Markets
SPDR reg Sector ETFs
XLB XLE XLF XLI XLK XLP XLU XLV XLY
iSharesreg ETFs including
Styles (eg small cap growth to large cap value)
Fixed Income
International
Stocks eg Dow 30
15
SPDR is a registered trademark of SampP Financial Services LLC iShares is a registered trademark of Blackrock
System Design Decisions
Timeframe
Applicable Markets
Types of Rotation
Selection Criteria
copy BackTesting Report 2012 16
Types of Rotation
Follow Economic Cycle thru sector ETFs
httpstockchartscomfreechartsperfhtml5bSE
CT5b
Source Sam Stovallrsquos Chart on StockChartscom
17
Types of Rotation
Select beaten-down bargain ETFs
18
Types of Rotation
Select ETFs with highest momentum
19
System Design Decisions
Timeframe
Applicable Markets
Types of Rotation
Selection Criteria
copy BackTesting Report 2012 20
Selection Criteria
KISS
Rank-able and continuously available
Able to back-test
RSI vs RoC
Dividends for Dogs of Dow
21
Original Back-tests on Wealth-Lab Proreg for 2001 - 2011
SampP Sectors lagged in almost every test
iShares High RoC rocked
Dow Stocks with low RSI more
consistent due to daily trades
LongShort didnrsquot help
22
Wealth Lab Pro is a registered trademark of FMC LLC
Buy and Hold Baseline
23
Buy amp Hold
Comparison for
12312001 -
12312011
SPDRs 9
Select Sector
ETFs
iShares All
30 Fidelity
Commission-
Free ETFs
Dow - Equal
Weight of 30
Stocks
SampP500 (IVV
iShares ETF
tracking
fund)
Starting Capital $100000 $100000 $100000 $100000
Net Profit $60029 $52798 $62063 $30430
Net Profit 600 528 621 304
Annualized Gain 48 43 50 27
Total Commission ($72) ($231) ($239) ($8)
Dividends Received $23684 $21456 $27565 $20377
Number of Trades 9 29 30 1
Win Rate 889 828 600 1000
Maximum Drawdown ($84414) ($79755) ($76261) ($78159)
Sharpe Ratio 039 038 040 025
Source Wealth Lab Pro portfolio simulation for 2001-2011
1st Pass Performance Stats
24
Backtest 2001-2011 SPDR Sectors
14-Day RSI iShares High
30- day RoC Dow 30
14-Day RSI
Selection and Sizing 3 lowest 333
each 3 highest
333 each 3 lowest 333
each Starting Capital $100000 $100000 $100000
Net Profit $122130 $222150 $245147 Net Profit 122 222 245
Annualized Gain 8 12 13 Total Commission ($22220) $0 ($32126)
Dividends Received $32258 $43202 $39059
Number of Trades 1399 162 2022
Average Bars Held 634 465 469
Win Rate 59 62 61
Maximum Drawdown ($88087) ($67605) ($153644)
Sharpe Ratio 055 089 066
Source Wealth Lab Pro portfolio simulation for 2001-2011
Long Short Not Helpful
25
Long Short on 30-Day RoC
SPDR
Sectors
RoC (LS) iShares RoC
(LS) Dow 30 (LS)
Selection and Sizing for 2
Long and 1 Short 45 each
15 margin 45 each 15
margin 45 each 15
margin Starting Capital $100000 $100000 $100000
Net Profit ($153) $128881 ($25396) Net Profit 0 129 -25
Annualized Gain 0 9 -3 Total Commission ($2759) $0 ($3156)
Dividends Received $8498 $11753 $10969
Number of Trades 175 183 200
Average Bars Held 4312 4128 3786
Win Rate 50 51 48
Maximum Drawdown ($35207) ($42615) ($82881)
Sharpe Ratio 007 072 -002
Source Wealth Lab Pro portfolio simulation for 2001-2011
Dow 30 Survivorship Bias C and AIG Dropped from Index
26
Ideal Dow Now Real Dow with C AIG
Starting Capital $10000000 $10000000
Net Profit $39482470 $14384800
Net Profit 39482 14385
Annualized Gain 1735 933 Total Commission ($3266655) ($3182385)
Dividends Received $4672826 $3087434
Number of Trades 2056 2003
Average Bars Held 463 473
Win Rate 6060 5806
Maximum Drawdown ($12444149) ($10729636)
Sharpe Ratio 089 047
Source Wealth Lab Pro portfolio simulation for 2001-2011
30-Day RoC Not Resilient iShares High RoC Varying Start Dates
27
Source Wealth Lab Pro portfolio simulation for 2001-2011
Optimizing RoC and Stop Loss For Free iShares Rotation
28
Source Wealth Lab Pro portfolio simulation for 2001-2011
RoC Look-Back Period vs Profit iShares High Momentum
29
Source Wealth Lab Pro portfolio simulation for 2001-2011
Stop Loss vs Profit Wealth-Lab Pro Simulation
30
Longer RoC More Resilient Bigger Profits Too
31
Source Wealth Lab Pro portfolio simulation for 2001-2011
iShares ETFs with Top 2 70-day RoC and 15 Stop
What Irsquom Trading Now
Prune commission-free iShares ETFs ACWIACWXAGGDVYEEMEFAEMBHYG
IDVIJHIJJIJKIWBIWDIWFIWMIWNIWOIWVLQDMUBSCZTIP
70-day RoC
Monthly pick top 2 high RoC ETFs
Size 50 each
15 fixed stop loss
32
Historical Performance of My ETF Rotation System
33
Starting Capital $100000
Net Profit $278688 Net Profit 279
Annualized Gain 14 Total Commission $0
Dividends Received $47823
Number of Trades 81
Average Bars Held 5891
Win Rate 60
Maximum Drawdown ($91590)
Sharpe Ratio 091
Source Wealth Lab Pro portfolio simulation for 2001-2011
Simulated Equity Curve ETF Rotation vs SampP500 Hold
34
Source Wealth Lab Pro portfolio simulation for 2001-2011
ETF Options Rotation Manually Back-Tested Two+ Ways
Covered Calls
Calls as Leveraged Position
Basic Same number of shares with less $$
Aggressive Risk 15 of account on each position
Same basic strategy of
iShares with Top 2 70-day RoC
35
Options Difficulties
Thinly traded
Huge bidask spread
Sometimes no bid to sell covered calls
Sometimes no options for underlying ETF
Historical data spotty
36
Options Not Helpful Here
37
$-
$50000
$100000
$150000
$200000
$250000
$300000
$350000
$400000
ETFs Only
Options
Aggressive Options
Covered Calls
My Tools
38
What It Takes to Succeed With
ETF Rotation Plan
Simple numeric comparison counting
1 hour per month
A little bit of self-discipline
Show up for that hour per month
Enter automatic stop loss orders
Donrsquot mess with positions otherwise
Willingness to sell holdings on cue
Market cooperation
39
Survey Prize Drawing
Please complete survey to be entered in
drawing
Fill in email address legibly
Check YES or NO to receive more info
40
Thank You For more information seehellip
wwwbacktestingblogcomsignalsetfrotation
Published article at
httpsguidancefidelitycomviewpointsbuy-
and-hold-sector-rotation
41
jackiepback
testingreport
com

System Design Decisions
Timeframe
Applicable Markets
Types of Rotation
Selection Criteria
copy BackTesting Report 2012 16
Types of Rotation
Follow Economic Cycle thru sector ETFs
httpstockchartscomfreechartsperfhtml5bSE
CT5b
Source Sam Stovallrsquos Chart on StockChartscom
17
Types of Rotation
Select beaten-down bargain ETFs
18
Types of Rotation
Select ETFs with highest momentum
19
System Design Decisions
Timeframe
Applicable Markets
Types of Rotation
Selection Criteria
copy BackTesting Report 2012 20
Selection Criteria
KISS
Rank-able and continuously available
Able to back-test
RSI vs RoC
Dividends for Dogs of Dow
21
Original Back-tests on Wealth-Lab Proreg for 2001 - 2011
SampP Sectors lagged in almost every test
iShares High RoC rocked
Dow Stocks with low RSI more
consistent due to daily trades
LongShort didnrsquot help
22
Wealth Lab Pro is a registered trademark of FMC LLC
Buy and Hold Baseline
23
Buy amp Hold
Comparison for
12312001 -
12312011
SPDRs 9
Select Sector
ETFs
iShares All
30 Fidelity
Commission-
Free ETFs
Dow - Equal
Weight of 30
Stocks
SampP500 (IVV
iShares ETF
tracking
fund)
Starting Capital $100000 $100000 $100000 $100000
Net Profit $60029 $52798 $62063 $30430
Net Profit 600 528 621 304
Annualized Gain 48 43 50 27
Total Commission ($72) ($231) ($239) ($8)
Dividends Received $23684 $21456 $27565 $20377
Number of Trades 9 29 30 1
Win Rate 889 828 600 1000
Maximum Drawdown ($84414) ($79755) ($76261) ($78159)
Sharpe Ratio 039 038 040 025
Source Wealth Lab Pro portfolio simulation for 2001-2011
1st Pass Performance Stats
24
Backtest 2001-2011 SPDR Sectors
14-Day RSI iShares High
30- day RoC Dow 30
14-Day RSI
Selection and Sizing 3 lowest 333
each 3 highest
333 each 3 lowest 333
each Starting Capital $100000 $100000 $100000
Net Profit $122130 $222150 $245147 Net Profit 122 222 245
Annualized Gain 8 12 13 Total Commission ($22220) $0 ($32126)
Dividends Received $32258 $43202 $39059
Number of Trades 1399 162 2022
Average Bars Held 634 465 469
Win Rate 59 62 61
Maximum Drawdown ($88087) ($67605) ($153644)
Sharpe Ratio 055 089 066
Source Wealth Lab Pro portfolio simulation for 2001-2011
Long Short Not Helpful
25
Long Short on 30-Day RoC
SPDR
Sectors
RoC (LS) iShares RoC
(LS) Dow 30 (LS)
Selection and Sizing for 2
Long and 1 Short 45 each
15 margin 45 each 15
margin 45 each 15
margin Starting Capital $100000 $100000 $100000
Net Profit ($153) $128881 ($25396) Net Profit 0 129 -25
Annualized Gain 0 9 -3 Total Commission ($2759) $0 ($3156)
Dividends Received $8498 $11753 $10969
Number of Trades 175 183 200
Average Bars Held 4312 4128 3786
Win Rate 50 51 48
Maximum Drawdown ($35207) ($42615) ($82881)
Sharpe Ratio 007 072 -002
Source Wealth Lab Pro portfolio simulation for 2001-2011
Dow 30 Survivorship Bias C and AIG Dropped from Index
26
Ideal Dow Now Real Dow with C AIG
Starting Capital $10000000 $10000000
Net Profit $39482470 $14384800
Net Profit 39482 14385
Annualized Gain 1735 933 Total Commission ($3266655) ($3182385)
Dividends Received $4672826 $3087434
Number of Trades 2056 2003
Average Bars Held 463 473
Win Rate 6060 5806
Maximum Drawdown ($12444149) ($10729636)
Sharpe Ratio 089 047
Source Wealth Lab Pro portfolio simulation for 2001-2011
30-Day RoC Not Resilient iShares High RoC Varying Start Dates
27
Source Wealth Lab Pro portfolio simulation for 2001-2011
Optimizing RoC and Stop Loss For Free iShares Rotation
28
Source Wealth Lab Pro portfolio simulation for 2001-2011
RoC Look-Back Period vs Profit iShares High Momentum
29
Source Wealth Lab Pro portfolio simulation for 2001-2011
Stop Loss vs Profit Wealth-Lab Pro Simulation
30
Longer RoC More Resilient Bigger Profits Too
31
Source Wealth Lab Pro portfolio simulation for 2001-2011
iShares ETFs with Top 2 70-day RoC and 15 Stop
What Irsquom Trading Now
Prune commission-free iShares ETFs ACWIACWXAGGDVYEEMEFAEMBHYG
IDVIJHIJJIJKIWBIWDIWFIWMIWNIWOIWVLQDMUBSCZTIP
70-day RoC
Monthly pick top 2 high RoC ETFs
Size 50 each
15 fixed stop loss
32
Historical Performance of My ETF Rotation System
33
Starting Capital $100000
Net Profit $278688 Net Profit 279
Annualized Gain 14 Total Commission $0
Dividends Received $47823
Number of Trades 81
Average Bars Held 5891
Win Rate 60
Maximum Drawdown ($91590)
Sharpe Ratio 091
Source Wealth Lab Pro portfolio simulation for 2001-2011
Simulated Equity Curve ETF Rotation vs SampP500 Hold
34
Source Wealth Lab Pro portfolio simulation for 2001-2011
ETF Options Rotation Manually Back-Tested Two+ Ways
Covered Calls
Calls as Leveraged Position
Basic Same number of shares with less $$
Aggressive Risk 15 of account on each position
Same basic strategy of
iShares with Top 2 70-day RoC
35
Options Difficulties
Thinly traded
Huge bidask spread
Sometimes no bid to sell covered calls
Sometimes no options for underlying ETF
Historical data spotty
36
Options Not Helpful Here
37
$-
$50000
$100000
$150000
$200000
$250000
$300000
$350000
$400000
ETFs Only
Options
Aggressive Options
Covered Calls
My Tools
38
What It Takes to Succeed With
ETF Rotation Plan
Simple numeric comparison counting
1 hour per month
A little bit of self-discipline
Show up for that hour per month
Enter automatic stop loss orders
Donrsquot mess with positions otherwise
Willingness to sell holdings on cue
Market cooperation
39
Survey Prize Drawing
Please complete survey to be entered in
drawing
Fill in email address legibly
Check YES or NO to receive more info
40
Thank You For more information seehellip
wwwbacktestingblogcomsignalsetfrotation
Published article at
httpsguidancefidelitycomviewpointsbuy-
and-hold-sector-rotation
41
jackiepback
testingreport
com

Types of Rotation
Select ETFs with highest momentum
19
System Design Decisions
Timeframe
Applicable Markets
Types of Rotation
Selection Criteria
copy BackTesting Report 2012 20
Selection Criteria
KISS
Rank-able and continuously available
Able to back-test
RSI vs RoC
Dividends for Dogs of Dow
21
Original Back-tests on Wealth-Lab Proreg for 2001 - 2011
SampP Sectors lagged in almost every test
iShares High RoC rocked
Dow Stocks with low RSI more
consistent due to daily trades
LongShort didnrsquot help
22
Wealth Lab Pro is a registered trademark of FMC LLC
Buy and Hold Baseline
23
Buy amp Hold
Comparison for
12312001 -
12312011
SPDRs 9
Select Sector
ETFs
iShares All
30 Fidelity
Commission-
Free ETFs
Dow - Equal
Weight of 30
Stocks
SampP500 (IVV
iShares ETF
tracking
fund)
Starting Capital $100000 $100000 $100000 $100000
Net Profit $60029 $52798 $62063 $30430
Net Profit 600 528 621 304
Annualized Gain 48 43 50 27
Total Commission ($72) ($231) ($239) ($8)
Dividends Received $23684 $21456 $27565 $20377
Number of Trades 9 29 30 1
Win Rate 889 828 600 1000
Maximum Drawdown ($84414) ($79755) ($76261) ($78159)
Sharpe Ratio 039 038 040 025
Source Wealth Lab Pro portfolio simulation for 2001-2011
1st Pass Performance Stats
24
Backtest 2001-2011 SPDR Sectors
14-Day RSI iShares High
30- day RoC Dow 30
14-Day RSI
Selection and Sizing 3 lowest 333
each 3 highest
333 each 3 lowest 333
each Starting Capital $100000 $100000 $100000
Net Profit $122130 $222150 $245147 Net Profit 122 222 245
Annualized Gain 8 12 13 Total Commission ($22220) $0 ($32126)
Dividends Received $32258 $43202 $39059
Number of Trades 1399 162 2022
Average Bars Held 634 465 469
Win Rate 59 62 61
Maximum Drawdown ($88087) ($67605) ($153644)
Sharpe Ratio 055 089 066
Source Wealth Lab Pro portfolio simulation for 2001-2011
Long Short Not Helpful
25
Long Short on 30-Day RoC
SPDR
Sectors
RoC (LS) iShares RoC
(LS) Dow 30 (LS)
Selection and Sizing for 2
Long and 1 Short 45 each
15 margin 45 each 15
margin 45 each 15
margin Starting Capital $100000 $100000 $100000
Net Profit ($153) $128881 ($25396) Net Profit 0 129 -25
Annualized Gain 0 9 -3 Total Commission ($2759) $0 ($3156)
Dividends Received $8498 $11753 $10969
Number of Trades 175 183 200
Average Bars Held 4312 4128 3786
Win Rate 50 51 48
Maximum Drawdown ($35207) ($42615) ($82881)
Sharpe Ratio 007 072 -002
Source Wealth Lab Pro portfolio simulation for 2001-2011
Dow 30 Survivorship Bias C and AIG Dropped from Index
26
Ideal Dow Now Real Dow with C AIG
Starting Capital $10000000 $10000000
Net Profit $39482470 $14384800
Net Profit 39482 14385
Annualized Gain 1735 933 Total Commission ($3266655) ($3182385)
Dividends Received $4672826 $3087434
Number of Trades 2056 2003
Average Bars Held 463 473
Win Rate 6060 5806
Maximum Drawdown ($12444149) ($10729636)
Sharpe Ratio 089 047
Source Wealth Lab Pro portfolio simulation for 2001-2011
30-Day RoC Not Resilient iShares High RoC Varying Start Dates
27
Source Wealth Lab Pro portfolio simulation for 2001-2011
Optimizing RoC and Stop Loss For Free iShares Rotation
28
Source Wealth Lab Pro portfolio simulation for 2001-2011
RoC Look-Back Period vs Profit iShares High Momentum
29
Source Wealth Lab Pro portfolio simulation for 2001-2011
Stop Loss vs Profit Wealth-Lab Pro Simulation
30
Longer RoC More Resilient Bigger Profits Too
31
Source Wealth Lab Pro portfolio simulation for 2001-2011
iShares ETFs with Top 2 70-day RoC and 15 Stop
What Irsquom Trading Now
Prune commission-free iShares ETFs ACWIACWXAGGDVYEEMEFAEMBHYG
IDVIJHIJJIJKIWBIWDIWFIWMIWNIWOIWVLQDMUBSCZTIP
70-day RoC
Monthly pick top 2 high RoC ETFs
Size 50 each
15 fixed stop loss
32
Historical Performance of My ETF Rotation System
33
Starting Capital $100000
Net Profit $278688 Net Profit 279
Annualized Gain 14 Total Commission $0
Dividends Received $47823
Number of Trades 81
Average Bars Held 5891
Win Rate 60
Maximum Drawdown ($91590)
Sharpe Ratio 091
Source Wealth Lab Pro portfolio simulation for 2001-2011
Simulated Equity Curve ETF Rotation vs SampP500 Hold
34
Source Wealth Lab Pro portfolio simulation for 2001-2011
ETF Options Rotation Manually Back-Tested Two+ Ways
Covered Calls
Calls as Leveraged Position
Basic Same number of shares with less $$
Aggressive Risk 15 of account on each position
Same basic strategy of
iShares with Top 2 70-day RoC
35
Options Difficulties
Thinly traded
Huge bidask spread
Sometimes no bid to sell covered calls
Sometimes no options for underlying ETF
Historical data spotty
36
Options Not Helpful Here
37
$-
$50000
$100000
$150000
$200000
$250000
$300000
$350000
$400000
ETFs Only
Options
Aggressive Options
Covered Calls
My Tools
38
What It Takes to Succeed With
ETF Rotation Plan
Simple numeric comparison counting
1 hour per month
A little bit of self-discipline
Show up for that hour per month
Enter automatic stop loss orders
Donrsquot mess with positions otherwise
Willingness to sell holdings on cue
Market cooperation
39
Survey Prize Drawing
Please complete survey to be entered in
drawing
Fill in email address legibly
Check YES or NO to receive more info
40
Thank You For more information seehellip
wwwbacktestingblogcomsignalsetfrotation
Published article at
httpsguidancefidelitycomviewpointsbuy-
and-hold-sector-rotation
41
jackiepback
testingreport
com
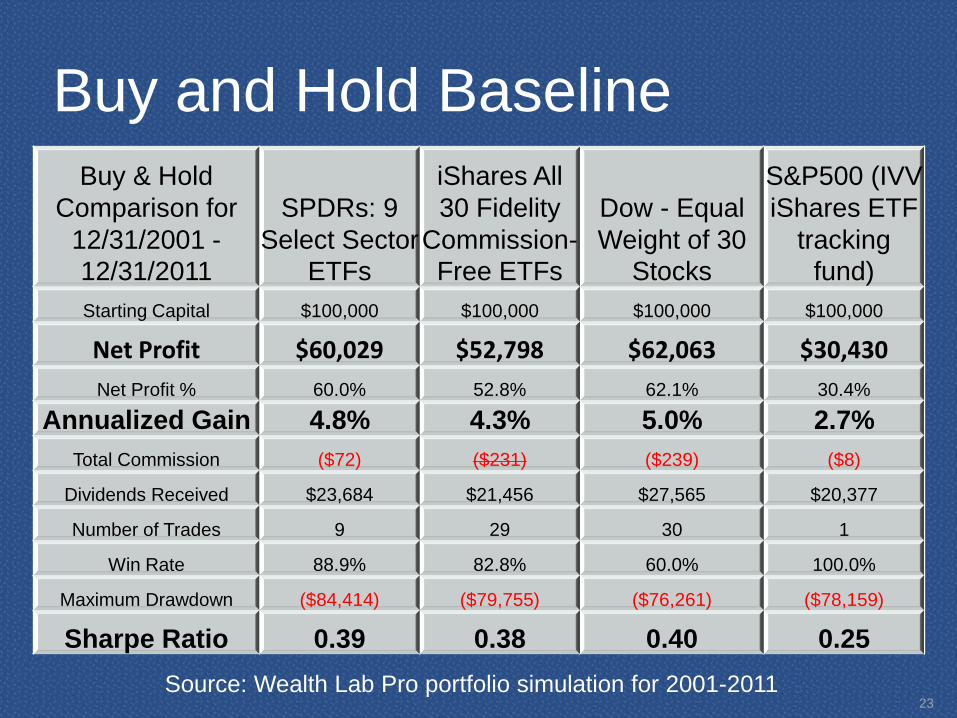
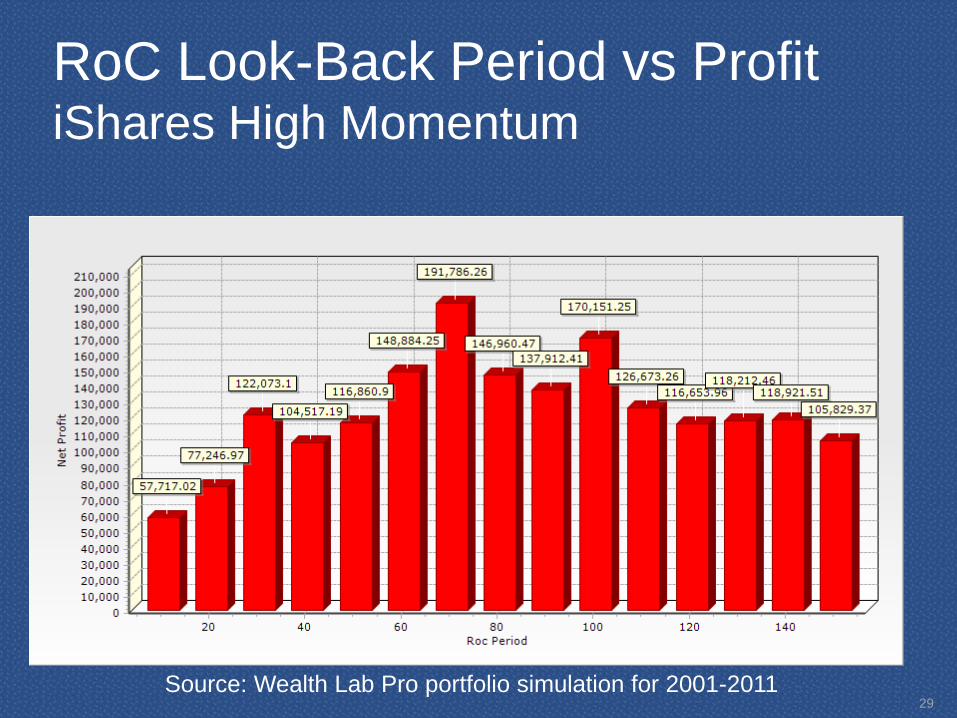

Thank You For more information seehellip
wwwbacktestingblogcomsignalsetfrotation
Published article at
httpsguidancefidelitycomviewpointsbuy-
and-hold-sector-rotation
41
jackiepback
testingreport
com