sector strategies performance report - us epa · pdf filefor more information visit the sector...
TRANSCRIPT


2 0 0 4
P e r f o r m a n c e R e p o r t
A Note To Stakeholders:
Performance measurement is a priority today at the Environmental Protection Agency. EPA
Administrator Mike Leavitt has stated his goal “to increase the velocity of environmental progress”
through collaborative problem-solving and other means to achieve performance results. This focus
on measuring real environmental progress, rather than mere process milestones, reflects the current
expectations of citizens, states, and the regulated community itself.
Several programs within EPA’s National Center for Environmental Innovation are exploring
innovative ways to measure performance trends. Our Performance Track program tracks the progress
of environmental leaders in meeting voluntary stewardship goals. Our evaluation division is
helping other EPA programs assess their effectiveness in meeting the Agency’s long term goals.
NCEI’s Sector Strategies Program is working with selected manufacturing industries and
other types of business and service sectors to measure performance trends on a broad scale.
During the past year, Sector Strategies staff initiated a dialogue on performance measurement
with representatives of the twelve sectors participating in the program. Early discussions focused
on defining relevant performance criteria for each sector and identifying available data (and gaps).
The Sector Strategies Performance Report is a first attempt to portray the environmental progress
of the twelve sectors.
This report represents a baseline, a snapshot in time. In the near term, I hope it will be useful
to you as a reference guide and strategic planning tool. Its long term value, however, will be
determined by the extent to which it prompts innovative thinking about how best to measure
and understand the pace of our environmental progress.
Sincerely,
Jay Benforado
Director

The U.S. Environmental Protection Agency invites you to learn about its new SectorStrategies Program through this first Sector Strategies Performance Report. Launchedin 2003, the Sector Strategies Program promotes industry-wide environmental gainsthrough innovative partnerships with 12 manufacturing and service sectors:
■ Agribusiness ■ Metal Casting ■ Cement ■ Metal Finishing■ Colleges & Universities ■ Paint & Coatings■ Construction ■ Ports■ Forest Products ■ Shipbuilding & Ship Repair■ Iron & Steel ■ Specialty-Batch Chemicals
Through this collaborative, voluntary partnership, we are working with sector tradegroups and other stakeholders to reduce pollution and conserve resources, and to measure corresponding performance results through quantitative metrics. During thefirst year of the Sector Strategies Program, we looked back on each sector’s environmentalprogress to date in order to set the stage for further performance enhancements. We alsodiscussed with our sector partners where additional opportunities for environmental performance improvements lie. Key environmental opportunities identified through ourresearch and discussions form the basis for this report.
The purpose of this report is multi-fold:
■ ■ ■ ■ To profile each sector, highlighting industry statistics and trends, typical processes and operations, and trade group partners;
■ ■ ■ ■ To describe, and where possible, to measure environmental progress to date, focusing on performance trends over the past 10 years; and
■ ■ ■ ■ To identify opportunities – both in the near term as well as over the next decade – for continued environmental improvement.
We used available emissions and resource data, performance indicators, and/or case studies to provide a snapshot of environmental progress in each sector. Case studies, inparticular, illustrate the kinds of innovative operational and measurement activities thatmight be adopted by the entire sector. In many cases, sector commitments are furtherdemonstrated through their active membership in relevant public-private partnerships,such as the National Environmental Performance Track. Over time, we will update performance information and measure sector gains. Thus, we see this report as the first in a series of sector performance updates within the framework of the SectorStrategies Program.
I n t r o d u c t i o n

Sector Strategies Program
The Sector Strategies Program promotes widespread improvement in environmental performance, with reduced administrative burden, in 12 sectors. These sectors are significant for their contributions to thenation’s economy as well as their environmentaland energy footprint. Participating sectors arerepresented by their national associations –more than 20 in all. Individual companies alsotake part, as do EPA programs and regionaloffices, other government agencies, and otherstakeholder groups.
The Sector Strategies Program pursues its goals through a knowledge-based approach toproblem-solving. The program maintains EPA staff experts in each participating sectorwho understand and can effectively address environmental issues that arise. These sectorliaisons are helping stakeholders develop unique, sector-based strategies to:
■ ■ ■ ■ Address and overcome barriers to environmental improvement;
■ ■ ■ ■ Promote the use of environmental management systems (EMS); and
■ ■ ■ ■ Track progress using performance metrics.
For more information visit the Sector Strategies Program Web site at www.epa.gov/sectors. If you are in one of the participating sectors, contact your tradeor service association to get more information or become involved.
The Sector Strategies Program is part of EPA’s National Center for EnvironmentalInnovation. The Center provides a testing ground for innovative ideas that advance environmental protection and assists EPA programs and regional offices in adoptinginnovative approaches that support improved performance. NCEI also houses theNational Environmental Performance Track, which recognizes top environmental performance among participating facilities of all types, sizes, and complexity.Performance Track participation requires that facilities adopt and implement an EMS,with commitments to continued improvement in environmental performance, publicoutreach, and performance reporting. Trade groups can participate as Performance Track Network Partners by promoting the program to their membership. For moreinformation, visit the program’s Web site at www.epa.gov/performancetrack.
Sectors At-a-Glance+
Contribution of Partner Sectors to U.S. Manufacturing Totals
Gross Domestic Product: 22%*
Facilities: 14%*
Employees: 20%*
Environmental Releases & Wastes: 21%**
Fuels and Energy Purchases: 33%*+
These figures represent the contribution of only manufacturing partner sectors.*Source: U.S. Census Bureau, 20011
**Source: U.S. EPA Toxics Release Inventory2
I n t r o d u c t i o n

Data SourcesThis report looks back over the last 10 years at sector-specific environmental trends in order to identify areas of continued opportunity, such as:
■ ■ ■ ■ Conserving water;
■ ■ ■ ■ Improving water quality;
■ ■ ■ ■ Increasing energy efficiency;
■ ■ ■ ■ Managing and minimizing waste; and
■ ■ ■ ■ Reducing air emissions.
The multi-year data upon which this report is basedcomes from a variety of public and private sectorsources. Industry reporting to some of these data systems is required by law, while other systems are populated with information submitted voluntarily by the sector. Additionally, sector partners often maintaintheir own databases to track environmental measuresover time. Using multiple sources in this report allowsthe Sector Strategies Program to provide the mostcomprehensive picture of each sector’s environmentalperformance to date.
Toxics Release InventoryOne of the report’s key data sources is EPA’s ToxicsRelease Inventory (TRI), a publicly available databasethat contains information on toxic chemical releasesand other waste management activities at facilities thatuse, process, or manufacture certain chemicals annuallyat levels above reporting thresholds. Although not allfacilities are subject to TRI reporting requirements,aggregate TRI data indicates sector trends in the management and minimization of waste. Where applicable and available for a sector, this reportdescribes and/or arrays graphically annual TRI datafrom 1993 through 2001. TRI categories include:
■ Releases to air, bodies of water, land, or underground injection wells, including on-site releases occurring at a facility and off-site releases resulting from wastes transferred for disposal at another facility;
■ Treatment of materials destroyed in on- or off-site operations such as biological treatment, neutralization, incineration, and physical separation;
■ Energy recovery from materials that are combusted in an energy recovery device like a boiler or industrial furnace, not including treatment by incineration; and
■ Recycling of materials recovered at the facility and made available for further use, or sent off-site for recycling and subsequently returned to the facility for further processing or use in commerce.
Other Federal DatabasesThe report also draws upon two other federal environmental databases for more information onreleases to air and water. The first, the NationalEmissions Inventory (NEI), contains EPA’s estimates of air emissions based upon inputs from numerousstate and local air agencies, tribes, and industry. NEIdata are in part modeled, rather than collected. Thesecond, the Permit Compliance System (PCS), contains information on facilities’ permitted pollutantdischarges in their wastewater. Only those facilities that discharge directly to waterbodies are included; discharges to sewer systems are not tracked in PCS.
Normalization of DataIn all cases the report depicts normalized data in orderto track more accurately real changes in environmentalperformance. As noted in the Glossary, “normalizing”means adjusting the actual annual release numbers sothey are not distorted by changes in facility and sectoreconomic conditions. In this report, annual economicoutput is measured by production volumes or value ofshipments.
For more details on data sources used in this report, see Appendix B.

Beneficial reuse: Use or reuse of a material that would otherwise become a waste.
Byproduct: Material, other than the intended product, that isgenerated as a consequence of an industrial process.
Co-product: A substance produced for a commercial purpose during the manufacture, processing, use, or disposal of another substance or mixture.
Energy efficiency: Actions to save fuels by better buildingdesign, modification of production processes, better selection of road vehicles and transport policies, etc.
Energy recovery: Obtaining energy from waste through avariety of processes, including combustion.
Environment management system (EMS): Asystematic approach to managing all environmental aspects of an operation. May be certified to ISO 14001, a widelyrecognized international standard.
Greenhouse gas (GHG): A collective term for thosegases, including carbon dioxide, methane, nitrous oxide, ozone,hydrofluorocarbons, perfluorocarbons, and sulfur hexafluoride,which contribute to potential climate change.
Hazardous air pollutant (HAP): A category of air pollutants that may present a threat of adverse human healtheffects or adverse environmental effects. Includes asbestos,beryllium, mercury, benzene, coke oven emissions, radionuclides, and vinyl chloride.
Hazardous waste: A byproduct of society that can pose a substantial or potential hazard to human health or the environment when improperly managed. Possesses at least one of four characteristics (ignitability, corrosivity, reactivity, or toxicity), or is specifically listed as hazardous by EPA.
Nitrogen oxides (NOX): A reddish-brown gas compoundthat is a product of combustion and a major contributor to theformation of smog and acid rain.
Non-hazardous waste: Any solid, semi-solid, liquid, or contained gaseous materials discarded from industrial, commercial, mining, or agricultural operations, and from community activities, that is not defined as “hazardous”.
Normalization: A process applied to a data set to comparethe data against some common measure of annual economicoutput, such as value of shipments, number of employees, orunits of production.
Particulate matter (PM): Solid particles or liquid dropletssuspended or carried in the air (e.g., soot, dust, fumes, or mist).PM2.5: Particles less than or equal to 2.5 micrometers in diameter. PM10: Particles less than or equal to 10 micrometers in diameter.
Stormwater runoff: The portion of precipitation, snowmelt, or irrigation water that does not infiltrate the ground or evaporate but instead flows onto adjacent land orwatercourses or is routed into drain/sewer systems.
Sulfur oxides (SOX): A gas compound that is primarily theproduct of combustion of fossil fuels and a major contributor toclimate change and acid rain.
Value of shipments: The net selling values, exclusive offreight and taxes, of all products shipped by manufacturers.
Volatile organic compounds (VOC): Any organic compound that evaporates readily to the atmosphere.Contributes significantly to smog production and certain healthproblems.
G l o s s a r y

■ ■ ■ ■ Agribusiness . . . . . . . . . . . . . . . . . . . . . . . . . . . . . . . . . . . . . . . . . . . . . . . . . . . . . . . . . . . . . . . . . . . . . . . . . . .1
■ ■ ■ ■ Cement . . . . . . . . . . . . . . . . . . . . . . . . . . . . . . . . . . . . . . . . . . . . . . . . . . . . . . . . . . . . . . . . . . . . . . . . . . . . . . . .3
■ ■ ■ ■ Colleges & Universities . . . . . . . . . . . . . . . . . . . . . . . . . . . . . . . . . . . . . . . . . . . . . . . . . . . . . . . . . . . . . . . .9
■ ■ ■ ■ Construction . . . . . . . . . . . . . . . . . . . . . . . . . . . . . . . . . . . . . . . . . . . . . . . . . . . . . . . . . . . . . . . . . . . . . . . . . .13
■ ■ ■ ■ Forest Products . . . . . . . . . . . . . . . . . . . . . . . . . . . . . . . . . . . . . . . . . . . . . . . . . . . . . . . . . . . . . . . . . . . . . . .17
■ ■ ■ ■ Iron & Steel . . . . . . . . . . . . . . . . . . . . . . . . . . . . . . . . . . . . . . . . . . . . . . . . . . . . . . . . . . . . . . . . . . . . . . . . . . .23
■ ■ ■ ■ Metal Casting . . . . . . . . . . . . . . . . . . . . . . . . . . . . . . . . . . . . . . . . . . . . . . . . . . . . . . . . . . . . . . . . . . . . . . . . .27
■ ■ ■ ■ Metal Finishing . . . . . . . . . . . . . . . . . . . . . . . . . . . . . . . . . . . . . . . . . . . . . . . . . . . . . . . . . . . . . . . . . . . . . . .31
■ ■ ■ ■ Paint & Coatings . . . . . . . . . . . . . . . . . . . . . . . . . . . . . . . . . . . . . . . . . . . . . . . . . . . . . . . . . . . . . . . . . . . . . .35
■ ■ ■ ■ Ports . . . . . . . . . . . . . . . . . . . . . . . . . . . . . . . . . . . . . . . . . . . . . . . . . . . . . . . . . . . . . . . . . . . . . . . . . . . . . . . . . .39
■ ■ ■ ■ Shipbuilding & Ship Repair . . . . . . . . . . . . . . . . . . . . . . . . . . . . . . . . . . . . . . . . . . . . . . . . . . . . . . . . . . . .43
■ ■ ■ ■ Specialty-Batch Chemicals . . . . . . . . . . . . . . . . . . . . . . . . . . . . . . . . . . . . . . . . . . . . . . . . . . . . . . . . . . .49
■ ■ ■ ■ Appendix A: Endnotes . . . . . . . . . . . . . . . . . . . . . . . . . . . . . . . . . . . . . . . . . . . . . . . . . . . . . . . . . . . . . . . .51
■ ■ ■ ■ Appendix B: Environmental Data Sources . . . . . . . . . . . . . . . . . . . . . . . . . . . . . . . . . . . . . . . . . . . . .57
C o n t e n t s

A g r i b u s i n e s s
Profile EPA’s Sector Strategies Program defines the agribusiness sector broadly to include those businessentities that most significantly affect how food is grown,processed, and distributed in the U.S. EPA is workingwith agribusiness stakeholders because of the major influence they have on the environmentalpractices of all segments of the food industry, from production to consumption. Diversifiedagribusiness companies such as Kraft Foods, Conagra, PepsiCo, Cargill, and Coca-Cola aresome of the largest in the U.S.
Food processing2 is the focal point for theagribusiness sector, given the predominant rolethat processors play in food production. Foodprocessing companies convert raw fruits, vegetables, grains, meats, and dairy products intofinished goods, ready for the grocer or wholesalerto sell to households, restaurants, or institutionalfood services. Food safety is an overarching objective that affects environmental planning and decisions in all facilities. Processing facilitiesaddress on-site environmental issues but also interact with farmers, livestock growers, distributors, and consumers in ways that can beneficially affect off-site environmental decisions.
Although the food processing industry is comprised of large agribusiness corporations, there are more than 20,000 food processingestablishments widely distributed throughout the country.3 Two-thirds of all food processingcompanies have fewer than 20 employees.4 Like many other industry sectors, the foodindustry has experienced consolidation and vertical integration in recent years.
PRODUCTION PROCESS The industry produces a diverse array of food products, eachwith its own unique production processes and environmental impacts.
PARTNERSHIPS The Sector Strategies Program’s working relationship with the agribusinesssector originated with the meat processing segment of the industry, represented by theAmerican Meat Institute (AMI).5 The National Food Processors Association (NFPA) isEPA's current partner in the Sector Strategies Program.6
KEY ENVIRONMENTAL OPPORTUNITIES The agribusiness sector is working withEPA to improve the industry’s performance by:
❒ Improving water quality;❒ Managing and minimizing waste; and❒ Improving performance of meat processors.
Sector At-a-Glance*Number of Facilities: 21,000
Value of Shipments: $480 Billion
Number of Employees: 1.5 Million*All figures represent food processing segment of sector. Source: U.S. Census Bureau, 20011
Food Processing Activity by Major Subsectors
Source: U.S. Census Bureau, 20017
Other
Animal Food
Bakeries
Grains
Meat
BeveragesFruits & Vegetables
Dairy
11% 11%
14%9%
7%
6%
17%25%

Agrib
usin
ess
2
Improving Water QualityIn the food processing sector, water is an essential element of plant sanitation. Typical wastewater pollutants include biodegradable organics, oil andgrease, and suspended solids. Food processors may beable to recover some of the fats, oils, and greases intheir waste stream and sell them to renderers, and insome cases, treated water can be recycled for plantcleanup or other processing purposes. Federal datafrom approximately 400 food processors indicate a44% decrease in wastewater discharges between 1994and 2002, as plants looked for opportunities to conserve, recycle, or reuse water.8
Managing and Minimizing WasteFood processors use and produce a variety of chemicalsin their operations, including nitrate compounds,ammonia, ethylene glycol, methanol, n-hexane, andhydrochloric and sulfuric acid. More than 1,000 foodprocessors report the release and management of theseand other chemicals through EPA’s Toxics ReleaseInventory (TRI). While normalized quantities of TRIreleases increased, the normalized quantity of TRIreleases and waste managed by food processing facilities decreased by 23% between 1993 and 2001.9
Improving Performance of Meat ProcessorsOngoing projects with AMI and its member companiespromote the use of environmental management systems (EMS) and stewardship in the supply chain.
Environmental Management SystemsTogether with AMI member companies and the state of Iowa, the Sector Strategies Program developed a customized EMS Implementation Guide for meatprocessors.10 Using the Guide as a basis, AMI developedthe Master Achiever Pioneer Star (MAPS) Program,which provides a tiered approach to EMS developmentand performance recognition for AMI members.11
Through their EMS:
■ ■ ■ ■ Advance Brands reduced the volume of caustic chemicals used to treat wastewater by 50%;12 and
■ ■ ■ ■ Excel Corporation reduced solid waste volume by 28% in 2002-2003.13
Stewardship in the Supply Chain Some of the larger meat processors are working withtheir agricultural and livestock suppliers to achieve betternutrient management.
Case Study: Comprehensive NutrientManagement Plans (CNMP)Farmland Foods, Prestage-Stoecker Farms, and 19 of theirsuppliers are participating in an Iowa-based pilot project to voluntarily implement CNMPs at livestock facilities. So far,participating farms have improved nutrient application onnearly 4,500 acres, with an anticipated decrease in soil lossat some farms of more than 30%.14

C e m e n t
Profile The cement sector2 comprises 116 plants in36 states that produce portland cement, which is used as abinding agent in virtually all concrete. Concrete, in turn,is used in a wide variety of construction projects and applications, ranging from patios anddriveways, to stucco and mortar, to bridges and high-rise buildings.
Strong construction markets helped boost cement consumption in the 1990s. Between1993 and 2001, the value of shipments more than doubled.3 At the same time, the cementindustry achieved increased efficiency by automating production and closing small facilities.As a result, the average cement kiln produces over 60% more cement today than 20 yearsago.4
PRODUCTION PROCESS Cement is composed of four elements – calcium, silica, aluminum, and iron – which are commonly found in limestone, clay and sand. These raw materials undergo the following stages of processing in making portland cement:
■ ■ ■ ■ Crushing at the quarry and then proportioning, blending, and grinding at the facility;
■ ■ ■ ■ Preheating before entering the facility’s rotary cement kiln – a long, firebrick-lined, steel furnace;
■ ■ ■ ■ Heating, or pyroprocessing, in the kiln, through which the raw materials become partially molten and form an intermediate product called “clinker”; and
■ ■ ■ ■ Cooling the clinker and grinding it with a small quantity of gypsum to create portland cement.
PARTNERSHIP The Portland Cement Association (PCA) has formed a partnership withEPA’s Sector Strategies Program to improve the environmental performance of the cementindustry. PCA members operate more than 100 facilities and account for more than 95%of U.S. cement production.5
KEY ENVIRONMENTAL OPPORTUNITIES The cement sector is working with EPA to improve the industry’s performance by:
❒ Increasing energy efficiency;❒ Reducing air emissions;❒ Managing and minimizing waste; and❒ Promoting environmental management systems.
Sector At-a-GlanceNumber of Facilities: 116
Value of Shipments: $8.3 Billion
Number of Employees: 18,000Source: U.S. Geological Survey, 20041

Increasing Energy EfficiencyCement manufacturing requires thermochemical processing of substantial quantities of limestone andother raw materials in huge kilns at very high andsustained temperatures. Fueled by coal and petroleumcoke, electricity, wastes, and natural gas, the sectoruses a significant amount of energy in its productionprocesses – an average of 5 million Btus per ton of clinker.6
The industry has made progress in reducing theamount of energy required to produce each ton of cement. Sector-wide energy usage fell 4% from1994 to 2000, following a consistent trend ofdecreased energy usage that began in the early 1970s.7
This continued decline is the result of industry’sefforts to modernize plants by replacing older, moreenergy-intensive “wet” kilns with newer “dry” kilns.Wet kilns blend ground raw materials with an aqueous slurry that is then fed into a kiln, whereasdry kilns are fed their raw materials as a blended drypowder. On average, wet process operations use 34% more energy per ton of production than dry process operations.8
Approximately 80% of U.S. cement capacity now relies on dry process technology.9
Case Study: Energy Star Partners The cement sector is working with EPA’s Energy Starprogram to develop tools to measure energy performanceand to assign ratings to plants within the industry.Currently, 18 of the largest cement manufacturing companies are Energy Star partners. As partners, theyhave committed to measuring and benchmarking theirenergy performance, and developing and implementing plans to improve their performance.10
Cem
ent
4
Energy Consumedby the Cement Sector
Mill
ion
Btus
per
equ
ival
ent t
on
Source: PCA's U.S. and Canadian Labor-Energy Input Survey
4.5
4.7
4.9
5.1
5.3
1994 1995 1996 1997 1998 1999 2000

Reducing Air EmissionsCement manufacturers are working to reduce emissions of nitrogen oxides (NOX), sulfur dioxide(SO2), particulate matter (PM), and greenhouse gases(GHG) from their operations.
Nitrogen Oxide Emissions In cement manufacturing, the combustion of fuels athigh temperatures in the kiln results in the release of NOX emissions. Between 1996 and 2001, the normalized quantity of NOX emissions from thecement sector fell by 3%.11 Current NOX emissionsfrom the sector account for approximately 1% of total U.S. non-agricultural NOx emissions.12
Sulfur Dioxide Emissions The combustion of sulfur-bearing compounds in coal,oil, and petroleum coke, and the processing of pyriteand sulfate in the raw materials, results in the releaseof SO2 emissions from cement operations.
To mitigate these emissions, cement plants typicallyinstall air pollution control technologies called “scrubbers” to trap such pollutants in their exhaustgases. In addition, limestone used in the productionprocess has inherent “self-scrubbing” properties, allowing the industry to handle high-sulfur fuels.Between 1996 and 2001, the normalized quantity of SO2 emissions from the cement sector decreasedby 10%.13
Particulate Matter Emissions In cement manufacturing, quarrying operations, thecrushing and grinding of raw materials and clinker,the kiln line, and cement kiln dust result in PM emissions. Between 1996 and 2001, the normalizedquantity of PM10 emissions from the cement sectorremained fairly constant, following marked improvements begun in the early years of Clean AirAct implementation..14
C e m e n t
33.6
34
34.4
34.8
35.2
35.6
1993 1994 1995 1996 1997 1998 1999 2000 2001
Carbon Dioxide Emissions from the Cement Sector
Met
ric to
ns (m
illio
ns)*
*Normalized by cement production Sources: U.S. DOE, U.S. Carbon Dioxide Emissions from Industrial Processes U.S Geological Survey, Mineral Commodity Summaries
0
5
10
15
20
25
1996 1997 1998 1999 2000 2001
Particulate Matter Emissions from the Cement Sector
Met
ric to
ns (t
hous
ands
)*
Particulate Matter2.5Particulate Matter10
*Normalized by clinker production Sources: U.S. EPA, National Emission Inventory U.S. Geological Survey, Minerals Yearbook
0
50
100
150
200
250
1996 1997 1998 1999 2000 2001
Nitrogen Oxide & Sulfur Dioxide Emissions from the Cement Sector
Met
ric to
ns (t
hous
ands
)*Nitrogen Oxide
Sulfur Dioxide
*Normalized by clinker production Sources: U.S. EPA, National Emission Inventory U.S. Geological Survey, Minerals Yearbook

Greenhouse Gas Emissions Approximately 98% of man-made carbon dioxide(CO2) emissions come from the combustion of fuel,for a total of 5.8 million tons in 2002.15 Of this percentage, about one-third is due to fuel combustionby motor vehicles, and another third comes frompower plants. The cement sector contributes to 1.3%of the final third, with CO2 emissions resulting fromthe burning of fossil fuels (predominantly coal) duringpyroprocessing, and from the chemical reactions (calcination) that convert limestone into clinker.16
In 2002, cement production resulted in more than 43 million metric tons of CO2 emissions.17
In 2003, PCA formalized its commitment to CO2
emissions reductions by joining Climate VISION, a voluntary program administered by the U.S.Department of Energy (DOE) to reduce GHG intensity (the ratio of emissions to economic output).18
PCA has committed to a 10% reduction in CO2
emissions per ton of product by 2020 (from 1990 levels).
Case Study: Voluntary Reporting of GHG EmissionsDOE’s 1605(b) Voluntary Reporting of GreenhouseGases Program: ■ Provides a tool for measuring GHG emission
reductions;■ Collects voluntarily reported data on GHG emissions
and activities aimed at reducing GHG emissions; and■ Gathers information on commitments to reduce GHG
emissions and increase carbon sequestration.19
Two participating Lehigh Cement facilities submittedreports in 2002 showing a combined emission reductionof more than 450,000 metric tons of CO2 equivalent.20
Cem
ent
6

C e m e n t
Managing and Minimizing WasteCement kiln dust (CKD) is the broad term that refersto particles released from the pyroprocessing line.CKD includes partially burned raw materials, clinker,and eroded fragments from the refractory brick liningof the kilns. Modern plants typically try to recoverCKD, because it can be reused in the manufacturingprocess. Recycling CKD serves the environment by:■ ■ ■ ■ Reducing the amount of raw materials needed;
■ ■ ■ ■ Reducing energy consumption, since the material is already partially processed; and
■ ■ ■ ■ Reducing health concerns associated with landfilling (e.g., the possible release of heavy metals and dust into the air and water).
Currently about two-thirds of the CKD generated isreturned to the kiln for reuse in the manufacturingprocess.21 The amount of CKD recycled continues toincrease as old process lines are replaced or updated.There are limits to the recycling of CKD in the manufacturing process, however, because contaminants (such as alkalis) can build up in theCKD and compromise the quality of the clinker.
The CKD that is not recycled is either disposed at alandfill or sold to other sectors for “beneficial reuse”applications such as road fill, liming agent for soil, orstabilizer for sludges and other wastes. Between 1995and 2002, the normalized quantity of CKD disposeddropped from 3.1 million metric tons to 2 millionmetric tons. During the same time period, beneficialreuse of CKD varied between 570,000 and 920,000metric tons.22
Cement Kiln Dust Disposed in Landfillsby the Cement Sector
+Data are not available for 1996-1997 and 1999*Normalized by clinker production Sources: PCA, Cement Kiln Dust Surveys U.S. Geological Survey, Minerals Yearbook
0
0.5
1
1.5
2
2.5
3
3.5
1995 1996 1997 1998 1999 2000 2001 2002
Met
ric to
ns (m
illio
ns)*
No Data+
No Data+

Promoting Environmental Management SystemsInterest in environmental management systems (EMS)is increasing in the cement sector. PCA has begun discussing the development of an EMS program withits membership. Details of the program are expectedto be announced in mid-2004.
Case Study: EMS at St. Lawrence Cement GroupIn 2000, St. Lawrence Cement Group created a 5-yearSustainable Environmental Performance business plan,which identified key issues, opportunities, and actions tobe integrated into its management framework. As partof the plan, St. Lawrence committed to:■ Implementing an ISO 14001-certified EMS at all of
its cement manufacturing and grinding facilities by the end of 2004;
■ Reducing CO2 emissions per ton of product by 15% by 2010 (from 2000 levels); and
■ Reducing consumption of virgin raw materials per ton of product by 15% by 2007 (from 2000 levels).
St. Lawrence has also implemented a corporate emissionand reporting standard, which allows it to track energyconsumption, air emissions, and CKD recycling acrossall of its facilities. The table below highlights the company’s progress to date in these areas.23
Environmental Improvements at St. Lawrence Cement Group24
Performance Measure 2000 2002
Total cement production (million tons) 3.5 4.1
Electrical consumption (kwh/ton) 152 144
Heat consumption (gigajoules/ton) 3.94 3.48
CO2 emissions (kg/ton) 792 704
NOx emissions (kg/ton) 2.9 2.1
SO2 emissions (kg/ton) 2.3 2.0
CKD previously disposed, then recycled (thousand tons) 50 24
Cem
ent
8

C o l l e g e s & Un i v e r s i t i e s
Profile The college and university sector4 includes awide variety of campuses across the country, from smallcommunity colleges to large research universities. Fundingsources for the sector include tuition, private donations,government grants, and, for public institutions, stateappropriations. In 2002, higher education institutions educated more than 15 million students. Enrollment is expected to increase to more than 18 million students by 2013.5
CAMPUS OPERATIONS Classroom education is only one of many activities taking place on college campuses. Campuses often maintain other types of facilities, includingresearch laboratories, art studios, utility generation and transmission plants, dormitories,and water distribution systems. Many large research institutions also have specialized facilities, such as medical centers, agricultural centers, nuclear reactors, and high securitybiomedical laboratories. Improving environmental performance on campuses offers aunique opportunity to raise awareness and instill knowledge about environmental issues in students.
PARTNERSHIPS Six organizations have formed a partnership with EPA's Sector StrategiesProgram to improve the environmental performance of the college and university sector.These organizations are:
■ ■ ■ ■ American Council on Education (ACE);
■ ■ ■ ■ APPA: Association of Higher Education Facilities Officers;
■ ■ ■ ■ Campus Consortium for Environmental Excellence (C2E2);
■ ■ ■ ■ Campus Safety, Health and Environmental Management Association (CSHEMA);
■ ■ ■ ■ Howard Hughes Medical Institute (HHMI); and
■ ■ ■ ■ National Association of College and University Business Officers (NACUBO).6
KEY ENVIRONMENTAL OPPORTUNITIES In 2003, EPA and the six partner organizations formed a performance measurement workgroup to select key environmentalperformance indicators, determine appropriate methodologies to measure these indicators,measure these indicators on their campuses, and develop tools to assist other institutionswith the measurement process. The college and university sector is working with EPA toimprove campus performance by:
❒ Increasing energy efficiency;❒ Reducing air emissions;❒ Managing and minimizing waste;❒ Conserving water; and❒ Promoting environmental management systems.
Sector At-a-GlanceNumber of Institutions: 4,000*
Value of Revenues: $260 Billion**
Number of Employees: 2.9 Million****Source: U.S. Census Bureau, 20011
**Source: National Center for Education Statistics, 20032
***Source: National Center for Education Statistics, 20013

Colleges &
Un
iversities
10
Increasing Energy Efficiency Energy consumption is one of the largest environmental impacts of college campuses. New construction, aging infrastructure, financial constraints, and increasing energy costs are motivating institutions to re-evaluate their energyinfrastructure. The U.S. Department of Energy estimates that at least 25% of the $6 billion collegesand universities spend annually on energy could besaved through better energy management.7
In order to reduce the costs and environmentalimpacts associated with energy use, colleges and universities across the country are undertaking a variety of energy conservation activities.
Case Study: Energy Star Partners As EPA Energy Star partners, more than 200 collegesand universities have committed to measure their energy consumption and develop and implement plans to improve their energy performance.8
In 2002, one Energy Star partner, DutchessCommunity College (DCC) in Poughkeepsie, NY,invested in energy efficiency by signing a $2.4 million performance-based contract that included replacing a 500-ton electric chiller, an industrial-scale water-cooling mechanism used to air condition fourbuildings on campus, with two new 300-ton gas-enginepowered chillers. As a result, the college has alreadyreduced energy use by 13%. Over the next 15 years,DCC expects to save more than 830,000 kilowatt-hoursper year in energy, for a total of $1.2 million savings inenergy costs.9
Case Study: Energy Efficiency at the University of Florida The University of Florida (UF) in Gainesville, FL,embarked on an energy efficiency campaign in the mid-1990s. With the leadership of the vice-presidentfor finance and administration, UF began a two-year,$6 million project to improve the scheduling and controlling of the campus’ energy demands. The projectresulted in over $2 million net savings. Over five years,UF’s total and per capita energy consumption decreasedby almost 25%.10
Reducing Air EmissionsMany colleges and universities are committed toreducing greenhouse gas (GHG) emissions resultingfrom power plants, electricity use, and fleet vehicleson campus. For example:
■ ■ ■ ■ The presidents of all 56 New Jersey colleges and universities have endorsed a Sustainability Greenhouse Gas Action Plan for New Jersey that calls for a 3.5% reduction in the state's GHG emissions by 2005.11
■ ■ ■ ■ The University of Florida in Gainesville, FL, is pursuing an aggressive goal of becoming “carbon-neutral” by the year 2030 through an effort to offset campus GHG emissions with projects that cut down GHG emissions by an equal amount.12

C o l l e g e s & Un i v e r s i t i e s
Managing and Minimizing Waste Many colleges and universities are working to reducegeneration and increase recycling of hazardous and solidwastes on their campuses.
Hazardous Waste MinimizationColleges and universities produce hazardous waste in campus laboratories, medical centers, and art studios, as well as during operations and maintenance of buildings and vehicles, and construction. Many campuses are implementing hazardous waste reduction programs to cost-effectively decrease theamount of hazardous wastes on campuses while supporting a mission of research and education.Measuring reductions of hazardous waste on campusesposes some unique challenges, because the quantitiesand types of chemicals used are constantly changing in dynamic research environments.
Case Study: Waste Minimization at the University of Michigan Over the past decade, research funding at the Universityof Michigan (UM) in Ann Arbor, MI, has grown129%. Consequently, research laboratory space hasincreased by 47%, and waste generation has increasedcorrespondingly.
In an effort to bring waste volumes and cost under control, UM launched a formal waste minimizationprogram in 1995. UM is utilizing many different tools, including:■ Education (including micro-teaching techniques);■ Protocol review;■ Non-hazardous product substitution;■ Solvent distillation systems;■ Chemical tracking systems; and ■ Chemical redistribution programs.
Though overall waste generation continued to increasethrough 2002, a decrease began in 2003 as many ofthese programs began to take full effect. The table belowdisplays some of the program’s successes. The programhas proven to be cost-effective, saving more than$200,000 annually in disposal costs and the need topurchase new chemicals.13
UM's Waste Minimization Initiatives14
Chemical Type Waste Minimization Method Annual Reduction
Acetone, Xylene, Alcohols Distillation 5,500 gallons
Ethidium Bromide Filtration 100 gallons
Photo Processing Waste Silver Recovery 800 gallons
Acids, Bases, Solvents Micro-Teaching Techniques 300 gallons
Varied Chemical Redistribution 400 bottles
Varied Chemical Tracking/Sharing 210 gallons
Elemental Mercury Equip. Mercury-Free Replacement 2,200 pounds
Varied Aqueous-Based Substitution 20 gallons

Solid Waste RecyclingSolid wastes from colleges and unversities includecommon recyclables, such as cans, glass, cardboardand office paper; and compostables, such as foodscraps, animal bedding, landscape refuse, and trash.An increasing number of colleges and universities arereducing their solid waste volumes through recycling.
Case Study: College and University Recycling CouncilThe National Recycling Coalition’s College andUniversity Recycling Council is a network of campus-based recycling professionals with a mission to organize and support environmental program leadersin managing resources, recycling, and waste issues.
The Council created an on-line benchmarking tool so that colleges and universities can compare their performance with other schools and quantify the aggregate benefits of campus resource management and recycling programs. The 100 Council members are encouraged to share their progress with the public.In 2002, 20 schools posted information on-line aboutthe amount of recyclables, compostables, and trash collected on their campuses.15
Conserving WaterWater conservation efforts on campuses often include simple activities, such as conserving water at the faucet, reusing landscaping water, and implementing more efficient methods of heating and cooling buildings.
Case Study: Water Conservation at the University of ColoradoIn 2001, the University of Colorado, in Boulder, CO,began several water conservation projects, including: ■ Installing temperature sensor and control valves
on two furnaces;■ Replacing water-driven aspirators with vacuum
pumps in laboratories; and■ Decreasing the amount of water used for irrigation.
As a result of these and other projects, total annualwater usage decreased by 11% between 2001 and2002, saving the university approximately $170,000.16
Promoting Environmental Management SystemsColleges and universities are increasingly utilizing systematic approaches, such as environmental management systems EMS, to meet environmentalchallenges. Campus-wide EMS can assist colleges anduniversities in making measurable progress towardenvironmental goals.
Case Study: Washington State University’s Campus-wide EMSIn 1999, Washington State University (WSU) in Pullman, WA, implemented one of the first campus-wide EMS. Since that time, WSU has experienced a number of environmental benefits inareas such as recycling and energy. Between 2001 and 2003, WSU experienced a 56% increase in recycling. A number of energy conservation projects have also led to the conservation of 3.6 million kilowatt-hours of energy per year. Through its EMS,WSU has also committed to reduce nitrogen oxide emissions by more than 50% and sulfur dioxide emissions by more than 85% by 2005.17 In 2003,WSU became the first university to be accepted into EPA's National Environmental Performance Track.18
Colleges &
Un
iversities
12

C o n s t r u c t i o n
Profile The construction sector3 comprises generaland specialty contractors, which are predominantly smallbusinesses that can be found across the country. The construction sector can be divided into three major segments:
■ ■ ■ ■ Building construction;
■ ■ ■ ■ Heavy and civil engineering construction, including highways, bridges, and other public works; and
■ ■ ■ ■ Specialty trade contractors, such as plumbing, mechanical, and electrical contractors.
In the last ten years, employment in the construction sector increased more than 40%.4 New orders for construction materials and supplies in 2003 totaled $420 billion, which is nearly 11% of total U.S. manufacturing orders.5
BUILDING PROCESS Contractors perform a wide variety of activities, from building roads to golf courses to buildings. While the production processes for the construction sector vary greatly depending upon the project, the following steps are often standard across projects:
■ ■ ■ ■ Project planning and design;
■ ■ ■ ■ Permitting;
■ ■ ■ ■ Material selection;
■ ■ ■ ■ Demolition and/or excavation;
■ ■ ■ ■ Security;
■ ■ ■ ■ Construction; and
■ ■ ■ ■ Inspections.
PARTNERSHIP The Associated General Contractors of America (AGC) has formed a partnership with EPA’s Sector Strategies Program to improve the environmental performance of the construction industry. AGC’s 35,000 members represent all segmentsof the construction industry except single-family housing.6
KEY ENVIRONMENTAL OPPORTUNITIES The construction sector is working withEPA to improve the industry’s performance by:
❒ Managing and minimizing waste;❒ Encouraging green construction;❒ Improving water quality;❒ Reducing air emissions; and❒ Promoting environmental management systems.
Sector At-a-GlanceNumber of Companies: 700,000*
Value of Construction: $850 Billion**
Number of Employees: 6.5 Million*
*Source: U.S. Census Bureau, 20011
**Source: U.S. Census Bureau, 20022
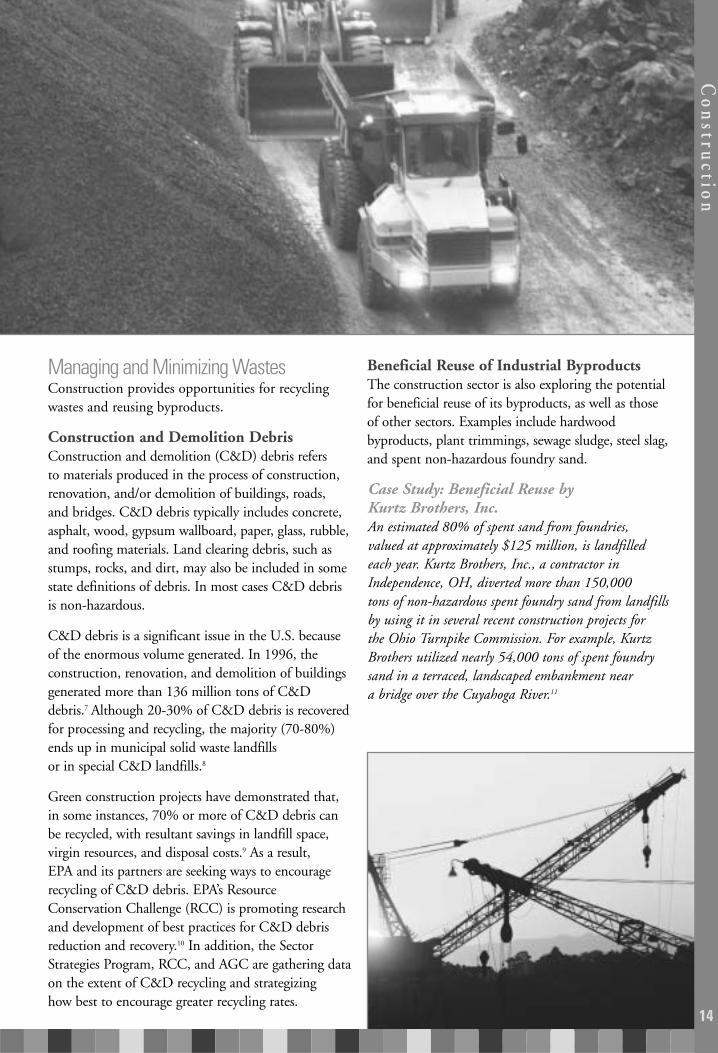
Managing and Minimizing Wastes Construction provides opportunities for recyclingwastes and reusing byproducts.
Construction and Demolition DebrisConstruction and demolition (C&D) debris refers to materials produced in the process of construction,renovation, and/or demolition of buildings, roads, and bridges. C&D debris typically includes concrete,asphalt, wood, gypsum wallboard, paper, glass, rubble,and roofing materials. Land clearing debris, such asstumps, rocks, and dirt, may also be included in somestate definitions of debris. In most cases C&D debrisis non-hazardous.
C&D debris is a significant issue in the U.S. becauseof the enormous volume generated. In 1996, the construction, renovation, and demolition of buildingsgenerated more than 136 million tons of C&Ddebris.7 Although 20-30% of C&D debris is recoveredfor processing and recycling, the majority (70-80%)ends up in municipal solid waste landfills or in special C&D landfills.8
Green construction projects have demonstrated that,in some instances, 70% or more of C&D debris canbe recycled, with resultant savings in landfill space,virgin resources, and disposal costs.9 As a result, EPA and its partners are seeking ways to encouragerecycling of C&D debris. EPA’s ResourceConservation Challenge (RCC) is promoting research and development of best practices for C&D debrisreduction and recovery.10 In addition, the SectorStrategies Program, RCC, and AGC are gathering data on the extent of C&D recycling and strategizing how best to encourage greater recycling rates.
Beneficial Reuse of Industrial ByproductsThe construction sector is also exploring the potentialfor beneficial reuse of its byproducts, as well as thoseof other sectors. Examples include hardwood byproducts, plant trimmings, sewage sludge, steel slag,and spent non-hazardous foundry sand.
Case Study: Beneficial Reuse by Kurtz Brothers, Inc.An estimated 80% of spent sand from foundries, valued at approximately $125 million, is landfilledeach year. Kurtz Brothers, Inc., a contractor inIndependence, OH, diverted more than 150,000 tons of non-hazardous spent foundry sand from landfills by using it in several recent construction projects for the Ohio Turnpike Commission. For example, KurtzBrothers utilized nearly 54,000 tons of spent foundrysand in a terraced, landscaped embankment near a bridge over the Cuyahoga River.11
Con
struction
14

C o n s t r u c t i o n
Encouraging Green Construction In the U.S., residential and commercial buildingsaccount for:
■ ■ ■ ■ 36% of total energy use;
■ ■ ■ ■ 65% of electricity consumption;
■ ■ ■ ■ 30% of greenhouse gas emissions; and
■ ■ ■ ■ 12% of potable water consumption.12
Buildings built to “green” standards use naturalresources like energy, water, materials, and land muchmore efficiently than conventional buildings. As wellas being environmentally preferable, green buildingscan also be cost-efficient. A recent study found thatsome investments in green buildings have paid forthemselves 10 times over through reduced operations,maintenance, and utility costs.13
The Leadership in Energy & Environmental Design®
(LEED) Green Building Rating System is a nationallyaccepted standard for green buildings. In order to be LEED® certified, a building project must demonstrate performance in five areas: sustainablesites, water efficiency, energy and atmosphere, materials and resources, and indoor environmentalquality.14 Many federal agencies and private customersnow require all new construction or major renovationsto meet LEED® requirements.
Green construction practices, such as using recycledmaterials, recycling C&D debris, and preventingstormwater pollution, are essential elements in greenbuilding design. EPA and AGC are working togetherto make a variety of green construction resourcesavailable to the sector through the Web. The EPA-sponsored Construction Industry ComplianceAssistance Center provides an overview of green buildings and will soon include links to state and localgreen building programs.15 AGC’s EnvironmentalServices Web page also offers resources, including the“Green Construction Bible” and a tutorial about theLEED® rating system.16
Case Study: Green Construction of EPA BuildingsEPA recently completed the construction of two greenbuildings – the New England Regional Laboratory(NERL) in Chelmsford, MA, and the NationalComputer Center (NCC) in Research Triangle Park, NC.
During the construction of NERL, Erland ConstructionInc., of Burlington, MA, diverted an estimated 200tons of materials from a landfill, including approximately 250,000 pounds of fly ash and almost8,000 yards of blasted ledge, which were processed on-site and then used in the building, the road’s subgrade, and a retaining wall.17
During planning and construction of NCC, SkanskaUSA Building, Inc.:■ Oriented the building to reduce heating and
cooling loads;■ Designed landscaping to reduce heat islands; ■ Consolidated parking areas to minimize site
disturbance;■ Utilized building products made from recycled
content; and■ Shipped many materials back to their original
manufacturers or to recycling facilities, rather than to a landfill.18
Improving Water Quality Stormwater runoff from construction activities canhave a significant impact on water quality. EPA regulations require operators of construction sitesone acre or larger to obtain authorization to discharge stormwater under a National PollutantDischarge Elimination System constructionstormwater permit. Such permits typically includebest management practices (BMPs) to reduce erosionand sediment runoff. Examples of BMPs include:
■ ■ ■ ■ Installing silt fencing;
■ ■ ■ ■ Providing vegetative buffers along waterbodies;
■ ■ ■ ■ Covering or seeding all dirt stockpiles; and
■ ■ ■ ■ Protecting storm drain inlets to filter out trash and debris.

Con
struction
Reducing Air EmissionsMany construction vehicles and equipment, such as earth moving equipment, generators and compressors, are powered by diesel engines. Exhaustfrom diesel engines contains particulate matter (PM),nitrogen oxides (NOX), and toxic air pollutants.Together, construction and mining equipmentaccount for 46% of total nonroad diesel emissions.19
On a national basis, the strategy for controlling airpollution from diesel engines involves low-pollutionrequirements for new diesel engines and rules covering the fuel used by these engines. Dieselengines on existing equipment will not be subject to the new regulations, yet may remain in operationfor another 25 to 30 years. Therefore, EPA and itspartners are encouraging firms to retrofit existingdiesel vehicles with pollution controls through theVoluntary Diesel Retrofit Program. This programseeks immediate emission reductions by promotinginnovative retrofit technologies, idle reduction,cleaner fuels, and cleaner engines.20
Case Study: Diesel Retrofit Partnership To achieve statewide reductions in NOX and PM, the California Air Resources Board established a $68million fund to assist contractors in re-powering theirheavy-duty diesel equipment with new engines capableof meeting more stringent NOX and PM standards. In 2001, AGC of California teamed up withCalifornia Caterpillar Dealers to organize a seven-yearproject called “Re-powering for Tomorrow” to utilizestate funds to re-power equipment. Over the course ofthe project, participants expect to reduce annual NOX
emissions by 1,200 tons and annual PM emissions by 90 tons.21
Promoting Environmental Management Systems Interest in environmental management systems(EMS) is increasing rapidly within the constructionsector. To date, three individual construction companies have been accepted into EPA's NationalEnvironmental Performance Track. In addition,AGC is a Performance Track Network Partner committed to encouraging top environmental performance through EMS.22
To increase EMS adoption by its members, AGC is currently developing an EMS ImplementationGuide for the construction industry. Once the Guideis complete, the Sector Strategies Program will partner with AGC to train contractors across thecountry in EMS.
Many construction companies see EMS as a valuable tool for performance improvement.
Case Study: EMS at Skanska USA BuildingIn 1998, Skanska USA Building, Inc., made a company-wide commitment to implement an ISO14001-compliant EMS. Through its EMS, Skanska:■ Increased recycling and reuse of construction
materials, for a savings of close to $1 million;■ Diverted 980 tons of debris from landfills
(all from one construction site);■ Minimized soil erosion on all of its construction
sites; and■ Reduced air emissions through 220,000 automobile
miles avoided in one year by encouraging employees to carpool and ride mass transit.23
16

F o r e s t P r o d u c t s
Profile The forest products2 sector includes companies that grow, harvest, or process wood and woodfiber for use in products. While the industry has operations in all 50 states, it is concentrated in the southeast and Great Lakes regions of thecountry.3
The forest products sector can be divided into two segments: one manufactures pulp, paper, and paperboard products; and the second produces engineered and traditional woodproducts. In recent years, decreases in demand from U.S. customers and increased foreigncompetition have negatively impacted the pulp and paper segment. Losses in the woodproducts segment have been minimized by the continued boom in the home building and improvement sector. Additional factors, such as improved efficiencies of new equipmentand over-capacity in the market, have resulted in the closure of 100 paper mills and 125wood products facilities and the elimination of more than 127,000 jobs since 1997.4
PRODUCTION PROCESS Forest products are manufactured through a variety of processes:
■ ■ ■ ■ To produce paper and paperboard products, wood material is digested or cooked down to make pulp, then the fibers are separated from impurities, bleached (if necessary), dewatered, pressed, and rolled.
■ ■ ■ ■ To produce lumber, logs are debarked and cut first into “cants”, then cut into specific lengths of sawn lumber, dried, and coated with surface protection.
■ ■ ■ ■ To produce veneer or plywood, logs are peeled or sliced into thin strips, dried, layered and glued to form panels, then pressed into boards.
■ ■ ■ ■ To produce reconstituted wood products (such as medium density fiberboard), raw wood is shredded or ground, mixed with adhesive, then pressed into boards.
PARTNERSHIP The American Forest & Paper Association (AF&PA) has formed a partnership with EPA’s Sector Strategies Program to improve the environmental performance of the forest products industry. AF&PA's more than 200 members manufacture more than 88% of the printing and writing paper and 60% of the structural wood products produced in the U.S.5
KEY ENVIRONMENTAL OPPORTUNITIES The forest products sector is working withEPA to improve the industry’s performance by:
❒ Increasing energy efficiency;❒ Reducing air emissions;❒ Managing and minimizing waste;❒ Conserving water; ❒ Improving water quality;❒ Encouraging sustainable forestry; and❒ Promoting environmental management systems.
Sector At-a-GlanceNumber of Facilities: 15,000
Value of Shipments: $210 Billion
Number of Employees: 850,000Source: U.S. Census Bureau, 20011

Increasing Energy EfficiencyGiven the energy intensive nature of its manufacturingprocesses, reducing energy consumption is an important environmental focus for the forest productssector. In 1998, the industry consumed more than3,200 trillion Btus of energy, making it the thirdlargest industrial consumer of energy among U.S.manufacturing sectors. Within the sector, the pulpand paper segment accounts for 85% of the energyuse, while the wood products segment accounts for 15%.6
To minimize the environmental impact of its energyconsumption, the forest products sector is investing in a variety of generation technologies and alternativefuels, including:
■ ■ ■ ■ Cogeneration;
■ ■ ■ ■ Biomass fuel; and
■ ■ ■ ■ Black liquor gasification.
CogenerationThe forest products sector has emerged as a leader in the utilization of cogeneration, a highly efficientprocess that produces electricity and heat from a single fuel source. Within the forest products sector,88% of the electricity generated at pulp and papermills and 99% of the electricity generated at woodproducts facilities is produced through cogeneration.7
Biomass FuelThe forest products industry is unique in its ability touse byproducts generated in the manufacture of pulp,paper, lumber, and other wood products as a biomassfuel source. Biomass fuel includes materials such as“hogged fuel”, which comprises logging and woodprocessing byproducts, and “spent pulping liquor”,which comprises extracts from the pulping process. In2000, these renewable energy sources comprised 56%of energy consumed at pulp and paper mills and 63%of energy consumed at wood products facilities.8
Black Liquor GasificationTo further reduce its use of fossil fuels, the forestproducts industry is partnering with the U.S.Department of Energy (DOE) to develop an energygenerating process called “black liquor gasification”.Gasification will convert spent pulping liquors andother biomass into combustible gases that can beburned efficiently like natural gas.
Although expensive to develop, biomass gasificationtechnologies have the potential to satisfy the energyneeds of the forest products industry and to generate asurplus of almost 22 gigawatts of power per year thatcould be sent to the electric power grid. In addition,black liquor gasification will reduce emissions of airpollutants, such as nitrogen oxides, sulfur dioxide, andparticulate matter. The first state-of-the-art biomassgasifier is now being built by Georgia-Pacific in BigIsland, VA.9
Forest Prod
ucts
18

F o r e s t P r o d u c t s
Reducing Air Emissions The forest products sector is working to reduce emissions of nitrogen oxides (NOX), sulfur dioxide(SO2), and greenhouse gases (GHG).
Nitrogen Oxide and Sulfur Dioxide EmissionsBetween 1995 and 2000, emissions of NOX per tonof production in the forest products sector decreasedby 10%, and emissions of SO2 per ton of productiondecreased by 7%.10 The following factors contributedto SO2 reductions: increased use of lower sulfur content coal, increased use of flue gas desulfurizationsystems, and the retirement of chemical recovery furnaces with direct contact evaporators.
Greenhouse Gas EmissionsIn 2003, AF&PA joined Climate VISION, a voluntary program administered by DOE to reduceU.S. greenhouse gas intensity (the ratio of emissionsto economic output).11
In order to reduce GHG emissions, AF&PA members are undertaking a series of programs,including carbon sequestration in forests and products, and the development of technologies toincrease use of renewable biomass fuels. Based onpreliminary calculations, AF&PA expects that theseprograms will reduce the sector's greenhouse gasintensity by 12% by 2012 relative to 2000 levels.12
Other voluntary efforts are also underway to reduceGHG emissions by forest products companies.
Case Study: Chicago Climate Exchange®
Launched in December 2003, the Chicago ClimateExchange® (CCX) is the world's first multi-nationaland multi-sector marketplace for reducing and tradinggreenhouse gas emissions. It represents the first voluntary commitment by a cross-section of North American corporations, municipalities, and other institutions to establish a rules-based market for reducing GHGemissions.
Four companies in the forest products sector have voluntarily joined CCX® and committed to reducingtheir GHG emissions by 4% below the average of their1998-2001 baseline by 2006. These companies are:International Paper, MeadWestvaco Corp., Stora EnsoNorth America, and Temple-Inland, Inc.13
Nitrogen Oxides & Sulfur Dioxide Emissions from Pulp & Paper Mills
0
2
4
6
8
10
12
Sulfur Dioxide
Poun
ds p
er to
n of
pro
duct
ion
1995 2000Source: AF&PA's EH&S Verification Program
Nitrogen Oxides

Forest Prod
ucts
Managing and Minimizing Waste The forest products sector is reducing waste byreusing non-hazardous industrial wastes from theproduction process and by promoting recycling of paper products so that mills can use greater percentages of recycled fibers.
Reduction in Environmental ReleasesForest products facilities use a variety of chemicalsand report on the release and management of manyof those materials through EPA’s Toxics ReleaseInventory (TRI). Over the past decade, the sectorhas made progress in reducing wastes. Between 1993 and 2001, normalized TRI releases by forestproducts facilities decreased by 28%.14
Beneficial Reuse of WasteThe majority of the forest products sector's wastesconsist of non-hazardous wastewaters and sludgesfrom pulp and paper mills. These wastes includewastewater treatment sludges, lime mud and slakergrits, boiler and furnace ash, scrubber sludges, andwood processing residuals. In 2000, more than 40%of this waste was reused rather than being burned,lagooned, or sent to a landfill. Waste from woodproducts mills includes waste wood particles andadhesive residues, the majority of which (90%) is beneficially reused.15
Recycled Paper ProductsAF&PA members are making efforts to increase therecycling of paper products. Their goal is to recover55% of the paper consumed annually in the U.S. by2012. AF&PA estimates that 48% of all paper wasrecovered for recycling in 2002. For some grades,such as corrugated boxes and newspapers, the recovery rate is over 70%.16
One hundred percent of recovered paper is utilized,and recovered fiber now accounts for more than one-third of the industry’s domestic raw materialsupply.17
20
TRI Releasesby the Forest Products Sector
1993 1994 1995 1996 1997 1998 1999 2000 2001Year
Poun
ds (m
illio
ns)*
*Normalized by annual value of shipments Sources: U.S. EPA, Toxics Release Inventory (TRI) U.S. Census Bureau, Annual Survey of Manufactures
0
50
100
150
200
250

F o r e s t P r o d u c t s
Conserving Water The forest products sector is the third largest industrial consumer of water among U.S. manufacturing industries. The pulp and paper segment of the industry accounts for most of thiswater use. Between 1995 and 2000, the volume of water discharged per ton of production, an indicator of water used, decreased by 1.6% in the pulp and paper industry.18
Improving Water QualityDue to the large volumes of water used in pulp andpaper processes, virtually all U.S. mills have primaryand secondary wastewater treatment systems toremove various pollutants from manufacturingprocess wastewater. Pulp and paper mills measure the total volume of water discharged as well as the quality of the water they discharge to publicwastewater treatment facilities or into receiving waters.
Key water quality indicators include:
■ ■ ■ ■ Biochemical oxygen demand (BOD);
■ ■ ■ ■ Total suspended solids (TSS); and
■ ■ ■ ■ Adsorbable organic halides (AOX).
BOD and TSS reduce the amount of oxygen available to fish and other aquatic organisms.Between 1995 and 2000, BOD discharges remainedsteady, and TSS discharges decreased by 15%.
In compliance with EPA’s Pulp and Paper ClusterRule, which requires the reduction of toxic pollutants released to water and air, the industry hassubstituted chlorine dioxide for elemental chlorine asa bleaching agent, virtually eliminating dioxin fromits wastewater. This substitution has also resulted in a 37% reduction of AOX, which is an indicator ofchlorinated organic substances, between 1995 and2000.19
Wastewater Discharges from Pulp & Paper Mills
Poun
ds p
er to
n of
pro
duct
ion
1995 2000Source: AF&PA's EH&S Verification Program
0
1
2
3
4
5
Biochemical OxygenDemand
Total SuspendedSolids
Adsorbable OrganicHalides

Forest Prod
ucts
22
Encouraging Sustainable ForestryAmerica’s forests cover 747 million acres or 33%of the country. Of this acreage, approximately504 million acres are classified as timberland, meaning each acre of land is capable of growing 20cubic feet of commercial wood per year. The majorityof the timberland (58%) is owned by private, non-industrial owners, while 13% is owned by theforest products industry.20 The remaining timberlandis publicly owned. Increasingly, timberland is beingmanaged using sustainable forestry practices.
Case Study: Sustainable Forestry Initiative®
While there are several sustainable forestry management programs, the Sustainable ForestryInitiative® (SFI) program is the most prominent in North America. More than 90% of industrial timberland in the U.S. is enrolled in the SFI program.
The goal of the program is to promote sustainableforestry practices that will allow businesses to meet market demands while promoting the protection ofwildlife, plants, soil, and air and water quality.Participants certify their land use and harvesting practices to a standard comprised of 6 sustainableforestry principles and 11 operational objectives.
Currently, of the more than 169 million acres enrolledin the SFI program in the U.S. and Canada, almost104 million acres have been independently certified asmeeting SFI program criteria by third-party auditors.In addition, participants in the SFI program havetrained more than 75,000 loggers and foresters in sustainable forestry practices since 1995.21
Promoting Environmental Management SystemsAs of October 2003, 61 forest products facilitiesbelonging to 12 AF&PA member companies hadadopted environmental management systems (EMS)certified to the ISO 14001 standard.22 Eighteen ofthese facilities have applied and been accepted intoEPA's National Environmental Performance Track.23

I r o n & S t e e l
Profile The iron and steel sector2 manufacturesthe steel used in the production of a wide range of products, ranging from food storage containers, todefense applications, to ship hulls. In 2003, Indiana mills produced about 20% ofdomestic steel, with Ohio, Illinois, Michigan, and Pennsylvania leading the rest of themany other states in which steel is made.3
Advances in technology, changes in markets, and global competition have led to many changes in the iron and steel sector. More than 30 steel companies have declared bankruptcy since 1998.4 The sector’s workforce fell from nearly 170,000 in 1997 toapproximately 140,000 in 2004.5
PRODUCTION PROCESS To produce steel, facilities use one of two processes, which utilize different raw materials and technologies.
■ ■ ■ ■ “Integrated” steel mills use a blast furnace to produce iron from iron ore, coke, and fluxing agents. A basic oxygen furnace (BOF) is then used to convert the molten iron, along with up to 30% steel scrap, into refined steel.
■ ■ ■ ■ “Minimills” use an electric arc furnace (EAF) to melt steel scrap and limited amounts of other iron-bearing materials to produce new steel.
The scrap metal used in steel production originates from sources such as scrapped automobiles, demolished buildings, discarded home appliances, and manufacturingreturns. Finishing processes, such as rolling mills, are similar at both types of mills.
PARTNERSHIPS The American Iron and Steel Institute (AISI) and the SteelManufacturers Association (SMA) have formed a partnership with EPA’s SectorStrategies Program to improve the environmental performance of the iron and steelindustry. Together AISI and SMA represent the majority of U.S. steel companies.6
KEY ENVIRONMENTAL OPPORTUNITIES The iron and steel sector is working withEPA to improve the industry’s performance by:
❒ Managing and minimizing waste;❒ Reducing air emissions;❒ Increasing energy efficiency; and ❒ Promoting environmental management systems.
Sector At-a-GlanceNumber of Facilities: 95
Value of Shipments: $51 Billion
Number of Employees: 140,000Source: American Iron & Steel Institute, 20041

Managing and Minimizing Waste Two-thirds of U.S. steel is now produced from scrap,making steel America’s most recycled material.7 In fact,all new steel contains at least 25% recycled steel.8
However, steelmaking still presents a variety of opportunities to remove undesirable materials from the recycling stream, increase reuse of co-products andbyproducts, and reduce releases to the environment.
Automotive Scrap Metal Recycling Obsolete automobiles are an important source of scrap metal. In 2001, the steel industry consumed the steel from 14.5 million recycled automobiles, in turn generating enough steel to produce more than 15 million new automobiles.9
One pressing problem in the use of scrap from automobiles is the potential presence of mercury.Automakers have used mercury in various applications, but the most prevalent use was in hoodand trunk convenience light switches in domesticautomobiles. Automakers phased out the use of mercury in convenience switches in 2002, but millions of older vehicles that will be recycled in the next few years contain up to a gram of mercuryper car in the switches. Currently, few automotive dismantlers remove these switches before the vehiclesare flattened or shredded, so the mercury is carriedinto the recycling stream.
EPA, steelmakers, and other stakeholders are workingto limit or prevent potential emissions of mercuryfrom convenience switches and to reduce the use oftoxic materials in new products. To this end, AISI andSMA participate in a coalition with dismantlers,shredder operators, and environmental groups, knownas the Partnership for Mercury Free Vehicles.10 Thepartnership is pursuing policy solutions, such as statelegislation, to bring about the recovery of existingmercury applications and to limit future uses of mercury in vehicles. EPA is working with these andother stakeholders, including state agencies, to explorepotential voluntary and regulatory solutions.
Beneficial Reuse of Slag Through the Sector Strategies Program, steelmakersand EPA hope to increase the beneficial reuse of materials generated during steel production. Forexample, iron or blast furnace slag, which is formed at integrated mills when iron ore, fluxing agents, coke, and other compounds combine, can be reusedfor construction and agricultural applications, such as road building aggregate, cement, or soil remineralization. In 2003, approximately 19 milliontons of domestic iron and steel slag, valued at approximately $300 million, were consumed off-site.11
Iron &
Steel
24

I r o n & S t e e l
Environmental ReleasesIron and steel facilities use a variety of chemicals andreport on the release and management of many of thosematerials through EPA’s Toxics Release Inventory(TRI). Between 1993 and 2001, normalized TRIreleases by iron and steel facilities increased steadily, as new or upgraded air pollution control equipment generated additional pollution control residues for disposal. Recycling remained the predominant wastemanagement method used in the sector, although energy recovery increased during this time period.12
Reducing Air EmissionsSteelmaking generates a variety of air emissions,including both hazardous air pollutant (HAP) and greenhouse gas (GHG) emissions.
Hazardous Air Pollutant EmissionsDepending upon their operations, common HAPsfrom iron and steel facilities include hydrochloric acid,manganese compounds, phenol, naphthalene, andbenzene. Between 1993 and 2001, total normalizedreleases of HAPs, as reported to TRI, declined by 71%in the sector.13 Much of this decrease is due to theinstallation of pollution control equipment to meetnew air requirements, such as the Clean Air Act’s NewSource Performance Standards.
The operation of new or upgraded air pollution control equipment at steel mills often results in thegeneration of additional pollution control residues,such as EAF dust and filter cakes, whose disposal must be reported to TRI as a release. Therefore, TRIreleases from the iron and steel sector rose between1993 and 2001, while TRI-reportable air emissionsdeclined.14
Depending on economics and other factors, EAF dustcan be processed to recover zinc and other materials.When zinc prices are low, however, EAF dust is morelikely to be disposed and reported as a TRI release.
TRI Releases and Waste Managed by the Iron & Steel Sector
ReleasedOn/Offsite
TreatedOn/Offsite
Energy RecoveryOn/Offsite
RecycledOn/Offsite
Poun
ds (m
illio
ns)*
1993 2001*Normalized by annual production Sources: U.S. EPA, Toxics Release Inventory (TRI) U.S. Geological Survey, Mineral Commodity Summaries
0
100
200
300
400
500
TRI Air Toxics+ Releasesby the Iron & Steel Sector
1993 1994 1995 1996 1997 1998 1999 2000 2001Year
Poun
ds (m
illio
ns)*
+Includes the Clean Air Act hazardous air pollutants that are reported to TRI *Normalized by annual production Sources: U.S. EPA, Toxics Release Inventory (TRI) U.S. Geological Survey, Mineral Commodity Summaries
0
1
2
3
4
5
6
7
8
TRI Releases by the Iron & Steel Sector
1993 1994 1995 1996 1997 1998 1999 2000 2001Year
Poun
ds (m
illio
ns)*
*Normalized by annual production Sources: U.S. EPA, Toxics Release Inventory (TRI) U.S. Geological Survey, Mineral Commodity Summaries
0
50
100
150
200
250
300

Iron &
Steel
Greenhouse Gas EmissionsSteelmaking generates GHG emissions both directlyand indirectly.
■ ■ ■ ■ Integrated mills produce carbon dioxide (CO2), a GHG, when transforming coke andiron ore into iron.
■ ■ ■ ■ Both minimills and integrated mills consume significant amounts of electricity, the generation of which results in GHG emissions.
In 2003, AISI joined Climate VISION, a voluntaryprogram administered by the U.S. Department ofEnergy (DOE) to reduce U.S. GHG intensity (theratio of emissions to economic output).15 To helpachieve this goal, the industry is researching alternativemeans of production at integrated mills that wouldnot generate CO2, seeking to reduce or capture GHGemissions from current production methods, andexploring ways to increase energy efficiency.16
Increasing Energy EfficiencyThe iron and steel industry, which relies heavily on coal and natural gas for fuel, is one of the largest energyconsumers in the manufacturing sector. In 1998, theindustry used approximately 1.6 quadrillion Btus ofenergy, representing approximately 7% of all U.S. manufacturing use and 2% of overall domestic use.17
In a just-completed report to DOE, the industryreported achieving a 17% reduction in energy intensityper ton of steel shipped since 1990. Because of the closerelationship between energy use and GHG emissions,the industry’s aggregate CO2 emissions per ton of steelshipped were reduced by a comparable amount duringthis same period.18
As part of their Climate VISION commitment, theindustry has commited to increasing its energy efficiency by 10% by 2012 (from 2002 levels).19
Case Study: Energy Efficiency at North Star SteelWith help from DOE, North Star Steel conducted an assessment of its Wilton, IA, minimill to identifyplant-level opportunities to increase energy efficiency and, in turn, reduce GHG emissions. In 2003-2004, the minimill completed two projects identified during the assessment. By installing carbon and oxygen injectionin the EAF, as well as low-NOX burners and Level 2 controls on its billet reheat furnace, the mill saved more than 58 billion Btus of electricity and natural gas, for a reduction of more than 4 million pounds ofCO2 equivalents. These and other projects will contributeto the goal of North Star’s parent company, Cargill, Inc.,to reduce energy use by 10% by the year 2005.20
Case Study: Landfill Methane Outreach ProgramJersey Shore Steel, in Jersey Shore, PA, and the ClintonCounty Landfill, both members of EPA’s LandfillMethane Outreach Program, developed a methane gasreclamation project to use landfill emissions for energy at the rolling mill. Jersey Shore uses gas piped from thelandfill to power its reheat furnace, saving 15% in energycosts and reducing GHG emissions by 71,000 tons ofCO2 equivalents per year.21
Promoting Environmental Management SystemsMost of the 20 integrated mills, and more than one third of the 75 minimills that produce carbon steel, have implemented environmental managementsystems (EMS).22 To date, three iron and steel facilitieshave been accepted into EPA’s National EnvironmentalPerformance Track. In addition, SMA is a PerformanceTrack Network Partner committed to encouraging topenvironmental performance through EMS.23 Throughthe Sector Strategies Program, EPA and its partnershope to increase the number of facilities with EMS.
Case Study: EMS at Nucor SteelThrough its EMS, Nucor Steel’s Auburn, NY, minimillcommitted to use scrap tires as a substitute for coal insteelmaking, utilizing the tires’ carbon, energy, and steel.Nucor consumed more than 600,000 tires in the first 18months of the program, avoiding the use of 4,000 tons of coal.24 26

M e t a l C a s t i n g
Profile The metal casting sector2 encompassesboth foundries and die casting facilities. Metal casters are primarily small businesses that produce a wide range ofgoods, ranging from engine blocks and cylinder heads to jewelry and plumbing fixtures.
Metal casting facilities are located across the country, but most are concentrated in theGreat Lakes states, Alabama, California, and Texas.3
PRODUCTION PROCESS The metal casting process involves pouring molten metalinto molds, allowing it to cool, then removing the resultant casting. Die casters andfoundries utilize different casting processes.
■ ■ ■ ■ Die casters produce non-ferrous (primarily aluminum) castings under high pressure in permanent metal molds.
■ ■ ■ ■ Foundries cast both ferrous and non-ferrous metals, using primarily disposable molds made of sand, wax, foam, or other materials. Foundries (but not die casters) must break apart their molds in order to remove the castings.
All metal castings require some degree of finishing to remove excess metal as well as dirt,grease, oil, oxides, and rust.
PARTNERSHIPS The North American Die Casting Association (NADCA) and theAmerican Foundry Society (AFS) have formed a partnership with EPA’s Sector StrategiesProgram to improve the environmental performance of the metal casting industry.NADCA’s membership includes corporate and individual members from more than 950 companies from the die casting industry.4 AFS represents nearly 10,000 members of thedie casting and foundry industries.5
KEY ENVIRONMENTAL OPPORTUNITIES The metal casting sector is working withEPA to improve the industry’s performance by:
❒ Increasing energy efficiency;❒ Managing and minimizing waste;❒ Conserving water;❒ Reducing air emissions; and ❒ Promoting environmental management systems.
Sector At-a-GlanceNumber of Facilities: 2,800
Value of Shipments: $28 Billion
Number of Employees: 210,000Source: U.S. Census Bureau, 20011

Increasing Energy EfficiencyGiven the energy-intensive nature of its manufacturingprocesses, reducing energy consumption is an important environmental focus for the metal castingsector. The most energy-intensive process in metal casting is the melting of metal, which accounts forapproximately 55% of total energy costs.6 Other energy-intensive processes include core making, moldmaking, heat treatment, and post-casting activities.Voluntary efforts are underway in the sector to reducethe energy requirements of these key processes.
Case Study: Industries of the FutureThe U.S. Department of Energy’s (DOE) Industries of the Future (IOF) program creates government-industrypartnerships to accelerate technology research, development, and deployment in nine energy-intensiveindustries, including metal casting.7
Industry participation in the program is managed by the Cast Metals Coalition (CMC), which was founded by several trade organizations, including AFSand NADCA.8 CMC has set measurable goals for 2020,including using 20% less energy to produce castings, compared to the sector’s 1998 energy requirements of 320 trillion Btus.9
Some of the ways that CMC and IOF are moving towardmeeting this goal include:■ Encouraging the development of new technologies like
the “lost foam” casting process, which could improve energy efficiency by as much as 27%;
■ Increasing research on aluminum die casting alloys to reduce the weight of automotive castings, for a potential energy savings of almost 2 trillion Btus per year; and
■ Developing software to optimize furnace controls to reduce coke/coal use by as much as 5%, for a potential energy savings of 400 million Btus per year per unit by the year 2020.10
CMC and IOF have also set industry performance targetsto develop environmental technologies to achieve 100%pre- and post-consumer recycling; 75% beneficial reuse of foundry byproducts, such as foundry sand; and thecomplete elimination of all waste streams.11
Metal C
asting
28

M e t a l C a s t i n g
Managing and Minimizing WasteThe metal casting sector is working to reduce releasesto the environment and increase the reuse of industrialbyproducts like foundry sand.
Reduction in Environmental Releases Metal casters use a variety of chemicals and report on the release and management of many of thosematerials through EPA’s Toxics Release Inventory(TRI). Over the past decade, the sector has madeprogress in reducing wastes. Between 1993 and 2001,normalized TRI releases by metal casting facilitiesdecreased by 11%. These reductions can be attributedto an 18% decrease in releases from the ferrous segment of the industry, which accounts for most ofthe sector’s releases. During this time period, most ofthe sector’s waste was managed through recycling.12
Beneficial Reuse of Foundry SandFoundries that use sand molds utilize vibrating gridsand/or conveyors to shake the mold from the casting.These foundries then reprocess the sand to removelumps, metal, impurities, and fine particles. Althoughfoundries can recondition and reuse sand many times, the sand eventually loses the desired physicalcharacteristics and must be sent for reuse elsewhere or disposed of in a landfill. Markets exist for the reuse of spent foundry sand, but many states restrictits use in construction applications such as roadbeds,even when the sand is non-hazardous.
In 1998, state foundry associations, AFS, and industrysuppliers formed Foundry Industry Recycling StartsToday (FIRST) to develop options for the recyclingand beneficial reuse of foundry sands.13 One ofFIRST’s goals is to quantify reuse rates and set reusegoals in key states. Currently, only the state ofWisconsin requires reporting on the use and disposalof spent foundry sands. Based upon data collectedfrom both generators and landfills, the WisconsinDepartment of Natural Resources estimates thatapproximately 68% of the spent foundry sand generated in that state is beneficially reused.14
To encourage beneficial reuse, EPA released a reviewof state practices and regulations regarding foundrysand in 2002 as a resource for the industry and forstates wishing to share best practices.15
Case Study: Beneficial Reuse by Resource Recovery CorporationA Michigan cooperative, Resource Recovery Corporation(RRC), receives third-party foundry sands from manyfoundries, identifies beneficial reuse opportunities, andthen provides a consistent supply of material to end users,such as a local asphalt company. RRC estimates that in2002 its activities reused more than 41,000 tons of recyclable materials (including sand and metals) thatwould otherwise have been diverted to landfills. Since1997, more than 210,000 tons of sand and 3,600 tonsof metal have been reused through RRC.16
TRI Releasesby the Metal Casting Sector
1993 1994 1995 1996 1997 1998 1999 2000 2001Year
Poun
ds (m
illio
ns)*
* Normalized by annual shipments Sources: U.S. EPA, Toxics Release Inventory (TRI) AFS, Metal Casting Forecast & Trends Stratecasts, Inc., Demand & Supply Forecast
0
10
20
30
40
50
60
Ferrous Metal CastingNon-Ferrous Metal Casting
TRI Releases and Waste Managedby the Metal Casting Sector
ReleasedOn/Offsite
TreatedOn/Offsite
Energy RecoveryOn/Offsite
RecycledOn/Offsite
Poun
ds (m
illio
ns)*
1993 2001* Normalized by annual shipments Sources: U.S. EPA, Toxics Release Inventory (TRI) AFS, Metal Casting Forecast & Trends Stratecasts, Inc., Demand & Supply Forecast
0
20
40
60
80
100
120
140
160

Metal C
asting
30
Conserving Water In order to conserve water, the metal casting sector is exploring technologies for recovering and re-circulating the wastewater used to lubricate andcool dies during the die casting process.
Case Study: Re-circulating Wastewater at Kennedy Die Casting, Inc.Kennedy Die Casting in Worcester, MA, installed a wax and water-based lubrication system for its die castmachines, replacing one that was solvent-based. The new system re-circulates wastewater and reduces waterdischarges. Prior to the changes, Kennedy Die Castingused 7 to 8 thousand gallons of water per day. CurrentlyKennedy Die Casting uses 400 gallons per day.17
Reducing Air EmissionsThe metal casting sector is working to reduce emissions of hazardous air pollutants (HAP), including organic air pollutants and metals. Theorganic air pollutants are primarily generated whilemaking the core portions of the molds, shaking themold away from the casting, and pouring the moltenmetal, while the metals are primarily generated during melting, pouring, and finishing processes.
Between 1993 and 2001, the normalized quantity of HAP releases, as reported to TRI, declined by53% in the ferrous segment of the industry and by60% in the non-ferrous segment.18
Promoting Environmental Management SystemsMore than 50% of metal casting products are used by the automotive and transportation indus-tries. Many automotive companies now require that their direct suppliers maintain environmentalmanagement systems (EMS) that are compliant withthe ISO 14001 standard. To meet these supply chaindemands, trade associations within the metal castingsector have taken an active role in encouraging thedevelopment of EMS by members.
Together with AFS, NADCA, the Indiana CastMetals Association, and the Indiana Department ofEnvironmental Management, the Sector StrategiesProgram has developed EMS tools for die casters andfoundries, including customized EMS ImplementationGuides and a brochure highlighting the financialbenefits of EMS.19 In addition, NADCA is aPerformance Track Network Partner committed to encouraging top environmental performancethrough EMS.20
Many metal casters are finding that EMS can be an effective tool for performance improvement.
Case Study: EMS at Chicago White Metal Casting, Inc.Chicago White Metal (CWM) in Bensenville, IL,implemented an EMS over five years ago. CWM is thefirst metal casting facility to be accepted into EPA’sNational Environmental Performance Track.21 Throughits EMS, CWM has:■ Recycled an additional 4,000 pounds of plastic stretch
film, 5,600 wood pallets, 177,000 pounds of scrap steel, 81,000 pounds of office paper, and 148,000 pounds of corrugated material;
■ Reduced annual solid waste disposal by 75%; and■ Reduced natural gas usage by at least 45%.22
TRI Air Toxics+ Releasesby the Metal Casting Sector
1993 1994 1995 1996 1997 1998 1999 2000 2001Year
Poun
ds (m
illio
ns)*
+Includes the Clean Air Act hazardous air pollutants that are reported to TRI *Normalized by annual shipments Sources: U.S. EPA, Toxics Release Inventory (TRI) AFS, Metal Casting Forecast & Trends Stratecasts, Inc., Demand & Supply Forecast
Ferrous Metal CastingNon-Ferrous Metal Casting
0
2
4
6
8

M e t a l F i n i s h i n g
Profile The metal finishing sector2 encompasses avariety of surface finishing and electroplating operations.Broadly speaking, metal finishing is the process of coatingan object with one or more layers of metal so as to improve its wear and corrosion resistance, control friction, impart new physical properties or dimensions, and/or alter itsappearance. Applications range from jewelry, to common hardware items and automotiveparts, to communications equipment and aerospace technologies.
Most metal finishing shops are small, independently owned facilities that perform on a contract basis. Other metal finishing operations are a part of larger manufacturing facilities. While the industry is geographically diverse, it is concentrated in highly industrialized areas like California, Texas, and the Great Lakes states.3
Low-cost imports from overseas and other globalization trends have led to changes in this industry. Recent industry estimates indicate job losses in the range of 25-30%between 2000 and 2003, with a corresponding reduction in sales of approximately 40%.4
PRODUCTION PROCESS Most finished objects undergo three stages of processing:
■ ■ ■ ■ Surface preparation and cleaning;
■ ■ ■ ■ Surface treatment through plating, organic coating, or other chemical surface finishing; and
■ ■ ■ ■ Post-treatment activities, such as rinsing and additional surface treatment.
PARTNERSHIPS Four trade associations have formed a partnership with EPA's SectorStrategies Program to improve the environmental performance of the metal finishing sector. These organizations include:
■ ■ ■ ■ American Electroplaters and Surface Finishers (AESF);
■ ■ ■ ■ Metal Finishing Suppliers’ Association (MFSA);
■ ■ ■ ■ National Association of Metal Finishers (NAMF); and
■ ■ ■ ■ Surface Finishing Industry Council (SFIC).5
Current collaboration with the metal finishing industry builds upon the success of pastpartnerships, particularly the Strategic Goals Program.6
KEY ENVIRONMENTAL OPPORTUNITIES The metal finishing sector is working withEPA to improve the industry’s performance by:
❒ Managing and minimizing waste; ❒ Conserving water; and❒ Promoting environmental management systems.
Sector At-a-GlanceNumber of Facilities: 3,200
Value of Shipments: $5.9 Billion
Number of Employees: 74,000Source: U.S. Census Bureau, 20011

Case Study: Improving Performance through the Strategic Goals ProgramBetween 1998 and 2002, more than 500 metal finishers, 20 states, and 80 local regulatory agencies(primarily publicly owned treatment works) participated with EPA in the Strategic Goals Program.Participating metal finishers pursued facility-specificenvironmental targets for resource inputs and wasteoutputs, including:■ 25% reduction in energy use; ■ 50% reduction in water use;■ 50% reduction in land disposal of
hazardous sludge;■ 50% reduction in emissions of metals to
water; and■ 90% reduction in organic chemical releases
reported to EPA’s Toxics Release Inventory (TRI).
Participating state and local regulatory agencies supported metal finishers in their pursuit of these goals through a strategically defined set of actions,including state recognition programs, targeted assistance,a targeted research and development agenda, and regulatory changes to reduce barriers to metals recoveryand wastewater pretreatment.
An independent third-party, the National Center forManufacturing Sciences, tracked the progress of 150participating metal finishers that consistently reportedtheir environmental progress. Through 2001, cumulative improvements for these facilities included:■ 7% reduction in energy use;■ 38% reduction in water use;■ 23% reduction in land disposal of
hazardous sludge;■ 62% reduction in emissions of metals to
water; and■ 62% reduction in organic chemical releases
reported to TRI.7
All percentages are normalized by dollar value of salesto account for changes in production levels.
Based upon the success of the Strategic Goals Program,EPA and the trade associations are now encouragingbroader use of these five indicators.
Metal F
inish
ing
32

M e t a l F i n i s h i n g
Managing and Minimizing WasteDuring the metal finishing process, some portion of the materials used in production is not totally captured on the finished product and can exit theprocess in wastewater and waste. EPA effluent guidelines require metal finishers to treat their wastewater to remove or reduce pollutants prior to discharge to either a publicly owned treatment worksor a public waterway. To comply, metal finishers addchemicals to the wastewater to remove metals andother constituents. Most metals then settle and aredewatered to form sludge. This sludge, known as F006,is regulated as a hazardous waste under the ResourceConservation and Recovery Act.
EPA’s Toxics Release Inventory (TRI) does not tracksludge releases, but it does track individual chemicalsthat may be constituents of sludge. Although less than20% of the metal finishing sector was subject to TRIreporting requirements in 2001, it is still notable thatfrom 1993 to 2001, the normalized amount of TRIreleases from those shops decreased by 44%. In 2001,releases accounted for only 11% of the sector’s waste,while 88% of metal finishing waste was treated or recycled.8
Improved performance was driven by the use of alternative plating chemistries, as well as by:
■ ■ ■ ■ Increased recovery of metals from the sludge; and
■ ■ ■ ■ Introduction of rinsing techniques that conserve water and reduce the volume of sludge generated.
Metals Recovery through Sludge RecyclingEPA and the industry are working together to increaserecovery of metals from metals-bearing sludge. EPAestimates that 10-20% of plating sludge is sent topermitted hazardous waste recycling facilities,9 whichuse techniques such as ion exchange canisters and electrowinning to recover economically valuable metals from the sludge. Metal recovery reduces landdisturbance, resource depletion, energy consumption,and other environmental impacts that result from themining and processing of virgin metal ore.
Rinsing Techniques to Reduce Sludge Generation In many cases, metal finishers have implemented more effective and efficient rinsing techniques, such as concurrent flow rinsing, which reduce the need totreat and dispose of plating baths. These techniquesresult in less water use, less chemical use, and lesssludge generation. For example, between 1997 and2001, Artistic Plating Company in Anaheim, CA,reduced its sludge volume by 40% by installing flowrestrictors and conductivity sensors.10
0
20
40
60
80
100
120
140
TRI Releases and Waste Managedby the Metal Finishing Sector
ReleasedOn/Offsite
TreatedOn/Offsite
Energy RecoveryOn/Offsite
RecycledOn/Offsite
Poun
ds (m
illio
ns)*
1993 2001*Normalized by annual value of shipments Sources: U.S. EPA, Toxics Release Inventory (TRI) U.S. Census Bureau, Annual Survey of Manufactures
TRI Releases by the Metal Finishing Sector
1993 1994 1995 1996 1997 1998 1999 2000 2001Year
Poun
ds (m
illio
ns)*
*Normalized by annual value of shipments Sources: U.S. EPA, Toxics Release Inventory (TRI) U.S. Census Bureau, Annual Survey of Manufactures
0
5
10
15
20
25

Metal F
inish
ing
34
Conserving Water Water use and sludge generation go hand-in-hand for the metal finishing industry. Reducing water use atmetal finishing facilities can reduce sludge generationand allow wastewater treatment systems to more successfully treat the wastewater.
Case Study: Reducing Water Use at East Side PlatingBy installing two cooling towers and adding sludge dryers, East Side Plating in Portland, OR:■ Reduced water use by 64% (between 1997 and 1999);■ Reduced sludge discharge by 67% (between 1997 and
1999); and■ Reduced permitted copper, nickel, chrome, and zinc
discharges by almost 50% (between 1997 and 2002).11
Promoting Environmental Management Systems Industry leadership has taken an active role in encouraging the development of environmental management systems (EMS) at member facilities. To help promote widespread adoption of EMS, the Sector Strategies Program partnered with themajor metal finishing trade associations to create acustomized EMS Implementation Guide, a brochurehighlighting the financial benefits of EMS, and anEMS training program tailored to the sector.12 Sincethe start of the Strategic Goals Program in 1998, over100 metal finishing job shops, all small businesses,have completed EMS training.13
Many metal finishing customers, including someautomobile manufacturers, are encouraging metal finishers to adopt EMS. This factor is recognized bythe industry leadership and is one of the driversbehind their commitment to industry-wide EMSdevelopment. This factor also has led corporate customers to help drive EMS development by theirmetal finisher suppliers, and by job shops themselvesto take the next step to ISO 14001 certification inorder to maintain a competitive edge.
Case Study: Supply Chain MentoringEPA’s Regional office in New England (EPA Region 1)established a novel approach to environmental stewardship through their Corporate Sponsor Program.The program encourages large equipment manufacturersto offer environmental management or environmental,health, and safety training to metal finishers and othercompanies within their supply chain.14
EPA’s National Environmental Performance Trackawarded special recognition to New Hampshire BallBearings, Inc., (NHBB) in Peterborough, NH, for itsparticipation in the program. NHBB mentors suppliersand offers preferred status to suppliers with EMS.15
In addition, many metal finishers are finding thatEMS can be an effective tool for performanceimprovement.
Case Study: EMS at SWD, Inc.SWD, Inc., in Addison, IL, adopted an EMS in 1997and became the first metal finisher in the U.S. to certifyits EMS to the ISO 14001 standard in 1998. Throughits EMS, SWD:■ Identified the environmental impacts of molybdenum
and barium as areas for improvement and took steps to eliminate both substances from all incoming raw materials;
■ Reduced sludge by 50% between 1996 and 1998by changing its chemical process; and
■ Reduced water discharge by 28% between 1996 and 2000 by reusing water in non-critical rinses.16
Case Study: EMS at Imagineering Finishing TechnologiesImagineering Finishing Technologies in South Bend, IN,implemented an EMS in 1998. Through its EMS,Imagineering identified a way to increase the recyclabilityof metal-bearing baths by direct discharging clean rinses(with appropriate monitoring). Between 2001 and2003, Imagineering recycled almost 4,500 pounds ofmetals. Besides alleviating stress on its wastewater treatment system, this project reduced shipments of sludge to a landfill by 66% and reduced purchases ofwastewater treatment chemicals by more than 9,000pounds within one year.17

Pa i n t & C o a t i n g s
Profile The paint and coatings sector2 manufacturesa variety of products that preserve, protect, and beautifythe objects to which they are applied. There are four maintypes of paints and coatings:
■ ■ ■ ■ Architectural coatings used in homes and buildings, such as interior and exterior paints, primers, sealers, and varnishes;
■ ■ ■ ■ Industrial coatings that are factory-applied to decorate and protect manufactured goods as part of the production process;
■ ■ ■ ■ Special purpose coatings, such as aerosol paints, marine paints, high performance maintenance coatings, and automotive refinish paints; and
■ ■ ■ ■ Allied paint products, including putties, paint and varnish removers, paint thinners, pigment dispersions, and paint brush cleaners.
The paint and coatings industry has been going through a period of increasing consolidation, marked by a large number of mergers, acquisitions, and spin-offs during the last decade.
PRODUCTION PROCESS Paint and coatings are made of a variety of compounds formulated to fulfill the requirements of different applications. Paint and coatings are manufactured through the following basic steps, which must be adapted to the characteristics of different ingredients:
■ ■ ■ ■ Addition of raw materials (resins, dry pigments, water, or solvents, depending on the type of paint);
■ ■ ■ ■ Mixing/dispersion;
■ ■ ■ ■ Filtration; and
■ ■ ■ ■ Packaging the paint or coating for sale.
PARTNERSHIP The National Paint and Coatings Association (NPCA) has formed a partnership with EPA’s Sector Strategies Program to improve the environmental performance of the paint and coatings industry. NPCA membership includes more than 350 companies that account for close to 90% of the total dollar volume of architectural paints and industrial coatings produced in the U.S.3
KEY ENVIRONMENTAL OPPORTUNITIES The paint and coatings sector is working with EPA to improve the industry’s performance by:
❒ Managing and minimizing waste;❒ Reducing air emissions; and❒ Promoting environmental management systems.
Sector At-a-GlanceNumber of Facilities: 1,500
Value of Shipments: $20 Billion
Number of Employees: 51,000Source: U.S. Census Bureau, 20011

Managing and Minimizing WasteThe paint and coatings sector is working to reduce generation and increase recycling of waste, as well as to address the life cycle impact of paint and coatings products.
Reduction in Environmental ReleasesPaint and coatings facilities use a variety of chemicalsand report on the release and management of many of those materials through EPA’s Toxics ReleaseInventory (TRI). Over the past decade, the sector hasmade progress in reducing releases of TRI chemicals.Between 1993 and 2001, normalized TRI releases bypaint and coatings facilities decreased by 50%. Mostof these releases were to air. In 2001, close to 50% ofthe sector’s TRI waste was managed through recycling.4
While current levels of recycling across the sector arealready substantial, additional opportunities may existfor further increases.
Life Cycle ImpactsThe paints and coatings sector has reduced or eliminateda number of harmful constituents, such as lead andmercury, from most of its products. Opportunities stillexist, however, to reduce life cycle impacts associatedwith the manufacture and use of paints and coatings.For example, environmental benefits could beachieved by substituting greater amounts of leftoverpaint for virgin raw materials in the production ofnew paint and coating products.
Pain
t & C
oatings
36
TRI Releases and Waste Managedby the Paint & Coatings Sector
0
20
40
60
80
100
ReleasedOn/Offsite
TreatedOn/Offsite
Energy RecoveryOn/Offsite
RecycledOn/Offsite
Poun
ds (m
illio
ns)*
1993 2001*Normalized by annual value of shipments Sources: U.S. EPA, Toxics Release Inventory (TRI) U.S. Census Bureau, Annual Survey of Manufactures
TRI Releasesby the Paint & Coatings Sector
0
3
6
9
12
15
18
1993 1994 1995 1996 1997 1998 1999 2000 2001Year
Poun
ds (m
illio
ns)*
*Normalized by annual value of shipments Sources: U.S. EPA, Toxics Release Inventory (TRI) U.S. Census Bureau, Annual Survey of Manufactures

Pa i n t & C o a t i n g s
Reducing Air EmissionsOrganic solvents are used as an ingredient in the production of oil-based paint and coatings because of their ability to dissolve and disperse other coatingconstituents. Organic solvents are also used in smallerquantities as an ingredient in the production of water-based paint and coatings, as well as in otheraspects of the manufacturing process.
As organic solvents evaporate, they release emissions of volatile organic compounds (VOC) and hazardous air pollutants (HAP). These releases occur inside production facilities as well as when paint and coatingproducts are ultimately applied to building structures,consumer products, and other surfaces.
Although VOCs and HAPs resulting from the production and use of paint and coating productsremain a serious environmental concern, these emissionshave decreased steadily in recent years. EPA estimatesthat the normalized quantity of VOC emissions resulting from the manufacture of paint and coatingsdeclined by 12% between 1996 and 2001.5 Thenormalized quantity of HAP releases, as reported to TRI,declined by 56% between 1993 and 2001.6
Environmental regulations, changing consumer preferences, and voluntary industry efforts all contributed to these decreases. As a result of these factors:
■ ■ ■ ■ Environmentally preferable water-based paint has increased from approximately 35% to over80% of architectural coating sales, over the past few decades, taking market share away from oil-based paint.7
■ ■ ■ ■ Markets for industrial and special purpose coatings have undergone transformation as customers have demanded, and manufacturers have introduced, a wide variety of more environmentally benign coating products.
■ ■ ■ ■ Improvements have been made in the way that paint and coating products are manufactured, handled, and applied.
The downward trend in VOC and HAP emissions islikely to continue due to:
■ ■ ■ ■ New regulatory requirements in recent years, including national VOC emissions standards for coatings, along with a number of Maximum Achievable Control Technology (MACT) standards for manufacturers and users of coatings products;
■ ■ ■ ■ New, inherently cleaner products and technologies, such as powder coatings, radiation-cured coatings, and high solids technologies; and
■ ■ ■ ■ Improved industrial housekeeping and applicationtechniques, as well as advances in the manufacturing process.
TRI Air Toxics+ Releases by the Paint & Coatings Sector
1993 1994 1995 1996 1997 1998 1999 2000 2001Year
Poun
ds (m
illio
ns)*
0
2
4
6
8
10
12
+Includes the Clean Air Act hazardous air pollutants that are reported to TRI *Normalized by annual value of shipments Sources: U.S. EPA, Toxics Release Inventory (TRI) U.S. Census Bureau, Annual Survey of Manufactures

Promoting Environmental Management Systems The adoption of environmental management systems(EMS) within the paint and coatings sector is increasing rapidly. NPCA has incorporated an EMScomponent into its Coatings Care® program, which is a condition of membership. Consequently, in the next few years all 900 NPCA facilities should be implementing an EMS.8
In addition, NPCA is a Performance Track NetworkPartner committed to encouraging top environmentalperformance through EMS. Five individual paint andcoatings facilities have been accepted into EPA'sNational Environmental Performance Track.9
Case Study: Coatings Care®
NPCA’s Coatings Care® program is designed to providea comprehensive system that integrates health, safety,and environmental activities within corporate planningand manufacturing operations. The EMS component of Coatings Care® fosters continuous improvement inmembers’ environmental performance and facilitatesongoing efforts to be sensitive to community and public concerns.
In addition, the EMS component of Coatings Care®
requires each participating facility to develop a quantitative inventory of emissions and discharges to all media, as well as the off-site transfer of wastes fromeach site. The Coatings Care® guidance suggests thatfacilities should identify and tabulate the volume ofeach permitted discharge, emission or waste on anannual basis and prepare a report presenting the findings of their inventory efforts.10
In 2004, the Sector Strategies Program and NPCA will jointly explore opportunities for building onCoatings Care®, as well as utilizing EPA’s nationalenvironmental databases and other publicly availabledata, to establish a comprehensive performance measurement program for the paint and coatings sector.
Many paint and coatings companies are finding that EMS can be an effective tool for performanceimprovement.
Case Study: EMS at Sherwin-WilliamsThe Sherwin-Williams Company has implemented anEMS that not only fosters compliance with regulationsas an integral part of day-to-day operations, but alsocharges facilities to minimize adverse safety, environmental, and health impacts through the use of integrated management systems and planning. The EMS applies to all company locations, includingSherwin-Williams' manufacturing plants, distributionservice centers and warehouses, automotive branches,and commercial and retail stores.
One major component of Sherwin-Williams’ EMS is waste minimization. Each of the company’s plants hasestablished recycling and/or rework programs. Theseprograms aim to minimize the generation of cleaningmaterials and maximize reuse and recycling of cleaningsolvents, recycling of wash water, reworking of miss-tinted paint into future batches, and recycling of cardboard, paper, and steel. As an indication of how successful the EMS has been, in 2002 Sherwin-Williams recycled more than 90 millionpounds of paint, cleaning solvents, and wash water.11
38
Pain
t & C
oatings

P o r t s
Profile The public port sector3 consists of portauthorities and agencies located along the coasts andaround the Great Lakes. Typically established by enactments of state government, ports develop, manage,and promote the flow of waterborne commerce.
Ports on the coasts and inland waterways provide more than 3,000 berths for deep draftships and transfer cargo and passengers through about 2,000 public and private marine terminals.4 Deep water ports accommodate more than 95% by weight, and 75% byvalue, of all U.S. overseas trade.5
The port sector is facing increased pressure to develop newer, larger, and more efficientfacilities to accommodate increased water trade carried by larger and larger vessels. U.S.international waterborne freight is forecast to triple by 2020.6 In response to the increasein trade, ports spent $2.8 billion on capital improvements in 2001-2002.7 In addition,cruise ships and other waterborne passenger services are increasingly using commercialport facilities.
PORT OPERATIONS Public ports develop and maintain the shoreside facilities for theintermodal transfer of cargo between ships, barges, trucks and railroads. Ports also buildand maintain cruise terminals for the cruise passenger industry. While port authoritiesdirectly operate many marine terminals, they also serve as landlords to many tenant operations. Port authority operations may also include other entities, such as airports,bridges, and railroads. Additionally, the U.S. military depends on numerous ports to serveas bases of operation and to deploy troops and equipment during national emergencies.
PARTNERSHIP The American Association of Port Authorities (AAPA) has formed a partnership with EPA's Sector Strategies Program to improve the environmental performance of deep water public ports.8 The intent is to focus on the ports where there is the greatest opportunity and capacity to make environmental improvements and then transfer tools and lessons to other ports, private shipping terminals, and related industries.
KEY ENVIRONMENTAL OPPORTUNITIES The port sector is working with EPA to improve performance by:
❒ Reducing air emissions;❒ Improving water quality;❒ Minimizing impacts of growth; and❒ Promoting environmental management systems.
Sector At-a-GlanceNumber of Port Authorities: 82*
Value of Shipments: $5.3 Billion**
Number of Employees: 58,000***Source: AAPA, 20041
**Source: U.S. Census Bureau, 20012

Reducing Air Emissions Marine vessels, land-based cargo-handling equipment, trucks, and trains all contribute to air emissions at ports. Common air pollutants fromthis transportation equipment include particulatematter (PM), nitrogen oxides (NOX), and sulfuroxides (SOX).
Port authorities typically only have direct controlover a limited number of these sources, so a collaborative approach with tenants and others is theonly way to get substantial reductions in emissionsover the long term.
Ports are making progress in reducing air emissionsby increasing the use of cleaner fuels and streamliningoperations. For example:
■ ■ ■ ■ Most major ports have switched, or are switching, from diesel fuel to electric or hybrid power for on-dock cranes.
■ ■ ■ ■ The use of on-dock rail and barges, in lieu of trucks, has increased.
■ ■ ■ ■ Turn-around times for trucks dropping off and picking up loads at ports have decreased, resulting in a decrease in truck idling and emissions from diesel engines.
Case Study: Reducing Air Emissions at NY/NJ Port Authority The Port Authority of New York and New Jersey andthe Army Corp of Engineers are in the process of deepening critical waterways in the New York/NewJersey Harbor. Heavy machinery will be used for thedeepening operations and will increase air emissions in the harbor area.
To offset these emissions, the Port Authority is exploringways to reduce emissions associated with other portmaritime activities. For example:■ The port is retrofitting the diesel engine of one of the
Staten Island Ferries with a selective catalytic reduction system in order to reduce NOX emissions.The port is also transitioning the ferry to ultra-low sulfur fuel to reduce SOX and PM emissions. If the test is successful, the port will make similar changes to all of its ferries, for an expected reduction of 400 to 800 tons per year of NOX emissions.
■ The port is replacing the diesel engine used by one of the small tugboats in the harbor with a new low-emissions diesel engine. If the initial test is successful, a larger tug will be re-powered and tested.9
Ports
40

P o r t s
Improving Water QualityPorts can improve the quality of surrounding waters byenhancing stormwater management and exploring newtechnologies to reduce the impact of invasive species.
Stormwater Management Stormwater management is increasingly important inimproving water quality near port facilities. Most largeports have hundreds of acres of paved waterfrontproperty for cargo handling, where stormwater runoffmay pick up various pollutants before entering waterways. Existing state stormwater regulations and new Total Maximum Daily Load (TMDL)requirements, which specify the maximum amount of pollutants that each water body can receive, aredriving improvements. Voluntary efforts to improvestormwater management are also underway at someports.
Case Study: Stormwater Management at the Port of TampaThe Port of Tampa, FL, is in the process of redevelopingPort Ybor, a former U.S. Department of Defense facility. The port has served many industrial rolesthroughout its history, leaving it contaminated withpetroleum products, solvents, and metals. In partnershipwith federal and state agencies, the Port of Tampa iscleaning up the site to make it suitable for industrialapplications. The port installed an advanced stormwater system to help reduce the pollutant load intoYbor Channel, which leads to Tampa Bay. This systemutilizes collection basins and baffle boxes that are capable of removing sediments and other suspended particles from stormwater so that they will not enterYbor Channel.10
Invasive SpeciesShips must carry ballast water for stability and ease of steering and propulsion. This ballast water often originates from ports and other coastal regions, rich in marine organisms. Ballast water is typically releasedin a different geographic area than where it was takenin, resulting in the introduction of non-native or invasive species to the area. Invasive species may cause both economic and environmental detriment by crowding out commercially viable species, affectingwater related activities such as swimming, and impacting waterborne transportation.
To minimize the impact of invasive species, ships typically exchange ballast water in the open oceanrather than in shallow bay and harbor areas. New ballast water treatment technologies may help to further reduce the impact of invasive species. EPA’sEnvironmental Technology Program is currentlydeveloping protocols to verify the performance of these new technologies.11
Minimizing Impacts of Growth To accommodate increased water trade carried by larger vessels, many ports must increase their capacityand dredge deeper channels and harbors. While port capacity can be increased somewhat throughimprovements in technology and operational efficiency, many ports also require physical expansion.Surrounding communities are increasingly interested in the positive and negative impacts of port expansion,so ports must consider how best to minimize and compensate for wetland or habitat loss, properly handle sediment from dredging operations, andaddress other impacts of port growth.
Case Study: Natural Resource Assessment at the Port of Portland The Port of Portland, OR, has developed a NaturalResource Assessment and Management Plan (NRAMP),the first comprehensive environmental data system of itskind, in an effort to establish a proactive policy forlong-term environmental planning.
Through NRAMP, the port has created ecological maps of all port-owned properties, which can be used to identify the natural resources and wildlife habitats present in these areas. Having access to this up-to-dateinformation will help the port to:■ Evaluate the potential ecological effects of future
projects before they begin;■ Avert projects with a significant negative impact
to overall environmental quality; and■ Effectively communicate different management and
development alternatives with the community.
The system will also decrease planning costs for futuredevelopment by reducing the amount of data that has to be collected for each new project and helping toavoid delays during land development.12

Ports
Promoting EnvironmentalManagement Systems One way ports are proactively addressing their environmental responsibilities is through the development of environmental management systems(EMS). Although only a few ports currently have an EMS, many other ports are beginning to developEMS in order to show leadership in environmentalprotection, reduce costs and improve efficiency,increase staff involvement and morale, and integrateother objectives, such as safety and security, withenvironmental activities.
Eleven ports are now participating in an EMSAssistance Project co-sponsored by the SectorStrategies Program and AAPA.13 Each of the selectedports is committed to developing performance measures and sharing results with stakeholders andother interested parties. Upon completion of theproject, each port will be ready to pursue certification to the ISO 14001 standard.
Case Study: EMS at the Port of Houston The Port of Houston Authority (PHA), which manages one of the largest ports in the world, adoptedan EMS at its Barbours Cut Terminal and CentralMaintenance facilities in 2002. Later that year PHAbecame the first port in the country to receive ISO14001 certification at any of its facilities.
Through its EMS, PHA identified six performanceimprovement objectives:■ Reduce NOX emissions;■ Reduce stormwater impacts;■ Reduce the generation of solid wastes;■ Increase recycling efforts;■ Reduce energy consumption; and■ Participate in the Texas Natural Resource
Conservation Commission’s Clean Texas Program.
To date, PHA has reduced NOX emissions by almost25% through the purchase of new, cleaner engines andthe use of a lower emission diesel fuel called PuriNOX.PHA has also been accepted into the Clean TexasProgram. By 2005, PHA expects to reduce energy consumption by 5% by making building modificationsand re-powering crane engines.14
Case Study: EMS at the Port of Boston In December 2003, the Port of Boston, MA, ConleyContainer Terminal received ISO 14001 certification,becoming the second certified U.S. public port facility.As part of its EMS, the terminal has set performanceimprovement objectives in eight areas: hazardous waste,wastewater, stormwater, construction waste, resourceuse, air emissions, spills, and noise. Initial targetsinclude establishing baselines from which to measureprogress, performing evaluations, and conducting outreach efforts. Much effort has been made to helpemployees understand how to minimize their environmental impact at the port.15
42

S h i p b u i l d i n g & S h i p R e p a i r
Profile The shipbuilding and ship repair sector2
builds and repairs ships, barges, and other large vessels.The sector also includes operations that convert or alterships as well as facilities that manufacture offshore oil and gas well drilling and production platforms. Most facilities that build ships also have the ability to repairships, although some smaller yards do only repair work. Most shipyards are concentrated along the coasts, the Ohio and Mississippi Rivers, and the Great Lakes.3
The shipbuilding and ship repair industry has been in decline due to intense globalcompetition and a decrease in the number of military ship orders. Throughout the1990s, naval ship procurement averaged only six ships per year, the lowest level since1932.4 From 1993 to 2001, the industry’s workforce decreased by 20%.5
PRODUCTION PROCESS New ship construction and ship repair have many industrialprocesses in common, including machining and metal working, metal plating and surface finishing, surface preparation, solvent cleaning, application of paints and coatings, and welding. In addition to these processes:
■ ■ ■ ■ New ship construction often includes parts fabrication and preassembling operations that involve cutting, shaping, bending, machining, blasting, and painting.
■ ■ ■ ■ Typical maintenance and repair operations include: blasting and repainting, rebuilding and installation of machinery, system replacement and overhauls, maintenance and installation, structural reconfiguration, and major remodeling of ship interiors or exteriors.
PARTNERSHIPS The American Shipbuilding Association (ASA) and the ShipbuildersCouncil of America (SCA) have formed a partnership with EPA’s Sector StrategiesProgram to improve the environmental performance of the shipbuilding and ship repair industry.6
KEY ENVIRONMENTAL OPPORTUNITIES The shipbuilding and ship repair sector is working with EPA to improve the industry’s performance by:
❒ Managing and minimizing waste;❒ Reducing air emissions;❒ Improving water quality; and❒ Promoting environmental management systems.
Sector At-a-GlanceNumber of Facilities: 680
Value of Shipments: $12 Billion
Number of Employees: 89,000Source: U.S. Census Bureau, 20011

TRI Releases and Waste Managedby the Shipbuilding & Ship Repair Sector
ReleasedOn/Offsite
TreatedOn/Offsite
Energy RecoveryOn/Offsite
RecycledOn/Offsite
Poun
ds (m
illio
ns)*
1993 2001* Normalized by annual value of shipments Sources: U.S. EPA, Toxics Release Inventory (TRI) U.S. Census Bureau, Annual Survey of Manufactures
0
1
2
3
4
5
Managing and Minimizing WasteOver the past decade, the shipbuilding and shiprepair sector has made progress in reducing wastegeneration and increasing reuse and recycling rates.Given the diversity of their industrial processes, shipbuilding and ship repair facilities use a variety of chemicals and report on the release and management of many of those materials through EPA’s Toxics Release Inventory (TRI). Between 1993 and 2001, normalized TRI releases by shipyards decreased by 43%. In 2001, treatment,energy recovery, and recycling accounted for 58% of this sector’s waste management.7
Improvements in hazardous waste management at shipyards can be attributed to several practices,including:
■ ■ ■ ■ Development of improved coating application technologies, such as in-line plural component mixers that only mix the amount of coating necessary, as it is required, to avoid the waste of excess paint;
■ ■ ■ ■ Use of paint waste for fuel blending, rather than solidifying it for land disposal;
■ ■ ■ ■ Reclamation of spent solvents from spray paintequipment; and
■ ■ ■ ■ Recycling of spent abrasive for use as an aggregate material in the production of asphalt and cement “clinker”.
Ship
bu
ildin
g & Sh
ip R
epair
44
TRI Releasesby the Shipbuilding & Ship Repair Sector
1993 1994 1995 1996 1997 1998 1999 2000 2001Year
Poun
ds (m
illio
ns)*
* Normalized by annual value of shipments Sources: U.S. EPA, Toxics Release Inventory (TRI) U.S. Census Bureau, Annual Survey of Manufactures
0
1
2
3
4
5

S h i p b u i l d i n g & S h i p R e p a i r
Reducing Air Emissions Because most large ships are built of steel, they must be periodically cleaned and coated in order to preserve the steel and to provide specific performance characteristics to the surface. Over thepast decade, the shipbuilding and ship repair sectorhas reduced particulate matter (PM) emissions during surface preparation and volatile organic compound (VOC) and hazardous air pollutant(HAP) emissions during the application of paint and coatings.
Particulate Matter Emissions Surface preparation is critical to the coating life cycle, as it provides both the physical and chemical requirements for long-term coating adhesion. To prepare surfaces for coating applications, shipyardspredominantly use a dry-abrasive blasting process.This dry-abrasive blasting is typically performed outdoors, as the sheer size of a ship makes enclosure difficult and expensive.
The blasting operation generates PM emissionsderived from both the break-up of the abrasive material and the removal of the existing coating. Overthe past ten years, shipyards have developed ways toreduce PM emissions to the environment, including:
■ ■ ■ ■ Temporary containment of blasting operations;
■ ■ ■ ■ Material substitutions; and
■ ■ ■ ■ Alternative surface preparation technologies.
Early attempts at temporary containment consisted ofhanging curtains from scaffolding, wires, dock-arms,and other structures around the ship. Generally, thesetemporary structures were open at the top andreduced PM emissions by reducing the wind speed in the blasting area. This practice has evolved toinclude the construction of temporary shrink-wrapenclosures of entire ships in drydock.
Case Study: Temporary Containment at Signal International Signal International, located in MS and TX, hasadapted temporary containment for use on offshore drillrigs. Their containment efforts have resulted in a 90%reduction in PM emissions from dry-abrasive blastingoperations.8
Shipyards have also reduced PM emissions throughmaterial substitutions. Most dry abrasives used outdoors at shipyards are either sand or slags derived from coal-fired utility boilers (coal slag) orsmelting (copper slag). Some abrasives result in higher PM emission rates than others. The NationalShipbuilding Research Program sponsored researchto determine the PM emission rates of the varioustypes of abrasives and to analyze the life cycle costsof material substitution.9 As a result, many shipyardsare now utilizing different abrasives with lower PMemission rates.
Case Study: Material Substitution at Bath Iron WorksIn 1994, Bath Iron Works (BIW) in Bath, ME, begansubstituting garnet abrasive for coal slag in their exterior ship dry-abrasive blasting operations. Garnetabrasive typically produces only 10% of the PM emissions of coal slag. Additionally, less abrasive isrequired when garnet is substituted for coal slag. BIW reports that a typical ship that once needed 300 to 500 tons of coal slag for surface preparationnow requires only 200 tons of garnet.10
Alternative surface preparation technologies thatreduce or eliminate PM emissions are also beinginvestigated by shipyards. Of the new technologies,Ultra High Pressure Water Jetting (UHPWJ) hasmade the greatest inroads for surface preparation of exterior ship surfaces. Water-based surface preparation methods emit significantly less PM than dry-abrasive methods. Over the past ten years,manufacturers of UHPWJ equipment have significantly improved the performance and lowered the operating costs of the technology.Currently, 5-10% of the exterior surfaces of ships inthe U.S. are prepared with UHPWJ technology.11

Volatile Organic Compound and Hazardous Air Pollutant Emissions Once the ship’s surface is properly prepared, coatingscan be applied. The type of coating to be applied (typically down to the level of a specific brand) isspecified by the customer (that is, the shipowner/operator) rather than the shipyard. These coatings may contain chemicals that are released to the environment during application.
When coatings are applied indoors, it is possible toutilize pollution control equipment, such as spraybooths, to control the release of VOCs and HAPs. At shipyards, however, most coatings are applied outdoors. As a result, VOCs and HAPs may bereleased to the environment.
Over the last decade, shipyards have worked to reduce the VOC and HAP emissions during coating application. EPA estimates that the normalized quantity of VOC emissions from shipyards declinedby 36% between 1996 and 2001.12 The normalizedquantity of HAP releases, as reported to TRI, declinedby 58% between 1993 and 2001.13
Much of the decline in both VOC and HAP emissions is due to the reformulation of marine coatings. Coatings manufacturers, working in cooperation with shipyards, have reformulated manymarine coatings to reduce their VOC and HAP content, while maintaining or improving the performance characteristics required by customers.While more viscous and difficult to apply, these low-VOC, high solids content coatings have becomethe industry standard due to their excellent performance characteristics.
46
Ship
bu
ildin
g & Sh
ip R
epair
0
2
4
6
8
10
Volatile Organic Compound Emissions from the Shipbuilding & Ship Repair Sector
Poun
ds (m
illio
ns)*
+Data for 2000 are not available for this sector*Normalized by annual value of shipments Sources: U.S. EPA, National Emission Inventory U.S. Census Bureau, Annual Survey of Manufactures
1996 1997 1998 1999 2000 2001Year
No Data +
TRI Air Toxics+ Releasesby the Shipbuilding & Ship Repair Sector
1993 1994 1995 1996 1997 1998 1999 2000 2001Year
Poun
ds (m
illio
ns)*
0.0
0.5
1.0
1.5
2.0
2.5
+Includes the Clean Air Act hazardous air pollutants that are reported to TRI *Normalized by annual value of shipments Sources: U.S. EPA, Toxics Release Inventory (TRI) U.S. Census Bureau, Annual Survey of Manufactures

S h i p b u i l d i n g & S h i p R e p a i r
Improving Water Quality Pollutants generated by shipyards can be released into the environment via stormwater.
Case Study: Stormwater Best Management PracticesIn 2002, Gulf Coast shipyards, along with representatives from EPA and state environmental agencies, formed a workgroup to improve shipyardmanagement of stormwater. The workgroup developed a set of practical, cost-effective best management practices (BMP) aimed at reducing pollutant loadingsin stormwater. In addition, the BMPs are intended toassist the shipyards in achieving other benefits, such as increased productivity, reduced materials usageand cost, reduced waste generation, reduced risk andliability, improved product quality, and increased customer satisfaction.
In 2004, participating shipyards will test BMP templates for six core shipyard processes that are believed to be major contributors to stormwater pollutant loadings:■ Removal of hull biofoulants;■ Out-of-doors abrasive blasting;■ Abrasive materials management;■ Out-of-doors spray painting;■ Metal grinding; and■ Welding, burning, and cutting.
Once the BMPs are verified, workgroup participantswill encourage additional shipyards to use the BMPs to reduce stormwater pollutant loadings from theirfacilities.14

Promoting Environmental Management SystemsThe adoption of environmental management systems(EMS) is increasing rapidly in the shipbuilding andship repair industry. In December 2000, NationalSteel and Shipbuilding Company (NASSCO)became the first shipyard to implement an EMS andcertify it to the ISO 14001 standard. During thesubsequent three years there have been at least fournew certifications (Bath Iron Works, Coast GuardShipyard, Electric Boat Corporation, and NorthropGrumman Newport News), and three additionalshipyards are ready to declare a functioning EMS(Bender Shipbuilding & Repair Company, FirstWaveMarine, and Southwest Marine).
To encourage widespread adoption of EMS in theshipbuilding and ship repair sector, the SectorStrategies Program, ASA, and SCA have developedEMS tools for shipbuilding and ship repair facilities,including a customized EMS Implementation Guideand a brochure highlighting the financial benefits ofEMS.15 ASA and SCA are now taking the lead tocontinue EMS promotion through mentoring andtraining sessions.
Many shipyards are finding that EMS can be aneffective tool for performance improvement.
Case Study: Improving Performance through EMSReducing waste is a common performance improvementobjective for shipyards with an EMS. Through theirEMS, several shipyards have reduced generation of solidand hazardous waste. For example:■ Bath Iron Works in Bath, ME, reduced the amount
of solid waste disposed by 10% between 2001 and 2002 by expanding its source recycling program and increasing employee education on the importance of recycling waste and reusing material. BIW sustained this effort in 2003 and decreased solid waste disposal by another 1%.16
■ Bender Shipbuilding & Repair Company, in Mobile, AL, reduced hazardous waste generation by decreasing paint and solvent use and recycling sandblasting grit.17
■ NASSCO in San Diego, CA, reduced hazardous waste and minimized VOC emissions generation by increasing its use of plural component paint systems that require less paint and solvent. In addition, NASSCO reduced the risk of unintentionally co-mingling hazardous waste with regular trash by color-coding tubs for waste segregation, conducting training, and examining tub contents prior to consolidation. NASSCO now ties waste segregation scores to housekeeping zones and publishes the scores and names of managers responsible for each zone in its weekly newsletter.18
Ship
bu
ildin
g & Sh
ip R
epair
48
Specia l ty-Batch Chemicals
Profile The specialty-batch chemical sector2
comprises companies that produce chemicals to meet thespecific needs of the customer on an “as needed” basis.Specialty-batch chemicals are often not a final product, but rather a key ingredient in a final product. The following products either use or are specialty-batchchemicals: flavorings, food additives, cleaning agents, construction materials, dyes andpigments, pharmaceuticals, and cosmetics.
The states with the most specialty-batch chemical manufacturing facilities are (indescending order): California, Texas, New Jersey, New York, Illinois, North Carolina,Georgia, and Louisiana.3 As with other sectors, over the last decade the specialty-batchchemical sector has been impacted by changes in markets and global competition.
PRODUCTION PROCESS Unlike commodity chemicals, which are manufactured for general use, specialty-batch chemicals are made to meet specific customer needs.Therefore, the raw materials, processes, operating conditions, equipment configurations,and end products change on a regular basis.
Most specialty-batch chemicals are made through “batch processing”, where discretequantities of chemicals are mixed to yield a desired compound. The process is completed on a relatively small scale and sometimes requires multiple steps. Batch producers can make hundreds of different compounds in a single year.
PARTNERSHIP The Synthetic Organic Chemical Manufacturers Association(SOCMA) has formed a partnership with EPA’s Sector Strategies Program to improvethe environmental performance of the specialty-batch chemical industry. SOCMA’s300 member companies represent more than 2,000 manufacturing sites and more than 100,000 employees. More than 75% of SOCMA members have fewer than 500employees.4
KEY ENVIRONMENTAL OPPORTUNITIES The specialty-batch chemical sector isworking with EPA to improve the industry’s performance by:
❒ Enhancing performance commitments; and❒ Managing and minimizing waste.
Sector At-a-GlanceNumber of Facilities: 2,000
Value of Shipments: $60 Billion
Number of Employees: 100,000Source: SOCMA, 20021

Specialty-B
atch C
hem
icals
50
Enhancing Performance CommitmentsBeginning in 2004, SOCMA members will adopt amodernized management system approach with thirdparty certification and metrics. This Responsible Care®
Management System (RCMS) will build upon theindustry’s existing Responsible Care® Program and itssix codes of practice: community awareness and emergency response, process safety, employee healthand safety, pollution prevention, distribution, and product stewardship. RCMS is based on benchmarkedbest practices of leading private sector companies,national regulatory requirements, and other initiatives.5
Performance MetricsPublic reporting of uniform, industry-wide metrics is a key part of RCMS. Such measures will enable member companies to identify areas for continuousimprovement and provide a means for the public totrack individual company and industry performance.RCMS measures will address performance across abroad range of issues including economics, environment, health, safety, security, and products.Specific environmental metrics will include:
■ ■ ■ ■ Releases to air, land, and water reported to EPA's Toxics Release Inventory (TRI);
■ ■ ■ ■ Greenhouse gas intensity; and
■ ■ ■ ■ Energy efficiency.
SOCMA members report TRI releases annually andwill report on greenhouse gas and energy metrics starting in 2005.6
Environmental Management SystemsAnother key component of RCMS is an environmentalmanagement system (EMS). At present, 73% ofSOCMA's Responsible Care Coordinators report thatthey have a quality management system or EMS inplace.7 Fifteen of these facilities have been accepted intoEPA’s National Environmental Performance Track. In addition, SOCMA is a Performance Track NetworkPartner, committed to encouraging top environmentalperformance through EMS.8 To encourage EMS adoption, SOCMA and the Sector Strategies Programdeveloped a customized EMS Implementation Guide.9
Case Study: EMS at Baker PetroliteThrough their EMS, Baker Petrolite’s plant in Rayne, LA:■ Decreased annual, normalized volatile organic
compound emissions by over 27% through equipment improvements and better monitoring, inspections, and preventative maintenance; and
■ Reduced hazardous waste generation by nearly 15% over three years by reusing vat rinsate, scheduling blending to reduce the amount of rinsate needed, and closely monitoring inventory.10
Managing and Minimizing WasteDue to similarities in industrial classifications, it is difficult to isolate the environmental impact of the specialty-batch chemical sector from that of the overallchemical industry. Between 1993 and 2001, normalizedTRI releases by the entire chemical sector decreased by65%. During this same time period, most of the sector’swaste was recycled or treated rather than released. Forexample, in 2001, 41% of the chemical sector's TRIreleases and waste managed was recycled, and 37% was treated.11

E n d n o t e s
INTRODUCTION1 U.S. Census Bureau. Statistics for Industry Groups and Industries: 2001,
Annual Survey of Manufacturers, for gross domestic product, and fuels and energy purchases - available at: http://www.census.gov/prod/2003pubs/m01as-1.pdf. U.S. Census Bureau. County Business Patterns: 2001, for the number of facilities and number of employess - available at: http://www.census.gov/epcd/cbp/view/cbpview.html.
2 U.S. Environmental Protection Agency. 2003. Toxics Release InventoryPublic Data Release: 2001. Data freeze: March 7, 2003
AGRIBUSINESS1 U.S. Census Bureau. 2001. County Business Patterns. For the number
of employees and number of establishments. Available at: http://www.census.gov/epcd/cbp/view/cbpview.html. U.S. Census Bureau. 2001. Statistics for Industry Groups and Industries, Annual Survey of Manufactures. For value of shipments. Available at http://www.census.gov/prod/2003pubs/m01as-1.pdf.
2 Standard Industrial Classification (SIC) codes used to define the economic activities of the industries or business establishments in this sector: 2011, 2013, 2015, 2021- 2024, 2026, 2032 - 2035, 2037, 2038, 2041, 2043 - 2048, 2051 - 2053, 2064, 2066 - 2068, 2079, 2082, 2086,2087, 2091, 2092, 2095, 2096, 2098, and 2099. Corresponding North American Industry Classification System (NAICS) codes: 311320, 311330, 311340, 311520, 311822, 311823, 311911, 311919, 311920, 311930, 311941, 311942, 311991, 311999, 312111, 312112, and 312120.
3 U.S. Census Bureau. 2001. County Business Patterns. Available at: http://www.census.gov/epcd/cbp/view/cbpview.html.
4 U.S. Census Bureau. 2001. County Business Patterns. Manufacturing Establishments by Employment Size, derived from: http://censtats.census.gov/cgi-bin/cbpnaic/cbpcomp.pl.
5 American Meat Institute. See http://meatami.com.6 National Food Processors Association. See http://www.nfpa-food.org/.7 U.S. Census Bureau. 2001. Statistics for Industry Groups and Industries,
Annual Survey of Manufactures. For value of shipments. Available at http://www.census.gov/prod/2003pubs/m01as-1.pdf.
8 U.S. Environmental Protection Agency. Permit Compliance System (PCS), IDEA refresh as of December 12, 2003.
9 U.S. Environmental Protection Agency. 2003. Toxics Release Inventory (TRI) Public Data Release: 2001. Data freeze: March 7, 2003.
10 U.S. Environmental Protection Agency. Sector Strategies Program, Environmental Management System (EMS) Implementation Guide for the Meat Processing Industry. Available at: http://www.epa.gov/sectors/agribusiness/agri_ems.html#ems.
11 AMI Master Achiever Pioneer Star Program (MAPS). See http://www.meatami.com/Content/NavigationMenu/ Labor_Environment/Environmental_MAPS_Program/ Environmental_MAPS_Program.htm.
12 Leaverton, Sue. Advance Brands. 2003. Conversation with sector point-of contact, September 15, 2003.
13 Frotz, Dave. Excel Corporation. 2003. Conversation with sector point-of contact, September 15, 2003.
14 Western Iowa Livestock External Stewardship Pilot Project (WILESPP). 2004. Laying the Groundwork for a Future of Effective Nutrient Management, DRAFT - FINAL REPORT.
CEMENT1 van Oss, Hendrik G. 2004. U.S Geological Survey, Mineral
Commodity Summaries. p. 42.2 Standard Industrial Classification (SIC) code used to define the
economic activities of the industries or business establishments in
this sector: 3241, and the corresponding North American Industry Classification System (NAICS) code: 327310.
3 van Oss, Hendrik G. 1997 and 2002. U.S Geological Survey, Cement Yearbook. Available at http://minerals.usgs.gov/minerals/pubs/commodity/cement/.
4 Portland Cement Association. U.S. and Canadian Portland Cement Industry: Plant Information Summary Survey. p. 2-3.
5 Carter, Tom, Portland Cement Association. May 2004. Interview.6 Portland Cement Association. U.S. and Canadian Labor-Energy Input
Survey. p. 2.7 Ibid., p. 2 and 7.8 Ibid.9 Portland Cement Association. U.S. and Canadian Portland Cement
Industry: Plant Information Summary Survey. p. 3.10 Energy Star web site at http://www.energystar.gov,and click on “Energy
Star Industry Partners” for complete list.11 NEI Emission Trends Data and Estimation Procedures, Criteria Pollutant
Data, Average Annual Emissions, All Criteria Pollutants Years Including 1970 - 2001, Updated August 2003. Available at http://www.epa.gov/ttn/chief/trends/.
Note: State and local emissions inventories are submitted to EPA once every three years (e.g., 1996 and 1999) for most of the point sources contained in NEI. EPA estimated emissions for any jurisdiction that did not submit an emissions inventory. Similarly, emissions for the years in between submissions were estimated by EPA. These estimates may not reflect changes in the industry, such as pollution prevention or compliance efforts. The 2002 inventory is scheduled for release in 2005.
12 van Oss, Hendrik G. and Amy C. Padovani. 2003. “Cement Manufacture and the Environment – Part II: Environmental Challenges and Opportunities.” Journal of Industrial Ecology. Volume 7, Number 1, page 101.
13 NEI Emission Trends Data and Estimation Procedures, Criteria PollutantData, Average Annual Emissions, All Criteria Pollutants Years Including 1970 - 2001, Updated August 2003. Available at http://www.epa.gov/ttn/chief/trends/.
14 Ibid.15 Energy Information Administration, Department of Energy. U.S.
Anthropogenic Carbon Dioxide Emissions, 1990-2002. Accessed from EIA web site: http://www.eia.doe.gov/oiaf/1605/ggrpt/carbon.html in May 2004. See also van Oss and Padovani, page 104.
16 van Oss, Hendrik G. and Padovani.17 Energy Information Administration, Department of Energy.18 Climate VISION, Program Mission. Available at
http://www.climatevision.gov/mission.html. The specific cement sector commitment is found at http://www.climatevision.gov/sectors/cement/. Accessed May 2004.
19 U.S. Department of Energy, Energy Information Administration. 2002. Voluntary Reporting of Greenhouse Gases Program: Available at: http://www.eia.doe.gov/oiaf/1605/frntvrgg.html. Accessed May, 2004.
20 U.S. Department of Energy, Energy Information Administration. 2002. Voluntary Reporting of Greenhouse Gases. Available at http://www.eia.doe.gov/oiaf/1605/TableB2_2002.html. Accessed May, 2004, Table B2.
21 van Oss and Padovani. page 97.22 Portland Cement Association, Cement Kiln Dust Surveys,
memo: May 2004.23 St. Lawrence Cement Group. 2003. Sustainable Development Report.
Page 4. Available athttp://www.holcim.com/Upload/CA/Publications/ SD%20Report_ENG.pdf.
24 Ibid.

COLLEGES & UNIVERSITIES1 U.S. Census Bureau. County Business Patterns: 2001, for the number
of establishments, available at: http://www.census.gov/epcd/cbp/view/ cbpview.html.
2 National Center for Education Statistics. Enrollment in Postsecondary Institutions, Fall 2003 and Financial Statistics, Fiscal Year 2003, December 2003, for value of shipments.
3 National Center for Education Statistics. Enrollment in Postsecondary Institutions, Fall 2001 and Financial Statistics, Fiscal Year 2001, December 2003, for the number of employees, available at http://nces.ed.gov/pubs2004/2004155.pdf.
4 Standard Industrial Classification (SIC) codes used to define the economic activities of the industries or business establishments in this sector: 8221 and 8222. Corresponding North American Industry Classification System (NAICS) codes: 611210 and 611310.
5 National Center for Education Statistics. Digest of Education Statistics: 2002. Chapter 3. Accessed January 5, 2004. Available at: http://nces.ed.gov/.
6 Partnerships: The American Council on Education (ACE) is the nation’s coordinating higher education association. Its approximately 1,800 members include accredited, degree-granting colleges and universities from all sectors of higher education and other education and education-related organizations. Additional information available at: www.ace.org.
The Association of Higher Education Facilities Officers (APPA) is an international association dedicated to maintaining, protecting, and promoting the quality of educational facilities. The nearly 4,500 individuals who comprise APPA are facilities professionals from public and private, two-year and four-year, colleges and universities. Additional information is available at: www.appa.org.
The Campus, Safety, Health and Environmental ManagementAssociation (CSHEMA), a division of the National Safety Council, is dedicated to assisting its membership in advancing safety, health and environmental quality in institutions of higher education. Additional information is available at: www.cshema.org.
The Campus Consortium for Environmental Excellence (C2E2) is a college and university member supported not-for-profit organization. The mission of the C2E2 is to support the continued improvement of environmental performance in higher education. Additional information is available at: www.c2e2.org.
The Howard Hughes Medical Institute (HHMI) is a medical research organization whose principal mission is the conduct of biomedical research. Approximately 320 Hughes investigators lead medical research laboratories at 68 of the nation's leading research centers and universities. Additional information is available at: www.hhmi.org.
The National Association of College and University Business Officers (NACUBO) is a nonprofit professional organization representing chief administrative and financial officers at more than 2,100 colleges and universities across the country. Additional information is available at: www.nacubo.org.
7 Rebuild America. Colleges & Universities Program Brief, October 2003. For additional information, please visit: www.rebuild.gov.
8 Dave Newport, University of Florida. Electronic communications with EPA sector point-of-contact, January 23, 2004.
9 For more information about EPA’s Energy Star Program, please visit www.energystar.gov.
10 For more information about Dutchess Community College, please visit http://www.sunydutchess.edu.
11 For more information on the New Jersey Institute of Technology’s Sustainability Greenhouse Gas Initiative, please visit http://www.njit.edu/.
12 Dave Newport, University of Florida. Electronic communications with EPA sector point-of-contact, January 23, 2004.
13 Terrance Alexander, University of Michigan. Electronic communications with EPA Sector Strategies Division, January 27, 2004. Additional information is available at: http://www.p2000.umich.edu/.
14 Ibid.15 For more information on the College and University Recycling Council
(CURC) benchmarking tool, please visit: http://www.nrc-ecycle.org/councils/CURC/projects.html.
16 Dave Wergin, University of Colorado Boulder. Electronic communications with EPA Sector point-of-contact, January 22, 2004.
17 Dwight Hagihara, Washington State University. Electronic communications with EPA Sector point-of-contact, January 27, 2004.
18 U.S. Environmental Protection Agency’s National Environmental Performance Track Program, available at: http://www.epa.gov/performancetrack.
CONSTRUCTION1 U.S. Census Bureau. County Business Patterns: 2001, for the number
of employees and number of establishments - available at: http://www.census.gov/epcd/cbp/view/cbpview.html. U.S. Census Bureau. Statistics for Industry Groups and Industries: 2001, Annual Survey of Manufactures, for value of shipments – available at http://www.census.gov/prod/2003pubs/m01as-1.pdf.
2 U.S. Census Bureau. Industry Economic Accounts, 2002 – available at: http://www.bea.gov/bea/dn2.htm.
3 Standard Industrial Classification (SIC) codes used to define the economic activities of the industries or business establishments in this sector: all of 15, 16 and 17. Corresponding North American Industry Classification System (NAICS) codes: 233110, 233210, 233220, 233310, 233320, 234110, 234120, 234910, 234920, 234930, 234990, 235110, 235210, 235310, 235410, 235420, 235430, 235510, 235520, 235610, 235710, 235810, 235910, 235920 - 235950, and 235990.
4 U.S. Census Bureau. County Business Patterns: 2001, available at: http://www.census.gov/epcd/cbp/view/cbpview.html.
5 U.S. Census Bureau. "Manufacturers' Shipments, Inventories, and Orders: December 2003," – available at www.census.gov/indicator/www/m3/prel/pdf/dec.pdf.
6 The Associated General Contractors of America website: http://www.agc.org/index.ww;jsessionid=aqfYQ96JU414.
7 U.S. EPA. Characterization of Building-Related Construction and Demolition Debris in the United States, June 1998. Report #EPA530-R-98-010. Prepared for U.S. EPA by Franklin Associates, Prairie Village, KS.
8 Ibid.9 Ibid.10 EPA’s Resource Conservation Challenge website:
http://www.epa.gov/epaoswer/osw/conserve/.11 Associated General Contractors. “Recycling Foundry Sand in Highway
Construction”, CONSTRUCTOR Magazine, January 2003.12 U.S. Green Building Council, “Why Build Green”, available at:
www.usgbc.org/aboutus/whybuildgreen.asp.13 Study Shows Green Building Investments Yield High Returns, available
at GreenBiz.com, Oct. 20, 2003.14 Leadership in Energy and Environmental Design (LEED) website:
http://www.usgbc.org/leed/leed_main.asp.15 Construction Industry Compliance Assistance Center, available at:
http://www.cicacenter.org/.16 AGC’s environmental services web page, available at:
http://www.agc.org/page.ww?section=Environmental&name=About+ Environmental.
Ap
pen
dix A
: En
dn
otes
52

E n d n o t e s
CONSTRUCTION (continued)17 Associated General Contractors. “Constructing a Green Building for
EPA”, CONSTRUCTOR Magazine, February 2003.18 Associated General Contractors. “EMS in Action on Construction
Projects”, CONSTRUCTOR Magazine, November 2002.19 Katayama, Roy and Craig Harvey, EPA Office of Transportation and Air
Quality. Discussion with Sector point-of-contact about draft table of Emission Totals by SCC and Pollutant; model run, January 12, 2004.
20 Voluntary Diesel Retrofit Program is available at: http://www.epa.gov/otaq/retrofit/.
21 Hakel, John, Executive Director, AGC of California. Discussion with EPA sector point-of-contact, Feb. 2004.
22 Performance Track Network Partners, available at: http://www.epa.gov/performancetrack/particip/trade.htm
23 Hector E. Valdez and Abdol R. Chini. “ISO 14000 Standards and the US Construction Industry”, Environmental Practice, Vol. 4, No. 4, Dec. 2002, pp. 210-219.
FOREST PRODUCTS1 U.S. Census Bureau. County Business Patterns: 2001, for the number of
employees and number of establishments - available at: http://www.census.gov/epcd/cbp/view/cbpview.html. U.S. Census Bureau. Statistics for Industry Groups and Industries: 2001, Annual Survey of Manufactures, for value of shipments – available at http://www.census.gov/prod/2003pubs/m01as-1.pdf.
2 Standard Industrial Classification (SIC) codes used to define the economic activities of the industries or business establishments in this sector: 2421, 2426, 2429, 2431, 2435, 2436, 2439, 2491, 2493, 2611, 2621, 2652, 2653, 2655 - 2657, and 2671 - 2679. Corresponding North American Industry Classification System (NAICS) codes: 321113321114, 321211 - 321214, 321219, 321912, 321918, 322110, 322121, 322122, 322130, 322211 - 322215, 322221 - 322224, 322226, 322231 - 322233, 322291, and 322299.
3 U.S. Census Bureau. County Business Patterns: 2001, for the number of employees - available at: http://www.census.gov/epcd/cbp/view/cbpview.html.
4 Compiled market trend data from American Forest & Paper Association, electronic communication to sector point-of-contact, January 16, 2004.
5 American Forest & Paper Association Membership Department Data, electronic communication to sector point-of-contact, May 2004.
6 U.S. Department of Energy Industrial Technologies Program. Forest Products Annual Report Fiscal Year 2003, 2003, available at: http://www.oit.doe.gov/pdfs/100903_news.pdf.
7 American Forest & Paper Association. Environmental Health and Safety Verification Program Year 2000 Report. 2002, available at: http://www.afandpa.org/Content/NavigationMenu/ Environment_and_Recycling/Environment,_Health_and_Safety/ Reports/EHSFullReportFinal.pdf.
8 Ibid.9 American Forest & Paper Association research and development data,
available at: http://www.afandpa.org/Template.cfm?Section=Policy_Issues &template=/TaggedPage/TaggedPageDisplay.cfm&TPLID=6&Original ID=2&InterestCategoryID=291&ExpList=2,286.
10 American Forest & Paper Association. Environmental Health and Safety Verification Program Year 2000 Report, 2002, available at: http://www.afandpa.org/Content/NavigationMenu/Environment_and_ Recycling/Environment,_Health_and_Safety/Reports/ EHSFullReportFinal.pdf.
11 Climate VISION (Voluntary Innovative Sector Initiatives: Opportunities Now), available at: http://www.climatevision.gov/.
12 Ibid.
13 Chicago Climate Exchange, available at: http://www.chicagoclimateexchange.com.
14 U.S. Environmental Protection Agency. Toxics Release Inventory (TRI) Public Data Release: 2001, data freeze: March 7, 2003.
15 American Forest & Paper Association. Environmental Health and Safety Verification Program Year 2000 Report, 2002, available at: http://www.afandpa.org/Content/NavigationMenu/ Environment_ and_Recycling/Environment,_Health_and_Safety/Reports/ EHSFullReportFinal.pdf
16 American Forest & Paper Association recycling data, available at: www.afandpa.org.
17 American Forest & Paper Association. 2003 Fiber Consumption Survey Report.
18 Department of Energy Center for Waste Reduction Technologies. Water Use in Industries for the Future, July 2003, available at: http://www.oit.doe.gov/pdfs/100903_news.pdf.
19 American Forest & Paper Association. Environmental Health and Safety Verification Program Year 2000 Report, 2002, available at: http://www.afandpa.org/Content/NavigationMenu/Environment_ and_Recycling/Environment,_Health_and_Safety/Reports/ EHSFullReportFinal.pdf.
20 American Forest & Paper Association. Forest & Paper Industry at a Glance, 2001, available (hardcopy) from the American Forest and Paper Association.
21 Sustainable Forestry Initiative data, available at: http://www.aboutsfi.org.22 ISO 14001 Registered Company Directory North America, Volume 4,
Number 2: 2003; published by QSU Publishing Company.23 EPA Performance Track Program 2004, available at:
http://www.epa.gov/performancetrack/.
IRON & STEEL1 MacDonald, Robert, Director of Statistics, American Iron & Steel
Institute (AISI). 2004. E-mail communication with sector point-of-contact, May 2004.
2 Standard Industrial Classification (SIC) code used to define the economicactivities of the industries or business establishments in this sector: 3312, and the corresponding North American Industry Classification System (NAICS) code: 331111.
3 U.S. Geological Survey (USGS) Mineral Commodity Summary. 2004. Iron and Steel. See http://minerals.usgs.gov/minerals/pubs/commodity/ iron_&_steel. For production statistics, USGS cites American Iron & Steel Institute (AISI). 2003 production and employment data from electronic communication from Robert MacDonald, Director of Statistics, AISI, to Tom Tyler, US EPA. May 4, 2004.
4 USGS. Mineral Commodity Summaries. 1999-2004. USGS cites US Bureau of Labor Statistics (BLS).
5 USGS. Mineral Commodity Summaries. 1999-2004. USGS cites US Bureau of Labor Statistics (BLS). 2003 employment number of 127,000 was reported by BLS and confirmed by AISI, above.
6 American Iron & Steel Institute (AISI). See http://www.steel.org/. Steel Manufacturers Association, See http://www.steelnet.org/.
7 U.S. Department of Energy (DOE), Office of Industrial Technologies (OIT). “Industry Profile.” Accessed May 24, 2004. See www.oit.doe.gov/steel/profile.shtml. See also DOE OIT. 200. Energy andEnvironmental Profile of the U.S. Iron and Steel Industry, DOE/EE-0229. Page 14. Available at same internet address. See also AISI Public Policy:Environment: Recycling. Accessed May 24, 2004. See www.steel.org/policy/environment/recycling.asp. Information confirmed in telephone voice message from Bill Heenan, Steel Recycling Institute, to Tom Tyler, US EPA, May 20, 2004.
8 U.S. EPA WasteWise information about steel recycling at www.epa.gov/epaoswer/non-hw/reduce/wstewise/wrr/factoid.htm.

IRON & STEEL (continued)9 Steel Recycling Institute, press release, May 5, 2003. See
www.recycle-steel.org/2002Rates.pdf, and www.recycle-steel.org/cars/index.html.
10 Members are the Automotive Recyclers Association, the Clean Car Campaign, the Clean Production Network, Great Lakes United, the Ecology Center, Environmental Defense, the Institute of Scrap Recycling Industries, Inc., the Mercury Policy Project, the Steel Manufacturers Association, and the Steel Recycling Institute (affiliated with AISI). See www.cleancarcampaign.org/partnership.shtml.
11 USGS Mineral Commodity Summaries. 2004. Iron and Steel Slag. Seehttp://minerals.usgs.gov/minerals/pubs/commodity/iron_&_steel_ slag/festslmcs04.pdf.
12 U.S. Environmental Protection Agency. 2003. Toxics Release Inventory (TRI) Public Data Release: 2001, data freeze: March 7, 2003.
13 Ibid.14 Ibid.15 For additional information, please visit: www.climatevision.gov.16 January 8, 2004 Meeting with Jim Schultz, AISI, Bill Heenan, SRI, and
sector point-of contact.17 DOE OIT. 2001. Steel Industry Profile (above). Table: DOE OIT, Steel
– Industry of the Future. DOE/GO-102001-1159, page 2. See www.oit.doe.gov/steel/pdfs/steel_brochure.pdf.
18 AISI, press release, May 3, 2004. See www.steel.org/news/pr/2004/pr040503.asp.
19 For additional information about Climate VISION, please see: http://www.climatevision.gov/index.html.
20 Department of Energy. 2003. An Assessment of Energy, Waste, and Productivity Improvements for North Star Steel Iowa, Subcontract No. 4000013389.See www.oit.doe.gov/bestpractices/factsheets/north_star_steel.pdf. Electronic correspondence from Chris Avent and John Skelley, North Star Steel, to Tom Tyler, US EPA, April 2004.
21 “Jersey Shore Powers Reheat Furnace with Landfill Gas.” Iron Age - New Steel. August 2001. See www.newsteel.com/articles/2001/August/NSX0108f3.htm.
22 Estimate based upon information from trade associations, literature searches, web searches, and information provided by listing services and on company websites.
23 For more information on each Performance Track Partner and their commitments and achievements, see www.epa.gov/performancetrack/particip/index.htm.
METAL CASTING1 U.S. Census Bureau. 2001. County Business Pattern. For the number of
employees and number of establishments. See http://www.census.gov/epcd/cbp/view/cbpview.html. U.S. Census Bureau. 2001. Statistics for Industry Groups and Industries,Annual Survey of Manufactures. For value of shipments. See http://www.census.gov/prod/2003pubs/m01as-1.pdf.
2 Standard Industrial Classification (SIC) codes used to define the economic activities of the industries or business establishments in this sector: 3321, 3322, 3324, 3325, 3363 - 3366, and 3369. Corresponding North American Industry Classification System (NAICS) codes: 331511 - 331513, 331521, 331522, 331524, 331525, and 331528.
3 American Foundry Society. 2002. 2003 Metal Casting Forecast and Trends.
4 The North American Die Casting Association (NADCA). See http://www.diecasting.org/.
5 American Foundry Society (AFS). See http://www.afsinc.org/.
6 U.S. Department of Energy, Industrial Technologies Program. Metal Casting Industry Research and Development Portfolio. See http://www.oit.doe.gov/metalcast/profile.shtml.
7 U.S. Department of Energy, Industrial Technologies Program. See http://www.eere.energy.gov/industry/technologies/industries.html.
8 Cast Metal Coalition of the American Foundrymen’s Society, North American Die Casting Association, and Steel Founders’ Society of America. 1998. Metalcasting Industry Technology Roadmap. See http://www.oit.doe.gov/metalcast/pdfs/roadmap.pdf.
9 Ibid.10 Ibid.11 Ibid.12 U.S. Environmental Protection Agency. 2003. 2001 TRI Public Data
Release, data freeze: March 7, 2003. Includes facilities listing SIC Code 332 and 336 as their primary activity on their Form R.
13 Foundry Industry Recycling Starts Today (FIRST). See htttp://www.foundryrecycling.org/aboutfirst.html.
14 Wisconsin Department of Natural Resources Bureau of Waste Management. 2002. Beneficial Use of Industrial Byproducts, 2000 UsageSummary. See http://www.dnr.wi.gov/org/aw/wm/publications/ beneficial/beneficialuse2000report.pdf.
15 U.S. Environmental Protection Agency, Sector Strategies Division. 2002. Beneficial Reuse of Foundry Sand: A Review of State Practices and Regulations.
16 Lenahan, Michael, President, Resource Recovery Corporation. 2004. Conversation with and email from the EPA sector point-of-contact, February 4, 2004.
17 Kennedy, Paul, Vice President, Kennedy Die Castings, Inc. 2004. Conversation with EPA sector point-of-contact, February 17, 2004.
18 U.S. Environmental Protection Agency. 2003. 2001 TRI Public Data Release, data freeze: March 7, 2003. Includes facilities listing SIC Codes 332 and 336 as their primary activity on their Form R for regulated HAPs.
19 Environmental Management Systems: Systematically Improving your Performance. See http://www.epa.gov/sectors/metalcasting/metcast_pdf/ metcast_bizcase.pdf.
20 Performance Track Network Partner list is available at: http://www.epa.gov/performancetrack/particip/trade.htm.
21 Performance Track Annual Performance Report for Chicago White MetalCasting, Inc, Year 2, 2002. See https://yosemite.epa.gov/opei/ptrack.nsf/ vAPRViewPrintView/BAF7C6D98AE345E285256DB8004FFDAA.
22 Treiber, Eric, Vice President, Chicago White Metal Casting, Inc. 2004. Conversation with sector point-of contact, February 9, 2004.
METAL FINISHING1 U.S. Census Bureau. 2001. County Business Patterns. For the number of
employees and number of establishments. See http://www.census.gov/epcd/cbp/view/cbpview.html. U.S. Census Bureau. 2001. Statistics for Industry Groups and Industries, Annual Survey of Manufactures. For value of shipments. See http://www.census.gov/prod/2003pubs/m01as-1.pdf.
2 Standard Industrial Classification (SIC) code used to define the economicactivities of the industries or business establishments in this sector: 3471, and the corresponding North American Industry Classification System (NAICS) code: 332813.
3 U.S. Environmental Protection Agency. 1995. Profile of the Fabricated Metal Products Industry. Pages 6-7.
4 Surface Finishing Market Research Board, Metal Finishing Industry Market Survey Report #8. 2004, Contact: Bill Rosenberg, Columbia Chemical Corporation, 3097 Interstate Parkway, Brunswick, OH 44212,330-225-3200. See http://www.columbiachemical.com.
Ap
pen
dix A
: En
dn
otes
54

E n d n o t e s
METAL FINISHING (continued)5 Partnerships: The American Electroplaters and Surface Finishers Society,
Inc. (AESF), http://www.aesf.org/.Metal Finishing Suppliers’ Association (MFSA) http://www.mfsa.org/.National Association of Metal Finishers (NAMF) http://www.namf.org/.Surface Finishing Industry Council (SFIC).
6 Strategic Goals Program (SGP). See http://www.strategicgoals.org. For a description of SGP goals, see http://www.strategicgoals.org/coregoals.cfm.
7 Ibid. To view progress on pollution reduction, see http://www.strategicgoals.org/reports2/.
8 U.S. Environmetnal Protection Agency. 2001. TRI Public Data Release, freeze date: March 7, 2003. Includes facilities that report primary SIC code 3471 on their Form R.
9 Borst, Paul A. 1997. U.S. EPA, Office of Solid Waste, Recycling of Wastewater Treatment Sludges from Electroplating Operations, F006.
10 California Environmental Protection Agency. 2003. Cal/EPA Environmental Management System Project. Appendix B: Artistic Plating Company. See http://www.calepa.ca.gov/EMS/Publications/2003/ LegReport/.
11 Edginton, Ross. 2004. Personal interview, 30 March 2004. Contact information: East Side Plating, Inc., 8400 SE 26th Place, Portland, OR 97202, 503-654-3774, [email protected] or see: http://www.eastsideplating.com.
12 Promoting Environmental Management Systems. See http://www.epa.gov/sectors/metalfinishing/metfin_ems.html#bizcase.
13 Richter, Christian. 2004. Phone conversation, May 25, 2004. Washington representative for National Association of Metal Finishers (NAMF) and sector point-of-contact.
14 For more about Region 1 (New England) Corporate Sponsor Program, see http://www.epa.gov/region1/pr/2001/aug/010824.html.
15 National Environmental Performance Track Program. See http://www.epa.gov/performancetrack/index.htm. For more information about the 2002 Performance Track Annual Performance Report for New Hampshire Ball Bearings, Inc., see https://yosemite.epa.gov/opei/ ptrack.nsf/vAPRViewPrintView/5B510B9B608F432685256D3B006E57EE.
16 Delawder, Tim. 2004. Personal interview with sector point-of-contact, March 15, 2004. Contact information: SWD, Inc., 910 Stiles Avenue, Addison, IL 60101-4913, 630-543-3003, [email protected] or http://www.swdinc.com.
17 Imagineering Finishing Technologies. See http://www.strategicgoals.org/su14.cfm.
PAINT & COATINGS1 U.S. Census Bureau. 2001. County Business Patterns. For the number of
employees and number of establishments. See http://www.census.gov/epcd/cbp/view/cbpview.html. U.S. Census Bureau. 2001. Statistics for Industry Groups and Industries Annual Survey of Manufactures. For value of shipments. See http://www.census.gov/prod/2003pubs/m01as-1.pdf.
2 Standard Industrial Classification (SIC) code used to define the economic activities of the industries or business establishments in this sector: 2851, and the corresponding North American Industry Classification System (NAICS) code: 325510.
3 Darling, David, National Paint and Coatings Association. 2004. Electronic communication to EPA sector point-of-contact, May 26, 2004.
4 U.S. Environmental Protection Agency. 2003. Toxics Release Inventory (TRI) Public Data Release, data freeze: March 7, 2003.
5 U.S. EPA, National Emission Inventory (NEI), Emission Factor and Inventory Group, OAQPS, data received: April 2004.
Note: State and local emissions inventories are submitted to EPA onceevery three years (e.g., 1996 and 1999) for most of the point sources contained in NEI. EPA estimated emissions for any jurisdiction that did not submit an emissions inventory. Similarly, emissions for the years in between submissions were estimated by EPA. These estimates may not reflect changes in the industry, such as pollution prevention or compliance efforts. The 2002 inventory is scheduled for release in 2005.
6 U.S. Environmental Protection Agency. 2003. Toxics Release Inventory (TRI) Public Data Release, data freeze: March 7, 2003.
7 Product Stewardship Institute. 2004. Paint Product Stewardship: A Background Report for the National Dialogue on Paint Product Stewardship. University of Massachusetts: Cowell, MA.
8 National Paint and Coatings Association. 2001. Coatings Care: Manufacturing Management Implementation Guide – Environmental Management (Pollution Prevention / Waste Management) Washington, DC. Also see Coatings Care®: Providing for a Cleaner, Safer, Coatings Industry at http://www.paint.org/cc/index.cfm.
9 National Environmental Performance Track Network Partner list is available at: http://www.epa.gov/performancetrack/particip/trade.htm.
10 National Paint and Coatings Association. 2001. Coatings Care: Manufacturing Management Implementation Guide – Environmental Management (Pollution Prevention / Waste Management), Washington, DC. Also see: Coatings Care®: Providing for a Cleaner, Safer, Coatings Industry at: http://www.paint.org/cc/index.cfm.
11 Darling, David, National Paint and Coatings Association. 2004. Electronic communication to EPA sector point-of-contact, February 6, 2004.
PORTS1 Chase, Tom, Director of Environmental Affairs, American Association of
Port Authorities. 2004. Personal interview, January 2004.2 U.S. Census Bureau. 2001. County Business Patterns. For the number of
employees and number of establishments . See http://www.census.gov/epcd/cbp/view/cbpview.html. U.S. Census Bureau. 1997. Economic Census. For value of shipments. See http://www.census.gov/epcd/cbp/view/cbpview.html.
3 Standard Industrial Classification (SIC) code used to define the economicactivities of the industries or business establishments in this sector: 4491, and the corresponding North American Industry Classification System (NAICS) codes: 48831 and 48832.
4 U.S. Army Corps of Engineers Navigation Data Center, Waterborne Commerce Statistics Center. 2002. Waterborne Commerce of the United States. Accessed January, 2004. www.iwr.usace.army.mil/ndc/wcsc/wcsc.htm.
5 American Association of Port Authorities. 2004. U.S. Public Port Facts. Accessed May 2004. http://www.aapa-ports.org/industryinfo/portfact.htm.
6 U.S. Department of Transportation, Maritime Administration, Office of Ports and Domestic Shipping. October 1998. A Report to Congress on the Status of the Public Ports of the United States 1996-1997.
7 Chase, Tom, Director of Environmental Affairs, American Association of Port Authorities. 2004. Personal interview, January 2004.
8 American Association of Port Authorities (AAPA). See http://www.aapa-ports.org/.
9 Hopson, Coleen, Project Manager, Port Authority of New York and New Jersey. 2004. Telephone interview with Abt Associates, Inc., January 28, 2004.
10 Parsche, Dave, Director of Environmental Affairs, Port of Tampa. 2004. Telephone interview with Abt Associates, Inc., January 26, 2004.
11 Environmental Technology Program. See http://www.epa.gov/etv/index.html.

PORTS (continued)12 Port of Portland, Environment. Fall 2003. Natural Resource Assessment
and Management Program. Accessed January 2004. http://www.portofportland.com/SelfPost/A_20031251016551003NRAMP.pdf.
13 For additional information on the Sector Strategies Program with AAPA, see http://www.epa.gov/sectors/ports/index.html.
14 Fiffick, Laura, Environmental Affairs Manager, Port of Houston Authority. 2004. Telephone interview with Abt Associates, Inc., February 25, 2004. See http://www.portofhouston.com/publicrelations/environment.html.
15 Wetherall, Catherine, Chief of Environmental Management, and Jennifer Newcombe, Environmental Project Manager, Massport. 2004. Telephone interview with Abt Associates, Inc., January 29, 2004. See http://www.massport.com/business/envir.html.
SHIPBUILDING & SHIP REPAIR1 U.S. Census Bureau. 2001. County Business Patterns. For the number of
employees and number of facilities. Available at: http://www.census.gov/epcd/cbp/view/cbpview.html. U.S. Census Bureau. 2001. Statistics for Industry Groups and Industries, Annual Survey of Manufactures, for value of shipments, available at: http://www.census.gov/prod/2003pubs/m01as-1.pdf.
2 Standard Industrial Classification (SIC) code used to define the economic activities of the industries or business establishments in this sector: 3731, and the corresponding North American Industry Classification System (NAICS) code: 336611.
3 U.S. Environmental Protection Agency. 1997. Profile of the Shipbuilding and Repair Industry. P. 7.
4 “The Report on Survey of U.S. Shipbuilding and Repair Facilities”. The Maritime Administration, 2003.
5 Ibid.6 American Shipbuilding Association (ASA). See http://
www.americanshipbuilding.com. Shipbuilders Council of America (SCA). See http://www.shipbuilders.org/.
7 U.S. Environmental Protection Agency. 2003. Toxics Release Inventory (TRI) Public Data Release: 2001, data freeze: March 7, 2003.
8 Killeen, Patrick, Manager, Environmental, Health and Safety, Signal International. 2004. Telephone interview with Dana Austin, Austin Environmental, January 30, 2004.
9 The National Shipbuilding Research Program. See http://www.nsrp.org/.10 Dickinson, Vince, Environmental Manager, Bath Iron Works. 2003.
Telephone interview with Stefanie Shull, ICF Consulting, June 5, 2003. 11 The National Shipbuilding Research Program.
See http://www.nsrp.org/, document ASE 006000.12 U.S. Environmental Protection Agency, Emission Factor & Inventory
Group. 2004. Received data from Tom McMullen, received April 2004.
Note: State and local emissions inventories are submitted to EPA once every three years (e.g., 1996 and 1999) for most of the point sources contained in NEI. EPA estimated emissions for any jurisdiction that did not submit an emissions inventory. Similarly, emissions for the years in between submissions were estimated by EPA. These estimates may not reflect changes in the industry, such as pollution prevention or compliance efforts. The 2002 inventory is scheduled for release in 2005.
13 U.S. Environmental Protection Agency. 2003. Toxics Release Inventory (TRI) Public Data Release: 2001, data freeze: March 7, 2003.
14 Sector Strategies Program, Shipyard Stormwater BMP Project, sector point-of-contact Shana Harbour - [email protected].
15 Sector Strategies Program EMS Implementation Guide for Shipbuilding Facilities. See http://www.epa.gov/sectors/shipbuilding/ship_ems.html#ems.
16 Dickinson, Vince, Environmental Manager, Bath Iron Works. 3003. Telephone interview with Stefanie Shull, ICF Consulting, June 5, 2003.
17 Morris, Jackie, Bender Shipbuilding & Repair Co. 2003. Telephone interview with Stefanie Shull, ICF Consulting, June 4, 2003.
18 Chee, Mike, Environmental Department Manager, NASSCO. 2002. Telephone interview with Will Gibson, ICF Consulting & Dana Austen, Austen Environmental, Summer of 2002.
SPECIALTY-BATCH CHEMICALS1 Facility, employee and value of shipment numbers from Synthetic
Organic Chemical Manufacturers Association (SOCMA), 2002, please visit web site for additional information: http://www.socma.com/about/index.htm
2 Due to overlapping operations, it is difficult to identify specific specialty batch facilities from the larger universe within chemical manufacturing – SIC 28. The Standard Industrial Classification (SIC) code used to define the economic activities of the industries or business establishments in SIC28 correspond to North American Industry Classification System (NAICS) codes: 325110, 325120, 325131, 325132, 325181, 325182, 325188, 325191, 325192, 325193, 325199, 325211, 325212, 325221, 325222, 325311, 325312, 325314, 325320, 325411, 325412, 325413, 325414, 325510, 325520, 325611, 325612, 325613, 325620, 325910, 325920, 325991, 325992, and 325998.
3 Principal Findings: The U.S. Specialty Batch Chemical Industry, Draft Report, February, 2000, pg. 4; available at: http://www.epa.gov/sectors/sbchemical/sb_pdf/sbchem_ PrincipalFindings.pdf
4 Ibid.5 Responsible Care® Management System (RCMS), information available
at: http://www.socma.com/ResponsibleCare/rcms.htm6 Responsible Care metrics are available at:
http://www.socma.com/PDFfiles/responsible_care/Metrics_Table.pdf7 Melissa Hockstead, SOCMA, Responsible Care, e-mail communication
with sector point-of-contact on April 29, 2004.8 Performance Track Network Partner list is available at:
http://www.epa.gov/performancetrack/particip/trade.htm9 EMS Implementation Guide for the specialty-batch chemicals is available
at: http://www.epa.gov/sectors/sbchemical/sb_ems.html10 Performance Track Annual Performance Report for Baker
Petrolite - Rayne Blend Plant, Year 2, 2002, available at: https://yosemite.epa.gov/opei/ptrack.nsf/vAPRViewPrintView/ FC81E1FD39CE946F85256DB4006F0640; also see Baker Petrolite application at: http://www.epa.gov/performancetrack/apps/pdfs/A06-0016.pdf
11 2001 TRI Public Data Release (PDR), data freeze: March 7, 2003, and includes facilities that report primary SIC code 28 on their Form R.
Ap
pen
dix A
: En
dn
otes
56

Environmental Data Sources
DATA SOURCE: Toxics Release Inventory (TRI)
Environmental Impact Indicators: Chemical releases, waste managed on- and off-site of toxic chemicals.
Period Analyzed for Trends: 1993-2001
Next Data Release: In 2004 for 2002 data
Partner sectors presenting data:* Agribusiness * Forest Products* Iron & Steel * Metal Casting * Metal Finishing * Paint & Coatings * Shipbuilding & Ship Repair* Specialty-Batch Chemicals
Data Source Description: The Toxics Release Inventory (TRI) was established under the Emergency Planning and CommunityRight-to-Know Act (EPCRA) of 1986 and expanded by thePollution Prevention Act of 1990. Following expansions of thereporting requirements in the past ten years, TRI now includesfacilities with 10 or more employees in the manufacturing sectors(SIC code 20 - 39); federal facilities; metal mines; coal mines; electrical utilities that combust coal or oil; commercial hazardouswaste treatment facilities; chemical wholesalers; petroleum bulk terminals and plants; and solvent recovery services who use,process, or manufacture more than a threshold amount of over 600 toxic chemicals. Facilities must report to TRI if they exceed the reporting threshold for manufacture or process (>25,000 lbs),or for otherwise use (>10,000 lbs). Reporting thresholds for persistent bioaccumulative toxic chemicals (PBTs) are lower. In2001, 22,359 facilities filed a Form R, reporting a total of 6.2 billion pounds of on- and off-site releases and 26.7 billion poundsof releases and on- and off-site waste management to TRI.
Data Source Considerations: Several aspects of TRI influence the use of these data for EPA’s Sector Strategies Program.
■ Small businesses not included: TRI excludes smaller facilities, those with fewer than 10 employees. However, for any given sector, this source does include larger facilities, which can be expected to have greater environmental impacts.
■ Toxicity: TRI releases and waste management activities are reported in absolute pounds. This does not take into account relative toxicity of a chemical. For example, a pound of a substance like mercury is more toxic than methanol. A facilities’ progress in reducing higher toxicity substances does not receive credit when trend analyses are presented for cumulative pounds. Several EPA tools are available to translate TRI pounds to toxicity-weighted values. This tool may be applied in future Reports.
■ Data accuracy: Data are reported by individual facilities, making TRI the most reliable data source available for chemical releases and waste management practices. On the other hand, data quality may suffer from changes in personnel, misunderstanding of the TRI data elements, or other sources of error. However, sources of error are being reduced with dissemination of reporting guidance, on-site data quality reviews, enforcement actions, improved reporting software, and TRI training courses.
Data Processing Steps:
■ TRI data for reporting years 1993-2001 were provided by the TRI program (Office of Environmental Information) frozen asof March 7, 2003. The frozen data were used to ensure reproducibility and to support later revisions of the analysis. Documentation of TRI and the program can be found at http://www.epa.gov/tri.
■ Extracted data elements for this Report include: Hazardous Air Pollutant (HAP) Releases to Air - stack and fugitive emissions of listed HAPs to air as reported in sections 5.1 and 5.2 of the TRI Form R.
Releases - emissions to air, discharges to bodies of water, releases to land and into underground injection wells. This includes releases, spills, and remedial actions occurring at the facility (on-site) and off-site releases resulting from wastes transferred for disposal to waste management facilities as reported in sections8.1 and 8.8 of the TRI Form R.
Treatment - the quantity of chemicals destroyed in on- or off-site operations such as biological treatment, neutralization, incineration, and physical separation as reported in sections 8.6 and 8.7 of the TRI Form R.
Energy Recovery - the quantity of the toxic chemicals that was combusted in an energy recovery device, such as a boiler or industrial furnace. These amounts are reported in sections 8.2 and 8.3 of the TRI Form R.
Recycling - the quantity of the toxic chemical that was either recovered at the facility and made available for further use, or sent off-site for recycling and subsequently made available for use in commerce. These amounts are reported in sections 8.4 and 8.5 of the TRI Form R.
■ Sector assignments were based on the facility’s primary 4-digit SIC code reported on the Form R each year.
■ Annual sector releases and waste managed totals were normalized using the sector’s production, shipments, or value of shipments, with 1993 as the baseline year.
■ Units of weight were converted for presentation purposes.

DATA SOURCE: National Emission Inventory (NEI)
Environmental Impact Indicators: Annual emissions of specificcriteria air pollutants. Specific pollutants analyzed: Sulfur Dioxide;Nitrogen Oxides; Particulate Matter (<2.5 microns and <10microns); and Volatile Organic Compounds.
Period Analyzed for Trends: 1996-2001
Next Data Release: In 2005 for years 2002-2004
Partner sectors presenting data: * Cement * Paint & Coatings * Shipbuilding & Ship Repair
Data Source Description: EPA’s Emission Factor and InventoryGroup (EFIG) within the Office of Air and Radiation prepares anational database of the criteria air pollutant emissions based oninput from numerous state, tribal, and local air pollution controlagencies as well as industry-submitted data. State and local emissions inventories are submitted to EPA once every three yearsfor most point sources contained in NEI. Through the 1999 NEI,EPA estimated emissions for any jurisdiction that did not submitan emissions inventory. Similarly, prior to 1999 NEI includedemission projections for each intervening year based on year-to-yearchanges at the sector level. The emissions estimates maintained inNEI are in short tons per year.
Data Source Considerations: Several changes to NEI influencethe appropriate use of these data for EPA’s Sector StrategiesProgram.
■ Changes in NEI: EFIG does not recommend comparing NEI 1996 and later years to years prior to 1996 due to changes in their compilation and data filling methods.
■ Addition of PM2.5: In 1997, EPA’s Office of Air Quality Planning Standards established National Ambient Air Quality Standards for particulate matter less than 2.5 micrometers in diameter. As a consequence, NEI began to collect PM2.5 emissions estimates as of the 1999 inventory.
■ Improved methodology & regulatory amendments: As a result of the Consolidated Emissions Reporting rule, the NEI updates for 2002 and beyond are expected to include data uploads from all jurisdictions. If so, EFIG’s estimation of missing data emissions will not be necessary.
Data Processing Steps:
■ NEI data obtained from EFIG staff (04/01/2004) and Trends1970_2001_toCHIEF082803.xls. Documentation available at: http://www.epa.gov/ttn/chief/trends/.
■ Annual sector emission totals normalized using the sectors’ production or value of shipments with 1996 as the baseline year.
■ Units of weight were converted for presentation purposes.
■ Paint and Coatings sector presents data based on 1996 and 2001emission estimates.
■ Shipbuilding and Ship Repair sector presents 1996 through 1999 and 2001 emission estimates. 2000 data are currently being processed by EPA.
■ Cement sector presents 1999 through 2001 emission estimates. EPA projected 2000 emissions on inventories received in 1999 for the cement manufacturing sector.
Ap
pen
dix B
: En
vironm
ental D
ata Sources
58

Environmental Data Sources
DATA SOURCE: Effluent Data Statistics (EDS) System derivation of Permit Compliance System (PCS)
Environmental Impact Indicators: Annual direct wastewater discharges of Clean Water Act (CWA) conventional pollutants.Specific pollutants analyzed: Biochemical Oxygen Demand(BOD), Oil and Grease, and Total Suspended Solids (TSS).
Period Analyzed for Trends: 1994-2002
Next Data Release: In first quarter of 2005 for 2004 data
Partner sector presenting data: * Agribusiness
Data Source Description: Under the Clean Water Act, all facilitiesdischarging an aqueous waste stream directly into the waters of theUnited States are required to obtain a National Pollution DischargeElimination System (NPDES) permit. Indirect dischargers, facilitiesdischarging to a central treatment system (often called publiclyowned treatment works, POTWs), are not typically included inPCS. PCS tracks permit data for approximately 50,000 active facilities, 6,500 of which are major dischargers. The PCS program’sEffluent Data Statistics System process starts by extracting thereported DMR data that have been entered into PCS. These dataare then processed through a software program to add the flow datato each record. This allows loadings to be calculated using flow andconcentration whenever mass loading data have not been reportedfor a monitoring period. The effluent data are then converted intoPCS standard units since the data can be reported in various units.After the data have been converted, they are processed by the EDSroutines to calculate mass load totals.
Data Source Considerations: Limitations to PCS influence theuse of these data for EPA’s Sector Strategies Program.
■ Universe of reporting facilities: Major facilities with a NPDES permit are required to submit monthly discharge monitoring reports to EPA or the authorized state or Regional office a facility’s classification is based on several parameters, including amount of discharge per day, wastewater sources, and populationaffected by discharge). Minor facilities, however, are not required to submit these reports, although some states and Regional offices enter them anyway. Because inconsistencies in available data for minor facilities across states exist the trends analysis was limited to pollutant loadings from major NPDES permitted facilities.
Data Processing Steps:
■ Obtained EDS file from Office of Compliance’s Integrated Data for Enforcement Analysis (IDEA) system (12/12/2003 refresh). Contact U.S. EPA’s PCS program for further information.
■ Units of weight were converted for presentation purposes.
DATA SOURCE: Emissions of Greenhouse Gases in theUnited States Report
Environmental Impact Indicators: Annual emissions of carbondioxide equivalents.
Period Analyzed for Trends: 1993-2001
Next Data Release: Preliminary 2002 data available.
Partner sector presenting data: * Cement
Data Source Description: The Department of Energy’s (DOE)Energy Information Administration (EIA) annually compiles andupdates estimates for anthropogenic greenhouse gas emissions.Most greenhouse gases (GHGs) in the United States, including carbon dioxide, are emitted as the result of the combustion of fossil fuels. Global warming potentials (GWPs) are used to compare the abilities of different greenhouse gases to trap heat inthe atmosphere. GWPs are based on the radiative efficiency (heat-absorbing ability) of each gas relative to that of carbon dioxide (CO2), as well as the decay rate of each gas (the amountremoved from the atmosphere over a given number of years) relative to that of CO2. GHG emissions and energy use are highlycorrelated for most industry sectors. As a result, the Report develops emission estimates primarily from DOE’s databases onenergy use, the Manufacturing Energy Consumption Survey(MECS), and the Commercial Business Energy ConsumptionSurvey (CBECS). A number of industrial sectors, including cementmanufacturing, also emit ignificant quantities of GHGs from non-fuel combustion processes. For these sectors, which includejust one of the partner sectors (cement manufacturing), the Reportdoes include estimates of GHGs associated with non-fuel use.
Data Source Considerations: The methodology and level of dataaggregation used in the Report influence the data available forEPA’s Sector Strategies Program.
■ Availability of sector-level data: GHG emissions are presented bygeneral end use categories: residential, commercial, industrial, and transportation. GHG emissions are generally not available for individual industrial sectors with the exception of cement manufacture.
Data Processing Steps:
■ GHG data were retrieved from EIA’s Voluntary Reporting Program site at http://www.eia.doe.gov/oiaf/1605/1605a.html.
■ Annual emission totals were normalized using cement production with 1993 as the baseline year.

DATA SOURCE: U.S. and Canadian Labor-Energy InputSurvey: 2000 Survey (released March 2002), page 7, PortlandCement Association.
Environmental Impact Indicator: Energy consumed, in millionBtus per equivalent ton.
Partner sector presenting data: * Cement
DATA SOURCE: Cement Kiln Dust Surveys, memo:May 2004, Portland Cement Association.
Environmental Impact Indicator: Cement Kiln Dust managed,in metric tons.
Partner sector presenting data: * Cement
DATA SOURCE: Environmental Health and SafetyVerification Program Year 2000 Report: Issued 2002, AmericanForest & Paper Association.
Environmental Impact Indicators:
■ Nitrogen Oxide and Sulfur Dioxide emissions from pulp and paper mills, in pounds per ton of production;
■ Wastewater discharges (Biochemical Oxygen Demand, Total Suspended Solids, Absorbable Organic Halides) from pulp and paper mills, in pounds per ton of production; and
■ Percents of Waste managed (beneficially reused and landfilled, lagooned, or burned for disposal) by pulp and paper and wood products mills.
Partner sector presenting data: * Forest Products
Ap
pen
dix B
: En
vironm
ental D
ata Sources
60

United States Environmental Protection Agency
National Center for Environmental Innovation (1807T)
EPA 100-R-04-002
June 2004