sectoral report - ΕΤΕ - Αρχική Σελίδα · internationalization of tertiary education...
TRANSCRIPT

*
Leveraging on the booming global trend of students’ mobility and its traditional
strength in the production of educators – albeit many living abroad, Greece could be
transformed into a regional education hub.
The global environment is favorable, as there has been an impressive increase in
students’ global mobility over the past four decades (with the number of young people
traveling to another country in pursuit of higher education quintupling, to 4.5 million
students in 2014 from about 1.8 million in 1995 and 0.8 million in 1975).
Countries have benefited from this trend to different degrees. NBG Research has
constructed an Education Index to measure the global competitiveness of universities. Our
estimates suggest that the key determining factors are: the degree of university
independence, the quality of its professors, the level of R&D expenditure and the country’s
language.
Greece ranks low in the Education Index, mainly due to the limited independence of
its universities. Weak competitiveness is reflected in Greece’s low share in the global market
(0.7 per cent) – with the majority of foreign students enrolling either through bilateral
agreements (e.g. with Cyprus) or are children of immigrants (mainly from Albania).
Based on our estimates, a convergence to international standards could increase
inbound students in Greece to about 110,000 from 27,600 in 2015, comprising
(i) significant improvements in university independence and (ii) benefits from the large pool
of Greek academic diaspora (as 60 per cent of Greek professors are currently employed
abroad, compared with an EU average of 11 per cent). In particular, the following steps
could be considered:
Establish a coherent national strategy for higher education in order to foster
independence, results-based funding and international collaborations.
Introduce policies and incentives to attract the academic diaspora.
Foster the creation of Centers-of-Excellence around Greek universities (while
increasing R&D expenditure in higher education).
Combined with the curtailment of the current outflow of Greek students, the
aforementioned increase in international students could result in an annual inflow to the
Greek economy of about €1.8 bn, mainly due to higher exports and lower imports of
education services.
Apart from the direct effect of turning Greece into an education hub, such reforms
could transform the Greek growth model by improving its level of human capital, and
according to our estimates from the NBG Long-term Education-adjusted Growth Model,
could boost annual GDP growth by 1.1 percentage points in the first decade of the reform
(adding, ceteris paribus, more than €20 bn annually to the Greek GDP by the end of the
decade) and by 0.4 percentage points in the next three decades.
Importantly, the gradual improvement of the country’s business sophistication, in
conjunction with the improved education system, would produce synergies, and double the
growth generating effects. Also note that these calculations underestimate the total benefit,
as this transformation would probably attract investment – thus boosting growth further.
Economic Analysis Department Eolou 86, 10232 Athens, Greece
SECTORAL REPORT
May 2017 NATIONAL BANK
OF GREECE
Turning Greece into an Education hub
Paul Mylonas, PhD NBG Group +30 210-3341521, e-mail: [email protected]

NATIONAL BANK OF GREECE Sectoral Report May 2017 1
Research Coordinator:
Jessie Voumvaki, Senior Economist
+30 210 3341549
e-mail: [email protected]
Analysts:
Athanasia Koutouzou, Economist
+30 210 3341528
e-mail: [email protected]
Georgios Sakkas, Economist
+30 210 3341547
e-mail: [email protected]
In the midst of a prolonged recession, Greece urgently needs new
drivers for its economy. Moreover, recent international research
has identified that the negative impact of globalization on income
distribution in advanced economies can be offset through
increases in total factor productivity (TFP), which in turn requires,
inter alia, investment in education. Leveraging on the booming
global trend of students’ mobility and capitalizing on the academic
excellence of Greek diaspora, Greece could become a regional
education hub. Supported by a powerful reputation (dating back
to ancient Greece) for producing educators, Greece could attract
from abroad academic professors and university students -
boosting its exports of services as well as its medium-term
potential growth (through its transformation to a knowledge-
intensive economy).
In the following analysis, we examine the global framework for
higher education as well as Greece’s relative position. We focus on
the key factors that determine the attractiveness of universities on
a global scale, and derive estimates for the potential long-term
boost to the Greek economy in the event Greece enacts the
necessary reforms for becoming a regional education hub.
A. GLOBAL MARKET
Over the past four decades, there has been an astonishing
increase in students’ global mobility, as the number of young
people traveling to another country in pursuit of higher education
has quintupled, to 4.5 million students in 2015 from about 1.8
million in 1995 and 0.8 million in 1975 (corresponding to 0.06 per
cent of the global population in 2015 versus 0.02 per cent in 1975).
According to the Institute of International Education1, this trend is
expected to strengthen in the future, with the number of
international students projected to reach 8 million by 2025.
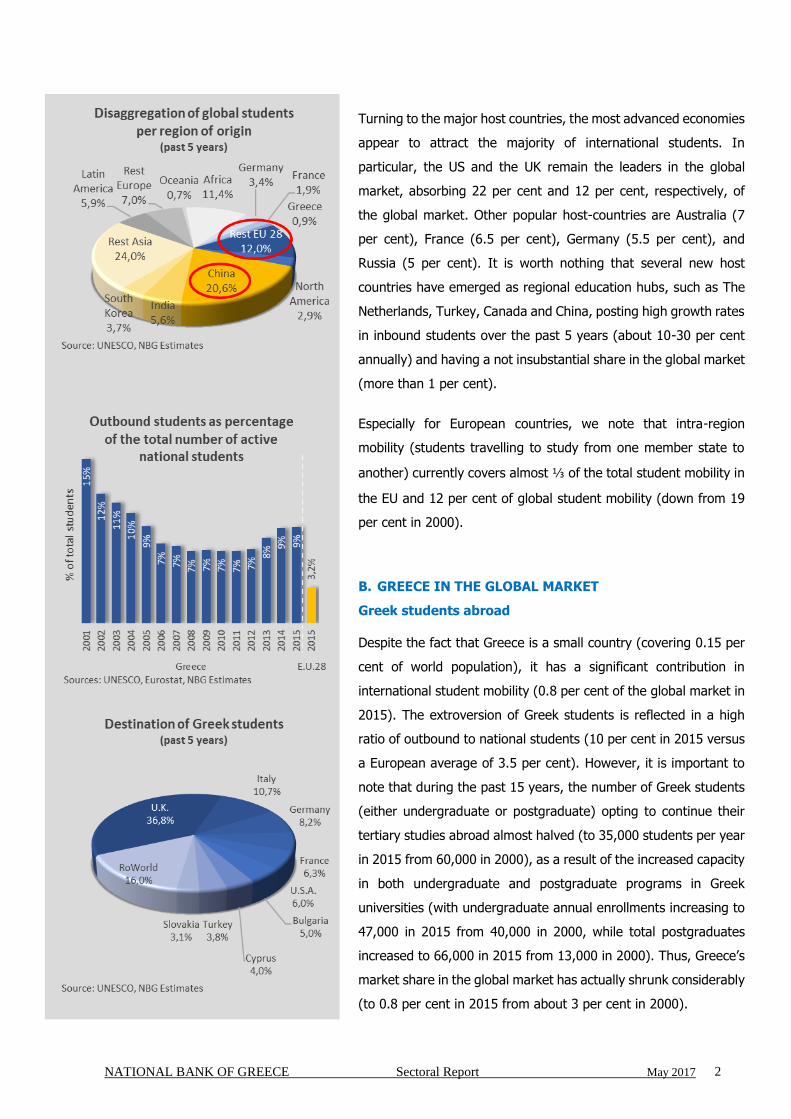
Asia has been a key driving force of student mobility, as it currently
provides ½ of the international students (compared with 40 per
cent in 2000), contributing 60 per cent of the increase during past
two decades (with ½ of this increase stemming from China).
1 “Project Atlas: A quick look at global mobility trends” (2015), Institute of International Education.
NATIONAL BANK OF GREECE Sectoral Report May 2017 2
Turning to the major host countries, the most advanced economies
appear to attract the majority of international students. In
particular, the US and the UK remain the leaders in the global
market, absorbing 22 per cent and 12 per cent, respectively, of
the global market. Other popular host-countries are Australia (7
per cent), France (6.5 per cent), Germany (5.5 per cent), and
Russia (5 per cent). It is worth nothing that several new host
countries have emerged as regional education hubs, such as The
Netherlands, Turkey, Canada and China, posting high growth rates
in inbound students over the past 5 years (about 10-30 per cent
annually) and having a not insubstantial share in the global market
(more than 1 per cent).
Especially for European countries, we note that intra-region
mobility (students travelling to study from one member state to
another) currently covers almost ⅓ of the total student mobility in
the EU and 12 per cent of global student mobility (down from 19
per cent in 2000).
B. GREECE IN THE GLOBAL MARKET
Greek students abroad
Despite the fact that Greece is a small country (covering 0.15 per
cent of world population), it has a significant contribution in
international student mobility (0.8 per cent of the global market in
2015). The extroversion of Greek students is reflected in a high
ratio of outbound to national students (10 per cent in 2015 versus
a European average of 3.5 per cent). However, it is important to
note that during the past 15 years, the number of Greek students
(either undergraduate or postgraduate) opting to continue their
tertiary studies abroad almost halved (to 35,000 students per year
in 2015 from 60,000 in 2000), as a result of the increased capacity
in both undergraduate and postgraduate programs in Greek
universities (with undergraduate annual enrollments increasing to
47,000 in 2015 from 40,000 in 2000, while total postgraduates
increased to 66,000 in 2015 from 13,000 in 2000). Thus, Greece’s
market share in the global market has actually shrunk considerably
(to 0.8 per cent in 2015 from about 3 per cent in 2000).

NATIONAL BANK OF GREECE Sectoral Report May 2017 3
EU countries host more than 85 per cent of Greek outbound
students, with the UK absorbing over ⅓ of Greek students abroad,
followed by Italy, Germany and France (with shares of 11 per cent,
8 per cent and 6 per cent, respectively).
Internationalization of tertiary education in Greece
Greek universities host a minor share of international students
globally (0.7 per cent, i.e. approximately 30,000 students).
Moreover, the majority of foreign students in Greece are enrolled
in the tuition-free undergraduate programs either through bilateral
country agreements (mainly with Cyprus) or are children of
immigrants (mainly from Albania) and Greek diaspora youths
(mainly from Germany). This fact reflects the low attractiveness of
Greek universities, which is further confirmed by:
the Global Universities Rankings (see BOX1), such as the
QS World University Ranking2 (QS) where Greece has an
average ranking of 590 in 2016, in a total of 900
universities worldwide (with six Greek universities
participating in the QS lists and only two in the top 500,
or 0.2 universities per million residents in the top 500,
compared with 0.4 on average in the EU), as well as
the relevant component of the Global Competitiveness
Index (WEF) according to which the quality of Greek
education and management schools is rated as 30 per cent
lower than the EU average.
C. THE COMPETITIVENESS OF GREEK UNIVERSITIES
The NBG model for universities’ global attractiveness
Data suggest that individual countries have benefited from the
global trend of rising students’ mobility depending on the
attractiveness of their universities. In fact, 50 countries appear to
attract 86 per cent of total international students (with the top 5
attracting 46 per cent). Standouts, with more than 10,000 foreign
students per 1 million residents are Australia and New Zealand. By
2 Other Global University Rankings such as the Times Higher Education World Ranking, the Shanghai Academic
Ranking of World Universities and the Center of World University Rankings (headquartered in the United Arab Emirates) show similar results, with 2 or 3 Greek universities in the top 500 lists.

NATIONAL BANK OF GREECE Sectoral Report May 2017 4
taking into account the size of each country, the US and Singapore
also stand out as notable host countries. On the other end of the
spectrum, with less than 100 foreign students per 1 million
residents are Brazil and China. In this context, Greece attracts
approximately 1,300 foreign students per 1 million residents
(excluding the special case of students from Cyprus3) – a ratio
significantly lower than the European average of 3,200 foreign
students per 1 million residents.
With a view to quantifying the determinants of universities’ global
attractiveness, we have constructed a cross-sectional model based
on a worldwide sample of 50 countries (attracting, as mentioned
above, 86 per cent of international students). Based on the
literature for education hubs4, we develop an econometric model
to estimate the level of inbound students per capita, based on
three factors defining the level of academic excellence of each
country’s universities:
The degree of university independence, as measured by
the degree of flexibility in key issues such as student
selection, staffing policy, budget autonomy, course
content as well as setting objectives and performance
evaluation.
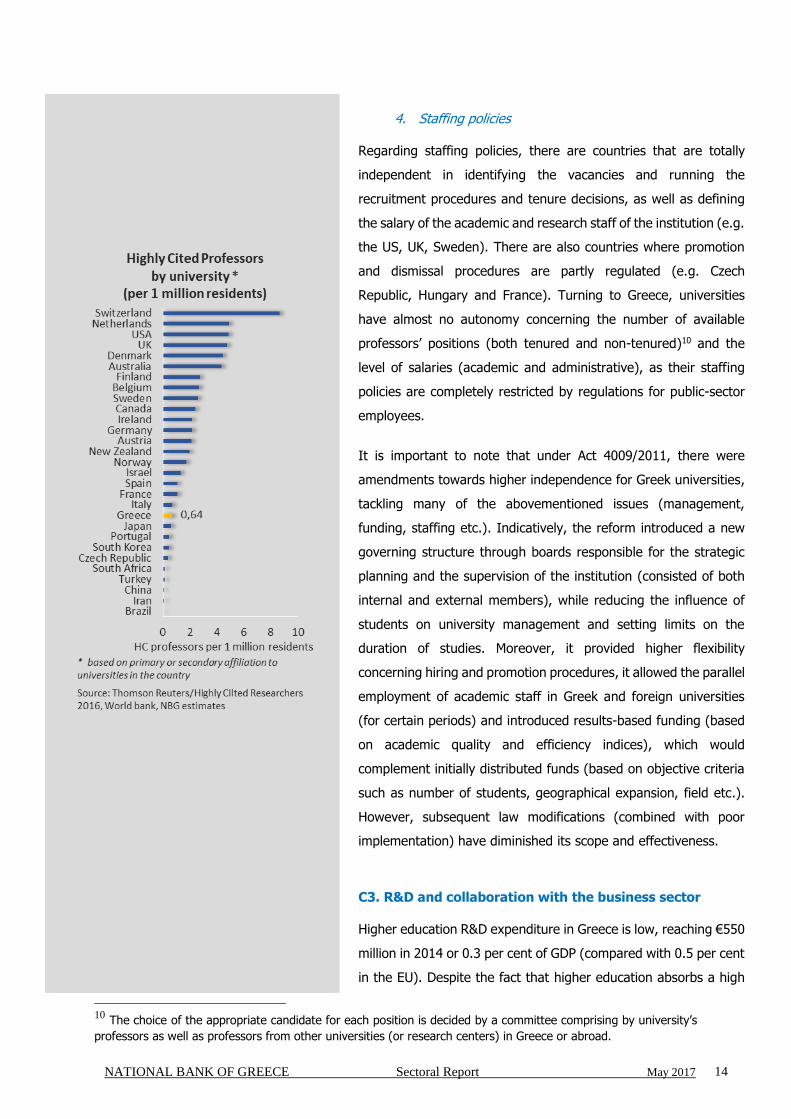
High quality teaching in universities, as measured by the
number of highly cited professors relative to the
population.
R&D in higher education (as a share of GDP).
Moreover, we have included a “language variable” since the
language in which courses are delivered is important, with English,
German and – to a lesser extent – French, being more attractive
to international students.
3 Students from Cyprus are not included in the model due to the strong link between Greece and Cyprus (along
with the common language), which is not often seen in other countries in the sample. 4 De Wit, H. (2013), “An introduction to higher education internationalization”, Center for Higher Education
Internationalization, Italy. De Wit, H., Egron-Polak, E., Howard, L., and Hunter F. (2015), “Internationalization of higher education”, European Parliament. Atbach, P. G., and Knight, J. (2007), “The internationalization of higher education: Motivations and realities”, Journal of Studies in International Education, 11 (3-4), 290-305. Horta, H. (2009), “Global and national prominent universities: Internationalization, competitiveness and the role of the state”, Higher Education, 58, 387-405.
NATIONAL BANK OF GREECE Sectoral Report May 2017 5
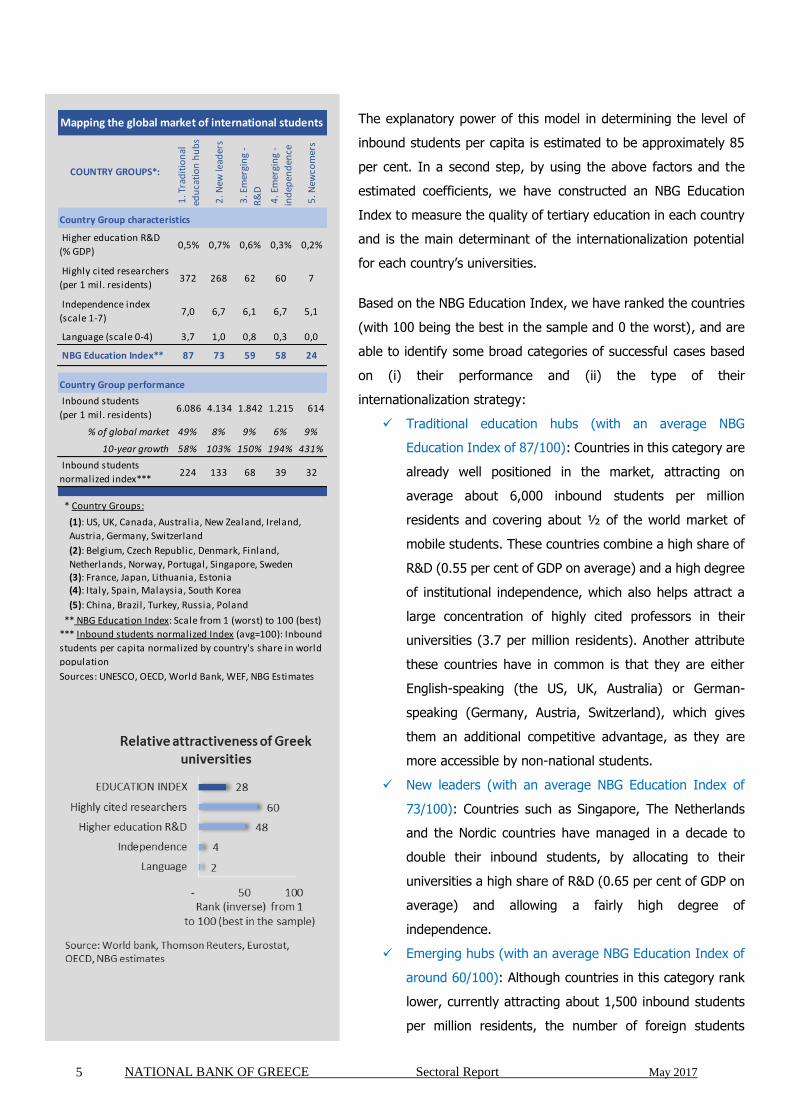
The explanatory power of this model in determining the level of
inbound students per capita is estimated to be approximately 85
per cent. In a second step, by using the above factors and the
estimated coefficients, we have constructed an NBG Education
Index to measure the quality of tertiary education in each country
and is the main determinant of the internationalization potential
for each country’s universities.
Based on the NBG Education Index, we have ranked the countries
(with 100 being the best in the sample and 0 the worst), and are
able to identify some broad categories of successful cases based
on (i) their performance and (ii) the type of their
internationalization strategy:
Traditional education hubs (with an average NBG
Education Index of 87/100): Countries in this category are
already well positioned in the market, attracting on
average about 6,000 inbound students per million
residents and covering about ½ of the world market of
mobile students. These countries combine a high share of
R&D (0.55 per cent of GDP on average) and a high degree
of institutional independence, which also helps attract a
large concentration of highly cited professors in their
universities (3.7 per million residents). Another attribute
these countries have in common is that they are either
English-speaking (the US, UK, Australia) or German-
speaking (Germany, Austria, Switzerland), which gives
them an additional competitive advantage, as they are
more accessible by non-national students.
New leaders (with an average NBG Education Index of
73/100): Countries such as Singapore, The Netherlands
and the Nordic countries have managed in a decade to
double their inbound students, by allocating to their
universities a high share of R&D (0.65 per cent of GDP on
average) and allowing a fairly high degree of
independence.
Emerging hubs (with an average NBG Education Index of
around 60/100): Although countries in this category rank
lower, currently attracting about 1,500 inbound students
per million residents, the number of foreign students
COUNTRY GROUPS*: 1
. Tra
dit
ion
al
edu
cati
on
hu
bs
2. N
ew le
ader
s
3. E
mer
gin
g -
R&
D
4. E
mer
gin
g -
ind
epen
den
ce
5. N
ewco
mer
s
Country Group characteristics
Higher education R&D
(% GDP) 0,5% 0,7% 0,6% 0,3% 0,2%
Highly cited researchers
(per 1 mil. residents) 372 268 62 60 7
Independence index
(scale 1-7) 7,0 6,7 6,1 6,7 5,1
Language (scale 0-4) 3,7 1,0 0,8 0,3 0,0
NBG Education Index** 87 73 59 58 24
Country Group performance
Inbound students
(per 1 mil. residents) 6.086 4.134 1.842 1.215 614
% of global market 49% 8% 9% 6% 9%
10-year growth 58% 103% 150% 194% 431%
Inbound students
normalized index*** 224 133 68 39 32
* Country Groups:
Sources: UNESCO, OECD, World Bank, WEF, NBG Estimates
(3): France, Japan, Lithuania, Estonia(4): Italy, Spain, Malaysia, South Korea
(5): China, Brazil, Turkey, Russia, Poland
Mapping the global market of international students
** NBG Education Index: Scale from 1 (worst) to 100 (best)
*** Inbound students normalized Index (avg=100): Inbound
students per capita normalized by country's share in world
population
(1): US, UK, Canada, Australia, New Zealand, Ireland,
Austria, Germany, Switzerland
(2): Belgium, Czech Republic, Denmark, Finland,
Netherlands, Norway, Portugal, Singapore, Sweden
NATIONAL BANK OF GREECE Sectoral Report May 2017 6
increased by 150 per cent on average during the past
decade (compared with 60 per cent for the traditional
education hubs). They have no extraordinary advantages
in terms of language or highly cited professors, however,
they appear to follow more targeted strategies, focusing
either on: i) R&D, such as Japan, France and Estonia or ii)
institutional independence, such as Italy, Spain and South
Korea.
Newcomers (with an average NBG Education Index of
24/100): Finally, countries such as China, Russia and
Turkey have recently gained market share, with significant
average growth of about 430 per cent during the past
decade. However, they are still relatively weak in terms of
R&D, professors and independence. They currently attract
just 600 inbound students per million residents on
average.
In this global environment, Greece ranks low – exhibiting an NBG
Education Index of 28/100 and a weak – compared with the
newcomers – growth rate during the past decade (of 120 per cent
versus 430 per cent for the newcomers). The main weakness in
Greek universities appears to be their low independence (one of
the lowest in the examined sample). Greek universities rank higher
in terms of R&D in higher education and quality of professors
(exhibiting a median performance).
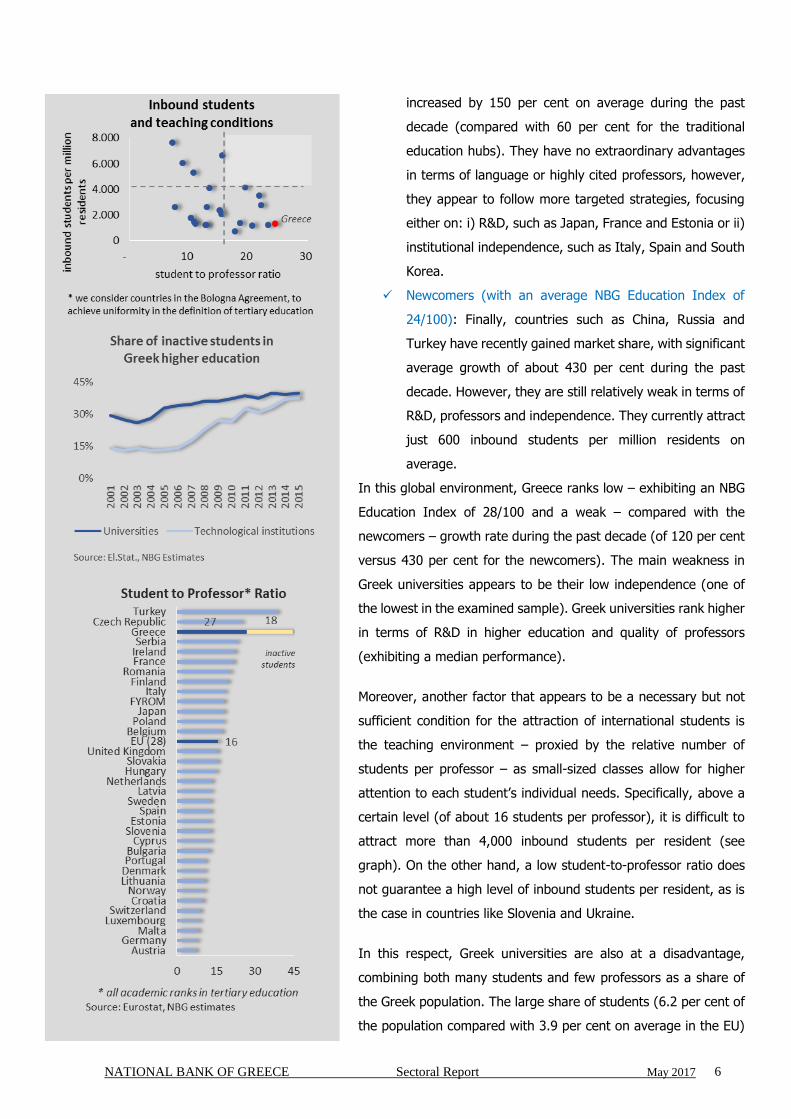
Moreover, another factor that appears to be a necessary but not
sufficient condition for the attraction of international students is
the teaching environment – proxied by the relative number of
students per professor – as small-sized classes allow for higher
attention to each student’s individual needs. Specifically, above a
certain level (of about 16 students per professor), it is difficult to
attract more than 4,000 inbound students per resident (see
graph). On the other hand, a low student-to-professor ratio does
not guarantee a high level of inbound students per resident, as is
the case in countries like Slovenia and Ukraine.
In this respect, Greek universities are also at a disadvantage,
combining both many students and few professors as a share of
the Greek population. The large share of students (6.2 per cent of
the population compared with 3.9 per cent on average in the EU)

NATIONAL BANK OF GREECE Sectoral Report May 2017 7
is mainly attributed to the high share of Greek students exceeding
the normal duration of studies by more than 2 years, with more
than 2/3 of them never obtaining a degree. This share of mostly
inactive students is estimated to cover about 40 per cent of tertiary
students (as proxied by students over 25 years old, which, to a
large extent, matches those exceeding the normal duration of
studies by more than 2 years, see BOX2). Combined with the low
share of professors in Greek universities (0.14 per cent of the
population compared with 0.25 per cent on average in the EU),
this leads to about 45 students of tertiary education being
attributed to each professor in Greek universities, compared with
16 students on average in the EU, and about 8 in countries like
Germany and Austria.
At this point, it should be noted that if we exclude the older –
mostly inactive - students, the share of Greek students to the
population is similar to the EU average (3.8 per cent versus 3.9
per cent). However, even excluding inactive students, the student-
to-professor ratio is still one of the highest in the EU (27 students
per professor versus an EU average of 16 students).
In the following sections, we will focus on the three factors of the
NBG Education Index and try to determine the reasons that hold
back Greek higher education. Specifically, we will explore:
C1. Greek professors and their share of working abroad
C2. The independence of Greek universities
C3. R&D in tertiary education and the degree of collaboration
with the business sector
C1. Greek professors
A positive externality of the Greek students’ outflow is the creation
of a large number of Greek professors working abroad (about 22
thousand) – covering 0.2 per cent of the Greek population
compared with 0.03 per cent on average in the EU. Therefore,
although there is a high share of professors who are Greek
nationals (20 per cent higher than the EU average, i.e. 0.34 per
cent versus 0.28 per cent), the majority is employed abroad (60
per cent versus 11 per cent on average for the EU countries).
Specifically, countries with a high share of their students educated
in the US and UK universities (mainly Greece, Cyprus and Ireland),

NATIONAL BANK OF GREECE Sectoral Report May 2017 8
also exhibit a high share of their country’s professors working
abroad.
This development is further reinforced by (i) the historically high
Greek immigration rate (see BOX 3), as well as (ii) the recent
increase of international academic mobility. In particular, based on
several surveys5, the main reasons for the increased academic
mobility appear to be the research environment, proximity to other
top professors, quality of teaching, as well as the level and
flexibility of research funding. The main beneficiary of this
development is the US - hosting 66 per cent of highly cited
professors, of which only 43 per cent were born there, while the
remainder (23 per cent) is a net academic inflow to the country.
European countries that are considered competitive in this respect
are Switzerland, Germany, Denmark and parts of the UK.
At this point, it is important to point out that, as the majority of
Greek professors abroad have been educated abroad in prestigious
universities, their academic quality is high. In fact, about 0.1 per
cent of Greek professors working abroad are highly cited (based
on the relevant annual list6 of Highly Cited Researchers by Clarivate
Analytics – formerly by Thomson Reuters) – a share that is
equivalent to the EU average and double the share of professors
working in Greek universities (0.05 per cent).
Looking at the other side of the coin, the professors in Greek
universities are relatively few (15 thousand), as they cover just
0.14 per cent of the population compared with 0.25 per cent on
average in the EU (and about 0.19 per cent globally). Moreover,
the existing pool of professors in Greek universities has lower
resources to support their research, with about only 0.05 per cent
being highly cited, compared with 0.09 per cent on average in the
EU. On the same note, professors have less incentive to be
employed in Greek universities as the average gross professor
wage in Greece is about 35 per cent lower than the EU average
5 Source: DG for Internal Policies – Policy department A: Economic and scientific policy, “The attractiveness of the
EU for top scientists”, June 2012 6 This is an annual list recognizing leading researchers from around the world, based on articles and citations
derived from a pool of about 11,855 science and social sciences journals (grouped in 22 research fields) indexed in the Web of Science Core Collection (Essential Science Indicators (ESI) database of Clarivate Analytics - formerly the IP&S business of Thomson Reuters). The list of about 3,000 Highly Cited Researchers in 2016 is based on the number of Highly Cited Papers produced during 2004-2014 (focusing on recent research achievement), meaning papers ranking in the top 1% of citations for each field and publication year. There are about 27 Greeks on the list of Highly Cited Researchers with just 6 of them affiliated with a Greek university.

NATIONAL BANK OF GREECE Sectoral Report May 2017 9
(and 50 per cent lower than countries like the US and the UK),
mainly reflecting the lower level of average wage in the country
(as professors are paid double the average employee in Greece,
compared with 2.2 times higher in the EU).
C2. Greek universities’ independence
According to the Greek Constitution, higher education is
considered a public good – i.e. the state has the exclusive right to
establish institutions as well as the obligation to cover their
financial needs via the government’s budget. Specifically, while
higher education institutions are self-governed private law entities,
they experience the strict control of the government, as the
Ministry of Education is responsible for many aspects of the
universities’ operation (e.g. hiring and payroll of the academic and
the administrative staff, funding).
As access to higher education has been used as a political issue,
currently almost all students that take part in the Pan-Hellenic
entrance exams succeed in enrolling in tertiary education
(although usually not in the field study of their first choice). This
development is reflected in low graduation rates7 (27 per cent in
Greece, versus an OECD average of 42 per cent) and it reinforces
the stock of older mostly inactive students exceeding the normal
duration of studies (about 40 per cent of total students as
mentioned earlier). Under the combination of these forces, Greece
exhibits a high ratio of students per capita (6.2 per cent of
population vs a European average of 3.9 per cent).
Meanwhile, the political system for reasons of regional economic
development created numerous small departments in small
municipalities all over the country. Specifically, the Greek tertiary
education system currently consists of 24 Universities and 16
Technological Institutions, which include about 500 departments.
With the scattering of educational institutions not based on
academic criteria, the current system is characterized by:
7 Defined as the number of graduates as a percentage of the population at the theoretical graduation age
(Source: UNESCO).
NATIONAL BANK OF GREECE Sectoral Report May 2017 10
high inefficiency in terms of allocation of human and
financial resources (e.g. many small departments located
in municipalities separated from the main campus),
overlapping of curricula), and most importantly,
low independence of universities in decisions regarding
students and faculty selection, funding and organizational
matters.
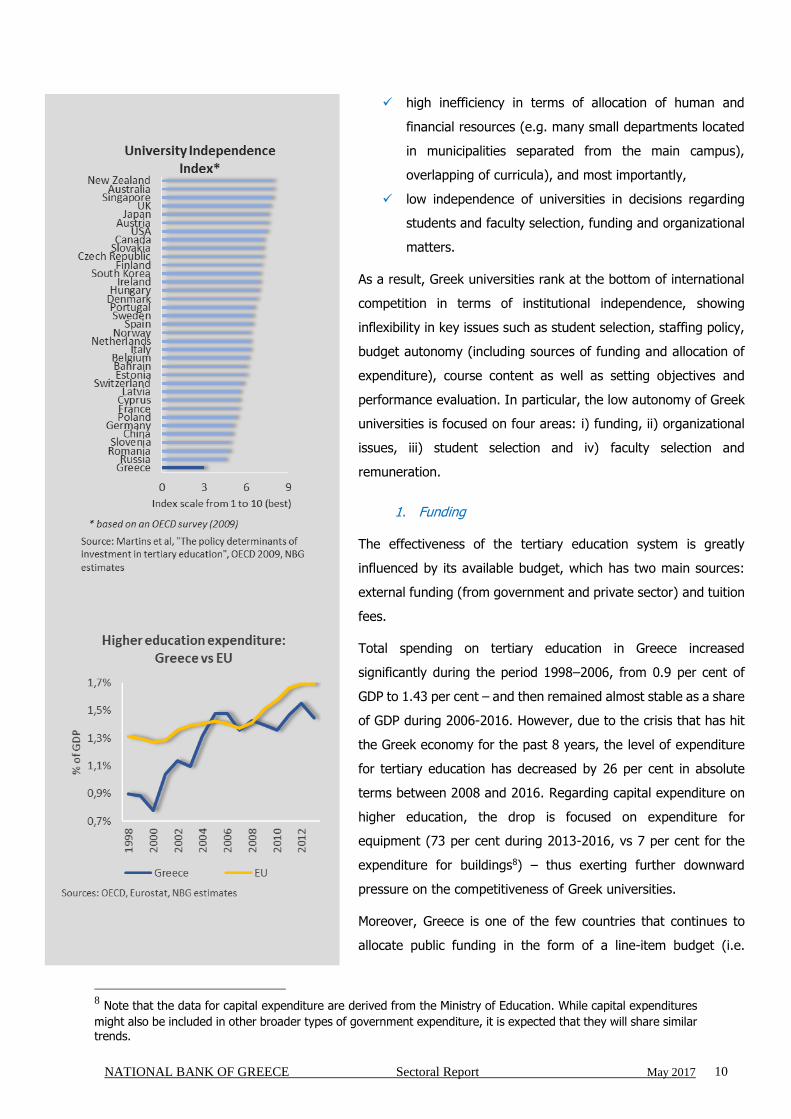
As a result, Greek universities rank at the bottom of international
competition in terms of institutional independence, showing
inflexibility in key issues such as student selection, staffing policy,
budget autonomy (including sources of funding and allocation of
expenditure), course content as well as setting objectives and
performance evaluation. In particular, the low autonomy of Greek
universities is focused on four areas: i) funding, ii) organizational
issues, iii) student selection and iv) faculty selection and
remuneration.
1. Funding
The effectiveness of the tertiary education system is greatly
influenced by its available budget, which has two main sources:
external funding (from government and private sector) and tuition
fees.
Total spending on tertiary education in Greece increased
significantly during the period 1998–2006, from 0.9 per cent of
GDP to 1.43 per cent – and then remained almost stable as a share
of GDP during 2006-2016. However, due to the crisis that has hit
the Greek economy for the past 8 years, the level of expenditure
for tertiary education has decreased by 26 per cent in absolute
terms between 2008 and 2016. Regarding capital expenditure on
higher education, the drop is focused on expenditure for
equipment (73 per cent during 2013-2016, vs 7 per cent for the
expenditure for buildings8) – thus exerting further downward
pressure on the competitiveness of Greek universities.
Moreover, Greece is one of the few countries that continues to
allocate public funding in the form of a line-item budget (i.e.
8 Note that the data for capital expenditure are derived from the Ministry of Education. While capital expenditures
might also be included in other broader types of government expenditure, it is expected that they will share similar trends.

NATIONAL BANK OF GREECE Sectoral Report May 2017 11
explicitly outlining the exact items on which money will be spent,
instead of block grants which can be freely managed and allocated
by the universities), introducing extensive micromanagement of
the universities by external bodies. In addition, highly bureaucratic
procedures hold back the absorption of available funds, especially
for investment purposes.
We note that while government spending remains above the EU
average (1.36 per cent on average during 2006-2014 compared
with 1.2 per cent in the EU), the participation of the private sector
in university funding in Greece is still significantly lower than the
EU average (0.09 per cent of GDP against 0.45 per cent in the EU).
In fact, tuition fees have a small contribution in higher education
funding in Greece, since they only concern post-graduate studies,
while undergraduate studies are tuition-free (while in most EU
undergraduate programs there are – usually low – tuition fees).
Therefore, the total expenditure in Greece remains slightly lower
than the EU average (1.5 per cent of GDP versus 1.7 per cent in
EU) and its level has decreased by 24 per cent during 2008-2013
(compared with an increase of 25 cent in the EU).
The relatively low total expenditure in higher education, combined
with the large number of students (with almost 40 per cent being
practically inactive), result in per student expenditure much less
than the EU average (€4,628 in PPP terms per student versus
€12,424 in EU). In fact, even if we exclude inactive students, the
expenditure per student remains considerably lower than the EU
average (€7,531 per student – remaining around its pre-crisis level
as the decrease in expenditure was counterbalanced by a decrease
of active students)9. The narrowing of this gap requires a
combination of measures in the direction of increasing the
available budget and lowering the number of students (mainly by
restricting the maximum duration of the studies and restricting the
entrance rate).
While the share of active students per capita in Greece is similar
to the EU (38 students per 1,000 residents compared with 39 in
9
During 2008-2014, the expenditure for tertiary education decreased by 6.7 per cent, while in the same period the
number of active students has shrunk by 6.0 per cent (as the students that exceeded the normal duration of their studies by less than 2 years – and thus are considered active – decreased by 30 per cent, while the first-time enrollments in each semester remained broadly stable).

NATIONAL BANK OF GREECE Sectoral Report May 2017 12
the EU), the fact that Greece has a lower GDP per capita compared
with the EU average creates constraints. A raise in higher
education funding to the EU level (1.69 per cent of the GDP) would
not be enough to close the gap of the expenditure per student.
Therefore, the Government would have to increase the total
funding to 2.39 per cent of GDP, so as to avoid reducing the
number of active students (by almost 30 per cent, to 27 per 1,000
residents from 38 currently) to reach the same level of per student
expenditure.
Alternatively, in the event there is no possibility of additional
government spending, higher education funding could increase by
allowing some scheme of needs-based tuition fees for
undergraduate studies which are now tuition-free, as well as
increasing business sector funding. Turning to international
practices in terms of tuition fees, we could classify countries into
two general categories.
In the first category, we classify countries such as the US,
UK and Australia, where students pay tuition fees for both
undergraduate and postgraduate programs. For social
reasons, the State provides a series of measures, such as
extended scholarship programs and bank loans on
favorable terms to financially support students. Tuitions in
public universities is subsidized and significantly lower
than for private universities, and even lower based on
residence criteria.
In most EU countries, there is a small private contribution
for attending undergraduate programs. Indicatively,
students in France and Portugal pay a small registration
fee. Some other European countries (Czech Republic,
Spain, Hungary, Austria, Poland and Slovakia) have
introduced tuition fees which are linked to the academic
performance of the students. In these countries, students
who do not achieve a certain goal (i.e. successful
completion of a minimum number of courses each year)
must pay tuition fees.

NATIONAL BANK OF GREECE Sectoral Report May 2017 13
2. Organizational issues
Organizational matters are heavily regulated by the Ministry of
Education which approves the rules of operation of each university
concerning matters such as i) a university’s ability to decide on its
executive head (who must already hold an academic position
within the university), ii) the structure and composition of decision-
making bodies (Greece is one of few countries with no non-
university representative in the governing body), iii) the ability to
form legal entities (only non-profit in Greece) and iv) decisions for
internal academic structures and the establishment, merging or
cancellation of academic departments.
Moreover, students have exerted a large influence on academic
issues and decision making processes (mainly stemming from the
historically high politicization of Greek universities largely due to
the central role that they had during the movement against
dictatorship and the restoration of democracy in Greece in 1974).
For example, students are involved in the decision making process
for issues like the election of the rector and the departments’
directors, the approval of the annual budget as well as the creation
of new teaching positions. The significant power of students on
several occasions has created obstacles to the proper functioning
and modernization of the university, while it discourages the
administrative bodies from protecting efficiently the facilities and
the personnel from acts of violence (as they are accused of
violating the universities’ asylum).
3. Students
The number and selection of students are controlled by the
Ministry of Education at the Bachelor level, while at the Masters
level there is greater flexibility. In contrast, universities in western
countries with well-developed tertiary education systems (e.g. the
UK, US) can determine the number of students that will be
accepted each year, as well as design and run the procedure for
the selection of the students that will be accepted.
NATIONAL BANK OF GREECE Sectoral Report May 2017 14
4. Staffing policies
Regarding staffing policies, there are countries that are totally
independent in identifying the vacancies and running the
recruitment procedures and tenure decisions, as well as defining
the salary of the academic and research staff of the institution (e.g.
the US, UK, Sweden). There are also countries where promotion
and dismissal procedures are partly regulated (e.g. Czech
Republic, Hungary and France). Turning to Greece, universities
have almost no autonomy concerning the number of available
professors’ positions (both tenured and non-tenured)10 and the
level of salaries (academic and administrative), as their staffing
policies are completely restricted by regulations for public-sector
employees.
It is important to note that under Act 4009/2011, there were
amendments towards higher independence for Greek universities,
tackling many of the abovementioned issues (management,
funding, staffing etc.). Indicatively, the reform introduced a new
governing structure through boards responsible for the strategic
planning and the supervision of the institution (consisted of both
internal and external members), while reducing the influence of
students on university management and setting limits on the
duration of studies. Moreover, it provided higher flexibility
concerning hiring and promotion procedures, it allowed the parallel
employment of academic staff in Greek and foreign universities
(for certain periods) and introduced results-based funding (based
on academic quality and efficiency indices), which would
complement initially distributed funds (based on objective criteria
such as number of students, geographical expansion, field etc.).
However, subsequent law modifications (combined with poor
implementation) have diminished its scope and effectiveness.
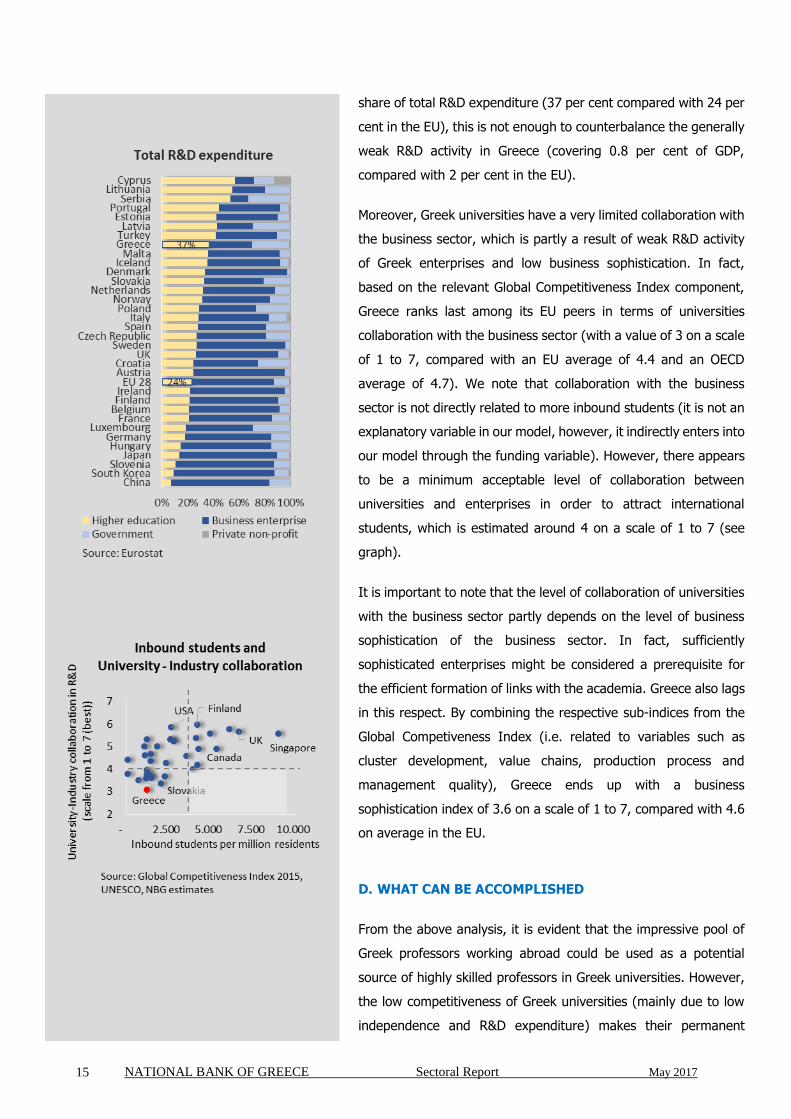
C3. R&D and collaboration with the business sector
Higher education R&D expenditure in Greece is low, reaching €550
million in 2014 or 0.3 per cent of GDP (compared with 0.5 per cent
in the EU). Despite the fact that higher education absorbs a high
10 The choice of the appropriate candidate for each position is decided by a committee comprising by university’s
professors as well as professors from other universities (or research centers) in Greece or abroad.
NATIONAL BANK OF GREECE Sectoral Report May 2017 15
share of total R&D expenditure (37 per cent compared with 24 per
cent in the EU), this is not enough to counterbalance the generally
weak R&D activity in Greece (covering 0.8 per cent of GDP,
compared with 2 per cent in the EU).
Moreover, Greek universities have a very limited collaboration with
the business sector, which is partly a result of weak R&D activity
of Greek enterprises and low business sophistication. In fact,
based on the relevant Global Competitiveness Index component,
Greece ranks last among its EU peers in terms of universities
collaboration with the business sector (with a value of 3 on a scale
of 1 to 7, compared with an EU average of 4.4 and an OECD
average of 4.7). We note that collaboration with the business
sector is not directly related to more inbound students (it is not an
explanatory variable in our model, however, it indirectly enters into
our model through the funding variable). However, there appears
to be a minimum acceptable level of collaboration between
universities and enterprises in order to attract international
students, which is estimated around 4 on a scale of 1 to 7 (see
graph).
It is important to note that the level of collaboration of universities
with the business sector partly depends on the level of business
sophistication of the business sector. In fact, sufficiently
sophisticated enterprises might be considered a prerequisite for
the efficient formation of links with the academia. Greece also lags
in this respect. By combining the respective sub-indices from the
Global Competiveness Index (i.e. related to variables such as
cluster development, value chains, production process and
management quality), Greece ends up with a business
sophistication index of 3.6 on a scale of 1 to 7, compared with 4.6
on average in the EU.
D. WHAT CAN BE ACCOMPLISHED
From the above analysis, it is evident that the impressive pool of
Greek professors working abroad could be used as a potential
source of highly skilled professors in Greek universities. However,
the low competitiveness of Greek universities (mainly due to low
independence and R&D expenditure) makes their permanent

NATIONAL BANK OF GREECE Sectoral Report May 2017 16
return to Greece difficult. In this section, we will first outline
specific policies that can be adopted (based on best practices from
other countries) and then analyze their effects in the Greek
economy both in the short term and in the medium term.
D1. SPECIFIC POLICIES
In order to strategically develop universities that would attract
high-quality professors (and subsequently students), we suggest
a combination of specific policies that could facilitate this goal:
1. Fostering independence and international collaborations
Countries with high levels of autonomy, that are attractive for
professors as well as students (such as the US, Australia, New
Zealand, the UK and Japan), follow some common policies:
coherent national strategy for higher education
universities are considered autonomous institutions, able
to form a complete strategy from the selection of students
and academic staff, to tuition setting, funding and budget
allocation
cooperation of universities with relevant ministries
(outside that for education) and chambers of commerce,
as well as other universities national and international
cross-country agreements for student and academic
mobility
results-based funding of universities as an incentive for
efficient operation and specific international strategy, and
professors’ evaluation as an incentive for academic
excellence
student support with extensive programs for grants and
scholarships, allowing for higher flexibility in terms of
tuition fees, without eliminating the social aspect of
educational services.
Focusing on university collaborations, the positive effects of such
initiatives concerning partnerships between universities, inter-
country agreements as well as the participation of the business
sector, can be confirmed through international experience.
Indicatively:

NATIONAL BANK OF GREECE Sectoral Report May 2017 17
Partnering with pre-eminent international institutions is a
way to gain critical expertise and sufficient legitimacy for
changes that would otherwise be hard to carry through. A
good example is that of Portugal and the MIT Portugal
Program (MPP consortium), connecting the MIT with 8
Portuguese schools of engineering, science, economics,
and management, 20 Portuguese research centers and
more than 50 industry partners under one umbrella.
Collaboration is strongly promoted, with students
attending more than one university (thus travelling during
their studies) and getting a joint degree (including MIT).
International applications are high and so is student
selectivity. This partnership has led to higher student
mobility in the universities concerned – attracting about
40 per cent foreign students in 2010 compared with 2 per
cent in 2006 (when the consortium was formed) and less
than 10 per cent in other Portuguese universities.
Moreover, based on annual surveys, graduates as well as
academic staff appear to be more oriented towards
industrial research and innovation and more open to
collaborations.
Reinforcing industry-universities collaboration is also
significant, as indicated by the Italian project “Marco
Polo”, which was part of a bilateral agreement between
the Italian and Chinese governments (2004) that aimed to
attract Chinese students to Italian universities. The
program was designed in order to meet the needs of
Italian firms which had set up factories or/and offices in
China and were seeking executives who understand both
the Italian and Chinese language and culture. Towards
that goal, (i) Italian industry heavily subsidized a special
fund that provided full annual scholarships to eligible
Chinese students, (ii) the Italian Government simplified
the visa procedures and (iii) Italian universities offered
Italian language courses to Chinese students. As a result,
Chinese students in Italy reached about 10,000 in 2013
from less than 300 students in 2004.

NATIONAL BANK OF GREECE Sectoral Report May 2017 18
2. Introducing return programs and incentive schemes for
the academic diaspora
As mentioned earlier, an easily accessible pool of professors is
available through the Greek academic diaspora. To determine the
set of policies and incentives required to attract those professors,
Greek officials could follow the example of other countries that
managed to benefit from their immigrants.
One of the largest immigrant bases is that of China, with
its diaspora estimated at about 50 million11, mostly
spread across neighboring countries in Southeast Asia.
Recognizing the benefits of innovation, knowledge
building and technology transfer, the Chinese
Government (after 1978 and under the Open Doors
policy) has followed a strategy aiming to encourage
Chinese immigrants (especially those with technological
skills) to return and work in China. For example, skilled
Chinese professors were motivated to return – either
permanently or temporarily – through a set of policies
from the government and local municipalities. Some
indicative policies were i) financial incentives to
returning immigrants (special research grants,
laboratories and assistants, low-interest loans,
exemptions on importing certain equipment, subsidies
on housing and salaries) ii) simplification of procedures
of return and settlement (Returnee Service Center as a
single window), iii) overseas recruitment associations for
scholars and professionals (Thousand Talents Program)
and science and business parks iv) as well as providing
special schools for immigrants’ children with difficulty in
the Chinese language. As a result, many positions in
tertiary education in China are covered by experts who
graduated abroad (about ¾ of presidents of
universities, as well as professors in the field of science
and engineering and about 60% of PhD supervisors).
Israel is another country with a significant brain drain
issue, with about ¼ of its professors working in
11 Based on a study commissioned by the Chinese State Council Office of Overseas Chinese Affairs: Guotu Zhuang,
“Distribution and trends of Overseas Chinese”, Studies on Overseas Chinese Affairs, 2010.

NATIONAL BANK OF GREECE Sectoral Report May 2017 19
universities abroad (mainly the US) based on the Israeli
Council of Higher Education. In an effort to attract those
academics back to the country and re-absorb them into
university or industry positions, the Israeli National Brain
Gain Program was launched in 2013. The program
includes i) a database of professors and other Israelis
with higher education living abroad (supervised by the
Ministries of Economy and Immigrant absorption),
combined with ii) the Israeli Academy of Sciences
Contact Center, promoting regular contact, with
immigrant professors, special workshops and other
assistance for their repatriation. According to recent
data, there are about 2,600 academics listed in the
database and about 500 have already returned in jobs
in Israel, with the aid of the contact center.
3. Creating Centers-of-Excellence (CoE)12
Apart from the introduction of incentives, professors will also
require an overall favorable environment for academic research.
In this context, a key initiative is the development of CoEs around
Greek universities, which would attract a critical mass of
professors, infrastructure and knowledge. If developed efficiently,
CoEs can gain international recognition among the academic as
well as business community and become a pole of research and
training. Successful examples include i) the CoEs of Airbus in
Malaysia (for sustainable fuel), Toulouse (for overall design) and
other countries worldwide, as well as ii) the GREEN project
(GREnoble Excellence in Neurodegeneration) for neurobiology in
Grenoble. Another notable project, still under development, is that
of Israel, with a recently formulated plan by the government for
the establishment of 30 CoEs (i-core program). The project is
under the umbrella of the wider Israel National Brain Gain Program
aiming to attract Israeli academics back to Israel and strengthen
scientific research. During 2011-2013, 16 of those CoEs were
launched and managed to attract about 60 researchers from
abroad, with a target to reach 80.
12 A CoE consists of a network of institutions (universities, research centers, business enterprises, government
departments) focusing on a specific field of research (and industrial development) and concentrating available resources to its development.

NATIONAL BANK OF GREECE Sectoral Report May 2017 20
This structure fits well with the characteristics of a small country
like Greece, focusing its available resources to niche markets
where a competitive advantage can be found (e.g. agriculture,
food manufacturing and tourism).
As business sophistication of the Greek enterprises is still low (see
p.15) Greek universities (and their Centers of Excellence) might
have to look for collaboration abroad. We note that international
collaborations among Centers of Excellence is a common practice.
Indicatively, the GREEN project in Grenoble, concerning research
against neurodegenerative diseases, is integrated in the European
and Canadian network of Centers of Excellence in
Neurodegeneration (COEN).
4. Creating special regime universities
The additional professors (who would subsequently attract more
students, both Greek and non-Greek) could be absorbed by
already existing universities in case they manage to reach the
above-mentioned requirements – especially in terms of
independence. Alternatively, bearing in mind that the Greek
tertiary sector could be resistant to change due to political and
social concerns, special-regime universities could be created - with
greater flexibility especially in terms of tuition fees and other
funding possibilities (as well as student selection and other
academic issues). It should be noted that such policies are not
without precedent. Indicatively:
There is already a case in Greece, concerning the International
Hellenic University in Thessaloniki, which was established
under a special framework (law 3391/2005), allowing i) tuition
for all programs (undergraduate and postgraduate), ii) control
over student selection and iii) all courses taught in English.
Another example is that of Singapore where, while most
universities are under government control, a reform in 2005
allowed the operation of two autonomous public institutions
with significant flexibility, while the Government sets broad
education policies and ensures accountability. This could have
led to the increase of about 30 per cent (or 15,000 students)
of international students choosing to study in Singapore after
2009.

NATIONAL BANK OF GREECE Sectoral Report May 2017 21
Taking a different path, Turkey has supported the
establishment of private non-profit universities (starting in
mid-1980s), which almost quadrupled during the past decade
(representing now 1/3 of the total number of Turkish
universities), while their share in enrollments has doubled
(absorbing 14 per cent of the enrolled students, up from 7 per
cent ten years ago13). Note that the high quality of these
universities is verified by their ranking in Global University
Rankings (with 3 of them within the top 500 universities
according to the QS World University Ranking – surpassing any
Turkish public university in the list).
D2. DIRECT EFFECT: ATTRACTING FOREIGN STUDENTS AND
BALANCE OF PAYMENTS INFLOWS
The effects from the formation of an education hub in Greece
would be twofold; it would increase the country’s growth potential
in the medium term, while it would also boost net exports in the
short term (through higher exports and lower imports of education
services).
In particular, based on our analysis, inbound students in Greek
universities could increase potentially to about 110,000 from
27,600 in 2015 (including the current flow of about 13,000-15,000
students from Cyprus), provided that the five factors identified in
our model as critical for the level of academic excellence improve
to the highest international standards; namely:
(i) raise Greek universities’ independence,
(ii) attract highly-cited professors (about 20 to 25 for the size of
Greek universities),
(iii) increase R&D expenditure in higher education to the EU
average (0.5 per cent of GDP (from 0.3 per cent in 2015),
(iv) introduce several programs in English, and
(v) lower the student to professor ration (from 21 to 16).
It is important to note that this convergence of Greek universities
to the international standards would also limit the current outflow
13 Note that these estimates exclude students undertaking their studies via distance education (mostly in Open
Education Faculties).
NBG model Current Target
Higher education R&D
(%GDP)0,3% 0,5%
Highly Cited Professors 7 23
Independence index 3,0 7,9
Language (dummy) 0 1
Inbound foreign students* 27.600 110.000
Other assumptions Current Target
Outbound greek students
(% of total Greek students)9% 3,2%
Outbound greek students 40.000 14.000
Student to professor ratio in
universities21 16
Professors in universities 12.300 22.800
Student Mobility: Assumptions and Estimates
* of which about 13,000 students are from Cyprus

NATIONAL BANK OF GREECE Sectoral Report May 2017 22
of Greek students, who would now find high quality education
services in their own country. Specifically, in case the share of
outbound students converged to the EU average of 3.5 per cent
(from about 10 per cent currently), there could be about 25,600
more Greek students in Greek universities. Therefore, along with
the increase of 82,400 inbound international students, the total
increase in demand for tertiary education in Greece would amount
to 108,000 additional students.
In practice, the special regime universities (assuming that these
are set up for foreign students and the extra Greek students would
be placed) should satisfy the above-mentioned five conditions and,
under a baseline scenario, could operate under the following
assumptions:
Regarding tuition, we assume that students attending
special-regime universities would pay tuition for both
bachelor and master degrees. By (i) setting tuition to
levels similar to global competition (with Greek and EU
students being charged about 50% lower than non-EU
students), and (ii) assuming that ½ of inbound students
would seek a master’s degree (which is the OECD
average) with ½ of them originating from non-EU
countries, the special regime universities would receive
tuition fees of €0.56 bn annually from approximately
108,000 students (non-Greek and Greek who do not
study abroad).
Additional revenues could be attracted from EU funding
programs linked to the international mobility of students
and academic staff as well as business R&D programs.
Based on the experience of other EU countries in the
absorption of similar funds, we estimate the potential
benefit at about €0.16 billion per year.
Turning to costs for the operation of special regime universities,
we assume that:
Aiming at the EU average student-to-professor ratio
(16), the special regime universities would require 6,800
professors. Considering average academic salary levels
for most of them and special compensation schemes for
professors with high levels of citations, we estimate
Additional students 108.400
more inbound EU 41.200
more inbound non EU 41.200
less outbound Greeks 26.000
Master degree or higher (% of students) 50%
Additional professors 6.770
Annual tuition for GR-EU students:
bachelor degree 2.500 €
master degree or higher 5.000 €
Annual tuition for non-EU student
bachelor degree 5.000 €
master degree or higher 10.000 €
Annual living expenses/ student 10.000 €
Annual living expenses/ professor 20.000 €
Annual salary/ Highly Cited Professor 150.000 €
Annual salary/ other teacher 50.000 €
Annual salary/ administrative staff 25.000 €
Annual needs in fixed capital / student 680 €
Revenues and expenditures assumptions
Special regime universities: Assumptions
Students and professors assumptions
Revenue 715 €
Tuition fees 560 €
Business R&D 55 €
EU funds 100 €
Costs 565 €
Salaries 340 €
R&D 150 €
Fixed capital needs 75 €
Net balance 150 €
*in million €
Special regime universities

NATIONAL BANK OF GREECE Sectoral Report May 2017 23
annual salaries for the special regime universities in the
order of €0.34 bn.
In order to attract and accommodate the additional
students, there needs to be an increase in annual R&D
expenditure of about €0.15 billion (based on the NBG
Education Model, as described above) as well as an
annual capital investment of about €75 million (based
on past fixed capital needs per student).
Under this scenario, the special regime universities’ revenues of
tuition fees and other funds (from EU programs or the business
sector) would exceed the costs of salaries and expenditure (R&D
and fixed capital) and therefore would not exert a negative effect
on the public budget.
More importantly, the aforementioned increase in tertiary students
could result in annual net export of education services of about
€1.7 billion from tuition fees and living expenses of foreign
students (as well as Greek students that would otherwise study
abroad), which combined with the EU funds and the business R&D
would attract more than €1.8 bn per year in the Greek economy.
Note that these higher expenditures correspond to higher tax
revenues. According to our estimates, resources of approximately
€ 0.4 bn per year14 would be raised from (i) the tax revenues from
the living expenses of the additional students and professors (both
VAT as well as taxes on rents and profits), and (ii) the income
taxes of the additional professors’ salaries. These extra funds
would be enough to cover for the improvements in terms of higher
education quality (higher independence, higher R&D expenditure
and lower professor–to-student ratio) to spread and benefit all
Greek universities (and not just the special-regime ones).
D3. LONG-RUN IMPACT: TRANSFORMING THE GREEK
GROWTH MODEL AND BOOSTING ITS LONG-TERM POTENTIAL
Apart from the aforementioned direct impact, higher education
benefits the economy through multiple externalities – mainly
through (i) its contribution to skills development and (ii) its
research activities that develop productivity-enhancing
14 These estimates refer to the direct effect. The total tax revenue boost would in fact be even higher due to
multiplier effects.
Net exports of education services 1.660 €
Tuition fees: Greek students 100 €
(26,000 less outbound students)
Tuition fees: Foreign students 460 €
(82,400 more inbound students)
Living expenses of students 1.100 €
Business R&D 55 €
EU funds 100 €
Total inflows 1.815 €
*in million €
Direct inflows to the Greek economy
Income tax of additional professors 100 €
Taxes on living expenses: 330 €
additional professors 55 €
additional students 275 €
Total taxes (direct effect) 430 €
*in million €
Tax Revenue
** 30% income tax, 25% taxes on living expenses (VAT
and taxes on rents and business profits)

NATIONAL BANK OF GREECE Sectoral Report May 2017 24
technologies. In fact, a substantial literature has emerged during
the past decades that highlights how education can create long-
term sustainable growth15. Drawing on this large literature that
analyzes the effect of higher education on economic growth, NBG
Research has constructed a model based on the augmented Solow
growth model16 which provides the fundamental level of production
per employee by considering physical and human capital as its
main determinants.
Our analysis introduces three novelties:
We correct the well-documented deficiency of not taking
into account the quality of higher education. Note that
previous attempts to consider the quality effect of
education have focused on earlier stages of education
(mainly secondary-school education)17.
We study separately the effect of academic human
capital on growth. Apart from increasing the human
capital inherent in the labor force and thus boosting its
productivity, academic human capital can affect
economic growth through a second channel: by
supporting the innovative base of the economy and
facilitating the diffusion of new technologies. Therefore,
academic human capital can also exert a separate direct
influence on the economy.
We encompass the idea that the impact of academic
human capital on growth depends on the level of the
country’s business sophistication.
With a view to quantifying this analysis, we have used a dynamic
panel model, based on the Pooled Mean Group estimator
approach18 which allows us to test for a long-term relationship with
15 Sianesi, B., and Van Reenen, J. (2003), “The returns to education: Macroeconomics”, Journal of Economic
Surveys, 17, 2, 157-200. Gemell N., (1996), “Evaluating the impacts of human capital stocks and accumulation on economic growth: Some new evidence”, Oxford Bulletin of Economics and Statistics, 58, 1. Keller, K., (2006), “Investments in primary, secondary and higher education and the effects on economic growth”, Contemporary Economic Policy, 24, 1, 18-34. 16 Mankiw, G., D. Romer, and D. Weil (1992), “A contribution to the empirics of economic growth”, Quarterly
Journal of Economics, 107, 407-437. 17 Hanushek, E.A., and Kimko, D.D., (2000), “Schooling, labor force quality and the growth of nations”, American
Economic Review, 90, 5, 1184-1208. 18 Pesaran, H., Yongcheol, S., and Smith, R., (1999), “Pooled mean group estimation of dynamic heterogeneous
panels”, Journal of the American Statistical Association, 94, 621-634.
First decade* Next 25 years*
Human capital 9,2% 4,5%
quantity 0,0% 0,0%
quality 9,2% 4,5%
Academic human
capital27% 0,0%
quantity 6% 0,0%
quality 21% 0,0%
Business
sophistication0,0% 0,0%
Source: NBG Estimates
Scenario 1: Assumpions
*average annual growth rate
NATIONAL BANK OF GREECE Sectoral Report May 2017 25
unique per country short-term dynamics. Our estimates are
derived from a worldwide sample of 38 countries (attracting about
80 per cent of international students) for the period 1995-2015.
With the scope of finding the drivers of GDP per employee, we
have included four main parameters:
Physical capital, as proxied by the FDI-to-GDP ratio.
Quality-adjusted human capital, as proxied by the
tertiary education employment shares adjusted by the
country’s NBG education index (of the previous 35 years
on average, so as to capture the quality of the current
employees).
Quality-adjusted academic human capital, as proxied by
the number of university professors per capita adjusted
by the country’s NBG education index.
Business sophistication, as proxied by an average of
respective sub-indices of the WEF Global Competiveness
Index (taking into account variables such as cluster
development, value chains, production process and
management quality).
Τhis model – the NBG Long-term Education-adjusted Growth
Model - explains 93 per cent of the growth differentials between
countries during the past 20 years.
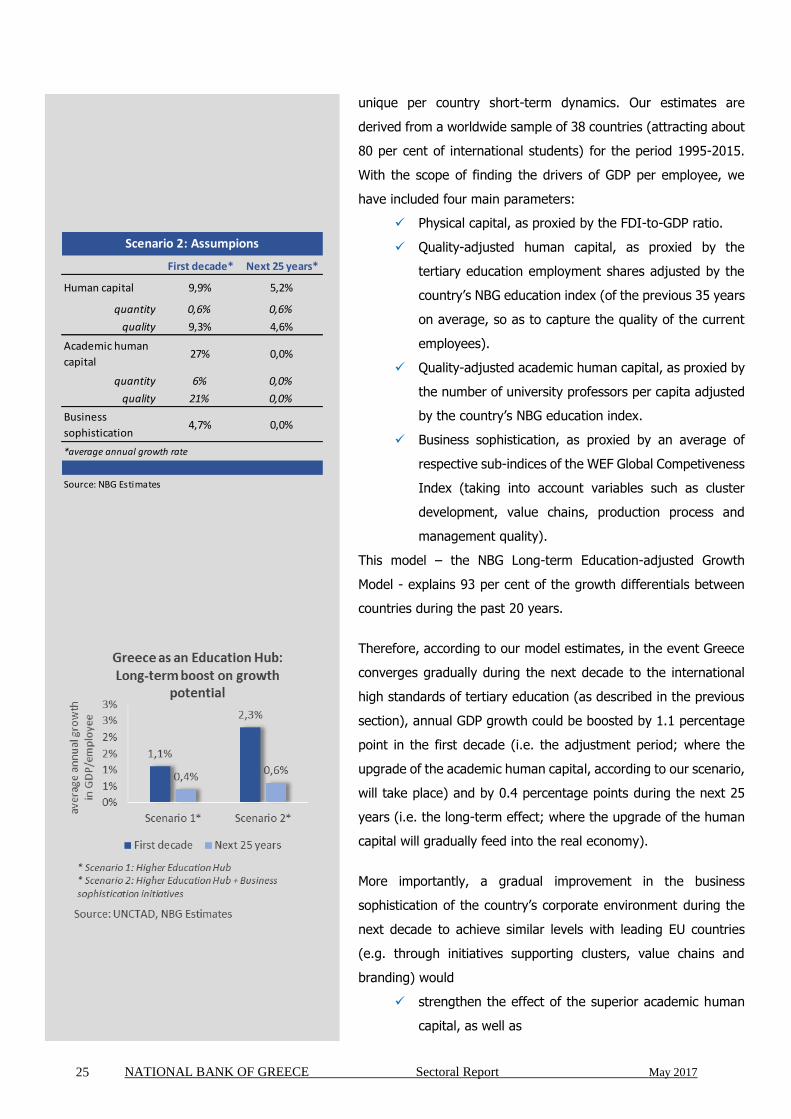
Therefore, according to our model estimates, in the event Greece
converges gradually during the next decade to the international
high standards of tertiary education (as described in the previous
section), annual GDP growth could be boosted by 1.1 percentage
point in the first decade (i.e. the adjustment period; where the
upgrade of the academic human capital, according to our scenario,
will take place) and by 0.4 percentage points during the next 25
years (i.e. the long-term effect; where the upgrade of the human
capital will gradually feed into the real economy).
More importantly, a gradual improvement in the business
sophistication of the country’s corporate environment during the
next decade to achieve similar levels with leading EU countries
(e.g. through initiatives supporting clusters, value chains and
branding) would
strengthen the effect of the superior academic human
capital, as well as
First decade* Next 25 years*
Human capital 9,9% 5,2%
quantity 0,6% 0,6%
quality 9,3% 4,6%
Academic human
capital27% 0,0%
quantity 6% 0,0%
quality 21% 0,0%
Business
sophistication4,7% 0,0%
Source: NBG Estimates
Scenario 2: Assumpions
*average annual growth rate
NATIONAL BANK OF GREECE Sectoral Report May 2017 26
attract foreign students to stay and work in Greece
with these positive synergies further increasing the growth
generating effects.
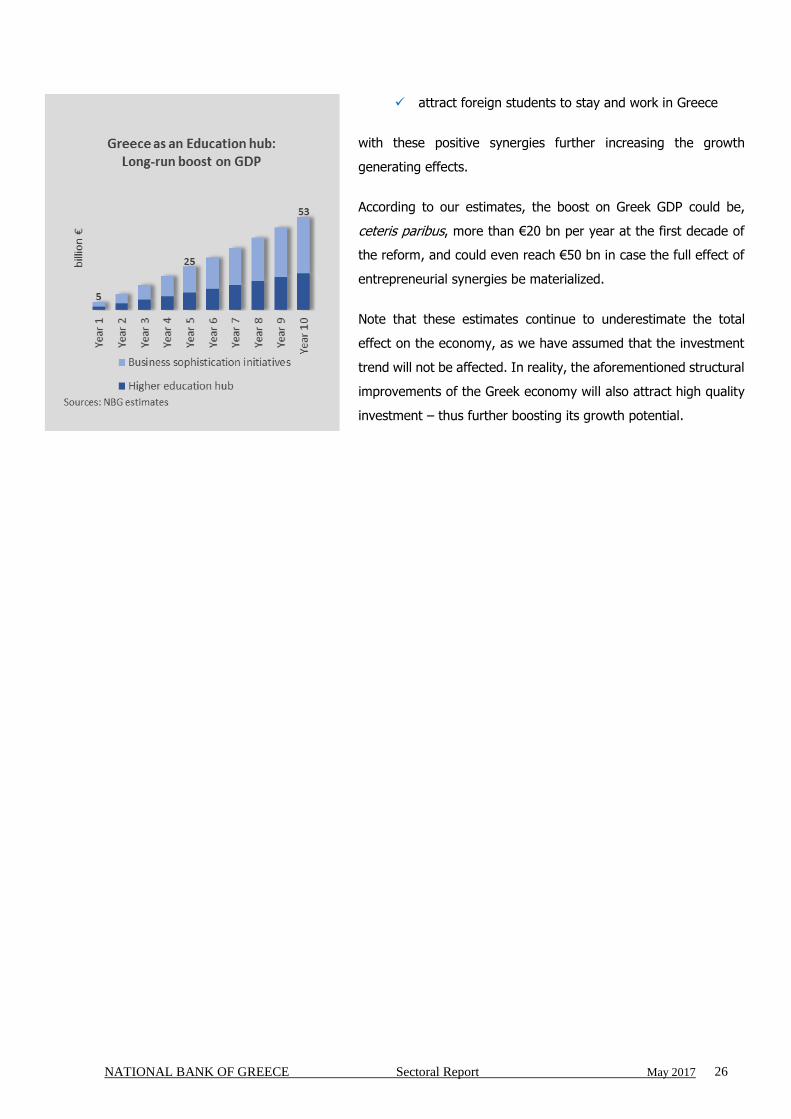
According to our estimates, the boost on Greek GDP could be,
ceteris paribus, more than €20 bn per year at the first decade of
the reform, and could even reach €50 bn in case the full effect of
entrepreneurial synergies be materialized.
Note that these estimates continue to underestimate the total
effect on the economy, as we have assumed that the investment
trend will not be affected. In reality, the aforementioned structural
improvements of the Greek economy will also attract high quality
investment – thus further boosting its growth potential.

NATIONAL BANK OF GREECE Sectoral Report May 2017 27
BOX 1: World University Rankings
The growing globalization of higher education brought about the emergence of global university rankings, which
are easily accessible and are designed to help prospective students make informed comparisons of leading
universities around the world.
A frequently cited index is the QS World University Ranking, assessing university performance across four areas:
Research (weight 60%): Through an academic reputation survey (weight 40%), professors are asked to
identify the institutions where they believe the best work is currently taking place within their own field
of expertise. Moreover, the more objective indicator of citations per faculty (weight 20%) is used to
assess each university’s research output and impact. Generally, the more often a piece of research is
cited (referenced to another paper or book publication), the more influential it is.
Teaching (weight 20%): Aiming to identify the universities that are best equipped to provide small class
sizes and a good level of individual supervision, the professor-to-student ratio is taken into account.
Employability (weight 10%): Through an employer reputation survey, employers are asked to identify
the universities they perceive to be producing the best graduates based on their experience.
Internationalization (weight 10%): The shares of international students (weight 5%) and international
faculty (weight 5%) are the last components of the QS rating calculation, evaluating the university’s
strategy concerning the growing phenomenon of student and staff mobility.
Universities in the US and the UK dominate global rankings, with 49 and 30 universities, respectively, in the top
200 of the QS World University Rankings.
Greece has an average ranking of 590 in 2016, with six universities participating on the QS lists and only two in
the top 500. The highest ranking university is the National Technical University of Athens (EMP), which is
continuously improving its position from 550th in 2012 to 395th in 2016, followed by Aristotle University of
Thessaloniki, which is 490th (40 places down from 2012). We note that both the university of Crete and the
Athens National and Kapodistrian University were on the top 500 list in 2012, but posted a drop of 150-200 places
during the past 4 years, mainly due to the level of research (citations).

NATIONAL BANK OF GREECE Sectoral Report May 2017 28
However, there are certain Greek universities that stand out in specific fields of study. Specifically, 5 Greek
universities are among the world’s top 500 in departments relevant to natural sciences (physics, chemistry,
mathematics), while 2 universities have managed to reach the top 200 in engineering and technology (with the
National Technical University of Athens ranking 67th), 1 in business management (Athens University of Economics
and Business) and 1 in pharmacology (National and Kapodistrian University of Athens).
While the comparison on a nominal level is not fair for a small country such as Greece in terms of resources and
recognition, even after adjusting for the population, Greece ranks relatively low, with 0.2 universities in the top
500 per million inhabitants, compared with an average performance of 0.4 in the EU (with about ½ concerning
universities in the top 200). Countries with high scores in global rankings compared with their population are
Finland, Ireland and Switzerland, while The Netherlands has a high performance in the top 200 rankings. We
note that controlling for the population, the US and UK exhibit a medium performance (partly due to the fact that
they are large countries).
Finally, it should be noted that there are several other institutions annually publishing different rankings of world
universities such as the Times Higher Education World Ranking (THE), the Academic Ranking of World Universities
(ARWU) and the Center for World University Rankings (CWUR). Most rankings follow similar approaches,
examining university attributes like research activity, volume and impact of publications, international mobility,
quality of teaching and organization, using both official statistics and survey data. However, they differ in the
specific metrics used and the weight they apply on each attribute. Indicatively, Greek universities have a slightly
better ranking when the Times Higher Education Index is used, with 3 universities in the top 500 instead of 2
when using the QS index described above. This is mainly because the THE gives more weight to the quality of
research activity (including publications, number of citations as well as reputation surveys), while QS focuses
more on the quality of teaching.

NATIONAL BANK OF GREECE Sectoral Report May 2017 29
BOX 2: “Eternal” students
Greece exhibits a large number of enrolled students in tertiary
education (677,000), as the ratio of enrolments per 1,000
residents stands at 62 versus 39 on average in EU. These
figures, however, are misleading due to the widespread
phenomenon in Greece of “eternal students” (i.e. students that
substantially prolong their graduation beyond the standard
duration of their studies).
A closer look at the age structure of the students enrolled in
the Greek Universities reveals that the share of the students
aged over 26 (i.e. those that probably are students for more
than 7-8 years) is increasing steadily during the past three
decades, reaching an astonishing 42 per cent of the total
students in 2015 (compared with approximately 15 per cent
during the decades of ‘50s to ‘80s).
By using the age group of 26+ as a proxy of “eternal”
students19 (i.e. students that exceed the normal duration of
studies by more than 2 years), we have estimated the number
of “eternal” students in Universities and in Technological
Institutions during the past fifteen years. Although the majority
of these students are enrolled in Universities (65 per cent), the
phenomenon presents high growth dynamics in Technological
Institutions (increasing by 315 per cent during 2001-2015,
versus 98 per cent in Universities). Note that the share of
“eternal” students to total students currently stands at about
40 per cent in both Universities and Technological Institutions
(compared with 29 in Universities in 2000 and 14 per cent in
Technological Institutions).
Regarding the causes of this phenomenon, we distinguish the
following factors:
The initial enrolment process into tertiary education –
via the Pan-Hellenic written exams – often results in
options that are less desirable to the candidate; this
19 Note that we have included in this proxy for inactive students only the 26+ students that have exceeded the
normal duration of their studies.

NATIONAL BANK OF GREECE Sectoral Report May 2017 30
being the negative consequence of a high “success”
ratio.
The low absorption of higher education graduates in
the Greek labor market discourages the students from
completing their studies.
The absence of any motivation for the timely
graduation or any penalty for exceeding the standard
study time (e.g. payment of a tuition fee) further
restrains the students’ efforts.
The establishment of several departments in rural
areas makes it difficult for many students to attend the
lectures.
Through the Act 4009/2011, the Greek state tried to control the
problem of “eternal” students by introducing a rule for the
maximum duration of studies (as determined by the curriculum
plus 4 semesters). However, an amendment of the law in 2015
has enabled students to continue their studies without any kind
of limitation in duration.

NATIONAL BANK OF GREECE Sectoral Report May 2017 31
BOX 3: Greek immigration trends
The global level of international migrants has historically been
on an upward trend, reaching 244 million in 2015, from 173
million in 2000 and 102 million in 1980. Most immigrants
originate from Asia (43 per cent), followed by Europe with 25
per cent. The destination regions are more balanced, with Asia
and Europe both covering about ⅓ of international migration
stock. It should be noted that on a country level, the US is a
dominant destination, hosting 47 million immigrants (20 per
cent), followed by Germany and Russia, hosting a much lower
12 million. Concerning the 60 million European migrants, we
note that about ⅔ have moved to another European country.
Greece is a country with a high immigration rate, as about 10
per cent of the population born in Greece lives in another
country, compared with a world average of about 3.3 per cent.
In fact, considering the accumulated stock of Greek
international migrants (not just those born in Greece), the total
Greek diaspora is estimated at about 5 million.
Driven mainly by the economic and political conditions in the
country, the first significant wave of Greek immigration
occurred during the early 20th century when about 350,000
immigrants, mostly of low education and with no specialized
training, left Greece seeking better economic opportunities
abroad (mainly in the US). Again, as a result of both economic
and political reasons (i.e. dictatorship), the second wave of
Greek immigration occurred during the 1960s and the 1970s -
leading to a peak of about 1.2 million Greek immigrants during
the 1980s. Thereafter, the outflow appeared to decrease
gradually until 2010, when the country was hit by the ongoing
economic crisis.
The recent – third – wave of immigrants differs significantly
compared with the previous two waves, as it mainly consists of
young and highly educated individuals. In fact, ⅓ of Greeks
leaving the country after 2010 are considered to have attended
tertiary education (compared with 20 per cent in 1990 and less
than 10 per cent during the previous immigration waves). This

NATIONAL BANK OF GREECE Sectoral Report May 2017 32
brings into focus the brain drain phenomenon and its
detrimental effects on human capital in Greece and the
potential growth of the country. Specifically, combining data for
the educational level of Greek immigrants and of employees in
Greece, it is estimated that about 20 per cent of Greeks with
tertiary education (in Greece and abroad) are employed abroad
(compared with 9 per cent on average in the EU).
The main destination country is Germany, attracting about 30
per cent of Greek immigrants in 2015, followed by North
America (mainly the US) with 25 per cent and Australia with 11
per cent. We note that during the past 20 years, the UK has
increased its share as a target market from 1 per cent to 5 per
cent.

NATIONAL BANK OF GREECE Sectoral Report May 2017 33
APPENDIX: Econometric models
A. NBG Education Model
NBG Research estimated a global universities competiveness model in order to assess the underlying
potential of Greece’s higher education. The model is based on cross-section data for the world’s main host
countries for international students.
Our sample consists of 50 countries, which attract 86 per cent of total international students. In order to
account for the effect of the different size of each country, we have expressed the variables either in per
capita terms (i.e. number of students and number of professors) or as a share of GDP (i.e. R&D
expenditures). The explanatory variables for each country’s inbound students per capita are the following:
a University Independence Index, based on OECD estimates20
the number of highly-cited professors per capita, based on the “List of Highly Cited Professors”
(Thomson Reuters, 2016)
the level of R&D expenditure in higher education as a share of GDP
a language variable, taking the value 4 for English-speaking countries, 3 for German-speaking
countries, 2 for French-speaking countries, 1 for countries with high English literacy and 0 for
countries with low English literacy.
Our model explains 85 per cent of the global distribution of international students. Based on the
estimated coefficients, we have constructed the NBG Education Index.
20 Martins, J. O., Boarini, R., Strauss H., and De la Maisonneuve, C. (2009), "The policy determinants
of investment in tertiary education", OECD Journal of Economic Studies, volume 2009, no 1.
inbi = 6.44 indi + 2,501 resi + 1,412 rdi + 231.52 langi + 788.60
(6.79) (2.13) (2.75) (2.35) (2.62)
R2 =0.85, DW=2.45
where:
inbi: inbound students in 2015 for the country i (per million residents, source: UNESCO),
indi: university independence index of country i (source: OECD)
resi: highly-cited professors in country i (per million residents, source: Thomson Reuters)
rdi: R&D expenditures in higher education in country i (as a share of GDP)
langi: language dummy for country i (as described above)

NATIONAL BANK OF GREECE Sectoral Report May 2017 34
B. NBG Long-term Education-adjusted Growth Model
NBG Research estimated a global growth model in order to assess the effect of higher education in Greek
growth. The model is based on panel data for the world’s main host countries for international students
during the past two decades.
The modelling framework is the one adopted in the vast majority of empirical studies that assess the
relationship between education and economic growth. It can be described as an augmented Cobb-Douglas
production function in order to take into account the role of human capital. Our sample consists of 38
countries with annual data for the period 1995-2015. With the dependent variable being GDP per employee,
the explanatory variables used are the following:
the FDI-to-GDP ratio (as a proxy of physical capital)
the tertiary education employment shares adjusted by the country's average NBG education index
of the previous 35 years (as a proxy for quality-adjusted human capital)
the number of university professors per capita adjusted by the country's NBG education index (as
a proxy for quality-adjusted academic human capital)
a business sophistication index (based on WEF estimates)
As the assumption of homogeneous parameter estimates across countries is considered a strong one, we
chose the estimation method of PMG21. This allows us to estimate non-stationary dynamic panels in which
the short-run dynamics can be country-specific, while the long-run relationship is valid across all countries.
After testing for (i) the non-stationarity of the variables (according to Augmented Dickey-Fuller unit root
test) and (ii) the hypothesis that the long-run coefficients are the same for all countries (according to the
Hausman test), we have estimated the following coefficients:
21 Pesaran, H., Yongcheol, S., and Smith, R., (1999), “Pooled mean group estimation of dynamic heterogeneous
panels”, Journal of the American Statistical Association, 94, 621-634.
i: Albania, Armenia, Australia, Austria, Bahrain, Belgium, Bosnia and Herzegovina, Brazil, Bulgaria, Canada, China, Croatia, Cuba, Cyprus, Czech Republic, Denmark, Estonia, Finland,
France, Germany, Greece, Hungary, Ireland, Italy, Japan, Kyrgyzstan, Latvia, Lithuania,
Malaysia, Mauritius, Netherlands, New Zealand, Norway, Poland, Portugal, Qatar, Romania, Russia, Serbia, Singapore, Slovakia, Slovenia, South Korea, Spain, Sweden, Switzerland,
Turkey, Ukraine, UK, US
T-statistics in parentheses below coefficient estimates.

NATIONAL BANK OF GREECE Sectoral Report May 2017 35
Our estimates confirm the existence of a long-run relationship, as the error correction term is negative and statistically
significant. In particular, the average speed of adjustment of 0.25 means that the gap between actual and equilibrium
GDP would be closed relatively fast, implying a deviations’ half-life of around 2 years. Focusing on the long-term
coefficients, all variables are statistically significant and with the expected sign.
Moreover, the statistically significant coefficients of academic human capital, business sophistication and their product
indicate the existence of a moderation effect, i.e. that the relationship between two variables (in our case, growth
and academic human capital) depends on a third variable (in our case, business sophistication index). The effect of
a moderating variable is characterized statistically as an interaction22. In our case, business sophistication as a
moderating variable affects the strength of the relation between academic human capital and growth.
22 Aiken, L.S., and West, S.G. (1991), “Multiple regression: Testing and interpreting interactions”, Thousand Oaks,
Sage.
where:
fdii: fdi stock as a share of GDP in country i (source: UNCTAD),
hci: tertiary education employment shares adjusted by the country's average NBG education
index of the previous 35 years in country i
ahci: universities' researchers per million residents adjusted by the country's NBG education index in country i
bsi: business sophistication index in country i, which is a composite index based on relevant sub-indices of the WEF Global Competitiveness Index, as follows:
bsi= 1/8*(State of cluster development) + 1/8*(Nature of competitive advantage)
+ 1/8*(Value chain breadth) + 1/8*(Control of international distribution) + 1/8*(Production process sophistication) + 1/8*(Extent of marketing)
+ 1/8*(Company spending on R&D) + 1/8*(Reliance on professional management)
gdpi: GDP divided by labor force in country i
i: Australia, Austria, Belgium, Bulgaria, Canada, China, Croatia, Cyprus, Czech Republic,
Denmark, Estonia, Finland, France, Germany, Greece, Hungary, Ireland, Italy, Japan, Korea,
Republic of, Latvia, Lithuania, Netherlands, New Zealand, Norway, Poland, Portugal, Romania, Russia, Singapore, Slovakia, Slovenia, Spain, Sweden, Switzerland, Turkey, UK, US
Note that all variables are expressed in logarithmic terms.
Variables Coefficients t-statistics
Long-run relationship
fdii 0.21 12.45hci 0.60 9.21ahci 0.03 6.17bsi 0.24 9.07ahci x bsi 0.05 2.31
Short-run dynamics
Error correction -0.25 4.52
D(gdpi (-1)) 0.27 3.21
Constant 1.52 3.83
NBG Long-term Education-adjusted Growth Model

NATIONAL BANK OF GREECE Sectoral Report May 2017 36
NATIONAL BANK OF GREECE
This report is provided solely for the information of professional investors who are expected to make their own investment decisions without undue reliance on its contents. Under no circumstances is it to be used or considered as an offer to sell, or a solicitation of any offer to buy. Any data provided in this bulletin has been obtained from sources believed to be reliable. Because of the possibility of error on the part of such sources, National Bank of Greece does not guarantee the accuracy, timeliness or usefulness of any information. The National Bank of Greece and its affiliate companies accept no liability for any direct or consequential loss arising from any use of this report.
SECTORAL REPORT
May 2017