securing a gold standard for equity
TRANSCRIPT

�
���������� � ��������������������
���������������� ���� ����� ������ ���� ����� ��� �����
�� ����� ��� ������� ��� ����� ��������
�
��������� � ����
�������
�������� ������� ���
��� ����������� ��� ��
������ ���������� �� � !�� � � ����" �� ���#� �� � � �� �#� ��������� � � ��$�%�& ���� '�(����������������)* � � � � �+�)�,�����������������+**������ � ��������� ����()-�*� � � �� �#� ������������ ����(*� '�(�./*(�/' ' 0�& & & /��/��1�*�� � � *�)/.*+/()'-0�& & & /���& �/���

2��
�� ������������������ ������������� � ���������������������������������������������������������������������������������������� ������������ ������ ��� ........................................................................................ 6�� �� ������� ................................................................................................................. 7���� ������ � �� ������������� �����������������������������������������������������������������
��� � ����� ���������� � �������������������� ��������������������������������������
��� ������������������������������������������������������������������������������������������
�� !�������������������������������������"�� ������"������ ������������
���"��������������������� ��������"�������������� ��������������
�������������������������������������������������������������������������������������������������������������������#�
$�� � �������%%���������������� � �������� ������ ��������������������
����"����&���������������������������������������������������������������������������������������'�
(�� � ������� � ��������������������������������������������������������������������������������������'�
���� �� ������������� � ����������� ������������ ��������! ��������������"#������ ���� ��$����$��! ���������� ���! � ����������������������������������������������������"%���� ������� ��������������� ��������� ............................................................... 19�� �� � ������! "����������# "����������������$ ��"����� ...................................... 20�%�� ��"�� ����&�����������������! �'����������������("��) ............................... 21���� )���������� ���������������������������������������������������������������������������������������������������
��� *�������������������+������&��&���+��� ������������������������������������(�
��� ,������ ���&������- ��������,��&!���������������,�����������������������'�
�� .�����������.�� ������������������������������������������������������������������������������������������
$�� � ��������/��������������������������������������������������������������������������������������������� �
(�� 0�������� ����.��%��������������������������������������������������������������������(�
� �� *������)������������ ����'��"�����%�� � "����� .......................................... 37���� 1 ))2- 3 �!)4 *�.�� ������������������������������������������������������������������������������������
��� !� ����"���� �����.�������- ��������������������������������������������������������������
��� ���������������&������� ................................................................................ 40���� �)������������������)�������&������������� ����� .................................. 41�
�&�� �������� ������������������������������������������������������������������������������������������#���� %���������������%������� ............................................................................... 44�� �� � ������'��+���� ����%�� ............................................................................... 46���� )�� ����������!������������������������������������������������������������������������������������� ��
��� 5�����������!������������������������������������������������������������������������������������������� ��
%�� �������������"�� ����, �����*���������������� ...................................... 49���� � �����������)�����1 ����������4 ��������6���� ������������������������������� #�
��� !�� ������������� ����������"����������������"���� �����7������
��� � �����������������������������������������������������������������������������������������������������������$��
&�� 2& ������� ��" ��������� �� ��������& � ��������������������������������������������'��&��� ( �� ���������$�����$��� � ��������� ��������������������������������������������������')�&���� �������� *�( �����������$��� ��$ ������������������������������������������������'+�&����� , �� ����$��������������������������������������������������������������������������������������������-.�

This report was reviewed by a Technical Advisory Group of industry experts who provided valuable feedback on ways to strengthen and improve the regulatory concept. The views represented herein reflect the opinions of the primary authors only and should not be construed as a consensus statement from other parties that made a contribution to its development nor an explicit endorsement of a particular regulatory approach.
Our mission Environmental Defense Fund is dedicated to protecting the environmental rights of all people, including the right to clean air, clean water, healthy food and flourishing ecosystems. Guided by science, we work to create practical solutions that win lasting political, economic and social support because they are nonpartisan, cost-effective and fair. © 2010 Environmental Defense Fund The complete report is available at www.edf.org Contact the author at: James Fine, Environmental Defense Fund [email protected] (916) 492-4698
4
�� ������������� � ����
Under Assembly Bill (AB) 32, California's Global Warming Solutions Act a cap
and trade framework is being developed to enable for large sources of emissions, such as power plants, to buy and sell emissions allowances as commodities. AB32 compels program designers to avoid adverse socioeconomic distributional impacts from climate policies and to direct investments in disadvantaged communities. These social, environmental and economic justice objectives compel implementing agencies – particularly the California Air Resources Board (CARB) as it scripts cap and trade program rules - to examine all potentially viable tools. This report examines the feasibility of building into the cap-and-trade framework a system for verifying, aggregating and crediting small, dispersed emission reductions by households and small businesses, particularly those implemented in low-income communities that have historically been subjected to disproportionately high levels of air pollution.
Community pooling and crediting offers a potentially powerful ability to direct economic benefits to hard-pressed communities while obtaining notable emission reductions. If adopted by policymakers, the “Climate for Community” concept would create a dynamic, ongoing incentive to reduce emissions in vulnerable communities, with concomitant economic and equity benefits. Community reductions pooling would be a new complementary tool to ensure that climate policy protects and benefits low-income and historically disadvantaged communities. Linking community actions to the financial rewards systems of carbon markets will spark individuals and small business creativity and effort in service of reducing emissions. In the context of AB 32 reductions and cost-effectiveness goals, several feasibility questions arise:
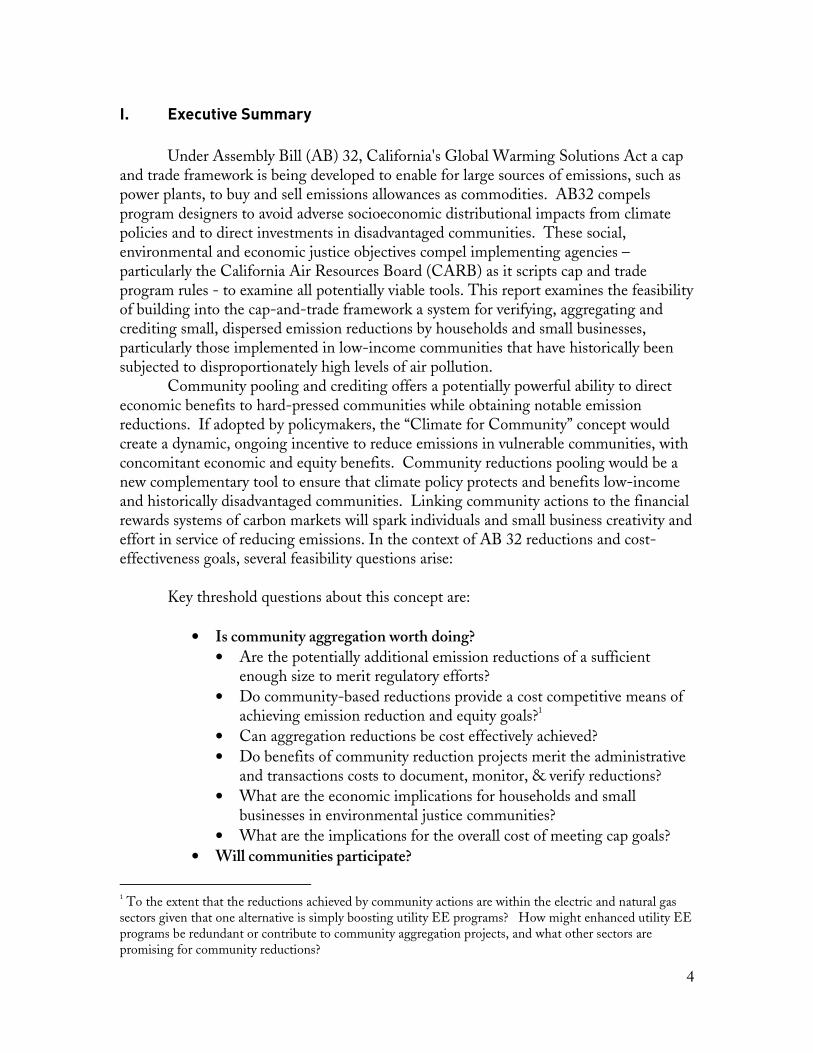
Key threshold questions about this concept are:
• Is community aggregation worth doing? • Are the potentially additional emission reductions of a sufficient
enough size to merit regulatory efforts? • Do community-based reductions provide a cost competitive means of
achieving emission reduction and equity goals?1 • Can aggregation reductions be cost effectively achieved? • Do benefits of community reduction projects merit the administrative
and transactions costs to document, monitor, & verify reductions? • What are the economic implications for households and small
businesses in environmental justice communities? • What are the implications for the overall cost of meeting cap goals?
• Will communities participate?
1 To the extent that the reductions achieved by community actions are within the electric and natural gas sectors given that one alternative is simply boosting utility EE programs? How might enhanced utility EE programs be redundant or contribute to community aggregation projects, and what other sectors are promising for community reductions?
5
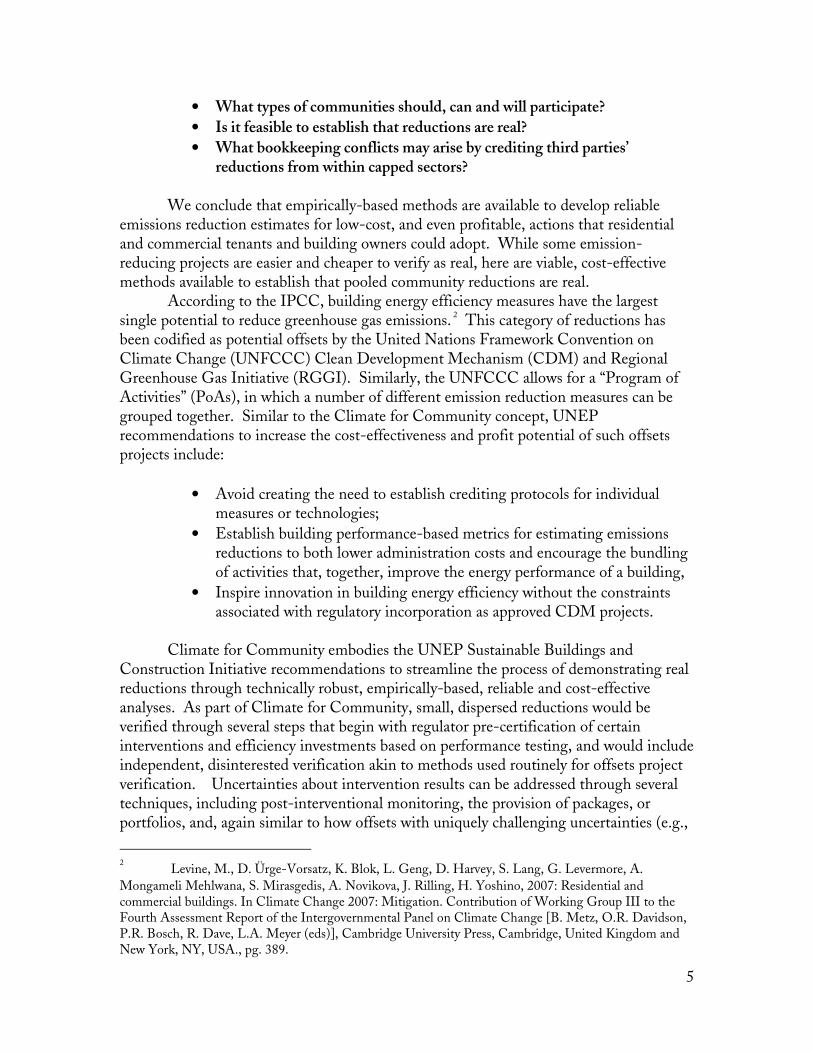
• What types of communities should, can and will participate? • Is it feasible to establish that reductions are real? • What bookkeeping conflicts may arise by crediting third parties’
reductions from within capped sectors? We conclude that empirically-based methods are available to develop reliable
emissions reduction estimates for low-cost, and even profitable, actions that residential and commercial tenants and building owners could adopt. While some emission-reducing projects are easier and cheaper to verify as real, here are viable, cost-effective methods available to establish that pooled community reductions are real.
According to the IPCC, building energy efficiency measures have the largest single potential to reduce greenhouse gas emissions. 2 This category of reductions has been codified as potential offsets by the United Nations Framework Convention on Climate Change (UNFCCC) Clean Development Mechanism (CDM) and Regional Greenhouse Gas Initiative (RGGI). Similarly, the UNFCCC allows for a “Program of Activities” (PoAs), in which a number of different emission reduction measures can be grouped together. Similar to the Climate for Community concept, UNEP recommendations to increase the cost-effectiveness and profit potential of such offsets projects include:
• Avoid creating the need to establish crediting protocols for individual
measures or technologies; • Establish building performance-based metrics for estimating emissions
reductions to both lower administration costs and encourage the bundling of activities that, together, improve the energy performance of a building,
• Inspire innovation in building energy efficiency without the constraints associated with regulatory incorporation as approved CDM projects.
Climate for Community embodies the UNEP Sustainable Buildings and
Construction Initiative recommendations to streamline the process of demonstrating real reductions through technically robust, empirically-based, reliable and cost-effective analyses. As part of Climate for Community, small, dispersed reductions would be verified through several steps that begin with regulator pre-certification of certain interventions and efficiency investments based on performance testing, and would include independent, disinterested verification akin to methods used routinely for offsets project verification. Uncertainties about intervention results can be addressed through several techniques, including post-interventional monitoring, the provision of packages, or portfolios, and, again similar to how offsets with uniquely challenging uncertainties (e.g.,
2 Levine, M., D. Ürge-Vorsatz, K. Blok, L. Geng, D. Harvey, S. Lang, G. Levermore, A.
Mongameli Mehlwana, S. Mirasgedis, A. Novikova, J. Rilling, H. Yoshino, 2007: Residential and commercial buildings. In Climate Change 2007: Mitigation. Contribution of Working Group III to the Fourth Assessment Report of the Intergovernmental Panel on Climate Change [B. Metz, O.R. Davidson, P.R. Bosch, R. Dave, L.A. Meyer (eds)], Cambridge University Press, Cambridge, United Kingdom and New York, NY, USA., pg. 389.

6
potential for reversals) are treated, through discounting. We name this verification construct a “Gold Standard for Equity” that provides a means to reach small, dispersed emission sources embedded in disadvantaged communities. The end result should be a robust mechanism for directing investment towards vulnerable communities that also creates access to an otherwise untapped and under-utilized sector of low-cost reductions while protecting the environmental integrity of the emissions cap.
�� ������������ ������ ����
Environmental Defense Fund (EDF) and San Francisco Community Power (SF
Power) implemented a pilot emission reduction project, focusing on roughly 500 low-income families and small businesses, and examined regulatory and voluntary efforts to identify, verify and credit reductions. We also convened an advisory group comprised of regulators and other stakeholders to identify issues associated with efforts to pool dispersed reductions, and to provide peer review of this study.
Our pilot study provides an analytical foil, as well as anecdotal evidence related to the potential for and interest in engaging small businesses and households in the fight against global warming. All of the households in our pilot are located in San Francisco, while the businesses are situated throughout the San Francisco Bay Area.
Under the pilot, a variety of interventions were offered to families and businesses. Outreach included brief surveys to identify emission-producing activity (e.g., vehicle use, electrical appliances, water and solid waste practices) and the distribution of "kits", which included a Kill-a-Watt meter, power strip, sink aerators, lighting switch motion detectors, among other items, to 162 low-income homes. We then revisited 50 of these homes about three months after the kits were delivered to determine whether their behavior had changed. In addition, SF Power consulted with small businesses and nonprofits to help them adopt emission-reducing measures (e.g. reductions in private vehicle use, lighting retrofits), with ex-post evaluation of actions through an analysis of utility bills.

7
� � ��������1. Is community aggregation worth doing?
Small businesses and low-income families are (directly and indirectly) responsible for a significant amount of greenhouse gas emissions. Small commercial, residential and transportation emissions accounted for over 60 percent of California’s greenhouse gas emissions in 2007. Small businesses and low-income families tend to rely on older, less efficient appliances. Even when it’s economically beneficial to replace inefficient equipment, small businesses and low-income households tend to hold on to old technologies until they no longer have a useful life. As shown in Figure ES-1, our pilot studies found that 20 percent of the refrigerators examined in low-income San Francisco households– representing roughly 25,000 refrigerators/homes– could be replaced cost-effectively (i.e., the net present value of bill savings exceeds replacement costs). While monetizing carbon reduction value alone isn’t sufficient to fund emission-reducing measures, this funding source can serve both as a financing tool and catalyst for action when linked with other resources. Monetizing carbon reductions offers an alternative funding mechanism to inspire third parties to implement utility-based efficiency programs. For example, pilot results indicate that with the addition of a carbon credit, even late model refrigerators using as little as 661 kilowatt-hours a year can become cost-effective to retire. Likewise, as shown in Figure ES-1, below, the already positive net present value of cost-effectively replacing the roughly 25,000 inefficient refrigerators located at non-public, low-income San Francisco households increases by $400,000 with the addition of a carbon credit, an added value of approximately $16 per refrigerator.� #�3 4 � ����5��/ ������ ����! �����������������������0�1 ������ �����2��������/ ����$� ���

8
2. What types of communities should, can and will participate? It is feasible to identify disadvantaged communities in using existing data for most of California. Small Regional air districts and the CARB are developing tools, and compiling datasets that will be useful for identifying California’s disadvantaged communities. Existing socioeconomic data can be used to identify low-income communities.
3. Is it feasible to establish that reductions are real?
Dispersed reduction actions are measurable and verifiable despite inherent uncertainties, some actions will be easier to verify than others. A collection of verification techniques can be employed, including statistical sampling, audits, and pre-certification based on prior studies. For example, electricity or natural gas-related reductions can be measured through statistical analysis of meter data or estimated with performance benchmarks. More dispersed measures related to a wider array of environmental media (e.g., solid waste, water) can be evaluated through statistical analysis and other methods so as to minimize transactions costs.
There are different measurement and verification challenges associated with dedicated actions and portfolio approaches. For example, refrigerators are plug-in appliances whose energy use can be measured, though field experience indicates that existing databases of equipment-specific energy use can be different than real world conditions. Provision of diverse bundles of smaller devices and behavioral interventions provides an opportunity for households to choose which items and behaviors to adopt. Adoption of the bundle of items can then be estimated statistically to fall within a range of energy reductions. Delivering a portfolio of products and services also lowers transaction costs. A Gold Standard for Equity, oriented towards reaching disadvantaged communities, that incorporates cost-minimizing steps can yield reliable demonstrations that reductions are real. As shown in Table ES-1, the program would involve several features, such as pre-certification, multi-intervention portfolios, utilizing existing social networks, and ex-poste monitoring using sampling techniques rather than comprehensive interventions. Building on UNEP recommendations – particularly aggregation and outcome certification - these techniques can overcome market barriers that have impeded more widespread implementation of energy efficiency and other emission-reducing measures.

9
,�� 6����5��
��� �������������� �������������������������� � ��3��4�����������
Establishing that Reductions are Real � Indirect or Direct Reductions in Disadvantaged Communities � Legal additionality � Project-specific and analytically robust forecast of baseline emissions � Performance benchmarks or other means of establishing a baseline � Pre-certification of emissions reductions (with ex-poste verification) � Testimonial affidavits of commitments to take specified actions � Portfolio of interventions � Ex-post statistical sampling to verify implementation � Disinterested third party verification
Example Projects Appropriate for Gold Standard Verification for Equity � Building retrofits and redesigns, such as HVAC retro-commissioning/ replacement,
weatherization, to reduce electricity use or to reduce onside fuel combustion � Increased efficiency of multi-unit building HVAC boilers � Avoided electricity and water use from appliance and fixture replacements � Transportation mode or fuel switching, or efficiency improvements � Solid waste management (recycling and composting) � On-site renewable electricity production � Hot water conservation
4. Can aggregation reductions be cost effectively achieved? What are the private transactions and administrative costs of demonstrating real reductions?
Community-based actions are likely to be cost competitive and are likely to lower the market clearing prices of emissions allowances. The types of actions likely to be taken by tenants and building owners, such as building and electronic appliance efficiency investments, or transport vehicle efficiency, are among the most economically attractive emission reductions options. Linking reductions from these sectors to allowance markets is likely to lower equilibrium allowance prices. Allowing for aggregation can spur increased adoption rates because the added financial opportunities will inspire third parties to implement measures and to establish that they are sufficiently real to be credited. Though many household level and small business investments are demonstrably cost competitive other barriers impede their widespread implementation. A variety of barriers impede rapid adoption of household and small enterprise measures that exhibit positive net present values. When coordinated with complimentary outreach and education programs, the administrative costs can be kept low. Our pilot study was implemented alongside a high efficiency toilet programs, thereby significantly reducing the marginal costs of marketing and delivering emissions reduction kits.

10
5. What bookkeeping conflicts may arise by allowing third parties to deliver non-offset reductions credits?
To ensure the environmental integrity of the emissions cap, community-based emission reduction within capped sectors that are credited to non-regulated entities must be accounted for through allowances set aside for this purpose or some other means to avoid double counting. Reductions occurring within sectors that are part of the cap-and-trade program risk being counted twice: once by the community aggregator providing the reduction strategy and once by the regulated entity that controls the emission source (e.g., power plant).
Ownership of carbon reductions may be best assigned to a third party as a way of overcoming owner/renter challenges. In cases where appliance owners don’t pay their energy bills (e.g., refrigerators and washing machines in rental units where utilities are included with the rent payment, or lighting in businesses paying a fixed rental fee), the economic incentives are disconnected from potential actors. As a result, renters pay higher energy costs than would be expected under an engineering economics approach3, with concomitantly higher polluting air and greenhouse gas emissions. Assigning carbon reduction values to third parties flexibly and efficiently delivering efficiency services using established networks creates opportunities to bridge incentive gaps efficiently and to overcome split incentives.
6. Will communities participate? Pilot surveys indicate that the technologies delivered in kits are being used, many extensively, and that there is much more opportunity for achieving efficiency-based reductions from low-income homes. As indicated in Figures ES-2, pilot survey respondents demonstrated, through use of kit items, and indicated, through survey responses, that they can and will take actions to reduce their emissions. As indicated in Figure ES-3, there are substantial opportunities to provide additional lighting-related reductions even in homes that have adopted similar measures. Pilot results indicate low rates of implementation of energy saving measures in HVAC systems, as well as high rates of inefficient (and broken) windows, as shown in Figure ES-4. When given sufficient support, small businesses and low-income households exhibit a willingness to adopt measures that lower their resource use, with concomitant reductions in costs and emissions. This is evidenced by pilot participants’ willingness to spend upwards of one-hour during the work week to engage in the climate change audit, as well as the adoption rate associated with kit items (see Figures ES-2 and ES-3, below). However, these populations typically need third-party assistance to overcome a number of barriers,
3 The engineering economics approach assumes perfect information for all, no market failures and all actors, including low-income families, are operating at peak efficiency already.

11
including access to information (e.g., knowledge of available subsidies) and investment capital. #�3 4 � ����5��
5 ������� �6 ���! �����1 ��( ���$�������7 � �������
n = 50
0%
10%
20%
30%
40%
50%
60%
70%
80%
90%
CFL Pow erStrip Refillabew ater bottle
used.
Avoidedpurchase of
w ater.
Canvas bag Kill-o-w attMeter
#�3 4 � ����5+�
�20��� � �� ��������! ���� ���������������� ������� ����
n = 50
82%
4%
14%
In use
Not using, don't like
Not using, no need

12 #�34�����5*�
�������
����
��������
�����
��8������
�����
�����3� �
��������3
��� ���
��
n =
50
0%
10%
20%
30%
40%
50%
60%
70%
80%DuctsSealed
Ducts Taped
DuctsInsulated
Usefireplace
No SinkFaucetAerator
Have afireplace
No WaterHeaterBlanket
Never CleanRefrigerator
Coils
Windowssingle
pane/cracks

13
II. �� ������������� � ����������� ������������ ��������! ���������� Local, state, and federal agencies developing policies to address global climate
change are grapplin with a number of complex issues, including how best to reduce greenhouse gas emissions, how to obtain substantial emission reductions quickly, and how to mitigate the adverse economic consequences of both climate change and the policies adopted to address the problem,4 which will likely hit already vulnerable communities the hardest.5 Low-income families and small businesses in marginalized communities are often less resilient than higher income households or large businesses and, as a result, face a greater risk of being harmed from climate and policy-induced changes. However, carefully crafted policies have the potential to produce overall societal benefits, including reductions in other air pollutants and economic and public health improvements that can help society’s most vulnerable members.
Under Assembly Bill (AB) 32, California's Global Warming Solutions Act, a “cap-and-trade” regime is scheduled to be implemented starting in 2012. AB 32 sets an overall emissions limit for large emissions sources and requires them to either directly reduce their emissions or purchase allowances from other sources. Cap-and-trade policies create a market for emissions, opening up profitable opportunities for polluters to “do well by doing good.” Existing cap-and-trade proposals6, however, do not allow small sources such as emissions related to the use of vehicles, equipment (e.g., lawn mowers, off-road vehicles), and electrical appliances at households and small businesses to participate in the market7. Whereas the point of regulation remains firmly with the regulated entity required to hold allowances equal to emissions, community crediting can provide additional low-cost allowances to the marketplace. Community-based reductions would focus on actions that will be principally paid back in the form of avoided energy, water, waste disposal, or transportation costs. As will be discussed later in this report, there are many examples of greenhouse gas reducing measures that are net economically beneficial, including vehicle fuel efficiency and commercial heating ventilation and air conditioning upgrades and maintenance.8
4 See Moss, Steven J., “Community-Based Trading Mechanisms to Reduce Polluting Air
Emissions and Address Global Warming,” Journal of Environmental Assessment, Policy, and Management, Volume 1, Number 2, June 1999. 5 Rachel Morello Frosch, Manuel Pastor, Jim Sadd, and Seth Shonkoff, The Climate Gap: Inequalities in How Climate Change Hurts Americans & How to Close the Gap, May 2009, http://college.usc.edu/geography/ESPE/perepub.html 6 CARB released a Preliminary Draft Regulation for the AB32 cap and trade program. See http://www.arb.ca.gov/cc/capandtrade/meetings/121409/pdr.pdf, Nov. 24, 2009. 7 For example, as currently described in CARB’s preliminary draft regulation for the AB32 cap and trade program, community or a neighborhood cannot replace all of its inefficient refrigerators and sell the resulting pollution reductions in the emissions market. 8 Creyts et al., 2007, Reducing U.S. Greenhouse Gas Emissions: How Much at What Cost?
Executive Report. December. See Exhibit B, page xiii. And, Sweeney, Weyant et al., 2008, DRAFT Analysis of Measures to Meet the Requirements of California’s Assembly Bill 32, Precourt Institute for Energy Efficiency, Stanford University. Discussion Draft September 27

14
As indicated in the figure below, small commercial, residential and transportation emissions were responsible for nearly 60 percent of California’s greenhouse gas emissions (GHG) in 2007. If these sources are not allowed to participate in a cap-and-trade market, grassroots and individual emission reduction efforts will be walled off from obtaining economic gains by doing the right thing. Millions of tons of greenhouse gas emissions will remain unabated as a result, and hard-pressed communities which rely disproportionately on older vehicles and inefficient appliances that lead to greater amounts of pollution will be locked out of a potential source of much-needed revenue.9
#�3 4 � ����
� ������9��:..)������$������ ���� �������".
Several community protections provisions were written into AB 32 to ensure that
disadvantaged and low-income11 communities are not adversely impacted by and benefit directly from the state’s emissions reductions strategies. The AB32 provisions include:
• “…maximize additional environmental and economic co-benefits…” (Div 25.5 Sec 38501(h)); • “…do not disproportionately impact low-income communities…” (Sec 38562(b)(2)), and
9 Transportation fuels will be part of the AB 32 cap and trade program starting in 2015, with an upstream point of regulation at the fuel provider. ". California Air Resources Board, Climate Change Proposed Scoping Plan, October, 2008. Figure 2, Page 13. 11 “Environmental Justice is the fair treatment and meaningful involvement of all people regardless of race, color, national origin, or income with respect to the development, implementation, and enforcement of environmental laws, regulations, and policies. EPA has this goal for all communities and persons across this Nation. It will be achieved when everyone enjoys the same degree of protection from environmental and health hazards and equal access to the decision-making process to have a healthy environment in which to live, learn, and work," EPA definition at http://www.epa.gov/oecaerth/environmentaljustice/.

15
• “…ensure that activities undertaken pursuant to the regulations complement, and do not interfere with, efforts to achieve and maintain federal and state ambient air quality standards and to reduce toxic air contaminant emissions…” (Sec 38562(b)(4)) • “…to direct public and private investment toward the most disadvantaged communities in California,” (Sec 38565).
One approach to ensuring that vulnerable communities benefit from AB32 is to enable participation in cap-and-trade markets. Under Climate for Community, small emission reductions would be aggregated into sufficiently large bundles of reductions so that they could be placed on carbon markets and traded.12 Doing so would provide the state with access to a large, hard-to-reach emissions pool. Climate for Community would provide a dynamic, ongoing incentive to reduce emissions while prompting concomitant economic and equity benefits. A thin domestic market for small-scale carbon emission reductions currently exists, as pioneered by TerraPass, Native Energy and other providers who sell reductions to voluntary buyers and exchanges, such as the Chicago Climate Exchange. Many of these voluntary offsets, however, would not withstand the scrutiny required to secure offsets for regulatory compliance. Instead, the offsets market is dominated by forest carbon sequestration, dairy farm digesters, and photovoltaic projects, with too few meeting rigorous standards for measurement and verification.13 Moreover, offsets providers have not penetrated deeply into low-income populations in the United States or the small business energy efficiency sector.14 For example, the Regional Greenhouse Gas Initiative is generating $130 million annually from a voluntary market, but households are currently not a creditable source for carbon reductions.15 Both the CDM and RGGI regulatory cap and trade programs allow for efficiency projects to be credited as offsets. However, there are a number of reasons why building and lighting energy efficiency, though economically attractive for tenants, has not received more interest from offset project developers. For example, they represent
12 An ancillary approach would be to create a common-denominator market for polluting air and greenhouse gas emissions, in which trades can be made across all emission sources and types. This could be accomplished through a few analytical steps. A relative value would have to be assigned to a unit reduction for all harmful emissions (e.g., a unit reduction of particulate matter might be worth ten times a unit reduction of carbon dioxide based on the public health, environmental, and economic damage caused by the different molecules). Precedent for such priority weighting has been established by the Carl Moyer Program. 13 For example, see TerraPass project types at http://www.terrapass.com/projects/categories.html, and a list of projects at http://www.climateactionreserve.org/. 14 Although not directly linked to the carbon market, there are notable examples of individual small businesses adopting energy efficiency measures, as discussed later in this report. See also CARB's website profiles of small businesses, and activities of commercial enterprises such as Village Green Environmental Solutions, which started in Australia but has recently opened an office in California. 15 www.rggi.org/home. RGGI does allow for offsets crediting outside of the electricity sector for reduction of GHG emissions from natural gas, oil or propane combustion due to end-use energy efficiency in the building sector ( see Model Rule, www.rggi.org/docs/Model%20Rule%20Revised%2012.31.08.pdf) starting page 112).

16
individual, small reductions with high transaction and administrative costs, and limited profit potential; and they reflect a heterogeneous, interactive range of measures that can be hard to quantify with standard verification techniques.
Conceptually, community-based emission reductions are similar to offsets with a few important differences. First, offsets must take place outside of the emissions cap. For example, enhancing carbon sequestration in forests and reducing methane emissions on farms would count as offsets since forestry and agriculture are not included under California’s emissions cap. Community reductions, however, include actions like energy efficiency upgrades that reduce emissions in the capped electricity sector. Because energy efficiency improvements like lighting retrofits and appliance replacements are critical community reduction strategies, it would not be appropriate to treat them as offsets since emissions changes occur in capped sectors. Second, compliance-grade offsets are held to very high standards in terms of quantification, verification, permanence, additionality, and realness. Applying the exact same standard to community reductions may not be appropriate. It will be important to set at least a minimum threshold to establish the integrity of reductions, but there are good reasons to pursue community reductions even if they can’t meet the rigorous standards of an offsets protocol. Community reductions provide much needed equity benefits for disadvantaged populations—an important requirement of AB 32—that may warrant additional consideration. Despite inherent uncertainties, it may be preferable to pursue aggregated reductions as a means to protect communities rather than costlier alternatives that provide financial relief with no direct environmental benefits. Climate for Community addresses two key policy requirements associated with cap-and-trade programs, (1) help low-income families and small businesses cope with higher energy prices and address environmental equity issues, and (2) cost-effective means to reduce greenhouse gas emissions
Adoption of the concept would help to address the following market failures:
• Slow technology transfer. Low-income households and small businesses tend to
have older, inefficient equipment, resulting in higher energy use and concomitant polluting air and greenhouse gas emissions.16
• Lack of capital. Reluctance to retire old equipment and appliances is partially due to a lack of capital to purchase new equipment and split incentives to do so (e.g., the renter pays the utility bill, but the property owner owns the appliances; or, the renter pays the bills and owns the appliances but anticipates that they will not be staying long enough to enjoy the returns from efficiency investments).
• Knowledge gaps. Inefficient behaviors and equipment are also the result of information gaps. For example, small businesses may not be attuned to avoiding
16
For example, Californians who earn more than $100,000 annually are 6 percent more likely to own two year old refrigerators, 1.5 percent more likely to own two to seven year old refrigerators, and 4 percent less likely to own eight to 10 years old refrigerators compared with Californians who make less than $25,000 a year. See KEMA, Inc., RASS Reports. California Statewide Residential Appliance Saturation Study. websafe.kemainc.com/RASSWEB/DesktopDefault.aspx.

17
peak electricity prices, and families may not recognize that plugged-in appliances continue to use electricity even when they’re turned off.17,18 In general, utility rebate programs require customers to seek out the information themselves or read it as part of a bill insert. Even if a customer inquires further, the application process can be tedious and hard to navigate, preventing low-income households and small businesses from taking advantage of incentives that will save them money.19
• Transactions costs. Market actors prefer investments that provide the highest returns. Implementing many measures at many small sources is presumed to provide less "bang for the buck" than measures aimed at larger power users and/or emission sources because the cost of each individual transaction may be significant. As a result, a large pool of important, but small and dispersed, reductions is underutilized, and the economics of verification have been neither tested nor optimized when, in practice, thoughtful implementation and learning by doing can lower transactions costs and improve cost-effectiveness.20
• Regressive economic effects of climate policy. Decision makers are increasingly concerned that low-income families tend to live in areas that have above-average environmental hazards and that this population, along with small businesses, will be least able to pay the higher resource prices likely to result from policies adopted to address global climate change. This, in turn, has prompted a search for ways to address equity issues as part of a cap-and-trade regime.
The first four deficiencies have helped create a well known gap between socially
cost-effective behavior and consumption patterns and actual marketplace conditions.21 This is the case even after decades of utility- and government-sponsored interventions. For example, in a recent survey SF Power found that one-fifth of refrigerators located in low-income San Francisco households could be cost-effectively replaced.22
17 M.Cubed, San Francisco Community Power, and Energy and Environmental Economics, Distributed Energy Resource Implementation: Testing Effective Load Management at the Feeder Level, Draft Interim Report, published by the California Energy Commission, Winter, 2007. 18
A report by Lawrence Berkeley National Laboratory indicates that in 2006 low-power mode energy use in California accounted for 13% of residential electricity use, or 982 kWh/yr per home. Meier, A., et al., Low Power Mode Energy Consumption in California Homes, 2008, California Energy Commission, Public Interest Energy Research Program, Report No. CEC-500-2008-035: Sacramento, Calif. 19 Even one of the report authors found one utility’s rebate process for insulation and refrigerators so cumbersome that he ended up not completing the forms, thereby forfeiting hundreds of dollars in rebates. 20 See for example, Steven J. Moss, Customer Segmentation as Applied to Energy Efficiency Programs, published by the California Institute of Energy and Environment, Fall, 2008. 21 Generally, see http://enduse.lbl.gov/Projects/EfficiencyGap.html, and for example reports, see Golove, William and Joseph Eto. 1996. Market Barriers to Energy Efficiency: A Critical Reappraisal of the Rationale for Public Policies to Promote Energy-Efficiency. Berkeley, CA: Lawrence Berkeley National Laboratory. Report No. LBL-38059. March; Sanstad, Alan H. and Richard B. Howarth. 1994. "'Normal' Markets, Market Imperfections, and Energy Efficiency." Energy Policy 22(10): 811-818. 22 Steven Moss, et al. “Climate for Community: Creating a sustainable platform for low-income families and small businesses to participate in emissions allowance markets.” White Paper developed by San Francisco Community Power and Environmental Defense Fund, 2009.

18
Climate for Community is intended to address all five of these deficiencies by crafting methods that can be incorporated into a cap-and-trade framework. Under this concept a dynamic mechanism will be created to identify inefficient technology, help finance retrofits and replacements and associated education efforts, and address equity concerns related to vulnerable populations.23 Although carbon value in itself may not pay the full costs of appliance replacements, for example, it can be captured and aggregated to provide an economic trigger to induce faster adoption of energy efficient devices and spark an ongoing market-based incentive to identify carbon-saving opportunities.
23 Steven Moss, “Community-Based Trading Mechanisms to Reduce Polluting Air Emissions and Address Global Warming,” Journal of Environmental Assessment, Policy, and Management, June 1999.

19
���� ���� ��$����$��! ���������� ���! � �
�� ������� ��������������� ����������A number of technical challenges pertain to aggregating reductions for crediting,
as summarized in Appendix A. Establishing that reductions are real involves several sequential steps:
• Identify methods to demonstrate that the project will result in real reductions, including establishing business-as-usual (BAU) emissions forecasts and assessing additionality • Develop a priori estimates of project-related emissions reductions, using existing evidence on technology performance (i.e., performance benchmarks) and assessments of existing BAU practices and technologies. • Implement the project • Conduct ex-post evaluations to determine the extent to which anticipated implementation has occurred. • Undergo disinterested, third-party verification of project reductions • Credit project reductions • Convert credit value into community deliverables, such as cash or additional efficiency investments
#�3 4 � ����
��$�� ���������� � ������ �������

20
For Climate for Community to be successful additional steps must be taken by regulating agencies; notably establishing a framework to address key analytical questions and allowing aggregation within the cap-and-trade program. For example, the technical framework must accommodate necessary adjustments to allowance distribution (i.e., setting aside allowances to use for crediting aggregated reductions), creating a list of certified aggregators and verifiers, and establishing pre-certification rules based on performance benchmarks. While the term “verification” is used often to describe this entire process, we consider verification the discrete step of third party review of a project and associated reductions claims.
� � � ������! "����������# "����������������$ ��"�������Methods for quantifying greenhouse gas reductions are well developed, both in
terms of the engineering approaches and the regulatory edifice to support emissions estimation and control. Offsets crediting for existing regulatory compliance cap and trade programs, notably the Clean Development Mechanism (CDM) under the Kyoto protocol and the Regional Greenhouse Gas Initiative, as well as voluntary emissions reductions markets, provide technical guidelines for determining that emissions reductions are real, additional, verified and permanent, and that reductions commitments are contractually enforceable. These methods are codified in protocols, but only a few protocols exist for the types of reductions that are of interest for community-scale aggregation, notably building and lighting energy efficiency. Further, a formal protocol may not be necessary in cases in which an alternative verification framework exists to quantify reductions with sufficient rigor. Building energy efficiency, in particular, has received attention from CDM offsets developers.24 The CDM project-based protocol for compact fluorescent lights is directly applicable to community-scale aggregation, though CFLs are just one of myriad technologies and behaviors that can reduce emissions associated with buildings. 25 As a UNEP Sustainable Buildings and Construction Initiative report finds, as of May 2008 only 6 of 3,000 offsets projects proposed for CDM crediting included building energy efficiency.26 These statistics indicate that we may be missing out on a huge opportunity to achieve near-term, low-cost emission reductions even where appropriate regulatory avenues already exist. The reasons for lack of robust efforts to implement efficiency offsets projects are discussed in the second chapter of this report (Impetus for Community Aggregation).
The UNEP study suggested that the CDM has an opportunity to provide incentives for building energy efficiency projects. As well, the IPCC fourth assessment reported that building energy efficiency measures have the largest single potential to
24 See UNEP, The Kyoto Protocol, Clean Development Mechanism, and the Building and Construction Sector. 2008. 25 See an example project form application at http://cdm.unfccc.int/UserManagement/FileStorage/QYJ6ZE3M9SI21TAUXO57PCBW0VNDKL; see also http://www.energymanagertraining.com/CDM/cdm_main.htm 26 UNEP. 2008.

21
reduce greenhouse gas emissions,27 but that these reductions are not likely to be inspired by putting a price on greenhouse gas emissions via carbon markets. Recommendations to increase the cost-effectiveness and profit potential of such projects include:
• Avoid creating the need to establish crediting protocols for individual measures or technologies; • Establish building performance-based metrics for estimating emissions reductions to lower administration costs and encourage the bundling of activities that, together, improve the energy performance of a building, and • Inspire innovation in building energy efficiency without the constraints associated with regulatory incorporation as approved CDM projects.
These recommendations provide a basis for our concept of a Gold Standard for Equity method of insuring that aggregated reductions are real.
%� ��"�� ����&�����������������! �'����������������("��)��The UNEP findings suggest several techniques that streamline verification based
on a body of evidence provided by experience and engineering studies. Our concept for verifying small, dispersed reductions relies on pre-certification based on performance expectations, utilizes the descriptive power of statistical sampling, and addresses uncertainties pertaining to any one intervention by conceiving of intervention packages that provide a sort of internal counterbalance (or, statistically, compensating errors). While these techniques can be robust and reliable, the fact that this class of reductions is inherently less reliable can be addressed with discounting. This demonstration and verification construct that we describe as a “Gold Standard for Equity” can be considered akin to project- or sector-based protocols.
�� )���������� �Additional reductions are those that aren’t already required by law or are not
going to occur anyway due to natural economic forces. The term typically applies to emission reductions that are to be counted as offsets, not to capped sector reductions. In the case of community reductions, expectations about financial additionality must be tempered by the context of the populations of interest.
While it is important to ensure that all reductions are real, different standards must be applied to low-income communities when crediting reductions. For example, we have already indicated that low-income households and small businesses tend to rely on old, inefficient appliances, even when replacing them with efficient models would be cost-effective. This implies that financial additionality is not appropriate as it would rule
27
Levine, M., D. Ürge-Vorsatz, K. Blok, L. Geng, D. Harvey, S. Lang, G. Levermore, A. Mongameli Mehlwana, S. Mirasgedis, A. Novikova, J. Rilling, H. Yoshino, 2007: Residential and commercial buildings. In Climate Change 2007: Mitigation. Contribution of Working Group III to the Fourth Assessment Report of the Intergovernmental Panel on Climate Change [B. Metz, O.R. Davidson, P.R. Bosch, R. Dave, L.A. Meyer (eds)], Cambridge University Press, Cambridge, United Kingdom and New York, NY, USA., pg. 389.

22
out reductions that are cost-effective on their own but where other adoption barriers persist. The RGGI Model Rule does not require demonstrations of financial additionality, but developers of project-based protocols within the CDM routinely establish that the value of offset credits is what makes the effort profitable.
The Western Climate Initiative Offsets Committee identified several parameters that define additional reductions, including baseline emissions, eligibility of projects based on starting dates, and period of crediting.28 To be successful, Climate for Community must achieve faster or greater GHG emissions reductions than required by law. For example, California electric utilities are already required to implement energy efficiency projects. Therefore, any reductions achieved through these required programs are not additional and should not be credited as community reductions. But if Climate for Community triggers greater penetration of utility or municipal efficiency programs, or produces emission reductions through services that aren’t offered by utilities or public sector entities, the “extra” reductions should be considered additional. The United Nations Framework Convention on Climate Change (UNFCCC) deals with this very issue in its Joint Implementation (JI) projects by allowing for demonstrations that either the regulatory programs are not enforced or that new activities increase enforcement beyond mandatory levels. The JI protocol also allows for a “Program of Activities” (PoAs) where a number of different emission reduction measures can be grouped together – similar to the concept of aggregating reduction projects.
“PoAs addressing mandatory local/regional/national policies and regulations are permissible provided it is demonstrated that these policies and regulations are systematically not enforced and that noncompliance with those requirements is widespread in the country/region. If they are enforced, the effect of the PoA is to increase the enforcement beyond the mandatory level required.”29
The WCI outlines four different options for evaluating additional reductions with
varying administrative costs and reliability30:
1. Project specific: Evaluating the reductions for each project according to specific additionality criteria;
2. Performance standard: Establishing a performance standard (e.g., metric for GHG pollution per unit of energy produced) beyond which any reductions would be considered additional;
3. Protocol specific: Define project typologies and outline detailed protocols for assessing additional reductions, and
4. Hybrid: Using performance standards and specific project requirements within protocols for certain reduction activities.
28 WCI Offsets Committee White Paper, Task 1: Offset System Essential Elements, Offset Definition (Task 1.1) and Eligibility Criteria (Task 1.2) [Draft]; www.westernclimateinitiative.org. 29
http://cdm.unfccc.int/EB/032/eb32_repan38.pdf, #3 at pg. 2. 30 WCI Offsets White Paper, pg. 4.

23
Climate for Community entails a hybrid approach that identifies a portfolio of reduction activities, each with a range of outcomes that are pre-certified based on a priori performance benchmarks and statistical sampling. For example, a community aggregator could identify average energy ratings for household appliances and lighting fixtures in a given area. Only those appliances that exceed an energy performance standard tied to that average could be credited as community reductions. Measures that only meet or fall below the standard can be assumed to have been likely to occur anyway.
Post-implementation verification would adjust the outcomes ascribed to individual projects, and, over time, can be used to update pre-certification assumptions. Regulating agencies can provide a variety of services to inspire consumer confidence, as entrepreneurial inspiration. For example, algorithmic "pre-certification" may be used to forecast ex-post evaluation results, with credit value based on ultimate returns but low-rate capital loans provided by local implementing agencies that invest, long term, in sustaining the use of measures. Regulating agencies already provide carbon emissions "calculators", a natural next step is to develop aggregation toolkits that walk individuals and small business operators through emissions reducing measures, and administrative steps, such as establishing a baseline or presence and use of specific technologies, as well as ex post monitoring and reporting and, perhaps, willingness to allow spot verifier inspections. In this way, the pre-certification equation would allow project developers to bound their expectations and garner investor support, while Bayesian-like updating based on ex-post evaluation will continually refine the environmental integrity of the credits that are ultimately awarded.�
�7 % ���������$�� ������� ��Pilot study findings indicate that there is a strong basis for establishing
additionality for a number of actions that would be prompted under the Climate for Community rubric. Consider the well-studied, and extensively marketed, compact fluorescent light bulb (CFL). The market is considered to be relatively saturated, with little opportunity for additional CFL penetration and associated avoided energy use. However, our pilot study found that low income households had significant potential for additional CFL use. A recent CEC-sponsored study of CFL market penetration found that more than nineteen out of twenty respondents in California (95.8%) are familiar with CFLs by name or brief description.31 Further, nearly eight out of ten (79%) households in California said they currently use at least one CFL inside or outside their home, which is significantly (at the 90% confidence level) more than the 66% of households in the comparison area.32 Our pilot found that 82% of 50 survey respondents used the CFLs we provided as part of the emissions reduction kits. Only 6% of respondents stated that they had not used the provided CFLs because they already had some. Another 6% said they were waiting for their pre-installed light bulbs to burn out before using the provided CFLs.
31 CEC CFL Report, pg. 85. 32 CEC CFL Report, pg. 80. The Comparison Area comprised of Kansas, Pennsylvania, and Georgia represents a population analogous to California but without targeted CFL programs.

24
Only the remaining 6% were reluctant to use CFLs even if they were provided for free. These findings are dramatically different from the CEC study, and support our hypothesis that the pilot study population (i.e., residents in low-income households) is not being reached as effectively as those surveyed in the CEC study. Recognizing that some populations weren't being reached effectively, the California Upstream Lighting Program encouraged many lighting manufacturers and retailers to enter the California retail CFL market for the first time, and to use additional distribution channels, such as ethnic groceries and discount (dollar) stores that had not previously been offering CFLs. The CEC report also found that, compared to areas without utility-led CFL distribution programs, Californians acquire CFLs from a greater variety of distribution channels, including significantly more from grocery and drug stores.33 This experience suggests that dynamic methods that provide sufficient incentives for action could prompt third-parties to fund creative, diverse, and effective means of reaching underserved populations.
The CEC study also provides useful baseline information about the number of CFLs used in each home, as shown in the table below. #�3 4 � ��+�
; �� ��������20��������� ������ ������$����$� ���<����=�������������������20�>�
The table suggests that homes in which CFLs are used still have opportunities to use more CFLs. Twenty-five percent (25%) of respondents have 4 or fewer CFLs installed currently, a statistic that can be compared with the average number of CFL-compatible lighting fixtures to estimate additionality potential. However, in so doing,
33
CEC Report, page 97. Households in the Comparison Area buy most of their CFL's from large home improvement stores (41%) and mass merchandise stores (37%, significantly more than the 12% in California). They buy fewer CFLs from other distribution channels, including significantly fewer from grocery (3% versus 8%) and drug stores (<1% versus 5%), two channels targeted by the California IOU program.[pg. 97]

25
this may be systematically underestimating CFL additionality in hard to reach communities where our pilot research indicates much lower CFL penetration rates.
For example, as shown in Figure 4, more than 80% of households surveyed were using the CFL they were given despite reported saturation in California's major utility markets. Only 14% reported that they weren't using the CFL because they didn't need it. Less than 5% indicated they weren't using the CFL because they didn't like one or more of its attributes.
#�3 4 � ��*�
�20��� � �� ��������! ��������0�1 ������ ��/ ����$� ���
n = 50
82%
4%
14%
In use
Not using, don't like
Not using, no need
Another way to contemplate additionality is to examine the rate at which
incandescent bulbs are being purchased. The CEC study found that nearly half of all households (47%) in California purchased light bulbs in the past three months. Of those households purchasing bulbs, 28% purchased CFLs, 58% purchased incandescent, and 46% purchased some type of specialty bulb. The high rate of "specialty bulb" purchases begs an observation. If the incentive structures are correctly crafted, aggregation will create an allowance market incentive to search for the most efficient technologies. For example, light emitting diode systems are poised to displace less efficient lights, including CFLs. With the marketplace properly structured, superior cost-effective technologies will be implemented without regulatory edicts that otherwise tend to select technology winners a priori, and lack the reflexivity of market-based policies.
�7 #� �� ������������ ����$8�� Existing regulatory and voluntary offsets protocols provide a strong technical basis for verifying building and lighting energy efficiency projects. � Though building and energy efficiency offsets credits are allowed within regulatory cap and trade programs, very few such projects have been developed. � The definition of additional reductions should include those activities that go beyond mandatory levels or achieve reductions where there is systematic noncompliance.
26
� Sanctioned reduction activities can be pre-certified as additional a priori in neighborhoods with low penetration rates.
�� *�������������������+������&��&���+��� �������An assessment of additional, real reductions must include a robust calculation of
existing (and possibly historical) baselines and a business-as-usual (BAU) forecast of emissions. Establishing baseline and BAU forecasts introduces two new sets of uncertainties: (1) incomplete or biased data upon which historical or current baselines are based, and (2) divergence from assumed and actual forecast parameters. Neither of these uncertainties is analytically intractable. For the class of small, dispersed reductions, baseline estimates may be developed based on real-time data from advanced utility meters; and statistical sampling to describe a population, rather than direct observation of the entire population. In addition to producing a statistically robust baseline, this step can inform the level of sampling needed to achieve acceptable power in ex-post verification.34 Projects with reliable baselines will provide for more reliable verification. For example, major appliances that have highly consistent usage characteristics will have a straightforward baseline derived from their energy rating (and, where appropriate, adjustments for performance degradation due to expectations about equipment deterioration and maintenance). Surveys and studies of average energy usage behavior for specific technologies can form the basis of baseline assumptions with ex post evaluations identifying significant deviations and needed revisions. Lessons from small business Demand Response Programs Different methods to accurately estimate baseline electricity use, including time specific (hourly) deviations, have been extensively examined in the context of utility regulatory proceedings, even though the exact actions that resulted in energy use change are unspecified. In practice, the need for detailed knowledge of actions is obviated by an ability to observe actual energy usage. Pacific Gas and Electric Company’s (PG&E) Capacity Bidding Program (CBP) provides an example of a demonstrated approach to developing a baseline and award credit for electricity load reductions during infrequent, brief (two to eight-hour), peak demand periods. These baseline and monitoring methods are deemed sufficiently reliable to form the basis for payments to customers for their avoided energy use. Along these lines a CBP-based pilot focusing on small businesses, and implemented by SF Power, reveals load declines that are shown clearly with hourly digital meter data. Figure 5 shows a small office building achieved load reductions during three demand response episodes, on August 29, 30 and 31 in 2007. While the program lasted for only four hours (as shown in the box marked with a dotted line in Figure 5), the data show clearly load reductions before and after the requested curtailment period.
34 The statistics literature has a well-established relationship between estimation power, sample size, and distributional attributes (i.e., standard deviation and shape of distribution). In the case of normally distributed values, the probability that the mean value estimated from sampling is close to the true, but unknown, mean is a function of both sample size and standard deviation. Similar relationships exist for non-normal distributions.

27
Similar methodologies can be employed to verify changes associated with other community-scale actions, particularly given the fact that California investor-owned utility ratepayers will have full access to digital meters by 2012. Demand response programs enable utilities to pay groups of customers for avoided energy use during selected times. Community aggregation utilizes a similar fiscal pathway, by enabling families and small businesses to opt into programs that use carbon market allowance value as the payment mechanism. #�3 4 � ��)�� ����������, �� �������6 ���3���� ��������8 ������, �� ����������2�������#'�
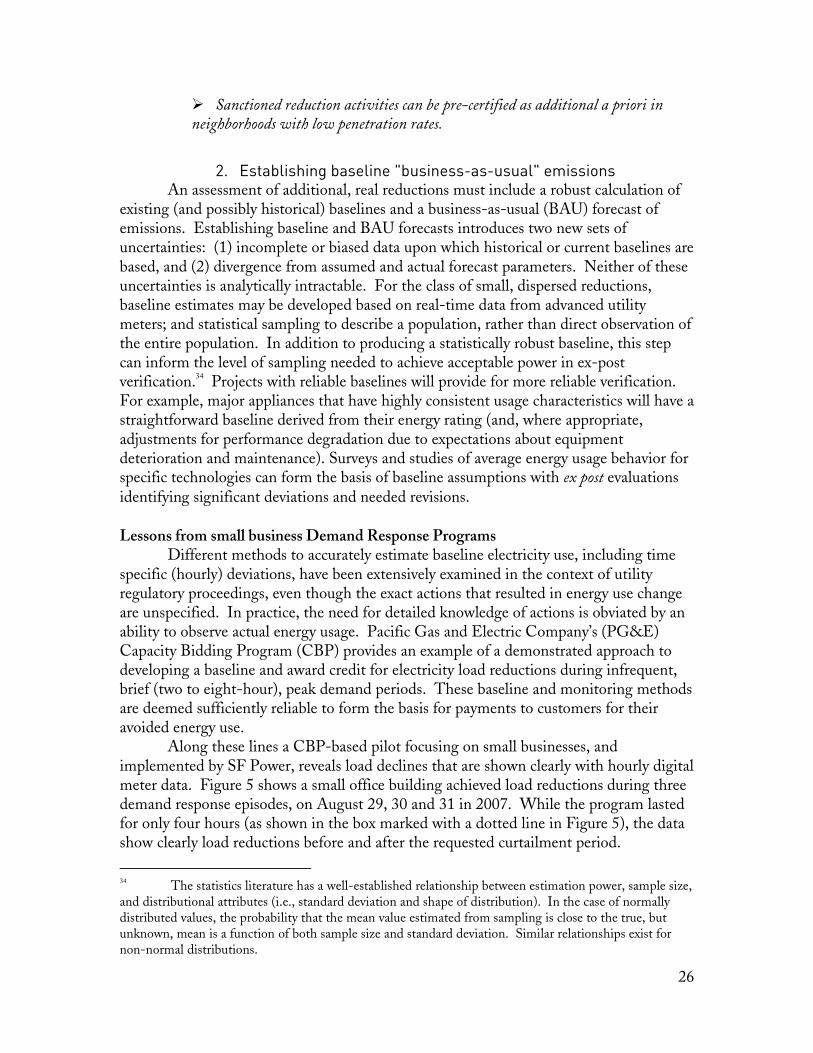
Pilot Study Finding: Household Refrigerators We compared the energy savings potential from refrigerator replacements against PG&E bills for 21 homes in the pilot study, as shown in Figure 6a. Mean savings as a percentage of electricity bills are shown in Figure 6b. If the 41.4% outlier value (#21) is included in the calculation, the mean value is 6.0%. But if it is removed, the sample size drops to 20and the mean becomes 4.2% with a 95% confidence interval of 2.9 to 5.5%.36 These findings demonstrate how high levels of confidence can be ascribed to avoided energy use from large appliance replacements, in this case refrigerators, and that overall the replacement of refrigerators can trim energy bills by about 5%. Energy prices are forecasted to rise in the range of 10% due to California's climate policies, with some significance regional differences. For low income households to be
35 Moss, S. and Fine, J. Distributed Energy Resource Impelementation: Testing Implementation of a Demand Response Program within a Small Business Population. California Energy Commission Public Interest Energy Research Program. Final Project Report. Pg. 31. 36 We scrutinized the outlier and found that, indeed, the refrigerator in the home was dominating electricity load and is thus appropriate to include in the sample.
0
100
200
300
400
500
600
700
800
1 AM
2 AM
3 AM
4 AM
5 AM
6 AM
7 AM
8 AM
9 AM
10 A
M11
AM
Noon
1 PM
2 PM
3 PM
4 PM
5 PM
6 PM
7 PM
8 PM
9 PM
10 P
M11
PM
Midnigh
t
Baseline
29-Aug-07
30-Aug-07
31-Aug-07

28
unharmed by these higher prices, one starting point is to lower overall energy demand. Reducing demand by ~9% will maintain energy bills at a constant level if prices rise 10%. Therefore, refrigerator replacement can be expected to get half way toward that goal. #�3 4 � ��.� ��������� ���������������������������� ��� ����
Percentage Reduction of Energy Bill due to Refrigerator Replacement for 21 Survey Respondents
0.0%
5.0%
10.0%
15.0%
20.0%
25.0%
30.0%
35.0%
40.0%
45.0%
1 2 3 4 5 6 7 8 9 10 11 12 13 14 15 16 17 18 19 20 21
Respondents (mean = 6%)
29
#�3 4 � ��.� � ������� ������������1 ���� � ����
0.0%1.0%2.0%
3.0%4.0%5.0%6.0%
7.0%8.0%9.0%
1Benefits depending on Sample Size
Ho
use
ho
ld A
void
ed E
ner
gy
Bill
n=21
n=20
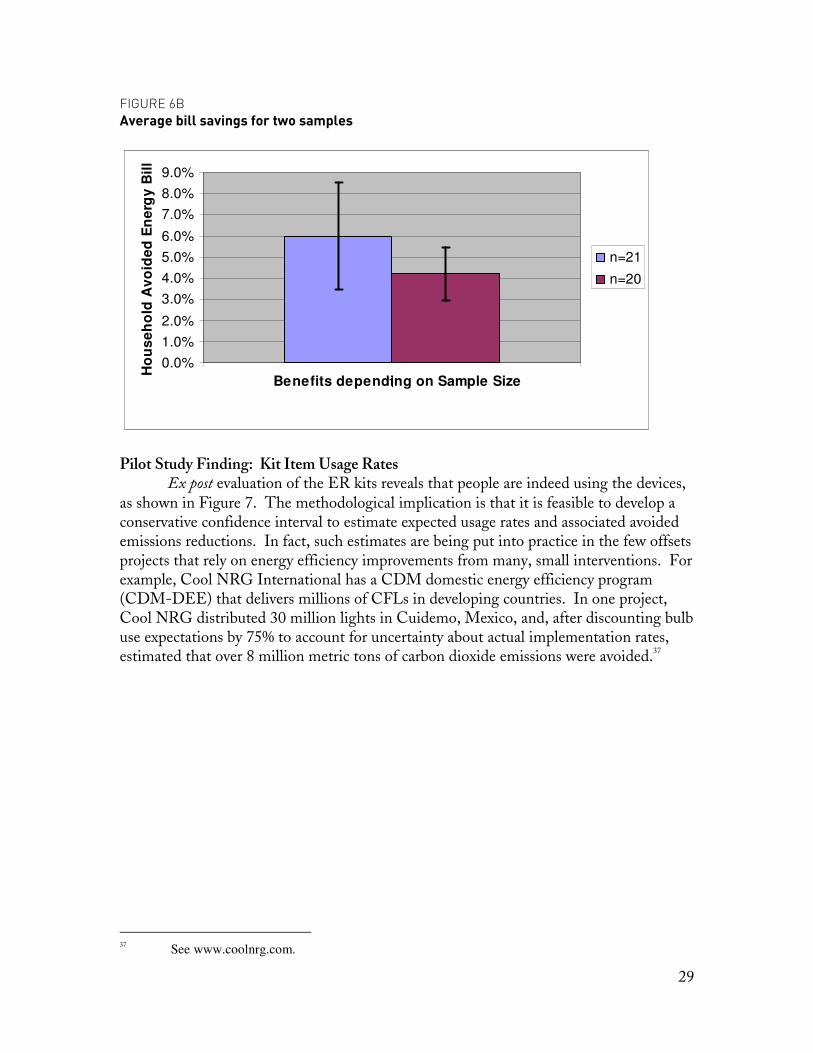
Pilot Study Finding: Kit Item Usage Rates Ex post evaluation of the ER kits reveals that people are indeed using the devices, as shown in Figure 7. The methodological implication is that it is feasible to develop a conservative confidence interval to estimate expected usage rates and associated avoided emissions reductions. In fact, such estimates are being put into practice in the few offsets projects that rely on energy efficiency improvements from many, small interventions. For example, Cool NRG International has a CDM domestic energy efficiency program (CDM-DEE) that delivers millions of CFLs in developing countries. In one project, Cool NRG distributed 30 million lights in Cuidemo, Mexico, and, after discounting bulb use expectations by 75% to account for uncertainty about actual implementation rates, estimated that over 8 million metric tons of carbon dioxide emissions were avoided.37
37 See www.coolnrg.com.

30
#�3 4 � ��'�6 ������������� ���������� ������� �������! ���������5 �����
Kit Item Use Rates (after tw o months)(n = 50)
0%
10%
20%
30%40%
50%60%
70%80%
90%
CFL Pow erStrip Refillabew ater bottle
used.
Avoidedpurchase of
w ater.
Canvas bag Kill-o-w attMeter
�
�7 #� �� �������������� �������� ����������� ����� ��� ����� ������������ ��!� ��� �8�
� It is feasible to establish a baseline for evaluating emission reduction activities. A combination of data reconciliation, pre-certification and statistical sampling can be used to derive a preliminary estimate to be confirmed or revised via future inspection. In many instances, sufficient data exist already. Additional sampling can provide data with which to update a priori baseline and forecast assumptions.
3. ,������ ���&������- ��������,��&!���������������,��������� Performance metrics based on experiences and testing can support preliminary
estimates of expected intervention outcomes. Actual performance and persistence merit ongoing evaluation as well. With established performance benchmarks, specified actions can be pre-certified by regulating agencies to be assumed to generate a specified amount of reductions. This will give confidence to all parties to the action: actors, service providers, regulating agencies and financiers.
Performance metrics may pertain to whole-building performance, individual appliances, and heating, ventilation and cooling (HVAC) systems. Whereas building performance is typically evaluated using computer-based simulation modeling, the utility bill is another metric by which to evaluate performance. Metered electricity or natural gas can be monitored to provide a backstop measure of performance. For example, crediting might be based on a requirement that a household or commercial enterprise does not increase metered energy use over a prior period. Ensuring that there is some
31
level of tracking to demonstrate the persistence of reductions is essential to maintaining the integrity of the program and achieving real environmental performance.
Performance-based metrics can facilitate the regulatory demonstration of building energy efficiency savings, and simplify monitoring and verification requirements. Nevertheless, application of such metrics requires clear understanding of technical potential and baseline business-as-usual expectations to determine what performance can be considered additional. Fortunately, considerable data exists to establish reliable expectations for the performance of certain measures. For example, we have a wealth of experimental data and auditing skill, including site testing and simulation modeling that can together predict expected benefits of efficiency investments with a high degree of confidence. Steps for translating these metrics into offsets credits have been taken already; for example, the aforementioned RGGI Model Rule and CDM offset protocols, as well as Title 24 standards of the California Building code.
For energy efficiency improvements such as refrigerator replacements, some assumption about avoided emissions from electricity generation is inevitably necessary. While it is not defensible to claim that any individual action, such as a singular appliance replacement, results in avoided generation from any individual power plant, the prospects of many small actions resulting in less electricity generation is real and demonstrable analytically. For example, the impact of replacing one light bulb is undetectable but one million new light bulbs may be noticeable in modeling simulations of grid-based electricity supply. Two steps are needed that are first informed by engineering studies and prior experience: (1) Sampling actions to determine measure effectiveness and implementation rates, and (2) Modeling of the power supply system to estimate how significant (or aggregated) energy efficiency results in changes in power generation.
Ultimately, an emissions factor must be identified and any value chosen will most certainly be open to criticism. This will be the case particularly when assessing the carbon intensity of energy efficiency-related reductions. Different factors will apply if one assumes action avoids electricity generated by the state’s average power supply mix, by the emissions of hypothetical additional supply, by the dirtiest sources, or any combination thereof. While there is an ongoing need to augment our knowledge about the effectiveness of various efficiency interventions, this will not always be the case. As interventions are tried and evaluated, pre-certification values become will be refined. One example of an existing technical resource is the Database for Energy Efficiency Research (DEER) maintained by the California Energy Commission. Ex-post monitoring will allow for continual Bayesian updating that refines the accuracy of pre-certification values.
�7 #� �� ��������% �5���������� �� Emission reduction measures could be pre-certified. Similar to emission-reduction
efforts for criteria pollutants (e.g., California's guidelines for Carl Moyer program cost effectiveness calculations38) and energy efficiency programs (e.g., DEER), emission reduction activities implemented by third-party aggregators could be
38 See Carl Moyer program Guidelines, Part IV, Appendices B, C, D and F at http://www.arb.ca.gov/msprog/moyer/guidelines/cmp_guidelines_part4.pdf.

32
pre-certified, subject to ex-post verification, or be proposed as specific projects to be approved by the appropriate regulatory agency.
� .�����������.�� ������Direct observation based on statistical sampling can be a robust way to describe a
population without observing every individual. Direct observation increases the confidence associated with verification, but it also increases transaction costs; there is a tradeoff between verification cost and confidence. For energy efficiency projects, it is possible to observe technology use, and perhaps to confirm certain behaviors, but there is an intractable disconnect when attempting to associate avoided energy use with reduced electricity generation. Again, statistics can help, and so too can validated, physically-based simulations of electricity supply systems. Also, utilities have a well-developed set of tools for estimating the impacts of various efficiency and conservation interventions on power generation. These techniques can be applied to establish the additionality of community-based interventions. When verification involves observation of many small measures as well as actions that might not be observable directly (e.g., turning off power strips), proxy observations through statistical sampling will be necessary to manage verification costs. While sampling techniques can never be as reliable as comprehensive direct observation, they do reflect well-established means to describe a population and associated actions with determinable degrees of certainty. Given the large "population" of measures and actors, direct observation quickly becomes intractable, but statistical sampling becomes ever more reliable as a general rule. The remaining question is what sample size is needed to describe a population. The answer is contingent on non-technical subjective decisions, such as the acceptable level of uncertainty in statistical calculations of expected values, and technical issues such as the size of the actual population and known or expected variability within the population. Indeed, a reflexive regulatory approach might be to create an algorithm that discounts calculated emissions reductions as a function of the statistical power of sampling-based verification. Additional ideas for weighting factors are discussed below.
Statistical sampling is built into the RGGI Model Rule pertaining to offsets crediting for building HVAC improvements.39 Sample language in the RGGI Model Rule pertaining to statistical sampling includes:
Provision for sampling of multiple like offset projects in residential buildings. Offset projects that implement similar measures in multiple residential buildings may employ representative sampling of buildings to determine aggregate baseline energy usage and energy savings. Sampling protocols shall employ sound statistical methods such that there is 95% confidence that the reported value is within 10% of the true mean. Any sampling plan shall be certified by an independent verifier, accredited pursuant to section XX-10.6.40
39 See note 12 for reference to relevant section in RGGI Model Rule. 40 page 121, RGGI Model Rule, Dec. 31, 2008, italics in original
33
Unfortunately, the statistical language in the RGGI Model Rule belies our
naiveté in designing offsets protocols since it is not possible to know the "true" mean and thus presupposes knowledge that will never be available. The RGGI approach also specifies emissions factors (and oxidation rates) for greenhouse gases produced from commercial and residential boilers so as to establish baseline performance. In this sense, RGGI lays the groundwork and builds upon CDM project-based offsets protocols for lighting energy efficiency.
Statistical sampling is a valid method for quantifying emission reductions, subject to periodic evaluation and revision. Reduction estimates may need to be discounted based on inherent measurement uncertainty. A reflexive regulatory approach that balances verification uncertainty with transactions cost might be an algorithm that discounts calculated emissions reductions as a function of the statistical power of sampling-based verification.
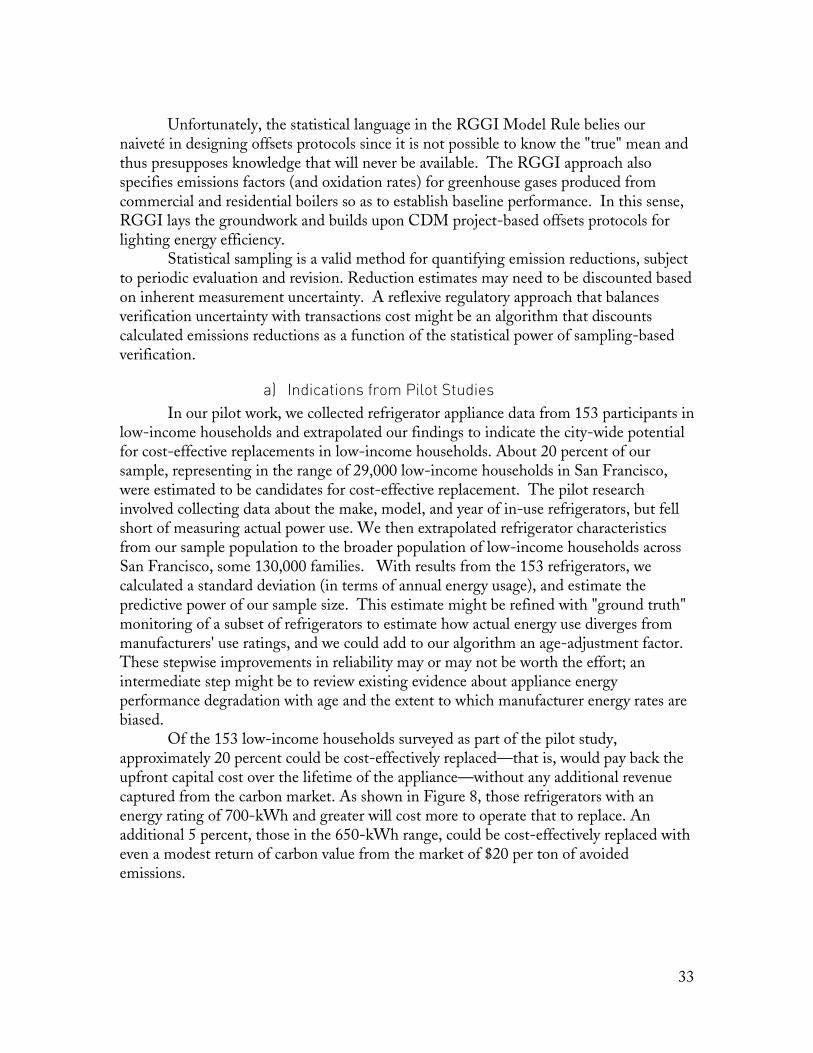
�7 � ������� ���� �% �������������
In our pilot work, we collected refrigerator appliance data from 153 participants in low-income households and extrapolated our findings to indicate the city-wide potential for cost-effective replacements in low-income households. About 20 percent of our sample, representing in the range of 29,000 low-income households in San Francisco, were estimated to be candidates for cost-effective replacement. The pilot research involved collecting data about the make, model, and year of in-use refrigerators, but fell short of measuring actual power use. We then extrapolated refrigerator characteristics from our sample population to the broader population of low-income households across San Francisco, some 130,000 families. With results from the 153 refrigerators, we calculated a standard deviation (in terms of annual energy usage), and estimate the predictive power of our sample size. This estimate might be refined with "ground truth" monitoring of a subset of refrigerators to estimate how actual energy use diverges from manufacturers' use ratings, and we could add to our algorithm an age-adjustment factor. These stepwise improvements in reliability may or may not be worth the effort; an intermediate step might be to review existing evidence about appliance energy performance degradation with age and the extent to which manufacturer energy rates are biased. Of the 153 low-income households surveyed as part of the pilot study, approximately 20 percent could be cost-effectively replaced—that is, would pay back the upfront capital cost over the lifetime of the appliance—without any additional revenue captured from the carbon market. As shown in Figure 8, those refrigerators with an energy rating of 700-kWh and greater will cost more to operate that to replace. An additional 5 percent, those in the 650-kWh range, could be cost-effectively replaced with even a modest return of carbon value from the market of $20 per ton of avoided emissions.
34
#�3 4 � ��-�/ ������ ����! �����������������������0�1 ������ �����2��������/ ����$� ���
$� � ��������/��������In the prior section we introduced the idea of discounting estimated emissions
reductions as a function of the confidence in verification methods. To the extent that reduction strategies yield equity benefits or concurrent direct co-pollutant reductions, these additional benefits might be embodied in credit values so as to inspire more of these community benefitting reductions. In this context, a new type of credit could be introduced into the marketplace that is based on a Gold Standard for Equity, with valuation that reflects greenhouse gas emissions, the concentration of low-income residents who have been historically subjected to disproportionately high pollution levels, as well as the incidence of toxic and smog-forming pollution.
The Gold Standard concept was first developed as a way of certifying premium carbon credits under the UNFCCC Clean Development Mechanism41. Developed countries that are parties to the Kyoto Protocol can fund CDM projects in the developing world as a way to offset their emissions. However, in the years since CDM has been operating, the integrity of the program has been called into question as a result of lax accounting or perverse incentives.
As a result, the international environmental community established a certification program for identifying high-quality offsets worthy of its Gold Standard. Achieving the Gold Standard label provides assurance that an offsets developer has complied with the strictest accounting standards and verification methods.
41 http://www.cdmgoldstandard.org/

35
Here we propose an analogous Gold Standard for Equity that would certify reductions generated in priority areas, notably environmental justice communities that AB 32 compels rule makers to pay particular attention to. While still achieving sufficient rigor, the Gold Standard for Equity would carry additional weight in assigning value to community reductions that reflects their societal importance.
The Gold Standard for Equity could be based on emission reductions achieved in environmental justice communities (e.g., communities distinguishable by race, class or culture that are near a disproportionate amount of pollution).42 These reductions could be assigned a higher value, or emitters located in EJ communities could be required to match the purchase of offset credits with "instep" reductions generated within communities that bear extra emission burdens. This would prevent local emission sources from purchasing all of their credits outside vulnerable communities while continuing to emit in these same places.
A co-pollutant, preferred, or "instep" credit approach could similarly be crafted through a few analytical steps. A relative value would have to be assigned to a unit reduction for all harmful emissions. For example, a unit reduction of particulate matter might be worth ten times a unit reduction of carbon dioxide based on the public health, environmental, and economic damage caused by the different pollutant types. Emission reduction strategies, from smoke stack scrubbers to electrifying diesel motors, could then be verified to result in a specific amount of reductions. For instance, if a community retrofitted all of its wood-burning fireplaces to natural gas or electricity it would receive pre-established emission credits.
While weighting mechanisms may inspire instep reductions, carbon values could be concurrently discounted to account for inherent, unavoidable uncertainties. More generally, reductions assigned to different activities could be discounted as a way to address the difficulty of verifying precisely the emission reductions from a diverse set of actions. The emission value of these packages would be determined by whether or not they are implemented in predefined communities and the quality of the associated measurement and verification. For example, technology measures like installation of energy-efficient lighting and appliances (i.e. measures for which comprehensive outcome data can be provided) would receive full credit with discounted credit provided for less reliable measurement and validation. Estimates for measures that rely on behavioral changes would be based on existing data or supporting analyses created as part of package development. Actual outcomes could then be validated using parameters drawn from locally observable data (e.g., gasoline sales reported to the Board of Equalization for local service stations; ridership on specific transit routes; local circuit loads).
Discounting ratios have been used in a number of settings to mitigate for the uncertainty of environmental impacts and the ability of particular reduction strategies to compensate for them. For example, the Clean Air Act Amendments passed in 1990 to control emissions of smog-forming pollutants allowed regional air districts to determine their own methods for dealing with new emission sources. In the South Coast Air
42 Program design needs to include a clear definition of the communities eligible for preferred emissions reductions. Communities located nearby the 700 major greenhouse gas point sources in California are also obvious choices.. We discuss community identification in a separate section.

36
Quality Management District, an extreme ozone non-attainment area, new pollution sources are required to offset twice as much pollution as they expected to generate.
Federal climate legislation is contemplating a similar method of discounting to give priority to domestic emission reductions that can be more easily monitored and verified compared to international offset reduction (such as reduced deforestation credits). The American Clean Energy Security Act (Waxman-Markey) passed the House of Representatives with a provision to credit only four emission allowances for every five tons of emission reductions achieved outside of the United States.
Similarly, emission reduction projects in priority low-income communities could be discounted in several ways to improve their competitiveness. Where uncertainty remains high, aggregators could be required to present additional reductions such that every three tons of CO2e reduced yields only two allowances. In other instances where uncertainty is low but delivery costs are high, aggregators could receive three allowances for every two tons of CO2e reduced (with the remaining value coming from co-pollutant reductions, government subsidy or other funding source).
(� �0�������� ����.��%������������An important element in demonstrating that emission reductions are real and
verifiable is maintaining transparency. Methods for soliciting stakeholder feedback must be outlined at the outset to ensure programs are constantly improved. Creating an open and transparent process will help to minimize gaming on behalf of any entity that stands to gain from taking credit for reducing emissions.
Two other dimensions of transparency include agency licensing (or certification) of aggregators, and disinterested, third-party review of verification findings. The state may want to consider establishing criteria for certifying eligible aggregators that agree to meet certain standards for implementing projects and accounting for emission reductions. This will provide a higher degree of accountability from aggregators and provide an easy way to track projects as they are completed and credited. Then third-party verifiers, perhaps the same organizations that evaluate offsets projects, would review project implementation and confirm that emission reductions conform to established standards. Reduction credits generated by licensed aggregators and verified by certified third parties would thus be essentially guaranteed administrative acceptance, giving the whole process more transparency and predictability.

37
� � *������)������������ ����'��"�����%�� � "������
Within the context of climate policy risks and benefits, environmental justice communities can be defined by several attributes:
• Proximity to emission sources – Communities near highways, power plants and
industrial facilities suffer from exposure to toxic air pollutants co-emitted with greenhouse gases;
• Sensitivity to utility rate increases – Low-income households spend the greatest percentage of their budget to pay utility bills, and will be hit hardest by future rate increases;43
• Inequitable pollution burden and share of benefits – People living in polluted communities are rarely the ones profiting from the commercial activities that produce the pollution.
CARB rule makers refer to "disadvantaged" communities, but the more
descriptive term is environmental justice communities. Activities that lead to greenhouse gas emissions occur almost everywhere, yet many emission sources tend to be concentrated in particular areas especially along busy transportation corridors and in industrial zones. Historically, property values are lower in heavily polluted areas, drawing low-income residents who cannot afford to live elsewhere. The result is a high coincidence of low-income communities of color in highly polluted areas, creating discernable clusters of environmental and economic inequalities. While the Climate for Community mechanism need not be limited to disadvantaged communities, the primary focus should be on delivering benefits to both low-income and environmental justice communities. The top priority, of course, would be places where the two overlap.
�� 1 ))2- 3 �!)4 *�.�� �A study conducted by the Bay Area Air Quality Management District
(BAAQMD) as part of their Community Air Risk Evaluation (CARE) initiative demonstrated that toxic air contaminants in the Bay Area tend to cluster in geographic and demographic “hotspots.” As shown on the map, areas in the top quartile of exposure to toxic air contaminants also encompass areas with concentrations of low-income households.44 These low-income communities abut congested highways, major shipping ports, oil refineries, power plants, and other industrial facilities and associated truck traffic that put people at serious risk from unhealthy air quality.
43 Don Fullerton, Distributional Effects of Environmental and Energy Policy: An Introduction, National Bureau of Economic Research, Working Paper 14241, August 2008; Greenstein, Robert, Sharon Parrott and Arloc Sherman. Designing Climate-Change Legislation that Shields Low-Income Households from Increased Poverty and Hardship, Center on Budget and Policy Priorities, Revised May 9, 2008. http://www.cbpp.org/files/10-25-07climate.pdf. 44 Defined as those households living below 185% of the federal poverty level. For reference, the 2009 poverty guidelines designated by the U.S. Department of Health and Human Services set an income threshold of $22,050 for a family of four (http://aspe.hhs.gov/poverty/09poverty.shtml).

38
�� !� ����"���� �����.�������- ��������The California Air Resources Board has engaged several California university
researchers to develop a Cumulative Impact Screening Method that could form the basis to identify EJ communities. Similarly, the BAAQMD’s CARE program estimated air toxic emissions on a two by two kilometer grid for the San Francisco Bay Area, as shown in Figure 9. This type of research has been applied to the Los Angeles Air Basin as well, and provides methodological guidance for characterizing these areas, along with other studies. In addition, communities located near the 700 major greenhouse gas point sources in California might be treated as EJ communities.
Such methods can be developed into tools to identify, at the neighborhood (e.g., assessor parcel) scale, areas with sensitive receptors that are already experiencing disproportionate cumulative environmental health risks. Though some significant data gaps remain, notably representation of the Central Valley, most of these data have been gathered.45
Even with a cumulative impact assessment tool, there is still a regulatory need for a stakeholder-informed process to determine how to apply the tool. Its flexible design allows for many different approaches to assessing cumulative impacts. This public discussion also should address how, if at all, to use the tool in a forecast mode to estimate the future cumulative impacts of flexible compliance programs in AB 32.
45
Organizing these data into a useable geographic information system platform is non-trivial and will require local government coordination.

39
#�3 4 � ��(�, ?( 7 �� ! ��� ����������@���� � ��������

40
�� ���������������&��������By our parlance, aggregators are organizations capable of implementing emission-
reducing interventions in homes and small business in collaboration with community members. Verifiers provide disinterested, third-party reviews of demonstrations that emission reductions are real. Offset project verifiers can provide their same services to aggregation projects, but regulating agencies might also perform this role.
Any number of community-based organizations could serve as aggregators under the Climate for Community concept. Organizations that already have extensive networks of constituents to whom they provide information and services may be particularly well suited for this function. Key capacities of a third-party aggregator include:
• Link individuals to utility, state, and federal programs; • Provide emission-reducing services, and • Monitor and report the behavior of their customers to track how those services are being implemented.
Having technical expertise in managing household utilities and a familiarity with
government agencies, local utilities, and the programs they offer would be valuable, but not necessary. Many community-based organizations already provide a link to programs that provide incentives to households and small businesses to make energy efficiency and water conservation improvements. A primary function of such organizations is to provide access to rebate programs offered by local, state, and federal agencies. Small business associations, religious institutions, third-party service providers, and other entities have performed these functions in the past. While organizations providing services and maintaining networks in communities are good candidates to serve as aggregators, state and federal oversight agencies may need to certify that such organizations meet institutional capacity requirements. An official aggregator registry could be formed, or aggregators could simply partner with a state agency such as the ARB to implement projects. Another manifestation of this arrangement could be to create a dedicated non-profit organization that serves as a clearinghouse to credit allowances and develop projects with individual aggregators. Aggregator certification would help customers determine what organizations can be trusted, and could form the basis for a system of information exchange between agencies, emission reduction vendors, and aggregators. Verifiers are already scheduled to be certified as part of the regulatory offsets programs. Third-party aggregators could be certified. Any community-based group – Chambers of Commerce, Parent-Teacher Associations, business associations, local government agencies and environmental groups – could be allowed to implement emission-reducing activities as an aggregator. However, to be eligible to claim the resulting values aggregators should be required to register with an appropriate regulatory agency, similar to California Air Resources Board’s plans to develop a list of offset project verifiers. This approach mirrors the requirement for California demand-response providers to register with an electric utility, and how offset provider claims are reviewed.

41
�� �)������������������)�������&������������� ������
Our pilot studies focused on three methodological foils: a kit of energy and water-savings technologies, refrigerators and toilets. These three sets of interventions represent a portfolio approach, a plug-in appliance with easy-to-measure energy usage but split incentives, and a water-saving device without split incentives. Ultimately, we must consider the full range of actions that might be suggested for pooling. While we are interested in examples of real project types, this methodology identifies attributes that generally lend themselves to reliable reductions quantification at relatively low monitoring and verification costs. In contemplating projects appropriate for verification with a Gold Standard for Equity, we consider their co-benefit potential as well. In a presentation to the California Air Resources Board in May, 2008, Derik Broehkoff of the World Resources Institute used uncertainty and co-benefit axes to categorize potential offsets projects, as shown in Figure 10. #�3 4 � ��� �8 �������3��4�����3 ������������, ��������3������ ����! � ��� �������&���������$��! �������������! � �-���
�- Broekhoff, D. Carbon Offsets and Incentive Mechanisms. World Resources Institute. May 28, 2008, Slide 20.

42
The categorization and findings of Broehkoff suggest that the community-benefitting projects are better addressed through "incentives" than offsets. Furthermore, Broehkoff suggests that one way to fund such incentives is to set aside emissions allowances.47 We address the set aside concept and its utility in ameliorating double counting and ownership disputes in a later chapter. Features of the Gold Standard for Equity, and example project types, are shown in Figure 11. The most reliable verification method is to observe actions and/or technologies in direct association with measured emissions reductions. Where emissions reductions cannot be observed directly, the next best verification will be observing actions and/or technologies. Where additional analytical steps, such as comparison to forecasted business-as-usual emissions, or self-reporting of activities, are necessary, AB 32’s community benefits language provides regulatory impetus to consider a Gold Standard for Equity. What is not shown in the Gold Standard for Equity summary table below is our essential claim that aggregation projects ought to be focused in environmental justice communities. �#�3 4 � �����
��������������������������8 ����������������3� ���������3��� �����
Establishing that Reductions are Real � Indirect or Direct Reductions in Disadvantaged Communities � Legal additionality � Project-specific and analytically robust forecast of baseline emissions � Performance benchmarks or other means of establishing a baseline � Pre-certification of emissions reductions (with ex-poste verification) � Testimonial affidavits of commitments to take specified actions � Portfolio of interventions � Ex-post statistical sampling to verify implementation � Disinterested third party verification
Example Projects Appropriate for Gold Standard Verification for Equity � Building retrofits and redesigns, such as HVAC retro-commissioning/ replacement,
weatherization, to reduce electricity use or to reduce onside fuel combustion � Increased efficiency of multi-unit building HVAC boilers � Avoided electricity and water use from fixture and appliance replacements � Transportation mode or fuel switching, or efficiency improvements � Solid waste management (recycling and composting) � On-site renewable electricity production � Hot water conservation
47 Broehkoff, 2008. Slide 11.

43
�&� �������� ���������������
Regulators, community stakeholders and regulated entities may think that aggregating community reductions is a good idea, but if the reductions are not cost competitive then the marketplace will not seek them and the program will not reach significant implementation scales. In this sense, the ultimate arbiter of what is cost-effective and what actions are actually inspired by putting a price on global warming pollution is the competitive marketplace for emissions allowances. Yet, we have strong reason to believe that community-benefit emission reductions to be engendered by the Climate for Community program face market barriers that will impede their implementation even if cost-competitive. For this reason, it may be that the value of aggregated credits is determined administratively (e.g., using an algorithm tied to prevailing allowance prices), rather than left to the marketplace to value.
Regardless of how aggregation credits ultimately are valued within allowance markets, when choosing where to direct regulatory efforts, both the potential magnitude of reductions and their cost-effectiveness must be considered a priori. Furthermore, there are near-term regulatory costs associated with developing the concept for inclusion in the AB32 cap and trade program. Cost-effectiveness potential can and should be applied as a regulatory screening device to determine what rules and regulations are worth the effort to develop. In this chapter we address the regulatory question: can aggregation be done cost effectively when compared with other emissions control measures? We consider cost-effectiveness from the perspectives of regulated entities within the cap-and-trade program, aggregation project administrators and consumers. When we consider consumers, we expand our thinking about costs and benefits to include co-benefits. We identify existing analyses of the cost-effectiveness of measures that might be taken by households and small enterprises and subsequently aggregated for carbon market crediting. Though these estimates systematically fail to incorporate benefits associated with co-pollutant reductions, many attractive measures will reduce pollution and save money. We then consider how to minimize the costs of Gold Standard for Equity verification by packaging interventions and piggy-backing on existing programs. Last, we consider market failures that impede the full utilization of net economically beneficial measures that also reduce greenhouse gas emissions and consider how aggregation might help to ameliorate these failures by inspiring existing (and new) organizations to take on aggregator roles. We define marginal abatement costs as the private cost of achieving emissions reductions minus resultant avoided costs, notably avoided energy costs. Transactions costs include both administration and verification costs. Administration costs pertain to implementing programs, such as program design and outreach. These costs are distinct from the costs of verification (i.e., time delay and professional fees for third party verifiers) that are incurred by private parties along the credit supply chain. There is a gray area in these definitions – the administrative costs of demonstrating that reductions are real. While this exercise is fundamentally antecedent to verification, it should not be confused with costs of third party verification and will include both public and private costs.

44
Directly or indirectly, the monetization of community reductions ought to be paid for by polluters. While it’s true that all consumers are culpable in the lifecycle emissions associated with consuming goods and services, the profits enjoyed by producing or providing those goods and services are not shared equally, so neither should be emissions abatement costs.
�� %���������������%��������Cost-effectiveness is an efficiency measure that does not inherently represent
equity (i.e., distributional implications). AB 32 defines cost-effectiveness explicitly as abatement costs divided by GHG emissions reduction tonnage, but doing so fails to consider who pays and who benefits.48 For example, retrofitting or replacing boilers in multi-family buildings can be cost effective once avoided energy costs are considered, but there may be disconnects between investors and beneficiaries.
Regulated entities will be faced with costs to reduce greenhouse gas emissions to levels set forth for 2020 and beyond. As a result, the cost-effectiveness metric appropriate for consideration is not the point at which capital costs are repaid within the useable lifetime of measures - such as for new appliances - but rather, it’s whether the cost of GHG reductions is equal to or less than the costs of alternative reduction measures. If greenhouse gas emissions allowances are trading at $20 per ton, then even measures with positive costs, so long as they are less than $20 per ton, will be worth doing. This tangible difference is shown in Figure 10, which is based on data from our pilot study, where less consumptive types of refrigerators become economically attractive to replace once allowance value is considered.
48
HSC Sec 38505(d). The language of the law is also internally inconsistent when it identifies of two objectives: maximizing reductions while minimizing costs. Economists preoccupied with optimization (i.e., seeking to minimize or maximize within constraints) immediately recognize that it is only by luck that both minimization and maximization of two attributes can be achieved simultaneously within a system. Given this logical conflict, we focus on cost minimization while considering emissions reductions goals to be meeting 2020 and 2050 caps, rather than reductions maximization.

45
#�3 4 � ��� ����������������! ����������! �� ��� ����� � �����:%A...�0�1 ������ ��/ ����$� ���������2��������1 ��$����1 ��$���������������� ����$������ ���� �������� �1 ����& ���<���B:.������������������������������� ������ �������>����
NPV Savings for Fridge Replacement
($20,000)
($10,000)
$0
$10,000
$20,000
$30,000
$40,000
$50,000
$60,000
$70,000
$80,000
$90,000
648kWh
661kWh
691kWh
695kWh
700kWh
715kWh
723kWh
726kWh
742kWh
760kWh
800kWh
1200kWh
Population of SF low-income refrigerators by Annual Energy Rating
NP
V S
avin
gs o
ver l
ifetim
e
Carbon credit ($20/ton)Energy Savings
When viewed from the perspective of a homeowner or enterprise, economic feasibility is met with measures that save at least as much, if not more, than money that they cost to implement. However, as previously discussed, there are a number of barriers, such as access to financing, that influence the "profitability" of community-scale actions. These barriers are discussed below and in a forthcoming report, considered within the context of existing financing mechanisms.49 �
As shown previously in Figure 8, of the 153 low-income households surveyed as part of the pilot study, approximately 20 percent could be cost-effectively replaced—that is, would pay back the upfront capital cost over the lifetime of the appliance—without any additional revenue captured from the carbon market. Those refrigerators with an energy rating of 700-kWh and greater will cost more to operate that to replace. An additional 5 percent, those in the 650-kWh range, could be cost-effectively replaced with even a modest return of carbon value from the market of $20 per ton of avoided emissions.
49 See Moss, S. and Fine, J., 2010, Left to Our Own Devices: Financing Efficiency for Small Businesses and Low Income Families. Environmental Defense Fund.

46
� � � ������'��+���� ����%���
Several marginal abatement cost (MAC) curves have been estimated for California,50 the entire U.S. 51, and the world52. The most recent, complete, and well-documented abatement cost curves for California are from the economic impact analyses conducted by CARB in support of the AB32 Scoping Plan and by Stanford University’s Precourt Energy Efficiency Center.53 The Stanford team estimated marginal abatement costs and the potential magnitude of reductions and provided initial assessments of each measures' uncertainty and price-responsiveness (reprinted herein as Figures 12A and 12B). #�3 4 � ������
�1 �����A�C �������� ����������������� , #:�����������'�
50 See work by Sweeney et al. at the Precourt Center for Energy Efficiency at Stanford, as well as the cost estimates prepared by CARB staff to analyze the economic impacts of AB32 at http://www.arb.ca.gov/cc/scopingplan/economics-sp/economics-sp.htm. 51 Creyts et at. (2007) Reducing GHG Emissions in the U.S.: How much at what cost? McKinsey & Co. and The Conference Board. See also EPA analysis of recent Federal legislative proposals at www.epa.gov/climatechange/economics/economicanalyses.html. 52 See the 2007 IPCC report at www.ipcc.ch/publications_and_data/ar4/wg3/en/contents.html, or research by the United Kindom Office of Climate Change at http://www.occ.gov.uk/activities/stern.htm. ? 53 Sweeney et al. (2007) Analysis of Measures to Meet the Requirements of California’s Assembly Bill 32 (DRAFT), Sept. 27. '� Sweeney et al. (2007) Page 14.

47
#�3 4 � ����� �
�1 �����9�������������� ! ,9���������3 ��� ��� ����� ��������������''��
We can draw general findings from Sweeney et al., as well as CARB and other work, notably by abatement cost estimates by McKinsey and Company. Transportation, building and appliance efficiency investments pay off quickly and can avoid significant quantities of greenhouse gas emissions. This finding is confirmed by other estimates of energy efficiency in the power sector.56
The Sweeney abatement curve indicates that a large number of actions taken by small businesses and households can reduce greenhouse gas emissions while providing net economic benefits. Energy efficiency, for example, can save more than the initial capital investment through avoided electricity or other utility bills.57 In the transportation sector, vehicle efficiency can pay for itself through avoided fuel costs.
With the Gold Standard for Equity, administration, monitoring and verification costs are more protracted and less refined than conventional offsets verification due to lack of practice and because small, dispersed actions are inherently harder to monitor and verify directly. Therefore we must consider the significance of cost adders, and revisit the cost-effectiveness metric without treating program administration cost as trivial. In so doing, however, we concurrently recognize that
'' Presented at Economic and Allocation Advisory Committee meeting, Aug. 13, 2009. 56 For example, see the conservation supply curves developed by the Northwest Power and Conservation Council at http://www.nwcouncil.org/energy/powerplan/6/supplycurves/default.htm. 57
See note 25. Creyts et al., 2007, Reducing U.S. Greenhouse Gas Emissions: How Much at What Cost? Executive Report. December. See Exhibit B, page xiii; Sweeney, Weyant et al., 2008, DRAFT Analysis of Measures to Meet the Requirements of California’s Assembly Bill 32, Precourt Institute for Energy Efficiency, Stanford University. Discussion Draft September 27

48
marginal benefits will be higher than just those associated with avoiding climate risks when community projects have co-benefits. The implication for cost-effectiveness is that community aggregation projects with significant co-benefits will have greater cost effectiveness than are represented in the strict metric of dollars per ton of greenhouse gas reduction.
�� )�� ����������!�����An important perspective is that of the program administrator (i.e., third-party
aggregator, regulating agency, and utility) which incurs transactions costs. Administrative costs can be triggered by taking actions to:
• Design and fund project • Achieve and document emissions reducing through outreach and education • Verify and credit reductions • Administer and report emissions reductions for crediting • Return credit value to communities and third party aggregators
There are numerous ways to reduce transactions costs. For example, third parties
can utilize existing networks and outreach programs, deliver streamlined program packages, and develop "seamless" financing mechanisms. In addition, outreach to inspire and verify actions need not and should not necessarily be conducted in isolation. Many organizations and programs are already underway in vulnerable communities. Be they public health clinics or utility-funded efficiency campaigns, there are already organizations operating in communities with existing social capital (e.g., networks) and the requisite skill set. For example, our piloting work piggy-backed on a high-efficiency toilet replacement program, thereby sharing the costs of program administration and avoiding the costs of building an outreach network from scratch.
�� 5�����������!�����There are several strategies to verify community-scale reductions that are likely to
be cost-effective. For instance, direct observation based on statistical sampling can be a robust way to describe a population without observing every individual. A complementary approach is to establish performance benchmarks and pre-certify reductions to be achieved for certain easy-to-verify actions.
There are yet more reasons to believe that transactions costs will decline even if they are relatively high during the initial phases of implementing community measures. Through scaling up and learning by doing, costs of broadly implemented measures are likely to decline in future years of implementation.

49
Administrative costs can be lessened by utilizing existing networks, delivering a package of services at one time, and integrating various financing mechanisms. Verifications cost may be substantial in some cases but can be limited by employing statistical sampling and performance benchmarks.
Costs of administration and verification may decline sharply as service providers refine their programs. Several strategies for minimizing administration costs are apparent already, such as linking into existing community outreach programs. Generally, aggregated reductions are likely to be administrable in ways that produce cost-effective reductions.
Allowing aggregation of emission reductions by many households and small businesses could help overcome emission trading transaction costs. Although it would be difficult for individuals to effectively participate in a cap-and-trade regime, third-party aggregation can catalyze community-based efforts, with carbon values funding part of third-party intervention efforts. For example, aggregation of modest-sized electricity use reductions – between 5 and 50 kilowatts – has proven to be cost-effective for small businesses during grid emergencies.
%� �������������"�� ����, �����*���������������� ��
As suggested by D. Broehkoff (2008) and shown earlier in Figure 10, projects that can achieve high co-benefits but uncertain global warming pollution reductions should be inspired using incentives rather than an offset mechanism. We agree but immediately contemplate what incentive systems are available58 and if they will overcome market failures or be of sufficient scale. Aggregation provides a dynamic market mechanism with the potential to scale up significantly by leveraging other incentive funding sources.
Market failures impede full utilization of community-benefitting reductions measures. Available incentive mechanisms can help to overcome these failures but are not likely to be sufficient. Aggregating reduction value for carbon market monetization adds another tool that will complement existing incentive programs in a dynamic way and without a finite pot of money dispersed by centralized decision-making.
Community pooling provides a new set of incentives that can inspire the marketplace to seek to invest in the same efforts that save residents and business owners money.
�� � �����������)�����1 ����������4 ��������6���� �The private and social costs of implementing comprehensive climate policy in
California will not be shared equally ipso facto. Businesses and individuals who can readily adopt low-carbon practices stand to benefit, while those without the resources or capacity to make substantial changes will suffer additional costs. At the household level, wealthier people can afford to purchase new fuel-efficient vehicles and make energy efficiency investments, or can more readily absorb the higher rates to continue their present lifestyle. Poorer people, on the other hand, lack the upfront capital to make 58 Ibid 50, Moss and Fine, Left to Our Own Devices.

50
investments, and will more likely end up spending more of their limited income on utility bills and fuel costs. Such regressive economic impacts could have significant societal ramifications as well. Without prioritizing investment in low-income communities, the gap between the wealthiest and poorest Californians will grow. In that respect, attempts to quantify the overall costs of emission reduction strategies must account for the indirect social costs of increased inequality.
The counterpoint is to recognize the added social benefits of reducing inequality by prioritizing investments that bring other benefits. Doing so changes the calculus of the cost-effectiveness equation, making certain types of reductions more attractive than others. Some reductions simply avoid GHG emissions, while other reduce GHG emissions and help build safer, healthier communities because they increase household and small business welfare and contribute benefits associated with co-pollutant reductions.
To the extent that reduction strategies yield equity benefits or concurrent direct co-pollutant reductions, these additional benefits might be embodied in credit values so as to inspire more of these community-benefitting reductions. As discussed prior, the Gold Standard for Equity could be based on emission reductions achieved in environmental justice communities.59 These reductions could be assigned a higher value, or emitters located in EJ communities could be required to match the purchase of offset credits with "instep" reductions generated within communities that bear extra emission burdens.
The value of community-based measures could be determined through a combination of market prices for carbon, consideration of equity and co-pollutant benefits, and acknowledgment of the risks that emission reductions estimated for community actions will actually be achieved. For example, payments that reflect the market value of carbon emissions allowances could be administratively adjusted upwards in cases in which emission reductions were obtained within a low-income community historically subjected to disproportionate environmental hazards. Likewise, payments could be adjusted downward to account for uncertainties.
Cost-effectiveness metrics defined by AB 32 are not equity measures and thus do not explicitly include co-pollutant benefits. Also, carbon markets will not automatically seek greenhouse gas reduction projects that provide significant co-benefits. A crediting mechanism that recognizes the economic value of co-pollutant reductions in specified geographic areas and adjusts for uncertainty as a function of the quality verification can signal to the marketplace that measures yielding co-pollutant reductions are more valuable than similar cost measures without co-pollutants.
59 Program design needs to include a clear definition of the communities eligible for preferred emissions reductions. We discuss this issue in the prior section.

51
�� !�� ������������� ����������"����������������"���� �����
7��������� � ������ Several regulatory programs have been suggested that would either return economic benefits to hard-pressed communities or provide environmental protection. Some of these approaches are cost-effective, others are not, but none of them offer the kind of dynamic and ongoing incentive that is needed to help vulnerable communities. One category of programs seeks to provide direct financial assistance to those in need via rebate checks, a yearly dividend, or utility discounts. While this type of economic payment has the potential to mitigate increased costs, it does nothing to change underlying behavior or provide a durable solution that will lower utility bills over the long run. Instead, the cash or check is often used to subsidize the continued use of inefficient, highly polluting technologies. In the worst cases, the money goes toward a consumer purchase that will increase energy usage and commit the user to higher utility costs. SF Power's analysis of the CARE program bears this out:
“Under state and federal energy assistance programs, low-income families can receive discounts on their energy bills. For example, the Californian for Alternative Rates for Energy (CARE) program provides low-income households with a 20 percent reduction in their utility rates. In 2008 Pacific Gas and Electric Company and Southern California Edison Company spent almost $600 million on the program.60 Although the policy’s goal of assisting low-income families is laudable, it can have the pernicious impact of subsidizing inefficient and environmentally damaging practices. That’s because low-income families tend to rely on older, inefficient appliances that use excessive amounts of electricity, natural gas, or heating oil. Subsidizing these families’ utility rates leads to greater energy consumption, essentially subsidizing the use of inefficient appliances, and the polluting air and greenhouse gas emissions associated with the generating resources necessary to meet this demand.61 Since particularly polluting power plants tend to be disproportionately located in low-income communities, the subsidies can have the unintended impact of reinforcing the poor environmental conditions in which the recipients may live.”
These types of programs offer a modest decrease in costs but guarantee no environmental benefit, and may in fact have the perverse effect of promoting the continued operation of inefficient technologies. Further, subsidies only perpetuate top-down models of addressing problems of both social equity and environmental justice. Communities must rely on state or federal funding to shield them from increased risks that are largely not of their own making. When funding levels are reduced or priorities
60 The federal Low Income Home Energy Assistance Program provides a similar subsidy. 61 For example, “Detailed modeling results show that on average, households are made worse off by the effort to protect them from electricity price changes because it will lead to greater electricity consumption.” Written Testimony of Dallas Burtraw, Senior Fellow, Resources for the Future, prepared for the U.S. Senate Committee on Finance, August 4, 2009.
52
shift (as they do during troubled economic times), already at-risk communities lose vital resources. A related regulatory concept is to create a community benefits fund that could provide capital to emission-reducing projects in specific areas. This has a direct link to environmental improvement that can create durable solutions for low-income communities in the form of weatherization projects, energy efficiency enhancements and the like. Assembly Bill (AB) 1405, for example, conceived of just such a structure that would take revenue from the cap-and-trade market and put it into a fund to support emission-reducing activities in disadvantaged communities. However, this kind of mechanism makes communities only ancillary players in the carbon market. Without a direct stake in the carbon market, it seems unlikely that the size of a community benefits fund will be sufficient. The result may be more spending for fewer reductions. Furthermore, project developers may lack certainty if they have to compete for funding via grant proposals rather than knowing ahead of time that they will be rewarded for presenting verified emission reductions. Finally, other proposals have suggested targeting more money towards expanding utility-based energy efficiency programs. To date, utility programs have had limited success in reaching low-income and historically polluted communities. At-risk populations may take a skeptical view of utility programs or simply not have the time to learn about and enroll in their services on their own. A community benefits organization, on the other hand, may be able to overcome these barriers. As an independent service provider, a CBO acting as an aggregator does not have a direct profit motive in selling a particular technology. More importantly, households and small businesses are more likely to trust a member of their own community than someone working for the utility company. Local organizations having existing networks in place and may gain access more easily, thereby lowering overall transaction costs. Also, by bundling services across different domains (energy, water, waste, transportation, building shell, consumer products), an aggregator can provide comprehensive emission-reducing services rather than just one rebate or discounted technology at a time. Utility companies should continue to do what they do best. In the transition to clean energy, they will have their hands full trying to improve operations, green the grid and deliver new emerging technologies. As the pace of technological advancement quickens, utilities will need to focus their attention on updating services for the vast majority of easily accessible homes and large commercial users. Dedicated outreach to low-income communities is unlikely to fall in their sweet spot. Investor-owned utilities are already required to prioritize energy efficiency investments while vulnerable communities are left behind. In many cases, the cost of labor is cheaper to have a local organization knocking on doors than it is for a highly-skilled technician to do the same. Other programs exist that seek to direct investment toward low-income communities, yet none of them provide the kind of dynamic, ongoing incentive that will empower communities to actively seek out reductions. Funding alone is not sufficient to break the cycle. Mailing rebate checks may put money in people’s pocket, but it will not change behavior or reduce emissions. Likewise, solely relying on efficiency programs will

53
continue to leave behind those who need help the most. Communities must be given an equal stake in combating climate change, and an equal opportunity to benefit from taking action. Helping local organizations to develop their resources and aggregate emission reductions has the greatest chance of delivering emission reduction results, now and in the future.

54
V. 2 & ������� ��" ��������� �� ��������& � ���2 & ������� ��" ��������� �� ��������& � ���2 & ������� ��" ��������� �� ��������& � ���2 & ������� ��" ��������� �� ��������& � ��� A major challenge in crediting community-based emission reductions is
determining who owns those reductions. In the case of energy efficiency and water conservation improvements, the actual emissions take place somewhere else, typically at a power plant that can be down the street or hundreds of miles away.
Because the electricity sector will be covered by the cap-and-trade program, it will be critical to ensure that community actions that result in capped sector reductions are not counted twice. Either the community implementing the actions or the power plant where the emissions were reduced should receive credit, but not both. Therefore, we need a mechanism to avoid double counting and establish ownership for community-based emission reductions.
Several methods could be used to assign ownership rights, including an allowance “set aside” or “carve out” from within the cap-and-trade program or by implementing offsets-like rules and requirements. A set aside or carve out works by identifying and reserving a pool of market allowances to be used for a specific purpose (see Figure 13). In this case, a portion of allowances under the overall cap would be set aside to be claimed by third parties that present aggregated community reductions from households and small businesses. In this way, community actors would get credit for energy efficiency improvements that result in emission reductions at the power plant. The utility is divested of responsibility for those capped emissions but can also not claim ownership for them. The set aside mechanism could work in at least two different ways. A pool of allowances could be subtracted from the cap, or a pot of money could be reserved to fund community efforts. If ARB administratively allocates a portion of allowances to a set aside pool, then third party aggregators would be awarded these allowances in exchange for verified reductions in their communities. Aggregators could then sell those allowances to return value to the community to invest in further reductions and maintain ongoing services into the future. Alternatively, capped entities could be required to purchase available allowances from vulnerable communities in their territory. The second option for a set aside is have ARB retain and sell the set aside allowances and deliver the resulting funds to communities for emission-reducing improvements. If funded through a more direct financial set aside, the state would have to designate a certain percentage of allowance revenue or a dollar value to be invested back into communities. The goal of both versions of the set aside mechanism is to direct investment from the carbon to low-income and historically polluted communities via third-party aggregators. Of course, not all community emission reductions will be achieved within capped sectors. Programs that get people to better utilize public transportation instead of their cars or to reduce direct emissions from gas-fired boilers may be outside of the cap and trade program boundaries. ARB could credit actions that reduce emissions outside of capped sectors as if they were offsets, with capped sector reductions returning value from set aside allowances. �

55
#�3 4 � ���+���$�� ����������� �����( ��$����
������8������� �����6�����3 �!� � � �������� ������$��������� ��� (/�
Providing these set asides will expand the pool of low-cost reductions, drive innovation, mitigate household and small business cost impacts, and benefit environmental justice communities. With these issues in mind, we conclude the following about double counting: To operate effectively within a cap-and-trade structure, community-based emission reduction activities should be assigned value as part of a carve-out. Otherwise, reductions occurring within sectors that are part of the cap-and-trade program would risk being counted twice: once by the community aggregator providing the reduction strategy and once by the regulated entity that controls the emission source (e.g., power plant).
Within a community carve-out, ownership of carbon reductions may be best assigned to a third party as a way of overcoming owner/renter challenges. In cases where appliance owners don’t pay associated energy costs (e.g., refrigerators and washing machines in rental units, lighting in businesses), they have little incentive to replace inefficient appliances, even if it would be cost-effective to do so from a societal, and the tenant’s, perspective. As a result, renters pay higher energy costs than would be expected under a pure engineering

56
economics approach62, with concomitantly higher polluting air and greenhouse gas emissions. By assigning carbon reduction values to a third party, that entity could flexibly focus the resulting benefits in ways that prompt property owners to adopt more efficient equipment. This could include initially working on equipment (e.g., coin-operated laundry facilities, toilets) in which split incentives don’t exist
62 The pure engineering economics approach assumes no market failures and that all actors, including low-income families, are operating with perfect economic efficiency, complete information and minimal transactions costs.

57
&�� ( �� ���������$�����$��� � ��������� ������� Phil Martien, Bay Area Air Quality Management District David Hungerford, California Energy Commission Jane Valentino, Center for Resource Solutions Martha Amram, Ennovationz Kristin Grenfell, Natural Resources Defense Council Kristin Douglas, California Public Utilities Commission Obadiah Bartholomy, Sacramento Municipal Utility District Chris Jones, UC Berkeley Shankar Prasad, Coalition for Clean Air Tim O'Connor, Environmental Defense Fund Jasmin Ansar, Union of Concerned Scientists Frances Thompson, PG&E Derek Walker, Environmental Defense Fund Mike McCormick, McCormick Climate Consulting Erik Winegar, California Air Resources Board Deidre Sanders, PG&E Claudia Orlando, California Air Resources Board Mihoyo Fuji, California Air Resources Board

58
&��� �������� *�( �����������$��� ��$ �����
A number of technical challenges pertain to aggregating reductions for crediting, as summarized in Matrix 1.
There is an inverse relationship between investing in verification certainty and cost-effectiveness. That is, costs rise as verification becomes more thorough and precise. Similarly, there is a tradeoff between reliability and verification costs because more observation increases verification expenses, but also increases confidence. Ultimately, we must identify the appropriate "sweet spot" where we can satisfy verification requirements at a reasonable cost. This includes balancing the need to achieve quite substantial emission reductions with the notion that reductions with a very high verification cost burden may need to be ignored or addressed outside a cap-and-trade structure.

59
��,� �9���
���$��� ��$ ���������3�� ������ � ������� ����$������ ���� ��������! ����������
Applicability to Aggregation How to address? Comments
Additional Reductions
Additionality applies to all reductions applying for allowance credits.
Aggregation projects must demonstrate that emission reductions would not have otherwise occurred without aggregation by establishing a baseline from which to calculate creditable reductions.
For electricity saving projects, aggregated reductions must (1) be distinct from utility or municipal programs; or (2) demonstrate increased penetration rates of utility or municipal programs. Reductions must be adjusted for depreciation, degradation and measurement limitations.
Co-pollutant reductions might also be considered within the context of additionality.
Measuring Reductions (“Real”)
Emissions reducing activities will have a range of measurability. At one end are emission reductions that can be directly observed. In the mid-range are projects that can be statistically verified, or pre-certified, with confidence.
A portfolio approach could be used to credit interventions that provide multiple measures, which have different probabilities associated with their actual use, to achieve reductions (e.g., emission reduction kit).
The diffuse nature of some projects may prohibit reliable measurement, especially projects with many end-users.
Given equity impetus and inherent challenges of directly observing reductions, a "trust but verify" using existing data, direct observation and third party review .
Using a priori and ex post in-person surveys, meter readings from individual appliances, and utility bills to collect data from project participants. Much of this information will be anecdotal but will be useful for statistical sampling as part of the "trust but verify" method.
Likewise, the pilot examined refrigerator electricity use principally based on manufacturers’ original data. Sample metering of various models could provide a basis for robust statistically-based verification of aggregated appliance replacement programs.
Aggregation could also use software and remote observation tools that measure energy use at the end-user level.63
The project’s GHG reductions are not real if they can’t be measured or quantified reliably.
Measurement requirements are the focus of project protocols to be approved by CARB.
Protocols set stage for aggregation rules. CCAR is developing a community-scale emissions estimation protocol, and other offsets protocols (e.g., urban forestry, truck stop electrification, public transit improvements, and energy efficiency) that may be relevant.
Crediting discounts might be used to overcome measurement uncertainties.
To minimize project and transactions costs, "materiality" supports the idea of measurement through sampling.
Permanence
Reductions attributed to aggregation projects must persist over defined time periods (e.g., be permanent). This is of limited concern to aggregation projects because avoided energy use or transportation fuel savings, for example, are by definition permanent.
All anticipated reductions must be considered permanent. If not, a quantitative discount method must be used in calculating the credits awarded.
Appliance swap out programs will require verified destruction of the original device.
Linking the concept of measurability and permanence is “deliverability”. Only reductions that actually occur would be credited (e.g., a CFL only saves energy if it replaces an existing incandescent, is installed, and used). Discounting methods driven by observed implementation and use rates can be used to calculate credits.
Verifiability
All GHG reduction projects must undergo verification from independent, CARB-approved verifiers. Aggregation projects must similarly be verified by "disinterested" parties.
Verifiers would need to use approved sampling methods, as in CPUC/IOU PGC program impact evaluations, to verify project implementation and associated reductions.
CARB would approve inclusion of Climate for Community within emissions reduction strategy.
Verification methods, and associated protocol development, would be akin to other crediting programs.
Cost Effectiveness
For all projects, extensive verification could create cost-effectiveness challenges because of the diffuse nature of aggregation projects.
Use statistical sampling, pre-certification and other methods to reduce the level and extent of effort needed by verifiers. Pre-certification would also address other existing market barriers.
Materiality is relevant – not all actions merit precise verification.
Define cost effectiveness from end user perspective, e.g. electricity customer.
It is not clear if all enabling technologies, such as digital meters, should be a part of the cost-effectiveness evaluation.
Ownership
When aggregation projects may overlap with reduction efforts by utilities and municipalities, it will be essential to specify ownership. For example, rights to claim GHG reductions from energy efficiency can be shared (or contested) by utilities, aggregators and energy end-user. Pre-agreement of ownership may be warranted to minimize risk and costly disputes.
Clear rules as to which party owns the GHG reduction credit should be developed.
It is common to require agreement on participation conditions before end-users receive the rebate. End-users receive the savings associated with the new technology and share value of GHG reductions credit. This example of sharing the environmental attributes of actions also is common in dispersed renewable power production.
63 Many observational technologies are available, such as digital utility meters, smart grid information systems, and light fixtures that measure and report usage via remote modem.

60
&���� , �� ����$��
Boyce, James. Memorandum to California Air Resources Board Economic Allocation
Advisory Committee, 2009. Broekhoff, Derik. “Carbon Offsets and Incentive Mechanisms.” World Resources
Institute slide presentation. May 28, 2008. Cadmus Group et al, “Compact Fluorescent Lamps Market Effects Interim Report”
DRAFT, January 22, 2009. California Air Resources Board, Climate Change Proposed Scoping Plan, October, 2008. California Air Resources Board, Small Business Toolkit,
http://www.arb.ca.gov/cc/localaction/smallbusiness.htm. Carl Moyer program Guidelines, Part IV, Appendices B, C, D and F at
http://www.arb.ca.gov/msprog/moyer/guidelines/cmp_guidelines_part4.pdf. Climate Action Reserve (formerly California Climate Action Registry),
http://www.climateactionreserve.org/. cool nrg, www.coolnrg.com. Creyts et al., “Reducing U.S. Greenhouse Gas Emissions: How Much at What Cost?”
Executive Report, December, 2007. Fine, James and Chris Mihm, “Costs and Benefits of Energy Efficiency Investments in
Texas Buildings and Vehicles,” Environmental Defense Fund. April 30, 2009. Fullerton, Don, “Distributional Effects of Environmental and Energy Policy: An
Introduction,” National Bureau of Economic Research, Working Paper 14241, August 2008
Golove, William and Joseph Eto. “Market Barriers to Energy Efficiency: A Critical
Reappraisal of the Rationale for Public Policies to Promote Energy-Efficiency.” Berkeley, CA: Lawrence Berkeley National Laboratory. Report No. LBL-38059. March 1996.
Greenstein, Robert, Sharon Parrott and Arloc Sherman. “Designing Climate-Change
Legislation that Shields Low-Income Households from Increased Poverty and Hardship,” Center on Budget and Policy Priorities, Revised May 9, 2008. http://www.cbpp.org/files/10-25-07climate.pdf.

61
KEMA, Inc., California Statewide Residential Appliance Saturation Study.
websafe.kemainc.com/RASSWEB/DesktopDefault.aspx. Lawrence Berkeley Labs, http://enduse.lbl.gov/Projects/EfficiencyGap.html. Levine, M., D. Ürge-Vorsatz, K. Blok, L. Geng, D. Harvey, S. Lang, G. Levermore, A.
Mongameli Mehlwana, S. Mirasgedis, A. Novikova, J. Rilling, H. Yoshino, “Residential and commercial buildings.” In Climate Change 2007: Mitigation. Contribution of Working Group III to the Fourth Assessment Report of the Intergovernmental Panel on Climate Change [B. Metz, O.R. Davidson, P.R. Bosch, R. Dave, L.A. Meyer (eds)], Cambridge University Press, Cambridge, United Kingdom and New York, NY, USA., 2007.
McCormick, Mike. Presentation to Local Government Sustainability Coalition, 2009. McKinsey, EPA HR2454 analysis. M.Cubed and San Francisco Community Power, "Left to Our Own Devices," Prepared
for Environmental Defense Fund, (forthcoming) 2009. M.Cubed, San Francisco Community Power, and Energy and Environmental
Economics, Distributed Energy Resource Implementation: Testing Effective Load Management at the Feeder Level, Draft Interim Report, published by the California Energy Commission, Winter, 2007.
Meier, A., et al., “Low Power Mode Energy Consumption in California Homes,”
California Energy Commission Public Interest Energy Research Program, Report No. CEC-500-2008-035: Sacramento, Calif., 2008.
Morello Frosch, Rachel, Manuel Pastor, Jim Sadd, and Seth Shonkoff, “The Climate
Gap: Inequalities in How Climate Change Hurts Americans & How to Close the Gap,” May 2009, http://college.usc.edu/geography/ESPE/perepub.html.
Moss, Steven J., “Community-Based Trading Mechanisms to Reduce Polluting Air
Emissions and Address Global Warming,” Journal of Environmental Assessment, Policy, and Management, Volume 1, Number 2, June 1999.
Moss, Steven et al. “Climate for Community: Creating a sustainable platform for low-
income families and small businesses to participate in emissions allowance markets.” White Paper developed by San Francisco Community Power and Environmental Defense Fund, 2009.

62
Moss, Steven J. Customer Segmentation as Applied to Energy Efficiency Programs, published by the California Institute of Energy and Environment, Fall, 2008.
Moss, Steven, Getting the Job Done Right: Employment Growth and California’s Global
Warming Solutions Act, published by Environmental Defense Fund, Winter, 2008. Northwest Power and Conservation Council,
http://www.nwcouncil.org/energy/powerplan/6/supplycurves/default.htm. Regional Greenhouse Gas Initiative. Model Rule,
www.rggi.org/docs/Model%20Rule%20Revised%2012.31.08.pdf. Sanstad, Alan H. and Richard B. Howarth. "'Normal' Markets, Market Imperfections, and
Energy Efficiency." Energy Policy 22(10): 811-818, 1994. Sweeney, Weyant et al., “Analysis of Measures to Meet the Requirements of California’s
Assembly Bill 32,” Precourt Institute for Energy Efficiency, Stanford University. Discussion Draft, September 27, 2008.
TerraPass, http://www.terrapass.com/projects/categories.html. United Nations Environment Programme, The Kyoto Protocol, Clean Development
Mechanism, and the Building and Construction Sector, 2008. http://cdm.unfccc.int/EB/032/eb32_repan38.pdf; http://www.cdmgoldstandard.org/.
U.S. Department of Health and Human Services, 2009 Poverty Guidelines,
http://aspe.hhs.gov/poverty/09poverty.shtml. Village Green Environmental Solutions, http://www.villagegreen.com.au/main.html. WCI Offsets Committee White Paper, Task 1: Offset System Essential Elements,
Offset Definition (Task 1.1) and Eligibility Criteria (Task 1.2) [Draft]; www.westernclimateinitiative.org.