securing large cellular networks via a data oriented
TRANSCRIPT

Securing Large Cellular Networks via A Data OrientedApproach: Applications to SMS Spam and Voice Fraud
Defenses
A DISSERTATION
SUBMITTED TO THE FACULTY OF THE GRADUATE SCHOOL
OF THE UNIVERSITY OF MINNESOTA
BY
Nan Jiang
IN PARTIAL FULFILLMENT OF THE REQUIREMENTS
FOR THE DEGREE OF
Doctor of Philosophy
December, 2013

c© Nan Jiang 2013
ALL RIGHTS RESERVED

Acknowledgements
First and foremost, I would like to thank my advisor Professor Zhi-Li Zhang for his
years of support and guidance. His attitude and engagement to his work and research
deeply touched me. After that, he became one of the most influential people in my life
during the past five years. I believe I’ll benefit from what I’ve learned from him for a
life time. I would also like to thank my committee members, Professor Nick Hopper,
Abhishek Chandra and Gongjun Xu for their valuable comments and suggestions on my
thesis work.
I give my gratuitous to my collaborators and lab mates Esam Sharafuddin, Guanlin
Lv and Cheng Jin. I had discussions and worked step by step on projects with Esam,
who was also able to provide useful information and help for my daily life.
I want to thank my mentors from Bell Labs, Jin Cao, Li Erran Li and Aiyou Chen,
as well as mentors from AT&T Labs, Wen-Ling Hsu, Ann Skudlark, Ashwin Sridharan.
At the early stage of my Ph.D. life, Jin provided insightful advice and warmly helps.
Wen-Ling and Ann gave me advice on my life and career.
i

Dedication
I dedicate this dissertation to my husband Yu Jin for years of encouragement and support
each step of the way; to our lovely daughter Amy, for the cheer and happiness she brings
to the family; to my parents, Wenyi Jiang and Meili Zhao, for their unconditional love
and care; to my sister Yao Jiang, who is willing to help whenever I need; to my parents-
in-law, Shengxue Jin and Huizhen Liang, who help taking care of Amy.
i

Abstract
With widespread adoption and growing sophistication of mobile devices, fraudsters
have turned their attention from landlines and wired networks to cellular networks.
While security threats to wireless data channels and applications have attracted the
most attention, attacks through mobile voice channels, such as Short Message Service
(SMS) spam and voice-related fraud activities also represent a serious threat to mobile
users. In particular, it has been reported that the number of spam messages in the US
has risen 45% in 2011 to 4.5 billion messages, affecting more than 69% of mobile users
globally. Meanwhile, we have seen increasing numbers of incidents where fraudsters
deploy malicious apps, e.g., disguised as gaming apps to entice users to download;
when invoked, these apps automatically – and without users’ knowledge – dial certain
(international) phone numbers which charge exorbitantly high fees. Fraudsters also
frequently utilize social engineering (e.g., SMS or email spam, Facebook postings) to
trick users into dialing these exorbitant fee-charging numbers.
Unlike traditional attacks towards data channels, e.g., Email spam and malware,
both SMS spam and voice fraud are not only annoying, but they also inflict financial
loss to mobile users and cellular carriers as well as adverse impact on cellular network
performance. Hence the objective of defense techniques is to restrict phone numbers
initialized these activities quickly before they reach too many victims. However, due to
the scalability issues and high false alarm rates, anomaly detection based approaches
for securing wireless data channels, mobile devices, and applications/services cannot be
readily applied here.
In this thesis, we share our experience and approach in building operational defense
systems against SMS spam and voice fraud in large-scale cellular networks. Our ap-
proach is data oriented, i.e., we collect real data from a large national cellular network
and exert significant efforts in analyzing and making sense of the data, especially to
understand the characteristics of fraudsters and the communication patterns between
fraudsters and victims. On top of the data analysis results, we can identify the best
predictive features that can alert us of emerging fraud activities. Usually, these features
represent unwanted communication patterns which are derived from the original feature
ii

space. Using these features, we apply advanced machine learning techniques to train
accurate detection models. To ensure the validity of the proposed approaches, we build
and deploy the defense systems in operational cellular networks and carry out both
extensive off-line evaluation and long-term online trial. To evaluate the system per-
formance, we adopt both direct measurement using known fraudster blacklist provided
by fraud agents and indirect measurement by monitoring the change of victim report
rates. In both problems, the proposed approaches demonstrate promising results which
outperform customer feedback based defenses that have been widely adopted by cellular
carriers today.
More specifically, using a year (June 2011 to May 2012) of user reported SMS spam
messages together with SMS network records collected from a large US based cellular
carrier, we carry out a comprehensive study of SMS spamming. Our analysis shows
various characteristics of SMS spamming activities. and also reveals that spam numbers
with similar content exhibit strong similarity in terms of their sending patterns, tenure,
devices and geolocations. Using the insights we have learned from our analysis, we
propose several novel spam defense solutions. For example, we devise a novel algorithm
for detecting related spam numbers. The algorithm incorporates user spam reports
and identifies additional (unreported) spam number candidates which exhibit similar
sending patterns at the same network location of the reported spam number during the
nearby time period. The algorithm yields a high accuracy of 99.4% on real network
data. Moreover, 72% of these spam numbers are detected at least 10 hours before user
reports.
From a different angle, we present the design of Greystar, a defense solution against
the growing SMS spam traffic in cellular networks. By exploiting the fact that most
SMS spammers select targets randomly from the finite phone number space, Greystar
monitors phone numbers from the gray phone space (which are associated with data only
devices like data cards and modems and machine-to-machine communication devices like
point-of-sale machines and electricity meters) to alert emerging spamming activities.
Greystar employs a novel statistical model for detecting spam numbers based on their
footprints on the gray phone space. Evaluation using five month SMS call detail records
from a large US cellular carrier shows that Greystar can detect thousands of spam
numbers each month with very few false alarms and 15% of the detected spam numbers
iii

have never been reported by spam recipients. Moreover, Greystar is much faster than
victim spam reports. By deploying Greystar we can reduce 75% spam messages during
peak hours.
To defend against voice-related fraud activities, we develop a novel methodology
for detecting voice-related fraud activities using only call records. More specifically, we
advance the notion of voice call graphs to represent voice calls from domestic callers to
foreign recipients and propose a Markov Clustering based method for isolating domi-
nant fraud activities from these international calls. Using data collected over a two year
period from one of the largest cellular networks in the US, we evaluate the efficacy of
the proposed fraud detection algorithm and conduct systematic analysis of the identi-
fied fraud activities. Our work sheds light on the unique characteristics and trends of
fraud activities in cellular networks, and provides guidance on improving and securing
hardware/software architecture to prevent these fraud activities.
iv

Contents
Acknowledgements i
Dedication i
Abstract ii
List of Tables ix
List of Figures x
1 Introduction 1
1.1 Existing Defenses . . . . . . . . . . . . . . . . . . . . . . . . . . . . . . . 3
1.2 Our Approach . . . . . . . . . . . . . . . . . . . . . . . . . . . . . . . . . 4
1.3 SMS Spam Defenses . . . . . . . . . . . . . . . . . . . . . . . . . . . . . 5
1.4 Voice Fraud Defense and Analysis . . . . . . . . . . . . . . . . . . . . . 7
2 Background 10
2.1 UMTS Network Overview . . . . . . . . . . . . . . . . . . . . . . . . . . 10
2.2 A Primer on Phone Numbers . . . . . . . . . . . . . . . . . . . . . . . . 12
2.3 User Spam Report . . . . . . . . . . . . . . . . . . . . . . . . . . . . . . 12
3 Related Work 14
3.1 Spam Analysis and Detection . . . . . . . . . . . . . . . . . . . . . . . . 14
3.2 Voice Fraud . . . . . . . . . . . . . . . . . . . . . . . . . . . . . . . . . . 16
v

4 Understanding SMS Spamming Activities 18
4.1 Introduction . . . . . . . . . . . . . . . . . . . . . . . . . . . . . . . . . . 18
4.2 Datasets . . . . . . . . . . . . . . . . . . . . . . . . . . . . . . . . . . . . 19
4.2.1 User Spam Report Dataset . . . . . . . . . . . . . . . . . . . . . 19
4.2.2 SMS Spam Call Detail Records . . . . . . . . . . . . . . . . . . . 19
4.3 Analyzing User Spam Reports . . . . . . . . . . . . . . . . . . . . . . . . 20
4.3.1 Data Preprocessing . . . . . . . . . . . . . . . . . . . . . . . . . . 20
4.3.2 Spam Number Extraction and Spam Report Volume . . . . . . . 21
4.3.3 Analyzing Spam Text Content . . . . . . . . . . . . . . . . . . . 22
4.4 Characterizing Spam Numbers . . . . . . . . . . . . . . . . . . . . . . . 23
4.4.1 Device and Tenure . . . . . . . . . . . . . . . . . . . . . . . . . . 23
4.4.2 SMS, Voice and Data Usage Patterns . . . . . . . . . . . . . . . 24
4.5 Network Characteristics of Spam Numbers . . . . . . . . . . . . . . . . . 25
4.5.1 Spam Sending Rate . . . . . . . . . . . . . . . . . . . . . . . . . 25
4.5.2 Spamming Locations and Impact on the Cellular Network . . . . 26
4.6 Investigating Correlations between Spam Numbers . . . . . . . . . . . . 27
4.6.1 Clustering Spam Messages with CLUTO . . . . . . . . . . . . . . 27
4.6.2 Correlations of Spam Numbers . . . . . . . . . . . . . . . . . . . 28
4.7 Implications on Building Effective SMS Spam Defenses . . . . . . . . . . 31
4.7.1 Are User Spam Reports Alone Sufficient? . . . . . . . . . . . . . 31
4.7.2 Detecting Spam Numbers using Spatial/Temporal Correlations . 32
4.8 Summary . . . . . . . . . . . . . . . . . . . . . . . . . . . . . . . . . . . 35
5 Greystar: Detecting SMS Spam using Grey Phone Space 36
5.1 Introduction . . . . . . . . . . . . . . . . . . . . . . . . . . . . . . . . . . 36
5.2 Datasets . . . . . . . . . . . . . . . . . . . . . . . . . . . . . . . . . . . . 37
5.2.1 Obtaining Ground Truth . . . . . . . . . . . . . . . . . . . . . . 37
5.3 Objectives and Existing Solutions . . . . . . . . . . . . . . . . . . . . . . 38
5.3.1 SMS Spam Defense Objectives . . . . . . . . . . . . . . . . . . . 38
5.3.2 Spam Detection by Crowdsourcing Victim Spam Reports . . . . 40
5.3.3 Overview of Greystar . . . . . . . . . . . . . . . . . . . . . . . . 40
5.4 Analyzing SMS Activities of Spammers and Legitimate Users . . . . . . 41
vi

5.4.1 Spammer Target Selection Strategy . . . . . . . . . . . . . . . . 42
5.4.2 Mobile User SMS Activities . . . . . . . . . . . . . . . . . . . . . 45
5.5 SMS Grey Phone Number Space . . . . . . . . . . . . . . . . . . . . . . 47
5.5.1 Investigating Service Plans . . . . . . . . . . . . . . . . . . . . . 47
5.5.2 Identifying Grey Phone Space . . . . . . . . . . . . . . . . . . . . 49
5.5.3 Characterizing Grey Phone Space . . . . . . . . . . . . . . . . . 50
5.5.4 Discussion: Greyspace vs. Darkspace . . . . . . . . . . . . . . . . 51
5.6 System Design . . . . . . . . . . . . . . . . . . . . . . . . . . . . . . . . 53
5.6.1 System Overview . . . . . . . . . . . . . . . . . . . . . . . . . . . 53
5.6.2 Classifier Design . . . . . . . . . . . . . . . . . . . . . . . . . . . 54
5.6.3 Parameter Selection . . . . . . . . . . . . . . . . . . . . . . . . . 55
5.7 Greystar Evaluation . . . . . . . . . . . . . . . . . . . . . . . . . . . . . 57
5.7.1 Accuracy Evaluation . . . . . . . . . . . . . . . . . . . . . . . . . 57
5.7.2 Detection Speed and Benefits to Cellular Carriers . . . . . . . . . 58
5.7.3 Analysis of Missed Detections . . . . . . . . . . . . . . . . . . . . 60
5.8 Summary . . . . . . . . . . . . . . . . . . . . . . . . . . . . . . . . . . . 62
6 Voice Graph 64
6.1 Introduction . . . . . . . . . . . . . . . . . . . . . . . . . . . . . . . . . . 64
6.2 Datasets . . . . . . . . . . . . . . . . . . . . . . . . . . . . . . . . . . . . 66
6.2.1 Obtaining Ground Truth . . . . . . . . . . . . . . . . . . . . . . 66
6.3 Voice Call Graphs . . . . . . . . . . . . . . . . . . . . . . . . . . . . . . 67
6.3.1 Definition of Voice Call Graphs . . . . . . . . . . . . . . . . . . . 68
6.3.2 Voice Call Graph Properties . . . . . . . . . . . . . . . . . . . . . 68
6.3.3 Heuristic for Detecting Voice-related Fraud . . . . . . . . . . . . 71
6.3.4 Challenges . . . . . . . . . . . . . . . . . . . . . . . . . . . . . . 72
6.4 A Markov Clustering based Fraud Detection Algorithm . . . . . . . . . 73
6.4.1 Decomposing Voice Graphs using MCL . . . . . . . . . . . . . . 73
6.4.2 Isolating Fraud Activities . . . . . . . . . . . . . . . . . . . . . . 74
6.5 Evaluation . . . . . . . . . . . . . . . . . . . . . . . . . . . . . . . . . . . 77
6.5.1 Evaluation on IRSF Fraud Detection . . . . . . . . . . . . . . . . 77
6.5.2 Evaluation on Early Fraud Detection . . . . . . . . . . . . . . . . 79
vii
6.5.3 Discussion . . . . . . . . . . . . . . . . . . . . . . . . . . . . . . . 80
6.6 Analysis of Fraud Activities . . . . . . . . . . . . . . . . . . . . . . . . . 81
6.6.1 Stability of Fraud Activities . . . . . . . . . . . . . . . . . . . . . 82
6.6.2 Categorization of Fraud Activities . . . . . . . . . . . . . . . . . 83
6.6.3 Social Engineering Techniques . . . . . . . . . . . . . . . . . . . 91
6.6.4 Originating Countries of Fraud Numbers . . . . . . . . . . . . . . 93
6.7 Summary . . . . . . . . . . . . . . . . . . . . . . . . . . . . . . . . . . . 94
7 Conclusion and Future Work 95
References 97
viii

List of Tables
4.1 Example spam messages from the same clusters. . . . . . . . . . . . . . 28
5.1 Corr. of activeness and plan features. . . . . . . . . . . . . . . . . . . . . 48
5.2 Device categories and examples. . . . . . . . . . . . . . . . . . . . . . . . 49
6.1 IRSF number detection result. . . . . . . . . . . . . . . . . . . . . . . . 80
6.2 Categorization of fraud activities. . . . . . . . . . . . . . . . . . . . . . . 82
6.3 Social engineering techniques applied by fraudsters. . . . . . . . . . . . . 88
ix

List of Figures
2.1 UMTS network architecture. . . . . . . . . . . . . . . . . . . . . . . . . 11
2.2 SMS architecture in UMTS networks. . . . . . . . . . . . . . . . . . . . 11
4.1 Monthly SMS/data/voice usage. . . . . . . . . . . . . . . . . . . . . . . 25
4.2 Spamming rate and variability in terms of number of messages. . . . . . 26
4.3 Correlation of spam numbers belonging to the same spam clusters. . . . 29
4.4 Different kinds of delays associated with user reported spam messages. . 33
4.5 Time for users taking to report multiple spam numbers in each cluster. . 33
5.1 Target selection strategies. . . . . . . . . . . . . . . . . . . . . . . . . . . 43
5.2 Foot prints of most representative target selection strategies. . . . . . . 44
5.3 SMS sent vs. received. . . . . . . . . . . . . . . . . . . . . . . . . . . . . 45
5.4 Activeness vs. spam prop. . . . . . . . . . . . . . . . . . . . . . . . . . . 47
5.5 Device activeness (log). . . . . . . . . . . . . . . . . . . . . . . . . . . . 51
5.6 Grey number distribution. . . . . . . . . . . . . . . . . . . . . . . . . . . 52
5.7 Distr. of θ and θ∗. . . . . . . . . . . . . . . . . . . . . . . . . . . . . . . 56
5.8 Grey ratio. . . . . . . . . . . . . . . . . . . . . . . . . . . . . . . . . . . 56
5.9 ROC curve (false positive rate vs. true positive rate. . . . . . . . . . . . 57
5.10 Accuracy evaluation (in comparison to victim spam reports). . . . . . . 57
5.11 Detection speed compared to spam report based methods. . . . . . . . . 59
5.12 Number of spam messages after restriction. . . . . . . . . . . . . . . . . 59
6.1 A voice graph from 1,000 randomly sampled originating numbers. . . . . 69
6.2 Voice call graph properties. . . . . . . . . . . . . . . . . . . . . . . . . . 70
6.3 Evolution of GCC’s in voice call graphs spanning different time intervals. 72
6.4 Voice graphs of a single clique and three different fraud activities. . . . . 75
6.5 Determining thresholds for identifying suspicious clusters. . . . . . . . . 77
x

6.6 Popularity of fraud numbers. . . . . . . . . . . . . . . . . . . . . . . . . 79
6.7 Lag of user reported IRSF numbers. . . . . . . . . . . . . . . . . . . . . 79
6.8 Stability of fraud activities measured by term. numbers. . . . . . . . . . 83
6.9 Closeness of originating numbers. . . . . . . . . . . . . . . . . . . . . . . 83
6.10 Cumulative number of victims attracted by different fraud activities. . . 84
6.11 Smartphone proportion change over time. . . . . . . . . . . . . . . . . . 90
xi
Chapter 1
Introduction
The past decade has witnessed the rapid deployment and evolution of mobile cellular
networks, which now support billions of users and a vast diverse array of mobile devices
from smartphones, tablets, to e-readers and smart meters. It was reported [1] that
in 2010 there were over 5 billion mobile phones in operation, in comparison to the
total world population of 6.8 billion. Mobile phones and tablets are gradually replacing
traditional wire-lines as well as personal computers, and are becoming an indispensable
component in our daily life [2, 3]. With breath-taking advances in smart mobile devices
and the growing sophistication in the mobile applications (apps) and services (e.g.,
location services and cloud services) they spur, we are now entering in a new era of
mobile computing.
With their wide adoption, smartphones, while providing valuable utility and con-
venience to mobile users, also bring with them new security threats. As smartphones
function both as phones as well as mobile computers, smartphone users not only face
the usual Internet security threats (e.g., malware and botnets [4]) through their web
browsing and other data activities (albeit such data-related security threats are miti-
gated by the perhaps markedly improved hardware and software platforms compared
to conventional desktop platforms); they may also encounter unsolicited SMS (Short
Message Service) spam, as well as a variety of voice-related security threats.
SMS Spam are unsolicited SMS messages sent by SMS spammers to a vast number
of victims. The explosion of mobile devices in the past decade has brought with it an
1

2
onslaught of such unwanted SMS ) spam [5]. It has been reported that the number of
spam messages in the US has risen 45% in 2011 to 4.5 billion messages [6]. In 2012, there
were 350K variants of SMS spam messages accounted for globally [7] and more than 69%
of the mobile users claimed to have received text spam [8]. The sheer volume of spam
messages not only inflicts an annoying user experience, but also incur significant costs to
both cellular service providers and customers alike. As the increasingly rich functionality
provided by smart mobile devices, these SMS spam often entice users to visit certain
(fraud) websites for other illicit activities, e.g., to steal personal information or to spread
malware apps, which can inflict financial loss to the users. At the same time, the huge
amount of spam messages also concerns the cellular carriers as the messages traverse
through the network, causing congestion and hence degraded network performance. In
contrast to email spam where the number of possible email addresses is unlimited - and
therefore the spammer generally needs a seed list beforehand, SMS spammers can more
easily reach victims by, e.g., simply enumerating all numbers from the finite phone
number space. This, combined with wide adoption of mobile phones, makes SMS a
medium of choice among spammers.
Voice Spam ranges from conventional voice scams similar to those on landlines, e.g.,
stealing customers privacy information or defrauding users of money through various
social engineering techniques, to new forms of voice fraud that utilize the data function-
ality of smartphones for voice-related trickeries. For instance, we have seen increasing
numbers of incidents where fraudsters deploy malicious apps, disguised as interesting
games and other applications to entice users to download them; when invoked, these
apps automatically – and without users’ knowledge – dial certain (international) phone
numbers which charge exorbitantly high fees. Fraudsters also frequently utilize other
social engineering trickeries to deceive users, e.g., through SMS or email spam, Twit-
ter tweets, or fake online postings to lure users into clicking on malicious URL links,
resulting in automatic dialing of exorbitant fee-charging international numbers. Com-
pared to malware apps that focus primarily on smartphone users, voice-related fraud
activities can have a much wider impact in cellular networks, as potentially all mobile
users can be victims of such activities. Furthermore, unlike data traffic, mobile inter-
national voice calls often follow the pay-per-call compensation model, and are far more
expensive; hence voice-related fraud activities involving international phone numbers

3
can bring direct and significant financial losses to both mobile users and cellular service
providers. Detecting and rooting out such voice-related fraud activities, especially those
that target users through the data plane triggered voice fraud, is not an easy task, due
to the large user population, the vast phone number space and limited data.
1.1 Existing Defenses
Because both SMS spam and voice fraud are not only annoying, but they also inflict
financial loss to mobile users and cellular carriers as well as adverse impact on cellular
network performance, the objective of defense techniques is to restrict phone numbers
initialized these activities quickly before they reach too many victims. To this end,
many existing solutions in defending against other threats like email spam are not
applicable here. For example, anomaly detection based approaches for securing wireless
data channels, mobile devices, and applications/services [9, 10, 11, 12, 13] can potentially
lead to an unacceptable false alarm rate, which can disturb normal users’ activities by
incorrectly restricting their services. Meanwhile, content inspection/classification based
techniques which are commonly used for detecting email spam often cannot scale up
with the huge number of SMS messages traversing the network within seconds.
Due to these reasons, cellular carriers often seek help from their customers to alert
them of emerging spamming and fraud activities. More specifically, for SMS spam,
cellular carriers deploy reporting mechanism for spam victims to report received spam
messages and then examine and restrict these reported spam numbers accordingly. After
receiving a spam message, a victim can report it via a text message forward. For voice
fraud, a victim can report suspicious voice transactions to the fraud agents by calling
the cellular carrier’s support line. To increase the accuracy of detection and to avoid
malicious users from gaming the reporting system, fraud agents can crowdsource reports
from multiple users regarding the same phone numbers. Such detection techniques based
on victim reports are very accurate, thanks to the human intelligence added while
submitting these reports. However, these methods can suffer from significant delay due
to the low report rate and slow user responses, rendering them inefficient in controlling
SMS spam and voice fraud.
4
1.2 Our Approach
To attack these problems, we adopt a data oriented approach which we illustrate below:
1. Large-scale data analysis and profiling. In both problems, we are facing
a huge volume of data records (e.g., billions of SMS messages and voice calls
each day) but only a small number of features. For example, we use only Call
Detail Records (CDRs) as our input in both problems, which only contain limited
features, like the originating phone number, the terminating phone number, the
communication time, etc. Building an accurate detection model directly on top
of these features is often infeasible. Therefore, we collect real data from a large
national cellular network and exert significant efforts in analyzing and making
sense of the data, especially to understand the characteristics of fraudsters and
the communication patterns between fraudsters and victims.
2. Predictive Feature Identification. On top of the data analysis results, we can
identify the best predictive features that can alert us of emerging fraud activities.
Usually, these features represent unwanted communication patterns which are de-
rived from the original feature space. Legitimate users are very unlikely involved
in such communication patterns and hence these derived features serve as good
indicators of fraud activities.
3. Building Statistical Detection Model. Even with the identified predictive
features, fraudster behaviors usually cannot be separated from legitimate user
behaviors using simple threshold based method. We therefore apply statistical
learning techniques to build the detection models, which provides more accurate
detection using sophisticated decision rules learned automatically from training
samples.
4. Off-line Evaluation and On-line Trial. Given the objective of our work is to
design defense solutions that are applicable to a real large-scale cellular network
environment, we carry out both extensive off-line evaluation and long-term online
trial in operational networks. To evaluate the system performance, we adopt both
direct measurement using known fraudster blacklist provided by fraud agents and
indirect measurement by monitoring the change of victim report rates.

5
5. Post-analysis of Fraud Activities. Building a defense solution is not the end
of our work. Instead, we carry out post-analysis of fraud activities detected by the
proposed algorithms which are later confirmed by auxiliary information sources.
Such analysis enables us to better understand the evolving techniques adopted by
fraudsters, which also shed lights on the future trend of fraud activities as well as
potential new defenses.
1.3 SMS Spam Defenses
Following the aforementioned approach, in Chapter 4 and Chapter 5, we present two
algorithms developed for fast and accurate detection of SMS spam.
Taking advantage of this SMS spam reporting mechanism, we collect spam messages
reported to one of the largest cellular carriers in the US from May 2011 to June 2012
– which contains approximately 543K spam messages – and carry out an extensive
analysis of spamming activities using these user reported spam messages together with
their associated SMS network records. Our objectives are three-fold: 1) to characterize
the spamming activities in today’s large cellular networks; 2) to infer the intent and
strategies of spammers; and 3) to develop effective spam detection methods based on
lessons learned from our analysis.
To achieve these goals, we first identify more than 78K spam numbers from user-
submitted SMS spam reports (referred to as user spam reports hereafter) and conduct
an in-depth analysis of spamming activities associated with these numbers. We observe
strong differences in behaviors between spammers and non-spammers in terms of their
voice, data and SMS usage. We find that the tenure of the spam numbers to be less
than one week old, and programmable devices are often used to deliver spam messages
at various spam sending rates.
In addition to analyzing spamming behaviors of individual spam numbers, we carry
out a multi-dimensional analysis of the correlations of spam numbers. More specifically,
we apply a text mining tool, CLUTO [14, 15], to cluster spam numbers into various
clusters based on similarity of spam content they generate. Our investigation shows
strong similarity among the spam numbers contained in each cluster: for instance,
the devices associated with these spam numbers are frequently of identical types, the

6
spam numbers used are often purchased at nearly the same time; furthermore, the call
records of these numbers also exhibit strong temporal and spatial correlations, namely,
they occur at a particular location and close in time. All the evidence suggests that the
spam numbers contained in the same cluster are likely employed by a single spammer
to engage in the same SMS spam campaign, e.g., at a particular location using multiple
devices such as laptops or 3G/4G cellular modems.
Based on the characteristics of spam numbers found in our analysis, we innovative
several spam defenses that rely less on user spam reports or do not require users’ partic-
ipation at all. For example, leveraging the strong temporal/spatial correlations among
spam numbers employed by the same spammer, we propose a novel related spam number
detection algorithm. The algorithm consists of two components. First, it maintains a
watchlist of all potential spam numbers detected based on the SMS sending patterns
of individual phone numbers. Second, upon receiving a user spam report, it identifies
additional (unreported) spam number candidates which exhibit similar sending patterns
at the same network location during the same or nearby time period. Evaluated on a
month long dataset, the algorithm identifies 5.1K spam numbers with an extremely high
accuracy of 99.4%, where more than 72% and 40% of the detection results are 10 hours
and 1 day before the user reports, respectively. Moreover, 9% of the detected spam
numbers have never been reported by users possibly due to the extremely low report
rate.
We next take a in-depth look at the target selection strategies adopted by most
SMS spammers in Chapter 5. We find that most spammers select targets randomly,
either from a few area codes or the entire phone number space. This is plausibly due
to the finite phone number space which enables spammers to reach victims by simply
enumerating their numbers. Meanwhile, we find spammers tend to concentrate at and
select targets from densely populated geolocations (e.g., large metro areas), where they
have access to more resources (e.g., high speed networks and spamming devices) and can
reach live users more easily. As a consequence, at these locations, the huge volume of
spam traffic can lead to more than a 20 times increase of SMS traffic at some Node-Bs,
and more than 10 times at some RNCs. The sheer volume of spam traffic can potentially
have an adverse impact on the experience of normal users in these areas.
7
Based on such observations, to detect these aggressive random spammers, we ad-
vance a novel notion of grey phone space. Grey phone space comprises a collection of grey
phone numbers (or grey numbers in short). Grey numbers are associated with two types
of mobile devices: data only devices (e.g., many laptop data cards and data modems,
etc.) and machine-to-machine (M2M) communication devices (e.g., utility meters and
medical devices, etc.). These grey numbers usually do not participate actively in SMS
communication as other mobile numbers do (e.g., those associated with smartphones),
they thereby form a grey territory that legitimate mobile users rarely enter. In the mean
time, the wide dispersion of grey numbers makes them hard to be evaded by spammers
who choose targets randomly.
On top of grey phone space, we propose the design of Greystar. Greystar employs
a novel statistical model to detect spam numbers based on their interactions with grey
numbers and other non-grey phone numbers. We evaluate Greystar using five months of
SMS call records. Experimental results indicate that Greystar is superior to the existing
SMS spam detection algorithms, which rely heavily on victim spam reports, in terms
of both accuracy and detection speed. In particular, Greystar detected over 34K spam
numbers in five months while only generating two false positives. In addition, more than
15% of the detected spam numbers have never been reported by mobile users. Moreover,
Greystar reacts fast to emerging spamming activities, with a median detection time of
1.2 hours after spamming activities occur. In 50% of the cases, Greystar is at least
1 day ahead of victim spam reports. The high accuracy and fast response time allow
us to restrict more spam numbers soon after spamming activities emerge, and hence
to reduce a majority of the spam messages in the network. We demonstrate through
simulation on real network data that, after deploying Greystar, we can reduce 75% of
the spam messages during peak hours. In this way, Greystar can greatly benefit the
cellular carriers by alleviating the load from aggressive SMS spam messages on network
resources as well as limiting their adverse impact on legitimate mobile users.
1.4 Voice Fraud Defense and Analysis
In Chapter 6, we introduce our work in defending against voice fraud activities. In
particular, using voice call records collected over a two year period in one of the largest

8
cellular networks in the US, the goal of our study is two-fold: 1) to develop an effec-
tive approach to proactively isolate dominant fraud calls from a myriad of legitimate
calls; 2) and to conduct a systematic analysis of the unique characteristics and trends
of fraud activities in cellular networks, e.g., techniques for soliciting fraud calls and
social engineering. Achieving these goals can provide a means of alerting customers and
cellular providers of potential fraud threats to avoid financial loss for both parties, and
ultimately improve customers’ satisfaction. Moreover, understanding different fraud ac-
tivities can help gain useful insights in developing better hardware/software architecture
for preventing future fraud activities.
Since voice call records only contain limited information, such as call time, originat-
ing/terminating numbers, country codes and call durations, we explore the relationship
among parties participating in the calls (i.e., “who calls whom”) for the fraud detection
task. In particular, we advance the notion of voice call graphs for representing the call
records. A voice call graph is a bi-partite graph, where two independent sets of nodes
represent the groups of domestic originating numbers and foreign terminating numbers,
respectively, and the edges stand for phone calls between these originating numbers
and terminating numbers. By visualizing small scale voice graphs and characterizing
large scale voice graphs with classic graph statistics, we find that fraud numbers and
victims often exhibit very strong correlation, which results in community structures in
the voice call graph. Therefore, the task of isolating fraud calls can be formulated as the
problem of extracting dominant community structures from voice graphs. This serves
as our basic heuristic for detecting voice-related fraud. Based on this heuristic, we pro-
pose a Markov Clustering (MCL) based algorithm to decompose voice call graphs in an
iterative manner, which produces millions of disconnected subgraphs on a month-long
voice graph. We further rely on the strength of community structures (measured by the
number of cliques) and their popularity (measured by the number of callers) as a gauge
to isolate fraud activities from these subgraphs.
We validate the proposed detection algorithm using two sources of ground truth: 1)
a list of phone numbers that are reported by mobile users to the cellular service provider,
which are then manually verified by fraud agents to be involved in international revenue
sharing fraud (IRSF); 2) online reports from mobile users that are posted on forums,
blogs or social media sites. By matching our detection results against the ground truth,
9
we find that the proposed algorithm is able to isolate from millions of terminating
numbers the most dominant IRSF fraud numbers. In particular, these IRSF numbers
together have attracted more than 85% of the victims and resulted in 78% of the fraud
calls. More importantly, in 60% of the cases, our method is able to detect fraud numbers
at least 1 month prior to the earliest online user reports. Such an advantage in early
fraud detection allows us to effectively reduce exposure to significant financial loss for
both mobile users and cellular network providers. In addition to IRSF activities, our
method also identifies a wide variety of other types of fraud, ranging from traditional
voice scams to emerging fraud cases committed through mobile devices, smartphone
apps and online social media sites. This enables us to gain a comprehensive view of
voice-related fraud in today’s large cellular networks.
Based on our detection results, we conduct extensive analysis of fraud activities
in cellular networks. Our analysis unveils two major types of fraud: 1) IRSF fraud
which brings direct revenue to the fraudsters through victims placing calls to premium
rate international numbers; and 2) scams that rely on social engineering to defraud
victims. For both types of fraud, we observe interesting characteristics that are unique
to cellular networks. For example, we find malware apps, unlocked devices and online
media sites can serve as new channels for carrying IRSF fraud, and smartphone users
are more susceptible to many of these fraud activities. Also, personal information such
as email contact lists and online transaction details are becoming popular components
of social engineering techniques. In addition, we identify the heteronym property of
fraud numbers, which take advantage of the fact that most mobile devices lack the
ability of distinguishing foreign numbers from domestic ones to solicit calls to fraud
numbers. Moreover, we find that the vetting process used by online app marketplace
and online media sites plays an important role in effectively preventing fraud activities.
All these observations provide us with useful insights in designing better and more secure
hardware/software platforms to prevent future fraud activities.

Chapter 2
Background
In this chapter, we first briefly introduce the architecture of the UMTS (Universal Mobile
Telecommunication System) network under study. We then review the components
that form a phone number in UMTS networks. Lastly, we describe the user reporting
mechanism that cellular service providers usually deploy to defense against SMS spam.
2.1 UMTS Network Overview
The cellular network under study utilizes primarily UMTS, a popular 3G mobile com-
munication technology supporting both voice and data services. The key components
of a typical UMTS network are illustrated in Fig. 2.1. When making a voice call or
accessing a data service, a mobile device directly communicates with a cell tower (or
node-B), which forwards the voice/data traffic to a Radio Network Controller (RNC).
In the case of mobile voice (also including Short Message Service or SMS), the RNC
delivers the voice traffic to the PSTN (Public Switched Telephone Network) or ISDN
(Integrated Services Digital Network) telephone network, through a Mobile Switching
Center (MSC) server. All voice call records, domestic or international, can be observed
at MSCs.
When sending an (text-based) SMS message, as illustrated in 2.2, 1 an end user
equipment (UEA) directly communicates with a cell tower (or node-B), which forwards
1 Note that we focus on studying text-based SMS messages, which are sent through the control(signaling) channel as opposed to messaging services which deliver content through data channels, likeiMessage and Multimedia Message Service (MMS).
10

11
Figure 2.1: UMTS network architecture.
the message to an RNC. The RNC then delivers the message to an MSC server, where
the message enters the Signaling System 7 (SS7) network and is stored temporarily at
a Short Message Service Center (SMSC). From the SMSC, the message will be routed
to the serving MSC of the recipient (UEB), then to the serving RNC and Node-B, and
finally reach UEB . The return message will follow a reverse path from UEB to UEA.
In the case of mobile data, the RNC delivers the data service request to a Serving
GPRS Support Node (SGSN), which establishes a tunnel with a Gateway GPRS Support
Node (GGSN) using GPRS Tunneling Protocol (GTP), through which the data enters
the IP network (and the public Internet) (see [16] for details of the UMTS network).
The UMTS network has a hierarchical structure: where each RNC controls multiple
node-Bs, and one SGSN serves multiple RNCs. A similar hierarchical structure also
exists in the voice channel, where each MSC communicates with multiple RNCs.
Figure 2.2: SMS architecture in UMTS networks.

12
2.2 A Primer on Phone Numbers
A telephone number consists of a sequence of digits for reaching a particular phone line
in a public switched phone network. The phone line that initiates the call is associated
with an originating number and the number of the targeting phone line is called the
terminating number. In a UMTS network, the phone number is also referred to as a
MSISDN (Mobile Subscriber Integrated Services Digital Network Number). A MSISDN
comprises three components: a country code followed by an area code (also called a na-
tional destination code), then by the subscriber number. A majority of phone numbers
within the same geographical area share the same country code and area code. Depend-
ing on the specific country, phone numbers vary in length. Under certain circumstances,
phone numbers from two different countries can be exactly the same (see Section 6.6.4).
An international dialing prefix (also referred to as an exit code) is attached in front of
the country code to distinguish these numbers. The specific exit code is determined
by both the originating country and the terminating country and is provided directly
by the cellular service provider. Users need to explicitly dial the exit code in order to
initiate an international phone call. However, when receiving a phone call from a foreign
party, the exit code is already contained in the incoming foreign number. Therefore,
when returning such a call, the exit code is often attached automatically by the mobile
device without the user’s knowledge.
2.3 User Spam Report
Cellular service providers deploy an SMS spam reporting service for their users: when a
user receives an SMS text and deems it as a spam message, s/he can forward the message
to a spam report number (7726 usually) designated by cellular service providers. Once
the spam is forwarded, an acknowledgment message is returned, which asks the user to
reply with the spammer’s phone number (referred to as the spam number2 hereafter).
Once the above two-stage process is completed within a predefined time interval, a
2 We use the term “spam numbers” here to differentiate from spammers, where the latter term refersto the human beings who are in control of these phone numbers that initiate SMS spam. It will beshown later chapters, spammers often employ multiple spam numbers for an SMS spam campaign. Incontrast, a non-spammer (e.g., an airline notification service) typically uses only a single phone numberwhen “broadcasting” an SMS notification to many recipients.

13
record is created in the user spam report. However, if the user fails to report the spam
number or the second SMS response is sent outside the time interval, an incomplete
spam record is created, leaving an empty entry for the spam number.

Chapter 3
Related Work
3.1 Spam Analysis and Detection
There is a large volume of literature on analyzing spam activities and on spam detection.
Spam Analysis: In a related study [17], the authors characterized the demographic
features and network behaviors of individual SMS spam numbers. Though we also
conduct network-level analysis of SMS spam, our purpose is to infer the intents and
strategies of SMS spammers, and to identify and explain the correlation among different
spam numbers. [18] investigated the security impact of SMS messages and discussed the
potential of denying voice service by sending SMS to large and accurate phone hitlists
at a high rate. Meanwhile, [18] also discussed several ways of harvesting active phone
numbers, which can potentially be employed by SMS spammers to generate accurate
target number lists to launch spam campaign more efficiently and to evade detection.
[19, 20] studied talkback spam on weblogs. Meanwhile, akin to SMS spammers, the
behaviors of email spammers were characterized in [21, 22, 23, 24]. As online social
media sites become popular, many studies focus on understanding spam activities on
these sites. For example, [25] quantified and characterized spam campaigns from “wall”
messages between Facebook users. [26] studied link farming by spammers on Twitter.
[27] analyzed the inner social relationships of spammers on Twitter. [28] characterized
spam on Twitter. In comparison, we not only study the strategies of SMS spammers
14

15
but also propose an effective spam detection solution based on our analysis.
Behavior based detection: Network behaviors of spammers, e.g., sending patterns,
have been used in SMS spam detection, such as [29]. Similar network statistics based
methods designed for email spam detection were also applied for identifying SMS spam,
such as[30, 31, 32, 33]. Content-based SMS spam filters using machine learning tech-
niques were also proposed in [34, 35]. However, the application of these methods is
limited due to either the unacceptable false alarm rate associated or the large computa-
tion overhead on the end user devices, because many legitimate customers can exhibit
SMS sending patterns similar to those of spammers. such as the numbers employed by
schools, churches and other organization for informing their employees or subscribers
important information. In contrast, Greystar utilizes a novel concept of grey phone
space to detect spam numbers, which yields an extremely low false alarm rate.
User end solutions: Some systems have been developed in the form of smartphone
apps to classify spam messages on user mobile devices[34, 35, 36]. However, not all
mobile devices support executing such apps. Furthermore, from a user’s perspective,
this method is a late defense as the spam message has already arrived on his/her device
and the user may already be charged for the spam message. Moreover, the high volume
of spam messages that have already traversed the cellular network may have resulted
in congestion and other adverse network performance impacts. Greystar is deployed
inside the carrier network and hence do not have these drawbacks. As we have seen in
Section 5.7, Greystar can quickly detect spam numbers once they start spamming and
hence significantly reduce spam traffic volume in the network.
Leveraging unwanted traffic: Similar to our work, many works have leveraged un-
wanted traffic for anomaly detection, such as Internet dark space [37, 38], grey space [39],
honeynet [40, 41] and failed DNS traffic [12], etc. We are the first to advance the notion
of grey phone space and propose a novel statistical method for identifying SMS spam
using grey phone space.
16
3.2 Voice Fraud
Our work is related to many research topics as follows.
Fraud detection: There is a rich body of literature on detection of various Internet
fraud activities. [42] studied the one click fraud by analyzing public reports of fraudulent
websites. [43] designed NetProbe, a system to detect fraud in online auction networks.
[44] detected fraud in web advertising networks. [45] used a spectrum based framework
for fraud detection in social networks. [46] also studies fraud detection in wireless and
landline networks. However, they focused on detecting subscription fraud (account
holders who have no intention to pay for any bill) by assessing the similarity between
accounts. In comparison, we focus on fraud that employ foreign fraud numbers and
target mobile customers inside the cellular network. To the best of our knowledge,
our work is the first to present a comprehensive study of voice fraud in large cellular
networks and we have discovered many emerging attacks carried by mobile devices,
smartphone apps and other channels in mobility networks.
Cellular network security: Due to the increasing popularity of cellular networks,
security in cellular networks is becoming an important research area. There are many
works which focus on detecting malware, botnets and other anomalous activities in
cellular networks. For example, [9] studied 25 distinct families of mobile viruses and
worms targeting the Symbian OS and developed a machine learning based malware
detection algorithm using behavioral statistics of these malware. [10] designed a mobile
botnet called Andbot which infects Android mobile devices and utilizes URL flux for
the command and control channel. [11] proposed to use process state transitions and
user operational patterns to differentiate behaviors of malware and human users. [47]
studied the security of feature phones and designed attacks using SMS messages against
end-users as well as mobile operators. Most of the existing works focus on securing
the mobile data channel. In comparison, our focus in chapter 6 is on fraud activities
through voice channels, which have potentially a much wider influence and can bring
direct financial loss to both mobile users and cellular network providers.
Graph based anomaly detection: Many recent works focus on anomaly detection
by representing the data as graphs and detecting suspicious activities by extracting

17
community structures from these graphs. For example, [48] studied properties of com-
munity structures in different application traffic graphs, [12] proposed to utilize DNS
failure graphs to identify suspicious network activities, [49] presented a data mining
technique for detecting anomalies in various bi-partite social graphs, [13] detected mal-
ware by mining file relation graphs. [50] designed a method to capture graph evolution
over time and applied the method to detect subscription fraud in telecom networks.
Motivated by these works, we propose to use voice call graphs to isolate fraud activities
in cellular networks.

Chapter 4
Understanding SMS Spamming
Activities
4.1 Introduction
As we have introduced in the previous chapter, service providers adopt user reports to
help them defense against SMS spam. which produces much fewer false alarms, thanks
to the human intelligence added while submitting these reports. In this Chapter, we
collect spam messages reported to one of the largest cellular carriers in the US from
May 2011 to June 2012, and carry out an extensive analysis of spamming activities
using these user reported spam messages together with their associated SMS network
records.
Our objectives are three-fold: 1) to characterize the spamming activities in today’s
large cellular networks; 2) to infer the intent and strategies of spammers; and 3) to
develop effective spam detection methods based on lessons learned from our analysis.
Achieving these objectives enables us to gain a better understanding of SMS spamming
activities and hence to develop more effective approaches to detect and reduce SMS
spams. Based on the characteristics of spam numbers found in our analysis, we pinpoint
the inefficacy of existing spam defenses based solely on user spam reports due to the
associated low report rate and long delay. By leveraging the strong temporal/spatial
correlations among spam numbers employed by the same spammer, we propose and
evaluate a novel related spam number detection algorithm.
18

19
The remainder of this chapter is organized as follows. We briefly introduce the
datasets in Section 4.2. In Section 4.3 we analyze user spam reports and extract spam
numbers, which we use to study the characteristics of SMS spammers in Section 4.4 and
their network behaviors in Section 4.5. In Section 4.6, we cluster spam numbers based
on the spam content and further investigate correlations of spam numbers contained
in each cluster. Analysis of existing solutions and proposal of new spam defenses are
presented in Section 4.7. Section 4.8 concludes the chapter.
4.2 Datasets
In this section, we describe the datasets collected from the UMTS network introduced
in 2.1 for our analysis.
4.2.1 User Spam Report Dataset
As we have introduced in Section 2.3, cellular service providers usually deploy an SMS
spam reporting service for their users, and user spam reports will be generated when
users choose to report spams they received. The dataset used in our study contains spam
messages reported by users over a one-year period (from June 2011 to May 2012). The
dataset contains approximately 543K complete spam records and all the spam numbers
reported are inside the said UMTS network (i.e., for whom we have access to complete
service plan information and can hence observe all the SMS network records originated
from these numbers). Each spam record consists of four features: the spam number,
the reporter’s phone number, the spam forwarding time and the spam text content.
4.2.2 SMS Spam Call Detail Records
To assist our analysis of spamming activities from multiple dimensions, we also utilize
the SMS (network) records – SMS Call Detail Records (referred to as CDRs hereafter) –
associated with the reported spam numbers over the same one year time period. These
CDRs are collected at MSCs primarily for billing purposes: depending on the specific
vantage point where call records are collected, there are two types of SMS CDRs (see
Fig. 2.2): whenever an SMS message sent by a user reaches the SS7 network, a Mobile
Originating (MO) CDR is generated at the MSC serving the sender (even when the

20
terminating number is inactive); once the recipient is successfully paged and the message
is delivered, a Mobile Terminating (MT) CDR is generated at the MSC serving the
recipient. We note that unlike the user-generated SMS spam reports, these SMS CDRs
do not contain the text content of the original SMS messages. Instead, they contain
only limited network related information such as the SMS sending time, the sender’s
and receiver’s phone numbers, the serving cell tower and the device International Mobile
Equipment Identity (IMEI) number for the sender (in MO CDRs) or the receiver (in MT
CDRs). Using SMS spam numbers identified from spam reports, we extract all CDRs
associated with these spam numbers during the same one-year period, and use them to
study the network characteristics of spam numbers and hence to infer the intents and
strategies of the spammers. Recall that all the focused spam numbers are inside the
cellular network under study, we only utilize MO CDRs for our studies, which cover the
complete spamming history of each spam number.
We would like to emphasize that no customer personal information was collected or
used in our study, and all customer identities were anonymized before any analysis was
carried out. In particular, for phone numbers, only the area code (i.e., the first 3 digits
of the 10 digit North American numbers) was kept; the remaining digits were hashed.
Similarly, we only retained the first 8-digit Type Allocation Code (TAC) of the IMEIs in
order to identify device types and hashed the remaining 8 digits. In addition, to adhere
to the confidentiality under which we have access to the data, in places we only present
normalized views of our results while retaining the scientifically relevant magnitudes.
4.3 Analyzing User Spam Reports
In this section, we study the user reported spam messages. We first describe the data
preprocessing step and explain how to extract spam numbers from these messages. We
then illustrate statistics derived from the spam text content.
4.3.1 Data Preprocessing
Human users, unfortunately, may introduce noise and/or biases in the rather cumber-
some SMS spam reporting process. For instance, a user may mistype a spam number
in the second step, leave it blank, or simply enter an arbitrary alphanumeric string,

21
say, xxxxxx, due to lack of patience. In addition, users may apply differing criteria in
deciding what is considered as spam. To address these issues, we take a rather con-
servative approach and employ several preprocessing mechanisms to filter out the noise
and potential biases introduced by human users during the reporting process.
To remove noise, we first filter out all spam reports that do not contain legitimate
and valid 10-digit phone numbers1 . In addition, we use the SMS CDRs to cross-validate
the remaining spam numbers, i.e., we remove those that either have no corresponding
SMS CDRs (within a week window of the user reporting). This filtering process removes
roughly 15.6% of the spam reports from further consideration.
To address the potential biases introduced by users in reporting spam, we match
the spam messages in the spam reports against a set of regular expressions defined by
anti-fraud/anti-abuse human agents of the cellular carrier (e.g., “.*you have won a XXX
$1,000 giftcard.*”). These regular expressions are generated by these agents over time
in a conservative manner based on manual inspection of spam reports and other user
complaints, with the aim to restrict the offending spam numbers from further abuse.
Hence these regular expressions have been tracked over years to ensure no false positives
(the agents are notified of false alarms when legitimate customers call the customer care
to complain about their SMS services being restricted). We obtain 384K spam reports
after removing all reports that do not match any of the regular expressions.
4.3.2 Spam Number Extraction and Spam Report Volume
During a one year observation period, a phone number can be deactivated, e.g., aban-
doned by users or shut down by cellular providers, and can be recycled after a predefined
time period. In other words, a phone number can be owned by some users for legitimate
communication and by some others for launching SMS spam during the observation pe-
riod. To address this issue, we consult the service plans of the phone numbers and
1 In fact, 12.2% of the user spam reports contain (valid) so-called short code numbers with fewerthan 10 digits. The short codes are generally used as gateways between mobile networks and other(computer) networks and services. For instance, they are used for computer users (e.g., via Googlevoice or Yahoo messenger service) to send SMS messages to other mobile users, or for mobile users tosend tweets to Twitter, or to vote for American Idol (in latter two cases, the messages are received bycomputers for further processing). Since this study focuses on SMS spam sent/received by mobile users,we remove these short code related reports from further consideration, leaving analysis of them as ourfuture work.

22
identify their service starting times and ending times, which help uniquely identify each
phone number. For instance, even with the same 10-digit sequence, a phone number
which has a service plan that ends in January and is reopened in May will be counted
as two different numbers in these two months. Hereafter we shall follow this definition
to identify spam numbers.
After preprocessing, from the one-year user-generated spam reports, we extract a
total of 78.8K spam numbers. Fewer than 1,000 spam messages were reported daily in
2011, and since 2012 this number has increased steadily and reached above 5K after
April 2012. Furthermore, the number of new spam numbers reported has also increased
over time (albeit not as significant). These increases are likely due to two factors: i)
SMS spam activities have grown considerably over time; and ii) more users have become
aware of – and started using – the spam reporting service. We also observe a clear day-
of-week effect because spamming activities are more significant during week days.
4.3.3 Analyzing Spam Text Content
Our initial analysis on the text content of the reported spam messages reveals many
interesting observations which we summarize as follows. We find among all the user
reported spam messages, 23% of them contain reply phone numbers and 75.1% of them
contain at least one valid URL, where 7.4% of these URLs used URL shortening service
like TinyURL [51]. This is likely due to the limited SMS message length and spammers’
intention of hiding the real phishing sites, which are much easier to be identified by
mobile users. We find that 74.6% of the domain names associated with the embedded
URLs are lookupable, i.e., they can be resolved to a total of 595 unique IP addresses.
For these 595 IP addresses, 443 (74.4%) are associated with one domain name, while the
rest of the 152 IP addresses are corresponding to multiple domain names. We find each
of these 152 IP addresses is usually associated with a relatively large number of domain
names. For example, the largest one is associated with 50 domain names. Moreover,
these IPs tend to come from similar subnets.
We further examine the domain names mapped to the same IP address. By looking
at the keywords within these domain names, we find clusters of domain names belonging
to different topics. For example, we find an IP address that hosts domain names related
to free rewards and free electronic devices, where the corresponding domain names

23
look very similar, such as 1k-reward.xxx and 1krewards.xxx, and cell-tryouts.xxx and
celltryout.xxx. These observations imply that spammers are likely to rent hosting servers
from certain IP ranges that are managed with loose policies. On each hosting server,
they tend to apply for multiple domain names and create a separate website for each
domain name. In this way, spammers can maximize the utilization of the phishing sites.
An interesting observation is that most spam messages are customized. Over 60%
of the messages contain random numbers or strings. These random numbers or strings
are often claimed as identification codes or are part of the URLs inside the spam mes-
sages. We suspect these random contents are used to differentiate spam victims for two
purposes. First, when victims access the phishing sites through the URLs, such random
content helps the spammer estimate the effectiveness of the spamming activities. We
believe some spammers are paid based on how many unique victims are attracted to
the phishing sites by the spam messages. Second, by recording the victims who reply
to the spammers or access the phishing sites, spammers can obtain a list of active (or
vulnerable in some sense) mobile phone numbers to increase the success rate of future
spam activities.
4.4 Characterizing Spam Numbers
Using spam numbers extracted from the user spam reports, we gather various other
sources of data associated with these numbers, such as account and device profiles,
network and traffic level data and statistics (voice, SMS and data usage patterns, ge-
olocations, and so forth). By analyzing and correlating these data sources, we study
the various characteristics of individual spam numbers.
4.4.1 Device and Tenure
Device: In order to identify the devices employed by spammers, we extract the first
8-digit TAC from each IMEI associated with spam numbers and match it against a TAC
lookup table. The table was created by the carrier in January 2013, which covers the
most popular mobile devices in the cellular network under study.
We find that nearly half of the devices are smartphones (44.5%). The rich func-
tionality of these devices enables spammers to create apps to automate SMS spamming

24
activities. There are 20.3% of the devices that have an unknown TAC type – this is
likely due to either unpopular spam devices or random IMEI numbers generated by SIM
boxes. Programmable devices such as 3G data modems, laptops/netbooks, data cards,
etc. account for a total of 11.7% devices used in SMS spam. Interestingly, many “M2M”
(machine-to-machine) devices (e.g., used for vehicle tracking and vending machines) are
also employed by spammers for sending SMS spam. Costs (both in terms of the devices
and the account contracts/payment methods available to them) likely play a role in
determining what types of devices are deployed for SMS spam campaigns.
Tenure. Here tenure is defined as the time from when the account of the spam number
is first enrolled in the service until the first spam message from that spammer is reported.
We find that a majority of the spammers hold new accounts. In particular, over half of
spam numbers have a tenure of only one day and more than 60% of them have a tenure
less than a week (similar observation was made in [17]).
4.4.2 SMS, Voice and Data Usage Patterns
We now study the overall SMS, voice and data usage patterns of spam numbers, and
compare them with the rest of legitimate numbers 2 . For data usage patterns, only
those spam numbers with data activities are used. Figs. 4.1[a-c] display the comparison
in terms of the number of SMS messages [a], the number of bytes of data [b] , and the
total call duration [c] over the same one month observation period. Not surprisingly,
spam numbers initiated far more SMS messages than legitimate ones (Fig. 4.1[a]). In
fact, we observe that 80% of the spam numbers send more than 10K SMS’s, and half
of the spam numbers send more than 100K SMS’s. In comparison to SMS usage, spam
numbers consume very little data as represented by the much fewer number of bytes
(Fig. 4.1[b]). However, among the spam numbers which do initiate data communi-
cations, the data activities more often than not involve financial sites such as banks.
Further investigation of whether such data traffic is associated with security attacks or
other illicit financial transactions is left to future work.
2 Though we have checked the tenure and device information of the legitimate numbers to removelikely spam numbers, there is still a chance that a few spam numbers are included in these legitimatenumbers. However, we believe this does not affect our analysis of the usage behaviors of legitimatenumbers given their large population size.

25
10−5
100
Number of SMS messages
1 −
CD
F
UsersSpammers
(a) Number of SMS’s
10−5
100
Number of bytes
1 −
CD
F
UsersSpammers
(b) Number of data bytes
10−5
100
Number of call minutes
1 −
CD
F
UsersSpammers
(c) Total call minutes
Figure 4.1: Monthly SMS/data/voice usage.
The total call minutes of spam numbers are generally shorter than those of legitimate
ones (Fig. 4.1[c]). However, we find some spam numbers may initiate even far more
(though generally short) voice calls than legitimate ones do. We count the out-going
voice calls from spam numbers and find 10 spam numbers which have initiated more
than 10K voice calls. All of them were reported by users on popular online forums [52]
as being involved in telemarketing and other voice related fraud activities [53]. It is
possible that these spam numbers harvest live mobile numbers through voice calls in
order to increase the efficiency of spamming.
4.5 Network Characteristics of Spam Numbers
Using the SMS CDRs, we next study the network characteristics of spam numbers.
4.5.1 Spam Sending Rate
We measure the SMS spamming rate using the average number of SMS messages sent
from each identified spam number per hour. We assess the variability of spamming
rates using the coefficient of variation, which is defined as cv = σ/µ, where σ and µ
represent the standard deviation and mean spamming rate of each spam number, re-
spectively. The coefficient of variation shows the extent of variability relative to the
mean sending rate. Fig. 4.2 displays the mean spamming rate and the corresponding
coefficient of variation for individual spam numbers. For ease of visualization, we il-
lustrate the marginal densities along both axes using rug plots. We observe that the

26
1 5 10 50 500 5000
0.1
0.2
0.5
1.0
2.0
5.0
10.0
Spamming rate (# SMS/hour in log scale)
Coe
ffici
ent o
f var
iatio
n (in
log
scal
e)
Figure 4.2: Spamming rate and variability in terms of number of messages.
spamming rate varies from a few to over 5,000 spam messages per hour. In addition,
while the majority of spamming activities are at a constant rate (i.e., with a low cv
close to the x-axis), some numbers exhibit more bursty spamming behaviors, i.e., with
a cv greater than 3. From these two metrics, we observe three distinct regions, which
we refer to as “slow,” “moderate,” and “fast” spammers (i.e., three clusters from left to
right in Fig. 4.2). “Moderate” spammers cover 63% of all spam numbers, while “fast”
spammers and “slow” spammers account for 20% and 17%, respectively. Further in-
vestigation shows that the spamming rates often depend on the devices used and the
network locations of the spammers.
4.5.2 Spamming Locations and Impact on the Cellular Network
We end this section by an assessment of the sending locations of spam messages and the
potential impact of spamming traffic on the cellular network. We define the location of
a spam number as the serving node-B from which a spam message is sent by that spam
number. We find there are a few spam numbers (4.9%) which are highly mobile, i.e.,
they utilize more than 10 node-B’s and distribute their workload among these node-B’s
(i.e., with the proportion of spam messages from the most dominant node-B less than
40%). However, most spam numbers initiate spam at less than 5 node-B’s (78.2% spam

27
numbers) and the most dominant node-B carry more than 60% of the traffic (74.5%).
We hence refer to these dominant node-B’s as the primary spamming locations for spam
numbers. In fact, many of these node-Bs reside in densely populated metro areas (e.g.,
New York City and Los Angeles). We suspect that concentrating on densely populated
urban areas enables spammers to easily obtain resources, like used phone numbers. In
addition, spammers can take the advantage of the high-speed 3G/4G network at these
locations to spam in much higher rates.
At these node-B’s, we find that the sheer volume of spamming traffic is astonishing.
The spamming traffic can exceed normal SMS traffic by more than 10 times. Even at
the RNC’s, which serve multiple node-B’s, the traffic from spamming may account for
80% to 90% of total SMS traffic at times. Such a high traffic volume from spammers
can exert excessive loads on the network, affecting legitimate SMS traffic. Furthermore,
since SMS messages are carried over the voice control channel, excessive SMS traffic can
deplete the network resource, and thus can potentially cause dropped calls and other
network performance degradation. These observations also emphasize the necessity of
restricting spam numbers earlier before they reach many victims and inflict adverse
impact on the cellular network.
4.6 Investigating Correlations between Spam Numbers
So far we have focused on the characteristics of individual spam numbers. In this section
we will cluster spam numbers based on the content similarity of the spam messages they
generate, and characterize and explain the correlations between spam numbers.
4.6.1 Clustering Spam Messages with CLUTO
Recall that, through our initial manual content inspection, we have observed that many
spam numbers are reported to have generated the same or similar spam messages. We
hence apply a text mining tool–CLUTO [14, 54]–to cluster spam messages with similar
content into spam clusters. CLUTO contains many different algorithms for a variety
of text-based clustering problems, which have been widely applied in research domains
like analyzing botnet activities [55]. After testing different clustering algorithms imple-
mented in CLUTO, we choose the most scalable k-way bisecting algorithm, which yields

28
comparable clustering results to other more sophisticated algorithms.
Raymond you won ... Go To apple.com.congratsuwon.xxx/codelrkfxxxxxxLaurence you won ... Go To apple.com.congratsuwon.xxx/codercryxxxxxx
You have been chosen ... Goto ipad3tests.xxx. Enter: 68xx on 3rd pageYou have been chosen ... Goto ipad3tests.xxx. Enter: 16xx on 3rd page
Table 4.1: Example spam messages from the same clusters.
Before applying CLUTO, we first compute a similarity matrix for all the spam
messages, using the tf-idf term weighting and the cosine similarity function. Operating
on the similarity matrix, the k-way bisecting algorithm repeatedly selects one of the
existing clusters and bi-partitions it in order to maximize a predefined criterion function.
The algorithm stops when K clusters are formed. We explore different choices of K’s
and select the largest K such that trivial clusters (i.e., which contain only one message)
start to appear after further increasing K. Details regarding how to apply CLUTO for
clustering spam messages can be found in [56].
We manually investigate and validate the clusters identified by CLUTO. Not surpris-
ingly, we find that spam messages within the same cluster are generally similar except
for one or two words. Table 4.1 demonstrates examples of spam messages that belong
to two different clusters, where the variant text content is highlighted in blue italics.
We suspect that such variant content is specific to each spam victim. Spammers rely on
such content to distinguish and track responses from different victims and possibly get
paid according to the number of unique responses. In the end, we obtain 2,540 spam
clusters that cover all the spam messages. We observe that most of the clusters (92%)
contain multiple spam numbers and 48% can cover more than 10 spam numbers. In
the follow-up analysis, we focus on the top 1,500 clusters which exhibit an intra-cluster
similarity greater than 0.8, and investigate the correlations of the spam numbers inside
these clusters. These clusters cover totally over 85% of the reported spam messages.
4.6.2 Correlations of Spam Numbers
Device similarity. We start by comparing the device types associated with individual
spam numbers. We define the device similarity as the proportion of spam numbers
within each cluster that use the most dominant device of that cluster. Fig. 4.3[a]
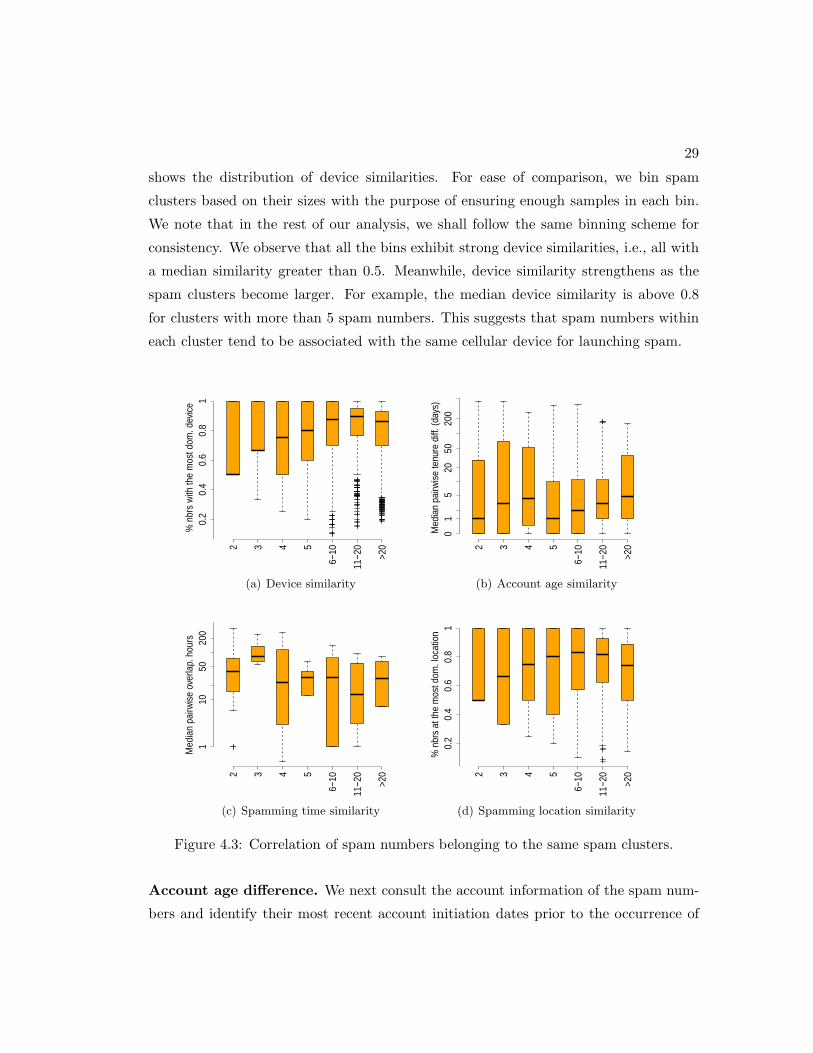
29
shows the distribution of device similarities. For ease of comparison, we bin spam
clusters based on their sizes with the purpose of ensuring enough samples in each bin.
We note that in the rest of our analysis, we shall follow the same binning scheme for
consistency. We observe that all the bins exhibit strong device similarities, i.e., all with
a median similarity greater than 0.5. Meanwhile, device similarity strengthens as the
spam clusters become larger. For example, the median device similarity is above 0.8
for clusters with more than 5 spam numbers. This suggests that spam numbers within
each cluster tend to be associated with the same cellular device for launching spam.
% n
brs
with
the
mos
t dom
. dev
ice
2 3 4 5
6−10
11−2
0
>20
0.2
0.4
0.6
0.8
1
(a) Device similarity
Med
ian
pairw
ise
tenu
re d
iff. (
days
)
2 3 4 5
6−10
11−2
0
>20
01
520
5020
0
(b) Account age similarity
Med
ian
pairw
ise
over
lap.
hou
rs
2 3 4 5
6−10
11−2
0
>20
110
5020
0
(c) Spamming time similarity
% n
brs
at th
e m
ost d
om. l
ocat
ion
2 3 4 5
6−10
11−2
0
>20
0.2
0.4
0.6
0.8
1
(d) Spamming location similarity
Figure 4.3: Correlation of spam numbers belonging to the same spam clusters.
Account age difference. We next consult the account information of the spam num-
bers and identify their most recent account initiation dates prior to the occurrence of

30
spam traffic. We note that after purchasing a spam number, a spammer may spend
some time preparing for spamming by sending out a few test messages. Taking this into
consideration, we refer to the account age of a spam number as the time span from the
account initiation date to the first date with observed active spamming behaviors (i.e.,
the first date with a spamming rate above 50 messages per hour based on Fig. 4.2).
We measure the account age difference of spam numbers in each cluster using the
their median pairwise absolute account age difference (in days). From Fig. 4.3[b], we
see the median values of such difference in all the bins are below 5 days. Such a small
difference indicates that most spam clusters employ spam numbers acquired within a
short time period, e.g., purchased from the same retailer at the same time. In fact, for
30% of the clusters, spammers start spamming actively at the same date when all the
spam numbers are initiated, 73% within 3 days and 82% within one week. This implies
that monitoring and tracking purchases of bulks of phone numbers by the same user
can be an effective way of alerting potential spam clusters.
Spamming time similarity. After investigating the similarity of demographic fea-
tures, we next compare the spamming patterns of spam numbers. We first explore
whether spam numbers within each cluster tend to send spam actively during the same
time period. We define the time similarity as the median pairwise overlapping time (in
hours) with active spamming behaviors (i.e., more than 50 messages per hour), which
is displayed in Fig. 4.3[c]. In most of the bins, the median values are above 20 hours,
which implies a strong temporal correlation among these spam numbers.
Spamming location similarity. Another spamming pattern we investigate is the
spamming locations of spam numbers. We define the location similarity as the pro-
portion of spam numbers within a cluster with primary spamming locations being the
most dominant one in that cluster. Fig. 4.3[d] displays the distribution of the loca-
tion similarity, which again appears to be very significant. The similarity reaches 0.8
when the cluster size equals 5 and drops slightly as cluster size further increases. We
investigate the clusters with more than 20 spam numbers and find that many of these
phone numbers have primarily locations in closeby node-B’s. We suspect that this is
because spammers want to increase the spamming speed by deploying multiple numbers
at nearby locations.

31
To summarize, various independent evidences from our analysis above of the spam
clusters demonstrate that spam numbers within the same cluster are strongly corre-
lated. We believe that the spam numbers contained in the same clusters are very likely
employed by the same spammers. These spammers purchase a bulk of spamming de-
vices and phone numbers and program them to initiate spam. These spam numbers
thus exhibit strong spatial and temporal correlations. Meanwhile, we observe that for
more than 80% of the clusters, the spam numbers in the cluster employ similar spam-
ming rates and target selection strategies. It implies that spammers often program
their spamming devices in a similar way (often at the maximum speed allowable for the
devices at the locations of the network). In comparison, spam numbers exhibit little
correlation across clusters, indicating that different clusters are likely caused by different
spammers (likely) from different locations.
4.7 Implications on Building Effective SMS Spam Defenses
Based on our previous analysis on various aspects of SMS spam numbers, in this section,
we pinpoint the inefficacy of existing solutions solely replying on user spam reports. We
then propose several novel and effective spam defense methods.
4.7.1 Are User Spam Reports Alone Sufficient?
As we have mentioned, many cellular carriers today rely primarily on user spam reports
for detecting and restricting spam numbers. Unfortunately, such a user-driven approach
inevitably suffers from significant delay. For example, the black solid curve in Fig. 4.4
measures how long it takes for a spam number to be reported after spam starts (i.e.,
report delay). We consider a spam number starts spamming when it first reaches at
least 50 victims in an hour. From Fig. 4.4, we observe that only less than 3% of the
spam numbers are reported within 1 hour after spam starts. More than 50% of the
spam numbers are reported 1 day after. This is likely due to the extreme low spam
report rate. Compared with the huge volume of spam messages, less than 1 in 10,000
of spam messages were reported by users in the 1-year observation period.
While most of the report delay is due to the extremely low spam report rate, even
users who do report spam may also introduce delay on their side, partly due to the

32
inconvenient two-stage reporting method. The red dotted curve in Fig. 4.4 shows how
fast a user reports a spam message after receiving it. Since each user can receive multiple
spam messages from the same spammer and can report the same report number multiple
times, we define user delay as the time difference between when the user reports a spam
message and the last time that the user receives spam from that particular spammer
before the report. We observe in Fig. 4.4, among the users who report spam, half of their
reports arrive more than 1 hour after they receive the spam messages. Around 20% of
the spam messages occur after one day. In fact, even for those users who report spam,
we find around 16.8% of them stop at the first stage and fail to supply the corresponding
spam numbers, not to mention the inaccurate spam records caused by users mistyping
spam numbers.
Such report delay is amplified when used for detecting multiple spam numbers em-
ployed by the same spammers. For example, we measure the earliest report times of
all spam numbers in each of the clusters which we identified in Section 4.6 that contain
at least 5 spam numbers. Fig. 4.5 demonstrates the total time (in hours) required for
users to report 50%, 80% and all spam numbers in each cluster, respectively. We again
observe a significant delay in user reports. In particular, for 80% of the clusters, it takes
20 hours for users to report half of the spam numbers in them. It takes even more than
38 hours for users to report 80% of the spam numbers in them.
Therefore, spam defenses relying solely on the current user spam reports can be
late and can miss many spam numbers due to both the low report rate and report
delay. Advertising can be useful to increase the users’ awareness of the spam reporting
service and hence can help increase the report rate. Meanwhile, incentives (e.g., credits)
provided by cellular carriers can encourage more users to report spam they have received.
In addition, an enhancement of the existing cumbersome two-stage reporting method is
also important to prevent mistakes during spam reporting and ultimately increase spam
report rate. As an example, on smartphones, we are currently developing a mobile-app
based solution which enables users to report spam via one single click.
4.7.2 Detecting Spam Numbers using Spatial/Temporal Correlations
In addition to improving the existing spam reporting, we can also design more efficient
spam defenses that are less dependent on user spam reports. For instance, although it
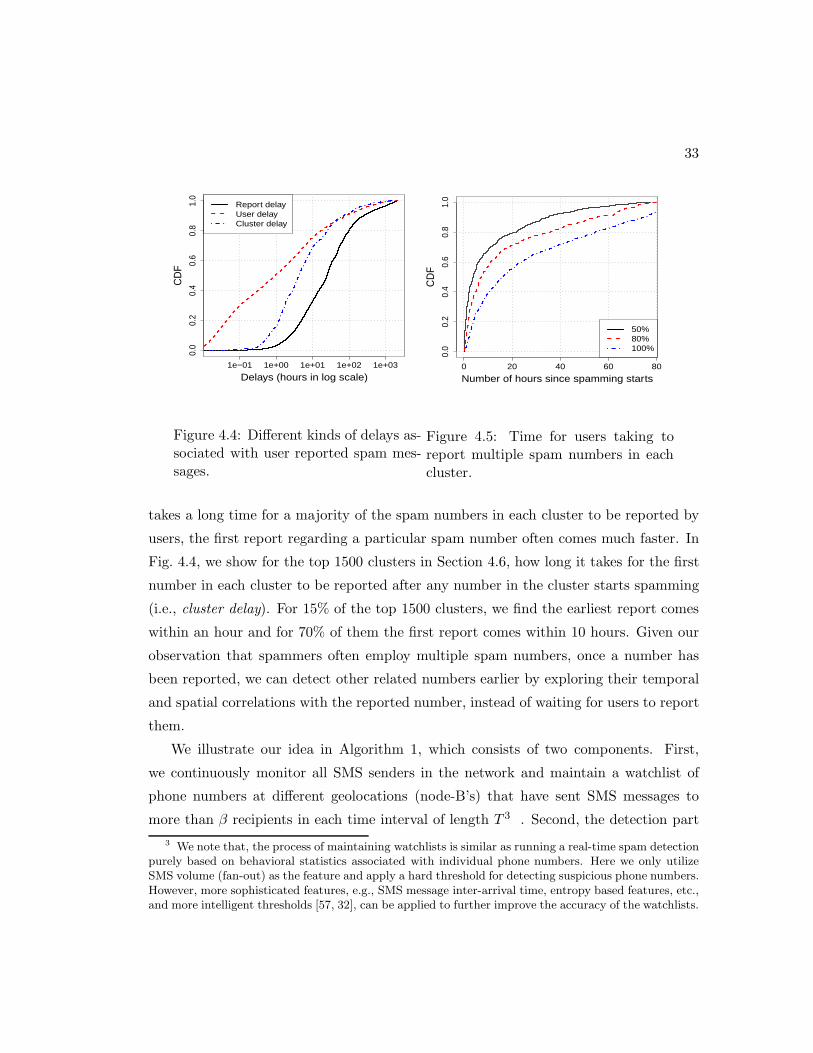
33
1e−01 1e+00 1e+01 1e+02 1e+03
0.0
0.2
0.4
0.6
0.8
1.0
Delays (hours in log scale)
CD
F
Report delayUser delayCluster delay
Figure 4.4: Different kinds of delays as-sociated with user reported spam mes-sages.
0 20 40 60 80
0.0
0.2
0.4
0.6
0.8
1.0
Number of hours since spamming starts
CD
F
50%80%100%
Figure 4.5: Time for users taking toreport multiple spam numbers in eachcluster.
takes a long time for a majority of the spam numbers in each cluster to be reported by
users, the first report regarding a particular spam number often comes much faster. In
Fig. 4.4, we show for the top 1500 clusters in Section 4.6, how long it takes for the first
number in each cluster to be reported after any number in the cluster starts spamming
(i.e., cluster delay). For 15% of the top 1500 clusters, we find the earliest report comes
within an hour and for 70% of them the first report comes within 10 hours. Given our
observation that spammers often employ multiple spam numbers, once a number has
been reported, we can detect other related numbers earlier by exploring their temporal
and spatial correlations with the reported number, instead of waiting for users to report
them.
We illustrate our idea in Algorithm 1, which consists of two components. First,
we continuously monitor all SMS senders in the network and maintain a watchlist of
phone numbers at different geolocations (node-B’s) that have sent SMS messages to
more than β recipients in each time interval of length T 3 . Second, the detection part
3 We note that, the process of maintaining watchlists is similar as running a real-time spam detectionpurely based on behavioral statistics associated with individual phone numbers. Here we only utilizeSMS volume (fan-out) as the feature and apply a hard threshold for detecting suspicious phone numbers.However, more sophisticated features, e.g., SMS message inter-arrival time, entropy based features, etc.,and more intelligent thresholds [57, 32], can be applied to further improve the accuracy of the watchlists.

34
is triggered by a confirmed spam number (e.g., from user spam reports). In particular,
when a spam number in the watchlist is confirmed, we look for all the other numbers
from the watchlist whose primary spamming locations (i.e., node-B’s) is the same as
the confirmed number and report them as spam number candidates.
Algorithm 1 Detecting correlated spam numbers.
1: Input: T , β2: //Maintaining a watchlist3: for all Locations l do4: Within the observation window T , identify Wl={nbr: nbr at location l has sent
SMS’s to more than β recipients}, and W := ∪Wl;5: end for6: //Detecting spam numbers by geo/temporal correlations;7: loop8: if A spam number x is confirmed and x ∈ W then9: Obtain the location l associated with x;
10: Output spam number candidates Wl − {x};11: end if12: end loop
We simulate the detection process on a month long dataset consisting of CDRs
and spam reports received during that month. The proposed algorithm detects 5,121
spam number candidates, 4,653 (90.9%) of which were reported later by mobile users
via spam reports. We have the remaining unreported candidates investigated by fraud
agents. The investigation combines information sources such as spam reports from
online forums (e.g., [58]), service plans, devices as well as the expert knowledge. In
the end, 465 of them have been validated to be spam numbers. In other words, the
proposed algorithm is highly accurate, with only 3 (less than 0.06%) candidates not
yet verified. In addition, we observe that in more than 93% of the cases, the proposed
algorithm detects spam numbers an hour ahead of user reports. More than 72% and
40% of the detection results are 10 hours and 1 day before user reports arrive. In fact,
more than half of the spam messages can be reduced by detecting and restricting spam
numbers using our method. From the perspective of spammers, the proposed method
can only be evaded by either reducing the spamming speed, employing a single number
for spamming or distribute numbers at different network locations. Nevertheless, any of
For proprietary reasons, the specific choices of parameters β and T will not be released here.

35
them will either limit the impact of spamming or significantly increase the management
cost.
4.8 Summary
In this chapter, we carried out extensive analysis of SMS spam activities in a large cellu-
lar network by combining user reported spam messages and spam network records. Us-
ing thousands of spam numbers extracted from these spam reports, we studied in-depth
various aspects of SMS spamming activities, including spammer’s device type, tenure,
voice and data usage, spamming patterns and so on. We found that spam numbers
sending similar text messages exhibit strong similarities and correlations from various
perspectives. Based on these facts, we proposed several novel spam detection methods
which demonstrated promising results in terms of detection accuracy and response time.

Chapter 5
Greystar: Detecting SMS Spam
using Grey Phone Space
5.1 Introduction
In Chapter 4, we performed extensive analysis on SMS spam, and proposed a novel
related spam number detection algorithm based on the strong temporal/spatial corre-
lations among spam numbers employed by the same spammer, as well as user spam
report. However, this algorithm still relies on user spam reports, which, as we also
pointed out in Section 4.7, inevitably suffers from significant delay. To address this is-
sue, in this chapter, we study popular target selection strategies adopted by spammers
and find that a majority of spammers choose targets randomly from a few area codes
or the entire phone number space, and initiate spam traffic at high rates.
To detect such aggressive random spammers, we advance a novel notion of grey
phone space. On top of grey phone space, we propose the design of Greystar. Greystar
employs a novel statistical model to detect spam numbers based on their interactions
with grey numbers and other non-grey phone numbers. We evaluate Greystar using five
months of SMS call records. Experimental results indicate that Greystar is superior to
the existing SMS spam detection algorithms, which rely heavily on victim spam reports,
in terms of both accuracy and detection speed.
The remainder of this chapter is organized as follows. We introduce the datasets used
in our study in Section 5.2. We then motivate the design of Greystar in Section 5.3. In
36

37
Section 5.4 we study the SMS activities of spammers and legitimate users. The definition
of grey numbers is presented in Section 5.5. In Section 5.6, we explain in detail the design
of Greystar. Evaluation results are presented in Section 5.7. Section 5.8 summarizes
this chapter.
5.2 Datasets
In this section, we describe the datasets and our ground truth used for identifying spam
phone numbers in this chapter. We used the same datasets as in Chapter 4, namely
user spam reports and SMS call detail records. The CDR dataset spans 5 months from
Jan 2012 to May 2012 for the study in this chapter. We also employ six months of spam
reports from Jan 2012 to June 2012 in order to cover spam numbers observed between
Jan and May but are reported after May due to the delay of the spam reports (see
Section 5.3.2).
5.2.1 Obtaining Ground Truth
Although victim spam reports provide us with ground truth for some spam numbers,
they are by no means comprehensive and can be noisy (see Section 5.3.2). Therefore, in
this paper, we employ a more reliable source of ground truth. In particular, we request
the fraud agents from the said UMTS carrier to manually verify spam number candidates
detected by us. These fraud agents are exposed to much richer (and more expensive)
sources of information. For example, fraud agents can investigate the ownership and
the price plan information of the candidates, examine their SMS sending patterns and
correlate them with known spam numbers in terms of their network locations and active
times, etc. The final decision is made conservatively by corroborating different evidence.
Admittedly, fraud agents can make mistakes during their investigation. Meanwhile,
their breadth may be limited by not being able to inspect all mobile numbers in the
network. Nevertheless, fraud agents provide us with the most authoritative ground
truth available for our study. It is worth mentioning that such investigation by fraud
agents has been deployed independently for SMS spam number detection and restriction
for more than one year and no false alarm has yet been observed (e.g., no user complaint
is observed so far regarding incorrectly restricted phone numbers). Therefore, in our

38
study, we will treat fraud agents as a black box authority, i.e., we submit a list of spam
number candidates to fraud agents and they return a list of confirmed spam numbers.
5.3 Objectives and Existing Solutions
In this section, we discuss the objectives of developing an effective defense against SMS
spam by comparing the difference between SMS spam and traditional email spam. We
then review the most widely adopted SMS spam detection method based on crowd-
sourcing victim spam reports and point out its inefficacy. In the end, we present the
rationale of the proposed Greystar system.
5.3.1 SMS Spam Defense Objectives
In a conventional SMS spamming scenario, an SMS spammer (note that we refer to
an SMS spammer as the person who employs a set of spam numbers to launch SMS
spam campaigns) first invests in a set of phone numbers and special high-speed devices,
such as 3G modems and SIM boxes [17]. Using these devices, s/he then initiates unso-
licited SMS messages to a large number of mobile phone numbers. Akin to traditional
email spam, the objective of SMS spam is to advertise certain information to entice
further actions from the message recipients, e.g., calling a fraud number or clicking on
a URL link embedded in the message which points to a malicious site. However, SMS
spamming activities exhibit unique characteristics which shift the focus of the defense
mechanisms and hence render inapplicable or inefficient existing solutions for defending
against traditional email spam.
Email service providers usually detect and filter email spam at their mail servers, to
which they have full access. There they can build accurate spam filters by exploiting rich
features in emails including the text content. Spam filters at end user devices are also
a common choice, where email clients (apps) filter spam while retrieving emails from
remote mail servers. Though blacklist of email spammers are sometimes used to assist
spam classification [59, 60, 61], restricting email spam senders is usually not the main
focus of the defense, since it requires close collaboration between email providers and
network carriers. Moreover, it is observed that many spam emails are originated from
legitimate hosts due to botnet activities [62], which makes restricting spam originators

39
an inapplicable solution.
In comparison to emails which are generally stored on servers and wait for users
to retrieve them, SMS messages are delivered instantly to the recipients through the
SS7 network. Along the path, SMS messages are only cached temporarily at SMSC
(only when the recipients are offline), leaving little time for cellular carriers to react to
them. The task becomes even more challenging especially when the SMS traffic volume
peaks during busy hours. Filtering SMS spam at end user devices (e.g., using mobile
apps) is also not applicable given many SMS capable devices (e.g., feature phones)
do not support running such apps. In addition, for a user with a pay-per-use SMS
plan, she is already charged for the spam message once it arrives at her device. More
importantly, even when SMS spam filters are deployed at SMSC’s and end user devices,
SMS spammers can still inflict significant loss to the carrier and other mobile users.
This is because the huge number of spam messages can lead to a significant increase
in the SMS traffic volume at the cell towers serving the spam senders, possibly causing
congestion and hence deteriorating voice/data usage experience of nearby users. For
example, we have found the SMS traffic volume at cell towers can easily get multiplied
by more than 10 times due to the activities of spammers. Therefore, the focus of the
SMS spam defense is to control spam numbers as soon as possible before they reach a
large number of victims.
An efficient SMS spam detection algorithm is hence expected to react quickly to
emerging spamming activities. Meanwhile, the focus on restricting spam numbers places
a strong emphasis on the accuracy of the algorithm. First, it requires a spam detection
algorithm to limit false alarms, because false alarms can lead to incorrect restriction of
legitimate users from accessing SMS services. Second, it demands the algorithm detect
as many spam numbers as possible so as to minimize the impact of SMS spam activities
on the network. Such high accuracy requirements are hard to achieve solely based on
the SMS sending patterns of the spammers. For example, it is difficult to separate
spam campaigns from legitimate SMS campaigns, such as a school sending messages to
its students to alert adverse weather conditions. These legitimate senders can exhibit
characteristics that are common to SMS spammers1 . Spammers may also alter their
1 Maintaining a whitelist of such legitimate intensive SMS users can be challenging. First, wehave little information to identify the white list if the users are outside the network. Second, evenfor the users inside the network, the whitelist can still be dynamic, with new businesses/organizations

40
sending patterns to mimic legitimate users to avoid detection. As a result, cellular
carriers often seek the assistance from their customers to alert them of emerging SMS
spam activities.
5.3.2 Spam Detection by Crowdsourcing Victim Spam Reports
The emphasis on high accuracy gives rise to the wide adoption of spam detection meth-
ods based on victim spam reports which were introduced in Section 5.2. Victim spam
reports represent a more reliable and cleaner source of SMS spam samples, as all the
spam messages contained in the reports have been vetted and classified by mobile users
(using human intelligence). To further mitigate the possible errors caused during the
two-step reporting process, cellular carriers often crowdsource spam reports from dif-
ferent users. For example, a simple yet effective strategy is to identify a spam number
after receiving reports from K distinct users. Meanwhile, defense mechanisms based on
victim spam reports are also of low cost, because only numbers reported by users need
to be further analyzed. Due to this reason, spam reports are usually a trigger for more
sophisticated investigation on the senders, such as their sending patterns, service plans,
etc..
Despite the high accuracy and low cost, detecting SMS spam based on spam reports
is analogous to performing spam filtering at user devices. The major drawback is de-
tection delay, which we have illustrated in Section 4.7. In addition to the problem of
detection delay, the current two-stage reporting method is error-prone. We find around
10% reporters fail to provide a valid spam number at the second stage. Moreover,
spam report based methods are vulnerable to attacks, as attackers can easily game with
the detection system by sending bogus reports to Denial-of-Service (DoS) legitimate
numbers. All these drawbacks render spam detection using victim spam reports an
insufficient solution.
5.3.3 Overview of Greystar
Recognizing the drawbacks of existing victim report based solutions, we introduce the
rationale behind Greystar. The objective of Greystar is to accurately detect SMS spam
initiating/stopping SMS broadcasting services every day. More importantly, users are not obliged toreport to the carrier when they intend to start such services.

41
while at the same time being able to control spam numbers as soon as possible before
they reach too many victims. To this end, we advance a novel notion of grey phone
numbers. These grey numbers usually do not communicate with other mobile numbers
using SMS, they thereby form a grey territory that legitimate mobile users rarely enter.
On the other hand, as we shall see in Section 5.4, it is difficult for spammers to avoid
touching these grey numbers due to the random target selection strategies that they
usually adopt. Greystar then passively monitors the footprints of SMS senders on these
grey numbers to detect impending spam activities targeting a large number of mobile
users.
Greystar addresses the problems in existing spam report based solutions as fol-
lows. First, the population of grey numbers is much larger and widely distributed (see
Section 5.5), providing us with more “spam alerts” to capture more spam numbers
more quickly. Second, by passively monitoring SMS communication with grey numbers,
we avoid the user delay and errors introduced when submitting spam reports. Last,
Greystar detects spammers based on their interactions with grey phone space. This
prevents malicious users from gaming the Greystar detection system and launching
DoS attacks against other legitimate users.
In the following, we first study the difference of spamming and legitimate SMS
activities in Section 5.4, which lays the foundation of the Greystar system. In Section 5.5
we introduce our methodology for identifying grey numbers. We then present the design
of Greystar in Section 5.6 and evaluate it in Section 5.7.
5.4 Analyzing SMS Activities of Spammers and Legiti-
mate Users
We first formally define SMS spamming activities. During a spamming process, a
spammer selects (following a certain strategy) a sequence of target phone numbers,
X := {x1, x2, · · · , xi, · · · } (1 ≤ i ≤ n), to send SMS messages to over a time window T .
Each target phone number is a concatenation of two components, the 3-digit area code
xai , which is location specific, and the 7-digit subscriber number xs
i . Note that we only
examine US phone numbers (which have 10 digits excluding the leading country code
“1”). Phone numbers of SMS senders from other countries which follow the same North

42
American Numbering Plan (NANP) are removed before the study. All the statistics
in this section are calculated based on a whole month data from January 2012. To
compare the activities of spam numbers and legitimate numbers, we obtain an equal
amount of samples from both groups. In particular, the spam numbers are identified
from victim spam reports and the legitimate numbers are randomly sampled from the
remaining SMS senders appearing in the month-long CDR data set. Both samples of
phone numbers are checked by fraud agents before the analysis to remove false positives
and false negatives.
5.4.1 Spammer Target Selection Strategy
We next study how spammers select spamming targets. Let X = {xt}, 1 ≤ t ≤ T ,
denote the sequence of phone numbers that a spam number sends messages to over
time. Given the fact that each phone number is a concatenation of two components:
the 3-digit area code xat , which is location specific, and the 7-digit subscriber number
xst , we also characterize the target selection strategies at two levels, i.e., how spammers
choose area codes and phone numbers within each area code.
We use the metric area code relative uncertainty (rua) to measure whether a spammer
favors phone numbers within certain area codes. The rua is defined as:
rua(X) :=H(Xa)
Hmax(Xa)=
−∑
q∈Q P (q) log P (q)
log|Q|,
where P (q) represents the proportion of target phone numbers with the same area code
q and |Q| is the total number of area codes in the phone number space. Intuitively, a
large rua (e.g., greater than 0.8) indicates that the spammer uniformly chooses targets
across all the area codes. In contrast, a small rua means the targets of the spammer
are concentrated by sharing only a few area codes.
We next define a metric random spamming ratio to measure how spammers select
targets within each area code. Let P a be the proportion of active phone numbers 2
with area code a. For a particular spamming target sequence Xa of a spam number, if
2 The active phone numbers are identified as all registered phone numbers inside the carrier’sbilling database who have unexpired service plans. We find that the active numbers are uniform acrossall area codes, possibly due to frequent phone number recycling within carrier networks (e.g., phonenumbers originally used by landlines are reassigned to mobile phones) and users switching betweencellular carriers while retaining the same phone numbers.

43
the spammer randomly choose targets, the proportion of active phone numbers in Xa
should be close to P a. Otherwise, we believe the spammer has some prior knowledge
(e.g., with an obtained target list) to select specific phone numbers to spam. Based on
this idea, we carry out a one sided Binomial hypothesis test for each spammer and each
area code to see if the corresponding target selection strategy is random within that
area code. The random spamming ratio is then defined as the proportion of area codes
with random spamming strategies (i.e., when the test fails to reject the randomness
hypothesis with P-value=0.05). Note that, for each spam number, only area codes with
more than 100 victims are tested to ensure the validity of the test.
0.0 0.2 0.4 0.6 0.8 1.0
0.0
0.2
0.4
0.6
0.8
1.0
Areacode RU
Ran
dom
spa
mm
ing
ratio
Figure 5.1: Target selection strategies.
Fig. 5.1 plots the rua (the x-axis) and the random spamming ratio (the y-axis) for
individual spam numbers. For ease of visualization, we illustrate the marginal densities
along both axes. Based on the marginal density of rua, we find that a majority of spam
numbers (78%, using rua = 0.8 as a cut-off threshold) concentrate on phone numbers
within certain area codes. We refer to such a spamming strategy as block spamming.
In comparison, the remaining 22% spam numbers adopt a global spamming strategy,
i.e., selecting targets from the entire phone number space. We rank area codes by their

44
popularity among spam numbers, i.e., how many spam numbers select the most target
numbers from a particular area code. In fact, we investigate the top 20 popular area
code among spammers and find that most of them correspond to large cities and metro
areas, e.g., New York City (with 3 area codes) , Chicago (2), Los Angeles (2), Atlanta,
and so on.
Based on the y-axis, we find that, no matter how a spam number chooses area
codes, a predominant portion of them select targets randomly within each area code.
We refer to these spammers as random spammers hereafter. This is likely accredited to
the finite phone number space, which enables spammers to enumerate phone numbers
to send spam messages to. Such random spamming strategies are of almost zero cost
and hence are the most economic strategies for spammers. Furthermore, this explains
why spammers favor large metro areas, because they are likely to reach more active
mobile users by randomly selecting numbers from these area codes.
0 2 4 6 8Time (days)
Pho
ne n
umbe
r sp
ace
(a) Global random
0 2 4 6Time (days)
Pho
ne n
umbe
r sp
ace
(b) Global sequential
0 2 4 6 8Time (days)
Pho
ne n
umbe
r sp
ace
(c) Block random
Figure 5.2: Foot prints of most representative target selection strategies.
We illustrate in Fig. 5.2 the “footprints” of three most popular target selection strate-
gies, where the x-axis represents time and the y-axis stands for numbers in the phone
number space. The global random spamming is shown Fig. 5.2[a], where a spammer
randomly chooses phone numbers from the entire phone number space 3 . In compar-
ison, in the global sequential spamming strategy (Fig. 5.2[b]), a spammer enumerates
3 Note that most spam numbers are programmed to avoid well known area codes that are unlikelyto contain active mobile users or inflict extra cost when sending SMS to, e.g., 900 area codes and areacodes of foreign countries which adopt the North American Numbering Plan (NANP). This results inranges of phone numbers never assessed by the spam number (i.e., shown as the blank horizontal regionsin Fig. 5.2[a]).

45
numbers in the phone number space in an ascending order and sends spam messages to
each phone number sequentially. Different from the above two strategies, block random
spamming only focuses on victims within certain area codes, and selects victims from
each area code randomly; see Fig. 5.2[c] for an example (the block sequential spamming
strategy, observed less frequently, is omitted due to space limit).
In summary, due to the finite phone space, spammers can simply enumerate phone
numbers to send spam messages. Compared to having a target phone number list before
spamming, this random target selection strategy is effective and of low cost, and hence
has been adopted by most SMS spammers. Due to their predominance, in this chapter,
we focus on detecting these random spammers. Meanwhile, the spammers who utilize
non-random target selection strategies (e.g., the points at the bottom of Fig. 5.1) will
be discussed in Section 5.7.3.
# SMS messages sent (normalized)
# S
MS
mes
sage
s re
ceiv
ed (
norm
aliz
ed)
0 5a 10a 15a 20a
05a
10a
15a
20a
Figure 5.3: SMS sent vs. received.
5.4.2 Mobile User SMS Activities
Since many SMS spammers adopt random target selection strategies, mobile users
(within the same area code) have the same exposure to spam. In other words, given a

46
fixed (long enough) observation period, these mobile users are expected to receive an
equal amount of spam messages. In this section, we study the SMS activities of legiti-
mate mobile users and demonstrate that certain users can be used for detecting spam
activities.
We first obtain a general understanding on the volume of SMS activities from legit-
imate mobile users in the network. Fig. 5.3 shows the number of messages sent (x-axis)
and received (y-axis) by each user over a month4 . We observe that a majority of
users send and receive a similar amount of SMS messages and thereby form an approx-
imate diagonal line. However, there are mobile users who deviate from such a pattern
noticeably. For example, the points close to the x-axis represent users who send far
more SMS messages than the ones they receive. These users consist of senders who
own a large subscriber base, e.g., cellular providers, university emergency contact lines,
political campaign lines, etc. In contrast, we observe quite a few points that reside near
the y-axis. Investigation shows that they are phone numbers which receive periodic up-
dates (e.g., electricity readings) from machine-to-machine (M2M) devices through SMS
messages (see Section 5.5.2 for discussion of M2M devices).
Fig. 5.3 implies the different magnitude that mobile users engaged in SMS commu-
nication. To quantify the intensity of SMS activities from mobile users, we define (SMS)
activeness as the number of messages sent from a mobile user during the observation
period. Intuitively, for users who are less active, the spam messages tend to account
for a more dominant proportion of their overall SMS communication. We illustrate
this point in Fig. 5.4, where we bin all users based on their activeness (x-axis, in log
scale), and calculate the distribution of the proportion of spam messages out of all SMS
messages received by each user within each bin. Note that spam messages are identified
as the SMS messages originated from spam numbers contained in victim spam reports.
From Fig. 5.4, we observe an upward shift of spam message proportions as the activeness
decreases. Interestingly, we find quite a few numbers which have sent no more than 1
SMS message during the one month period. For a majority of these numbers, all the
messages they have received are spam (as indicated by the fact that most probability
mass is squeezed to a small region close to 1). This implies that these SMS inactive
4 We note that the constants used for normalization (denoted as a and b) vary across individualfigures.

47
0 1 2 3 4 5 6 7 8 9 10
0.0
0.2
0.4
0.6
0.8
1.0
# of SMS messages sent (log base 2)
Pct
. of r
ecei
ved
msg
s th
at a
re s
pam
Figure 5.4: Activeness vs. spam prop.
numbers are good indicators of spamming activities, i.e., SMS senders who communicate
with them are more likely to be spammers.
5.5 SMS Grey Phone Number Space
In order to utilize these SMS inactive numbers for spam detection, we want to first
answer the following questions. Why do these numbers have a low volume of SMS
activity? Is there an inexpensive way to identify a stable set of such numbers for
building the detection system? To answer these questions, we carry out an in-depth
analysis of SMS inactive users. We then define grey phone space and propose a method
for identifying the grey phone space using CDR records. In the end, we study properties
of grey phone space and show the potential of using it to detect spamming activities.
5.5.1 Investigating Service Plans
Cellular carriers often provide their customers with a rich set of features to build their
personal service plans. Users are free to choose the best combination of features to

48
balance their needs and the cost. For example, a frequent voice caller often opts in
an unlimited voice plan and a user who watches online videos a lot can choose a data
plan with a larger data cap. Therefore, service plans encode demographic properties
of the associated users. We hence study the correlations between different service plan
features and SMS activeness to understand these SMS inactive users.
More specifically, we extract all the service plans associated with the legitimate user
samples, which include features related to voice, data and SMS services. We calculate
the Pearson correlation coefficients of the SMS activeness and individual plan features
(treated as binary variables). The features are then ranked according to the correlation
values. We summarize the top 5 features that are positively and negatively correlated
with SMS activeness in Table 5.1.
Top 5 negatively correlated Top 5 positively correlatedText restricted Monthly unlimited voice/textVoice restricted Messaging unlimited
Text msg pay per use Rollover family planVoice/data prepaid Unlimited SMS/MMS
Large cap data plans Small cap data plans
Table 5.1: Corr. of activeness and plan features.
The top 5 features with negative correlations are in the first column of Table 5.1.
Many of these SMS inactive users are enrolled in the pay-per-use SMS plan, a com-
mon economical choice for users who rarely access SMS services. Interestingly, a large
number of SMS inactive users have restrictions on their voice/text plans and have been
simultaneously enrolled in large cap data plans. Such restrictions only apply for mobile
users with data only devices, such as tablets and laptop data cards, etc. In contrast, the
top 5 features with positive correlations are summarized in the second column. Most of
SMS active users have unlimited SMS plans, a favorable choice of frequent SMS com-
municators. Many of them have also enrolled in small cap data plans and unlimited
MMS plans, which are dedicated for smartphone users.
Though service plans demonstrate clear distinctions between SMS inactive and active
users, relying on service plans to identify SMS inactive users is not effective in practice
due to two reasons. First, service plans change frequently, especially when users upgrade
their devices. Second, query service plan information persistently during run time can
be very expensive. Fortunately, our analysis above also reveals that service plans are

49
strongly correlated with the device types, e.g., data only device users are less active
compared to smartphone users. Can we use device types as a proxy to identify SMS
inactive users instead? We shall explore such possibilities in the following section.
SMS towards data only devices. Like phones, laptops and other data only devices
are also equipped with SIM cards and hence, once connected to the network, are able
to receive SMS messages. We therefore can capture CDR records to these devices at
MSCs. However, manufacturers often restrict text usage on these devices by masking
the APIs related to SMS functions. Meanwhile, at the billing stage, text messages to
these data only devices (with a text restricted plan) are not charged by the carrier.
There are exceptions such as laptops enrolled in regular text messaging plans, however,
such cases are rare based on our observations.
5.5.2 Identifying Grey Phone Space
The device associated with each phone number can be found in the CDR data based on
the first eight-digit TAC of the IMEI. We use the most updated TAC to device mapping
from the UMTS carrier in January 2013 and have identified 27 mobile device types
(defined by the carrier) which we summarize in Table 5.2. We note that finer grained
analysis at individual device level is also feasible. However, we find that, except for
the vehicle tracking devices which we shall see soon, devices within each category have
strong similarity in their SMS activeness distributions. Hence we gain little by defining
grey numbers at the device level.
Type ExamplesData-only
Laptop data cards, tablets, netbooks,eReaders, 3G data modems, etc.
M2M Security alarms, telematics, vehicletracking devices, point-of-sale termi-nals, medical devices, etc.
Phone Smartphones, feature phones, quickmessaging phones, PDAs, etc.
Table 5.2: Device categories and examples.
Fig. 5.5 shows the CDF distributions of SMS activeness of phone numbers associated
with different device types. We observe three clusters of CDF curves. The first one
consists of curves concentrating at the top-left corner, representing devices with very low

50
SMS activeness. This cluster covers all data only devices and a majority of machine-to-
machine devices (see [63] for more discussions of M2M devices). The second cluster lies
in the middle of the plot, which includes all phone devices. The third cluster contains
only one M2M device type, which covers all vehicle tracking devices. Interestingly,
the curve of such devices shows a bi-modal shape, where some devices communicate
frequently using SMS while other devices mainly stay inactive. Based on Fig. 5.5, we
define grey numbers as the ones that are associated with devices in the first cluster, i.e.,
data only devices and M2M devices excluding the vehicle tracking device category. The
collection of all grey number are referred to as the grey phone space. The grey numbers
are representatives of a subset of SMS inactive users5 . Meanwhile, the grey phone
space defined in this way is stable because it is tied to mobile devices instead of specific
phone numbers, whose behaviors can change over time (e.g., when a user upgrades the
device). Furthermore, grey numbers can be identified directly based on the IMEIs in
the CDR data with little cost, as opposed to querying and maintaining service plan
information for individual users.
5.5.3 Characterizing Grey Phone Space
We next study the distribution of grey numbers and show how grey phone space can
help us detect spamming activities.
Fig. 5.6 shows the size of each area code in the phone space (the x-axis, in terms
of the number of active phone numbers) and the proportion of grey phone numbers out
of all active phone numbers in that area code (the y-axis). The correlation coefficient
of two dimensions is close to 0, indicating that grey numbers exist in both densely and
sparsely populated areas. The wide distribution of grey numbers ensures a better chance
of detecting spam numbers equipped with random spamming strategies. To illustrate
this point, we calculate the proportion of grey numbers out of all the numbers accessed
by spam numbers (red solid curve) and legitimate users (blue dotted curve). We observe
5 We use devices in the first cluster as our definitions of grey space, however, as we have seen inFig. 5.5, even within the grey number categories there are still (a very few) numbers that are highlyactive in SMS communication. The proposed beta-binomial classification model (discussed in detail inSection 5.6) will take into account this fact. Intuitively, the model detects a spam number only when itis observed to have significant interaction with the grey space. Given a majority of the grey numbersthat are SMS inactive, the chance that a phone number is misclassified as a spam number due to itsinteraction with these outliers in the grey space is very small.

51
Activeness (# of msgs sent (log and normalized))
CD
F
1 100a 10000a
0.0
0.2
0.4
0.6
0.8
1.0
PhoneM2MData only
PhoneM2MData only
PhoneM2MData only
PhoneM2MData only
PhoneM2MData only
PhoneM2MData only
PhoneM2MData only
PhoneM2MData only
PhoneM2MData only
PhoneM2MData only
PhoneM2MData only
PhoneM2MData only
PhoneM2MData only
PhoneM2MData only
PhoneM2MData only
PhoneM2MData only
PhoneM2MData only
PhoneM2MData only
PhoneM2MData only
PhoneM2MData only
PhoneM2MData only
PhoneM2MData only
PhoneM2MData only
PhoneM2MData only
Figure 5.5: Device activeness (log).
that a predominant portion of legitimate users never touch grey phone space. In fact,
less than 1% of the users have ever accessed grey numbers in the 1 month observation
period. In addition, we show the same distribution for legitimate users (who have sent
to at least 50 recipients in a month) conditioned on having touched at least one grey
number. Compared to the spam numbers which tend to access more grey numbers (red
solid curve), these legitimate users communicate with much fewer grey numbers. In
most cases, the access of grey numbers is triggered by users replying to spam numbers
who usually use M2M devices to launch spam.
5.5.4 Discussion: Greyspace vs. Darkspace
In addition to the grey phone space, the “dark” phone space (i.e., formed by unassigned
phone numbers) can also be a choice for detecting spam activities using the same tech-
nique proposed in this chapter. Analogous concepts of grey IP addresses and dark IP
addresses for detecting anomalous activities have been explored in [39, 37]. However,
unlike IP addresses which are often assigned to organizations in blocks (i.e., sharing the
same IP prefix), the phone number space is shared by different cellular service providers,

52
Number of active TNs (log and normalized)
Gre
y T
N p
erce
ntag
e (n
orm
aliz
ed)
a 5a 20a 50a
b2b
3b4b
Figure 5.6: Grey number distribution.
landline service providers and even (IP) TV providers. Even if some phone numbers
are assigned in blocks initially to a certain provider, the frequent phone number assign-
ment changes caused by new user subscription, old user termination, recycling of phone
numbers and phone number porting in/out between different providers will ultimately
result in the shared ownership of the phone number space as we have seen today. For
example, different cellular and landline providers can have phone numbers under the
same legitimate area code. It is difficult to tell which phone number belongs to which
provider without inquiring the right provider.
This poses significant challenges when we want to identify dark (unassigned) phone
numbers. As dark phone numbers can be anywhere in the phone number space (within
legitimate area codes) and can belong to any provider, it is rather difficult to determine
a dark number, at least from the perspective of a single provider. For instance, just
because a phone number is not assigned to any user/device belonging to a particular
provider, it does not necessarily mean that such a number is dark. In other words, accu-
rate detection of dark numbers requires the collaboration of all the owners of the phone
number space, which is an intractable task. Meanwhile, such dark number repository

53
needs to be updated frequently to reflect the changes of phone number assignments.
In comparison, grey numbers can be defined easily with respect to a particular
provider: these are phone numbers assigned to devices belonging to customers of that
provider where there are usually less SMS activities originated from these numbers
(devices). Meanwhile, whether a number is grey is readily available to us (based on the
existing the IMEI numbers inside CDR records) without any extra work.
5.6 System Design
In this section, we first present an overview of Greystar. We then introduce the detection
model and how we choose parameters for the model.
5.6.1 System Overview
The logic of Greystar is illustrated in Alg. 2, which runs periodically at a predefined
frequency. In our experiment, we run Greystar hourly. Greystar employs a time window
of W (e.g., W equals 24 hours in our studies). The footprint of each SMS originating
number s, e.g., the sets of grey and non-grey numbers accessed by s (denoted as Gs and
Ns, respectively), are identified from the CDR data within W . After that, a filtering
process is conducted which asserts two requirements on originating numbers to be clas-
sified, i.e., in the past 24 hours: i) the sender is active enough (which has sent messages
to no less than M = 50 recipients. Recall the high sending rates of known spam numbers
in Fig. 4.2); and ii) the sender has touched at least one grey number. These two criteria,
especially the second one, can help significantly reduce the candidates to be classified in
the follow-up step. In fact, we find that, on average, less than 0.1% of users send SMS
to grey numbers in each day. More importantly, these users cover a majority of active
SMS spammers in the network as we shall see in Section 5.7. As a consequence, this
filtering step can noticeably reduce the system load as well as potential false alarms.
Once a sender passes the filtering process, the function detect spamnbr is called to
classify the sender into either a spam number or a legitimate number based on Gs and
Ns associated with that sender. In this chapter, we propose a novel Beta-Binomial
model for building the classifier, which we explain in detail next.

54
Algorithm 2 Greystar algorithm.
1: Input: CDR records D from the past W = 24 hours, M=50;2: Output: Spam number candidates C;3: From D, extract all SMS senders Orig;4: for each s ∈ Orig do5: Extract the CDR records associated with s: Ds ⊂ D;6: From Ds, identify the grey numbers Gs and non-grey numbers Ns accessed by s;7: if |Gs| + |Ns| ≥ M and |Gs| > 0 then8: if detect spamnbr(Gs, Ns)=1 then9: C := C ∪ {s};
10: end if11: end if12: end for
5.6.2 Classifier Design
We assume a random SMS spammer selects spamming targets following a two-step
process. First, the spammer chooses a specific target phone number block. Second, the
spammer uniformly chooses target phone numbers from that block. Let θ denote the
density of grey numbers in the target block and X := {xi}, 1 ≤ i ≤ n be the sequence of
target phone numbers selected. Meanwhile, let k be the number of grey numbers in X.
The target selection process can then be formulated as the following generative process.
1. Choose a target block with grey number density θ;
2. Choose xi ∼ Bernoulli(θ), 1 ≤ i ≤ n;
We note that θ varies as a spammer chooses different phone number blocks. The
choice of phone number blocks is arbitrary. For example, A spammer can choose a
large phone block across multiple area codes or a small one consisting of only a fraction
of phone numbers within one area code. Therefore, θ itself can be considered as a
random variable. We assume θ follows a Beta distribution6 , i.e., θ ∼ Beta(α, β), with
6 In Bayesian inference, the Beta distribution is the conjugate prior probability distribution forthe Bernoulli and binomial distributions. Instead of using the Bernoulli model, we can model thesecond stage of the target selection process as sampling from a multinomial distribution correspondingto different device types. In this case, the conjugate prior distribution of the multinomial parametersis the Dirichlet distribution. However, our preliminary experiments show little performance gain fromapplying the more sophisticated model in comparison to the increased computation cost.

55
a probability density function as:
P (θ|α, β) =Γ(α + β)
Γ(α)Γ(β)θα(1 − θ)β,
where Γ is the gamma function. Therefore, the random variable k follows a Beta-
Binomial distribution:
P (k|n, α, β) =
(
n
k
)
Γ(k + α)Γ(n − k + β)
Γ(n + α + β)
Γ(α + β)
Γ(α)Γ(β)
The target selection process of legitimate users can be expressed using the same
process. Because legitimate users tend to communicate less with grey numbers, their
corresponding θ∗’s are usually much smaller. Let α∗ and β∗ be the parametrization
of the Beta distribution associated with θ∗. For a phone number that has accessed
n targets, out of which k are grey numbers, we classify it as a spam number (i.e.,
detect spamnbr returns 1) if
P (spammer|k, n)
P (legitimate|k, n)=
P (k|n, α, β)P (spammer)
P (k|n, α∗, β∗)P (legitimate)> 1,
where the first equation is derived using the Bayes theorem. It is equivalent to
P (k|n, α, β)
P (k|n, α∗, β∗)>
P (legitimate)
P (spammer)= η
In practice, it is usually unclear how many spammers are in the network, therefore, to
estimate η directly is challenging. We instead choose η through experiments.
5.6.3 Parameter Selection
There are five parameters to be estimated in the classifier, α, β, α∗, β∗ and η. We use
the data from January 2012 to determine these parameters. To obtain ground truth,
we submit to the fraud agents a list of all the SMS senders that i) have sent to more
than 50 recipients in a 24 hour time window; and ii) at least one of the recipients is grey
(recall the filtering criteria in Algorithm 2). Fraud agents carry out investigation on
these numbers for us and label spam numbers in the list. We then divide the January
data into two subsets, the first two weeks of data for fitting the Beta-binomial models
(i.e., to determine the first four parameters) and the rest of data is reserved for testing
the classifier to estimate η.

56
Prop. of grey numbers accessed (normalized)
Den
sity
0 5a 10a 15a
020
4060
8010
0Spam numberLegitimate number
Figure 5.7: Distr. of θ and θ∗.
Pct. of grey nbrs touched (log and normalized)
CD
F
a 5a 20a 100a 500a
0.0
0.2
0.4
0.6
0.8
1.0
Spam nbrUserUser|grey
Figure 5.8: Grey ratio.
In particular, using the training data set, we estimate the parameters for two Beta-
binomial models using maximum likelihood estimation. With the estimated parameters,
we illustrate the probability density function θ ∼ Beta(α, β) and θ∗ ∼ Beta(α∗, β∗) in
Fig. 5.7. The density functions agree with our previous observations in Fig. 5.8. The
mass of the probability function corresponding to the legitimate users concentrates
on a narrow region close to 0, implying that legitimate users communicate much less
with grey numbers than non-grey numbers. In contrast, the density associated with
spam numbers widely spreads out, indicating more grey numbers are touched by spam
numbers due to their random target selection strategies.
We evaluate the accuracy of the classifier given different choices of η on the test data
set and the Receiver Operating Characteristic (ROC) curve is displayed in Fig. 5.9. The
x-axis represents the false alarm rate (or the false positive rate) and the y-axis stands
for the true detection rate (or the true positive rate). From Fig. 5.9, with a certain η,
Greystar can detect more than 85% spam numbers without producing any false alarm.
We will choose this η value in the rest of our experiments7 .
7 Note that the exact parameter values used in Greystar are proprietary and we are not able torelease them in the thesis. We have also tested the choice of η using different partitioning of thetraining/test data. The η remains stable across experiments.

57
5.7 Greystar Evaluation
In this section, we conduct an extensive evaluation of Greystar using five months of
CDR data and compare it with the methods based on victim spam reports in terms of
accuracy, detection delay and the effectiveness in reducing spam traffic in the network.
0.0 0.2 0.4 0.6 0.8 1.0
0.0
0.2
0.4
0.6
0.8
1.0
False positive rate
True
pos
itive
rat
e
Figure 5.9: ROC curve (false positiverate vs. true positive rate.
Jan Feb Mar Apr May
Num
ber
of T
Ns
020
0040
0060
0080
0010
000
ConfirmedMissedAdditional
Figure 5.10: Accuracy evaluation (incomparison to victim spam reports).
5.7.1 Accuracy Evaluation
To estimate the accuracy and the false alarm rate, we again consult with the fraud
agents to check the numbers from Greystar detection results. False negatives (or missed
detections), on the other hand, are more difficult to identify. Given the huge number of
negative examples classified, we are unable to have all of them examined by the fraud
agents to identify all missed detections because of the high manual investigation cost.
As an alternative solution, we compare Greystar detection results with victim spam
reports to obtain a lower bound estimate of the missed detections.
More formally, let Sg denote the detection results from Greystar and Sc be the spam
numbers contained in the victim spam reports received during the same time period.
We define missed detections of Greystar as Sc − Sg. In addition, we define additional
detections of Greystar as Sg − Sc to measure the value brought by Greystar to the
existing spam defense solution. The monthly accuracy evaluation results are displayed

58
in Fig. 5.10.
The blue bars in Fig. 5.10 illustrate the spam numbers validated by fraud agents in
each month. Greystar is able to detect thousands of spam numbers per month. The
ascending trend of detected spam numbers coincides with the increase of victim spam
reports in the five-month observation window. This implies that Greystar is able to
keep up with the increase of spam activities. In addition to the large number of true
detections, Greystar is highly accurate given only two potential false alarms are identi-
fied by fraud agents in 5 months. Interestingly, these two numbers are associated with
tenured smartphone users who suddenly behave abnormally and initiate SMS messages
to many recipients whom they have never communicated with in the past. We suspect
these users have been infected by SMS spamming malware that launch spam campaigns
from the users’ devices without their consent. To identify SMS spamming malware and
hence removing such false alarms will be our future work.
In comparison to the victim spam reports, Greystar detects over 1000 addition
spam numbers that were not reported by spam victims while missing less than 500
monthly. Meanwhile, although a majority of the spam numbers detected by Greystar
are also reported by spam victims, Greystar can detect these numbers much faster than
methods based on victim reports, and consequently can suppress more spam messages
in the network. We illustrate this point in the next section.
5.7.2 Detection Speed and Benefits to Cellular Carriers
We note that, to reduce noise, cellular carriers often rely on multiple spam reports
(e.g., K reports) from different victims to confirm a spam number. We refer to such
a crowdsourcing method as the K+ algorithm. To evaluate the speed of Greystar, we
compare it with two versions of the K+ algorithms, namely, 1+ and 3+. Comparing
with 1+ supplies us with the lower bound of the time difference and comparison with
3+ illustrates the real benefit brought by Greystar to practical spam defense solutions.
More specifically, we measure how many hours Greystar detects a spam number ahead
of 1+ and 3+, respectively. Fig. 5.11 shows the CDF curves of the comparison results,
where we highlight the location on the x-axis corresponding to 24 hours with a green
vertical line. We observe that Greystar is much faster than K+ algorithms. For example,
Greystar is one day ahead of 1+ in 50% of the cases and is one day before 3+ in more

59
1 2 5 10 20 50 100 500
0.0
0.2
0.4
0.6
0.8
1.0
Delay (hours in log scale)
CD
F
Report 1+Report 3+
Figure 5.11: Detection speed compared to spam report based methods.
Time (hours) in a week
# sp
am m
sgs
(nor
mal
ized
)0
2a4a
6a8a
10a
12a
0 50 100 150
Total Report 1+ Greystar
Figure 5.12: Number of spam messages after restriction.
60
than 90% of the times.
We find that, on average, it takes less than 1.2 hours for Greystar to detect a spam
number after it starts spamming (i.e., starts sending messages to more than 50 victims in
an hour). The fast response time of Greystar is accredited to the much larger population
of grey numbers, from which Greystar can gather evidence to detect more spam numbers
more quickly. In addition, collecting evidence passively from grey numbers eliminates
the delay during the human reporting process (recall Fig. 4.4). Therefore, Greystar
is characterized with a much faster detection speed than the K+ algorithm. Such a
gain in the detection speed can lead to more successful reduction of spam traffic in the
network. We illustrate this point next.
For simplicity, we assume a spam number can be instantly restricted after being
detected. We run simulation on a one week dataset (the first week of January 2012)
and calculate the number of spam messages appearing in each hour assuming a par-
ticular spam detection algorithm is deployed exclusively in the network. The results
are illustrated in Fig. 5.12. The total spam messages are contributed by known spam
numbers observed in that week. We observe that Greystar can successfully suppress the
majority of spam messages. During peak hours when the total number of spam messages
exceeds 600K, only around 150K remains after Greystar is deployed. In other words,
Greystar leads to an overall reduction of 75% of spam messages during peak hours. In
comparison, 1+ only guarantees a spam reduction of 50% due to long detection delay.
We note that, due to the noise in the spam reports, cellular providers often employ K+
(K ≥ 3) instead of 1+ to avoid false alarms. In this case, the benefit from Greystar is
even more substantial.
5.7.3 Analysis of Missed Detections
In this section, we investigate the missed detections (false negatives) from Greystar,
i.e., the spam number candidates that were not detected by Greystar but have been
reported by spam victims. There are around 500 such numbers in each month and
totally around 27K missed detections. We note that we focus only on a subset of the
candidates who are customers of the cellular network under study, for whom we have
access to a much richer set of information sources to carry out the investigation. We
believe the conclusions from analyzing this subset of candidates also apply for other

61
candidates outside the network.
We classify these candidates into three groups based on the volume of the associated
CDR records.
No volume. We do not observe any CDR record for 19.5% of the numbers. We inquiry
the SMS billing records for these numbers and find that many of them initiate a vast
amount of SMS traffic to foreign countries, such as Canada and Jamaica, etc., and hence
no CDR record has been collected to trigger Greystar detection.
Low volume. We find around 27% of the missed detections have accessed less than 50
recipients during the observation period. We study the text content inside the victim
spam reports to understand the root cause of these missed detections. The most popular
text content are party advertisements and promotions from local restaurants. Users
are likely to have registered with these merchants in the past and hence received ads
from them. For the rest of the numbers, we find many send out spam messages to
advertise mobile apps and premium SMS services. From the users’ comments posted
on online forums and social media sites [58, 52], we find two of the advertised apps are
messenger/dating apps which have issues with their default personal settings. Without
manual correction, these apps, once initiated, will send out friend requests to a few
random users of the apps. Spam messages from the remaining numbers are also likely
to be sent out without users’ consent, especially the ones that broadcast premium SMS
services. We suspect they are caused by apps abusing permissions or even behaviors of
malware apps. For example, one app advertised by spam is reported to contain malware
that sent SMS text to the contact list on the infected device, where the text contains a
URL for downloading that malware.
High volume. The rest of the phone numbers send SMS to a large number of recipients.
From the reported spam text, we find 7.1% of them belong to legitimate advertiser who
broadcast to registerred customers and are somehow reported by the recipients. For
the rest of numbers, we find their spam topics are quite different from those of the
detected ones. In particular, 11% of these numbers are associated with adult sites
or hotlines, in comparison to only 0.06% among the detected numbers. Meanwhile,
17.6% of them advertise local shopping deals, as opposed to only 2.1% among the
detected ones. Such difference suggests that these spam victims somehow gave out their

62
phone numbers to spammers, e.g., while visiting malicious sites to register services or
to purchase products. In addition, we extract the voice call history associated with
these high volume candidates. Interestingly, we find that about 4% of these numbers
have initiated phone calls to many terminating numbers in the past. We suspect that
these spammers employ auto-dialers to harvest active phone numbers (i.e., the ones that
have answered the calls) from the phone number space. With the list of active phone
numbers, spammers can send spam more effectively and avoid detection in the mean
time.
Admittedly, there are spam numbers in these three categories that are missed by
Greystar because they are equipped with a target number list obtained through auto-
dialing or social engineering techniques (for example, accurate target lists can potentially
be obtained by applying techniques discussed in [18]). SMS traffic from these users is
not differentiable from that of the legitimate users. However, we emphasize that these
missed detections only account for less than 9% of all the spam numbers detected and
they will not have a significant impact on the efficacy of Greystar for reducing the overall
spam traffic. In fact, we find that, on average, the missed detections sent 37% less spam
messages in comparison to the spam numbers detected by Greystar. On the other hand,
we do see the needs of combining Greystar and other methods to build a more robust
defense solution. For example, many malicious activities can be better detected by
correlating different channels (e.g., voice, SMS and data). Meanwhile, cellular carriers
can collaborate with mobile marketplace to detect and control suspicious apps that can
potentially initiate spam.
5.8 Summary
In this chapter, we presented the design of Greystar, an innovative system for fast
and accurate detection of SMS spam numbers. Greystar monitors a set of grey phone
numbers, which signify impending spam activities targeting a large number of mobile
users, and employs an advanced statistical model for detecting spam numbers according
to their interactions with grey phone numbers. Using five months of SMS call detail
records collected from a large cellular network in the US, we conducted extensive eval-
uation of Greystar in terms of the detection accuracy and speed, and demonstrated the

63
great potential of Greystar for reducing SMS spam traffic in the network.

Chapter 6
Voice Graph
6.1 Introduction
In the previous Chapters, we have studied extensively SMS spam and proposed ef-
fectively defenses to reduce the adverse impact of SMS spammers. In this Chapter,
we study another major threat to mobile users through voice channels – voice fraud,
especially when international phone numbers are involved.
Using voice call records collected over a two year period in one of the largest cellular
networks in the US, the goal of our study is two-fold: 1) to develop an effective approach
to proactively isolate dominant fraud calls from a myriad of legitimate calls; 2) and to
conduct a systematic analysis of the unique characteristics and trends of fraud activities
in cellular networks, e.g., techniques for soliciting fraud calls and social engineering.
Achieving these goals can provide a means of alerting customers and cellular providers
of potential fraud threats to avoid financial loss for both parties, and ultimately improve
customers’ satisfaction. Moreover, understanding different fraud activities can help gain
useful insights in developing better hardware/software architecture for preventing future
fraud activities.
we advance the notion of voice call graphs for representing the call records. A voice
call graph is a bi-partite graph, where two independent sets of nodes represent the groups
of domestic originating numbers and foreign terminating numbers, respectively, and the
edges stand for phone calls between these originating numbers and terminating numbers.
By visualizing small scale voice graphs and characterizing large scale voice graphs with
64

65
classic graph statistics, we find that fraud numbers and victims often exhibit very strong
correlation, which results in community structures in the voice call graph. Therefore,
the task of isolating fraud calls can be formulated as the problem of extracting dominant
community structures from voice graphs. This serves as our basic heuristic for detecting
voice-related fraud. Based on this heuristic, we propose a Markov Clustering (MCL)
based algorithm to decompose voice call graphs in an iterative manner, which produces
millions of disconnected subgraphs on a month-long voice graph. We further rely on
the strength of community structures (measured by the number of cliques) and their
popularity (measured by the number of callers) as a gauge to isolate fraud activities
from these subgraphs.
We validate the proposed detection algorithm using two sources of ground truth: 1)
a list of phone numbers that are reported by mobile users to the cellular service provider,
which are then manually verified by fraud agents to be involved in international revenue
sharing fraud (IRSF); 2) online reports from mobile users that are posted on forums,
blogs or social media sites. By matching our detection results against the ground truth,
we find that the proposed algorithm is able to isolate from millions of terminating
numbers the most dominant IRSF fraud numbers.
Based on our detection results, we conduct extensive analysis of fraud activities in
cellular networks. Our analysis unveils two major types of fraud: 1) IRSF fraud which
brings direct revenue to the fraudsters through victims placing calls to premium rate
international numbers; and 2) scams that rely on social engineering to defraud victims.
For both types of fraud, we observe interesting characteristics that are unique to cellular
networks.
The remainder of this Chapter is organized as follows. The datasets studied are
introduced in Section 6.2. In Section 6.3, we formally define voice call graphs and
motivate the heuristics for fraud detection. We then propose a MCL based algorithm in
Section 6.4 to decompose voice call graphs and isolate fraud related subgraphs. Using
ground truth from two sources, we evaluate the detection results in Section 6.5 and
conduct systematic analysis of detected fraud activities in Section 6.6. Section 6.7
concludes the Chapter.

66
6.2 Datasets
In this section, we discuss the datasets and ground truth used in our fraud analysis.
We use datasets consisting of a complete set of international voice calls collected at
the MSCs of the UMTS network under study. Theses phone calls are initiated by
mobile users in the cellular network (i.e., domestic users) to international terminating
numbers. We emphasize here that no customer private information is used in our
analysis and we have anonymized all customer identities (domestic originating numbers).
In particular, the anonymization process keeps the area code intact and only anonymizes
the remaining 7 digits in the originating numbers. More importantly, the distance
between two originating numbers1 is also preserved after anonymization. In addition to
protecting users’ privacy, this type of anonymization enables us to study the relationship
among phone numbers that participate in the same fraud activities. Similarly, to adhere
to the confidentiality under which we have access to the data, in places, we only present
normalized views of our results while retaining the scientifically relevant magnitudes.
6.2.1 Obtaining Ground Truth
To evaluate the efficacy of the proposed fraud detection algorithm and to understand
different fraud activities, we utilize two sources of user reports as our ground truth.
IRSF list: This list contains phone numbers associated with international revenue
share fraud activities. In the scenarios of IRSF, an international revenue share provider
designates a set of numbers as premium rate service (PRS) numbers, which are often
priced much higher than normal calls terminating to the same foreign country2 . The
profit generated from calls to these PRS numbers are shared by the revenue share
provider and the content provider. By serving as the content provider and attracting
victims to call these PRS numbers, the attackers gain direct revenue from these IRSF
calls. Cellular service providers are directly impacted by IRSF fraud because they will
suffer from monetary loss when their customers refuse to pay for the cost due to IRSF
calls. The IRSF list in our study is created from customer reports to the care center
of a large cellular service provider regarding suspicious IRSF activities observed from
1 We treat two phone numbers oni, onj as two integers, and the distance between them defined as|oni − onj |.
2 In a few countries, revenue sharing numbers can have similar rates as regular calls.

67
their monthly bill statements. Manual validation then follows up by placing phone
calls to the reported IRSF candidates before adding these numbers to the list. If such
numbers are of premium rates, provider-specific strategies will be applied to prevent
future customers’ calls to these numbers. Some agents may even check the numbers
that are adjacent to the reported numbers to see if they are also premium-rate. Even
though these numbers may not be involved in any reported fraud activities so far, they
can be acquired by fraudsters in future. We refer to the phone numbers identified in
this way as premium rate number ranges in the rest of this Chapter.
Online feedback: This list contains phone numbers regarding which we have found
customer complaints posted on forums, blogs and other online media sites, such as [64,
52], through popular search engines. This data source covers a wide variety of fraud
activities, such as voice calls related to scams and malware, etc. We note that a small
fraction of the IRSF numbers identified from the online feedback overlap with the IRSF
list. However, there are also many IRSF numbers which are not covered by the IRSF
list, possibly because no one has complained about them yet. In addition, to understand
different fraud activities and their associated social engineering techniques, we assign
labels to the fraud numbers by distilling and summarizing keywords from user comments
describing these numbers (see Section 6.6.3).
We note that since there is no guarantee that users will report all fraud activities
they encounter, not to mention that many users lack the knowledge to identify fraud
activities, these two data sources only cover a subset of all fraud activities in the network.
Moreover, there is often a lag between fraud activities and user feedback. For example,
users may only start to notice the IRSF activity when they observe unexpected charges
on their monthly bills. As we shall see in Section 6.5.2, such a lag can last weeks to even
months, rendering much less effective the widely used reactive fraud detection method
based on user feedback.
6.3 Voice Call Graphs
In this section, we advance the notion of voice call graphs as a means to represent the
communication patterns exhibited in the mobile voice channel. After characterizing
voice graphs constructed from different time spans, we propose our key heuristic in

68
identifying fraud activities.
6.3.1 Definition of Voice Call Graphs
In this Chapter, we only study a single direction of phone calls, i.e., the outbound phone
calls placed by domestic phone numbers to international numbers. This choice not only
helps reduce the volume of the data, but also enables us to observe both fraud calls
initiated by domestic numbers and returned calls solicited by incoming fraud calls (e.g.,
random scanning, see Section 6.6).
In our dataset, each voice record contains the domestic originating number and the
targeted international terminating number (note that we drop the terms “domestic” and
“international” in the rest of the Chapter for simplicity). By depicting each record as
an edge, all voice records can be readily captured by a bi-partite graph, which we refer
to as a voice call graph, or a voice graph in short. Formally, we define a voice call graph
G := {{ON ,T N}, E}, where ON and T N stand for the set of originating numbers
and the set of terminating numbers appearing within the observation time window T ,
respectively. An edge eij is drawn between oni ∈ ON and tnj ∈ T N if at least one
voice call is made from oni to tnj within T . Note that since we only look at phone calls
on one direction (i.e., from domestic numbers to international numbers), we treat edges
as undirected3 .
6.3.2 Voice Call Graph Properties
Fig. 6.1 shows a call graph plotted using the Graphviz tool [65], which represents voice
calls from 1,000 randomly sampled originating numbers in one single day, where the
blue/red nodes represent originating/terminating numbers, respectively. At a glance,
the voice graph in Fig. 6.1 is extremely sparse and contains a large number of discon-
nected components (subgraphs), with a majority of the subgraphs containing only one
single edge. For those subgraphs with more than one edge, most of them exhibit a star
structure centered on originating numbers, representing one originating number placing
phone calls to a few terminating numbers. In comparison, most terminating numbers
only have degree 1. As we extend the observation time period and the originating
3 The definition of voice call graphs can be easily extended to weighted graphs or directed graphs.For instance, the weight on an edge represents the number of calls associated with each edge.

69
Figure 6.1: A voice graph from 1,000 randomly sampled originating numbers.
number population, the voice graph grows significantly and renders direct visualization
inapplicable. Instead, we characterize larger voice graphs using popular graph statis-
tics. Fig. 6.2[a] shows the log-log plot of the node degree distribution in a one-day voice
graph. We observe that the degrees of both the originating numbers and terminating
numbers display a power-law shape. The power-law shape of the originating numbers
implies that a majority of domestic customers rarely call foreign numbers from their
cell phones. In addition, the power-law shape of the terminating numbers indicates
that, except for a few very popular terminating numbers (on the low end of the curve)
associated with hotlines of popular hotels and resorts or foreign agencies like embassies,
etc., most terminating numbers receive calls from a very small number of originating
numbers.
Similarly to what we observed in Fig. 6.1, originating numbers tend to have a higher
degree than terminating numbers. The low popularity of terminating numbers also
reflects the lack of correlation among originating numbers. This is not surprising, due to
the much larger space of foreign terminating numbers, in general, two mobile customers
are unlikely to call the same international number(s). Therefore, voice graphs often

70
10
−5
10−4
10−3
10−2
10−1
100
Node degree (log scale)
1 −
CD
F
orig. numberterm. number
(a) Node degrees in a one-daygraph
0 5 10 15 20 25 300
0.5
1
1.5
2
2.5
3
3.5x 10
6
Time (days)
Num
ber
of d
isco
nnec
ted
subg
raph
s
(b) Number of subgraphs overtime
100
101
102
103
10−5
10−4
10−3
10−2
10−1
100
Subgraph size (# of edges in log scale)
1 −
CD
F
1 day1 week1 month
(c) Subgraph size distribution
Figure 6.2: Voice call graph properties.
consist of a large number of small disconnected subgraphs. Fig. 6.2[b] shows the increase
in the number of subgraphs over time, which ranges from 0.3 million in a one-day graph
to more than 3 million in a one-month graph. The growth is sublinear, plausibly due to
the expansion of a giant connected component, which we will discuss in section 6.3.4.
In addition, Fig. 6.2[c] demonstrates the distribution of the sizes of subgraphs from
voice graphs spanning different time periods (in terms of the number of edges within
each subgraph). The subgraph sizes display again a power-law shape, indicating the
dominance of small subgraphs in voice graphs. The same observation holds for the
voice graphs from one day, one week, and one month data, though we do observe that
the number of subgraphs grows during a longer observation period. The extremely low
connectivity in a voice graph distinguishes it from other types of widely studied graphs,
such as network traffic activity graphs [48] and online social network graphs [66], which
often exhibit much stronger connectivity and correlations among nodes.
We note that, since the objective of this Chapter is to identify and analyze fraud
activities in cellular networks, we want to identify as many fraud activities as possible.
As we shall see in Section 6.6.4, fraud activities can take days to become noticeable. To
cover such cases, we need to extend our observation period. Therefore, in the rest of this
Chapter, by default we choose one month as the observation window for constructing
voice graphs.

71
6.3.3 Heuristic for Detecting Voice-related Fraud
Based on our analysis of voice graphs, we propose our heuristic for detecting fraud
activities from these graphs. We utilize two properties of voice graphs. First, in com-
parison to most legitimate terminating numbers that have low degrees, fraudsters intend
to attract more victims to call fraud numbers and hence fraud numbers often appear
to be much more popular (also referred to as heavy hitters). We note that detecting
heavy hitters is a common approach used for identifying anomalous activities [67, 68].
However, the popularity of terminating numbers alone is not enough in this scenario.
We find that the most popular terminating numbers are associated with hotel hotlines,
traveling agencies, embassies, and so on. In comparison, as we shall see in Section 6.5,
the most popular fraud activities only attract hundreds of victims during a month-
long period, which are not among the top high degree terminating numbers. We need
additional features to help identify fraud numbers.
The second property we utilize is the low connectivity of voice graphs. Based on our
experience, fraudsters often employ several foreign numbers to increase the chance of
reaching victims and to avoid detection and regulation. As we shall see in Section 6.6,
these numbers can even come from different countries. Therefore, we are alerted with a
potential fraud activity while observing many domestic users start placing phone calls
to the same set of foreign numbers. The communication patterns exhibiting the above
two properties are often referred to as community structures in voice call graphs, where
a set of originating numbers place phone calls to a set of terminating numbers. This
serves as our key heuristic for detecting voice fraud in cellular networks.
Based on this heuristic, we formulate the fraud detection problem as finding the
community structures from voice graphs4 . We note that a community structure can
also originate to legitimate activities, for example, due to tourists calling hotlines in
a popular resort or companies communicating with foreign branches. However, as we
shall see in Section 6.5, this heuristic can help successfully isolate a large number of
popular fraud activities from millions of phone calls. In addition, we shall discuss in
Section 6.6 that certain types of fraud activities can be detected in a more accurate way
4 We have also explored other call features such as call duration and call time. However, none ofthem exhibit significant difference between fraud numbers and legitimate numbers. In future work, wewill investigate other features like user calling history to improve detection accuracy.

72
by investigating properties of the community structures.
0 5 10 15 20 25 300
0.05
0.1
0.15
0.2
0.25
0.3
0.35
Time (days)
Fra
ctio
n co
vere
d by
GC
C
orig.term.edge
Figure 6.3: Evolution of GCC’s in voice call graphs spanning different time intervals.
6.3.4 Challenges
Identifying all community structures is still a challenging task. This is mainly due
to the appearance of random edges or weak connections which connect different com-
munities, thereby forming large subgraphs mixed with different fraud activities. For
example, Fig. 6.3 shows the evolution of the largest subgraph (a.k.a. giant connected
component or GCC) in the voice call graph over a month-long time period. In Fig. 6.3,
three curves display the coverage of GCC at a particular time in terms of originating
numbers, terminating numbers and edges, respectively. We observe the GCC becomes
significant from 10 days onwards and covers up to 25% edges in a 30-day voice graph.
Since the voice graphs used in this Chapter are constructed using month-long data, with
such a long observation period, the GCC and other large subgraphs can grow to thou-
sands or millions of edges. To separate different fraud activities within GCC and other
large subgraphs, it is necessary to decompose them first. Therefore, we next propose a
Markov clustering based method for decomposing large subgraphs and then identifying
community structures from the decomposition results.

73
6.4 A Markov Clustering based Fraud Detection Algo-
rithm
In this section, we propose a Markov Clustering (MCL) [69] based algorithm for decom-
posing voice graphs and identifying potential fraud activities.
6.4.1 Decomposing Voice Graphs using MCL
Alg. 3 shows the proposed algorithm, where we iteratively apply the MCL algorithm
to large subgraphs which contain more than N edges (N = 2, 000). For subgraphs
with fewer than 2K edges, we can extract community structures with little cost (see
Section 6.4.2).
Algorithm 3 Decomposing voice call graphs with MCL.
1: Input: G, N = 2, 000, β = 2;2: Extract disconnected subgraphs G := {Gi} from G, where ON = ∪iON i, T N = ∪iT N i
and E = ∪iEi;3: for each Gi ∈ G do4: if Ei > N then5: Construct symmetric adjacency matrix A from Gi;6: repeat7: Normalize rows in A;8: A := A2; //expansion
9: aij := aβij , for all entries in A;//inflation
10: until A converges11: Extract disconnected subgraphs GA from A;12: G = G ∪ GA − {Gi};13: end if14: end for
Introduction to MCL algorithm. The MCL algorithm is developed for graph par-
titioning, which is based on the assumption that random walks tend to stay within the
same cluster for a longer time rather than traversing across clusters. MCL iterates two
processes: expansion and inflation (line 8 and 9 in Algorithm 3). Expansion takes the
power of the Markovian matrix using regular matrix product. For instance, taking the
square of the matrix will compute random walks of length two. Since higher length
paths are more common within clusters than between different clusters, expansion will
increase the probabilities of intra-cluster walks. Inflation is the element-wise power to

74
β followed by a diagonal scaling (to make the resulting matrix Markovian). Inflation
changes the probabilities associated with the collection of random walks departing from
one particular edge by favoring more probable walks. MCL terminates when the two
processes converge. Cluster memberships can be identified by extracting connected
components from the MCL result. We select MCL to decompose voice graphs for two
reasons. First, in MCL, we do not need to specify the expected number of clusters.
Second, MCL can scale up to large graphs consisting of millions of edges.
The standard MCL algorithm only takes regular (non bi-partite) undirected graphs
as input. However, voice call graphs are bi-partite undirected graphs. Therefore, for
each subgraph up to decomposition, before feeding it to MCL, we need to create its
corresponding non bi-partite version. For example, let Aasym be the adjacency matrix
corresponding to a voice graph G, we construct a symmetric adjacency matrix A from
Aasym as follows:
A =
(
0 Aasym
ATasym 0
)
The MCL algorithm then operates on A and finally decomposes G into a series of
subgraphs after iterating the expansion and inflation steps. We have tested different
selections of β and β = 2 yields the most stable and interpretable results, which is the
default parameter setting that we use throughout this Chapter. By the end of the algo-
rithm, all voice graphs larger than N will be decomposed and the remaining subgraphs
are of less than N edges. We next isolate fraud activities from these subgraphs.
6.4.2 Isolating Fraud Activities
Recall that we have formulated the task of detecting fraud activities as the problem
of identifying dense community structures in call (sub)graphs. In a bipartite graph,
we refer to the atomic community structure as a clique, which represents the small-
est complete (2-by-2 bi-partite) subgraph in the original graph. Fig. 6.4[a] shows the
structure of a clique, which contains four edges, connecting two originating numbers
and two terminating numbers. The total number of cliques varies across different voice
graphs. For example, Fig. 6.4[b-d] shows three voice graphs corresponding to three
different types of fraud activities identified using the proposed method (Please refer to

75
(a) A clique. (b) Win mobile malware(11 orig. nbrs, 4 term. nbrs,177 cliques)
(c) Random scanning (126orig. nbrs, 18 term. nbrs,74 cliques)
(d) Email scam (40 orig.nbrs, 38 term. nbrs, 16cliques)
Figure 6.4: Voice graphs of a single clique and three different fraud activities.
Section 6.6 for detailed descriptions and analysis of these fraud activities). Fig. 6.4[d]
exhibits a much denser community structure, and, as a consequence, is characterized
by a large number of cliques5 . In other words, the number of cliques serves as an
indicator of the significance of the community structure in a subgraph. Therefore, in
this Chapter, we only consider subgraphs with at least one clique as the candidates for
fraud activities. After this filtering step, we isolate approximately 30K candidates from
millions of call subgraphs every month. For the rest of the subgraphs which contain no
clique, the originating numbers show little correlation and hence our heuristic does not
apply. In Section 6.5.1, we will discuss those fraud activities that fall into subgraphs
without any clique.
After filtering out subgraphs without cliques, we further reduce the number of candi-
dates for investigation based on the graph properties. Based on the heuristic presented
in Section 6.3.3, we differentiate subgraphs representing fraud activities from legitimate
ones through two features: the popularity of terminating numbers (in terms of the
number of originating numbers forming the community structure) and the connectivity
of the community structure (in terms of the number of cliques in the subgraph). By
matching the first month data against two sources of ground truth, Fig. 6.5 displays how
5 In fact, the community structure in Fig. 6.4[b] is formed by the return calls in response to threefraud numbers sequentially pinging the same set of victims. The community structure is not significantsince victims may not necessarily respond to the same fraud numbers. In Fig. 6.4[c], the fraudsteradvertised fraud numbers through emails and the loose community structure is due to victims callingmultiple fraud numbers. In comparison, Fig. 6.4[d] shows the fraud activity caused by a malware. Avictim is programmed to call all the fraud numbers coded in the malware, and thereby showing a verystrong community structure.

76
the detection rate changes while we tune these two parameters. In Fig. 6.5, the x-axis
represents the percentile of subgraphs extracted after we change each of the parameters,
and the y-axis stands for the proportion of fraud activities that are not covered by the
x percentile of subgraphs. We observe in Fig. 6.5 that 1) the top 5% subgraphs with
no less than 5 cliques account for more than 90% of fraud activities; 2) the top 20%
subgraphs with no less than 10 originating numbers also cover around 90% of fraud
activities. These observations also validate our heuristic that fraud numbers are often
associated with a higher popularity and fraud activities tend to exhibit dense commu-
nity structures in their corresponding subgraphs. We note that in practice, we prefer to
choose higher values for these two parameters. Though this limits the number of fraud
activities identified, it can help reduce the workload of manual investigation by elimi-
nating many false alarms. However, since one of our main objectives in this Chapter
is to understand the diversity of voice fraud activities in cellular networks, we want to
include as many fraud activities as possible. Therefore, in the rest of this Chapter we
choose 5 cliques and 10 originating numbers as the thresholds, i.e., only subgraphs with
at least 5 cliques and 10 originating numbers will be considered as containing potential
fraud activities. Investigation based on the ground truth shows that such thresholds are
able to help filter out 98% of these subgraphs, while still capturing more than 90% of
the fraud activities.
We note that a limitation of the proposed algorithm is that it relies on strong com-
munity structures in voice call graphs to detect fraud activities. Therefore, fraudsters
can potentially evade detection by eliminating the correlation among fraud numbers,
e.g., by employing only one fraud number or by defrauding a different subset of victims
with each individual fraud number. The proposed algorithm also fails to detect stealthy
fraud activities that attract less than 10 victims in a month. However, as we shall see in
Section 6.5.1, both strategies are not dominant and are only adopted in less than 10% of
the observed fraud cases. Moreover, these strategies limit the impact of fraud activities
and hence they attract far fewer victims than other fraud activities that employ multiple
correlated phone numbers.
In the remainder of this Chapter, for each remaining subgraph, we call the termi-
nating numbers within cliques potential fraud numbers. The originating numbers that
phone these fraud numbers are referred to as victims and the associated calls are called

77
0 20 40 60 80 1000
0.2
0.4
0.6
0.8
1
Percentile
Pro
port
ion
of u
ncov
ered
frau
d ac
tiviti
es # orig. numbers# cliques
# clique = 5 (95 pctl.)
# orig. nbr = 10 (80 pctl.)
# clique = 5 (95 pctl.)
# orig. nbr = 10 (80 pctl.)
Figure 6.5: Determining thresholds for identifying suspicious clusters.
fraud calls. Fraud numbers, victims, and fraud calls collectively form a fraud activity.
The remaining nodes and edges in the subgraph are omitted in our studies. Next, we
will evaluate our fraud detection results.
6.5 Evaluation
In this section, we compare the detection results against the ground truth. The evalua-
tion shows that proposed algorithm is able to detect most popular fraud activities and
our detection results are usually months ahead of user reports.
6.5.1 Evaluation on IRSF Fraud Detection
We run the proposed fraud detection algorithm on five months of data (Jan 2011 to
May 2011) Since there is usually an anticipated lag between the occurrence of fraud
activities and user reports to the carrier, we use the IRSF list that contains IRSF
numbers inserted between Jan 2011 and Oct 2011 by the service provider as the ground
truth6 . Moreover, in Section 6.6, we shall study the evolution of fraud activities using
two years of data to track their entire life cycle.
6 We also have access to the IRSF numbers inserted before Jan 2011. However, most of such numbersshow no activity in 2011. This is likely due to the specific strategies exercised by the carrier to preventusers from calling these numbers.

78
Our first evaluation focuses on detecting IRSF numbers. After decomposing the
monthly voice graphs from Jan 2011 to May 2011 and applying the filtering process,
we isolate around 24K fraud number candidates in total. Any of the 24K candidates
that are covered by the IRSF list is considered as a true detection (or a true positive).
On the contrary, we consider a missed detection when a phone number from the IRSF
list appears in the data but not among the 24K candidates. In addition, by searching
for feedback on the Internet, we identify a separate set of IRSF numbers outside the
IRSF list. Reports of these numbers are often associated with complaints regarding
high charges. We refer to this new IRSF number set as new detections. We note that
the above counting method only provides a lower bound on the detection performance,
since some IRSF numbers may be reported after Oct 2011 given the potential lag of
user reports (see Section 6.5.2).
To assess the severity and impact of fraud activities, we measure the number of
victims and fraud calls attracted by each fraud number. We note that the lifetime of a
fraud number determines the quantity of victims and fraud calls associated with that
number, which can be affected significantly by user reports. For example, after being
reported to the provider, the provider-specific strategies often restrict other users’ access
to the fraud number. The online user feedback can also prevent other users who read
the post from making fraud calls. Therefore, to ensure a fair comparison and to capture
the real impact of fraud activities, we count the number of victims and fraud calls of a
fraud number only within a 4-week time window prior to its first report time. For true
detections and missed detections, we consider the first report time as the time when the
fraud numbers were inserted into the IRSF list. For new detections, we treat the time
of the first online post regarding a fraud number as its first report time.
Table. 6.1 displays the detection results, in terms of the fraud numbers, victims
and fraud calls associated with three IRSF number sets. We observe that though the
detected and new fraud numbers only account for 11% of all the fraud numbers, together
they attract 85% of all the victims and are the root cause of 78% of fraud calls. Fig. 6.6
shows the distribution of the number of victims associated with each IRSF number
(note that the x-axis is in log scale). IRSF numbers belonging to the true detection and
new detection groups are highly popular and attract a large number of victims, with
mean values of 6 and 8, respectively. In comparison, most fraud numbers in the missed

79
detection category are only associated with a single victim. This is plausibly due to
two reasons. First, the high popularity of the detected IRSF numbers is actually due
to the emergence of new IRSF activities, which utilize malware, unlocked devices, and
online social media to draw attention from more victims and hence attract more fraud
calls (we shall present case studies of these new IRSF activities in Section 6.6). Second,
we find that a majority of the IRSF numbers (more than 90%) that our detection
algorithm missed actually belong to the premium rate number ranges. These premium
rate numbers were detected proactively by fraud agents exploring the adjacent numbers
of confirmed IRSF numbers. However, since no user report is found complaining about
these numbers, they may not yet be utilized for fraud activities or the fraudsters have
not yet advertised these numbers. In other words, these numbers are dormant IRSF
numbers in comparison to other active IRSF numbers reported by users. By excluding
these dormant IRSF numbers, our detection rate on active IRSF numbers can exceed
50%.
100
101
102
103
104
0
0.2
0.4
0.6
0.8
1
Number of victims
CD
F
DetectedMissedNew
Figure 6.6: Popularity of fraud num-bers.
−100 0 100 200 3000
0.2
0.4
0.6
0.8
1
Lag (days)
CD
F
Figure 6.7: Lag of user reportedIRSF numbers.
6.5.2 Evaluation on Early Fraud Detection
We have demonstrated that our algorithm can successfully isolate many highly popular
IRSF numbers. Taking prompt actions against these IRSF numbers can help both
customers and cellular service providers avoid significant financial loss. In fact, one
key advantage of our algorithm is the short response time to emerging fraud activities.
For the IRSF numbers in the true detection category, we measure the gap between the

80
detection time7 and the time that they first appear in the IRSF list, which we refer to
as the lag of user reports. A positive lag value means the detection time goes before the
user report time. We demonstrate the cumulative distribution function (CDF) plot of
the user report lag in Fig. 6.7. For more than 80% of the IRSF numbers, our detection
result precedes user reports and in more than 60% of the cases, we can detect the IRSF
numbers at least one month earlier than the user reports! Similar observations are
made for the other types of fraud. Early detection of these IRSF numbers provides the
cellular service provider with enough time to track and to take actions against these
fraud activities to prevent other customers from calling these numbers. On top of our
detection results, we are developing tools for alerting customers of potential fraud risk
through mobile apps and SMS messages.
Table 6.1: IRSF number detection result.Fraud nbrs. Victims Fraud calls
Detected 6.7% 66.9% 35.7%Missed 89.0% 14.6% 22.5%New 4.3% 18.5% 41.8%
6.5.3 Discussion
False positives. We argue that analyzing voice call graphs alone is not sufficient for
identifying fraud activities with high accuracy. By matching the 24K fraud number
candidates with the two sources of ground truth, we find that the proposed detection
algorithm yields a precision of 9.3%, i.e., around 9.3% out of 24K phone numbers are
associated with IRSF or other fraud activities. However, we believe that 9.3% only
serves as a precision lower bound. Given the observation of significant delay of user
reports in Section 6.5.2, we expect to see more numbers in our detection results to be
reported as fraud numbers by mobile users in future.
Practical usefulness. Despite the relatively large number of false positives, the pro-
posed algorithm still provides a valuable “first-line” defense in alerting users and cel-
lular providers of emerging fraud activities. After isolating from millions of voice calls
7 For IRSF numbers detected using data from one particular month, their detection time is definedas the first day in the following month, e.g., if an IRSF number is detected using the April data, itsdetection time is considered as May 1st.
81
a small number of fraud candidates using our method, cellular service providers can
allocate resources to track these suspicious numbers and combine with other expensive
data sources, like billing information and customer call history, to further confirm the
fraud activities. For example, we can investigate the billing records associated with
potential IRSF calls to look for exorbitant charges. IRSF numbers can also be con-
firmed by directly calling these numbers8 . We believe many of these methods can be
automated to reduce the manual cost, e.g., through automated query scripts or using
auto-dialing tools, to make post-investigation of our automatic detection results more
manageable. More importantly, our analysis using real voice call records shows that, by
proactively identifying and restricting potential IRSF numbers based on our detection
results, cellular service providers can benefit from a reduction of tens of thousands of
fraud calls per month, and subsequently a huge saving in customer care cost and an
implicit increase in customer satisfaction, which far outweighs the cost of investigating
the detection results.
Other fraud. We note that, unlike IRSF activities, we are unable to assess the detection
rate of other types of fraud, since we are not able to query all the numbers to find
corresponding user feedback (if any) through online search engines. However, as we
shall see in Section 6.6, our method has successfully identified many other types of voice
fraud, including emerging fraud cases committed through mobile devices, smartphone
apps and online social media sites. This enables us to gain a comprehensive view
of voice-related fraud in today’s large cellular networks. Understanding these fraud
activities, e.g., how are they committed (Section 6.6.2) and what are their popular social
engineering techniques (Section 6.6.3), can provide us with unique insights into how to
design securer software/hardware architectures to prevent future fraud activities.
6.6 Analysis of Fraud Activities
In this section, we present detailed analysis of the fraud numbers detected using the
proposed method.
8 Once accessing an IRSF number, the callers are often transferred to an interactive voice response,where they are kept on hold with background music, while their airtime is being used.

82
Table 6.2: Categorization of fraud activities.Revenue Channel Description Pct.(%) RS
IRSF (dir.)
Malware Malicious mobile apps with automated dialer to IRSFnumbers
13.2 ALL
RandomScanning
Pinging a range of phone numbers sequentially to so-licit return calls
3.3 1.37
Online Me-dia
Publishing IRSF numbers on blogs, forums and socialnetworks
2.5 1.20
UnlockedDevice
Unlocked devices are pre-configured with IRSF num-bers as SMS or MMS access points
2.5 0.53
DeviceExploit
Only certain brand and type of phones are involved 0.8 0.13
Scam (indir.)
Target Scam Calls users who fraudsters already have informationabout and attempt to collect more information, tosell products, or to defraud them of money, etc.
55.4 1.04
Online Me-dia
Post phone numbers online and cheat for money frompeople who call
10.7 1.44
Email Hack somebody’s email account, send phishing emailsto all the contacts
8.3 1.46
Malware Lock users’ PCs, force them to call certain numbersto remove the malware
3.3 1.01
6.6.1 Stability of Fraud Activities
Since we use whole month datasets for fraud detection, certain long lasting fraud activi-
ties that span several months can appear multiple times. In order to obtain an accurate
count of different fraud activities, we first need to remove these duplicated cases. Our
approach is as follows.
For any two detected fraud activities i and j, we calculate their similarity using the
Jaccard similarity coefficient, defined as J(i, j) := |FN i ∩ FN j|/|FN i ∪ FN j |, where
FN i represents the set of fraud numbers associated with fraud activity i. J(i, j) ranges
from 0 to 1, with J(i, j) = 1 indicating that two fraud activities are caused by the same
fraud numbers. For a fraud activity i, we find its most similar counterpart k from other
fraud activities, where k = argmaxjJ(i, j). We display the Jaccard similarity between
each fraud activity and its most similar counterpart in Fig. 6.8.
We observe that Fig. 6.8 displays a bi-modal shape, where a majority of the fraud
activities do not have a counterpart with a similar set of fraud numbers. Based on the
plot, we select 0.6 as the threshold and consider a fraud activity i is a duplicate if there
exists another activity j such that J(i, j) > 0.6.

83
0 0.2 0.4 0.6 0.8 10
10
20
30
40
50
Maximum terminating number similarity
Num
ber
of fr
aud
activ
ities
Figure 6.8: Stability of fraud activi-ties measured by term. numbers.
2 4 6 8Orig. nbr. closeness (log base 10)
Cou
nt
Figure 6.9: Closeness of originatingnumbers.
6.6.2 Categorization of Fraud Activities
After removing duplicated instances, we match the fraud number candidates from our
five months of detection results against the online user feedback to categorize differ-
ent types of fraud. In particular, we run queries for all fraud number candidates
through popular online search engines and extract user comments regarding these num-
bers based on the search results. Most comments are from online forums, such as
whocallsme.com[64] and 800notes.com[52], etc. We manually investigate all the com-
ments and identify different types of fraud activities based on the comments. We note
that when we compare user comments regarding different phone numbers within the
same fraud activity, we find consistency in terms of the user feedback describing these
fraud numbers. This confirms the validity of our detection result, where phone numbers
exhibiting strong correlation (e.g., appearing in the same subgraph) are employed for
conducting the same fraud activity. In addition, this observation enables us to categorize
voice fraud at the level of fraud activities instead of individual phone numbers.
We display the fraud categorization in Table 6.2. Based on whether the fraud ac-
tivities can bring immediate monetary gain to the fraudsters, we classify them into two
major categories: IRSF and Scam (column 1). Inside each major category, we further
group fraud activities into subcategories according to the channels through which dif-
ferent fraud activities are committed (column 2). In the third column of Table 6.2, we
present the details of each type of fraud activity. The dominance of each type of fraud
in terms of their proportion out of all fraud activities is shown in the fourth column. In

84
the fifth column, we display the relative significance (RS) of smartphone devices partic-
ipating in each type of fraud, which we shall define formally at the end of this section.
In the following, we discuss each fraud category in detail and present case studies.
20 40 60 80
20
40
60
80
100
120
140
Time (weeks)
Cum
ulat
ive
num
ber
of v
ictim
s
Term_A (11)
(a) Win mobile malware
10 20 30 40
1000
2000
3000
4000
5000
Time (weeks) C
umul
ativ
e nu
mbe
r of
vic
tims
Term_A (10)Term_B (12)
(b) Spoof call malware
10 20 30
2000
4000
6000
8000
Time (weeks)
Cum
ulat
ive
num
ber
of v
ictim
s
Term_A (11)
(c) Scam on Twitter
10 20 30
50
100
150
200
250
Time (weeks)
Cum
ulat
ive
num
ber
of v
ictim
s
Term_A (10)Term_B (10)Term_C (12)
(d) Voting scam
Figure 6.10: Cumulative number of victims attracted by different fraud activities.
IRSF. IRSF fraudsters devise various approaches to solicit users to make as many phone
calls as possible to the fraud numbers to maximize their profit. Though IRSF activities
are also common for landlines, we have discovered a number of IRSF activities unique
to cellular networks, including:
1) Malware. The most dominant IRSF case, accounting for 13.2% of all fraud activities,
is caused by malicious mobile apps. These mobile apps are designed to be able to initiate
users’ inadvertent phone calls to IRSF numbers. These IRSF numbers employed by the
malware can be either static or dynamic. In the former case, we find a malware disguised

85
as a gaming app on windows mobile devices (referred to as windows mobile malware),
which has four IRSF numbers hard coded. At night, the app launches many calls to these
IRSF numbers automatically. The corresponding voice graph corresponding is depicted
in Fig. 6.4[d], which shows a large number of cliques since the app automatically calls
all these 4 IRSF numbers.
In the latter case, we identify a series of apps (possibly with the same authorship)
which are claimed to be able to spoof the caller’s identity or changing the caller’s voice
(referred to as spoof call malware). However, when a user places a call (e.g., to a
domestic number), the call will first pass through an IRSF number (i.e., as a proxy)
before reaching the destination. More interestingly, we find that these apps are able to
communicate with a remote server to download new lists of IRSF numbers periodically.
Due to the employment of dynamic IRSF numbers, it is much harder to detect and
disable these apps.
In Fig. 6.10[a-b], we compare the IRSF numbers associated with these two types
of malware in terms of the number of victims attracted over time9 . The x-axis is
aligned to the first time when we observe the fraud number, and the y-axis represents
the cumulative number of victims over time. In addition, for each terminating number,
we display its length (i.e., number of digits) inside the parentheses.
Fig. 6.10[a] demonstrates an IRSF number employed by the Windows mobile mal-
ware. We observe that around 140 victims start calling the number within 2 weeks after
its debut. However, the number of new victims quickly vanishes after 6 weeks when
the malware is taken down from the online marketplace. In comparison, Fig. 6.10[b]
shows a similar plot for the spoof call malware. After the malware appears, we observe
a linear increase of victims to 50K in around 20 weeks. This is mainly because the
malware targets unlocked devices and is hosted by an unofficial website, which lacks a
formal process for identifying and removing malicious apps. Meanwhile, when Term A
became unavailable somehow at the 20th week, the fraudster acquired a new fraud
number Term B and remotely configured the malware to start calling this new number.
Therefore, we can see a continuous increase of victims associated with the new number
9 Because the curves corresponding to the fraud numbers of the same fraud activities in Fig. 6.10[a]and [c] look almost the same, we hence only show one example in each plot.

86
after 30 weeks, when Term A stopped acquiring new victims.
2) Random Scanning. In this scenario, fraudsters employ automated calling system to
ping a series of adjacent phone numbers and leave no message to attract users to call
back. This type of fraud activity can be distinguished by measuring the distance of the
originating numbers (recall our datasets contain only the outgoing calls).
In order to measure the relationship of originating numbers, we define the closeness
as mediani(minj |oni − onj|), where oni, onj ∈ ON . Essentially, closeness measures the
median distance of all originating numbers to their closest counterparts. Fig. 6.9 shows
the distribution of closeness of all subgraphs after filtering (note that the x-axis is in log
scale). We are able to identify successfully all such random scanning as the instances
with a closeness less than 100 (to the left of the x-axis).
3) Online Media IRSF. We find several cases where fraudsters post IRSF numbers
on popular online media, e.g., Facebook and Twitter, etc. For example, Fig. 6.10[c]
shows the increase of victims corresponding to an IRSF case advertised through Twitter.
Around the 12th week, the fraudster posted a tweet disclosing the contact numbers of
a famous Puerto Rican singer, which had been retweeted thousands of times within a
day. The advertising strategy is so successful that more than eight thousand victims
were drawn to make phone calls to these IRSF numbers on the same day. Fortunately,
these fraud calls soon disappeared on the following day when many tweets were posted
and retweeted shortly to alert other people of this fraud activity.
As another example, we identify a website that advertises IRSF numbers for a public
vote of popular scenic locations. Fig. 6.10[d] demonstrates the behaviors of the three
IRSF numbers associated with this fraud case. During their lifetime, Term A and Term B
steadily attracted new victims and number of victims was almost doubled close to the
end of the vote. In comparison, the Term C attracted many fewer victims, plausibly
because it has 12 digits instead of 10 digits, which makes it much easier to be identi-
fied as an international number (see Section 6.6.4 for the heteronym property of fraud
numbers).
4) Unlocked Device. Victims of this fraud activity are users of unlocked mobile devices.
Unlocked mobile devices are cell phones that are not tied to a specific carrier. The
advantage of purchasing such devices is that it offers the user more choices of voice/data
87
plans and ease of switch between carriers, especially when a user is traveling abroad.
There are many ways of acquiring an unlocked device. For example, after the contract
with the carrier ends, a user can ask the service provider for a code to unlock her
device. It is also possible to purchase unlocked devices through third party retailers.
We have identified fraud activities on unlocked devices purchased from online third party
retailers, where the fraudsters reconfigured the device and specified IRSF numbers as the
access points for Short Message Service (SMS) or Multimedia Messaging Service (MMS).
Consequently, sending SMS or MMS messages will trigger calls to IRSF numbers.
5) Device Exploit. This fraud activity only applies for one particular prepaid mobile
device. Users complain that they will lose all the remaining credits in their accounts
while making phone calls to these fraud numbers. We suspect this is caused by attackers
taking advantage of certain vulnerabilities of the device or the operating system. Strictly
speaking, this is not a regular IRSF case. However, since fraudsters are likely to gain
profit from such activities, we include it here for completeness.
Scam. Scam, sometimes referred to as phishing fraud, often involves two stages. At the
first stage, fraudsters solicit phone calls from mobile users. At the second stage, when
victims call the fraud numbers, fraudsters apply various social engineering techniques
to defraud victims of money or acquire private information from them. Scam includes:
1) Target Scam. This is the most common case which accounts for 55.4% of all fraud
activities. In this scenario, fraudsters target victims for whom they have certain private
information, e.g., their names, phone numbers, addresses, and medical prescription
details.
2) Online Media Scam. In this scenario, fraudsters post advertisements on online fo-
rums, e.g., craigslist. The advertisements are often about inexpensive house rentals and
real estate selling. Several phone numbers are often listed at the end of the posts to
entrap victims baited by a low price.
3) Email. In this case, fraudsters hack into personal email accounts and send emails to
the contact list disguised as the original account owners. In the email, fraudsters claim
an emergency in the foreign country and request phone calls from people in the contact
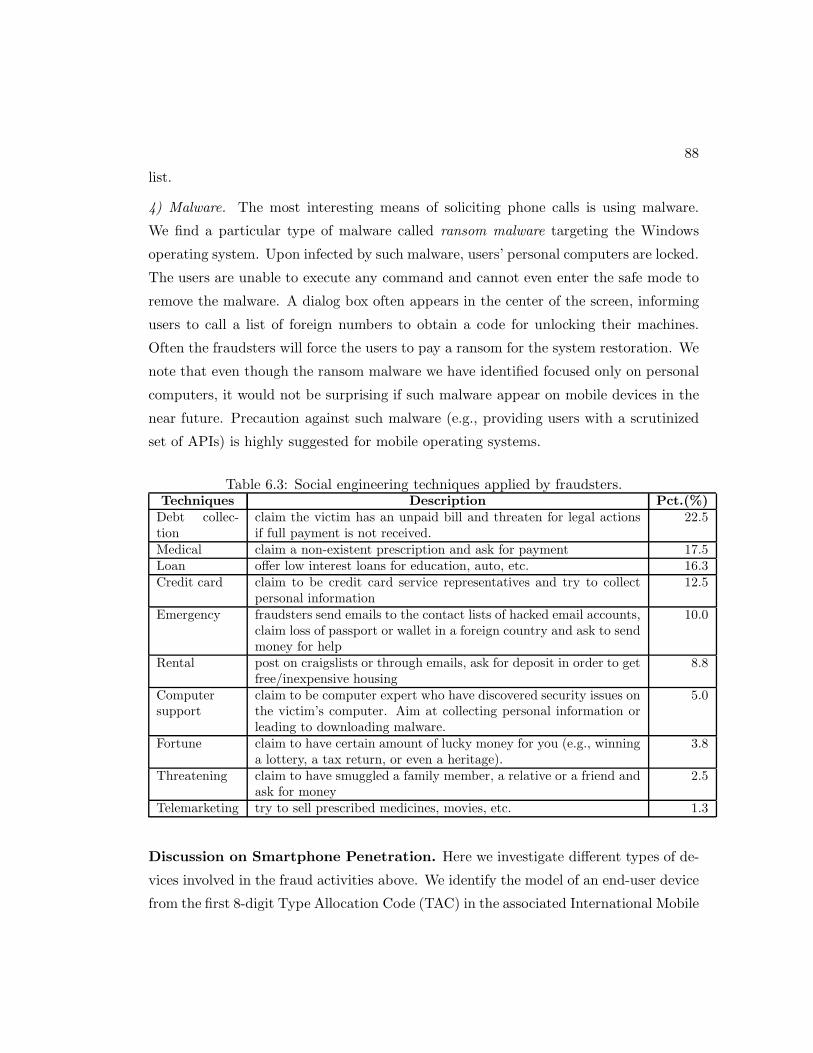
88
list.
4) Malware. The most interesting means of soliciting phone calls is using malware.
We find a particular type of malware called ransom malware targeting the Windows
operating system. Upon infected by such malware, users’ personal computers are locked.
The users are unable to execute any command and cannot even enter the safe mode to
remove the malware. A dialog box often appears in the center of the screen, informing
users to call a list of foreign numbers to obtain a code for unlocking their machines.
Often the fraudsters will force the users to pay a ransom for the system restoration. We
note that even though the ransom malware we have identified focused only on personal
computers, it would not be surprising if such malware appear on mobile devices in the
near future. Precaution against such malware (e.g., providing users with a scrutinized
set of APIs) is highly suggested for mobile operating systems.
Table 6.3: Social engineering techniques applied by fraudsters.Techniques Description Pct.(%)
Debt collec-tion
claim the victim has an unpaid bill and threaten for legal actionsif full payment is not received.
22.5
Medical claim a non-existent prescription and ask for payment 17.5Loan offer low interest loans for education, auto, etc. 16.3Credit card claim to be credit card service representatives and try to collect
personal information12.5
Emergency fraudsters send emails to the contact lists of hacked email accounts,claim loss of passport or wallet in a foreign country and ask to sendmoney for help
10.0
Rental post on craigslists or through emails, ask for deposit in order to getfree/inexpensive housing
8.8
Computersupport
claim to be computer expert who have discovered security issues onthe victim’s computer. Aim at collecting personal information orleading to downloading malware.
5.0
Fortune claim to have certain amount of lucky money for you (e.g., winninga lottery, a tax return, or even a heritage).
3.8
Threatening claim to have smuggled a family member, a relative or a friend andask for money
2.5
Telemarketing try to sell prescribed medicines, movies, etc. 1.3
Discussion on Smartphone Penetration. Here we investigate different types of de-
vices involved in the fraud activities above. We identify the model of an end-user device
from the first 8-digit Type Allocation Code (TAC) in the associated International Mobile

89
Equipment Identity (IMEI). The remaining 6-digit serial number has been anonymized
to protect customers’ privacy. Based on the functionality of devices, we further classify
them into smartphones and regular phones. In comparison to regular phones, smart-
phones are characterized with high computational power, and support services like video
streaming, web browsing, GPS and a variety of mobile apps.
For ease of exposition, we define α(g) as the proportion of victims involved in fraud
activity g who are smartphone users. Similarly, we denote α0 as fraction of smartphone
users out of all mobile users in the network. Therefore, we define the relative significance
of smartphones associated with fraud activity g as RS(g) := α(g)/α0, which is displayed
in the last column of Table 6.2. A higher value of RS (greater than 1) indicates the
predominance of smartphones involved in that fraud activity.
Since IRSF Malware is propagated in the form of bogus mobile apps, all victims
associated with this type of fraud are smartphones. Surprisingly, Online Media IRSF,
Online Media Scam and Email Scam (line 3, 7 and 8) attract many more smartphone
victims. We conjecture that smartphone users, who are capable of maintaining persis-
tent access to online media sites and email services, are potentially exposed to more
fraud activities. Moreover, many smartphone devices support the “click to call” func-
tion which allows users to initiate phone calls by clicking on the phone numbers on the
web page from the browser. This also increases their chance of responding to fraud ac-
tivities. In comparison, Unlocked Device and Device Exploit (line 4 and 5), constrained
by a few vulnerable devices, most of which are regular phones, attract a predominant
number of regular phone victims. Moreover, since Target Scam and Malware Scam (line
6 and 9) are migrated unchangeably from landlines and Internet, they do not rely on
specific mobile devices. Thus they have an RS value close to 1.
We further explore the fraction of new victims with smartphone devices over a two-
year time period, which is depicted as the solid red curve in Fig. 6.11. For comparison,
we also display the proportion of smartphone users out of all mobile users over the
same time period (the blue dotted curve). The ascending trend of the dotted curve
in Fig. 6.11 clearly indicates a sign of smartphone penetration, where the proportion
contributed by smartphone users increases steadily, with a few jumps plausibly due to
the release of popular smartphone devices and other social events. However, we observe
that smartphone users always account for a much higher proportion of new victims

90
(i.e., the solid curve stays above the dotted curve), indicating that smartphone users
are more susceptible to fraud activities. In addition, accompanying the fast increase
of smartphone popularity, we observe that the proportion of victims with smartphone
devices is also increasing significantly, which is indicated by the ascending trend of the
red solid curve in Fig. 6.11. This is possibly because of the emerging fraud activities
targeting smartphone population, especially the ones carried by malware apps and online
media sites, which can be much more effective in acquiring new victims than traditional
fraud targeting landlines.
Time (spanning two years)
Sm
artp
hone
pro
port
ion
New victimsAll users
Figure 6.11: Smartphone proportion change over time.
Implications: While mobile users enjoy the advance of smartphone devices, its rich
functionality and strong computation power leave more room for fraudsters to carry out
more sophisticated attacks on these devices, which makes smartphone devices more sus-
ceptible to fraudulent activities. We observe many fraud activities carried by malicious
mobile apps targeting smartphones. These malware apps have integrated the func-
tions of voice calls and data transmission and exhibit certain characteristics of modern
botnets, e.g., employing dynamic fraud numbers to evade detection and regulation,
maintaining connection with a command-and-control (C&C) server, etc. We expect to
see in near future that new malware apps incorporate other channels, e.g., SMS and
MMS, for fraud activities. Moreover, more techniques used by botnets today are ex-
pected to be adopted for developing malware apps, such as fast-flux, domain-flux and

91
P2P network, etc. Lessons learned from combating botnets can be useful for preventing
fraud in cellular networks.
Since all malware infections we have observed are triggered by users actively down-
loading malware from the online marketplace, detection and removal of malware at the
online marketplace has proved to be an effective way of preventing fraud activities. In
particular, our analysis suggests that the online marketplace should come up with more
advanced vetting process for the apps, especially if it contains code segment involved
with voice calls or SMS messages. Similarly, information posted on online media should
also be carefully vetted (especially phone numbers appearing on online posts) to avert
fraud activities.
6.6.3 Social Engineering Techniques
Given that many fraud activities adopt social engineering to defraud victims, we take
a closer look at the social engineering techniques that fraudsters often employ to solicit
victims to make phone calls, to disclose sensitive personal information, or even to inflict
monetary loss. As mentioned in Section 6.6.2, our analysis of social engineering tech-
niques also relies on descriptions from online feedback provided by the victims based on
their conversations with the fraudsters.
We summarize the identified social engineering techniques in Table 6.3, where the
first column shows the name of the technique and the second column provides ex-
planation of each technique. The third column displays the popularity of each social
engineering technique in terms of the proportion of fraud activities (i.e., subgraphs) that
practice it. There are also fraud numbers (less than 10%) that either no one complaints
about or the corresponding social engineering technique cannot be distilled from the
online feedback. This may be due to the small victim population affected by this fraud
activity or the lag in user reports (recall there can be several months of delay of user
reports after the fraud activity is detected). We temporarily ignore these numbers and
leave them for future investigation.
In Table 6.3, we see various techniques that fraudsters usually adopt. Though these
techniques vary from case to case, they generally fall into several categories which are
more likely to attract people’s attentions. For example, people usually are responsive
if they are told that they have an outstanding expense, which may affect their credit
92
rating. Therefore, a very popular social engineering technique is regarding bill or debt,
where fraudsters claim fictitious debts owed by the victims in order to acquire private
information or defraud victims of money. Similarly, techniques regarding services that
are crucial in our daily life, such as personal/car loan and credit cards, are also commonly
used by fraudsters. An interesting observation shows that fraudsters applying these
techniques often are aware of personal information of the victims, such as their names,
addresses, bank account or former prescription information. For example, we observe
reports regarding fraudsters pretending to be bank personnel, who mentioned victims’
former bank account numbers. In fact, the bank has reported the leak of customer
private information due to hacker attacks. Apparently, such information has somehow
been acquired to conduct fraud activities. As another example, medical prescription
information is adopted frequently by the fraudsters to defraud victims. With personal
information, fraudsters often launch targeted scam to increase their success rate. In
comparison, when lacking such information, fraudsters usually employ auto dialer to
find victims or rely on social media sites, forums or other online media channels. The
common social engineering techniques applied by these fraudsters are advertisement
for discounted drugs, lottery defraud or even feigning an emergency regarding a family
member. However, these fraud activities only account for less than 10%.
Implications: Personal information plays an important role in fraud activities. Based
on user reports, fraud activities are more difficult to recognize when personal information
is mentioned by fraudsters. We have identified cases where personal information is
acquired by fraudsters from bank databases through security attacks. This suggests
the importance of correlating fraud activities and network intrusions to understand and
track the chain of fraudulent events. In addition, there are also cases where fraudsters
are likely to acquire personal information from online sources, like social media sites
or personal blogs. Vetting these online sources to avoid information leakage is crucial
for combating fraud activities. Moreover, with the increasing functionality of mobile
devices, users tend to store personal information, e.g., contact list, emails or even credit
card information (for online purchase) in these devices. There is a demanding need for
better security on these personal devices.

93
6.6.4 Originating Countries of Fraud Numbers
To understand the geographical distribution of fraud numbers, we investigate the top
originating countries of these numbers. In fact, we find fraud numbers are distributed
widely to 58 different countries, where the top countries, UK, Sao Tome and Principe
and Russia, collectively contribute to less than 25% of fraud numbers, respectively.
More interestingly, we find around 60% of the fraud activities contain phone numbers
from multiple countries. All these make tracking and regulating fraud activities a much
more challenging task. In addition, we have observed diversity of fraud activities from
different countries. For example, the UK is related to a higher number of email related
fraud activities, Nigeria is associated with more rental fraud activities, and Sao Tome
and Principe has contributed to many malware related fraud numbers.
An interesting observation is made by measuring the length of the fraud numbers.
Including country codes, around 60% of the fraud numbers contain 10 digits, the same
number of digits as a typical US number excluding the country code “1”. We refer to
this observation as the heteronym property of fraud numbers. Having the same length as
a US number, it is very hard for a user to distinguish such a foreign number, and hence
increase chances of victims calling that number. In an extreme case, we find a scam
activity employing three different foreign numbers looking very similar: 664-133xxxx in
Montserrat, 66-4133xxxx in Thailand and 64-4133xxxx in New Zealand10 . We have
tried to initiate international phone calls to mobile devices equipped with four most
popular mobile operating systems. Unfortunately, in the default firmware setting, none
of the devices has successfully parsed the incoming number and displayed the right
country name of the caller. This explains why many users complaining on the forums
about high rate US numbers, which are essentially international fraud numbers.
Implications: Though certain mobile apps have started to offer the functionality for
parsing incoming phone numbers, it is necessary for the mobile operating systems to
provide direct support of such functionality. We believe it is a critical step for prevent-
ing fraud activities by presenting more information to the users to help them identify
potential fraud calls. Our analysis also indicates that fraudsters often employ numbers
10 Different international exit codes are used to differentiate calls to these numbers, e.g., 011 forMontserrat, 001 for Thailand, and 00 for New Zealand. However, such exit codes are often attachedautomatically by the device without informing the user.

94
from multiple countries to void tracking and regulation. Therefore, a forum for inter-
national telecom companies to share knowledge regarding premium rate numbers and
known fraud numbers can be useful for detecting and preventing fraudulent activities.
6.7 Summary
In this Chapter, we proposed a graph based method to detect fraud activities of voice
calls in a large cellular network, which enables us to efficiently isolate popular fraud
numbers from millions of international phone numbers. Using call records spanning a
two-year time period, we showed that our method successfully detected a great variety
of voice call fraud activities. In addition, we identified unique characteristics of fraud
activities in cellular networks, such as new fraud carried by malware apps, unlocked
devices and online media sites, social engineering techniques and heteronym property
of fraud numbers. Our analysis sheds light on the new characteristics and trends of
voice-related fraud activities in current mobile networks.

Chapter 7
Conclusion and Future Work
This dissertation is dedicated to share the experience and our data oriented approach
for building operational defense systems against attacks from mobile voice channels in
large-scale cellular networks: SMS spam and voice fraud.
In particular, we investigated SMS spam activities in a large cellular network by
combining user reported spam messages and spam network records. Using thousands
of spam numbers extracted from these spam reports, we studied in-depth various as-
pects of SMS spamming activities, including spammer’s device type, tenure, voice and
data usage, spamming patterns and so on. We found that spam numbers sending sim-
ilar spam messages exhibit strong spacial and temporal correlations, based on which
we proposed novel spam detection methods which demonstrated promising results in
terms of detection accuracy and response time. In addition, our analysis result also
demonstrated that most spammers selected victims randomly. This lead to the design
of Greystar, an innovative system for fast and accurate detection of SMS spam numbers.
To defend against voice fraud, we proposed a graph based method to detect fraud
activities of voice calls in a large cellular network, which enables us to efficiently isolate
popular fraud numbers from millions of international phone numbers. Using call records
spanning a two-year time period, we showed that our method successfully detected a
great variety of voice call fraud activities. In addition, we identified unique characteris-
tics of fraud activities in cellular networks, such as new fraud carried by malware apps,
unlocked devices and online media sites, social engineering techniques and heteronym
property of fraud numbers. Our analysis sheds light on the new characteristics and
95

96
trends of voice-related fraud activities in current mobile networks.
Our future work involves investigating the potential of combining additional features,
such as the user calling history, and instant user fraud reports to improve detection
accuracy. Our future work will also focus on applying the same approach to detect other
suspicious activities in cellular networks, such as telemarketing campaigns. Meanwhile,
we will correlate detection results from different methods with cellular data traffic to
detect malware engaged in such spamming activities.

References
[1] Over 5 billion mobile phone connections worldwide.
http://www.bbc.co.uk/news/10569081.
[2] Data capable cell phones replacing the pc.
http://blogs.itbusiness.ca/2011/03/data-capable-cell-phones-replacing-the-pc/.
[3] Report: Cellphones replacing landlines. http://www.upi.com/Top News/US/2009/11/19/Report-
Cellphones-replacing-landlines/UPI-72441258651963/.
[4] iphone virus turns into a mobile botnet. http://www.redmondpie.com/iphone-
virus-turns-into-a-mobile-botnet-9140130/.
[5] Federal communications commission. Spam: unwanted text messages and email,
2012. http://www.fcc.gov/guides/spam-unwanted-text-messages-and-email.
[6] Mobile spam texts hit 4.5 billion. http://www.businessweek.com/news/2012-04-
30/mobile-spam-texts-hit-4-dot-5-billion-raising-consumer-ire.
[7] C. Baldwin. 350,000 different types of spam sms messages were targeted at mobile
users in 2012, 2013. http://www.computerweekly.com/news/2240178681/ 350000-
different-types-of-spam-SMS-messages-were-targeted-at-mobile-users-in-2012.
[8] 69% of mobile phone users get text spam, 2012.
http://abcnews.go.com/blogs/technology/2012/08/69-of-mobile-phone-users-
get-text-spam/.
[9] A. Bose, X Hu, K. Shin, and T. Park. Behavioral detection of malware on mobile
handsets. In MobiSys ’08, 2008.
97

98
[10] X. Cui, B. Fang, L. Yin, X. Liu, and T. Zang. Andbot: towards advanced mobile
botnets. Proc. of the 4th USENIX Workshop on Large-Scale Exploits and Emergent
Threats, 2011.
[11] L. Xie, X. Zhang, J. Seifert, and S. Zhu. pbmds: a behavior-based malware detec-
tion system for cellphone devices. In WiSec ’10, 2010.
[12] N. Jiang, J. Cao, Y. Jin, L. Li, and Z.-L. Zhang. Identifying suspicious activ-
ities through dns failure graph analysis. In Proceedings of the eighteenth IEEE
International Conference on Network Protocols (ICNP’10), 2010.
[13] Y. Ye, T. Li, S. Zhu, W. Zhuang, E. Tas, U. Gupta, and M. Abdulhayoglu. Com-
bining file content and file relations for cloud based malware detection. In KDD
’11, 2011.
[14] Cluto - software for clustering high-dimensional datasets.
http://glaros.dtc.umn.edu/gkhome/views/cluto.
[15] Y. Zhao and G. Karypis. Criterion functions for document clustering: Experiments
and analysis. Technical report, University of Minnesota, 2002.
[16] Y. Jin, N. Duffield, A. Gerber, P. Haffner, W.-L. Hsu, G. Jacobson, S. Sen,
S. Venkataraman, and Z.-L. Zhang. Making sense of customer tickets in cellular
networks. In IEEE INFOCOM’11 Mini-Conference, 2010.
[17] I. Murynets and R. Jover. Crime scene investigation: Sms spam data analysis.
IMC’12, 2012.
[18] W. Enck, P. Traynor, P. McDaniel, and T. La Porta. Exploiting open function-
ality in sms-capable cellular networks. In Proc. of the 12th ACM Conference on
Computer and Communications Security, 2005.
[19] E. Bursztein, P. Lam, and J. Mitchell. Trackback spam abuse and prevention. In
Proc. of the 2009 ACM workshop on Cloud computing security, 2009.
[20] E. Bursztein, B. Gourdin, and J. Mitchell. Reclaiming the blogosphere talkback a
secure linkback protocol for weblogs. In Proc. of the 16th European Symposium on
Research in Computer Security, 2011.

99
[21] C. Kreibich, C. Kanich, K. Levchenko, B. Enright, G. Voelker, V. Paxson, and
S. Savage. On the Spam Campaign Trail. In LEET’08, 2008.
[22] C. Kreibich, C. Kanich, K. Levchenko, B. Enright, G. Voelker, V. Paxson, and
S. Savage. Spamcraft: An inside look at spam campaign orchestration. In LEET’09,
2009.
[23] C. Kanich, C. Kreibich, K. Levchenko, B. Enright, G. Voelker, V. Paxson, and
S. Savage. Spamalytics: An empirical analysis of spam marketing conversion. Com-
munications of the ACM, 52(9):99–107, 2009.
[24] A. Pathak, F. Qian, C. Hu, M. Mao, and S. Ranjan. Botnet spam campaigns can
be long lasting: evidence, implications, and analysis. SIGMETRICS ’09, 2009.
[25] H. Gao, J. Hu, C. Wilson, Z. Li, Y. Chen, and B. Zhao. Detecting and characterizing
social spam campaigns. IMC ’10, 2010.
[26] S. Ghosh, B. Viswanath, F. Kooti, N. Sharma, G. Korlam, F. Benevenuto, N. Gan-
guly, and K. Gummadi. Understanding and combating link farming in the twitter
social network. WWW ’12, 2012.
[27] C. Yang, R. Harkreader, J. Zhang, S. Shin, and G. Gu. Analyzing spammers’ social
networks for fun and profit: a case study of cyber criminal ecosystem on twitter.
WWW ’12, 2012.
[28] C. Grier, K. Thomas, V. Paxson, and M. Zhang. @spam: the underground on 140
characters or less. CCS ’10, 2010.
[29] Q. Xu, E. Xiang, Q. Yang, J. Du, and J. Zhong. Sms spam detection using non-
content features. Intelligent Systems, IEEE, 27(6):44 –51, 2012.
[30] T. Ouyang, S. Ray, M. Rabinovich, and M. Allman. Can network characteristics
detect spam effectively in a stand-alone enterprise? PAM’11, 2011.
[31] M. Sirivianos, K. Kim, and X. Yang. Introducing social trust to collaborative
spam mitigation. In Proc. of the 30th IEEE International Conference on Computer
Communications, 2011.

100
[32] S. Hao, N. Syed, N. Feamster, A. Gray, and S. Krasser. Detecting spammers
with snare: spatio-temporal network-level automatic reputation engine. USENIX
Security Symposium’09, 2009.
[33] A. Pitsillidis, K. Levchenko, C. Kreibich, C. Kanich, G.M. Voelker, V. Paxson,
N. Weaver, and S. Savage. Botnet judo: Fighting spam with itself. In NDSS’09,
2010.
[34] K. Yadav, P. Kumaraguru, A. Goyal, A. Gupta, and V. Naik. Smsassassin: crowd-
sourcing driven mobile-based system for sms spam filtering. HotMobile ’11, 2011.
[35] G. Cormack, J. Hidalgo, and E. Sanz. Feature engineering for mobile (sms) spam
filtering. SIGIR ’07, 2007.
[36] H. Tan, N. Goharian, and M. Sherr. $100,000 Prize Jackpot. Call now! Identifying
the pertinent features of SMS spam. In Proc. of the 35th Annual ACM SIGIR
Conference, 2012.
[37] R. Pang, V. Yegneswaran, P. Barford, V. Paxson, and L. Peterson. Characteristics
of internet background radiation. In Proc. of the 4th ACM Internet measurement
conference, 2004.
[38] E. Wustrow, M. Karir, M. Bailey, F. Jahanian, and G. Huston. Internet background
radiation revisited. In Proc. of the 10th ACM Internet measurement conference,
2010.
[39] Y. Jin, G. Simon, K. Xu, Z.-L. Zhang, and V. Kumar. Gray’s anatomy: dissecting
scanning activities using ip gray space analysis. In Proceedings of the 2nd USENIX
workshop on Tackling computer systems problems with machine learning techniques,
pages 2:1–2:6, 2007.
[40] The honeynet project, 2012. http://project.honeynet.org/.
[41] G. Dunlap, S. King, S. Cinar, M. Basrai, and P. Chen. Revirt: enabling intrusion
analysis through virtual-machine logging and replay. In Proc. of the 2nd USENIX
Symposium on Operating Systems Design and Implementation, 2002.

101
[42] N. Christin, S. Yanagihara, and K. Kamataki. Dissecting one click frauds. In CCS
’10, 2010.
[43] S. Pandit, D. Chau, S. Wang, and C. Faloutsos. Netprobe: a fast and scalable
system for fraud detection in online auction networks. In WWW ’07.
[44] A. Metwally, D. Agrawal, and A. Abbadi. Using association rules for fraud detection
in web advertising networks. In VLDB ’05, 2005.
[45] X. Ying, X. Wu, and D. Barbar a. Spectrum based fraud detection in social
networks. In CCS ’10, 2010.
[46] C. Cortes, D. Pregibon, and C. Volinsky. Communities of interest. In IDA’01,
2001.
[47] C. Mulliner, N. Golde, and J. Seifert. Sms of death: from analyzing to attacking
mobile phones on a large scale. In SEC’11, 2011.
[48] Y. Jin, E. Sharafuddin, and Z.-L. Zhang. Unveiling core network-wide communi-
cation patterns through application traffic activity graph decomposition. In Proc.
of SIGMETRICS ’09, pages 49–60, 2009.
[49] J. Sun, H. Qu, D. Chakrabarti, and C. Faloutsos. Neighborhood formation and
anomaly detection in bipartite graphs. In ICDM ’05, 2005.
[50] C. Cortes, D. Pregibon, and C. Volinsky. Computational methods for dynamic
graphs. Journal of Computational and Graphical Statistics, 12, 2003.
[51] Tinyurl. http://tinyurl.com/.
[52] 800notes - Directory of unknown callers. http://www.800notes.com.
[53] N. Jiang, Y. Jin, A. Skudlark, W. Hsu, G. Jacobson, S. Prakasam, and Z.-L.
Zhang. Isolating and analyzing fraud activities in a large cellular network via voice
call graph analysis. MobiSys’12, 2012.
[54] Y. Zhao, G. Karypis, and U. Fayyad. Hierarchical clustering algorithms for docu-
ment datasets. Data Min. Knowl. Discov., 2005.

102
[55] G. Jacob, R. Hund, C. Kruegel, and T. Holz. Jackstraws: picking command and
control connections from bot traffic. SEC’11, 2011.
[56] A. Skudlark N. Jiang, Y. Jin and Z.-L. Zhang. Understanding and detecting sms
spam through mining customer reports. Technical report, AT&T Labs, 2012.
[57] A. Ramachandran, N. Feamster, and S. Vempala. Filtering spam with behavioral
blacklisting. CCS ’07, 2007.
[58] Sms watchdog. http://www.smswatchdog.com.
[59] S. Sinha, M. Bailey, and F. Jahanian. Improving SPAM blacklisting through dy-
namic thresholding and speculative aggregation. In Proc. of the 17th Annual Net-
work and Distributed System Security Symposium, 2010.
[60] J. Jung and E. Sit. An empirical study of spam traffic and the use of DNS black
lists. In Proc. of the 4th ACM Internet Measurement Conference, 2004.
[61] A. Ramachandran, N. Feamster, and D. Dagon. Revealing botnet membership
using dnsbl counter-intelligence. In Proc. of the 2nd Workshop on Steps to Reducing
Unwanted Traffic on the Internet, 2006.
[62] Y. Xie, F. Yu, K. Achan, R. Panigrahy, G. Hulten, and I. Osipkov. Spamming
botnets: signatures and characteristics. In Proc. of the 2008 ACM SIGCOMM
Annual Conference, 2008.
[63] M. Shafiq, L. Ji, A. Liu, J. Pang, and J. Wang. A first look at cellular machine-
to-machine traffic: large scale measurement and characterization. In Proc. of the
2012 ACM International Conference on Measurement and Modeling of Computer
Systems, 2012.
[64] WhoCallsMe - Reverse phone number lookup. http://www.whocallsme.com.
[65] Graphviz. http://www.graphviz.org/.
[66] A. Mislove, M. Marcon, K. Gummadi, P. Druschel, and B. Bhattacharjee. Mea-
surement and analysis of online social networks. In IMC ’07, 2007.
103
[67] Y. Zhang, S. Singh, S. Sen, N. Duffield, and C. Lund. Online identification of
hierarchical heavy hitters: algorithms, evaluation, and applications. In Proc. of
ACM IMC, 2004.
[68] A. Mahimkar, Z. Ge, A. Shaikh, J. Wang, J. Yates, Y. Zhang, and Q. Zhao. Towards
automated performance diagnosis in a large iptv network. In SIGCOMM’09, pages
231–242, 2009.
[69] S. Dongen. Graph clustering by flow simulation. PhD thesis, University of Utrecht,
2000.