sedentexct d2.2 v1 final d2.2 v1 … · · 2018-04-184.4 scatter dose above plane of isocentre...
TRANSCRIPT
1 SEDENTEXCT D2.2 Report
Project Deliverable
Project number:
212246
Project Acronym:
SEDENTEXCT
Project title: Safety and Efficacy of a New and Emerging Dental X-ray Modality
Instrument: Collaborative Project (Small or medium-
scale focused research project)
Activity code: Fission-2007-3.2-01
Start date of project:
1 January 2008
Duration: 42 months
Title: D2.2: Completion of scatter dose measurements around CBCTs and recommendations for protective measures and positioning of CBCT
units in dental offices
Contractual Delivery date:
31 March 2010 (30 June 2010 agreed with EC Project Officer through PPR Year 2)
Actual Delivery date:
23 July 2010
Organisation name of lead beneficiary for this Deliverable: UNIMAN (University of Manchester)
Document version:
v1.0
Dissemination level: PU PP RE CO
Public Restricted to other programme participants (including the Commission) Restricted to a group defined by the consortium (including the Commission) Confidential, only for members of the consortium (including the Commission)
PU
Safety and Efficacy of a New and Emerging Dental X-ray Modality
2 SEDENTEXCT D2.2 Report
Authors (organisations): Ria Bogaerts (KUL): WP2 Lead Lorna Sweetman (UNIMAN) Ruben Pauwels (KUL) Hilde Bosmans (KUL) Anne Walker (UNIMAN) Chrysoula Theodorakou (UNIMAN) Katie Howard (UNIMAN) Sophia Gavala (NKUA) Eleftheria Carinou (NKUA) Deimanté Ivanauskaité (VU) Aušra Urbonienė (VU)
Abstract:
In this deliverable report, scatter dose measurements from ten different models of dental Cone Beam Computed Tomography (CBCT) devices are presented. The measurements were collected using two techniques: one active where a scattering material was placed in the CBCT and a radiation detector positioned at various locations in the room to measure during the exposure, the other passive where small dosemeters were attached to walls around the CBCT for a period of 3 to 12 weeks while normal clinical and non-clinical exposures were performed. The active measurements, which used the maximum exposure parameters, found scatter dose per scan at a distance of 1 m from the isocentre of the CBCT was in the range 4.1 – 46.8 µSv (mean: 11.3 µSv, median: 7.4 µSv). The passive measurements, carried out on four models of CBCT ranged from 2.0 µSv to 8.1 µSv per scan at 1 m.
Information was also gathered on the average number of patients seen in different CBCT facilities and the national requirements or guidelines on the design of such facilities with respect to radiation protection. Example calculations of the shielding requirements, combining all the data, are offered and recommendations based on the measurements are proposed.
Safety and Efficacy of a New and Emerging Dental X-ray Modality
3 SEDENTEXCT D2.2 Report
Table of Contents 1. The Context ..............................................................................................4
1.1 SEDENTEXCT aims and objectives ..................................................4 1.2 Work package 2 (WP2) objectives.....................................................4 1.3 Deliverable D2.2 ................................................................................5 1.4 Radiological protection and design dose constraints.........................6 1.5 Glossary ............................................................................................8
2. The Methodology ......................................................................................9 2.1 Measurements using PMMA or anthropomorphic phantoms.............9 2.2 Passive measurements with thermoluminescent dosemeters .........12 2.3 Workload .........................................................................................13
3. Results....................................................................................................14 3.1 Active measurements ......................................................................14 3.2 Passive measurements ...................................................................15 3.3 Workload .........................................................................................17
4. Discussion ..............................................................................................18 4.1 Field of view, FOV ...........................................................................18 4.2 Exposure time, pulsed x-rays ..........................................................18 4.3 Degree of rotation............................................................................19 4.4 Scatter dose above plane of isocentre ............................................19
5. Implications for staff and structural protection.........................................21 5.1 Distance...........................................................................................21 5.2 Structural protection – shielding ......................................................23
6. Conclusions ............................................................................................27 6.1 Current recommendations ...............................................................27 6.2 Further and future work ...................................................................27
7. References .............................................................................................29
Appendix 1: Measurement protocol and recording sheet..............................30
Appendix 2: Detailed results of scatter measurements ..................................32 • Kodak 9000 3D • 3D Accuitomo 80 • ProMax 3D • NewTom 9000 • GX CB-500 • Scanora 3D XL • i-CAT NG • Galileos Comfort • 3D Accuitomo 170
4 SEDENTEXCT D2.2 Report
1. The Context 1.1 SEDENTEXCT aims and objectives
The aim of this project is the acquisition of the key information necessary for sound and scientifically based clinical use of dental Cone Beam Computed Tomography (CBCT). In order that safety and efficacy are assured and enhanced in the ‘real world’, the parallel aim is to use the information to develop evidence-based guidelines dealing with justification, optimisation and referral criteria and to provide a means of dissemination and training for users of CBCT. The objectives and methodology of the collaborative project are:
1. To develop evidence-based guidelines on use of CBCT in dentistry, including referral criteria, quality assurance guidelines and optimisation strategies. Guideline development will use systematic review and established methodology, involving stakeholder input.
2. To determine the level of patient dose in dental CBCT, paying special attention to paediatric dosimetry, and personnel dose.
3. To perform diagnostic accuracy studies for CBCT for key clinical applications in dentistry by use of in vitro and clinical studies.
4. To develop a quality assurance programme, including a tool/tools for quality assurance work (including a marketable quality assurance phantom) and to define exposure protocols for specific clinical applications.
5. To measure cost-effectiveness of important clinical uses of CBCT compared with traditional methods.
6. To conduct valorisation, including dissemination and training, activities via an ‘open access’ website.
At all points, stakeholder involvement will be intrinsic to study design.
1.2 Work package 2 (WP2) objectives
It is fundamental to radiation protection that the benefits of a procedure using ionizing radiation outweigh the risks; this is incorporated into the relevant European Directive 97/43/Euratom [1]. The limited studies in the literature indicate that the radiation dose achievable with CBCT units is substantially less than conventional CT but higher than conventional dental imaging. In addition the radiation dose varies according to the particular manufacturer’s system being assessed. For example, one system may give a dose ten times another for the same examination. Doses are many times greater than those for conventional ‘dental’ examinations. Dose depends upon the size of the volume of the patient imaged and the other selected technique factors.
5 SEDENTEXCT D2.2 Report
These studies suffer because they are individually limited to reports related to one or two CBCT systems. More work is needed to verify this limited literature on a greater range of current CBCT systems and without the inter-study variation in measurement methodologies; the research will achieve this. Importantly, however, our research will specifically deal with paediatric dosimetry, an area that has not been previously assessed using anatomically appropriate paediatric phantoms. Our research will also develop a robust system of Monte-Carlo dose simulation for CBCT that will facilitate optimisation of exposures.
The overall aim of this work package is to determine the level of (1) patient dose in dental CBCT, paying special attention to paediatric dosimetry, and (2) personnel dose. These goals correspond to the following sub-objectives:
1. To develop a method to readily characterise the dose distribution for different scanners, using measurements simply performed in the field, to allow simple conversion to effective dose.
2. To determine the scatter dose distribution around scanners and explore the consequences for operator dose.
1.3 Deliverable D2.2
Deliverable D2.2 presents scatter dose measurements around CBCTs and uses these to make recommendations for protective measures and positioning of CBCT units. Dental radiology has generally been categorised as a low dose modality. With the introduction of CBCT into the field, this is changing. Compared with dental panoramic radiography, it has been shown that patient doses are higher, but little has been published on the increase in staff doses from this technique. Furthermore, the number of CBCT installations has increased rapidly in recent years and it would not be unexpected that the average usage of the installed CBCTs would increase with time as the technique becomes established. With such a wide range of designs and models of CBCTs, this work aimed to look not just at the average dose that a person in the vicinity of the CBCT might receive but also at the range of doses. This requires measurement of the scatter in different situations (clinical and non-clinical) and also information on typical workloads so that the scatter measurements can be extrapolated to annual doses. By including project partners from across Europe, the number of CBCT models that could be accessed and the amount of data that could be collected were increased.
Active and passive measurements of scattered radiation were carried out by:
• University of Manchester, UK
• National and Kapodistrian University of Athens, Greece
• Katholieke Universiteit Leuven, Belgium

6 SEDENTEXCT D2.2 Report
• Vilnius University, Lithuania
1.4 Radiological protection and design dose constraints
In addition to the protection of patients, every facility using ionising radiation must ensure that the exposure of other individuals, whether employees or members of the public, is kept as low as reasonably practicable and below the established annual dose limits. Directive 96/29/Euratom [2] sets these dose limits at 20 mSv for employees and 1 mSv for members of the public.
There are three practical measures that can be employed to reduce exposure to the scattered x-rays. These are:
• Time
• Distance
• Shielding Minimising the time spent in the vicinity of a radiation source and maximising the distance from it, will minimise the dose that an individual receives. By placing an attenuating material, or shield, between the source and the individual, further dose reduction is possible.
Time, occupancy
If an individual occupies an area adjacent to a CBCT facility for only part of the time when the CBCT is in use, the dose to that individual will, consequently, be proportionately lower than if they were present constantly. Generally, in this sort of situation, time is incorporated into the design of the facility in such a way that a higher dose rate is permitted in adjacent areas on the basis that over the time that the areas are occupied during the year, the cumulative dose will remain within the projected value.
There are restrictions on the extent to which this can be applied. It would not be acceptable to create a situation where an individual could receive a significant fraction of an annual dose limit during a single period of occupancy in an otherwise rarely used location. The occupancy of some areas can also change rapidly, e.g. if a worker’s hours change from part-time to full-time.
Distance, the inverse square law
The dose received from a point source of radiation decreases rapidly as the distance from the source is increased, following the inverse square law. The inverse square law states that the dose, D, is proportional to the reciprocal of the square of the distance, x. This can be expressed mathematically as:
21
xD ∝
What this means in practice is that if the distance to the source is increased by a factor of 2, say from 1 m to 2 m, the radiation dose will be reduced by a
7 SEDENTEXCT D2.2 Report
factor of 22 i.e. 4. Similarly increasing the distance to 3 m, reduces the dose by a factor of 9. However, the opposite is also true and decreasing the distance will cause the dose to increase rapidly.
Shielding, dose constraints
When designing facilities, dose constraints are used in the determination of the amount of shielding to be incorporated into the barriers of the rooms: walls, doors, windows, floor and ceiling. If all the inputs into the shielding calculations (for example, the numbers of patients; radiation output from the x-ray equipment; position and orientation of the x-ray equipment; and occupancy of adjacent areas) are accurate, the dose constraint will not be exceeded when the facility is in operation. Facilities may be designed months or years in advance of their construction or use, at a time when such information may not be firmly established. Facilities may also have lifetimes of 10-20 years or more, over which time clinical practice can change significantly and predicted workloads could increase manyfold. Therefore, dose constraints may be set lower than the corresponding dose limits in order to incorporate an extra conservatism into the design process.
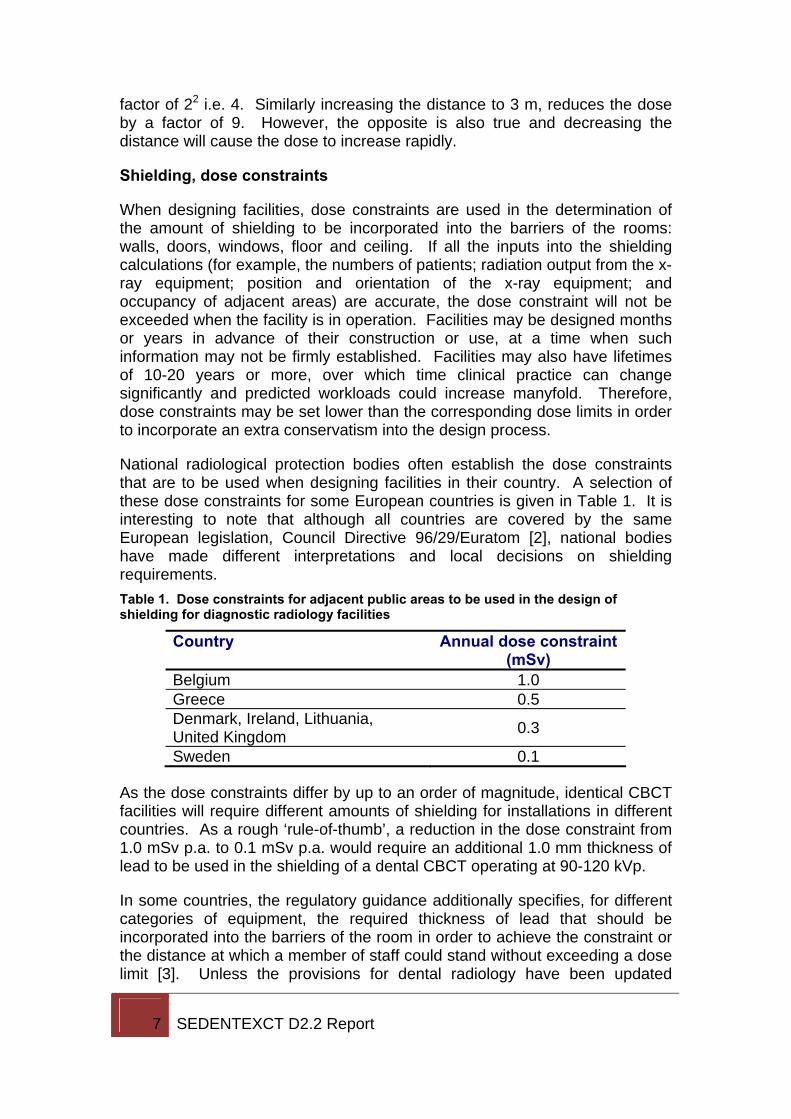
National radiological protection bodies often establish the dose constraints that are to be used when designing facilities in their country. A selection of these dose constraints for some European countries is given in Table 1. It is interesting to note that although all countries are covered by the same European legislation, Council Directive 96/29/Euratom [2], national bodies have made different interpretations and local decisions on shielding requirements. Table 1. Dose constraints for adjacent public areas to be used in the design of shielding for diagnostic radiology facilities
Country Annual dose constraint (mSv)
Belgium 1.0 Greece 0.5 Denmark, Ireland, Lithuania, United Kingdom 0.3
Sweden 0.1
As the dose constraints differ by up to an order of magnitude, identical CBCT facilities will require different amounts of shielding for installations in different countries. As a rough ‘rule-of-thumb’, a reduction in the dose constraint from 1.0 mSv p.a. to 0.1 mSv p.a. would require an additional 1.0 mm thickness of lead to be used in the shielding of a dental CBCT operating at 90-120 kVp.
In some countries, the regulatory guidance additionally specifies, for different categories of equipment, the required thickness of lead that should be incorporated into the barriers of the room in order to achieve the constraint or the distance at which a member of staff could stand without exceeding a dose limit [3]. Unless the provisions for dental radiology have been updated
8 SEDENTEXCT D2.2 Report
recently to reflect the use of CBCTs, they are unlikely to provide sufficient protection.
1.5 Glossary
Air kerma
A physical quantity that measures the energy released by a beam of x-rays. Kerma stands for kinetic energy released per unit mass. The unit of measurement is the gray (Gy).
Ambient dose equivalent, H*(10)
A dose quantity used to demonstrate compliance with radiation protection requirements. It is indicative of the effective dose that a person would receive in a location. The unit of measurement is the sievert (Sv).
Design dose constraint
The dose used in the calculation of the shielding requirements for a radiological facility.
Isocentre
The point in space around which the x-ray tube rotates. The distance between the isocentre and the x-ray tube is constant.
Photon energy, keV
The energy of an individual x-ray photon is very small. It is typically quoted in kiloelectonvolts (keV) because the SI unit of energy, the joule, is too large. 1 keV = 1.6 x 10⁻¹⁶ joules. The more energy an x-ray photon has, the more easily it can penetrate through matter.
Tube current, mA
The tube current is an indicator of the amount of x-rays produced. It is measured in milliamperes, mA.
Tube potential, kVp
The energy of the x-rays produced by an x-ray tube is determined by the potential difference it uses. A tube potential of 120 kVp produces x-rays up to an energy of 120 keV.
9 SEDENTEXCT D2.2 Report
2. The Methodology In this section, the different methodologies that were used to gather information are described.
2.1 Measurements using PMMA or anthropomorphic phantoms
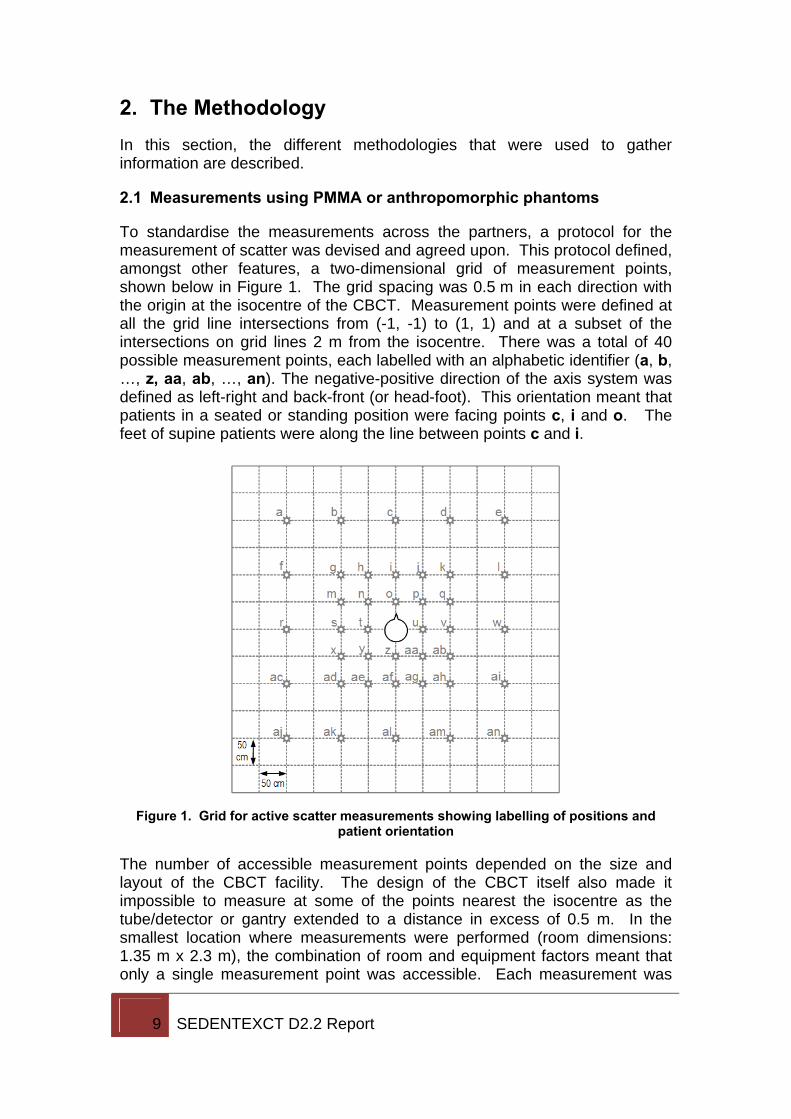
To standardise the measurements across the partners, a protocol for the measurement of scatter was devised and agreed upon. This protocol defined, amongst other features, a two-dimensional grid of measurement points, shown below in Figure 1. The grid spacing was 0.5 m in each direction with the origin at the isocentre of the CBCT. Measurement points were defined at all the grid line intersections from (-1, -1) to (1, 1) and at a subset of the intersections on grid lines 2 m from the isocentre. There was a total of 40 possible measurement points, each labelled with an alphabetic identifier (a, b, …, z, aa, ab, …, an). The negative-positive direction of the axis system was defined as left-right and back-front (or head-foot). This orientation meant that patients in a seated or standing position were facing points c, i and o. The feet of supine patients were along the line between points c and i.
Figure 1. Grid for active scatter measurements showing labelling of positions and
patient orientation
The number of accessible measurement points depended on the size and layout of the CBCT facility. The design of the CBCT itself also made it impossible to measure at some of the points nearest the isocentre as the tube/detector or gantry extended to a distance in excess of 0.5 m. In the smallest location where measurements were performed (room dimensions: 1.35 m x 2.3 m), the combination of room and equipment factors meant that only a single measurement point was accessible. Each measurement was
10 SEDENTEXCT D2.2 Report
performed three times at each point to reduce statistical variation and uncertainties in the positioning of equipment.
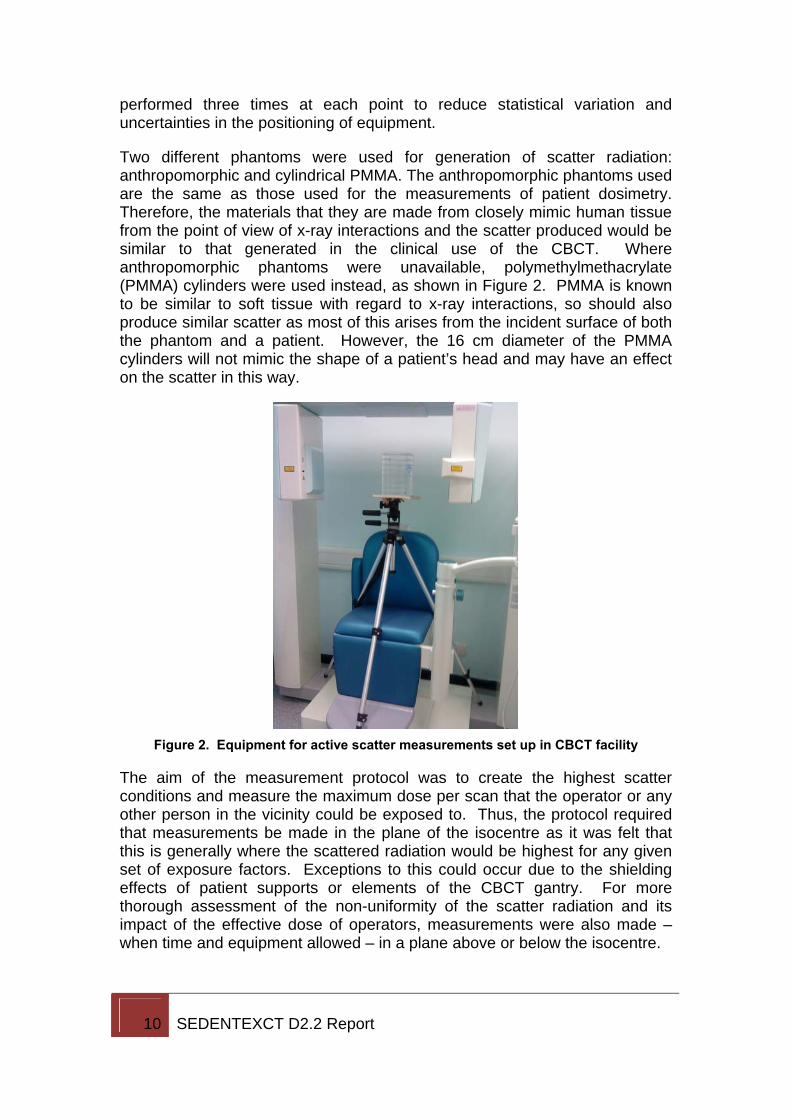
Two different phantoms were used for generation of scatter radiation: anthropomorphic and cylindrical PMMA. The anthropomorphic phantoms used are the same as those used for the measurements of patient dosimetry. Therefore, the materials that they are made from closely mimic human tissue from the point of view of x-ray interactions and the scatter produced would be similar to that generated in the clinical use of the CBCT. Where anthropomorphic phantoms were unavailable, polymethylmethacrylate (PMMA) cylinders were used instead, as shown in Figure 2. PMMA is known to be similar to soft tissue with regard to x-ray interactions, so should also produce similar scatter as most of this arises from the incident surface of both the phantom and a patient. However, the 16 cm diameter of the PMMA cylinders will not mimic the shape of a patient’s head and may have an effect on the scatter in this way.
Figure 2. Equipment for active scatter measurements set up in CBCT facility
The aim of the measurement protocol was to create the highest scatter conditions and measure the maximum dose per scan that the operator or any other person in the vicinity could be exposed to. Thus, the protocol required that measurements be made in the plane of the isocentre as it was felt that this is generally where the scattered radiation would be highest for any given set of exposure factors. Exceptions to this could occur due to the shielding effects of patient supports or elements of the CBCT gantry. For more thorough assessment of the non-uniformity of the scatter radiation and its impact of the effective dose of operators, measurements were also made – when time and equipment allowed – in a plane above or below the isocentre.
11 SEDENTEXCT D2.2 Report
Maximising the scatter was also a question of ensuring that the main x-ray beam encountered the phantom during as much of the rotation as possible. Therefore, the field of view was placed at the centre of the phantom when possible, even if the normal clinical placement would have been otherwise.
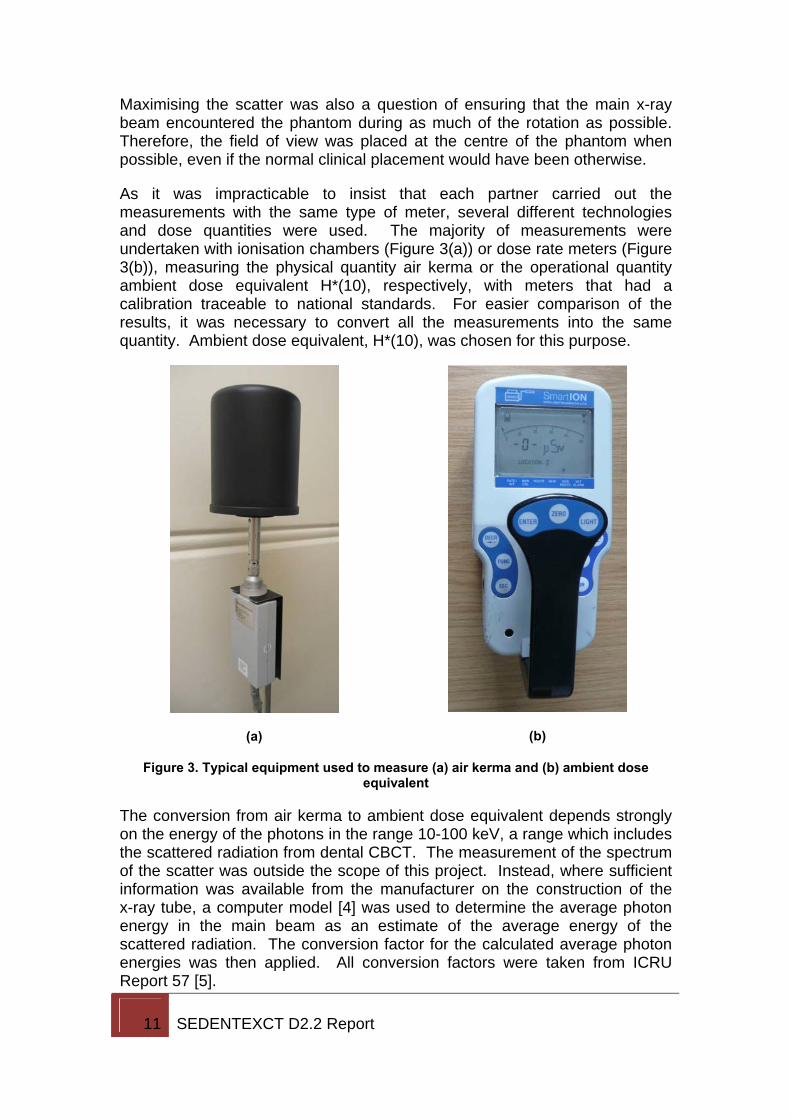
As it was impracticable to insist that each partner carried out the measurements with the same type of meter, several different technologies and dose quantities were used. The majority of measurements were undertaken with ionisation chambers (Figure 3(a)) or dose rate meters (Figure 3(b)), measuring the physical quantity air kerma or the operational quantity ambient dose equivalent H*(10), respectively, with meters that had a calibration traceable to national standards. For easier comparison of the results, it was necessary to convert all the measurements into the same quantity. Ambient dose equivalent, H*(10), was chosen for this purpose.
(a)
(b)
Figure 3. Typical equipment used to measure (a) air kerma and (b) ambient dose equivalent
The conversion from air kerma to ambient dose equivalent depends strongly on the energy of the photons in the range 10-100 keV, a range which includes the scattered radiation from dental CBCT. The measurement of the spectrum of the scatter was outside the scope of this project. Instead, where sufficient information was available from the manufacturer on the construction of the x-ray tube, a computer model [4] was used to determine the average photon energy in the main beam as an estimate of the average energy of the scattered radiation. The conversion factor for the calculated average photon energies was then applied. All conversion factors were taken from ICRU Report 57 [5].
12 SEDENTEXCT D2.2 Report
Wherever possible, the exposure settings (kV, mA, degree of rotation, time and field of view) were chosen to maximise the total radiation output of the CBCT, and thus maximise the scatter. This presented some challenges. Not all CBCT equipment allows manual control of certain parameters, e.g. mA. Other equipment limits the combinations of kV and mA or mA and time that are available. This meant that it was occasionally difficult to make an a priori determination of the combination of factors necessary to produce the greatest amount of scattered radiation. Furthermore, measurements of scatter were, in some cases, made simultaneously with those for patient dosimetry. This necessitated the use of clinically relevant exposure factors. Therefore, not all models of CBCT have had the maximum scatter per scan assessed. Where sufficient data has been available, an extrapolation has been made from the measured quantities to the maximum.
2.2 Passive measurements with thermoluminescent dosemeters
In addition to the active measurements of scatter, partners were provided with thermoluminescent dosemeters (TLD) to be placed in CBCT facilities for a period of up to two months. The advantage of the passive measurements was that they could be carried out during the clinical use of the CBCT. This gives an indication of how the average scatter in routine use might differ from the maximum exposure factors used for the active measurements.
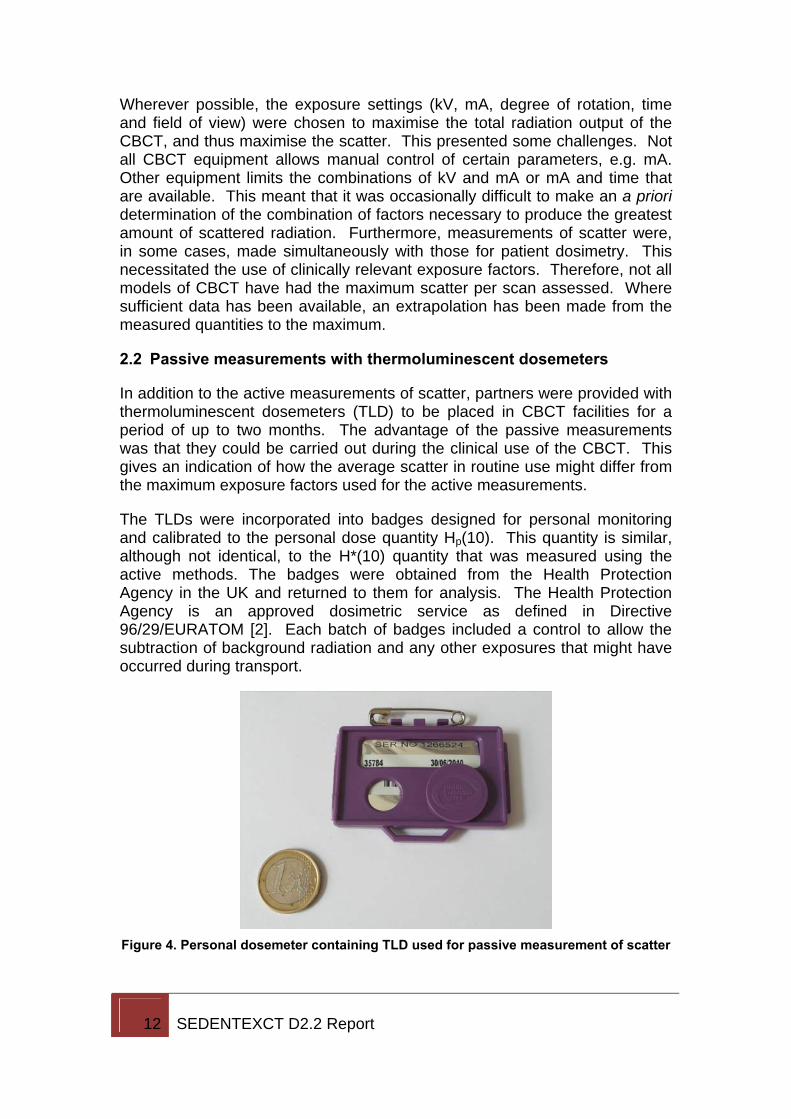
The TLDs were incorporated into badges designed for personal monitoring and calibrated to the personal dose quantity Hp(10). This quantity is similar, although not identical, to the H*(10) quantity that was measured using the active methods. The badges were obtained from the Health Protection Agency in the UK and returned to them for analysis. The Health Protection Agency is an approved dosimetric service as defined in Directive 96/29/EURATOM [2]. Each batch of badges included a control to allow the subtraction of background radiation and any other exposures that might have occurred during transport.
Figure 4. Personal dosemeter containing TLD used for passive measurement of scatter
13 SEDENTEXCT D2.2 Report
Badges were placed on the natural barriers in the facility, e.g. walls and ceiling, in each of the orthogonal directions: left, right, front, back, up. The dataset for the passive dosimetry included – along with the doses – the distances that the badges were placed from the isocentre; the length of time the badges were left in place and the number of exposures carried out while the badges were in place. In some locations, the exposure parameters for all of the exposures made during the monitoring period were also provided.
The number of locations where passive monitoring was carried out is necessarily smaller than the number of locations were active measurements of scatter were made. Passive dosimetry could only be done when CBCT examinations were the only source of ionising radiation in the room. In many locations other items of x-ray equipment, such as intra-oral tubes, were sited in the same room as the CBCT or the CBCT itself was capable of operating in other, e.g. panoramic or cephalometric, modes.
2.3 Workload
Partners were also asked to provide workload data for practices in their area. The locations from which this information was obtained are not necessarily the same as those where measurements were carried out, although there is a large degree of overlap between the two groups. At its simplest the workload can be represented by the average number of patients. However, there are other aspects that might influence the radiological protection requirements. If a large proportion of the workload is made up by paediatric patients, exposure parameters are likely to be set lower and the cumulative radiation exposure in the vicinity of the CBCT will be less than in a practice where only adults are seen.
14 SEDENTEXCT D2.2 Report
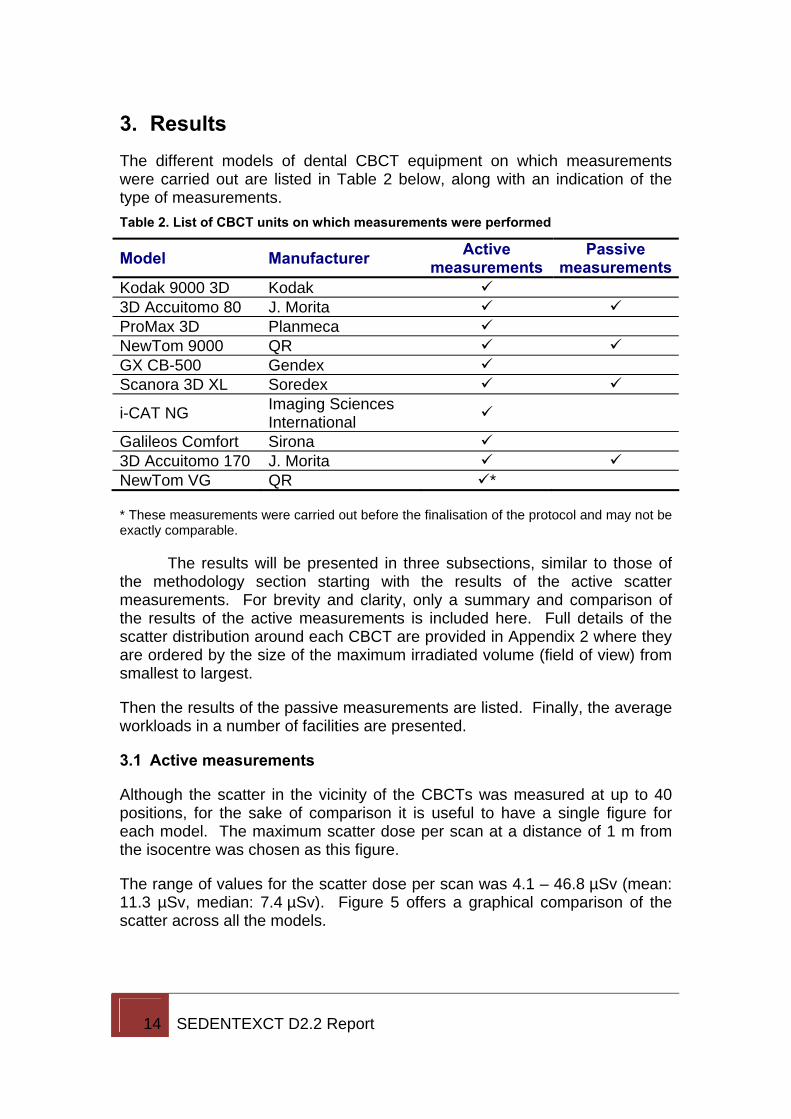
3. Results The different models of dental CBCT equipment on which measurements were carried out are listed in Table 2 below, along with an indication of the type of measurements. Table 2. List of CBCT units on which measurements were performed
Model Manufacturer Active measurements
Passive measurements
Kodak 9000 3D Kodak 3D Accuitomo 80 J. Morita ProMax 3D Planmeca NewTom 9000 QR GX CB-500 Gendex Scanora 3D XL Soredex
i-CAT NG Imaging Sciences International
Galileos Comfort Sirona 3D Accuitomo 170 J. Morita NewTom VG QR *
* These measurements were carried out before the finalisation of the protocol and may not be exactly comparable.
The results will be presented in three subsections, similar to those of the methodology section starting with the results of the active scatter measurements. For brevity and clarity, only a summary and comparison of the results of the active measurements is included here. Full details of the scatter distribution around each CBCT are provided in Appendix 2 where they are ordered by the size of the maximum irradiated volume (field of view) from smallest to largest.
Then the results of the passive measurements are listed. Finally, the average workloads in a number of facilities are presented.
3.1 Active measurements
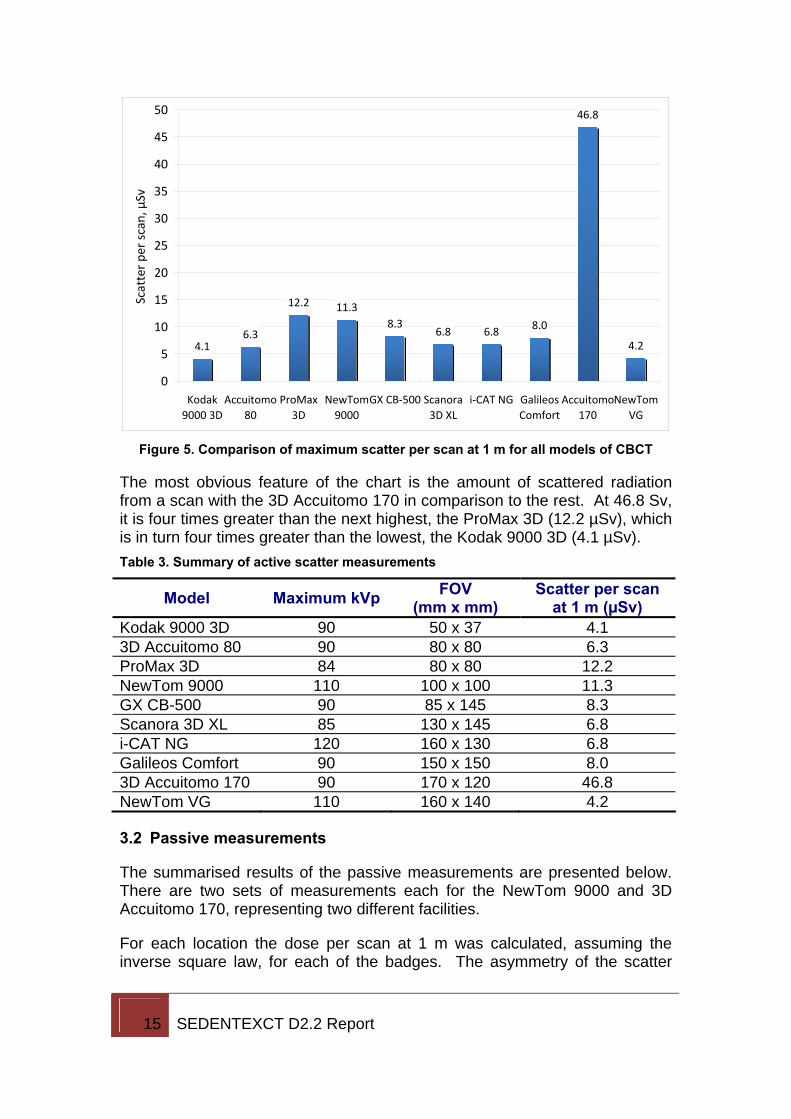
Although the scatter in the vicinity of the CBCTs was measured at up to 40 positions, for the sake of comparison it is useful to have a single figure for each model. The maximum scatter dose per scan at a distance of 1 m from the isocentre was chosen as this figure.
The range of values for the scatter dose per scan was 4.1 – 46.8 µSv (mean: 11.3 µSv, median: 7.4 µSv). Figure 5 offers a graphical comparison of the scatter across all the models.
15 SEDENTEXCT D2.2 Report
4.16.3
12.2 11.38.3
6.8 6.8 8.0
46.8
4.2
0
5
10
15
20
25
30
35
40
45
50
Kodak9000 3D
Accuitomo80
ProMax3D
NewTom9000
GX CB‐500 Scanora3D XL
i‐CAT NG GalileosComfort
Accuitomo170
NewTomVG
Scatter pe
r scan, µ
Sv
Figure 5. Comparison of maximum scatter per scan at 1 m for all models of CBCT
The most obvious feature of the chart is the amount of scattered radiation from a scan with the 3D Accuitomo 170 in comparison to the rest. At 46.8 Sv, it is four times greater than the next highest, the ProMax 3D (12.2 µSv), which is in turn four times greater than the lowest, the Kodak 9000 3D (4.1 µSv). Table 3. Summary of active scatter measurements
Model Maximum kVp FOV (mm x mm)
Scatter per scan at 1 m (µSv)
Kodak 9000 3D 90 50 x 37 4.1 3D Accuitomo 80 90 80 x 80 6.3 ProMax 3D 84 80 x 80 12.2 NewTom 9000 110 100 x 100 11.3 GX CB-500 90 85 x 145 8.3 Scanora 3D XL 85 130 x 145 6.8 i-CAT NG 120 160 x 130 6.8 Galileos Comfort 90 150 x 150 8.0 3D Accuitomo 170 90 170 x 120 46.8 NewTom VG 110 160 x 140 4.2
3.2 Passive measurements
The summarised results of the passive measurements are presented below. There are two sets of measurements each for the NewTom 9000 and 3D Accuitomo 170, representing two different facilities.
For each location the dose per scan at 1 m was calculated, assuming the inverse square law, for each of the badges. The asymmetry of the scatter
16 SEDENTEXCT D2.2 Report
distribution meant that there was some variation in the outcome of these calculations. In the tables below, the quoted dose per scan is the maximum.
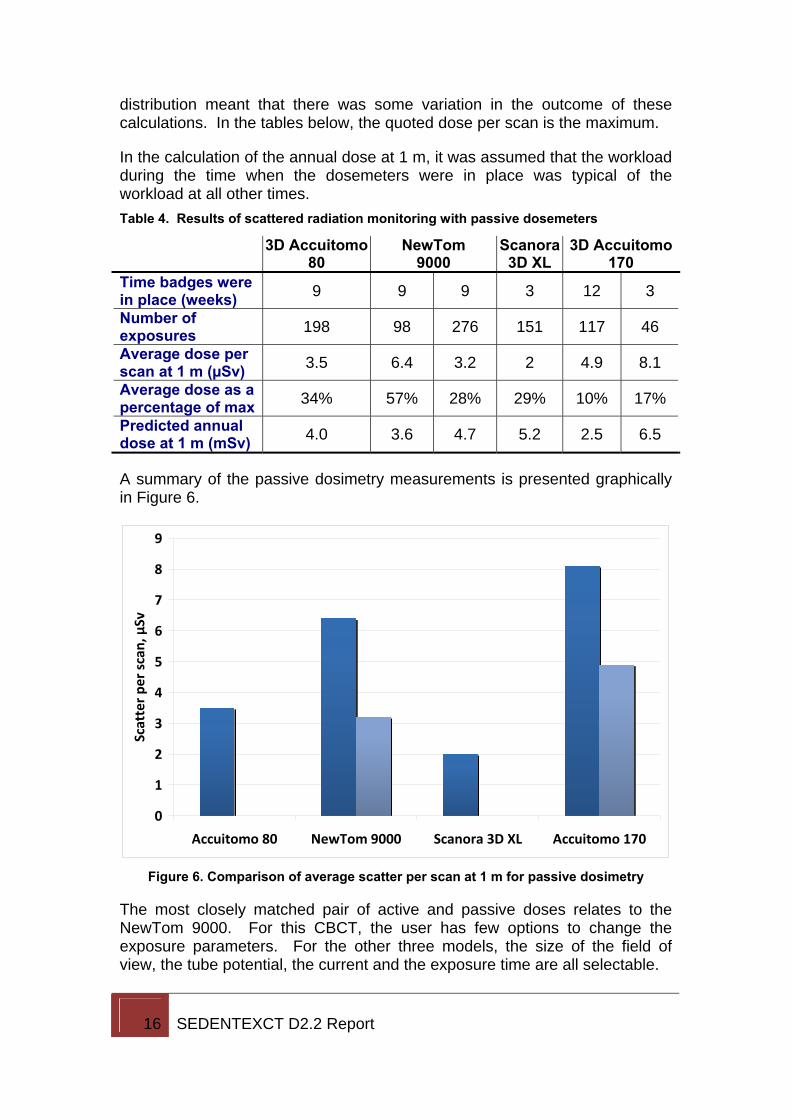
In the calculation of the annual dose at 1 m, it was assumed that the workload during the time when the dosemeters were in place was typical of the workload at all other times. Table 4. Results of scattered radiation monitoring with passive dosemeters
3D Accuitomo 80
NewTom 9000
Scanora 3D XL
3D Accuitomo 170
Time badges were in place (weeks) 9 9 9 3 12 3
Number of exposures 198 98 276 151 117 46
Average dose per scan at 1 m (µSv) 3.5 6.4 3.2 2 4.9 8.1
Average dose as a percentage of max 34% 57% 28% 29% 10% 17%
Predicted annual dose at 1 m (mSv) 4.0 3.6 4.7 5.2 2.5 6.5
A summary of the passive dosimetry measurements is presented graphically in Figure 6.
0
1
2
3
4
5
6
7
8
9
Accuitomo 80 NewTom 9000 Scanora 3D XL Accuitomo 170
Scatter pe
r scan
, µSv
Figure 6. Comparison of average scatter per scan at 1 m for passive dosimetry
The most closely matched pair of active and passive doses relates to the NewTom 9000. For this CBCT, the user has few options to change the exposure parameters. For the other three models, the size of the field of view, the tube potential, the current and the exposure time are all selectable.
17 SEDENTEXCT D2.2 Report
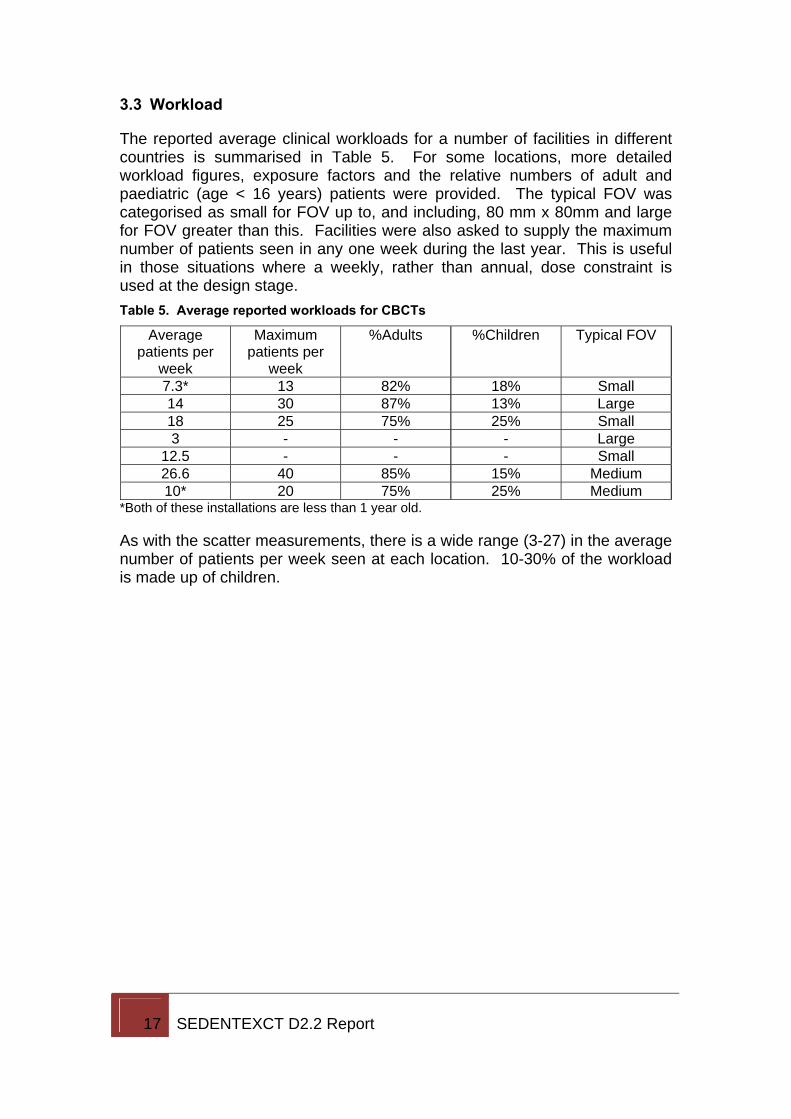
3.3 Workload
The reported average clinical workloads for a number of facilities in different countries is summarised in Table 5. For some locations, more detailed workload figures, exposure factors and the relative numbers of adult and paediatric (age < 16 years) patients were provided. The typical FOV was categorised as small for FOV up to, and including, 80 mm x 80mm and large for FOV greater than this. Facilities were also asked to supply the maximum number of patients seen in any one week during the last year. This is useful in those situations where a weekly, rather than annual, dose constraint is used at the design stage. Table 5. Average reported workloads for CBCTs
Average patients per
week
Maximum patients per
week
%Adults %Children Typical FOV
7.3* 13 82% 18% Small 14 30 87% 13% Large 18 25 75% 25% Small 3 - - - Large
12.5 - - - Small 26.6 40 85% 15% Medium 10* 20 75% 25% Medium
*Both of these installations are less than 1 year old.
As with the scatter measurements, there is a wide range (3-27) in the average number of patients per week seen at each location. 10-30% of the workload is made up of children.
18 SEDENTEXCT D2.2 Report
4. Discussion There are many factors that affect the radiation output of a CBCT and hence the amount of scatter that is produced. Some of the main ones are considered below.
4.1 Field of view, FOV
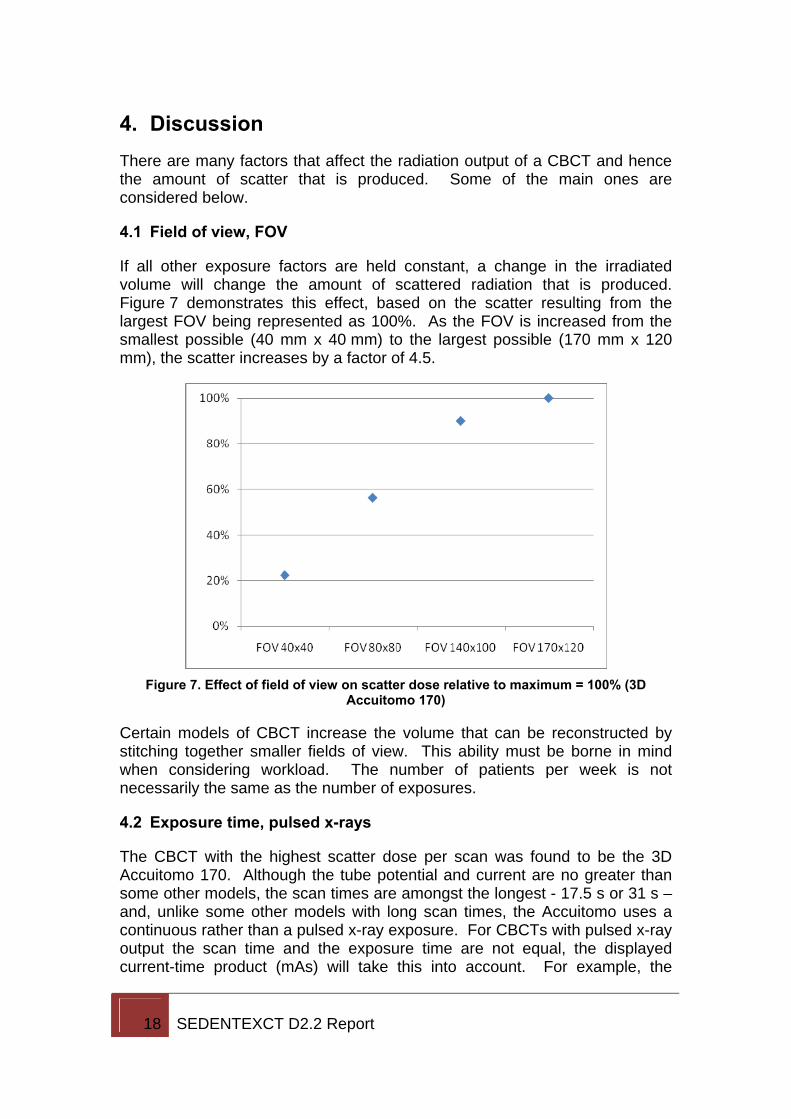
If all other exposure factors are held constant, a change in the irradiated volume will change the amount of scattered radiation that is produced. Figure 7 demonstrates this effect, based on the scatter resulting from the largest FOV being represented as 100%. As the FOV is increased from the smallest possible (40 mm x 40 mm) to the largest possible (170 mm x 120 mm), the scatter increases by a factor of 4.5.
Figure 7. Effect of field of view on scatter dose relative to maximum = 100% (3D
Accuitomo 170)
Certain models of CBCT increase the volume that can be reconstructed by stitching together smaller fields of view. This ability must be borne in mind when considering workload. The number of patients per week is not necessarily the same as the number of exposures.
4.2 Exposure time, pulsed x-rays
The CBCT with the highest scatter dose per scan was found to be the 3D Accuitomo 170. Although the tube potential and current are no greater than some other models, the scan times are amongst the longest - 17.5 s or 31 s – and, unlike some other models with long scan times, the Accuitomo uses a continuous rather than a pulsed x-ray exposure. For CBCTs with pulsed x-ray output the scan time and the exposure time are not equal, the displayed current-time product (mAs) will take this into account. For example, the
19 SEDENTEXCT D2.2 Report
displayed current-time product for a 23 s, 5 mA exposure on the GX CB-500 is 57.06 mAs.
Perhaps related to the high x-ray output of the 3D Accuitomo 170, the unit requires a minimum delay of 15 minutes after every four exposures. This type of delay is also a feature of the NewTom 9000 – it requires 15-20 minutes after every 5-6 exposures. While these enforced pauses may reduce the rate at which exposures can be carried out during quality assurance testing or dosimetric assessment, they are unlikely to limit the clinical workload.
4.3 Degree of rotation
While many of the CBCTs included in this report irradiate through a full 360° rotation some, such as the ProMax 3D, expose only for part of a rotation. In the case of the ProMax 3D the irradiation occurs over 200°. By looking at the maximum value at 1 m in any direction, the scatter dose per scan of this CBCT may be higher than might otherwise be expected, e.g. by comparison with the patient dose.
The user has the choice of two different starting positions for the scan, oriented at 90° to each other. This causes an asymmetry in the distribution of the scatter. Although scatter at diagnostic x-ray energies is produced isotropically, the majority of scatter that will be measured is back in the direction of the x-ray tube since scatter in the forward direction will be further attenuated by the phantom. Since the materials used to construct the tube housing are designed to be highly absorbing of radiation to reduce x-ray emission in unwanted directions, in practice the greatest scatter would be measured around the edges (sides and bottom) of the tube.
It could be possible to reduce the amount of shielding required around this design of CBCT through careful positioning; orienting the equipment so that the zone of minimum scatter coincides with the area where an individual might otherwise be exposed to the highest doses, e.g. the operator position.
4.4 Scatter dose above plane of isocentre
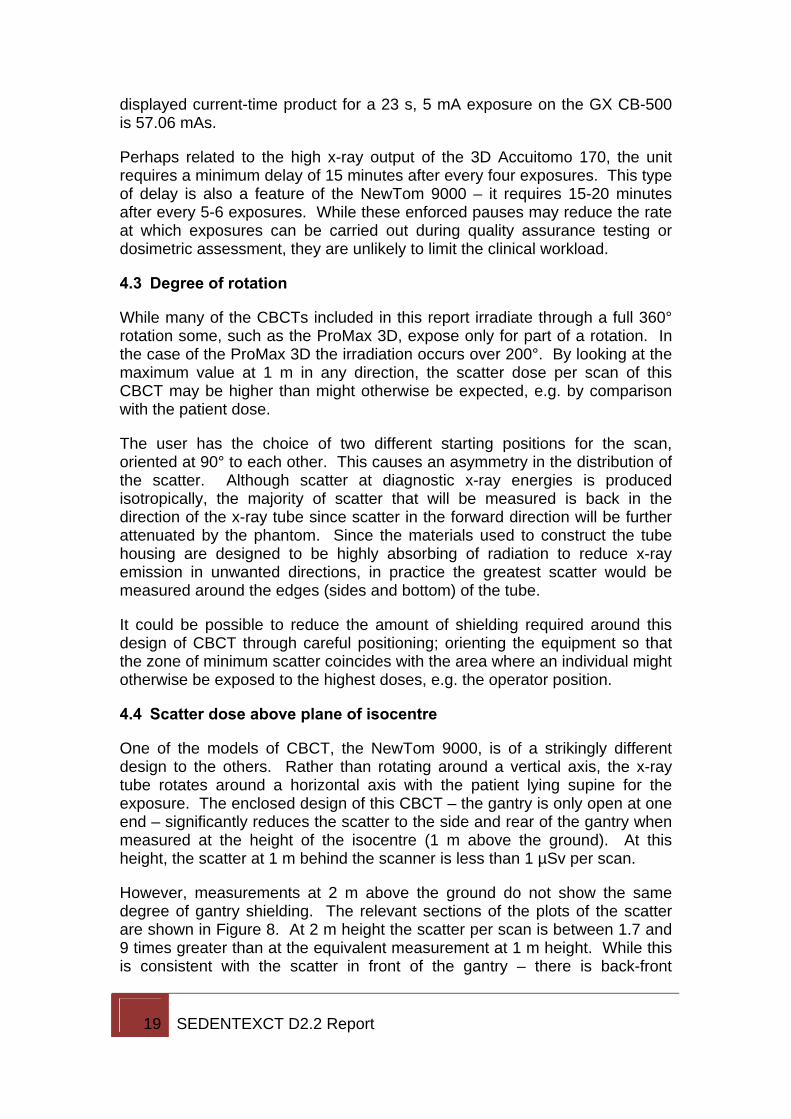
One of the models of CBCT, the NewTom 9000, is of a strikingly different design to the others. Rather than rotating around a vertical axis, the x-ray tube rotates around a horizontal axis with the patient lying supine for the exposure. The enclosed design of this CBCT – the gantry is only open at one end – significantly reduces the scatter to the side and rear of the gantry when measured at the height of the isocentre (1 m above the ground). At this height, the scatter at 1 m behind the scanner is less than 1 µSv per scan.
However, measurements at 2 m above the ground do not show the same degree of gantry shielding. The relevant sections of the plots of the scatter are shown in Figure 8. At 2 m height the scatter per scan is between 1.7 and 9 times greater than at the equivalent measurement at 1 m height. While this is consistent with the scatter in front of the gantry – there is back-front
20 SEDENTEXCT D2.2 Report
symmetry – it would not necessarily be expected from a survey of the scatter carried out in the plane of the isocentre.
-1 -0.5 0 0.5 1
0 2.4 t u 3.0
-0.5 0.8 0.5 0.2 0.5 1.0
-1 ad ae af ag ah
(a)
-1 -0.5 0 0.5 1
0 4.7 t u 5.2
-0.5 4.2 4.0 0.5 4.5 4.5
-1 ad ae af ag ah
(b) Figure 8. Comparison of scatter at 1 m (isocentre height) and 2 m from the ground at
the rear and sides of the NewTom 9000
In comparison, the 3D Accuitomo 170 which, like all of the Accuitomo models, has a support structure above the position of the patient’s head produces scatter per scan at 1 m directly above the isocentre of only 7% of the scatter produced at 1 m in front of the isocentre.
21 SEDENTEXCT D2.2 Report
5. Implications for staff and structural protection CBCTs are capable of producing fairly substantial levels of scattered radiation when compared with previous dental radiology equipment. Furthermore, different models produce significantly different levels of radiation. Even when choosing the maximum exposure parameters for each CBCT the scattered radiation dose at 1 m ranged from 4.1 µSv to 46.8 µSv – a difference of a factor of 10 between the lowest and highest.
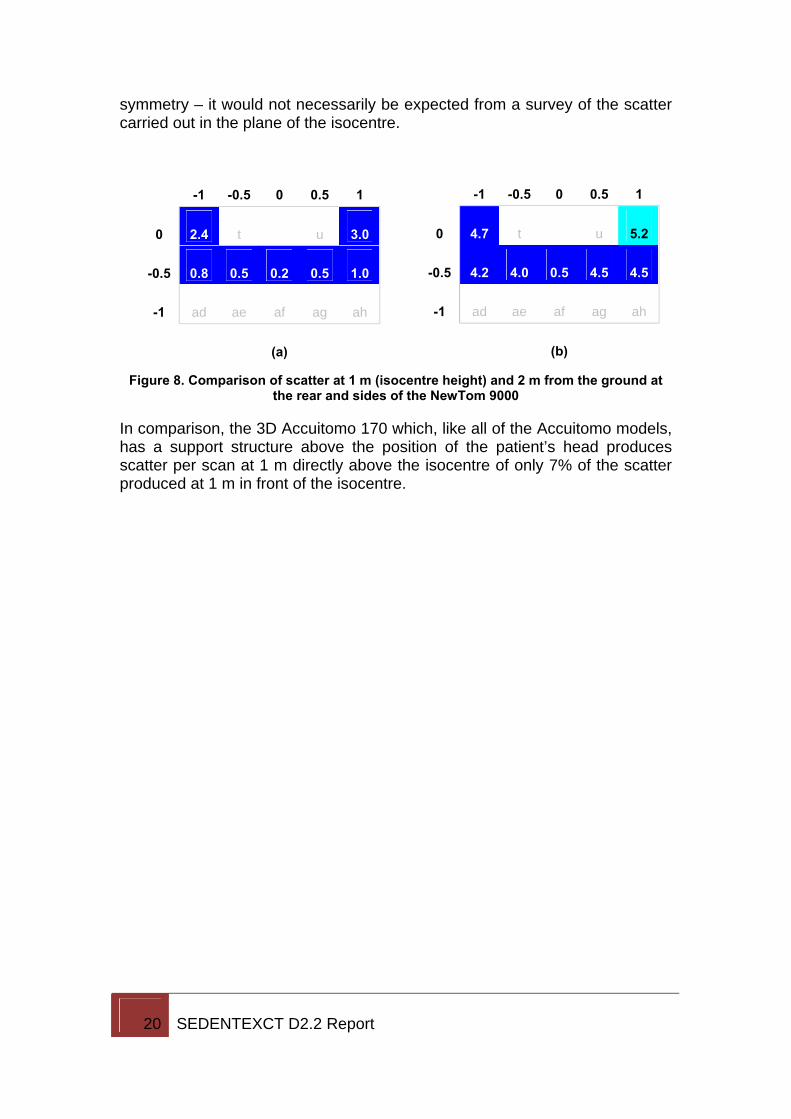
The minimum numbers of exposures necessary to achieve a cumulative annual dose of more than 1 mSv at 1 m are presented in Table 6. Even the largest of these represents a workload of fewer than five exposures per week. Table 6. Minimum number of exposures required to reach a dose of 1 mSv at 1 m.
Model Number of exposures per week
Kodak 9000 3D 4.7 3D Accuitomo 80 3.1 ProMax 3D 1.6 NewTom 9000 2.0 GX CB-500 2.3 Scanora 3D XL 2.8 i-CAT NG 2.8 Galileos Comfort 2.4 3D Accuitomo 170 0.5 NewTom VG 4.6
5.1 Distance
Given the values in Table 6, it is unlikely that distance alone will provide sufficient protection from scattered radiation in the vicinity of the CBCT, despite the inverse square relationship between radiation exposure and distance.
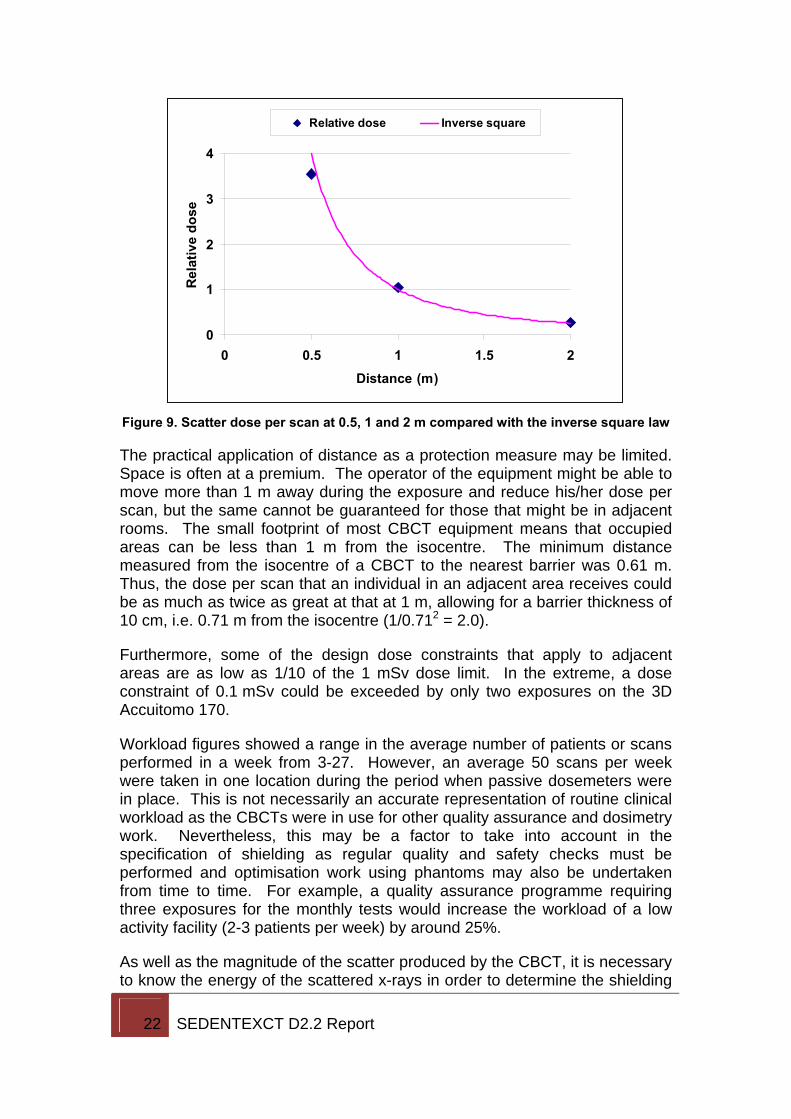
Strictly, the inverse square law only applies to radiation emitted from a small (point) source rather than the much more complex geometry of a CBCT where the scattered radiation is produced from an extended source around the isocentre. However, it was found during the active scatter measurements that the scatter were reasonably described by the inverse square law, at least for those designs of equipment where the patient is standing or seated. An example from one set of measurements (ProMax 3D) is given in Figure 9.
22 SEDENTEXCT D2.2 Report
0
1
2
3
4
0 0.5 1 1.5 2Distance (m)
Rel
ativ
e do
se
Relative dose Inverse square
Figure 9. Scatter dose per scan at 0.5, 1 and 2 m compared with the inverse square law
The practical application of distance as a protection measure may be limited. Space is often at a premium. The operator of the equipment might be able to move more than 1 m away during the exposure and reduce his/her dose per scan, but the same cannot be guaranteed for those that might be in adjacent rooms. The small footprint of most CBCT equipment means that occupied areas can be less than 1 m from the isocentre. The minimum distance measured from the isocentre of a CBCT to the nearest barrier was 0.61 m. Thus, the dose per scan that an individual in an adjacent area receives could be as much as twice as great at that at 1 m, allowing for a barrier thickness of 10 cm, i.e. 0.71 m from the isocentre (1/0.712 = 2.0).
Furthermore, some of the design dose constraints that apply to adjacent areas are as low as 1/10 of the 1 mSv dose limit. In the extreme, a dose constraint of 0.1 mSv could be exceeded by only two exposures on the 3D Accuitomo 170.
Workload figures showed a range in the average number of patients or scans performed in a week from 3-27. However, an average 50 scans per week were taken in one location during the period when passive dosemeters were in place. This is not necessarily an accurate representation of routine clinical workload as the CBCTs were in use for other quality assurance and dosimetry work. Nevertheless, this may be a factor to take into account in the specification of shielding as regular quality and safety checks must be performed and optimisation work using phantoms may also be undertaken from time to time. For example, a quality assurance programme requiring three exposures for the monthly tests would increase the workload of a low activity facility (2-3 patients per week) by around 25%.
As well as the magnitude of the scatter produced by the CBCT, it is necessary to know the energy of the scattered x-rays in order to determine the shielding
23 SEDENTEXCT D2.2 Report
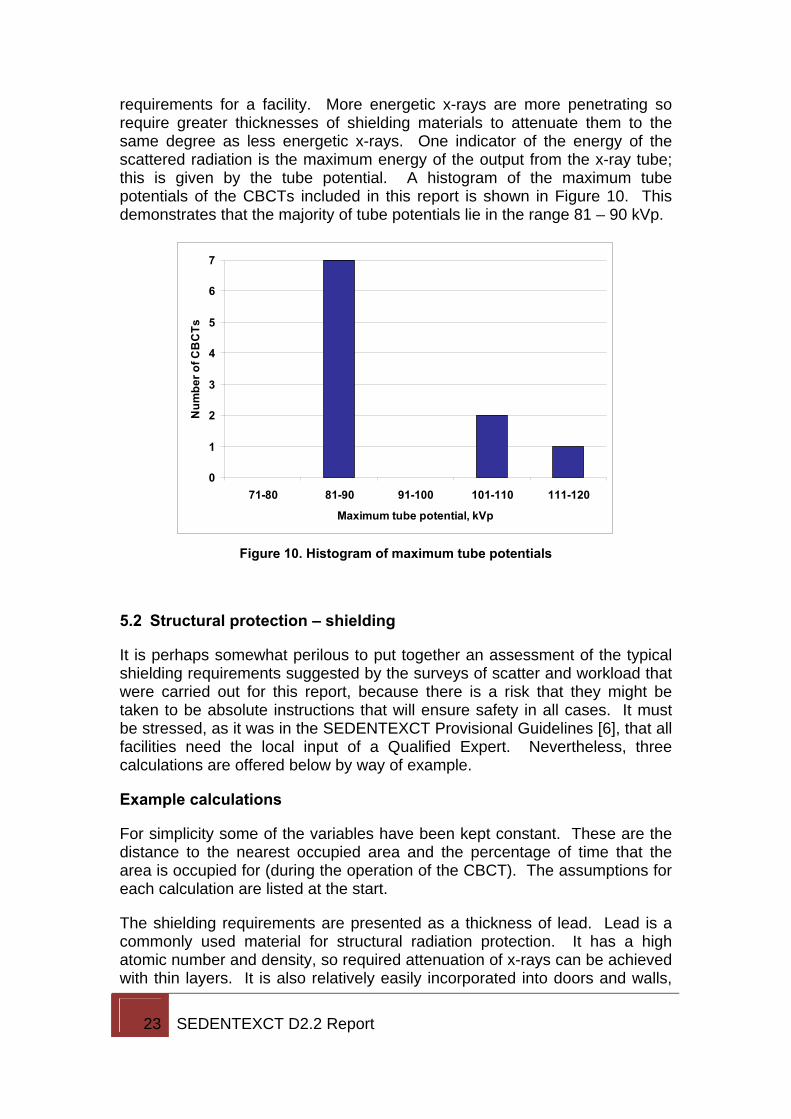
requirements for a facility. More energetic x-rays are more penetrating so require greater thicknesses of shielding materials to attenuate them to the same degree as less energetic x-rays. One indicator of the energy of the scattered radiation is the maximum energy of the output from the x-ray tube; this is given by the tube potential. A histogram of the maximum tube potentials of the CBCTs included in this report is shown in Figure 10. This demonstrates that the majority of tube potentials lie in the range 81 – 90 kVp.
0
1
2
3
4
5
6
7
71-80 81-90 91-100 101-110 111-120
Maximum tube potential, kVp
Num
ber o
f CB
CTs
Figure 10. Histogram of maximum tube potentials
5.2 Structural protection – shielding
It is perhaps somewhat perilous to put together an assessment of the typical shielding requirements suggested by the surveys of scatter and workload that were carried out for this report, because there is a risk that they might be taken to be absolute instructions that will ensure safety in all cases. It must be stressed, as it was in the SEDENTEXCT Provisional Guidelines [6], that all facilities need the local input of a Qualified Expert. Nevertheless, three calculations are offered below by way of example.
Example calculations
For simplicity some of the variables have been kept constant. These are the distance to the nearest occupied area and the percentage of time that the area is occupied for (during the operation of the CBCT). The assumptions for each calculation are listed at the start.
The shielding requirements are presented as a thickness of lead. Lead is a commonly used material for structural radiation protection. It has a high atomic number and density, so required attenuation of x-rays can be achieved with thin layers. It is also relatively easily incorporated into doors and walls,
24 SEDENTEXCT D2.2 Report
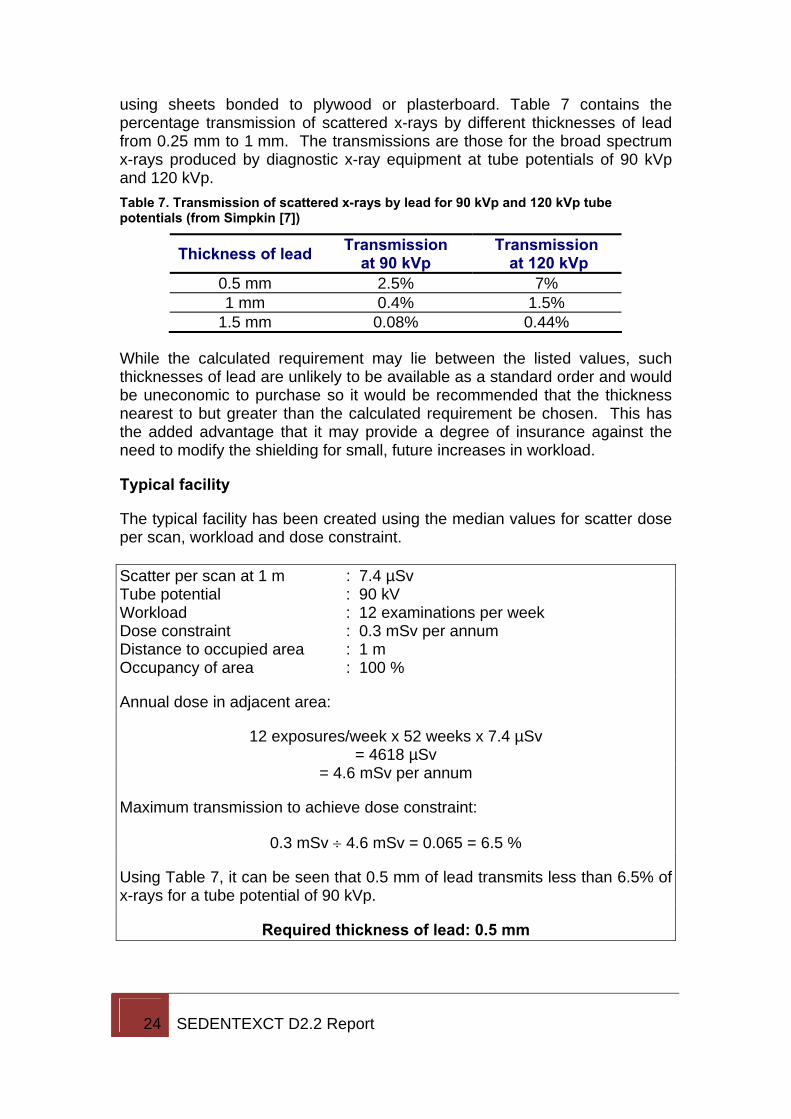
using sheets bonded to plywood or plasterboard. Table 7 contains the percentage transmission of scattered x-rays by different thicknesses of lead from 0.25 mm to 1 mm. The transmissions are those for the broad spectrum x-rays produced by diagnostic x-ray equipment at tube potentials of 90 kVp and 120 kVp. Table 7. Transmission of scattered x-rays by lead for 90 kVp and 120 kVp tube potentials (from Simpkin [7])
Thickness of lead Transmission at 90 kVp
Transmission at 120 kVp
0.5 mm 2.5% 7% 1 mm 0.4% 1.5%
1.5 mm 0.08% 0.44%
While the calculated requirement may lie between the listed values, such thicknesses of lead are unlikely to be available as a standard order and would be uneconomic to purchase so it would be recommended that the thickness nearest to but greater than the calculated requirement be chosen. This has the added advantage that it may provide a degree of insurance against the need to modify the shielding for small, future increases in workload.
Typical facility
The typical facility has been created using the median values for scatter dose per scan, workload and dose constraint. Scatter per scan at 1 m : 7.4 µSv Tube potential : 90 kV Workload : 12 examinations per week Dose constraint : 0.3 mSv per annum Distance to occupied area : 1 m Occupancy of area : 100 %
Annual dose in adjacent area:
12 exposures/week x 52 weeks x 7.4 µSv = 4618 µSv
= 4.6 mSv per annum
Maximum transmission to achieve dose constraint:
0.3 mSv ÷ 4.6 mSv = 0.065 = 6.5 %
Using Table 7, it can be seen that 0.5 mm of lead transmits less than 6.5% of x-rays for a tube potential of 90 kVp.
Required thickness of lead: 0.5 mm
25 SEDENTEXCT D2.2 Report
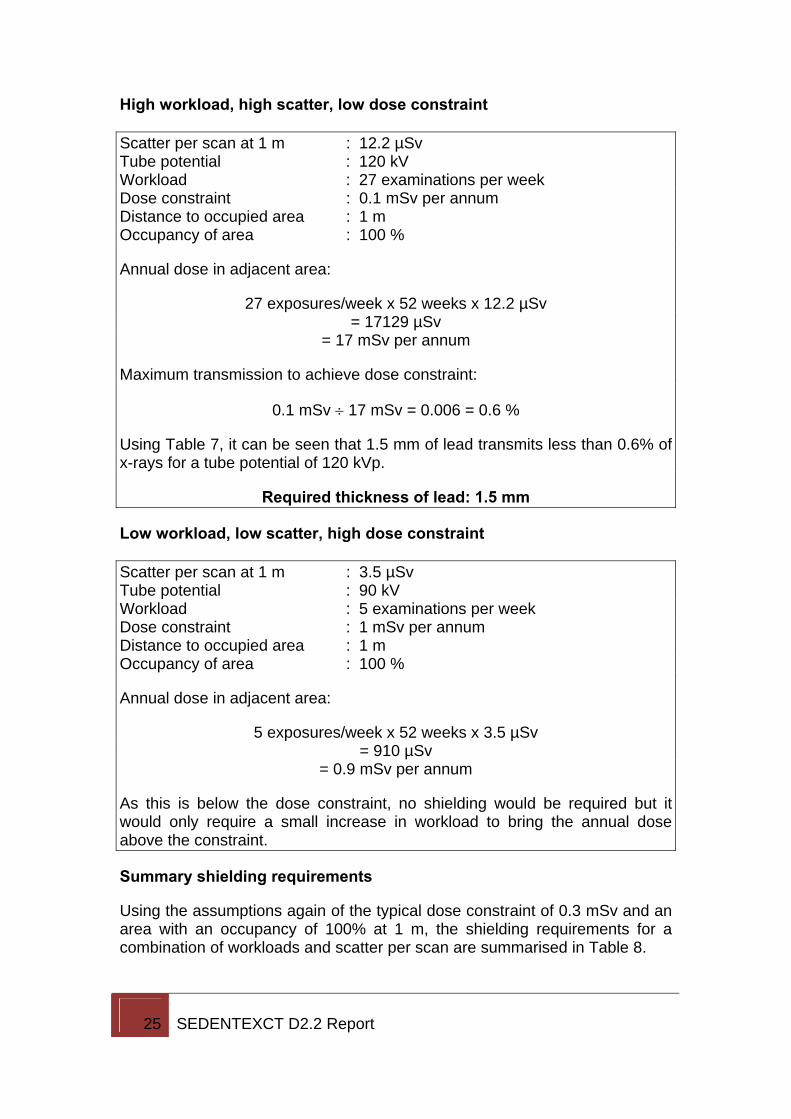
High workload, high scatter, low dose constraint Scatter per scan at 1 m : 12.2 µSv Tube potential : 120 kV Workload : 27 examinations per week Dose constraint : 0.1 mSv per annum Distance to occupied area : 1 m Occupancy of area : 100 %
Annual dose in adjacent area:
27 exposures/week x 52 weeks x 12.2 µSv = 17129 µSv
= 17 mSv per annum
Maximum transmission to achieve dose constraint:
0.1 mSv ÷ 17 mSv = 0.006 = 0.6 %
Using Table 7, it can be seen that 1.5 mm of lead transmits less than 0.6% of x-rays for a tube potential of 120 kVp.
Required thickness of lead: 1.5 mm
Low workload, low scatter, high dose constraint Scatter per scan at 1 m : 3.5 µSv Tube potential : 90 kV Workload : 5 examinations per week Dose constraint : 1 mSv per annum Distance to occupied area : 1 m Occupancy of area : 100 %
Annual dose in adjacent area:
5 exposures/week x 52 weeks x 3.5 µSv = 910 µSv
= 0.9 mSv per annum
As this is below the dose constraint, no shielding would be required but it would only require a small increase in workload to bring the annual dose above the constraint.
Summary shielding requirements
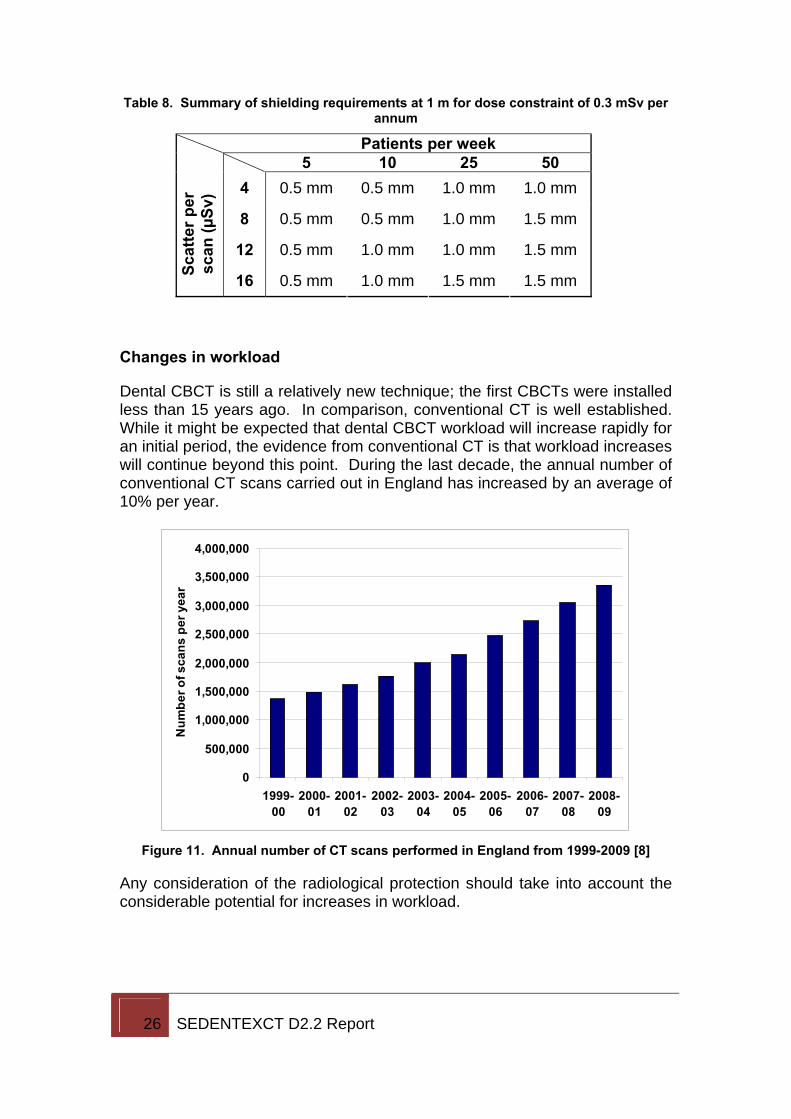
Using the assumptions again of the typical dose constraint of 0.3 mSv and an area with an occupancy of 100% at 1 m, the shielding requirements for a combination of workloads and scatter per scan are summarised in Table 8.
26 SEDENTEXCT D2.2 Report
Table 8. Summary of shielding requirements at 1 m for dose constraint of 0.3 mSv per annum
Patients per week 5 10 25 50
4 0.5 mm 0.5 mm 1.0 mm 1.0 mm
8 0.5 mm 0.5 mm 1.0 mm 1.5 mm
12 0.5 mm 1.0 mm 1.0 mm 1.5 mm
Scat
ter p
er
scan
(µSv
)
16 0.5 mm 1.0 mm 1.5 mm 1.5 mm
Changes in workload
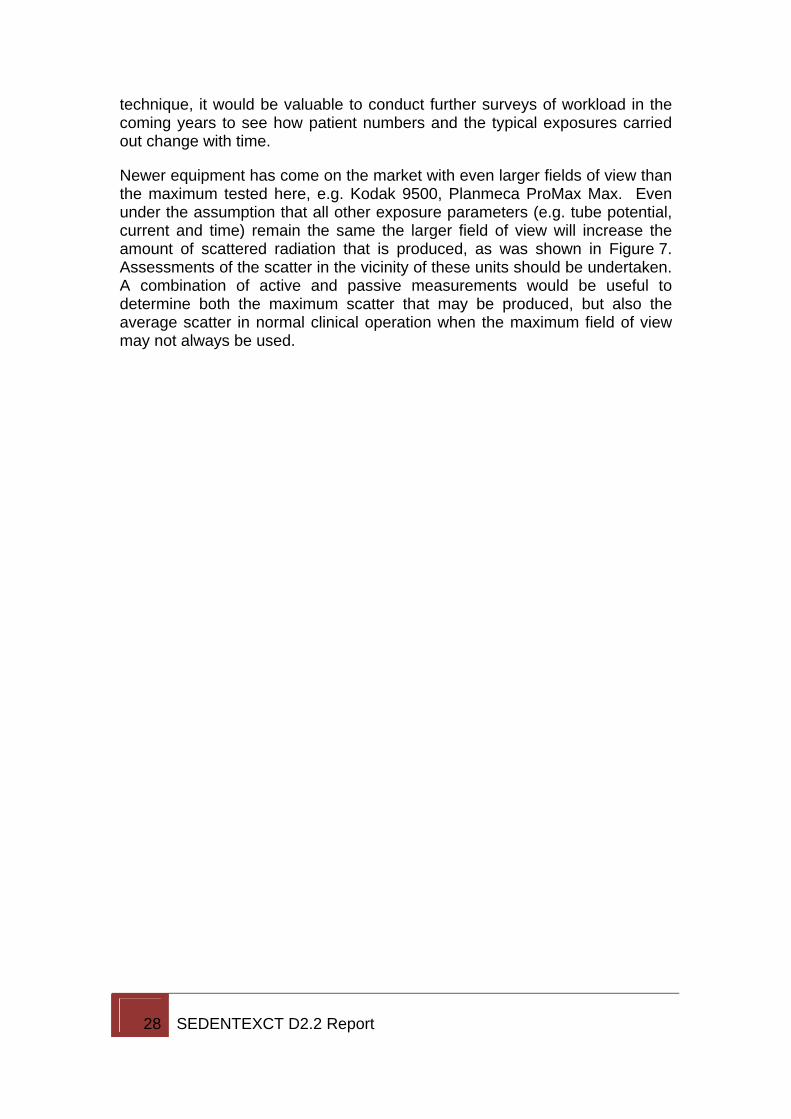
Dental CBCT is still a relatively new technique; the first CBCTs were installed less than 15 years ago. In comparison, conventional CT is well established. While it might be expected that dental CBCT workload will increase rapidly for an initial period, the evidence from conventional CT is that workload increases will continue beyond this point. During the last decade, the annual number of conventional CT scans carried out in England has increased by an average of 10% per year.
0
500,000
1,000,000
1,500,000
2,000,000
2,500,000
3,000,000
3,500,000
4,000,000
1999-00
2000-01
2001-02
2002-03
2003-04
2004-05
2005-06
2006-07
2007-08
2008-09
Num
ber o
f sca
ns p
er y
ear
Figure 11. Annual number of CT scans performed in England from 1999-2009 [8]
Any consideration of the radiological protection should take into account the considerable potential for increases in workload.

27 SEDENTEXCT D2.2 Report
6. Conclusions The scatter produced by dental CBCT has been demonstrated to be higher than that of conventional (intra-oral and panoramic) dental radiology techniques. The maximum amount of scatter per scan that can be produced by different models of CBCT covered a wide range from 4.1 µSv to 46.8 µSv. With such variability in the levels of radiation exposure in the vicinity of CBCTs it should be stressed that a qualified expert must be consulted in relation to the radiological protection requirements. Lead shielding up to 1.5 mm thickness may be needed in medium to high workload facilities and possibly in excess of this for facilities where the CBCT is in continuous use during a full working day or there are occupied areas within 1 m of the CBCT.
6.1 Current recommendations
• For all but the lowest of workloads on CBCTs with low amounts of scatter, distance will not provide sufficient protection for either the operator or adjacent areas.
• When designing a CBCT facility, it would be advantageous to base radiological protection requirements on assumptions of maximum scatter and double the initial workload projections to reduce the likelihood that additional shielding or other control measures will need to be introduced during the lifetime of the CBCT.
• It would be very helpful if manufacturers made information on scatter widely available in a consistent format.
• After installation, a qualified expert should carry out assessment of the scatter produced by the CBCT and confirm that the design is appropriate.
• CBCT installations should be subject to regular survey with passive dosemeters to assess average doses. The timescale for carrying out such surveys can be determined by monitoring exposure logs to look for increases in workload.
6.2 Further and future work
Workload is likely to increase as equipment becomes more widely available and more people are trained in the interpretation of the images. The majority of the facilities from which workload data was obtained were relatively recent installations so it is difficult to predict where future workloads may peak. Even a modest increase of 10% per annum (such as that currently seen in conventional CT) would see a doubling of workload in 7 years, within the expected lifetime of a CBCT. A sustained annual increase in workload of 25% would see the number of patients increase by a factor of 5 in the same period. As we are still at a stage when dental CBCT is a relatively new and evolving
28 SEDENTEXCT D2.2 Report
technique, it would be valuable to conduct further surveys of workload in the coming years to see how patient numbers and the typical exposures carried out change with time.
Newer equipment has come on the market with even larger fields of view than the maximum tested here, e.g. Kodak 9500, Planmeca ProMax Max. Even under the assumption that all other exposure parameters (e.g. tube potential, current and time) remain the same the larger field of view will increase the amount of scattered radiation that is produced, as was shown in Figure 7. Assessments of the scatter in the vicinity of these units should be undertaken. A combination of active and passive measurements would be useful to determine both the maximum scatter that may be produced, but also the average scatter in normal clinical operation when the maximum field of view may not always be used.
29 SEDENTEXCT D2.2 Report
7. References [1] Council of the European Union Council Directive 97/43/Euratom of 30 June 1997 on health protection of individuals against the dangers of ionizing radiation in relation to medical exposure. Available from: http://ec.europa.eu/energy/nuclear/radioprotection/doc/legislation/9743_en.pdf (last accessed 22 July 2010).
[2] Council Directive 96/29/Euratom of 13 May 1996 laying down basic safety standards for the protection of the health of workers and the general public against the dangers arising from ionizing radiation. Available from: http://ec.europa.eu/energy/nuclear/radioprotection/doc/legislation/9629_en.pdf (last accessed 22 July 2010).
[3] National Radiological Protection Board. Guidance Notes for Dental Practitioners on the Safe Use of X-Ray Equipment. 2001. Available from: http://www.hpa.org.uk/web/HPAwebFile/HPAweb_C/1194947310610 (last accessed 22 July 2010).
[4] Cranley K, Gilmore BJ, Fogarty GWA and Desponds L. Electronic format by D Sutton. IPEM Report 78: Catalogue of diagnostic X-ray spectra and other data, 1997. Institute of Physics and Engineering in Medicine.
[5] International Commission on Radiation Units and Measurements. ICRU Report 57. Conversion coefficients for use in radiological protection against external radiation. 1998.
[6] SEDENTEXCT. Radiation Protection; Cone Beam CT for Dental and Maxillofacial Radiology. Provisional Guidelines (v1.1 May 2009). Available from: http://www.sedentexct.eu/content/provisional-guidelines-cbct-dental-and-maxillofacial-radiology (last accessed 22 July 2010).
[7] Simpkin DJ. Transmission data for shielding diagnostic x-ray facilities. 1995. Health Physics, 68, 704-9.
[8] UK Department of Health. Hospital Activity Statistics – Imaging and Radiodiagnostics. Available from: http://www.dh.gov.uk/en/Publicationsandstatistics/Statistics/Performancedataandstatistics/HospitalActivityStatistics/DH_077487 (last accessed 22 July 2010).
30 SEDENTEXCT D2.2 Report
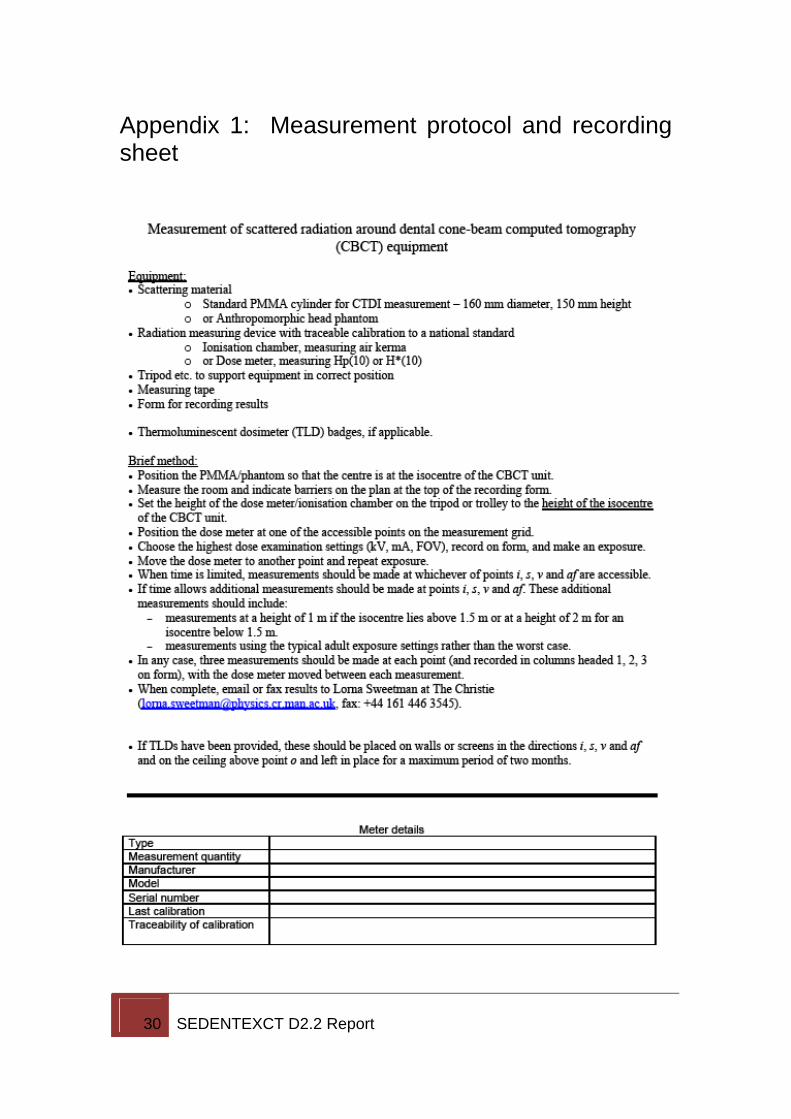
Appendix 1: Measurement protocol and recording sheet
31 SEDENTEXCT D2.2 Report
32 SEDENTEXCT D2.2 Report
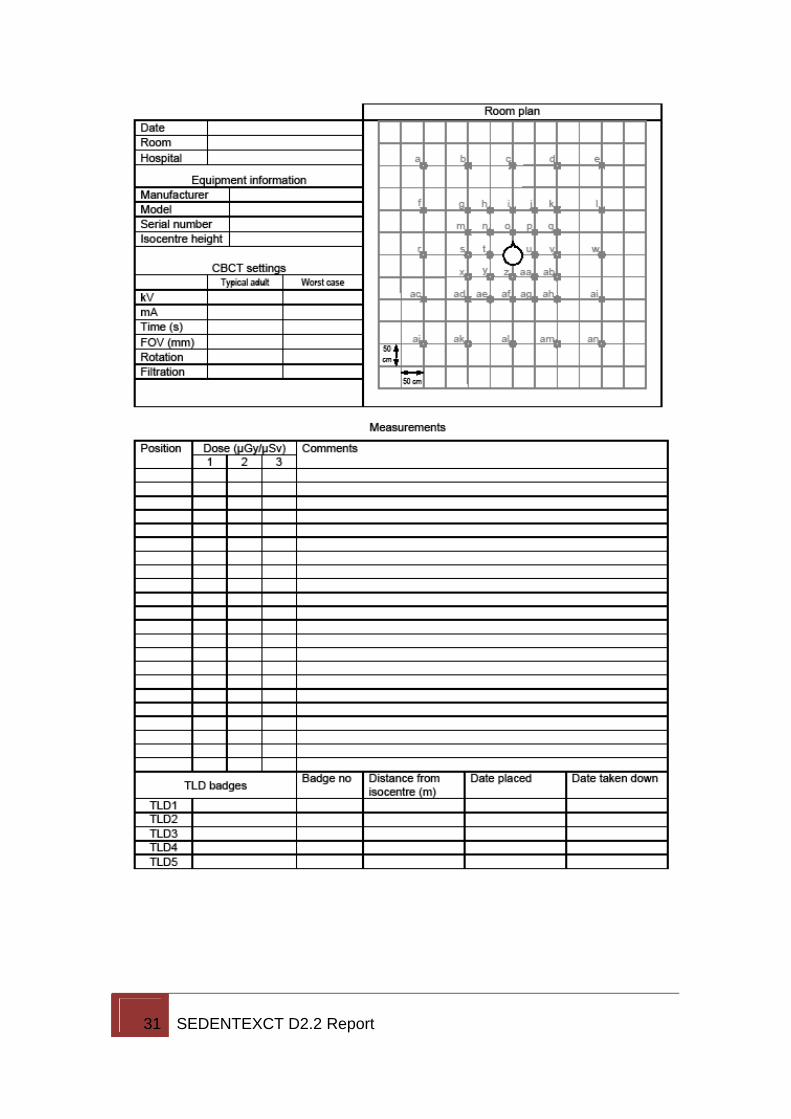
Appendix 2: Detailed results of scatter measurements Included in this appendix are the detailed measurements of scatter around each model of CBCT. For information, the maximum settings for the main exposure parameters are presented in a table. This is accompanied by the minimum distance to any barrier, which was either measured on site or taken from the space requirements detailed by the manufacturer in their promotional material. Also presented are a series of figures showing the spatial distribution of the scattered radiation measured in the rooms in which the CBCTs were located. The values at each point are the average of the three measurements and the standard deviation. Colour-coding has been added to highlight the variation in dose per scan in different parts of the room and across different models of CBCT. The position of the CBCT and the arc of the rotation of the x-ray tube and detector are superimposed on the plots.
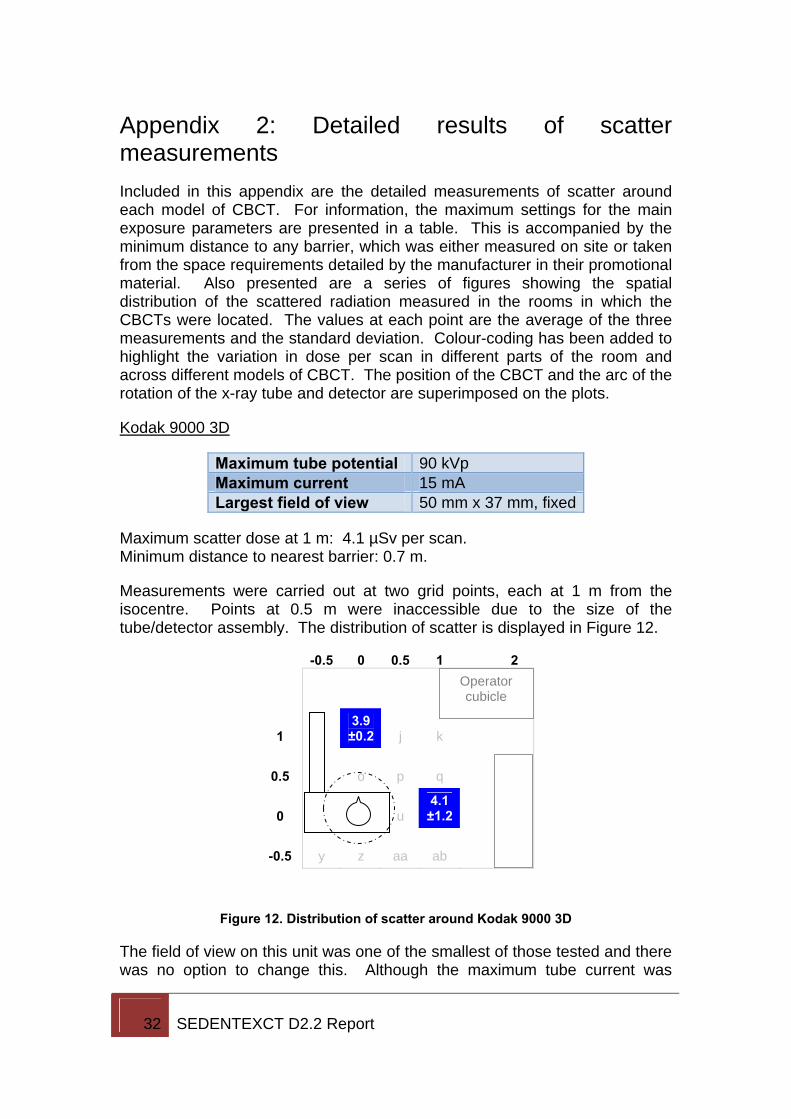
Kodak 9000 3D
Maximum tube potential 90 kVp Maximum current 15 mA Largest field of view 50 mm x 37 mm, fixed
Maximum scatter dose at 1 m: 4.1 µSv per scan. Minimum distance to nearest barrier: 0.7 m.
Measurements were carried out at two grid points, each at 1 m from the isocentre. Points at 0.5 m were inaccessible due to the size of the tube/detector assembly. The distribution of scatter is displayed in Figure 12.
-0.5 0 0.5 1 2
1 3.9 ±0.2 j k
0.5 o p q
0 u 4.1 ±1.2
-0.5 y z aa ab
Figure 12. Distribution of scatter around Kodak 9000 3D
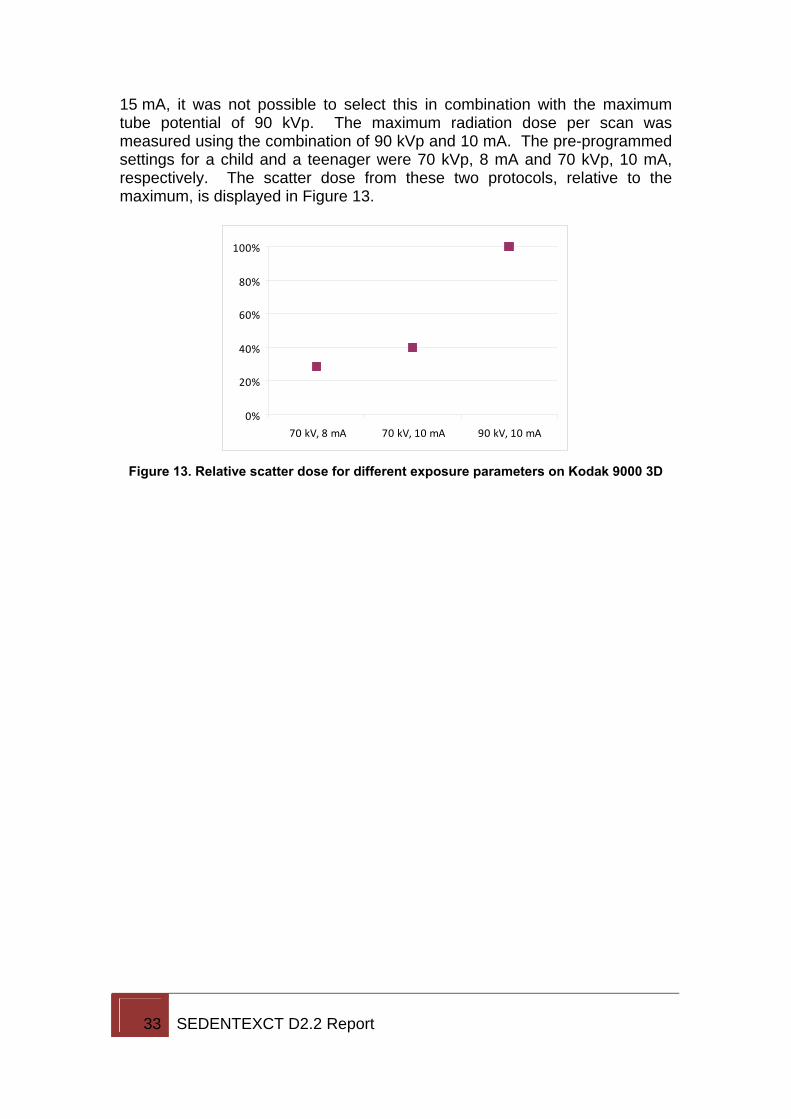
The field of view on this unit was one of the smallest of those tested and there was no option to change this. Although the maximum tube current was
Operator cubicle
33 SEDENTEXCT D2.2 Report
15 mA, it was not possible to select this in combination with the maximum tube potential of 90 kVp. The maximum radiation dose per scan was measured using the combination of 90 kVp and 10 mA. The pre-programmed settings for a child and a teenager were 70 kVp, 8 mA and 70 kVp, 10 mA, respectively. The scatter dose from these two protocols, relative to the maximum, is displayed in Figure 13.
0%
20%
40%
60%
80%
100%
70 kV, 8 mA 70 kV, 10 mA 90 kV, 10 mA
Figure 13. Relative scatter dose for different exposure parameters on Kodak 9000 3D
34 SEDENTEXCT D2.2 Report
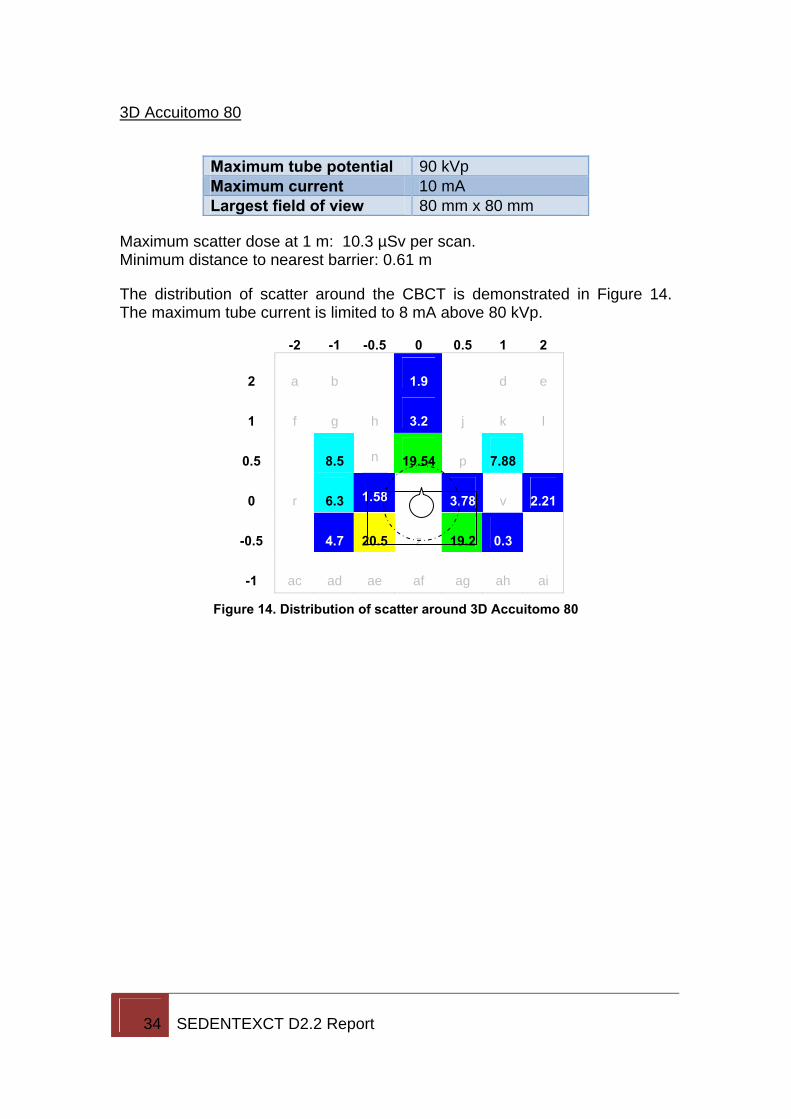
3D Accuitomo 80
Maximum tube potential 90 kVp Maximum current 10 mA Largest field of view 80 mm x 80 mm
Maximum scatter dose at 1 m: 10.3 µSv per scan. Minimum distance to nearest barrier: 0.61 m
The distribution of scatter around the CBCT is demonstrated in Figure 14. The maximum tube current is limited to 8 mA above 80 kVp.
-2 -1 -0.5 0 0.5 1 2
2 a b 1.9 d e
1 f g h 3.2 j k l
0.5 8.5 n 19.54 p 7.88
0 r 6.3 1.58 3.78 v 2.21
-0.5 4.7 20.5 z 19.2 0.3
-1 ac ad ae af ag ah ai
Figure 14. Distribution of scatter around 3D Accuitomo 80
35 SEDENTEXCT D2.2 Report
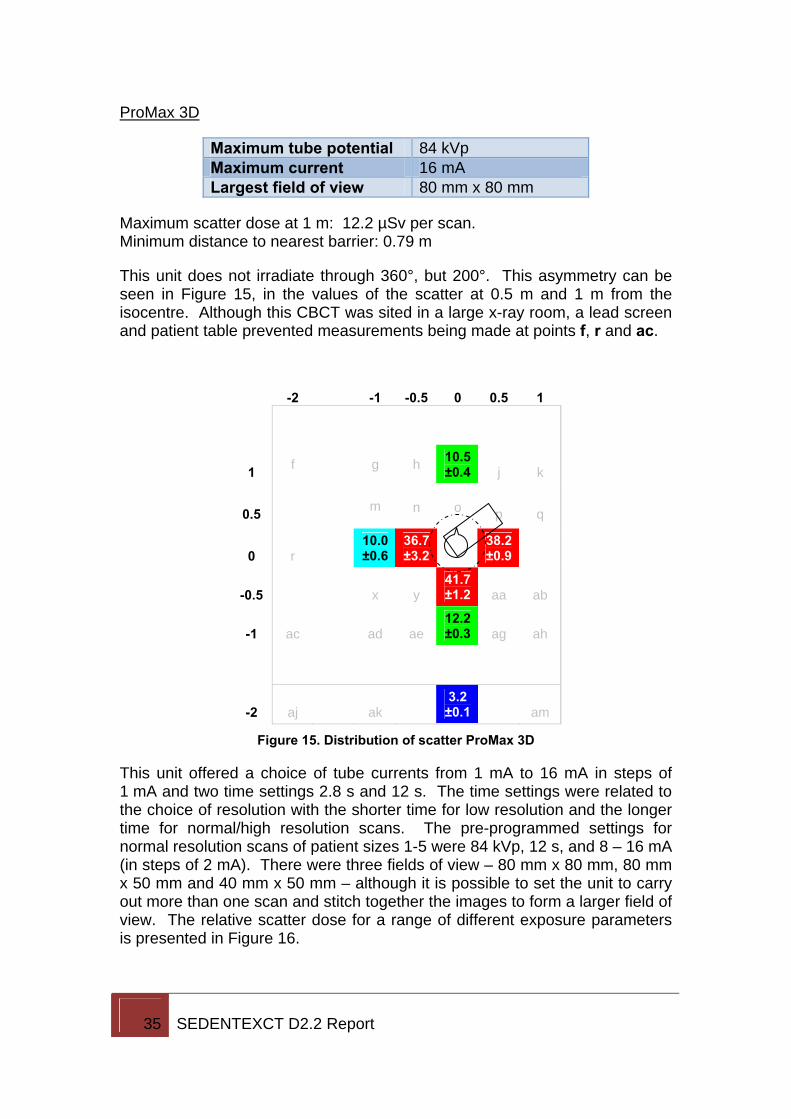
ProMax 3D
Maximum tube potential 84 kVp Maximum current 16 mA Largest field of view 80 mm x 80 mm
Maximum scatter dose at 1 m: 12.2 µSv per scan. Minimum distance to nearest barrier: 0.79 m
This unit does not irradiate through 360°, but 200°. This asymmetry can be seen in Figure 15, in the values of the scatter at 0.5 m and 1 m from the isocentre. Although this CBCT was sited in a large x-ray room, a lead screen and patient table prevented measurements being made at points f, r and ac.
-2 -1 -0.5 0 0.5 1
1 f g h 10.5 ±0.4 j k
0.5 m n o p q
0 r 10.0 ±0.6
36.7 ±3.2
38.2 ±0.9
-0.5 x y 41.7 ±1.2 aa ab
-1 ac ad ae 12.2 ±0.3 ag ah
-2 aj ak 3.2 ±0.1 am
Figure 15. Distribution of scatter ProMax 3D
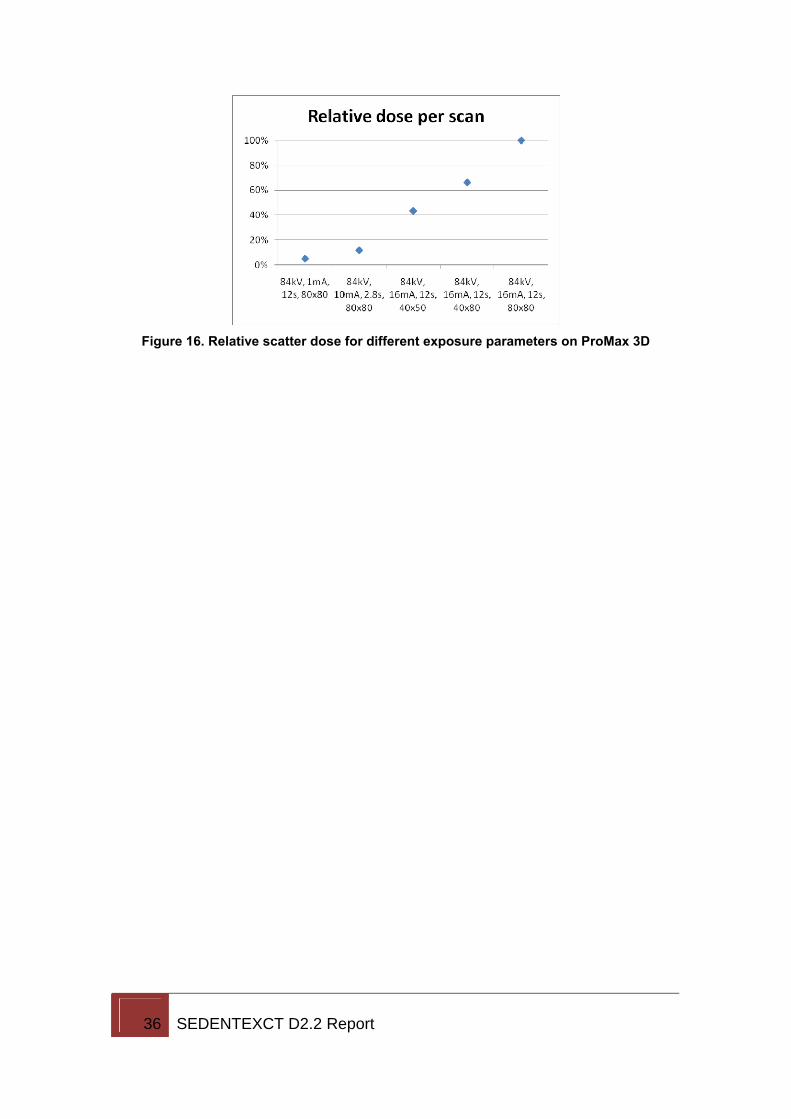
This unit offered a choice of tube currents from 1 mA to 16 mA in steps of 1 mA and two time settings 2.8 s and 12 s. The time settings were related to the choice of resolution with the shorter time for low resolution and the longer time for normal/high resolution scans. The pre-programmed settings for normal resolution scans of patient sizes 1-5 were 84 kVp, 12 s, and 8 – 16 mA (in steps of 2 mA). There were three fields of view – 80 mm x 80 mm, 80 mm x 50 mm and 40 mm x 50 mm – although it is possible to set the unit to carry out more than one scan and stitch together the images to form a larger field of view. The relative scatter dose for a range of different exposure parameters is presented in Figure 16.
36 SEDENTEXCT D2.2 Report
Figure 16. Relative scatter dose for different exposure parameters on ProMax 3D
37 SEDENTEXCT D2.2 Report
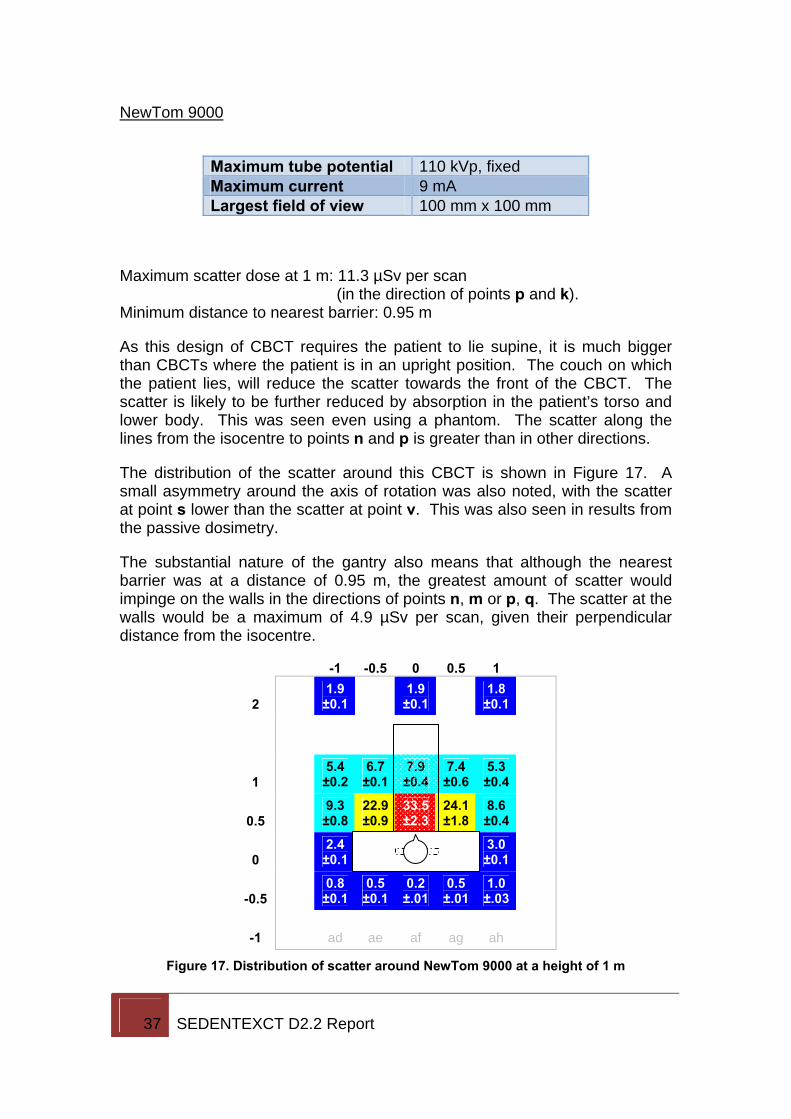
NewTom 9000
Maximum tube potential 110 kVp, fixed Maximum current 9 mA Largest field of view 100 mm x 100 mm
Maximum scatter dose at 1 m: 11.3 µSv per scan (in the direction of points p and k).
Minimum distance to nearest barrier: 0.95 m
As this design of CBCT requires the patient to lie supine, it is much bigger than CBCTs where the patient is in an upright position. The couch on which the patient lies, will reduce the scatter towards the front of the CBCT. The scatter is likely to be further reduced by absorption in the patient’s torso and lower body. This was seen even using a phantom. The scatter along the lines from the isocentre to points n and p is greater than in other directions.
The distribution of the scatter around this CBCT is shown in Figure 17. A small asymmetry around the axis of rotation was also noted, with the scatter at point s lower than the scatter at point v. This was also seen in results from the passive dosimetry.
The substantial nature of the gantry also means that although the nearest barrier was at a distance of 0.95 m, the greatest amount of scatter would impinge on the walls in the directions of points n, m or p, q. The scatter at the walls would be a maximum of 4.9 µSv per scan, given their perpendicular distance from the isocentre.
-1 -0.5 0 0.5 1
2 1.9 ±0.1 1.9
±0.1 1.8 ±0.1
1 5.4 ±0.2
6.7 ±0.1
7.9 ±0.4
7.4 ±0.6
5.3 ±0.4
0.5 9.3 ±0.8
22.9 ±0.9
33.5 ±2.3
24.1 ±1.8
8.6 ±0.4
0 2.4 ±0.1 t u
3.0 ±0.1
-0.5 0.8 ±0.1
0.5 ±0.1
0.2 ±.01
0.5 ±.01
1.0 ±.03
-1 ad ae af ag ah
Figure 17. Distribution of scatter around NewTom 9000 at a height of 1 m
38 SEDENTEXCT D2.2 Report
Another feature of this CBCT is that the tube current is determined by an automatic exposure control which chooses an appropriate mA depending on the attenuation of the object in the x-ray beam, whether patient or phantom. Therefore, it was not possible to achieve a consistent tube current for each scatter measurement. However, the protocol requirement that each measurement should be performed three times, is likely to have reduced the impact of this. Since information was available on the average tube current for the exposures during the scatter measurements, the dose per scan at the maximum current of 9 mA, was calculated and it is these values that are included in Figure 17.
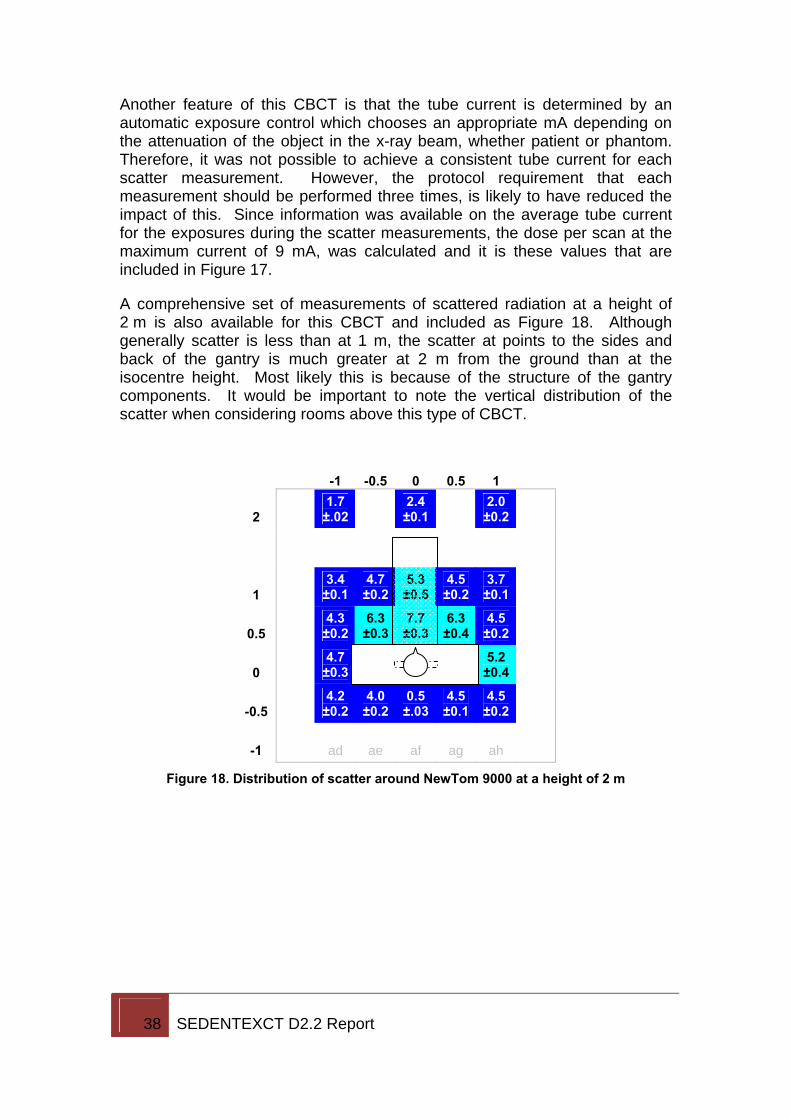
A comprehensive set of measurements of scattered radiation at a height of 2 m is also available for this CBCT and included as Figure 18. Although generally scatter is less than at 1 m, the scatter at points to the sides and back of the gantry is much greater at 2 m from the ground than at the isocentre height. Most likely this is because of the structure of the gantry components. It would be important to note the vertical distribution of the scatter when considering rooms above this type of CBCT.
-1 -0.5 0 0.5 1
2 1.7 ±.02 2.4
±0.1 2.0 ±0.2
1 3.4 ±0.1
4.7 ±0.2
5.3 ±0.5
4.5 ±0.2
3.7 ±0.1
0.5 4.3 ±0.2
6.3 ±0.3
7.7 ±0.3
6.3 ±0.4
4.5 ±0.2
0 4.7 ±0.3 t u
5.2 ±0.4
-0.5 4.2 ±0.2
4.0 ±0.2
0.5 ±.03
4.5 ±0.1
4.5 ±0.2
-1 ad ae af ag ah
Figure 18. Distribution of scatter around NewTom 9000 at a height of 2 m
39 SEDENTEXCT D2.2 Report
GX CB-500
Maximum tube potential 90 kVp, fixed Maximum current 5 mA, fixed Largest field of view 85 mm x 145 mm
Maximum scatter dose at 1 m: 8.3 ± 0.5 µSv per scan. Minimum distance to nearest barrier: 0.65 m
The room in which this unit was located is the smallest of those visited. The circular path of the x-ray tube/detector extended more than 50 cm from the isocentre and the door from the corridor opened into the room. This, along with the other fixtures and fittings in the room meant that there was only one accessible point on the measurement grid, point i at 1 m in front of the isocentre. Therefore, a plot of the scatter has not been included in this report.
Furthermore, the tube potential and current were fixed. The total mAs could be varied by choosing the size of the voxels in the reconstructed image. Large voxels (0.3 mm or greater) used a rotation time of 8.9 sec, while small voxels (0.25 mm or less) used a rotation time of 23 sec.
40 SEDENTEXCT D2.2 Report
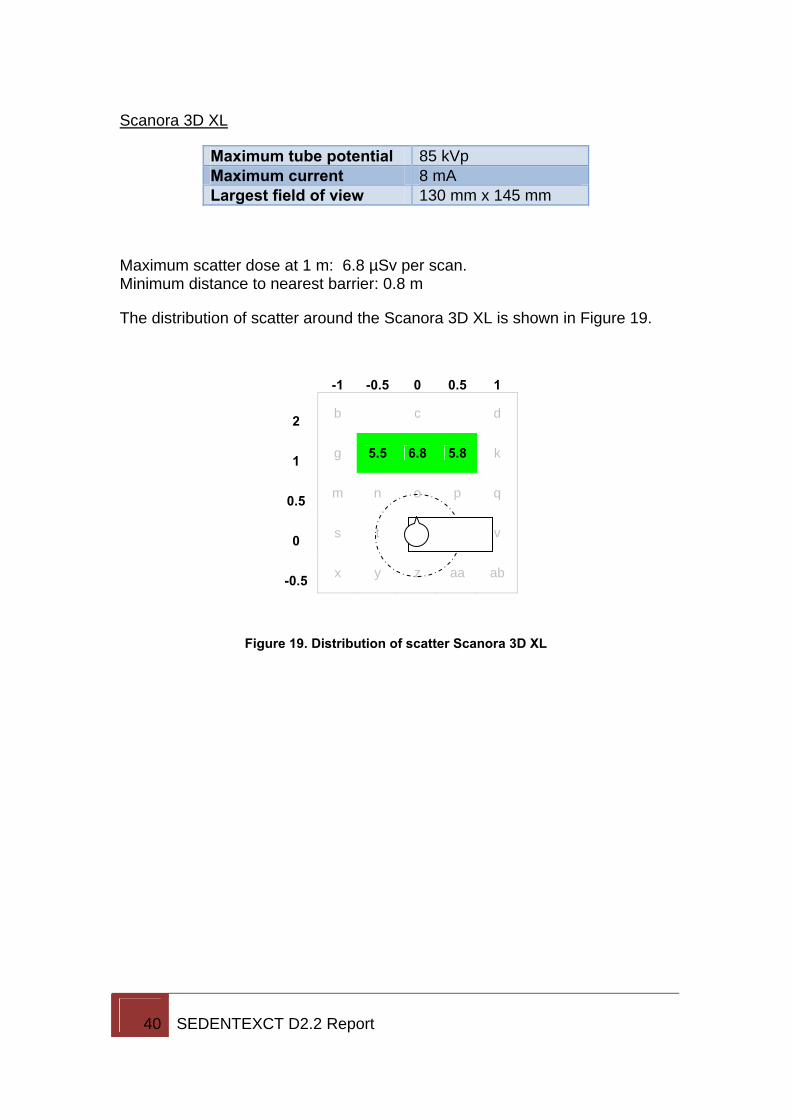
Scanora 3D XL
Maximum tube potential 85 kVp Maximum current 8 mA Largest field of view 130 mm x 145 mm
Maximum scatter dose at 1 m: 6.8 µSv per scan. Minimum distance to nearest barrier: 0.8 m
The distribution of scatter around the Scanora 3D XL is shown in Figure 19.
-1 -0.5 0 0.5 1
2 b c d
1 g 5.5 6.8 5.8 k
0.5 m
n o p q
0 s t
u v
-0.5 x y z aa ab
Figure 19. Distribution of scatter Scanora 3D XL
41 SEDENTEXCT D2.2 Report
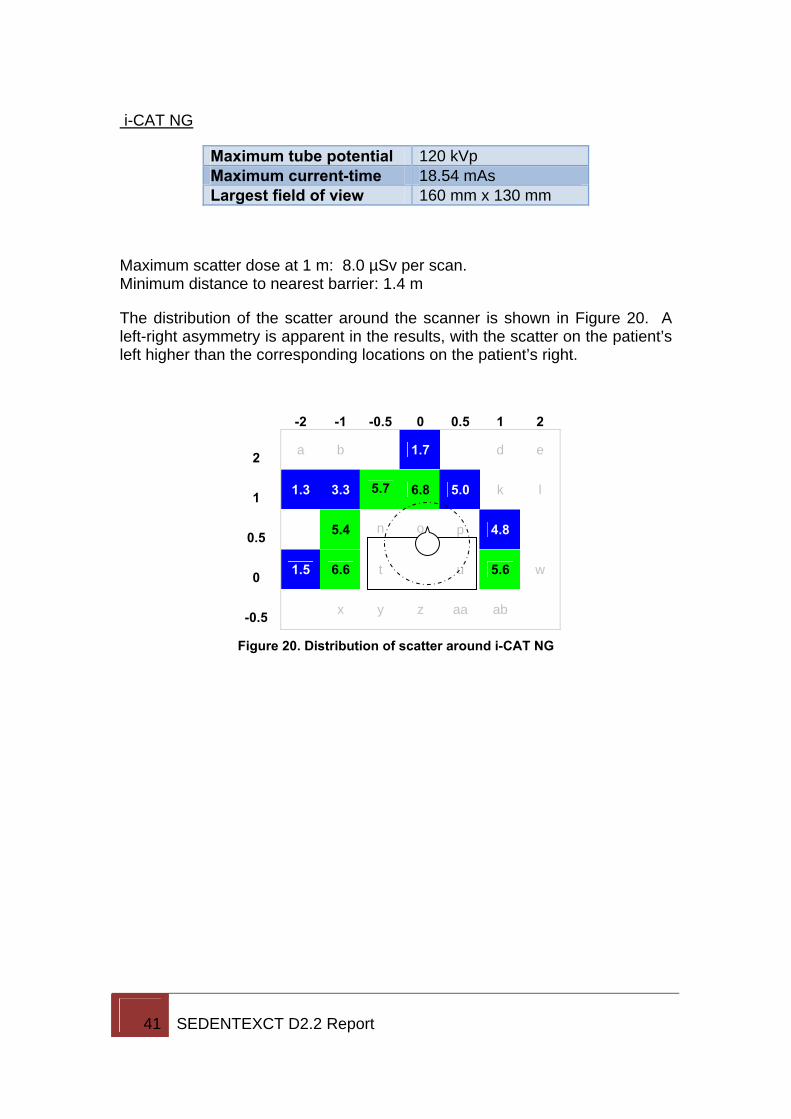
i-CAT NG
Maximum tube potential 120 kVp Maximum current-time 18.54 mAs Largest field of view 160 mm x 130 mm
Maximum scatter dose at 1 m: 8.0 µSv per scan. Minimum distance to nearest barrier: 1.4 m
The distribution of the scatter around the scanner is shown in Figure 20. A left-right asymmetry is apparent in the results, with the scatter on the patient’s left higher than the corresponding locations on the patient’s right.
-2 -1 -0.5 0 0.5 1 2
2 a b 1.7 d e
1 1.3 3.3
5.7 6.8 5.0 k l
0.5 5.4
n
o p 4.8
0 1.5 6.6 t u 5.6 w
-0.5 x y z aa ab
Figure 20. Distribution of scatter around i-CAT NG
42 SEDENTEXCT D2.2 Report
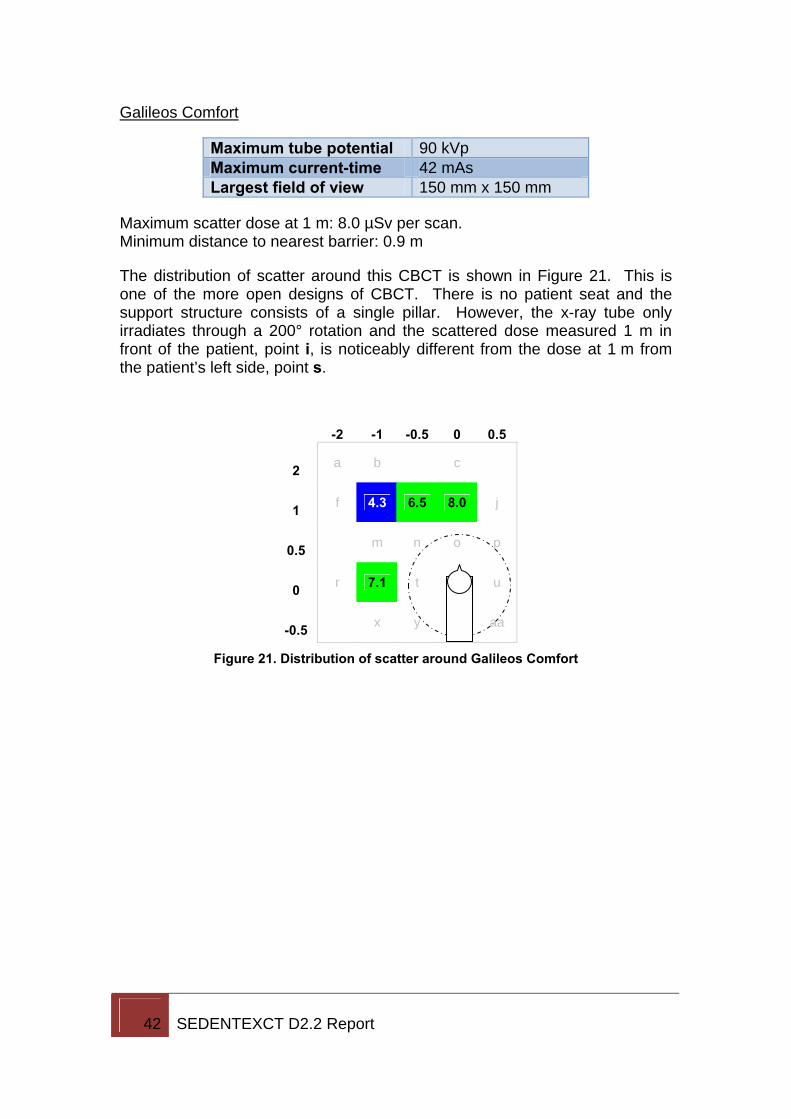
Galileos Comfort
Maximum tube potential 90 kVp Maximum current-time 42 mAs Largest field of view 150 mm x 150 mm
Maximum scatter dose at 1 m: 8.0 µSv per scan. Minimum distance to nearest barrier: 0.9 m
The distribution of scatter around this CBCT is shown in Figure 21. This is one of the more open designs of CBCT. There is no patient seat and the support structure consists of a single pillar. However, the x-ray tube only irradiates through a 200° rotation and the scattered dose measured 1 m in front of the patient, point i, is noticeably different from the dose at 1 m from the patient’s left side, point s.
-2 -1 -0.5 0 0.5
2 a b c
1 f 4.3 6.5 8.0 j
0.5 m
n o p
0 r 7.1 t
u
-0.5 x y z aa
Figure 21. Distribution of scatter around Galileos Comfort
43 SEDENTEXCT D2.2 Report
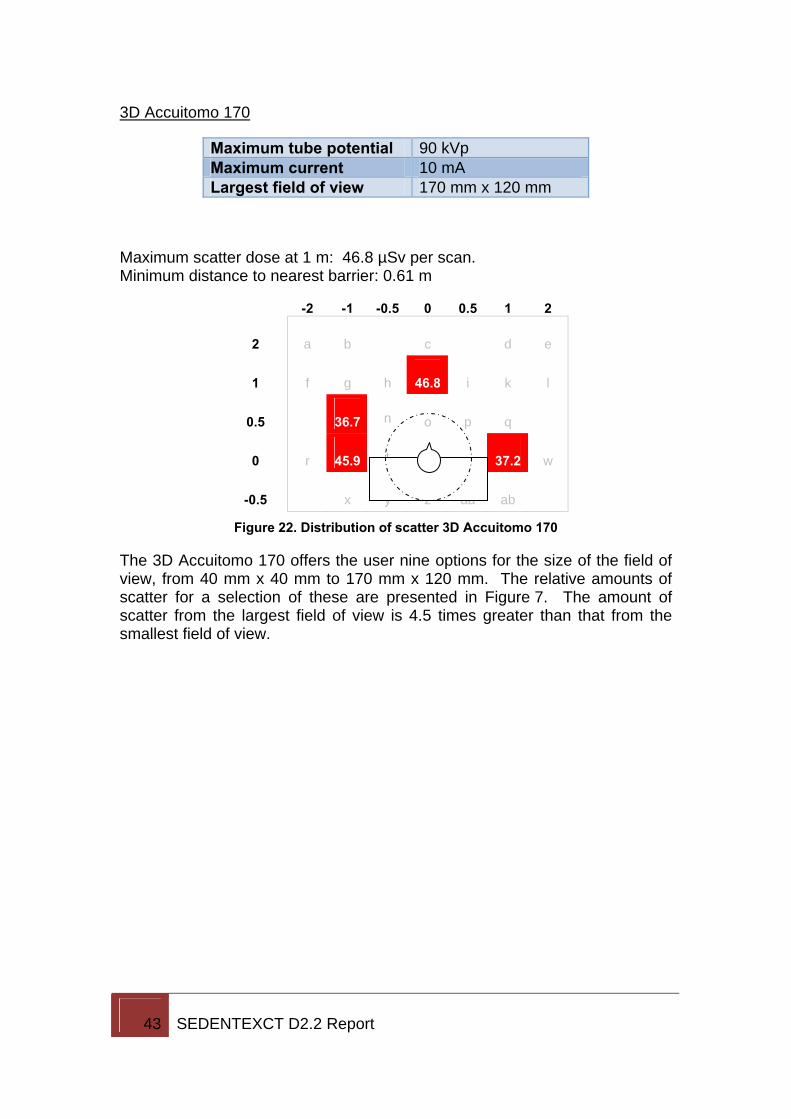
3D Accuitomo 170
Maximum tube potential 90 kVp Maximum current 10 mA Largest field of view 170 mm x 120 mm
Maximum scatter dose at 1 m: 46.8 µSv per scan. Minimum distance to nearest barrier: 0.61 m
-2 -1 -0.5 0 0.5 1 2
2 a b c d e
1 f g h 46.8 i k l
0.5 36.7 n o p q
0 r 45.9 t u 37.2 w
-0.5 x y z aa ab
Figure 22. Distribution of scatter 3D Accuitomo 170
The 3D Accuitomo 170 offers the user nine options for the size of the field of view, from 40 mm x 40 mm to 170 mm x 120 mm. The relative amounts of scatter for a selection of these are presented in Figure 7. The amount of scatter from the largest field of view is 4.5 times greater than that from the smallest field of view.