sediment chemistry, toxicity, and benthic community conditions in
TRANSCRIPT

SEDIMENT CHEMISTRY, TOXICITY, AND BENTHIC COMMUNITY CONDITIONS INSELECTED WATER BODIES OF THE LOS ANGELES REGION
FINAL REPORT
CALIFORNIA STATE WATER RESOURCES CONTROL BOARDDIVISION OF WATER QUALITY
BAY PROTECTION AND TOXIC CLEANUP PROGRAM
CALIFORNIA DEPARTMENT OF FISH AND GAMEMARINE POLLUTION STUDIES LABORATORY
UNIVERSITY OF CALIFORNIA, SANTA CRUZINSTITUTE OF MARINE SCIENCES
SAN JOSE STATE UNIVERSITYMOSS LANDING MARINE LABORATORIES
AUGUST 1998

i
AUTHORS
Brian Anderson, John Hunt, Bryn Phillips, John Newman, and Ron TjeerdemaUniversity of California, Santa Cruz
Craig J. Wilson, Gita Kapahi, and Richard A. SapudarState Water Resources Control Board
Mark Stephenson and Max PuckettCalifornia Department of Fish and Game
Russell Fairey and James OakdenSan Jose State University Foundation/Moss Landing Marine Laboratories
Michael Lyons and Shirley BirosikRegional Water Quality Control BoardLos Angeles Region

ii
EXECUTIVE SUMMARY
Study ObjectivesThe Bay Protection and Toxic Cleanup Program (BPTCP) was established by the California StateLegislature in 1989 with four major goals:1) To provide protection of present and future beneficial uses of the bay and estuarine waters
of California;2) To identify and characterize toxic hot spots3) To plan for toxic hot spot cleanup or other remedial or mitigation actions; and4) To develop prevention and control strategies for toxic pollutants that will prevent creation
of new toxic hot spots or the perpetuation of existing ones within the bays and estuaries ofthe State.
These goals are being addressed through activities in each of the coastal Water Quality ControlBoard Regions, including the Los Angeles Region (Region 4). As part of the legislativemandate, the BPTCP has implemented regional monitoring studies to identify toxic hot spots.The assessment strategy has generally relied upon application of various components of theSediment Quality Triad in a weight-of-evidence approach to hot spot determination (Chapman etal., 1987). In 1992, the Los Angeles Regional Water Quality Control Board (LARWQCB), incooperation with the State Water Resources Control Board (SWRCB), began BPTCP sedimentmonitoring in the Los Angeles Region. Initial monitoring activities were conducted in the LosAngeles and Long Beach Harbor areas as part of a three-year cooperative agreement between theNational Oceanic and Atmospheric Administration (NOAA) and the SWRCB. TheNOAA/SWRCB studies were designed to investigate sediment conditions in Southern Californiabays and estuaries (Fairey et al., 1995; Anderson et al., 1997). In addition to results from thiscooperative agreement study, this report contains results of subsequent LARWQCB/BPTCPinvestigations conducted throughout the Los Angeles Region.
Studies were performed in inner and outer Los Angeles and Long Beach Harbors, Palos Verdes,Shoreline Marina, Los Alamitos Bay, King Harbor, Marina Del Rey, Ballona Creek, ChannelIslands Harbor, Ventura Harbor, Port Hueneme, Malibu Lagoon, Mugu Lagoon, Santa Clara andVentura River Estuaries, Colorado Lagoon/Simm’s Pond, and McGrath Lake in the Los Angelesregion.
The objectives of the study were as follows:
Characterize the magnitude and relative spatial distribution of pollution-associated bioeffects inthe above-listed water bodies.
Determine relationships between concentrations and mixtures of sediment-associated chemicalsand the occurrence and severity of bioeffects.
Distinguish more severely impacted sediments from less severely impacted sediments.
Use a weight-of-evidence approach based on the Sediment Quality Triad to categorize stationsfor future work.

iii
Major Findings
Through a cooperative agreement this study achieved the combined program objectives of theLos Angeles Regional Water Quality Control Board, the State Water Resources Control Board’sBay Protection and Toxic Cleanup Program, and the National Oceanic and AtmosphericAdministration’s Status and Trends Program. Using a weight-of-evidence approach based on theSediment Quality Triad, measures of chemical pollution, toxicity, benthic community structure,and bioaccumulation were completed on 267 samples collected from 138 stations. Stations inIndustrial Harbors, Marinas, and Lagoons were sampled over a five year period to determinerelative degradation in selected water bodies in the Los Angeles Region. When combined withmeasures of other sediment characteristics such as grain size, TOC, unionized ammonia, andhydrogen sulfide, these measures were useful for determining the relative level of pollution andbiological impacts at a wide range of stations.
Degree of chemical contamination was assessed using two sets of sediment quality guidelines:the ERL/ERM guidelines developed by NOAA (Long et al., 1995), and the TEL/PEL guidelinesdeveloped for the State of Florida (MacDonald, 1996). In addition, non-guideline chemicalswere compared to the BPTCP database to compare relative concentrations with those measuredstatewide. Copper, mercury, zinc, TBT, total chlordane, total PCBs, and high molecular weightPAHs were found to be the chemicals or chemical groups of greatest concern at the IndustrialHarbor stations. Copper, lead, mercury, zinc, total chlordane, and total PCBs were found to bethe chemicals or chemical groups of greatest concern at the Marina stations. PCBs, and anumber of pesticides, including chlordane, dieldrin, endosulfan, and DDT, were the chemicals ofgreatest concern in the Lagoon stations.
Of the 192 Industrial Harbor stations where toxicity was assessed, 29 % showed significanttoxicity to amphipods. Toxicity was highest in the inner Industrial Harbor sediment samples.Pore water samples demonstrated higher toxicity than sediment samples; 79% of the IndustrialHarbor stations were toxic to abalone embryos exposed to sediment pore water. Of the 35Marina stations tested for amphipod toxicity, sediment samples were toxic to amphipods at 31%of the stations. Of the 33 Lagoon station sediment samples tested, 58% were significantly toxic.
Many of the chemicals that correlated with toxicity also exceeded the sediment quality guidelinevalues. Amphipod survival in Industrial Harbor stations was negatively correlated with a numberof chemicals or chemical groups, including copper, mercury, nickel, lead, zinc, chlordane, totalPCBs, low and high molecular weight, and total PAHs, the ERM Quotient, and the number ofERM Exceedances in the samples. In addition amphipod survival in the Industrial Harborsamples was negatively correlated with sediment grain size and TOC. Because chemicals bind toTOC and fine-grained sediments, it is not possible without further study to separate bioeffectsdue to these binding phases from those due to pollutants. Abalone development in IndustrialHarbor pore water samples was negatively correlated with tin, total chlordane, two PCBcongeners, the ERM Quotient value, and the number of ERM Exceedances in these samples. Amphipod survival in Marina sediments was negatively correlated primarily with metals (As, Cu,Pb, Hg, Ni, and zinc), as well as TBT. Amphipod survival in these samples was also negativelycorrelated with the PEL Quotient, the number of ERM Exceedances, and percent clay in the

iv
samples. Amphipod survival in Lagoon sediment samples was negatively correlated with metals(Cu, Hg, Ag, Zn), pesticides such as chlordane, DDT, and dieldrin, and a number of PCBcongeners and PAH compounds. In addition, amphipod survival in Lagoons was negativelycorrelated with the ERM Quotient and the number of ERM Exceedances in these samples.
Of the 102 Industrial Harbor stations where benthic community structure was characterized, 13%were considered to be degraded. The Relative Benthic Index (RBI), derived to characterizebenthic community structure, was negatively correlated with a number of metals, pesticides,PCBs and PAHs. In addition, the RBI was negatively correlated with sediment TOC, the ERMQuotient, and the number of ERM Exceedances. Multivariate and univariate correlationsbetween toxicity test results and benthic community metrics indicated that amphipod survival intoxicity tests was positively correlated with the total number of crustacean individuals andspecies at these stations. Abalone development in toxicity tests was positively correlated withthe number of mollusc individual and species. Only one of 22 Marina samples had significantlydegraded benthic community structure (RBI < 0.30). Benthic community structure at the Marinastations was negatively correlated with metals, pesticides, PCBs, grain size, TOC, and the ERMQuotient and number of ERM Exceedances. All 6 of the Lagoon samples assessed in MuguLagoon had degraded benthos.
Bioaccumulation measured in field collected fish and laboratory exposed bivalves (Macomanasuta) indicated that field collected fish in the West Basin and Cabrillo Beach Pier areas of LosAngeles Harbor contained DDT and PCB tissue concentrations that exceeded EPA screeningvalues (U.S. EPA, 1990; U.S. EPA, 1995a). Bivalves exposed to sediments from the CabrilloBeach Pier area accumulated significantly higher concentrations of DDT and PCBs than clamsexposed to control sediment. Fish collected from one station in Mugu Lagoon also had elevatedlevels of PCBs compared to EPA screening values.
The results of these studies were consolidated into weight-of-evidence categorization tables.Stations were grouped based on chemical and ecotoxicological results into 9 possible categoriesthat considered the magnitude of contamination by chemicals of concern, occurrence of toxicityusing multiple toxicity test protocols, benthic community degradation, and in some cases, tissuebioaccumulation. Specific thresholds were established for each measure, beyond which stationswere considered to have elevated chemistry, significant toxicity, degraded benthic communitystructure, or elevated tissue concentrations.
The Industrial Harbor stations that met all the criteria for Category 1 were located in theConsolidated Slip area. Samples from these stations had elevated chemistry, recurrent toxicity,and degraded benthic community structure. A majority of the Industrial Harbor stations met thecriteria for Categories 5 or 6. These were stations with either, elevated chemistry and mixedresults from biological measures (Cat. 5), or with measured biological impact but chemistryvalues below thresholds or not measured (Cat. 6).
The majority of Marina stations met the criteria for Categories 5 and 6. Some stations in MarinaDel Rey had sediments with elevated chemistry; these stations were also significantly toxic toamphipods. The RBI at some of these stations was relatively low, but did not exceed thethreshold for significant benthic community degradation.

v
The majority of Lagoon stations also met the criteria for Categories 5 and 6. Stations inColorado Lagoon, Ballona Creek, and McGrath Lake had elevated chemistry and weresignificantly toxic to amphipods, but benthic community structure was not characterized at thesestations. Stations in Mugu Lagoon all met the criteria for Category 6. Individual pesticidesexceeded some guideline values in Mugu Lagoon, and amphipod survival was variable. Benthiccommunity structure was degraded at all of the 6 Mugu Lagoon stations analyzed.
Results of these analyses will be combined with existing knowledge of chemicals of concern,biological effects, and site characteristics from previous studies to aid in development of hot spotcleanup plans. In addition, these investigations provide an initial step for identification ofreference sites to be used in future monitoring studies.

vi
ACKNOWLEDGMENTS
This study was conducted with the assistance of a number of colleagues from the Marine PollutionStudies Laboratory and its facilities at Granite Canyon, Moss Landing, and Santa Cruz, California. Theauthors would like to specifically acknowledge the following people for their efforts in the successfulcompletion of the investigations described in this report.
University of California, Santa Cruz, Staff Conducting Toxicity Testing at Granite Canyon
Steve Clark, Matt Englund, Michelle Hester, Hilary McNulty, Patty Nicely, Steve Osborne, WitoldPiekarski, Kelita Smith, Shirley Tudor, Lisa Weetman, Michelle White
University of California, Santa Cruz, Trace Organics Laboratory
Jonathan Becker, Gloria J. Blondina, James Derbin, Linda Hannigan, Deborah Holstad, Dana Longo,Raina Scott, Katharine Semsar, Thomas Shyka, Matthew Stoetling, Else Gladish-Wilson, Laura Zirelli
California Department of Fish and Game, Trace Metal and Sample Collection Laboratory
Jon Goetzl, Gary Ichikawa, Jim Kanihan, Kim Paulson, Mark Pranger
San Jose State University, Sample Collection and Data Management
Ross Clark, James Downing, Michelle Jacobi, Eric Johnson, Brenda Konar, Stewart Lamerdin, EliLandrau, Cassandra Roberts
Moss Landing Marine Laboratories (SJSU), Organic Carbon and Grain Size Analysis
Bill Chevilier, Steve Fitzwater, Craig Hunter, Pat Iampietro, Sean McDermott, Michelle White
Moss Landing Marine Laboratories (SJSU), Benthic Community Analysis
Carrie Bretz, Diane Carney, Jim Oakden, John Oliver, Pete Slattery
We would especially like to thank Michelle White and Patty Nicely for assistance with preparing thisreport, specifically for their skills with mapping, data compilation, and statistical analysis. In addition,the authors would like to thank Dr. Edward Long for invaluable contributions to the design andimplementation of this study, data interpretation, and technical review.
This study was funded by the State Water Resources Control Board and Los Angeles RegionalWater Quality Control Board through the Bay Protection and Toxic Cleanup Program, and theNational Oceanic and Atmospheric Administration through NOAA’s Bioassessment Branch andthe National Status and Trends Program.

vii
TABLE OF CONTENTS
AUTHORS.................................................................................................................................................................... I
EXECUTIVE SUMMARY ....................................................................................................................................... II
STUDY OBJECTIVES ...................................................................................................................................................IIMajor Findings................................................................................................................................................... iii
ACKNOWLEDGMENTS ........................................................................................................................................ VI
TABLE OF CONTENTS ........................................................................................................................................VII
LIST OF FIGURES ....................................................................................................................................................X
LIST OF TABLES ................................................................................................................................................. XIII
LIST OF ABBREVIATIONS .................................................................................................................................XV
LIST OF APPENDICES ......................................................................................................................................XVII
INTRODUCTION ...................................................................................................................................................... 1
PURPOSE ................................................................................................................................................................... 1PROGRAMMATIC BACKGROUND AND NEEDS............................................................................................................ 2STUDY AREA ............................................................................................................................................................ 3
Industrial Harbors .............................................................................................................................................. 5Marinas ............................................................................................................................................................... 7Lagoons and River Mouths ............................................................................................................................... 12
METHODS................................................................................................................................................................ 15
SAMPLE SITE SELECTION ........................................................................................................................................ 15SAMPLING METHODS .............................................................................................................................................. 16
Summary of Methods......................................................................................................................................... 16Cleaning Procedures......................................................................................................................................... 16Sediment Sample Collection.............................................................................................................................. 26Analysis of Contaminants in Fish Tissue........................................................................................................... 28Transport of Samples ........................................................................................................................................ 30Homogenization and Aliquoting of Samples ..................................................................................................... 30Procedures for the Extraction of Pore Water.................................................................................................... 30Subsurface Water Collection............................................................................................................................. 32Collection of Intact Sediment Cores for Sediment-Water Interface Tests ......................................................... 32Sample Chain of Records & Custody ................................................................................................................ 32Authorization/Instructions to Process Samples................................................................................................. 33
TRACE METALS ANALYSIS OF SEDIMENTS.............................................................................................................. 33Analytes and Detection Limits........................................................................................................................... 33Sediment Digestion Procedures ........................................................................................................................ 34Tissue Digestion Procedures............................................................................................................................. 34Atomic Absorption Methods .............................................................................................................................. 34Acid Volatile Sulfide and Simultaneously Extracted Metals – AVS-SEM ......................................................... 34
TRACE ORGANIC ANALYSIS OF SEDIMENTS (PCBS, PESTICIDES, AND PAHS) ........................................................ 35Analytes and Detection Limits........................................................................................................................... 35Summary of Methods......................................................................................................................................... 38Sediment Extraction .......................................................................................................................................... 38Tissue Extraction............................................................................................................................................... 39Organic Analysis ............................................................................................................................................... 39

viii
TOTAL ORGANIC CARBON ANALYSIS OF SEDIMENTS .............................................................................................. 40Summary of Methods......................................................................................................................................... 40
GRAIN SIZE ANALYSIS OF SEDIMENTS..................................................................................................................... 41Sample Splitting and Preparation ..................................................................................................................... 41Wet Sieve Analysis (separation of coarse and fine fraction) ............................................................................. 41Dry Sieve Analysis (coarse fraction) ................................................................................................................. 41Hydrometer Analysis (Fine Fraction) ............................................................................................................... 42Analytical Procedures ....................................................................................................................................... 42
TOXICITY TESTING.................................................................................................................................................. 42Summary of Methods......................................................................................................................................... 42Sediment Samples.............................................................................................................................................. 43Pore Water Samples .......................................................................................................................................... 43Subsurface Water Samples ................................................................................................................................ 44Measurement of Ammonia and Hydrogen Sulfide............................................................................................. 44Marine (Rhepoxynius abronius) and Estuarine (Eohaustorius estuarius) Amphipod Survival Tests ............... 45Abalone (Haliotis rufescens) Embryo-Larval Development Test ...................................................................... 46Bay Mussel (Mytilus spp.) Embryo-Larval Development Test .......................................................................... 46Polychaete Worm (Neanthes arenaceodentata) Survival and Growth Test ...................................................... 47Purple Sea Urchin (Strongylocentrotus purpuratus) Embryo-Larval Development Test ................................. 48Purple Sea Urchin (Strongylocentrotus purpuratus) Embryo-Larval Development Test Exposed at theSediment-Water Interface.................................................................................................................................. 48Sea Urchin (Strongylocentrotus purpuratus) Fertilization Test........................................................................ 49Test Acceptability and Evaluation..................................................................................................................... 50
BENTHIC COMMUNITY ANALYSIS ........................................................................................................................... 50BIOACCUMULATION ................................................................................................................................................ 51
28-day Clam (Macoma balthica) Bioaccumulation Test................................................................................... 51
DATA ANALYSIS.................................................................................................................................................... 51
COMPARISON OF CHEMISTRY WITH SEDIMENT QUALITY GUIDELINE VALUES......................................................... 51NON-GUIDELINE CHEMICALS.................................................................................................................................. 53ERM AND PEL QUOTIENTS .................................................................................................................................... 53STATISTICAL ANALYSIS OF TOXICITY TEST DATA................................................................................................... 56RELATIVE BENTHIC INDEX...................................................................................................................................... 57
Number of Species............................................................................................................................................. 58Number of Individuals....................................................................................................................................... 58Indicator Species............................................................................................................................................... 59Negative Indicator Species................................................................................................................................ 59Positive Indicator Species ................................................................................................................................. 60Calculation of RBI............................................................................................................................................. 60Use of RBI ......................................................................................................................................................... 61Multivariate and Univariate Techniques for Comparison of Chemistry and Toxicity Data ............................. 62
STRATEGY FOR CATEGORIZATION OF STATIONS BASED ON AVAILABLE MONITORING DATA.................................. 63QUALITY ASSURANCE/QUALITY CONTROL ............................................................................................................. 67
Summary of Methods......................................................................................................................................... 67
RESULTS/DISCUSSION......................................................................................................................................... 68
INDUSTRIAL HARBORS ............................................................................................................................................ 68Chemistry Data ................................................................................................................................................. 68Toxicity Testing Data ........................................................................................................................................ 72Benthic Community Analysis............................................................................................................................. 74Bioaccumulation Analysis ................................................................................................................................. 76Industrial Harbor Station Categorization......................................................................................................... 78
MARINAS ................................................................................................................................................................ 80Chemistry Data ................................................................................................................................................. 80Toxicity Testing Data ........................................................................................................................................ 81Benthic Community Analysis............................................................................................................................. 82

ix
Marina Station Categorization.......................................................................................................................... 82LAGOONS ................................................................................................................................................................ 83
Chemistry Data ................................................................................................................................................. 83Toxicity Testing Data ........................................................................................................................................ 84Benthic Community Analysis............................................................................................................................. 84Bioaccumulation Analysis ................................................................................................................................. 85Lagoon Station Categorization ......................................................................................................................... 85
STUDY LIMITATIONS .......................................................................................................................................... 86
CONCLUSIONS ....................................................................................................................................................... 87
REFERENCES.......................................................................................................................................................... 90

x
LIST OF FIGURES
FIGURE 1. LOS ANGELES REGION STUDY AREA............................................................................................................ 4FIGURE 2A-C. OUTER LOS ANGELES AND LONG BEACH HARBOR (A), PORT HUENEME (B), AND PALOS VERDES (C)
SAMPLING STATIONS. ......................................................................................................................................... 18FIGURE 3A-B. INNER LOS ANGELES AND LONG BEACH HARBOR (A) AND CONSOLIDATED SLIP (B) SAMPLIN STATIONS.
........................................................................................................................................................................... 19FIGURE 4A-B. SHORELINE MARINA (A) AND LOS ALAMITOS BAY (B) SAMPLING STATIONS. ...................................... 20FIGURE 5A-B. KING HARBOR (A) AND MARINA DEL REY (B) SAMPLING STATIONS.................................................... 21FIGURE 6A-B. VENTURA HARBOR (A) AND CHANNEL ISLANDS HARBOR (B) SAMPLING STATIONS. ........................... 22FIGURE 7. MUGU LAGOON SAMPLING STATIONS ........................................................................................................ 23FIGURE 8A-C. MCGRATH LAKE (A), BALLONA CREEK (B), AND COLORADO LAGOON (C) SAMPLING STATIONS. ....... 24FIGURE 9A-C. VENTURA RIVER ESTUARY (A), SANTA CLARA RIVER ESTUARY (B), AND MALIBU LAGOON (C)
SAMPLING STATIONS. ......................................................................................................................................... 25FIGURE 10. NUMBER OF INDUSTRIAL HARBOR STATION SAMPLES EXCEEDING EITHER THE ERL OR ERM SEDIMENT
QUALITY GUIDELINES. ...................................................................................................................................... 172FIGURE 11A-C. DISTRIBUTION OF SEDIMENT SAMPLES IN OUTER LOS ANGELES AND LONG BEACH HARBOR (A), PORT
HUENEME (B), AND PALOS VERDES (C) EXCEEDING THE ERM FOR COPPER.................................................... 173FIGURE 12A-B. DISTRIBUTION OF SEDIMENT SAMPLES IN INNER LOS ANGELES AND LONG BEACH HARBOR (A), AND
CONSOLIDATED SLIP (B) EXCEEDING THE ERM FOR COPPER. .......................................................................... 174FIGURE 13A-C. DISTRIBUTION OF SEDIMENT SAMPLES IN OUTER LOS ANGELES AND LONG BEACH HARBOR (A), PORT
HUENEME (B), AND PALOS VERDES (C) EXCEEDING THE ERM FOR TOTAL CHLORDANE................................. 175FIGURE 14A-B. DISTRIBUTION OF SEDIMENT SAMPLES IN INNER LOS ANGELES AND LONG BEACH HARBOR (A), AND
CONSOLIDATED SLIP (B) EXCEEDING THE ERM FOR TOTAL CHLORDANE. ....................................................... 176FIGURE 15A-C. DISTRIBUTION OF SEDIMENT SAMPLES IN OUTER LOS ANGELES AND LONG BEACH HARBOR (A), PORT
HUENEME (B), AND PALOS VERDES (C) EXCEEDING THE ERM FOR TOTAL PCB. ............................................ 177FIGURE 16A-B. DISTRIBUTION OF SEDIMENT SAMPLES IN INNER LOS ANGELES AND LONG BEACH HARBOR (A), AND
CONSOLIDATED SLIP (B) EXCEEDING THE ERM FOR TOTAL PCB. ................................................................... 178FIGURE 17A-C. DISTRIBUTION OF SEDIMENT SAMPLES IN OUTER LOS ANGELES AND LONG BEACH HARBOR (A), PORT
HUENEME (B), AND PALOS VERDES (C) EXCEEDING THE ERM FOR HIGH MOLECULAR WEIGH PAH. ............. 179FIGURE 18A-B. DISTRIBUTION OF SEDIMENT SAMPLES IN INNER LOS ANGELES AND LONG BEACH HARBOR (A), AND
CONSOLIDATED SLIP (B) EXCEEDING THE ERM FOR HIGH MOLECULAR WEIGH PAH. .................................... 180FIGURE 19A-C. ERM QUOTIENT VALUES AT OUTER LOS ANGELES AND LONG BEACH HARBOR (A), PORT HUENEME
(B), AND PALOS VERDES (C) SAMPLING STATIONS........................................................................................... 181FIGURE 20A-B. ERM QUOTIENT VALUES AT INNER LOS ANGELES AND LONG BEACH HARBOR (A), AND
CONSOLIDATED SLIP (B) SAMPLING STATIONS. ................................................................................................ 182FIGURE 21A-C. TOXICITY OF SEDIMENT SAMPLES IN OUTER LOS ANGELES AND LONG BEACH HARBOR (A), PORT
HUENEME (B), AND PALOS VERDES (C). .......................................................................................................... 183FIGURE 22A-B. TOXICITY OF SEDIMENT SAMPLES IN INNER LOS ANGELES AND LONG BEACH HARBOR (A), AND
CONSOLIDATED SLIP (B)................................................................................................................................... 184FIGURE 23A-C. TOXICITY OF POREWATER SAMPLES IN OUTER LOS ANGELES AND LONG BEACH HARBOR (A), PORT
HUENEME (B), AND PALOS VERDES (C). .......................................................................................................... 185FIGURE 24A-B. TOXICITY OF POREWATER SAMPLES IN INNER LOS ANGELES AND LONG BEACH HARBOR (A), AND
CONSOLIDATED SLIP (B)................................................................................................................................... 186FIGURE 25. AMPHIPOD SURVIVAL AT INDUSTRIAL HARBOR STATIONS RELATIVE TO TOTAL CHLORDANE
CONCENTRATIONS............................................................................................................................................ 187FIGURE 26. AMPHIPOD SURVIVAL AT INDUSTRIAL HARBOR STATIONS RELATIVE TO ERMQ AND NUMBER OF ERM
EXCEEDANCES. ................................................................................................................................................ 188FIGURE 27. RELATIONSHIP BETWEEN ABALONE DEVELOPMENT IN 50% POREWATER AT INDUSTRIAL HARBOR
STATIONS RELATIVE TO ERMQ AND NUMBER OF ERM EXCEEDANCES .......................................................... 189FIGURE 28A-C. DISTRIBUTION OF STATIONS IN OUTER LOS ANGELES AND LONG BEACH HARBOR (A), PORT HUENEME
(B), AND PALOS VERDES (C) DEMONSTRATING BENTHIC COMMUNITY STRUCTURE. ....................................... 190FIGURE 29A-B. DISTRIBUTION OF STATIONS IN INNER LOS ANGELES AND LONG BEACH HARBOR (A), AND
CONSOLIDATED SLIP (B) DEMONSTRATING BENTHIC COMMUNITY STRUCTURE............................................... 191FIGURE 30. RELATIVE BENTHIC INDEX AT INDUSTRIAL HARBOR STATIONS IN RELATION TO ERMQ AND NUMBER OF
ERM EXCEEDANCES........................................................................................................................................ 192

xi
FIGURE 31. NUMBER OF MARINA STATION SAMPLES EXCEEDING EITHER THE ERL OR ERM SEDIMENT QUALITY
GUIDELINES. ..................................................................................................................................................... 193FIGURE 32A-B. DISTRIBUTION OF SEDIMENT SAMPLES IN SHORELINE MARINA (A), AND LOS ALAMITOS BAY (B),
EXCEEDING THE ERM FOR COPPER.................................................................................................................. 194FIGURE 33A-B. DISTRIBUTION OF SEDIMENT SAMPLES IN KING HARBOR (A), AND MARINA DEL REY (B) EXCEEDING
THE ERM FOR COPPER..................................................................................................................................... 195FIGURE 34. DISTRIBUTION OF SEDIMENT SAMPLES IN CHANNEL ISLANDS HARBOR EXCEEDING THE ERM FOR COPPER.
......................................................................................................................................................................... 196FIGURE 35A-B. DISTRIBUTION OF SEDIMENT SAMPLES IN SHORELINE MARINA (A), AND LOS ALAMITOS BAY (B),
EXCEEDING THE ERM FOR ZINC. ..................................................................................................................... 197FIGURE 36A-B. DISTRIBUTION OF SEDIMENT SAMPLES IN KING HARBOR (A), AND MARINA DEL REY (B) EXCEEDING
THE ERM FOR COPPER..................................................................................................................................... 198FIGURE 37. DISTRIBUTION OF SEDIMENT SAMPLES IN CHANNEL ISLANDS HARBOR EXCEEDING THE ERM FOR ZINC.
......................................................................................................................................................................... 199FIGURE 38A-B. DISTRIBUTION OF SEDIMENT SAMPLES IN SHORELINE MARINA (A), AND LOS ALAMITOS BAY (B),
EXCEEDING THE ERM FOR TOTAL CHLORDANE............................................................................................... 200FIGURE 39A-B. DISTRIBUTION OF SEDIMENT SAMPLES IN KING HARBOR (A), AND MARINA DEL REY (B) EXCEEDING
THE ERM FOR TOTAL CHLORDANE.................................................................................................................. 201FIGURE 40. DISTRIBUTION OF SEDIMENT SAMPLES IN CHANNEL ISLANDS HARBOR EXCEEDING THE ERM FOR TOTAL
CHLORDANE..................................................................................................................................................... 202FIGURE 41A-B. DISTRIBUTION OF SEDIMENT SAMPLES IN SHORELINE MARINA (A), AND LOS ALAMITOS BAY (B),
EXCEEDING THE ERM FOR TOTAL PCB. .......................................................................................................... 203FIGURE 42A-B. DISTRIBUTION OF SEDIMENT SAMPLES IN KING HARBOR (A), AND MARINA DEL REY (B) EXCEEDING
THE ERM FOR TOTAL PCB. ............................................................................................................................. 204FIGURE 43. DISTRIBUTION OF SEDIMENT SAMPLES IN CHANNEL ISLANDS HARBOR EXCEEDING THE ERM FOR TOTAL
PCB. ................................................................................................................................................................ 205FIGURE 44A-B. ERM QUOTIENT VALUES AT SHORELINE MARINA (A), AND LOS ALAMITOS BAY (B). ..................... 206FIGURE 45A-B. ERM QUOTIENT VALUES KING HARBOR (A), AND MARINA DEL REY (B). ....................................... 207FIGURE 46. ERM QUOTIENT VALUES AT CHANNEL ISLANDS HARBOR STATIONS. ................................................... 208FIGURE 47A-B. TOXICITY OF SEDIMENT SAMPLES AT SHORELINE MARINA (A), AND LOS ALAMITOS BAY (B). ........ 209FIGURE 48A-B. TOXICITY OF SEDIMENT SAMPLES AT KING HARBOR (A), AND MARINA DEL REY (B). ..................... 210FIGURE 49A-B. TOXICITY OF SEDIMENT SAMPLES AT VENTURA HARBOR (A), AND CHANNEL ISLANDS HARBOR (B).
......................................................................................................................................................................... 211FIGURE 50. AMPHIPOD SURVIVAL AT MARINA STATIONS IN RELATION TO COPPER AND TBT CONCENTRATIONS..... 212FIGURE 51A-B. DISTRIBUTION OF STATIONS IN SHORELINE MARINA (A), AND LOS ALAMITOS BAY (B),
DEMONSTRATING BENTHIC COMMUNITY STRUCTURE...................................................................................... 213FIGURE 52A-B. DISTRIBUTION OF STATIONS IN KING HARBOR (A), AND MARINA DEL REY (B), DEMONSTRATING
BENTHIC COMMUNITY STRUCTURE. ................................................................................................................ 214FIGURE 53A-B. DISTRIBUTION OF STATIONS IN VENTURA HARBOR (A), AND CHANNEL ISLANDS HARBOR (B),
DEMONSTRATING BENTHIC COMMUNITY STRUCTURE...................................................................................... 215FIGURE 54. NUMBER OF LAGOON STATION SAMPLES EXCEEDING EITHER THE ERL OR ERM SEDIMENT QUALITY
GUIDELINES. ..................................................................................................................................................... 216FIGURE 55. DISTRIBUTION OF SEDIMENT SAMPLES IN MUGU LAGOON EXCEEDING THE ERM FOR ZINC. ................. 217FIGURE 56A-C. DISTRIBUTION OF SEDIMENT SAMPLES IN MCGRATH LAKE (A), BALLONA CREEK (B), AND COLORADO
LAGOON/SIMS POND (C) EXCEEDING THE ERM FOR ZINC. .............................................................................. 218FIGURE 57. DISTRIBUTION OF SEDIMENT SAMPLES IN MUGU LAGOON EXCEEDING THE ERM FOR TOTAL CHLORDANE.
......................................................................................................................................................................... 219FIGURE 58A-C. DISTRIBUTION OF SEDIMENT SAMPLES IN MCGRATH LAKE (A), BALLONA CREEK (B), AND COLORADO
LAGOON/SIMS POND (C) EXCEEDING THE ERM FOR TOTAL CHLORDANE........................................................ 220FIGURE 59. DISTRIBUTION OF SEDIMENT SAMPLES IN MUGU LAGOON EXCEEDING THE ERM FOR DIELDRIN........... 221FIGURE 60A-C. DISTRIBUTION OF SEDIMENT SAMPLES IN MCGRATH LAKE (A), BALLONA CREEK (B), AND COLORADO
LAGOON/SIMS POND (C) EXCEEDING THE ERM FOR DIELDRIN. ....................................................................... 222FIGURE 61. DISTRIBUTION OF SEDIMENT SAMPLES IN MUGU LAGOON EXCEEDING THE ERM FOR TOTAL PCB....... 223FIGURE 62A-C. DISTRIBUTION OF SEDIMENT SAMPLES IN MCGRATH LAKE (A), BALLONA CREEK (B), AND COLORADO
LAGOON/SIMS POND (C) EXCEEDING THE ERM FOR TOTAL PCB. ................................................................... 224FIGURE 63. ERM QUOTIENT VALUES AT MUGU LAGOON STATIONS........................................................................ 225

xii
FIGURE 64A-C. ERM QUOTIENT VALUES AT MCGRATH LAKE (A), BALLONA CREEK (B), AND COLORADO
LAGOON/SIMS POND (C). ................................................................................................................................. 226FIGURE 65. TOXICITY OF SEDIMENT SAMPLES AT MUGU LAGOON STATIONS. .......................................................... 227FIGURE 66A-C. TOXICITY OF SEDIMENT SAMPLES AT MCGRATH LAKE (A), BALLONA CREEK (B), AND COLORADO
LAGOON/SIMS POND (C). ................................................................................................................................. 228FIGURE 67A-C. TOXICITY OF SEDIMENT SAMPLES AT VENTURA RIVER ESTUARY (A), SANTA CLARA RIVER ESTUARY
(B), AND MALIBU LAGOON (C). ........................................................................................................................ 229FIGURE 68. AMPHIPOD SURVIVAL IN RELATION TO DIELDRIN CONCENTRATIONS AT LAGOON STATIONS. ................ 230FIGURE 69. AMPHIPOD SURVIVAL RELATIVE TO ERM QUOTIENT AND ERM EXCEEDANCES AT LAGOON STATIONS.
......................................................................................................................................................................... 231FIGURE 70. DISTRIBUTION OF STATIONS IN MUGU LAGOON DEMONSTRATING BENTHIC COMMUNITY STRUCTURE. 232

xiii
LIST OF TABLES
TABLE 1. DESCRIPTIONS OF SAMPLES COLLECTED AS PART OF BPTCP/NOAA MONITORING IN THE LOS ANGELES
REGION. ............................................................................................................................................................. 17TABLE 2. DRY WEIGHT TRACE METAL MINIMUM DETECTION LIMITS (MDL). .......................................................... 33TABLE 3: DRY WEIGHT MINIMUM DETECTION LIMITS OF CHLORINATED PESTICIDES ................................................. 35TABLE 4. DRY WEIGHT DETECTION LIMITS OF NIST PCB CONGENERS. ................................................................... 36TABLE 5. DRY WEIGHT MINIMUM DETECTION LIMITS FOR ADDITIONAL PCB CONGENERS. ........................................ 37TABLE 6: DRY WEIGHT MINIMUM DETECTION LIMITS OF CHLORINATED TECHNICAL GRADE MIXTURES................... 37TABLE 7: DRY WEIGHT MINIMUM DETECTION LIMITS OF POLYAROMATIC HYDROCARBONS IN TISSUE ..................... 38TABLE 8. DRY WEIGHT MINIMUM DETECTION LIMITS OF ORGANOMETALLIC COMPOUNDS....................................... 38TABLE 9. COMPARISON OF SEDIMENT SCREENING LEVELS DEVELOPED BY NOAA AND THE STATE OF FLORIDA ........ 54TABLE 10. CONCENTRATIONS OF NON-GUIDELINE CHEMICALS RELATIVE TO THE BPTCP DATABASE. ....................... 55TABLE 11. MINIMUM SIGNIFICANT DIFFERENCE (MSD) VALUES CALCULATED FOR SELECTED TOXICITY TESTS. ....... 57TABLE 12. ERM AND PEL QUOTIENTS AND NUMBER OF SEDIMENT QUALITY GUIDELINE EXCEEDANCES AT
INDUSTRIAL HARBOR STATIONS....................................................................................................................... 103TABLE 13. SURVIVAL OF AMPHIPODS RHEPOXYNIUS ABRONIUS (RA) OR EOHAUSTORIUS ESTUARIUS (EE) IN
INDUSTRIAL HARBOR STATION SEDIMENTS.. ................................................................................................... 108TABLE 14A. DEVELOPMENT OF ABALONE EMBRYOS (HALIOTIS RUFESCENS) IN INDUSTRIAL HARBOR STATION PORE
WATERS (100% CONCENTRATION). .................................................................................................................. 115TABLE 14B. DEVELOPMENT OF ABALONE EMBRYOS (HALIOTIS RUFESCENS) IN INDUSTRIAL HARBOR STATION PORE
WATERS (50% CONCENTRATION). .................................................................................................................... 120TABLE 14C. DEVELOPMENT OF ABALONE EMBRYOS (HALIOTIS RUFESCENS) IN INDUSTRIAL HARBOR STATION PORE
WATERS (25% CONCENTRATION).. ................................................................................................................... 125TABLE 15. SPEARMAN RANK CORRELATION COEFFICIENTS FOR SELECTED CHEMICALS SIGNIFICANTLY CORRELATED
WITH AMPHIPOD SURVIVAL AT INDUSTRIAL HARBOR STATIONS.. ..................................................................... 130TABLE 16. SPEARMAN RANK CORRELATION COEFFICIENTS FOR SELECTED CHEMICALS SIGNIFICANTLY CORRELATED
WITH ABALONE DEVELOPMENT IN 25% PORE WATER AT INDUSTRIAL HARBOR STATIONS. ............................... 131TABLE 17. RELATIVE BENTHIC INDEX VALUES FOR INDUSTRIAL HARBOR STATIONS................................................ 132TABLE 18. SPEARMAN RANK CORRELATION COEFFICIENTS FOR SELECTED CHEMICALS SIGNIFICANTLY NEGATIVELY
CORRELATED WITH BENTHIC COMMUNITY STRUCTURE (AS RELATIVE BENTHIC INDEX) AT INDUSTRIAL HARBOR
STATIONS.. ....................................................................................................................................................... 137TABLE 19A. RESULTS OF PRINICIPAL COMPONENTS ANALYSIS (PCA) OF AMPHIPOD SURVIVAL IN TOXICITY TESTS,
BENTHIC COMMUNITY STRUCTURE METRICS, AND CHEMICALS MEASURED IN INDUSTRIAL HARBOR SEDIMENTS........................................................................................................................................................................... 138
TABLE 19B. RESULTS OF PRINICIPAL COMPONENTS ANALYSIS (PCA) OF ABALONE DEVLOPMENT IN TOXICITY TESTS,BENTHIC COMMUNITY STRUCTURE METRICS, AND CHEMICALS MEASURED IN INDUSTRIAL HARBOR SEDIMENTS........................................................................................................................................................................... 139
TABLE 20. SPEARMAN RANK CORRELATION COEFFICIENTS FOR AMPHIPOD SURVIVAL OR ABALONE EMBRYO
DEVELOPMENT IN LABORATORY TOXICITY TESTS SIGNIFICANTLY CORRELATED WITH BENTHIC COMMUNITY
STRUCTURE METRICS MEASURED AT INDUSTRIAL HARBOR STATIONS ............................................................. 140TABLE 21A. RESULTS OF TOTAL DDT AND TOTAL PCB TISSUE ANALYSES OF FISH COLLECTED AT SELECTED
INDUSTRIAL HARBOR STATIONS ....................................................................................................................... 141TABLE 21B. RESULTS OF TISUE ANALYSES OF MACOMA NASUTA BIOACCUMULATION TESTS USING SELECTED
INDUSTRIAL HARBOR SEDIMENTS. ................................................................................................................... 142TABLE 22. CATEGORIZATION OF LOS ANGELES REGION INDUSTRIAL HARBOR STATIONS BASED ON CHEMISTRY,
TOXICITY AND BENTHIC COMMUNITY ANALYSIS.. ............................................................................................. 143TABLE 23. ERM AND PEL QUOTIENTS AND NUMBER OF SEDIMENT QUALITY GUIDELINE EXCEEDANCES AT MARINA
STATIONS.. ....................................................................................................................................................... 154TABLE 24. SURVIVAL OF AMPHIPODS RHEPOXYNIUS ABRONIUS (RA) OR EOHAUSTORIUS ESTUARIUS (EE) IN MARINA
STATION SEDIMENTS.. ...................................................................................................................................... 155TABLE 25. SPEARMAN RANK CORRELATION COEFFICIENTS FOR SELECTED CHEMICALS SIGNIFICANTLY CORRELATED
WITH AMPHIPOD SURVIVAL AT MARINA STATIONS............................................................................................ 157TABLE 26. SPEARMAN RANK CORRELATION COEFFICIENTS FOR SELECTED CHEMICALS SIGNIFICANTLY CORRELATED
WITH SEA URCHIN DEVELOPMENT AT THE SEDIMENT-WATER INTERFACE AT MARINA STATIONS ...................... 158

xiv
TABLE 27. RELATIVE BENTHIC INDEX VALUES FOR MARINA STATIONS.. .................................................................. 159TABLE 28. SPEARMAN RANK CORRELATION COEFFICIENTS FOR SELECTED CHEMICALS SIGNIFICANTLY CORRELATED
WITH BENTHIC COMMUNITY STRUCTURE (AS RELATIVE BENTHIC INDEX = BI) AT MARINA STATIONS.. ......... 160TABLE 29. CATEGORIZATION OF LOS ANGELES REGION MARINA STATIONS BASED ON CHEMISTRY, TOXICITY AND
BENTHIC ANALYSIS........................................................................................................................................... 161TABLE 30. ERM AND PEL QUOTIENTS AND NUMBER OF SEDIMENT QUALITY GUIDELINE EXCEEDANCES AT LAGOON
STATIONS.. ....................................................................................................................................................... 163TABLE 31. SURVIVAL OF AMPHIPODS RHEPOXYNIUS ABRONIUS (RA) OR EOHAUSTORIUS ESTUARIUS (EE) IN MARINA
STATION SEDIMENTS. ....................................................................................................................................... 164TABLE 32. SPEARMAN RANK CORRELATION COEFFICIENTS FOR SELECTED CHEMICALS SIGNIFICANTLY CORRELATED
WITH AMPHIPOD SURVIVAL AT LAGOON STATIONS. .......................................................................................... 166TABLE 33. RELATIVE BENTHIC INDEX VALUES FOR LAGOON STATIONS.................................................................... 167TABLE 34. RESULTS OF TISSUE ANALYSES OF FISH COLLECTED FROM MUGU LAGOON. ........................................... 168TABLE 35. CATEGORIZATION OF LOS ANGELES REGION LAGOON STATIONS BASED ON CHEMISTRY, TOXICITY AND
BENTHIC ANALYSIS........................................................................................................................................... 169

xv
LIST OF ABBREVIATIONS
AA Atomic AbsorptionASTM American Society for Testing MaterialsBPTCP Bay Protection and Toxic Cleanup ProgramCDF Cumulative Distribution FrequenciesCDFG California Department of Fish and GameCH Chlorinated HydrocarbonCOC Chain of CustodyCOR Chain of RecordsEDTA Ethylenediaminetetraacetic AcidEMAP Environmental Monitoring and Assessment ProgramEPA U.S. Environmental Protection AgencyERL Effects Range LowERM Effects Range MedianERMQ Effects Range Median Quotient (Mean)EqP Equilibrium Partitioning CoefficientFAAS Flame Atomic Absorption SpectroscopyGC/ECD Gas Chromatograph Electron Capture DetectionGFAAS Graphite Furnace Atomic Absorption SpectroscopyHCl Hydrochloric AcidHDPE High-density PolyethyleneHMW PAH High Molecular Weight Polynuclear Aromatic HydrocarbonsHNO3 Nitric AcidHPLC/SEC High Performance Liquid Chromatography Size ExclusionH2S Hydrogen SulfideIDORG Identification and Organizational NumberKCL Potassium ChlorideLARWQCB Los Angeles Regional Water Quality Control BoardLC50 Lethal Concentration (to 50 percent of test organisms)LMW PAH Low Molecular Weight Polynuclear Aromatic HydrocarbonsMDL Method Detection LimitMDS Multi-Dimensional ScalingMLMLMoss Landing Marine LaboratoriesMPSL Marine Pollution Studies LaboratoryNH3 AmmoniaNOAA National Oceanic and Atmospheric AdministrationNOEC No Observed Effect ConcentrationNS&T National Status and Trends ProgramPAH Polynuclear Aromatic HydrocarbonsPCB Polychlorinated BiphenylPEL Probable Effects LevelPELQ Probable Effects Level Quotient (Mean)

xvi
LIST OF ABBREVIATIONS cont.
PPE Porous PolyethylenePPT Parts Per ThousandPVC Polyvinyl ChlorideQA Quality AssuranceQAPP Quality Assurance Project PlanQC Quality ControlREF ReferenceRWQCB Regional Water Quality Control BoardSEM-AVS Simultaneously Extracted Metals-Acid Volatile SulfideSJSUF San Jose State University FoundationSCCWRP Southern Calif. Coastal Waters Research ProjectSPARC Scientific Planning and Review CommitteeSQC Sediment Quality CriteriaSWRCB State Water Resources Control BoardT TemperatureTBT TributyltinTFE Tefzel TeflonTEL Threshold Effects LevelTIE Toxicity Identification EvaluationTOC Total Organic CarbonTOF Trace Organics FacilityUCSC University of California Santa CruzUSEPA U.S. Environmental Protection AgencyWCS Whole core squeezing
Units1 part per thousand (ppt) = 1 mg/g1 part per million (ppm) = 1 mg/kg, 1 µg/g sed1 part per billion (ppb) = 1 µg/kg, 1 ng/g sed

xvii
LIST OF APPENDICES
Appendix A: Data Base DescriptionAppendix B: Sampling DataAppendix C: Analytical Chemistry Data
Section 1: Trace Metal ConcentrationsSection 2: Trace Metal Concentrations in PorewaterSection 3: Acid Volatile Sulfides and Simultaneous Extracted Metals ConcentrationsSection 4: Pesticide ConcentrationsSection 5: PCB and Arochlor ConcentrationsSection 6: PAH ConcentrationsSection 7: Chemistry Summations and QuotientsSection 8: Bivalve and Fish Tissue Chemistry
Appendix D: Sediment Grain Size and Total Organic Carbon AnalysesAppendix E: Toxicity Test Data
Section 1: Rhepoxynius abronius Survival in SedimentSection 2: Eohaustorius estuarius Survival in SedimentSection 3: Haliotis rufescens Larval Shell Development in Subsurface WaterSection 4: Haliotis rufescens Larval Shell Development in PorewaterSection 5: Strongylocentrotus purpuratus Fertilization in PorewaterSection 6: Strongylocentrotus purpuratus Development in PorewaterSection 7: Strongylocentrotus purpuratus Development in Intact Sediment CoresSection 8: Mytilus Larval Shell Development in Subsurface WaterSection 9: Mytilus Larval Shell Development in PorewaterSection 10: Neanthes arenaceodentata Survival in SedimentSection 11: Neanthes arenaceodentata Weight Change in Sediment
Appendix F: Benthic Community Data

1
INTRODUCTION
In 1989, the California State legislature established the Bay Protection and Toxic CleanupProgram (BPTCP). One of the primary activities of the BPTCP is monitoring andassessment of sediments in selected California bays and estuaries. The assessmentstrategy has generally relied upon application of various components of the SedimentQuality Triad in a weight-of-evidence approach to hot spot determination (Chapman etal., 1987).
In 1992, the Los Angeles Regional Water Quality Control Board (LARWQCB), incooperation with the State Water Resources Control Board (SWRCB), began BPTCPsediment monitoring in the Los Angeles Region. Initial monitoring activities wereconducted in the Los Angeles and Long Beach Harbor areas as part of a three-yearcooperative agreement between the National Oceanic and Atmospheric Administration(NOAA) and the SWRCB. The NOAA/SWRCB studies were designed to investigatesediment conditions in Southern California bays and estuaries (Fairey et al., 1995;Anderson et al., 1996). In addition to results of the first year of this cooperativeagreement, this report contains results of subsequent LARWQCB/BPTCP investigationsconducted throughout the Los Angeles Region.
Purpose
Studies were performed in inner and outer Los Angeles and Long Beach Harbors, PalosVerdes, Shoreline Marina, Los Alamitos Bay, King Harbor, Marina Del Rey, BallonaCreek, Channel Islands Harbor, Ventura Harbor, Port Hueneme, Malibu Lagoon, MuguLagoon, Santa Clara and Ventura River Estuaries, Colorado Lagoon/Simm’s Pond, andMcGrath Lake in the Los Angeles region.
The objectives of the study were as follows:
1.) Characterize the magnitude and relative spatial distribution of pollution-associatedbioeffects in the above-listed water bodies.
2.) Determine relationships between concentrations and mixtures of sediment-associatedchemicals and the occurrence and severity of bioeffects.
3.) Distinguish more severely impacted sediments from less severely impactedsediments.
4.) Use a weight-of-evidence approach based on the Sediment Quality Triad to categorizestations for future work.
Results of these analyses are intended to be combined with existing knowledge ofchemicals of concern, biological effects, and site characteristics to aid in development of

2
hot spot cleanup plans. In addition, these investigations provide an initial step foridentification of reference sites to be used in future monitoring studies.
A Proposed Regional Toxic Hot Spot Cleanup Plan was published by the LARWQCB inDecember 1997. Conclusions presented in this document were partly based on results ofinitial BPTCP studies (LARWQCB, 1997). Much of the data collected as part of theBPTCP had not been reported at the time this document was produced. Consequently,the Cleanup Plan may be revised using results from more recent BPTCP studies presentedin this report. In particular, in future versions of the Plan there is an expectation that (1)other sites may be identified as candidate toxic hot spots; (2) potential toxic hot spots willbe addressed; (3) cleanup levels may be added to the Cleanup Plan; (4) site rankings maychange as new information becomes available. The proposed Regional Toxic Hot SpotCleanup Plan will be revised and presented to the Regional Water Quality Control Boardduring late 1998 or early 1999.
Programmatic Background And Needs
This study was implemented through the Bay Protection and Toxic Cleanup Program(BPTCP). Studies were designed, managed, and coordinated by the LARWQCB, and bythe SWRCB's Bays and Estuaries Unit as a cooperative effort with the CaliforniaDepartment of Fish and Game's (CDFG) Marine Pollution Studies Laboratory. Initialstudies in the LA/Long Beach Harbor area were conducted in cooperation with NOAA'sBioeffects Assessment Branch, and funding in these studies was provided by the SWRCBand NOAA's Coastal Ocean Program.
Although the State Water Board and NOAA have common programmatic needs, they arenot identical. NOAA is mandated by Congress to conduct a program of research andmonitoring on marine pollution. Much of this research is being conducted through theNational Status and Trends (NS&T) Program and the Coastal Ocean Program. TheNS&T Program performs regional intensive studies of the magnitude and extent ofchemical-associated bioeffects in selected coastal embayments and estuaries. The areaschosen for these regional studies are those in which the pollutant concentrations indicatethe greatest potential for biological effects. These biological studies augment the regularchemical monitoring activities of the Program, and provide a means of estimating thetoxicity associated with measured concentrations of sediment pollutants.
The California Water Code, Division 7, Chapter 5.6, Section 13390, mandates theSWRCB and the LARWQCB to provide the maximum protection of existing and futurebeneficial uses of bays and estuarine waters and to plan for remedial actions at thoseidentified toxic hot spots where the beneficial uses are being threatened by toxicpollutants. The BPTCP has four major goals: (1) provide protection of present and futurebeneficial uses of the bay and estuarine waters of California; (2) identify and characterizetoxic hot spots; (3) plan for toxic hot spot cleanup or other remedial or mitigation actions;(4) develop prevention and control strategies for toxic pollutants that will prevent creation

3
of new toxic hot spots or the perpetuation of existing ones within the bays and estuariesof the State.
Field and laboratory work was accomplished under interagency agreement with, andunder the direction of, the CDFG. Sample collection, sample processing, and datamanagement were performed by staff of the San Jose State University Foundation atMoss Landing Marine Laboratories (MLML). MLML staff also performed total organiccarbon (TOC) and grain size analyses, as well as benthic community analyses. Toxicitytesting was conducted by the University of California at Santa Cruz (UCSC) staff at theCDFG toxicity testing laboratory at Granite Canyon, Monterey County. Trace metalsanalyses were performed by CDFG personnel at the trace metal analytical facility atMLML. Synthetic organic pesticides, polycyclic aromatic hydrocarbons (PAHs), andpolychlorinated biphenyls (PCBs) were analyzed at the UCSC trace organics analyticalfacility at Long Marine Laboratory in Santa Cruz.
Study Area
The Los Angeles Region encompasses all coastal drainages flowing to the Pacific Oceanbetween Rincon Point on the coast of western Ventura County, and the eastern LosAngeles County Line, south to the Orange County Line, as well as drainages of the fivecoastal islands (Anacapa, San Nocolas, Santa Barbara, Santa Catalina, and Santa Cruz ). In addition, the region includes all coastal waters within three miles of the continental andcoastal island coastlines.
The enclosed bays, estuaries and coastal waters included in this study are shown in Figure1. The region contains two large deepwater harbors (Los Angeles and Long BeachHarbors) and one smaller deepwater harbor (Port Hueneme). There are small craftmarinas within the harbors, as well as tank farms, naval facilities, fish processing plants,boatyards, and container terminals. Several small craft marinas also occur along the coast(Shoreline Marina, Los Alamitos Bay, Marina del Rey, King Harbor, Channel IslandsHarbor, and Ventura Harbor).
Several large, primarily concrete-lined rivers lead to tidal prisms influenced by marinewaters (eg., Los Angeles River, San Gabriel River). These seasonal rivers drain largeurban areas composed primarily of impermeable surfaces. In addition, several of thesetidal prisms receive a considerable amount of freshwater throughout the year frompublicly-owned treatment plants. Lagoons are located at the mouths of other rivers andcreeks draining relatively undeveloped areas (eg., Mugu Lagoon, Malibu Lagoon,Ventura and Santa Clara River estuaries). There are also a few isolated coastal fresh orbrackish water bodies receiving runoff from agricultural or residential areas (eg.,McGrath Lake, Colorado Lagoon, Sim’s Pond).

2010
Kilometers
�0
5
Kilometers
0 2.5
1
2
3 4
5 1. Los Angeles Harbor2. Long Beach Harbor3. Shoreline Marina4. Colorado Lagoon/Sims Pond5. Los Alamitos Bay
Ventura Marina
Channel Islands Harbor
Mugu Lagoon
Marina Del ReyBallona Creek
King Harbor
Malibu Lagoon
McGrath Lake Estuary
Port Hueneme
Ventura River Estuary
Santa Clara River Estuary
Palos Verdes
California
34.00
33.00
119.00 118.00
118.00119.00
33.00
34.00
Figure 1. Los Angeles Region Study Area.
4

5
Industrial Harbors
Los Angeles and Long Beach Harbors
The Los Angeles and Long Beach Harbors are located in the southeastern portion of theLos Angeles basin. Along the northern portion of San Pedro Bay is a natural embaymentformed by a westerly extension of the coastline that contains both harbors, with the PalosVerdes hills the dominant onshore feature. Offshore, a generally low topographic ridge isassociated with the eastern flank of the Palos Verdes uplift and adjacent Palos Verdesfault zone, and extends northwest across the San Pedro shelf nearly to the breakwater ofthe Los Angeles Harbor.
The port and harbor have been modified over the course of more than one hundred yearsto include construction of breakwaters, landfills, slips and wharves, along withchannelization of drainages, dredging of navigation channels, and reclamation ofmarshland. The inner harbor includes the Main Channel, the East and West Basins, andthe East Channel Basin. The outer harbor is the basin area located between TerminalIsland and the San Pedro and Middle Breakwaters. Both harbors are considered to be oneoceanographic unit, and have a common breakwater across the mouth of San Pedro Bay. The inner harbors are of estuarine character with regards to aquatic life, while the outerharbors reflect the conditions of the coastal marine waters of the Southern CaliforniaBight. Ecological preserves in the area include Point Fermin Marine Life Refuge andSeal Beach National Wildlife Refuge (Port of Los Angeles, 1992).
Beneficial uses for outer Los Angeles and Long Beach Harbors listed by the LARWQCBinclude contact and non-contact water recreation, Navigation, sport fishing, shellfishharvesting, marine habitat, and preservation of rare and endangered species. Beneficialuses for inner Los Angeles and Long Beach Harbors listed by the LARWQCB includecontact and non-contact water recreation, navigation, sport fishing, shellfish harvesting,marine habitat, industrial service supply, and rare and endangered species habitat.
Circulation in the outer harbors results from tidal currents, with the general influx throughAngels and Queens Gates, the two vessel traffic openings, and outflux at the east end ofLong Beach Harbor. Studies have indicated the existence of a large clockwise eddy, orcircular current extending east from the Los Angeles Main Channel to the Navy Mole,and another counter clockwise eddy at a depth of 20 feet. These and other minor eddycurrents are considered to be partly responsible for relatively good quality water in theouter harbor (Port of Los Angeles, 1992).
Inner harbor circulation fluctuates with tidal flow, with less mixing than in the outerharbor. These patterns result in the greatest flushing rates due to tides occurring at theharbor entrances, Angels Gate, Queens Gate, and east of Freeman Island. The lowestflushing rates are in the Cerritos Channel, Middle Harbor, and Main Channel (Port of LosAngeles, 1992).

6
Under the influence of the strong currents and rocky habitat of the outer harbor, aquaticlife resembles that of the nearby coast, with the inner harbor having biota such as thatgenerally found in bays and estuaries. The inner harbor has a mostly soft bottomcharacter, and supports the expected assortment of infaunal worms, molluscs, andcrustacea, epifaunal starfish and sea urchins, and bottom dwelling fish such as halibut. Species common to the hard substrate of the outer harbor, which include the rocky riprapareas, are the blacksmith, kelp bass, señorita, and various surfperches. Both pelagic andepibenthic-demersal fish are common in both the inner and outer harbors, and includeanchovy, white croaker, sardine, and queenfish (Port of Los Angeles, 1992).
In general, the outer harbor areas have a greater species diversity and lower density thaninner harbor areas, with inner harbor species being more abundant than those in the outerharbor. The changes to the physical environment in the harbor areas have altered themakeup of the biological communities present, with water quality conditions in the innerharbor improving over the last ten years (Port of Los Angeles, 1992). There is currentlyan extensive stand of giant kelp (Macrocystis pyrifera) along both sides of the San PedroBreakwater, with large brown algae (Sargassum muticum) and ribbon kelp (Egregiamenziesii) also represented. Kelp is an important source of primary production in thesewaters, and provides both food and habitat for nearshore fish and invertebrates.
The major surface drainages in the area include the Los Angeles River, which flows in achannel and drains parts of the San Fernando Valley into eastern San Pedro Bay at LongBeach. The Dominguez Channel drains the intensely urbanized area west of the LosAngeles River into the Consolidated Slip of the Los Angeles inner harbor, carrying with itmostly urban runoff and nonprocess industrial waste discharges. A major source of bothfreshwater and waste in the outer harbor is secondary effluent from the Terminal IslandTreatment Plant (Port of Los Angeles, 1992). Waste discharges to the inner harbor areaof Los Angeles Harbor consist of contact and non-contact industrial cooling waste water,stormwater runoff, fuel spills and oil spills from marine vessel traffic or dockingfacilities, and drainage from several industrial sites. Several areas of the LosAngeles/Long Beach Harbor complex have been put on the U.S. EPA 303(d) list ofimpaired water bodies by the LARWQCB: the Dominguez Channel Estuary was listedbecause beneficial uses are not supported for aquatic life due to sediment pollution andbenthic community impairment; Consolidated Slip was listed because beneficial uses arenot supported for aquatic life due to sediment pollution and toxicity, benthic communityimpairment, and bioaccumulation; Southwest Slip was listed due to sediment toxicity;and the Cabrillo Pier area was listed because beneficial uses are not supported for aquaticlife due to sediment pollution, sediment toxicity, and bioacummulation of organicchemicals in fish and shellfish tissues.
Sediment studies conducted in the inner and outer LA and Long Beach Harbors includeongoing monitoring of chemistry and benthic community structure at the Terminal IslandSewage Treatment Plant. Sediment chemistry is monitored by the Ports of Los Angelesand Long Beach as part of channel deepening projects, maintenance dredging, andconstruction of new facilities. In addition to these monitoring programs, the State Mussel

7
Watch Program conducts routine bioaccumulation monitoring studies at selected stationsin the LA and Long Beach Harbors.
Port Hueneme
Port Hueneme is a medium-sized deepwater harbor located in Ventura County, north ofMugu Lagoon. The total size of the harbor is 121 acres. Part of it was operated by a U.S.Navy Construction Battalion, which is now closed, while the rest of the harbor serves as acommercial port operated by the Oxnard Harbor District. The construction of a majority ofthe harbor was completed in 1975. The commercial side generally serves ocean-goingcargo vessels and oil supply boats; the latter serves the oil platforms in the Santa BarbaraChannel. The LARWQCB listed the harbor's beneficial uses as process water supply,contact and noncontact water recreation, navigation, marine habitat, and commercialfishing. Two endangered bird species may use the harbor, the California brown pelican andthe California least tern.
Sediment core samples analyzed in 1985 as part of a proposed dredge project indicatedrelatively low levels of metals, with pesticides below the analytical detection limits(LARWQCB, 1995). Few other sources of information exist on water quality in the portoutside of work conducted by the State Mussel Watch (SMW). Recent PAH analyses oftransplanted mussels conducted by the SMW program have indicated high levels on boththe commercial and Navy sides of the harbor. In addition, this study detected elevated zincand PCBs on the commercial and Navy sides of the port, respectively. A 1988 SMW TBTstudy revealed elevated levels of TBT in oyster and mussel tissue, moderately high watercolumn levels, and low mortality with some chambering or stunting. In terms of pollutantconcentrations and their effects, this harbor is the least well studied in the Los AngelesRegion (LARWQCB, 1995). Port Hueneme has been put on the U.S. EPA 303(d) list ofimpaired water bodies by the LARWQCB because beneficial uses are not supported foraquatic life due to sediment pollution and toxicity.
Marinas
Shoreline Marina
Shoreline Marina was constructed in the late 1970s near the entrance of Queensway Bay,just east of the Port of Long Beach. The marina is primarily a small craft harbor. It alsoserves as a fish nursery and bird foraging area.
Limited sediment quality data are available from Regional Board sediment sampling in1988, and a State Board report on TBT pollution. Regional Board sediment samplingindicated levels of lead and zinc were somewhat elevated (up to 91 and 130 ppm,respectively). This is likely a reflection of the proximity of the marina to the mouth of theLos Angeles River which drains into Queensway Bay. The State Board report indicatedelevated water levels of TBT (up to 150 PPT), but only trace amounts of TBT were in thesediment. DBT and MBT, however, were found at high levels in the sediment. There are a
8
large number of recreational craft berthed in the marina and leaching of their antifoulingpaints are the likely source of the TBT.
The beneficial uses of the marina are: noncontact water recreation, preservation of rareand endangered species, and marine habitat. The toxic hot spot status of ShorelineMarina is currently unknown due to scarcity of available data. The marina is not listedseparately in the Water Quality Assessment and may be considered part of QueenswayBay.
Alamitos Bay
Alamitos Bay is composed of a variety of subareas: the Marine Stadium, a recreation facilitybuilt in 1932 and used for boating, water skiing, and jet skiing; Long Beach Marina, whichcontains five smaller basins for recreational craft and a boatyard; a variety of public andprivate berths; and the Bay proper which includes several small canals, a bathing beach, andseveral popular clamming areas. The Bay and marina serve as a fish nursery and birdforaging area. Additional beneficial uses identified by the LARWQCB include contact andnoncontact water recreation, commercial and sportfishing for fish and shellfish, and habitatfor rare and endangered species. The total acreage of Alamitos Bay is 285 acres.
The Bay receives nonpoint source runoff from a number of storm drains in addition toleaching of boat paint (LARWQCB, 1995). The Bay receives flow via the Marine Stadium,from Los Cerritos Channel, and a flood control structure that drains a large portion of theadjacent cities of east Long Beach, Lakewood, and Bellflower.
A limited amount of recent contamination data is available for the Bay. State MusselWatch stations sampled in the mid-1980s revealed slightly elevated levels of zinc,cadmium, TBT, and PCBs. A 1986 statewide study found moderately elevated levels ofTBT in the water column (as high as 93 ppt) as well as moderately elevated levels in thesediment (up to 540 ppb; LARWQCB, 1995). Regional Board sediment samplingconducted in 1988 found moderately elevated levels of lead and zinc (up to 59 and 110ppm, respectively) in the Long Beach Marina portion of the Bay (LARWQCB, 1995).
The Los Cerritos Channel tidal prism starts at Anaheim Road and connects with AlamitosBay through the Marine Stadium; the wetland connects to the Channel a short distance fromthe lower end of the Channel. The wetlands, and portion of the channel near the wetlands,is an overwintering site for a great diversity of birds (up to 50 species) despite its small size. An endangered bird species, the Belding's Savannah Sparrow, may nest there and an areaadjacent to the wetlands is a historic least tern colony site. One small marina is located inthe channel that is also used by rowing teams and is a popular fishing area.
State Mussel Watch stations surveyed in the mid-1980s in Los Cerritos Channel showedsomewhat elevated levels of chlordane and PCBs, and sediment analyses from dredgingprojects indicated moderately elevated levels of arsenic, chromium, copper, and zinc(LARWQCB, 1995). The Los Cerritos Channel has been put on the U.S. EPA 303(d) list

9
of impaired water bodies by the LARWQCB due to elevated ammonia, sedimentcontamination, and elevated coliform levels.
King Harbor
King Harbor is located in southern Santa Monica Bay in the city of Redondo Beach. Construction of the harbor initially began in 1937; however, an effective breakwater wasnot built until the 1950s and inner harbor areas were not developed into their current basinformation until the 1960s. It is primarily a small craft harbor approximately 90 acres insize.
The harbor is utilized by a diverse array of marine flora and fauna and is also a resting andfeeding habitat for many species of marine birds. A generating station located near theharbor both takes in and discharges water at the harbor, thus providing some cycling withinthe waterbody. The harbor's location at the mouth of the Redondo Submarine Canyoncreates upwelling of nutrient-rich water into the harbor during the summer. The beneficialuses of the harbor listed by the LARWQCB include industrial service supply, noncontactwater recreation, commercial and sportfishing, protection of rare and endangered species,and marine habitat.
As part of biennial surveys conducted by the Southern California Edison-Redondo BeachGenerating Station (SCE), data on sediment chemistry (metals Cr, Cu, Ni, and Zn), benthiccommunity structure, and bioaccumulation are collected. Most of the SCE monitoringstations are concentrated in what might be considered the "outer harbor" where thedischarge occurs. Sediment chemistry concentrations were relatively low in 1990. Tissueconcentrations of these metals were also quite low with the exception of slightly elevatedzinc levels. Infaunal and nekton communities were found to be undegraded (LARWQCB,1995).
LARWQCB sediment sampling conducted in 1988 in Basins 1 and 2 found moderatelyelevated copper and zinc levels. SMW sampling conducted in 1987 found elevated levelsof both copper and zinc (172 and 682 ppm, respectively) at a station located near theboatyard in Basin 1. Low levels of organic chemical compounds were found in the 1987SMW survey.
The surface water microlayer was sampled and analyzed by Southern California CoastalWater Research Project (SCCWRP) in 1986, and low concentrations of most metals werefound in both the dissolved and particulate fractions of the samples. Both copper and zinc,however, were found at over 1 ppm in the dissolved fraction. DDE was found at 26 ppb,along with moderately elevated levels of PAHs (dominated by high molecular weightPAHs, indicating combustion as the major source). Results of a microlayer toxicity testindicated about one-third of the larval kelp bass experienced mortality in the sample andabout 50% showed various abnormalities. The toxicity and abnormalities, however, did notappear to be linked to any measured pollutant concentration (Cross et al., 1987).

10
In a 1988 TBT study conducted by Fish and Game, moderate oyster mortality wasdiscovered in oysters transplanted into Basin 1; those that survived showed stunted shellgrowth (LARWQCB, 1995). TBT water levels ranged from moderate to high (up to 140ppt). Oyster tissue levels (420 ppb) were an order of magnitude lower than the musseltissue levels (6.2 ppm).
Marina Del Rey
Marina Del Rey harbor was created in the early 1960s from part of Ballona Wetlands. Thepresent Mother's Beach in Basin D was created on the site of the former Lake Los Angeles.Flushing and circulation in the 354-acre harbor tends to be poor. The harbor is considered afish nursery and a likely least tern foraging site for the Venice Beach nesting colony. Theharbor contains many species common to shallow-water embayments (Soule et al., 1997).The beneficial uses of most of the harbor include contact and noncontact water recreation,commercial fishing, preservation of rare and endangered species, marine habitat, andshellfish harvesting.
Several storm drains lead into the back basins, and a large flood control channel, BallonaCreek, drains near the harbor mouth. Approximately 6000 pleasure craft are berthed inthe harbor at any one time, the majority of which are scraped or sanded while in the waterto remove fouling organisms and renew bottom paint. One large and one small boatyardare located in the harbor. The former Ballona wetland was apparently the site ofoccasional dumping and some of the effects of this practice may still persist. The formerDow Chemical plant site may also be leaching some contaminants into the Venice Canalsthat drain into the entrance channel.
A considerable number of studies have been conducted in the harbor, mainly by the SMWprogram, and Dr. Dorothy Soule, who is associated with USC. The latest report on harbormonitoring (1997) indicates some increased PCB inputs may be occurring, possibly fromrelease of historic polluted soil from construction sites during storms (Soule et al., 1997). Earlier investigations into sediment contamination suggested that Ballona Creek is a majorsource of pollutants to the harbor; however, the heaviest pollution within the marina properwas in the back basins. Metals pollution was increasing, and some pesticide concentrationswere also increasing. Studies conducted in 1987 included investigation of sediment toxicity(Soule et al., 1997). No acute toxicity was found but there was some indication of chronictoxicity. Parts of the marina water column were found to be highly polluted with TBT. Levels of sediment pollutants were correlated with benthic impacts (Soule et al., 1997). There are likely a variety of sources of pollutants in Marina Del Rey including storm drainsand anti-fouling paints. SMW results show a gradient in pollution with concentrationsincreasing towards the back of the marina. Both Cu and Zn concentrations tend to be highin the back basins (LARWQCB, 1995). A SWRCB-CDFG TBT study conducted in 1988found high levels of TBT in oysters and mussels, high levels in the water columnparticularly in the back basins, and high mortality or stunting of growth in transplantedoysters (LARWQCB, 1995). Marina Del Rey has been put on the U.S. EPA 303(d) list of

11
impaired water bodies by the LARWQCB due to sediment pollution and toxicity, andbioaccumulation of chemicals in shellfish tissue.
Ventura Marina:
Ventura Marina is a small craft harbor located between the mouths of the Ventura andSanta Clara Rivers. It is home to numerous small boats and two boatyards. The "VenturaKeys" area of the marina is a residential area situated along three canals. The marina issurrounded by agricultural land and a large unlined ditch drains into the Keys area. Sincethe marina is between the mouths of two rivers which discharge large sediment loadsfrom their relatively undeveloped watersheds, the marina has a constant problem withsedimentation in the entrance.
The marina's beneficial uses are: industrial service supply, navigation, contact andnoncontact water recreation, commercial and sportfishing, marine habitat, wildlifehabitat, and shellfish harvesting. The Keys beneficial uses are the same with theexception of shellfish harvesting and industrial service supply.
The Ventura Harbor complex includes approximately 50 acres of open water area andapproximately 70 acres of mooring areas. Approximately 1500 craft, including 10 sportfishing and 73 commercial fishing vessels, are moored in Ventura Harbor. A commercialfish processing facility, offshore oil drilling support facility and headquarters for theChannel Islands National Park are based at Ventura Harbor. Two boat launching rampsfor public use are provided in the harbor.
Ventura Harbor has been put on the U.S. EPA 303(d) list of impaired water bodies by theLARWQCB due to elevated coliform concentrations.
Channel Islands Harbor
Channel Islands Harbor is a recreational boating marina located south of the Santa ClaraRiver. Beneficial uses of the harbor include contact and noncontact water recreation,navigation, commercial and sportfishing, and marine habitat, and industrial servicesupply. Adjacent land uses include urban developments and agriculture land. The inletcanal to the Southern California Edison Ormond Beach power plant is located at the northend of the harbor.
SMW surveys from the early and mid-1980s revealed low to intermediate levels of metalsand organic chemical compounds (LARWQCB, 1995). One exception occurred in 1986when transplanted mussels accumulated 2 ppm of total DDT. Sediment sampling formetals conducted by Regional Board staff in 1988 revealed slightly to moderatelyelevated levels (LARWQCB, 1995). A 1986 State Board-CDFG study of TBTcontamination in harbors revealed elevated levels of TBT in the water column andmoderately elevated levels in the sediment (LARWQCB, 1995).

12
Lagoons and River Mouths
Malibu Lagoon
Malibu Lagoon is a coastal wetland located on the northern end of Santa Monica Bay. Total acreage of estuarine open water, tidal channels and wetlands is estimated to be 29acres. Owned by the California Department of Parks and Recreation, the lagoon isoperated as a state park for wildlife habitat and passive recreation. Like most coastalwetlands, the lagoon provides habitat for several threatened or endangered bird species, aswell as spawning and nursery ground habitat for marine and estuarine vertebrate andinvertebrate species. Freshwater flow into the lagoon is dominated by Malibu Creek andtreated wastewater discharges. Malibu Creek is considered to be the southernmost rangeof the endangered steelhead trout. The watershed area is approximately 109 square miles(CERES, 1998). In addition to Malibu Creek, inputs include runoff from residentialdevelopment of Malibu Colony, a golf course, the Pacific Coast Highway, andcommercial developments to the north. Malibu Lagoon has been put on the U.S. EPA303(d) list of impaired water bodies by the LARWQCB due to bioaccumulation ofchemicals in shellfish tissue, degraded benthic community, elevated coliforms, andexcessive fresh water.
Mugu Lagoon
Mugu Lagoon is a 1500-acre coastal lagoon located approximately 40 miles north ofSanta Monica Bay. This lagoon is one of the few remaining salt marshes in southernCalifornia along the Pacific Flyway. The peregrine falcon, least tern, light-footed clapperrail, and brown pelican are examples of threatened and endangered species that aresupported by habitats within Mugu Lagoon. In addition to providing one of the fewremaining habitats on the mainland for harbor seals to pup, Mugu Lagoon is a nurseryground for many marine fish and mammals.
Mugu Lagoon is the receiving water body for the Calleguas Creek watershed as well asthe agricultural fields of the Oxnard plain. The lagoon borders on an Area of SpecialBiological Significance and supports a great diversity of wildlife. The Point Mugu NavalAir Base is also located in the immediate vicinity of the lagoon. Calleguas Creek and itsmajor tributaries (Revolon Slough, Conejo Creek, Arroyo Creek, Arroyo Santa Rosa, andArroyo Simi) drain an area of 343 square miles in southern Ventura County and a smallportion of western Los Angeles County. Due to high erosion rates in the watershed andconsiderable channelization of Calleguas Creek, sedimentation rates are high enough inthe watershed that the lagoon could be filled with sediment within 50 years (LARWQCB,1997).
The Eastern Arm of the lagoon is somewhat removed from the rest of the lagoon andtends to receive water from and drain directly into the lagoon mouth. The water tends tobe marine in character the majority of time. The western arm has slower water flow andhas the most widespread freshwater influence during wet weather, receiving water from

13
several drains. The Main lagoon is affected primarily by Calleguas Creek, which carries aconsiderable amount of water during storms, although this flow is generally funneled intoa channel that flows to the lagoon mouth.
Previous monitoring of Mugu Lagoon has identified the following problems: (1) impairedreproduction in the light-footed clapper rail due to elevated levels of DDT and PCBs; (2)fish and shell fishtissue levels which exceeded the National Academy of Sciencesguidelines for several pesticides; (3) possible exceedances of U.S. EPA water qualitycriteria for several metals (nickel, copper, and zinc); (4) possible impacts to sediment andwater quality, as well as aquatic community health, from operations at the Naval AirBase. Several banned pesticides continue to be found in high concentrations in thelagoon’s sediments and biota (LARWQCB, 1997). Mugu Lagoon has been put on theU.S. EPA 303(d) list of impaired water bodies by the LARWQCB due to sedimentpollution, bioaccumulation of chemicals in shellfish tissue, impaired bird reproduction,and excessive sediment. The Calleguas Creek Estuary has been listed due to sedimentpollution, water column toxicity, and excessive nitrates, ammonia, and turbidity.
McGrath Lake
McGrath Lake is a 40-acre lake within McGrath State Beach and is owned by theCalifornia State Parks and Recreation Department. The area is managed for low intensityuses such as hiking and nature observation. Adjacent uses include oil-related facilities tothe north and a power plant to the south. To the east are park land and agricultural fields.A public beach is immediately adjacent to the west end of the lake. There is no oceanoutlet to the lake but waves occasionally overwash the beach berm. Water is pumpedfrom the lake to the ocean throughout most of the year to maintain a lower lake level andavoid flooding of upstream agriculture fields. In addition, the Lake is breechedintermittently at the southern edge during the wet season to prevent flooding of adjacentagriculture fields. Water sources to the lake include fresh and seawater groundwaterseepage, and irrigation water runoff. McGrath Lake was included in the LARWQCB1996 list of 303(d) impaired water bodies due to sediment pollution (elevated pesticides)and toxicity. The site was polluted in 1993 when a ruptured pipeline released nearly80,000 gallons of crude oil into an agricultural ditch that drains into the lake. TheMcGrath Lake Trustee Council currently is developing a management plan forremediation and restoration of the lake habitat and beneficial uses.
Ventura River Estuary
Ventura River Estuary lies directly to the west of the city of Ventura and is owned by thecity and the California Department of Parks and Recreation. The estuary comprisesapproximately 10 acres. The total area of the Ventura River watershed is 226 squaremiles. The site is crossed by Highway 101, a city street, Southern Pacific Railroad tracks,and oil and gas pipelines. In addition to the river and its tributaries, inputs into theestuary include urban and agricultural runoff. Adjacent land uses include the VenturaCounty Fairgrounds, the city of Ventura, and agricultural lands to the northwest. There is

14
also an RV park and State Park to the west of the estuary. The estuary is normally subjectto tidal influence but in low flow periods a beach berm restricts tidal flow for shortperiods of time. The LARWQCB listed this site as an impaired water body under Section303 (d) due to eutrophication and elevated levels of DDT in fish and shellfish tissue.
Colorado Lagoon
Colorado Lagoon is a 13-acre saltwater influenced man-made water body created bydredging a mudflat. The lagoon is connected by a tidegate to Alamitos Bay through theMarine Stadium. The gate is left open during the winter and is closed at times during thesummer to retain enough water in the Lagoon for swimming, which is allowed in the westarm of the Lagoon. Nonpoint source runoff enters the Lagoon from six storm drains. TheLagoon was once a popular clamming site and apparently still supports a considerablenumber of cherrystone clams. Additional beneficial uses listed by the LARWQCB includecontact and noncontact water recreation, commercial and sportfishing, habitat for rare andendangered species, and marine habitat.
SMW data from the mid-1980s and tissue sampling of clams and mussels conducted by theLong Beach Health Department indicated lead levels were as high as 15.8 ppm in residentclams, presumably from street runoff. Resident mussels collected in 1985 contained 19ppm lead while mussels transplanted into the Lagoon during 1986 accumulated 18 ppmlead. No other metals were elevated. Total chlordane and DDT were initially high but by1986 had dropped (~300 ppb for each; LARWQCB, 1995). Colorado Lagoon has been puton the U.S. EPA 303(d) list of impaired water bodies by the LARWQCB due to sedimentpollution and toxicity, and bioaccumulation of chemicals in shellfish tissue.

15
METHODS
Sampling for the Los Angeles Region Bay Protection and Toxic Cleanup Program wasconducted in 20 separate sampling periods (called Legs) conducted over a five yearperiod from July 30, 1992 through August 22, 1997 (Table 1). In general, the BPTCPmonitoring strategy was designed to proceed in two phases with an initial screening phasefollowed by confirmation studies. Screening studies typically consisted of somecomponent(s) of the Sediment Quality Triad (Toxicity, Chemistry, and/or BenthicAnalyses after Chapman et al., 1987), and confirmation studies were designed to includeall components of the Triad, as warranted. Confirmation studies also includedbioaccumulation studies at particular stations where the chemicals of concern warrantedthese analyses. The initial Legs of the Los Angeles Region monitoring (Legs 1-4) wereconducted as a cooperative monitoring study between the BPTCP and the NOAA Statusand Trends program, as described above. Several of the Los Angeles Region samplingLegs consisted solely of toxicity monitoring at reference sites in Los Angeles and LongBeach Harbors for comparison to toxicity of San Diego Bay sediments (eg., Legs 19, 20,22, and 23). Later Legs combined screening surveys in water bodies not recentlymonitored, confirmation studies at stations previously demonstrating toxicity or highchemistry, and in some cases, surveys to locate appropriate reference sites for inclusion inreference envelope determinations (as discussed below).
Sample Site Selection
The Magellan Global Positioning System and reference photographs were used toprecisely locate sampling stations. In general, individual sampling locations consisted ofthree field replicates, referred to as stations, with each station located approximately 100to 200 meters apart at the points of a triangle centered over the site. In some cases, moredetailed information on spatial distributions of chemical pollution and toxicity wererequired for individual stations. In this case, additional field replicates were sampledaround one of the points of the triangle. These were located 50 meters apart.
More intensive sampling was conducted in the Consolidated Slip area in order todetermine both the horizontal and vertical extent of chemical contamination andassociated toxicity. Thus, in addition to multiple field replicates at several stations in thisarea, samples were also collected at deeper sediment depths in addition to the 2 cmsurficial samples collected at the majority of BPTCP sampling sites. The collectionmethods for these deeper samples are described in the following section.
In some cases, particularly in later sampling Legs, no field replication was included in thesampling design. In this report, unless otherwise stated, all stations are treated separatelyfor discussion of spatial distribution of chemical pollution and bioeffects. Areal extent ofpollution and bioeffects around a particular site are inferred from field replicate data onlywhen sufficient information is available.

16
The sampling sites were selected to provide a broad representation of conditions andgeneral trends throughout the study area resulting from various pollution sources. Onlyareas having relatively fine-grained (greater than 30 percent fines) sediments weresampled. Potential reference sites were interspersed in the inner and outer industrialharbors, marinas, and lagoons. Stations sampled in the Industrial Harbors, Marinas, andLagoons are shown in Figures 2-9.
Sampling Methods
Summary of Methods
This section describes specific techniques used for collecting and processing samples. Because collection of sediments influences the results of all subsequent laboratory anddata analyses, it is important that samples be collected in a consistent and conventionallyacceptable manner. Field and laboratory technicians were trained to conduct a widevariety of activities using the accepted procedures of EMAP (Weisberg, 1990), NS&T(NOAA, 1991), and ASTM (1992) to ensure comparability in sample collection amongcrews and across geographic areas.
Cleaning Procedures
All sampling equipment (i.e., containers, container liners, scoops, water collectionbottles) was made from non-contaminating materials and was precleaned and packagedprotectively prior to entering the field. Sample collection gear and samples were handledonly by personnel wearing non-contaminating polyethylene gloves. All sample collectionequipment (excluding the sediment sampler) was cleaned by using the followingsequential process: two-day soak and wash in Micro detergent, three tap-water rinses,three deionized water rinses, a three-day soak in 10% HCl, three ASTM Type II Milli-Qwater rinses, air dry, three petroleum ether rinses, and air dry.
All cleaning after the Micro detergent step was performed in a positive pressure "clean"room to prevent airborne contaminants from contacting sample collection equipment. Airsupplied to the clean room was filtered.
The sediment sampler was cleaned prior to entering the field, and between samplingstations, using the following steps: a vigorous Micro detergent wash and scrub, a sea-water rinse, a 10% HCl rinse, and a methanol rinse. The sediment sampler was scrubbedwith seawater between successive deployments at the same station to remove adheringsediments from contact surfaces possibly originating below the sampled layer.Sample storage containers were cleaned in accordance with the type of analysis to beperformed upon its contents. All containers were cleaned in a positive pressure "clean"room with filtered air to prevent airborne contaminants from contacting sample storagecontainers.

17
Plastic containers (HDPE or TFE) for trace metal analysis media (sediment, archivesediment, pore water) were cleaned by: a two-day Micro detergent soak, three tap-waterrinses, three deionized water rinses, a three-day soak in 10% HCl or HNO, three Type IIMilli-Q water rinses, and air dried.
Glass containers for total organic carbon, grain size or synthetic organic analysis media(sediment, archive sediment, pore water, and subsurface water) and additional teflonsheeting cap-liners were cleaned by: a two-day Micro detergent soak, three tap-waterrinses, three deionized water rinses, a three-day soak in 10% HCl or HNO, three Type IIMilli-Q water rinses, air dry, three petroleum ether rinses, and air dry.
Table 1. Descriptions of samples collected as part of BPTCP/NOAA monitoring in theLos Angeles Region.Sampling
LegSampling
Date Sampling Locations and Descriptions1 7/30/92 LA and Long Beach Harbors and vicinity screening2 8/19/92 LA and Long Beach Harbors and vicinity screening3 9/10/92 LA and Long Beach Harbors and vicinity screening4 9/15/92 LA and Long Beach Harbors and vicinity screening11 1/15/93 Northern LA County sites screening13 2/10/93 Ventura River Lagoon screening18 5/7/93 LA Harbor screening19 5/28/93 LA Harbor Reference stations for San Diego Bay study20 6/18/93 LA Harbor Reference stations for San Diego Bay study22 8/3-5/93 LA Harbor Reference stations for San Diego Bay study23 8/17-19/93 LA Harbor Reference stations for San Diego Bay study25 2/3/94 LA and Long Beach Harbors and vicinity confirmation26 2/14/94 LA and Long Beach Harbors and vicinity confirmation30 4/18/94 LA Harbor confirmation, Mugu Lagoon, McGrath Lake screening32 5/22/94 LA Harbor Reference stations for San Diego Bay study45 6/24/96 LA Harbor confirmation, Mugu Lagoon, McGrath Lake confirmation
Port Hueneme, Shoreline Marina, Marina Del Rey Screening46 7/22/96 Consolidated Slip confirmation and areal extent48 2/10/97 LA, Long Beach Harbor and marina reference stations survey #1.
Marina Del Rey, Shoreline Marina, King Harbor,Mugu Lagoon confirmation
53 5/12/97 LA, Long Beach Harbor and marina reference stations survey #2.Cabrillo Pier confirmation and bioaccumulation study.
54 8/22/97 Kaiser Pier screening

Outer Los Angeles/Long Beach Harbor Stations
40010
40033
40004
40015 40016
40032
40030
40017
40014
4001840020
Port Hueneme
Cabrillo Beach
44012
44013
4900549004
48009
40031
Palos Verdes
40031
49003
49002
49001
Figures 2a, 2b, and 2c. Outer Los Angeles and Long Beach Harbor (a), Port Hueneme (b), and Palos Verdes (c) Sampling Stations.
18

Inner Los Angeles/Long Beach Harbor Stations
Consolidated Slip of Inner Los Angeles Harbor
Consolidated Slip
40002
40001
48010 40003
46002
40005
40019
40011
40007
40008
40013
40012
40009
44055
47010
47007
47005
47004
47002
47001
47003
47008
47009
40006
46003
46001
Figures 3a and 3b. Inner Los Angeles and Long Beach Harbor (a) and Consolidated Slip (b) Sampling Stations.
19

Shoreline Marina
Los Alamitos Bay
48008
48006
44020
48007
40021
44011
40023
40022
Figures 4a and 4b. Shoreline Marina (a) and Los Alamitos Bay (b) Sampling Stations.
20

King Harbor
Marina Del Rey
48011
4800148002
48004
48005
48003
44014
Ballona Creek
Figures 5a and 5b. King Harbor (a) and Marina Del Rey (b) Sampling Stations.
21

Ventura Marina
Channel Islands Harbor
48012
44023
44021
Figures 6a and 6b. Ventura Marina (a) and Channel Islands Harbor (b) Sampling Stations.
22

Mugu Lagoon
44050
44016
48015
48016
44051
4801344052
48014
44053 44054
48017
48018
Figure 7. Mugu Lagoon Sampling Stations.
23

McGrath Lake
Colorado Lagoon
Colorado Lagoon/Sims Pond
Ballona Creek
44017
44026
44024
44027
Figures 8a, 8b, and 8c. McGrath Lake (a), Ballona Creek (b), and Colorado Lagoon/Sims Pond (c) Sampling Stations.
Colorado Lagoon
Sims Pond
24

Malibu Lagoon
Santa Clara River Estuary
44025
Ventura River Estuary
44022
44018
Figures 9a, 9b, and 9c. Ventura River Estuary (a), Santa Clara River Estuary (b), and Malibu Lagoon (c) Sampling Stations.
25

26
Sediment Sample Collection
All sampling locations (latitude & longitude), whether altered in the field orpredetermined, were verified using a Magellan NAV 5000 Global Positioning Systemreceiver, and recorded in the field logbook.
The primary method of sediment collection was by use of a 0.1m2 Young-modified VanVeen grab aboard a sampling vessel. Modifications include a non-contaminating Kynarcoating which covered the grab's sample box and jaws. After the filled grab sampler wassecured on the boat gunnel, the sediment sample was inspected carefully. The followingacceptability criteria were met prior to taking sediment samples:
1. Sampler was not over-filled (i.e., the sediment surface was not pressedagainst the top of the sampler).
2. Overlying water was present, indicating minimal leakage.3. Overlying water was not excessively turbid, indicating minimal sample
disturbance.4. Sediment surface was relatively flat, indicating minimal sample disturbance.5. Sediment sample was not washed out due to an obstruction in the sampler
jaws.6. Desired penetration depth was achieved (i.e., 10 cm).7. Sample was muddy (approx. >30% fines), not sandy or gravelly.8. Sample did not include excessive shell, organic or man-made debris.
If a sample did not meet all the above criteria, it was rejected, dumped into the bay, andthe sampler was re-deployed until a sufficient amount of material was obtained.
It was critical that sample contamination be avoided during sample collection. Allsampling equipment (i.e., siphon hoses, scoops, containers) was made of non-contaminating material and was cleaned appropriately before use. Samples were nottouched with un-gloved fingers. In addition, potential airborne contamination (e.g., fromengine exhaust, cigarette smoke) was avoided. Before sub-samples from the grab samplerwere taken, the overlying water was removed by slightly opening the sampler, beingcareful to minimize disturbance or loss of fine-grained surficial sediment. Once overlyingwater was removed, the top 2 cm of surficial sediment was sub-sampled from the grab. Subsamples were taken using a precleaned flat bottom scoop. This device allowed arelatively large sub-sample to be taken from a consistent depth. When subsamplingsurficial sediments, unrepresentative material (e.g., large stones or vegetative material)was removed from the sample in the field. Small rocks and other small foreign materialremained in the sample. Determination of overall sample quality was determined by thechief scientist in the field. Such removals were noted on the field data sheet. For thesediment sample, the top 2 cm was removed from the grab and placed in a pre-labeledpolycarbonate container. Between grabs or cores, the sediment sample in the containerwas covered with a teflon sheet, and the container covered with a lid and kept cool. When

27
a sufficient amount of sediment was collected, the sample was covered with a teflon sheetassuring no air bubbles. A second, larger teflon sheet was placed over the top of thecontainer to ensure an air tight seal, and nitrogen was vented into the container to purge itof oxygen.
If water depth did not permit boat entrance to a site (e.g. <1 meter), divers sampled thatsite using sediment cores (diver cores). Cores consisted of a 10 cm diameterpolycarbonate tube, 30 cm in length, including plastic end caps to aid in transport. Diversentered a study site from one end and sampled in one direction, so as to not disturb thesediment with feet or fins. Cores were taken to a depth of at least 15 centimeters.Sediment was extruded out of the top end of the core to the prescribed depth of 2-cm,removed with a polycarbonate spatula and deposited into a cleaned polycarbonate tub.Additional samples were taken with the same seawater rinsed core tube until the requiredtotal sample volume was attained. Diver core samples were treated the same as grabsamples, with teflon sheets covering the sample and nitrogen purging. All sampleacceptability criteria were met as with the grab sampler.
As discussed above, more intensive sampling was conducted in the ConsolidatedSlip/Dominguez Channel tidal prism area of inner Los Angeles Harbor in order toinvestigate the horizontal and vertical distribution of chemical pollution and associatedbioeffects in this area. The horizontal distribution of pollution and toxicity wasdetermined by collecting multiple field replicates at several stations along a gradientleading from Henry Ford Bridge and out Dominguez Channel. Samples were collectedalong two transects, each having four sample locations. The first transect was located inthe upper channel and ran from Dominguez Channel to the east end of Consolidated Slip. The second transect was located in the mid to west end of end of Consolidated Slipleading to the east end of East Basin. Both transects were located based on pastmonitoring data to define the east and west boundaries of sediment pollution inConsolidated Slip.
In order to determine the vertical distribution of pollution and bioeffects, samples atseveral stations were collected at multiple depths. In addition to the surficial samplescollected at the top 2 cm, samples were collected at three additional depths: surface(top30 cm), Depth 2 (from 30 cm to 90 cm), and Depth 3 (from 90 cm to 150 cm). Inmost cases, a hard clay layer below 90 cm prevented collection of the third sample depth.
Samples for the vertical distribution study were collected with a gravity coring devicedeployed from a boat. The corer was lined with a 7-cm diameter polybutyrate liner,which was changed between samples. Once collected, core samples were cut with astainless steel saw into the three sections, the end of each sediment core adjacent to thesaw cut was discarded, and samples were aliquoted as described above.
Replicate benthic samples (n=3) were obtained at predetermined sites from separatedeployments of the Van Veen sampler. The three replicates were positioned according tothe BPTCP sampling protocol (e.g., located by previously assigned lat/long coordinates).

28
The coring device was 10 cm in diameter and 14 cm in height, enclosing a 0.0075-m2
area. Corers were placed into sediment with minimum disruption of the surfacesediments, capturing essentially all surface-active fauna as well as species living deeperin the sediment. Corers were pushed about 12 cm into the sediment and retrieved bydigging along one side, removing the corer and placing the intact sediment core into a pvcscreening device. Sediment cores were carefully sieved through a 0.5-mm screen andresidues (e.g., organisms and remaining sediments) were rinsed into pre-labeled storagebags and preserved with a 10% formalin solution. After 3 to 4 days, samples were rinsedand transferred into 70% isopropyl alcohol and stored for future taxonomy andenumeration.
Analysis of Contaminants in Fish Tissue
Fish species targeted for collection were selected and prioritized based on relativeabundance of species of interest; species behavior (eg., feeding behavior); and habitatrange; frequency of consumption by anglers; likelihood of contaminant accumulationbased on tissue lipid content. Composite tissue samples were necessary to maximize thenumber of stations and fish species on which chemical analysis could be performed. Thenumber of fish required to complete a composite was five for larger fish and fifteen forsmaller fish. Fish species collected and number of fish needed to complete a compositewere as follows:
1. White Croaker (Genyonemus lineatus) (5 per composite)2. White Surfperch (Phanerdon furcatus) (5 per composite)3. Shiner Surfperch (Cymatogaster aggregata) (15 per composite)4. Topsmelt (Atherinopsis affinis) (15 per composite)
Fish were collected from Point Mugu Lagoon October 5, 1992, using a 50' beach seine. Size of topsmelt ranged from 16.5-22 cm (total length) and 10-12.4 cm for shinersurfperch. Fish were collected from Los Angeles Harbor May 14-15, 1997, using a 25'otter trawl. Size of white croaker ranged from 20-28 cm (total length) and 14-19 cm forwhite surfperch. Collected samples were wrapped in chemically cleaned Teflon®sheeting, to prevent trace metal and trace organic contamination, and frozen fortransportation to the laboratory. Dissections and muscle tissue sample preparations wereperformed using non-contaminating methods in a clean room environment (Stephenson etal., 1994). Equal weight samples were taken from each fish using Teflon® forceps toprovide a composite total of approximately 125 grams. All composites werehomogenized and homogenate splits were taken for each chemical analysis.
Muscle tissue (i.e., fillets) of white croaker were analyzed with skin on, while topsmeltand perch were analyzed whole body (i.e., head, guts, tail removed). The decision toanalyze tissue fillets or whole body was based on the manner in which the particular fishwas most commonly cooked and eaten.

29
All sample composites were analyzed for PAHs, PCB congeners, pesticides, percentmoisture and percent lipid. A more detailed description of these methods can be found inthe California State Mussel Watch Program Ten Year Data Summary Report (1988) andthe California Bay Protection and Toxic Cleanup Program Quality Assurance Project Plan(Stephenson et al., 1994).
The U.S. EPA document used to design the study, Guidance For Assessing ChemicalContaminant Data For Use In Fish Advisories-Volume 1-Fish Sampling and Analysis(U.S. EPA, 1995a), was also used to develop the contaminant screening values used inthis study. In developing the screening values (SVs) for a number of noncarcinogenic andcarcinogenic compounds, risk-based dose response variables were used. These variableswere used in the following equations to calculate the SVs used in this study:
For Noncarcinogens: SV = (RfD * BW)/CRFor Carcinogens: SV = [(RL/SF)*BW]/CR
where SV = Screening Value (µg/g)RfD = Oral reference dose (µg/g/d)RL = Maximum acceptable risk level (dimensionless)
SF = Oral slope factor (µg/g/d)-1
BW = Body Weight (kg)CR = Consumption rate of tissue(g/d)
Body weight (BW), consumption rate (CR) and risk level (RL) have been held constantfor all calculations in this document. Body weight was chosen at 70 kg, which is themean body weight for the average male adult population (U.S. EPA, 1990). Consumptionrate was chosen at 6.5 grams per day (one meal a month), which is the estimate of theaverage consumption of fish and shellfish from marine, estuarine and fresh waters by the
general adult population (U.S. EPA, 1990). The risk level (RL) was chosen at 10-5 as
recommended by the EPA Office of Water for the calculation of screening values. Insimple terms, this means that if a person weighing 70 kg consumed 6.5 grams of fish perday with the same concentration of contaminant, for 70 years, the increased risk would beat most one additional cancer death per 100,000 persons. Values used for oral RfD andSF were those suggested for use by the EPA (U.S. EPA, 1993). Screening values couldnot be calculated for all chemicals analyzed in this study since reliable information on thetoxicity or carcinogenic potency of chemicals is not available for all analytes. RfD andSF information that has been developed to date is available in the EPA's Integrated RiskInformation System (IRIS, 1992). This system is continuously updated, as informationbecomes available, so calculations of screening values for additional chemicals may bepossible in the future. Calculated screening values and comparative screening valuesfrom other selected sources are presented in Tables 21 and 34.
The screening values calculated from the constants selected above are used to helpidentify potential chemicals of concern and should not be treated as health risk thresholds. Comparisons of sample tissue levels with screening values are meant to provide

30
guidance to further investigations of contaminant levels in southern California fishtissues. They should not be construed as regulatory action levels or be used as definitiveanswers to questions concerning the safety of fish consumption. Health risk concernswill be reviewed and, if necessary, warnings issued, by the California Office ofEnvironmental Health Hazard Assessment (OEHHA).
Transport of Samples
Six-liter polycarbonate sample containers for chemistry and toxicity and benthic coreswere packed in ice chests with enough ice to keep them cool for 48 hours. Each containerwas sealed in precleaned, large plastic bags closed with a cable tie to prevent contact withother samples or ice or water. Ice chests were driven back to the laboratory by thesampling crew or flown by air freight within 24 hours of collection.
Homogenization and Aliquoting of Samples
Samples remained in ice chests (on ice, in double-wrapped plastic bags) until thecontainers were brought back to the laboratory for homogenization. All sampleidentification information (station numbers, etc.) was recorded on Chain of Custody(COC) and Chain of Record (COR) forms prior to homogenizing and aliquoting. Asingle container was placed on plastic sheeting while also remaining in original plasticbags. The sample was stirred with a polycarbonate stirring rod until mud appearedhomogeneous.
All prelabeled jars were filled using a clean Teflon or polycarbonate scoop and stored infreezer/refrigerator (according to media/analysis) until analysis. The sediment samplewas aliquoted into appropriate containers for trace metal analysis, organic analysis, porewater extraction, and bioassay testing. Samples were placed in boxes sorted by analysistype and leg number. Sample containers for sediment bioassays were placed in arefrigerator (4°C) while sample containers for sediment chemistry (metals, organics, TOCand grain size) were stored in a freezer (-20°C).
Procedures for the Extraction of Pore Water
Whole Core Squeezing
In sampling Legs 1 through 23 (Table 1) pore water was extracted from refrigerated (4°C)sediment samples using the whole core squeezing (WCS) method developed by Bender etal. (1987). This method employed mechanical force to squeeze pore water frominterstitial spaces. The squeezing technique was a modification of the original Benderdesign, with some adaptations made based on the work of Carr et al. (1989) and Carr andChapman (1991). This WCS method was developed for laboratory or field use inconjunction with standard coring techniques.

31
The major features of the squeezer consisted of an aluminum support framework, 10-cmi.d. acrylic core tubes with sampling ports, a pressure regulated pneumatic ram with airsupply valves, and pH and oxygen electrodes placed in-line with sample effluent. Tracemetal contamination was avoided by ensuring that all sample containers, filters and WCSsurfaces in contact with the sample were plastics (acrylic, PVC, and TFE) and cleanedwith Micro, 10% HCl, Type II Milli-Q brand water and methanol.
One to two liters of homogenized sediment sample were placed in the squeezer tube forpore water extractions. The tubes were placed in the support framework and pressure wasapplied to the top piston by adjusting the air supply to the pneumatic ram. An initial airpressure of ~20 psi was sufficient to maintain a steady flow of sample effluent throughthe top piston, and at no time during squeezing did air pressure exceed 200 psi.
A porous pre-filter (PPE or TFE) was inserted in the top of the piston and used to screenlarge (> 70 microns) sediment particles. Further filtration was accomplished withdisposable TFE filters of 5 microns and 0.45 microns in-line with sample effluent. Tocompensate for filter clogging and sediment compaction during the course of squeezing,effluent flow was maintained by fine adjustment of the pressure regulator on the airsupply to increase the air pressure to the ram.
Sample effluent of the required volume was collected in TFE containers underrefrigeration. Pore water was then subsampled in the volumes and specific containersrequired for archiving and chemical or toxicological analysis. Samples to be analyzed fortrace metals were acidified to an approximate pH of 2-3 to minimize oxidation of themetal and adsorption to sample container walls. Other subsamples were eitherrefrigerated or frozen as required under normal holding time criteria for each specificanalysis.
Upon completion of a sediment squeezing run, all squeezer surfaces in contact withsample were thoroughly cleaned to minimize metal or organic cross-contaminationbetween samples. Blanks of Type II Milli-Q brand water were substituted for sampleand squeezed prior to and after the core tubes used for sample extractions. This squeezerblank was used as a quality control step to test for possible contaminations. Pore watersamples were frozen until needed for testing.
Centrifugation Extraction
In sampling Legs 25 through 54 (Table 1), pore water was extracted using centrifugation. All procedures for the centrifugation extraction of pore water were performed using tracemetal and trace organic clean techniques. Operations were performed in a positivepressure clean room with filtered air to prevent airborne contamination.
All sample containers or sampling equipment in contact with sediment or porewaterreceived a scrub and 2 day soak in MICRO® detergent, followed by triple fresh and

32
deionized water rinses. Equipment was then immersed in 10% HCl for 3 days, triplerinsed in MILLI-Q® Type II water, air dried, and triple rinsed with petroleum ether.
Samples were stored on ice at 4°C prior to centrifugation. Pre-cleaned Teflon scoopswere used to transfer sediment from sample containers to centrifuge jars. High speedone-liter polycarbonate centrifuge jars were used for extraction of pore water. Sampleswere spun at 2500 G for 30 minutes at 4°C in a Beckman J-6B refrigerated centrifuge.
Porewater was transferred from each centrifuge jar into final sample containers (250 pre-cleaned borosilicate glass jars) using pre-cleaned polyethylene siphons. While decanting,care was used to avoid floating debris, fauna, shell fragments or other solid material. After transfer into final sample containers, porewater was immediately refrigerated at4°C. Samples were refrigerated, not frozen, and testing was initiated within 24 hours ofextraction of the final samples.
Subsurface Water Collection
Subsurface water was collected at selected stations to assess site water toxicity. Apolyethylene water sample bottle was attached to the frame of the Van Veen grab samplerand a stopper was pulled as the jaws of the grab closed for a sediment sample. The watersample was consequently collected approximately 0.5 meters above the sediment surface. Subsurface water samples were transferred to acid and solvent rinsed 1 liter amberbottles and held in the dark at 4°C until testing.
Collection of Intact Sediment Cores for Sediment-Water Interface Tests
Intact sediment cores were sampled directly from the Van-Veen grab sampler at selectedstations for later sediment-water interface toxicity tests. Cores were 7.5 cm in diameterpolycarbonate tubes sampled to a depth of 5 cm. Cores were removed from the samplerby sealing the bottom of the core with polyethylene-gloved hands, and quickly sealingfirst the bottom, then the top with polyethylene caps. The bottom caps were thenwrapped with parafilm™ to prevent leakage, stored upright in an ice chest, andtransported to the toxicity testing laboratory via overnight courier. Intact cores wererefrigerated in the dark until used in toxicity tests. Sediment-water interface test methodsare described below.
Sample Chain of Records & Custody
Chain-of-records documents were maintained for each station. Each form was a record ofall sub-samples taken from each sample. IDORG (a unique identification number foronly that sample), DFG station numbers and station names, leg number (samplecollection trip batch number), and date collected were included on each sheet. A Chain-of-Custody form accompanies every sample so that each person releasing or receiving asubsample signs and dates the form.

33
Authorization/Instructions to Process Samples
Standardized forms entitled "Authorization/Instructions to Process Samples"accompanied the receipt of any samples by any participating laboratory. These formswere completed by DFG personnel, or its authorized designee, and were signed andaccepted by both the DFG authorized staff and the staff accepting samples on behalf ofthe particular laboratory. The forms contain all pertinent information necessary for thelaboratory to process the samples, such as the exact type and number of tests to run,number of laboratory replicates, dilutions, exact eligible cost, deliverable products(including hard and soft copy specifications and formats), filenames for soft copy files,expected date of submission of deliverable products to DFG, and other informationspecific to the lab/analyses being performed.
Trace Metals Analysis of Sediments
Trace metal analyses were conducted at the California Department of Fish and Game's(CDFG) Trace Metals Facility at Moss Landing, CA. Table 2 indicates the trace metalsanalyzed and lists method detection limits for sediments. These methods weremodifications of those described by Evans and Hanson (1993) as well as those developedby the CDFG (California Department of Fish and Game, 1990). Samples were selectedfor chemical analyses by SWRCB staff based on results from toxicity tests.
Analytes and Detection Limits
Table 2. Dry Weight Trace Metal Minimum Detection Limits (MDL). ***Note that alltissue MDLs are reported in dry weight units because wet weight MDLs are based onpercent moisture of the sample.
Analytes MDLµg/g dry
MDLµg/g dry
MDLµg/L
Sediment Tissue WaterSilver 0.002 0.01 0.001Aluminum 1 1 NAArsenic 0.1 0.25 0.1Cadmium 0.002 0.01 0.002Copper 0.003 0.1 0.04Chromium 0.02 0.1 0.05Iron 0.1 0.1 0.1Mercury 0.03 0.03 NAManganese 0.05 0.05 NANickel 0.1 0.1 0.1Lead 0.03 0.1 0.01Antimony 0.1 0.1 NATin 0.02 0.02 NASelenium 0.1 0.1 NAZinc 0.05 0.05 0.02

34
Sediment Digestion Procedures
One gram aliquot of sediment was placed in a pre-weighed Teflon vessel, and one mlconcentrated 4:1 nitric:perchloric acid mixture was added. The vessel was capped andheated in a vented oven at 130°C for four hours. Three mL hydrofluoric acid was addedto the vessel, recapped and returned to oven overnight. Twenty mL of 2.5% boric acidwere added to vessel and placed in oven for an additional 8 hours. Weights of vessel andsolution were recorded, and solution transferred to 30-mL polyethylene bottles.
Tissue Digestion Procedures
A three gram aliquot of tissue was placed in a pre-weighed Teflon vessel, and three mlsof concentrated 4:1 nitric:perchloric acid mixture was added. Samples then were cappedand heated on hot plates for five hours. Caps were tightened and heated in a vented ovenat 130°C for four hours. Samples were allowed to cool and 15 mls of Type II water wasadded to the vessels. The solution was then quatitatively transferred to a pre weighed 30ml polyethylene (HDPE) bottle and taken up to a final weight of 20 g with Type II water.
Atomic Absorption Methods
Samples were analyzed by furnace AA on a Perkin-Elmer Zeeman 3030 AtomicAbsorption Spectrophotometer, with an AS60 auto sampler, or a flame AA Perkin ElmerModel 2280. Samples, blanks, matrix modifiers, and standards were prepared using cleantechniques inside a clean laboratory. ASTM Type II water and ultra clean chemicals wereused for all standard preparations. All elements were analyzed with platforms forstabilization of temperatures. Matrix modifiers were used when components of thematrix interferes with adsorption. The matrix modifier was used for Sn, Sb and Pb.Continuing calibration check standards (CLC) were analyzed with each furnace sheet, andcalibration curves were run with three concentrations after every 10 samples. Blanks andstandard reference materials, MESS1, PACS, BCSS1 or 1646 were analyzed with eachset of samples for sediments.
Acid Volatile Sulfide and Simultaneously Extracted Metals – AVS-SEM
This procedure determines the concentration of acid volatile sulfide (AVS) and theconcentrations of selected metals that are solubilized during the acidification process(simultaneously extracted metal, SEM). The AVS/SEM procedure followed methodsdescribed by Allen et al. (1993). AVS in the samples was first converted to hydrogensulfide by acidification with hydrochloric acid at room temperature. The hydrogensulfide was purged from the samples and trapped in an aqueous solution of sodiumhydroxide. Sulfide concentrations were then determined spectrophotometrically byreaction with amine sulfuric acid and ferric chloride reagents to form methylene blue. The SEM are selected metals liberated from the sediment during the acidification. Theconcentrations of these metals were measured in the remaining acid after filtration of thesample.

35
Trace Organic Analysis of Sediments (PCBs, Pesticides, and PAHs)
Analytes and Detection Limits
Analytical sets of 12 samples were scheduled such that extraction and analysis occurredwithin a 40-day window. The methods employed by the UCSC-TOF were modificationsof those described by Sloan et al. (1993). Tables 3-8 indicate the pesticides, PCBs, andPAHs currently analyzed and list method detection limits for sediments on a dry weightbasis.
Table 3: Dry Weight Minimum Detection Limits of Chlorinated Pesticides
Analytes † Database Abbreviation MDLng/g dry
MDLng/g dry
MDLng/L
Sediment Tissue WaterFraction #1 Analytes †Aldrin ALDRIN 0.5 1.0 2.0alpha-Chlordene ACDEN 0.5 1.0 1.0gamma-Chlordene GCDEN 0.5 1.0 1.0o,p'-DDE OPDDE 1.0 3.0 1.0o,p'-DDT OPDDT 1.0 4.0 2.0Heptachlor HEPTACHLOR 0.5 1.0 2.0Hexachlorobenzene HCB 0.2 1.0 1.0Mirex MIREX 0.5 1.0 1.0Fraction #1 & #2 Analytes †,‡p,p'-DDE PPDDE 1.0 1.0 0.5p,p'-DDT PPDDT 1.0 4.0 2.0p,p'-DDMU PPDDMU 2.0 5.0 5.0trans-Nonachlor TNONA 0.5 1.0 1.0Fraction #2 Analytes ‡cis-Chlordane CCHLOR 0.5 1.0 1.0trans-Chlordane TCHLOR 0.5 1.0 1.0Chlorpyrifos CLPYR 1.0 4.0 4.0Dacthal DACTH 0.2 2.0 2.0o,p'-DDD OPDDD 1.0 5.0 5.0p,p'-DDD PPDDD 0.4 3.0 3.0p,p'-DDMS PPDDMS 3.0 20 20p,p'-Dichlorobenzophenone DICLB 3.0 25 25Methoxychlor METHOXY 1.5 15 15Dieldrin DIELDRIN 0.5 1.0 1.0Endosulfan I ENDO_I 0.5 1.0 1.0Endosulfan II ENDO_II 1.0 3.0 3.0Endosulfan sulfate ESO4 2.0 5.0 5.0Endrin ENDRIN 2.0 6.0 6.0Ethion ETHION 2.0 NA NAalpha-HCH HCHA 0.2 1.0 1.0beta-HCH HCHB 1.0 3.0 3.0gamma-HCH HCHG 0.2 0.8 1.0delta-HCH HCHD 0.5 2.0 2.0Heptachlor Epoxide HE 0.5 1.0 1.0cis-Nonachlor CNONA 0.5 1.0 1.0Oxadiazon OXAD 6 NA NAOxychlordane OCDAN 0.5 0.2 1.0
† The quantitation surrogate is PCB 103. ‡ The quantitation surrogate is d8-p,p’-DDD

36
Table 4. Dry Weight Detection Limits of NIST PCB Congeners.Analytes † Database
AbbreviationMDL ng/g drysediment
MDL ng/g drytissue
MDL ng/Lwater
2,4'-dichlorobiphenyl PCB08 0.5 1.0 1.02,2',5-trichlorobiphenyl PCB18 0.5 1.0 1.02,4,4'-trichlorobiphenyl PCB28 0.5 1.0 1.02,2',3,5'-tetrachlorobiphenyl PCB44 0.5 1.0 1.02,2',5,5'-tetrachlorobiphenyl PCB52 0.5 1.0 1.02,3',4,4'-tetrachlorobiphenyl PCB66 0.5 1.0 1.02,2',3,4,5'-pentachlorobiphenyl PCB87 0.5 1.0 1.02,2',4,5,5'-pentachlorobiphenyl PCB101 0.5 1.0 1.02,3,3',4,4'-pentachlorobiphenyl PCB105 0.5 1.0 1.02,3',4,4',5-pentachlorobiphenyl PCB118 0.5 1.0 1.02,2',3,3',4,4'-hexachlorobiphenyl PCB128 0.5 1.0 1.02,2',3,4,4',5'-hexachlorobiphenyl PCB138 0.5 1.0 1.02,2',4,4',5,5'-hexachlorobiphenyl PCB153 0.5 1.0 1.02,2',3,3',4,4',5-heptachlorobiphenyl PCB170 0.5 1.0 1.02,2',3,4,4',5,5'-heptachlorobiphenyl PCB180 0.5 1.0 1.02,2',3,4',5,5',6-heptachlorobiphenyl PCB187 0.5 1.0 1.02,2',3,3',4,4',5,6-octachlorobiphenyl PCB195 0.5 1.0 1.02,2',3,3',4,4',5,5',6-nonachlorobiphenyl PCB206 0.5 1.0 1.02,2',3,3',4,4',5,5',6,6'-decachlorobiphenyl PCB209 0.5 1.0 1.0
† PCB 103 is the surrogate used for PCBs with 1 - 6 chlorines per molecule. PCB 207 is used for all others.

37
Table 5. Dry Weight Minimum Detection Limits for additional PCB congeners.
Analytes † DatabaseAbbreviation
MDL ng/g drysediment
MDL ng/g drytissue
MDL ng/Lwater
2,3-dichlorobiphenyl PCB5 0.5 1.0 1.04,4'-dichlorobiphenyl PCB15 0.5 1.0 1.02,3',6-trichlorobiphenyl PCB27 0.5 1.0 1.02,4,5-trichlorobiphenyl PCB29 0.5 1.0 1.02,4',4-trichlorobiphenyl PCB31 0.5 1.0 1.02,2,'4,5'-tetrachlorobiphenyl PCB49 0.5 1.0 1.02,3',4',5-tetrachlorobiphenyl PCB70 0.5 1.0 1.02,4,4',5-tetrachlorobiphenyl PCB74 0.5 1.0 1.02,2',3,5',6-pentachlorobiphenyl PCB95 0.5 1.0 1.02,2',3',4,5-pentachlorobiphenyl PCB97 0.5 1.0 1.02,2',4,4',5-pentachlorobiphenyl PCB99 0.5 1.0 1.02,3,3',4',6-pentachlorobiphenyl PCB110 0.5 1.0 1.02,2',3,3',4,6'-hexachlorobiphenyl PCB132 0.5 1.0 1.02,2',3,4,4',5-hexachlorobiphenyl PCB137 0.5 1.0 1.02,2',3,4',5',6-hexachlorobiphenyl PCB149 0.5 1.0 1.02,2',3,5,5',6-hexachlorobiphenyl PCB151 0.5 1.0 1.02,3,3',4,4',5-hexachlorobiphenyl PCB156 0.5 1.0 1.02,3,3',4,4',5'-hexachlorobiphenyl PCB157 0.5 1.0 1.02,3,3',4,4',6-hexachlorobiphenyl PCB158 0.5 1.0 1.02,2',3,3',4,5,6'-heptachlorobiphenyl PCB174 0.5 1.0 1.02,2',3,3',4',5,6-heptachlorobiphenyl PCB177 0.5 1.0 1.02,2',3,4,4',5',6-heptachlorobiphenyl PCB183 0.5 1.0 1.02,3,3',4,4',5,5'-heptachlorobiphenyl PCB189 0.5 1.0 1.02,2',3,3',4,4',5,5'-octachlorobiphenyl PCB194 0.5 1.0 1.02,2',3,3',4,5',6,6'-octachlorobiphenyl PCB201 0.5 1.0 1.02,2',3,4,4',5,5',6-octachlorobiphenyl PCB203 0.5 1.0 1.0
† PCB 103 is the surrogate used for PCBs with 1 - 6 chlorines per molecule. PCB 207 is used for all others.
Table 6: Dry Weight Minimum Detection Limits of Chlorinated Technical GradeMixtures
Analytes † Database Abbreviation MDLng/g dry
MDLng/g dry
MDLng/L
Sediment Tissue WaterToxaphene ‡ TOXAPH 50 100 100Polychlorinated Biphenyl Aroclor 1248 ARO1248 5 100 100Polychlorinated Biphenyl Aroclor 1254 ARO1254 5 50 50Polychlorinated Biphenyl Aroclor 1260 ARO1260 5 50 50Polychlorinated Terphenyl Aroclor 5460† ARO5460 10 100 100
† The quantitation surrogate is PCB 207. ‡ The quantitation surrogate is d8-p,p’-DDD

38
Table 7: Dry Weight Minimum Detection Limits of Polyaromatic Hydrocarbons in Tissue
Analytes † Database Abbreviation MDL ng/gdry Sediment
MDL ng/gdry Tissue
MDL ng/LWater
Naphthalene NPH 5 10 302-Methylnaphthalene MNP2 5 10 301-Methylnaphthalene MNP1 5 10 30Biphenyl BPH 5 10 302,6-Dimethylnaphthalene DMN 5 10 30Acenaphthylene ACY 5 10 30Acenaphthene ACE 5 10 302,3,5-Trimethylnaphthalene TMN 5 10 30Fluorene FLU 5 10 30Dibenzothiophene DBT 5 10 30Phenanthrene PHN 5 10 30Anthracene ANT 5 10 301-Methylphenanthrene MPH1 5 10 30Fluoranthene FLA 5 10 30Pyrene PYR 5 10 30Benz[a]anthracene BAA 5 10 30Chrysene CHR 5 10 30Tryphenylene TRY 5 10 30Benzo[b]fluoranthene BBF 5 10 30Benzo[k]fluoranthene BKF 5 10 30Benzo[e]pyrene BEP 5 10 30Benzo[a]pyrene BAP 5 10 30Perylene PER 5 10 30Indeno[1,2,3-cd]pyrene IND 5 15 45Dibenz[a,h]anthracene DBA 5 15 45Benzo[ghi]perylene BGP 5 15 45Coronene COR 5 15 45
† See QA report for surrogate assignments.
Table 8. Dry Weight Minimum Detection Limits of Organometallic CompoundsAnalytes † Database Abbreviation MDL
ng/g dryMDLng/g dry
MDLng/L
Sediment Tissue WaterTributyltin TBT 13 20 1
Summary of Methods
Analytical sets of 12 samples were scheduled such that extraction and analysis wouldoccur within a 40-day window. Methods employed by UCSC-TOF were modifications ofthose described by Sloan et al. (1993). Tables 3-8 indicate the pesticides, PCBs, andPAHs currently analyzed, and list method detection limits for sediments and tissues on adry weight basis.
Sediment Extraction

39
Samples were removed from the freezer and allowed to thaw. A 10-gram sample ofsediment was removed for chemical analysis and an independent 10-gram aliquot wasremoved for dry weight determinations. The dry weight sample was placed into a pre-weighed aluminum pan and dried at 110°C for 24 hours. The dried sample wasreweighed to determine the sample’s percent moisture. The analytical sample wasextracted 3 times with methylene chloride in a 250-mL amber Boston round bottle on amodified rock tumbler. Prior to rolling, sodium sulfate, copper, and extraction surrogateswere added to the bottle. Sodium sulfate dehydrates the sample allowing for efficientsediment extraction. Copper, which was activated with hydrochloric acid, complexes freesulfur in the sediment. After combining the three extraction aliquots, the extract wasdivided into two portions, one for chlorinated hydrocarbon (CH) analysis and the otherfor polycyclic aromatic hydrocarbon (PAH) analysis.
Tissue Extraction
Samples were removed from the freezer and allowed to thaw. A 5-gram sample of tissuewas removed for chemical analysis and an independent 5-gram aliquot was removed fordry weight determinations. The dry weight sample was placed into a pre-weighedaluminum pan and dried at 110°C for 24 hours. The dried sample was reweighed todetermine the sample’s percent moisture. The analytical sample was extracted twice withmethylene chloride using a Tekmar Tissumizer. Prior to extraction, sodium sulfate andextraction surrogates were added to the sample and methylene chloride.
The two extraction aliquots were combined and brought to 100 mL. A 25-mL aliquotwas decanted through a Whatmann 12.5 cm #1 filter paper into a pre-weighed 50 mLflask for lipid weight determination. The filter was rinsed with ~15 mL of methylenechloride and the remaining solvent was removed by vacuum-rotary evaporation. Theresidue was dried for 2 hours at 110°C and the flask was re-weighed. The change inweight was taken as the total methylene chloride extractable mass. This weight then wasused to calculate the samples "percent lipid".
Organic Analysis
The CH portion was eluted through a silica/alumina column, separating the analytes intotwo fractions. Fraction 1 (F1) was eluted with 1% methylene chloride in pentane andcontained > 90% of p,p'-DDE and < 10% of p,p'-DDT. Fraction 2 (F2) analytes wereeluted with 100% methylene chloride. The two fractions were exchanged into hexaneand concentrated to 500 µL using a combination of rotary evaporation, controlled boilingon tube heaters, and dry nitrogen blow downs.
F1 and F2 fractions were analyzed on Hewlett-Packard 5890 Series gas chromatographsutilizing capillary columns and electron capture detection (GC/ECD). A single 2 µlsplitless injection was directed onto two 60 m x 0.25 mm i.d. columns of differentpolarity (DB-17 & DB-5; J&W Scientific) using a glass Y-splitter to provide a twodimensional confirmation of each analyte. Analytes were quantified using internal

40
standard methodologies. The extract’s PAH portion was eluted through a silica/aluminacolumn with methylene chloride. It then underwent additional cleanup using size-exclusion high performance liquid chromatography (HPLC/SEC). The collected PAHfraction was exchanged into hexane and concentrated to 250 µL in the same manner asthe CH fractions.
Total Organic Carbon Analysis of Sediments
Summary of Methods
Samples were received in the frozen state and allowed to thaw at room temperature.Source samples were gently stirred and sub-samples removed with a stainless steelspatula and placed in labeled 20 ml polyethylene scintillation vials. Approximately 5grams equivalent dry weight of the wet sample was sub-sampled.
Sub-samples were treated with two, 5 ml additions of 0.5 N, regent grade HCl to remove
inorganic carbon (CO-3), agitated, and centrifuged to a clear supernate. Some sampleswere retreated with HCl to remove residual inorganic carbon. The evolution of gas
during HCl treatment indicates the direct presence of inorganic carbon (CO-3). AfterHCl treatment and decanting, samples were washed with approximately 15 ml ofdeionized-distilled water, agitated, centrifuged to a clear supernate, and decanted. Twosample washings were required to remove weight determination and analysisinterferences.
Prepared samples were placed in a 60°C convection oven and allowed to completely dry(approx. 48 hrs). Visual inspection of the dried sample before homogenization ensuredcomplete removal of carbonate containing materials, (shell fragments). Two 61 mm(1/4") stainless steel solid balls were added to the dried sample, capped and agitated in acommercial ball jar mill for three minutes to homogenize the dried sample.
A modification of the high temperature combustion method, utilizing a Weatstone bridgecurrent differential was used (Control Equipment Co., No. 440 Elemental Analyzer) todetermine carbon and nitrogen concentrations. The manufacturer's suggested procedureswere followed. The methods are comparable to the validation study of USEPA methodMARPCPN I. Two to three aliquots of 5-10 mg of dried prepared sub-sample were usedto determine carbon and nitrogen weight percent values. Calibration of the instrumentwas with known standards using Acetanilide or L-Cystine. Detection limits were 0.2ug/mg, carbon and 0.01 ug/mg nitrogen dry weight.
The above methods and protocols are modifications based on several published papers,reference procedures and analytical experimentation experience (Franson, 1981; Froelich,1980; Hedges and Stern, 1983; MARPCPN I, 1992).
Quality control was assessed by the analysis of National Research Council of CanadaMarine Sediment Reference Material, and BCSS-1 at the beginning and end of each

41
sample analysis set (20-30 individual machine analyses). All analyzed values were withinsuggested criteria of + 0.09% carbon (2.19% Average). Nitrogen is not reported on thestandard data report, but was accepted at + 0.008% nitrogen (0.195% Average) from theEPA study. Quality assurance was monitored by re-calibration of the instrument everytwenty samples and by the analysis of a standard as an unknown and comparing knowntheoretical percentages with resultant analyzed percentages. Acceptable limits ofstandard unknowns is less than + 2%. Sample variance was assessed by duplicate ortriplicate sample analysis, variance (standard deviation/mean) was always less than 7%.
Grain Size Analysis of Sediments
Sample Splitting and Preparation
The procedure used combined wet and dry sieve techniques to determine particle size ofsediment samples. Methods follow those of Folk (1974). Samples were thawed andthoroughly homogenized by stirring with a spatula. Spatulas were rinsed of all adheringsediment between samples. Size of the subsample for analysis was determined by thesand/silt ratio of the sample. During splitting, the sand/silt ratio was estimated and anappropriate sample weight was calculated. Subsamples were placed in clean, pre-weighed beakers. Debris was removed and any adhering sediment was washed into thebeaker.
Wet Sieve Analysis (separation of coarse and fine fraction)
Beakers were placed in a drying oven and sediments were dried at less than 55°C untilcompletely dry (approximately three days). Beakers were removed from drying oven andallowed to equilibrate to room temperature for a least a half-hour. Each beaker and itscontents were weighed to the nearest .01 g. This weight minus the empty beaker weightwas the total sample weight. Sediments in beakers were disaggregated using 100 ml of adispersant solution in water (such as 50g Calgon/L water) and the sample was stirred untilcompletely mixed and all lumps disappear. The amount and concentration of dispersantused was recorded on the data sheet for each sample. Sample beakers were placed in anultrasonic cleaner for 15 minutes for disaggregation. Sediment dispersant slurry waspoured into a 63 µm (ASTM #230, 4 phi) stainless steel or brass sieve in a large glassfunnel suspended over a 1L hydrometer cylinder by a ring stand. All fine sediments werewashed through the sieve with water. Fine sediments were captured in a 1L hydrometercylinder. Coarse sediments remaining in sieve were collected and returned to the originalsample beaker for quantification.
Dry Sieve Analysis (coarse fraction)
The coarse fraction was placed into a preweighed beaker, dried at 55-65°C, allowed toacclimate, and then weighed to 0.01 g. This weight, minus the empty beaker weight, wasthe coarse fraction weight. The coarse fraction was poured into the top sieve of a stack ofASTM sieves having the following sizes: No. 10 (2.0 mm), 18 (1.0 mm), 45 (0.354 mm),

42
60 (0.25 mm), 80 (0.177 mm), 120 (0.125 mm), and 170 (0.088 mm). The stack wasplaced on a mechanical shaker and shaken at medium intensity for 15 minutes. Aftershaking, each sieve was inverted onto a large piece of paper and tapped 5 times to freestuck particles. The sieve fractions were added cumulatively to a weighing dish, and thecumulative weight after each addition determined to 0.01g. The sample was returned toits original beaker, and saved until sample computations were completed and checked forerrors.
Hydrometer Analysis (Fine Fraction)
Hydrometers used for the analysis were precalibrated using the techniques of Lewis(1984). A reference cylinder was filled with water and 100 ml of dispersant solution. Prior to the analysis, a hydrometer reading was taken for Cc, the composite correction fortemperature, dispersing agent, and the meniscus.
For each of the sample cylinders, the volume was raised to 1000 ml using tap water. Thehydrometer number was recorded, the temperature was noted, and the sample added andstirred for 1 minute. Hydrometer readings were taken at 1 minute, 3 minutes, 10 minutes,30 minutes, 90 minutes, 4.5 hours and 24 hours. If the water temperature had changed bygreater than 2°C then hydrometer corrections were remeasured. The colloidal weight wasdetermined by subtracting the other fractions from the total weight.
Analytical Procedures
Fractional weights and percentages for various particle size fractions were calculated. Ifonly wet sieve analysis was used, weight of fine fraction was computed by subtractingcoarse fraction from total sample weight, and percent fine composition was calculatedusing fine fraction and total sample weights. If dry sieve was employed as well,fractional weights and percentages for the sieve were calculated using custom software ona Macintosh computer. Calibration factors were stored in the computer.
Toxicity Testing
Summary of Methods
All toxicity tests were conducted at the California Department of Fish and Game's MarinePollution Studies Laboratory (MPSL) at Granite Canyon. Toxicity tests were conductedby personnel from the Institute of Marine Sciences, University of California, Santa Cruz. As stated above, this report discusses data collected in 20 sampling Legs over a 5-yearperiod. A number of different toxicity tests were employed during this period. Allsamples analyzed for toxicity were tested with the 10-day amphipod survival protocolusing either Rhepoxynius abronius or Eohaustorius estuarius. Rhepoxynius was used inthe majority of the earlier (Screening) Legs while Eohaustorius was used in laterconfirmation Legs. Eohaustorius was used in later Legs because it is less susceptible to

43
fine grain sediments and unionized ammonia (EPA, 1994), two sediment characteristicswhich often confound interpretation of toxicity test results.
In addition to the 10-d solid phase amphipod test, all stations in Legs 1 through 4 werescreened for pore water toxicity using the red abalone (Haliotis rufescens) 48-h embryo-larval development protocol. Pore water toxicity was also assessed in later Legs (1-23,and 45) using the purple sea urchin (Strongylocentrotus purpuratus) embryo-larvaldevelopment protocol.
A number of other solid-phase and pore water toxicity test protocols were used in thisstudy. In some cases these tests were included as part of ongoing protocol evaluationsconducted as part of the Bay Protection and Toxic Cleanup Program. These included the20-d solid phase growth and survival protocol using the polychaete worm Neanthesarenaceodentata, the 96-h solid phase sediment water interface protocol using purple seaurchin embryo development, and the 20-minute purple sea urchin fertilization protocolusing pore water. In a few cases the bivalve embryo-larval development protocol usingthe Bay mussel Mytilus galloprovincialis was used to assess pore water or subsurface sitewater toxicity, because the salinity of the samples was too low to use sea urchin orabalone embryos. The specific methods for all of the species and protocols tested aredescribed in more detail below.
Sediment Samples
Bedded sediment samples were transported to MPSL from the sample-processinglaboratory at Moss Landing in ice chests at 4°C. Transport time was one hour. Sampleswere held at 4°C, and all tests were initiated within 14 days of sample collection, unlessotherwise noted in the Quality Assurance Appendix. All sediment samples were handledaccording to procedures described in ASTM (1992) and BPTCP Quality AssuranceProject Plan (QAPP, 1993). Samples were removed from refrigeration the day before thetest, and loaded into test containers. Water quality was measured at the beginning andend of all tests. At these times pH, temperature, salinity, and dissolved oxygen weremeasured in overlying water from all samples to verify that water quality criteria werewithin the limits defined for each test protocol. Total ammonia concentrations were alsomeasured at these times. Samples of overlying and interstitial water for hydrogen sulfidemeasurement were taken at the beginning and end of each toxicity test. Interstitial watermeasurements were taken from Leg 30 on, prior to that only overlying watermeasurements were taken. Hydrogen sulfide samples were preserved with zinc acetateand stored in the dark until time of measurement.
Pore Water Samples
Once at MPSL, frozen porewater samples (squeeze extracted porewater, Legs 1-23) werestored in the dark at -12°C until required for testing. Experiments performed by the U.S.National Biological Survey have shown no effects of freezing porewater upon the resultsof toxicity tests (Carr et al., 1995). Unfrozen pore water samples (centrifuge extracted
44
porewater, Legs 25-54) were stored in the dark, at 4°C. All porewater samples wereequilibrated to test temperature (15°C) on the day of a test, and pH, temperature, salinity,and dissolved oxygen were measured in all samples to verify water quality criteria werewithin the limits defined for the test protocol. Total ammonia and sulfide concentrationswere also measured. Pore water samples with salinities outside specified ranges for eachprotocol were adjusted to within the acceptable range. Salinities were increased by theaddition of hypersaline brine, 60 to 80‰, drawn from partially frozen seawater. Dilutionwater consisted of Granite Canyon seawater (32 to 34‰). Water quality parameters weremeasured at the beginning and end of each test.
Subsurface Water Samples
Abalone, mussel and urchin embryo-larval development tests were performed on selectedsubsurface water column samples (described above). Toxicity tests were initiated within14 days of the sample collection date. Water quality parameters, including ammonia andsulfide concentrations, were measured in one replicate test container from each sample inthe overlying water as described above. Measurements were taken at the beginning andend of all tests.
Measurement of Ammonia and Hydrogen Sulfide
Total ammonia concentrations were measured using an Orion Model 95-12 AmmoniaElectrode. The concentration of unionized ammonia was derived from the concentrationof total ammonia using the following equation (from Whitfield 1974, 1978):
[NH3] = [total ammonia] x ((1 + antilog(pKa°- pH))-1),
where pKa° is the stoichiometric acidic hydrolysis constant for the test temperature andsalinity. Values for pKa°were experimentally derived by Khoo et al. (1977). The methoddetection limit for total ammonia was 0.1 mg/L.
Total sulfide concentrations were measured using an Orion Model 94-16 Silver/SulfideElectrode, except that samples tested after February, 1994, were measured on aspectrophotometer using a colorimetric method (Phillips et al., 1997). The concentrationof hydrogen sulfide was derived from the concentration of total sulfide by using thefollowing equation (ASCE, 1989):
[H2S] = [S2-] x (1 - ((1 + antilog(pKa°- pH))-1)),
where temperature and salinity dependent pKa° values were taken from Savenko (1977). The method detection limit for total sulfide was 0.1 mg/L for the electrode method, and0.01 mg/L for the colorimetric method. Values and corresponding detection limits forunionized ammonia and hydrogen sulfide were an order of magnitude lower than thosefor total ammonia and total sulfide, respectively. Care was taken with all sulfide and

45
ammonia samples to minimize volatilization by keeping water quality sample containerscapped tightly until analysis.
Marine (Rhepoxynius abronius) and Estuarine (Eohaustorius estuarius) AmphipodSurvival Tests
Solid-phase sediment sample toxicity was assessed using the 10-day amphipod survivaltoxicity test protocols outlined in EPA 1994. All Eohaustorius and Rhepoxynius wereobtained from Northwestern Aquatic Sciences in Yaquina Bay, Oregon. Animals wereseparated into groups of approximately 100 and placed in polyethylene boxes containingYaquina Bay collection site sediment, then shipped on ice via overnight courier. Uponarrival at Granite Canyon, the Eohaustorius were acclimated to 20‰ (T=15°C), andRhepoxynius were acclimated to 28‰ (T=15°C). Once acclimated, the animals were heldfor an additional 48-hours prior to addition to the test containers. Upon arrival at GraniteCanyon, the amphipods were acclimated slowly (<2‰ per day) to 28‰ seawater(T=20°C). Once acclimated, the animals were held for an additional 48 hours prior toinoculation into the test containers.
Test containers were one liter glass beakers or jars containing 2 cm of sediment and filledto the 700-ml line with control seawater adjusted to the appropriate salinity using springwater or distilled well water. Test sediments were not sieved for indigenous organismsprior to testing although at the conclusion of the test, the presence of any predators wasnoted and recorded on the data sheet. Test sediment and overlying water were allowed toequilibrate for 24 hours, after which 20 amphipods were placed in each beaker along withcontrol seawater to fill test containers to the one-liter line. Test chambers were aeratedgently and illuminated continuously at ambient laboratory light levels.
Five laboratory replicates of each sample were tested for ten days. A negative sedimentcontrol consisting of five lab replicates of Yaquina Bay home sediment for Eohaustoriusand Rhepoxynius was included with each sediment test. After ten days, the sedimentswere sieved through a 0.5-mm Nitex screen to recover the test animals, and the number ofsurvivors was recorded for each replicate.
Positive control reference tests were conducted concurrently with each sediment testusing cadmium chloride as a reference toxicant. For these tests, amphipod survival wasrecorded in three replicates of four cadmium concentrations after a 96-hour water-onlyexposure. A negative seawater control consisting of one-micron-filtered Granite Canyonseawater, diluted to the appropriate salinity was compared to all cadmium concentrations.
Amphipod survival for each replicate was calculated as:
(Number of surviving amphipods) x 100 (Initial number of amphipods)
46
Abalone (Haliotis rufescens) Embryo-Larval Development Test
The red abalone (Haliotis rufescens) embryo-larval development test was conducted onsome pore water and subsurface water samples. Details of the test protocol are given inEPA (1995). A brief description of the method follows.
Adult male and female abalone were induced to spawn separately using a dilute solutionof hydrogen peroxide in seawater. Fertilized eggs were distributed to the test containerswithin one hour of fertilization. Test containers were polyethylene-capped, seawaterleached, 20-ml glass scintillation vials containing 10 ml of sample. Each test containerwas inoculated with 100 embryos (10/mL). Samples that were tested at multipleconcentrations were diluted with one-micron-filtered Granite Canyon seawater.Laboratory controls were included with each set of samples tested. Controls include adilution water control consisting of Granite Canyon seawater, and a brine control with allsamples that require brine adjustment. Tests were conducted at ambient seawater salinity(33±2‰). A 48-h positive control reference test was conducted concurrently with eachpore water test using a dilution series of zinc sulfate as a reference toxicant.
After a 48-h exposure period, developing larvae were fixed in 5% buffered formalin. Alllarvae in each container were examined using an inverted light microscope at 100x todetermine the proportion of veliger larvae with normal shells, as described in EPA(1995). Percent normal development was calculated as:
Number of normally developed larvae counted X 100Total number of larvae counted
Bay Mussel (Mytilus spp.) Embryo-Larval Development Test
The bay mussel (Mytilus spp.) embryo-larval development test was conducted on somelow salinity pore water and subsurface water samples because this protocol is moretolerant than abalone and sea urchin embryos to lower salinities. Details of the testprotocol are given in EPA (1995). A brief description of the method follows.
Adult male and female mussels were induced to spawn separately using temperatureshock by raising the ambient temperature by 10°C. Fertilized eggs were distributed to thetest containers within four hours of fertilization. Test containers were polyethylene-capped, seawater leached, 20-ml glass scintillation vials containing 10 mLs of sample. Each test container was inoculated with 150 to 300 embryos (15-30/mL) consistentamong replicates and treatments within a test set. Samples that were tested at multipleconcentrations were diluted with one-micron-filtered Granite Canyon seawater. Laboratory controls were included with each set of samples tested. Controls include adilution water control consisting of Granite Canyon seawater, a brine control with allsamples that require brine adjustment. Tests were conducted at 28±2‰. A 48-h positivecontrol reference test was conducted concurrently with each test using a dilution series ofcadmium chloride as a reference toxicant.

47
After a 48-h exposure period, developing larvae were fixed in 5% buffered formalin. Alllarvae in each container were examined using an inverted light microscope at 100x todetermine the proportion of normal live prossidoconch larvae, as described in EPA(1995). Percent normal live larvae was calculated as:
Number of normal larvae X 100Initial embryo density
Polychaete Worm (Neanthes arenaceodentata) Survival and Growth Test
The Neanthes test followed procedures described in Puget Sound Protocols (1992). Emergent juvenile Neanthes arenaceodentata (2-3 weeks old) were obtained from Dr.Donald Reish of California State University, Long Beach. Worms were shipped inseawater in plastic bags at ambient temperature via overnight courier. Upon arrival atMPSL, worms were allowed to acclimate gradually to 28‰ salinity (<2‰ per day,T=15°C). Once acclimated, the worms were maintained at least 48 hours, and no longerthan 10 days, before the start of the test.
Test containers were one-liter glass beakers or jars containing 2 cm of sediment and filledto the 700-ml line with seawater adjusted to 28‰ using spring water or distilled wellwater. Test sediments were not sieved for indigenous organisms prior to testing, but thepresence of any predators was noted and recorded on the data sheet at the conclusion ofthe test. Test sediment and overlying water were allowed to equilibrate for 24 hours, afterwhich 5 worms were placed in each beaker along with 28‰ seawater to fill testcontainers to the one-liter line. Test chambers were aerated gently and illuminatedcontinuously at ambient laboratory light levels. Worms were fed TetraMin® every 2days, and overlying water was renewed every 3 days. Water quality parameters weremeasured at the time of renewals.
After 20 days, samples were sieved through a 0.5-mm Nitex screen, and the number ofsurviving worms recorded. Surviving worms from each replicate were wrapped in anpiece of pre-weighed aluminum foil, and placed in a drying oven until reaching a constantweight. Each foil packet was then weighed to the nearest 0.1 mg. Worm survival andmean weight/worm for each replicate was calculated as follows:
Percent worm survival = (Number of surviving worms) X 100 (Initial number of worms)
Mean weight per worm = (Total weight - foil weight) X 100 (Number of surviving worms)

48
Purple Sea Urchin (Strongylocentrotus purpuratus) Embryo-Larval DevelopmentTest
The sea urchin (Strongylocentrotus purpuratus) larval development test was conductedon some pore water and solid phase sediment-water interface samples. Details of the testprotocol are given in EPA (1995). A brief description of the method follows.
Sea urchins were collected from the Monterey County coast near Granite Canyon, andheld at MPSL at ambient seawater temperature and salinity (33±2‰) until testing. Adultsea urchins were held in complete darkness to preserve gonadal condition. On the day ofa test, urchins were induced to spawn in air by injection with 0.5M KCl. Eggs and spermcollected from the urchins were mixed in seawater at a 500 to 1 sperm to egg ratio, andembryos were distributed to test containers within 1 hour of fertilization. Test containerswere polyethylene-capped, seawater leached, 20-ml glass scintillation vials containing 10mLs of sample. Each test container was inoculated with approximately 250 embryos(25/ml). All pore water samples were tested at three concentrations: 100, 50 and 25%pore water, each having three replicates. Pore water samples were diluted with one-micron-filtered Granite Canyon seawater. Laboratory controls were included with eachset of samples tested. Controls include a dilution water control consisting of GraniteCanyon seawater, and a brine control with all samples that require brine adjustment. Tests were conducted at ambient seawater salinity (33±2‰). A 96-hour positive controlreference test was conducted concurrently with each pore water test using a dilution seriesof copper chloride as a reference toxicant.
After a 96-hour exposure, larvae were fixed in 5% buffered formalin. Approximately 100larvae in each container were examined under an inverted light microscope at 100x todetermine the proportion of normally developed larvae as described in EPA (1995). Visual clues used to identify embryos as normal included development of skeletal rods(spicules) that extend beyond half the length of the larvae and normal development of athree-part gut. Embryos demonstrating retarded development were considered abnormal. Percent normal development was calculated as:
Number of normally developed larvae counted X 100Total number of larvae counted
Purple Sea Urchin (Strongylocentrotus purpuratus) Embryo-Larval DevelopmentTest Exposed at the Sediment-Water Interface
In some cases solid-phase sediment toxicity was assessed using the purple sea urchin(Strongylocentrotus purpuratus) embryo/larval development test. In this case, sea urchinembryos were exposed to intact (un-homogenized) sediment cores at the sediment-waterinterface. Intact sediment cores were collected directly from the Van Veen grab sampler.Details of the test protocol are given in the MPSL Standard Operating Procedure, whichfollows the EPA methods manual (1995). A brief description of the method follows.

49
Sediment-water interface test containers consisted of a polycarbonate tube with a 25-µmscreened bottom placed so that the screen was within 1 cm of the surface of an intactsediment core (Anderson et al., 1996). Seawater at ambient salinity was poured into thecore tube and allowed to equilibrate for 24 hours before the start of the test. Afterinserting the screen tube into the equilibrated cores, each tube was inoculated withapproximately 250 embryos obtained using the methods described above. A negativelaboratory control consisted of the Yaquina Bay home sediment used in all amphipodtests. Tests were conducted at ambient seawater salinity ± 2‰. Ambient salinity atGranite Canyon is usually 32 to 34‰. A positive control reference test was conductedconcurrently with the test using a dilution series of copper chloride as a referencetoxicant.
After an exposure period of 96 hours, larvae were fixed in 5% buffered formalin. Onehundred larvae in each container were examined under an inverted light microscope at100x to determine the proportion of normally developed larvae as described in EPA(1995). Percent normal development was calculated as:
Number of normally developed larvae counted X 100Total number of larvae counted
Sea Urchin (Strongylocentrotus purpuratus) Fertilization Test
The sea urchin (Strongylocentrotus purpuratus) fertilization test was conducted on porewater samples. Details of the test protocol are described in Dinnel et al. (1987). Seaurchins were from the same stock described for the sea urchin larval development test. On the day of a test, urchins were induced to spawn in air by injection with 0.5M KCl. Sperm were exposed in test containers for sixty minutes before approximately 1000 eggswere added. After twenty minutes of fertilization, the test was fixed in a 5% bufferedformalin solution. A constant sperm to egg ratio of 500 to 1 was used in all tests. Thisratio maintained fertilization in the 70-90% range required by the test protocol. Fertilization was determined by the presence or absence of a fertilization membrane. Testcontainers were polyethylene-capped, seawater leached, 20-ml glass scintillation vialscontaining 5 mls of pore water. Pore water samples were diluted with one micron-filteredGranite Canyon seawater. Laboratory controls were included with each set of samplestested. Controls included a dilution water control consisting of Granite Canyon seawater,a brine control with all samples that require brine adjustment. Tests were conducted atambient seawater salinity (33±2 ppt). A positive control reference test (1 hour spermexposure) was conducted concurrently with each pore water test using a dilution series ofcopper chloride as a reference toxicant. All eggs in each container were examined underan inverted light microscope at 100x, and counted as either fertilized or unfertilized. Percent fertilization was calculated as:
Number of fertilized eggs X 100Number of eggs observed

50
Test Acceptability and Evaluation
Quality Assurance/Quality Control (QA/QC) guidelines for the toxicity tests used in theBPTCP project are summarized in the BPTCP Quality Assurance Project Plan(Stephenson et al., 1994). Test acceptability criteria from published protocols wereevaluated for all tests. Quality assurance checklists were compiled that noted compliancefor all tests with each of these criteria. Evaluation codes were assigned to each deviationfrom QA/QC guidelines, and can be summarized as follows:
-3: sample has minor exceedances of QA criteria that are unlikely to affectassessments.
-4: sample meets or exceeds control criteria requirements.-5: data has exceedances, but are generally usable for most assessments and reporting
purposes. -6: sample has major exceedances of control criteria requirements and the data is not
usable for most assessments and reporting purposes.
It is recommended that if assessments are made that are especially sensitive or critical, theQA evaluations be consulted before using the data. Test data judged to be unacceptableare not reported, and samples from unacceptable tests are retested if necessary.
Benthic Community Analysis
Each catalogued sample was processed individually in the laboratory to obtain anaccurate assessment of species diversity and abundance. All macroinvertebrates weresorted from residues under a dissecting microscope, identified to lowest possible taxon,and counted. Laboratory processing of benthic cores consists of both rough and finesorting. Initial sorting separates animals into large taxonomic groups such as polychaetes,crustaceans, mollusks and other (e.g., phoronids). Bound laboratory logbooks weremaintained and used to record number of samples processed by each technician, as wellas results of any sample resorts, if necessary. Sorters were required to sign and date aMilestone Progress Checksheet for each replicate sample processed. Specimens ofsimilar taxonomic groups were placed in vials and labeled internally and externally withproject, date collected, site/station information, and IDORG. In-house senior taxonomistsand outside specialists processed and verified the accuracy of species identification andenumeration. An archived voucher specimen collection was established at this time.

51
Bioaccumulation
28-day Clam (Macoma balthica) Bioaccumulation Test
The 28-day bioaccumulation test with Macoma nauta was conducted according toEPA/Army Corps of Engineers Inland Testing Manual (EPA/ACOE, 1994). Clams wereobtained from Brezina and Associates (Dillon Beach, CA). Clams arrived via overnightcourier on day 0 of the test. Test containers consisted of 5L polyethylene trays with 2.5Lof sediment. Sediment was loaded into test containers, and allowed to equilibrate for 24hours before clams were added. Fifteen clams were placed in 3 replicate containers andflow-through seawater was started at a rate of 120 mL per minute. After 28 days,sediment was screened and discarded. Surviving clams were placed in clean, flow-through seawater to depurate for 24 hours. After depuration, clams were blotted dry,weighed, and frozen for tissue analysis at -12°C.
A negative control consisting of Yaquina Bay amphipod home sediment from NWAS orMacoma collection site sediment was used. Three replicates of clams were depurated for24 hours at the initiation of the test to obtain baseline tissue concentrations.
DATA ANALYSIS
Comparison of Chemistry with Sediment Quality Guideline Values
Bioavailability is the key to understanding the relationship between sediment chemistryand biological impacts. However, using TIEs, bioaccumulation analyses, or otherspecialized methods to evaluate bioavailability was not possible on the large number ofsamples evaluated in BPTCP studies to date. In order to assess large numbers of samplesfor their potential to impact biological resources, we compared sediment chemicalconcentrations to published guideline values derived from studies of approximately onethousand samples collected nationwide. These studies have used empirical observation oflarge data sets containing matching chemistry and biology data to provide guidance forevaluating the probability that measured contaminant concentrations may contribute toobserved biological effects (MacDonald, 1996; Long et al., 1995). While the reportedguideline values were derived from sediments containing mixtures of chemicals, theywere calculated individually for each chemical. Their application may be confounded insediments where biological responses are affected by synergistic or antagonisticinteractions among multiple compounds, by unmeasured or unidentified compounds, orby unconsidered physical factors.
The National Status and Trends Program has evaluated chemical and toxicologicalevidence from a number or laboratory, field, and modeling studies to establish ranges ofchemical concentrations which are rarely, sometimes, or usually associated with toxicity. Evaluation of available data (Long et al., 1995) has resulted in the identification of threeconcentration ranges for selected chemical compounds:

52
1) Minimal Effects Range: The range in concentrations over which toxic effectsare rarely observed.
2) Possible Effects Range: The range in concentrations over which toxic effectsare occasionally observed.
3) Probable Effects Range: The range in concentrations over which toxic effectsare frequently or always observed.
Two different methods were used to determine these chemical ranges. One methoddeveloped by NOAA (Long et al., 1995) used chemical data which were associated withtoxic response. These data were used to determine the lower 10th percentile of rankeddata where chemical concentration was associated with an effect (Effects Range- Low, orERL). Chemical concentrations below the ERL are not expected to have an effect. TheEffects Range- Median (ERM) reflects the 50th percentile of ranked data and representsthe level above which effects are expected to occur. Effects are occasionally expected tooccur when chemical concentrations fall between the ERL and ERM.
The screening concentrations described by MacDonald (1996) also identify three rangesof chemical concentrations associated with toxic biological response but use an alternatemethod. The ranges are identified as PEL (Probable Effects Level), and TEL (ThresholdEffects Level). TELs were derived by taking the geometric mean of the 50th percentile ofthe "No Effects" data and the 15th percentile of the "Effects" data. The PEL values werederived by taking the geometric mean of the 85th percentile of the "No Effects" data andthe 50th percentile of the "Effects" data. The ERL, ERM, TEL, and PEL values areprovided in Table 9.
Although different data sets and percentiles were used in these two approaches to derivechemical screening concentrations, they are in close agreement, usually within a factor of2. Values reported for both methods are given in Table 1. Neither of these methods isadvocated over the other in this report. Both are used in conjunction with biologicalmeasures in the following analysis to establish a weight-of-evidence approach to hotspotidentification.
It should be noted that the degree of confidence that MacDonald (1996) and Long et al.(1995) had in their respective numerical guidelines varied considerably among thedifferent chemical substances. For example, both had little confidence in the values fornickel, mercury, DDTs, dieldrin, and endrin. Swartz et al. (1994), reported an effectconcentration for amphipods exposed to Total DDT in sediment based on laboratorydose-response experiments and correlations with field data. This effect concentration isused instead of the ERM for total DDT in this report. This value is 100 µg total DDT pergram of organic carbon.

53
Non-Guideline ChemicalsTo evaluate chemicals for which no ERM or PEL guidelines have been calculated,concentrations of specific chemicals were compared to the range of chemicalconcentrations in the BPTCP database. This database contains concentrations ofapproximately 120 analytes measured in sediments collected in the majority ofCalifornia’s bays, estuaries, lagoons and near coastal areas. The following informationwas described for each chemical: the Median Detection Limit (MDL), the number ofsamples analyzed, the number of samples above the MDL, the highest value in thedataset, and the 90th and 95th percentile thresholds for each chemical. In this report,chemicals for which no sediment quality guideline values have been published werecompared to the 90th and 95th percentile thresholds, and to the range of concentrationmeasured throughout the state for comparison (Table 10).
ERM and PEL QuotientsSediment Quality Guideline quotients (SQGQ) were calculated to allow a simplecomparison between observed chemical concentrations and guideline values developedfor that chemical using a nationwide data base. To derive these quotients for a givensample, the concentration of each chemical was divided by its respective SQG value toget a quotient. Quotient values greater than 1 indicated that the chemical in that sampleexceeded its guideline value, and was likely to be associated with biological effects,based on comparisons to the large data sets from which the guidelines were derived.
In screening samples for potential effects of chemical mixtures, the quotient values for 16chemicals were averaged to get a mean SQG quotient. In this report, sample chemicalconcentrations were compared primarily to ERM values, where possible, and meanERMQ values were generally used as summary quotients for chemical mixtures. Thismean value was calculated somewhat differently from mean ERMQ values presented byLong et al. (1998), as is discussed below in the section on the use of threshold values. The chemicals used to derive this mean value were: Antimony, Cadmium, Chromium,Copper, Lead, Mercury, Silver, Zinc, Total DDT (using the DDT value of Swartz, et al.,1994), Total Chlordane, Dieldrin, Endrin, Total PCBs, low molecular weight (LMW)PAHs, and high molecular weight (HMW) PAHs. In cases where concentrations of thesechemicals were below the analytical method detection limit (MDL), a value of one-halfthe MDL was used in the derivation of the mean ERMQ. The use of mean ERMQ valueswas designed to assist with screening samples in which multiple compounds contributedto the overall level of chemical pollution, and was intended for use in conjunction withthe standard chemical-specific method discussed above. Although synergistic effects arepossible with the different contaminants, this is not implied by the use of mean SQGQs. Quotients are presented as a method for comparing relative degree of contamination atthese stations to aid management efforts.

54
Table 9. Comparison of sediment screening levels developed by NOAA and the state ofFlorida
State of Florida (1) NOAA (2,3)SUBSTANCE TEL PEL ERL ERMTotal PCB (ug/kg- dry weight) 21.550 188.79 22.70 180.0PAH (ug/kg- dry weight)Acenaphthene 6.710 88.90 16.00 500.0Acenaphthylene 5.870 127.89 44.00 640.0Anthracene 46.850 245.00 85.30 1100.0Fluorene 21.170 144.35 19.00 540.02-methylnaphthalene 20.210 201.28 70.00 670.0Naphthalene 34.570 390.64 160.00 2100.0Phenanthrene 86.680 543.53 240.00 1500.0Total LMW-PAHs 311.700 1442.00 552.00 3160.0
Benz(a)anthracene 74.830 692.53 261.00 1600.0Benzo(a)pyrene 88.810 763.22 430.00 1600.0Chrysene 107.710 845.98 384.00 2800.0Dibenz(a,h)anthracene 6.220 134.61 63.40 260.0Fluoranthene 112.820 1493.54 600.00 5100.0Pyrene 152.660 1397.60 665.00 2600.0Total HMW-PAHs 655.340 6676.14 1700.00 9600.0
Total PAHs 1684.060 16770.54 4022.00 44792.0Pesticides (ug/kg- dry weight)p,p’DDE 2.070 374.17 2.20 27.0p,p’DDT 1.190 4.77Total DDT 3.890 51.70 1.58 100.0/g o.c.Lindane 0.320 0.99Chlordane 2.260 4.79 2.00 6.0Dieldrin 0.715 4.30 8.0Endrin 45.0Metals (mg/kg- dry weight)Arsenic 7.240 41.60 8.20 70.0Antimony 2.00 25.0Cadmium 0.676 4.21 1.20 9.6Chromium 52.300 160.40 81.00 370.0Copper 18.700 108.20 34.00 270.0Lead 30.240 112.18 46.70 218.0Mercury 0.130 0.70 0.15 0.7Nickel 15.900 42.80 20.90 51.6Silver 0.733 1.77 1.00 3.7Zinc 124.000 271.00 150.00 410.0
(1) D.D. MacDonald, 1994(2) Long et al., 1995(3) Long and Morgan, 1990

55
Table 10. Concentrations of non-guideline chemicals relative to the BPTCP database.Chemical Name BPTCP
CodeMDL #
Anal.# Above
MDLHighestValue
90th %Threshold
95th %Threshold
ERM
Aluminum ALUMINUM 1 603 603 165,000 83,000 101,000 n/aAntimony ANTIMONY 0.1 603 603 52.8 3.35 5.35 25Arsenic ARSENIC 0.1 544 544 1140 21.2 26 70Cadmium CADMIUM 0.002 603 603 27.9 1.76 2.67 9.6Chromium CHROMIUM 0.02 603 603 860 212 250 370Copper COPPER 0.003 603 603 7,800 300 400 270Iron IRON 0.1 603 603 336,300 55,300 59,900 n/aLead LEAD 0.03 603 603 2100 120 171 218Manganese MANGANESE 0.05 603 603 1190 630 682 n/aMercury MERCURY 0.03 603 603 9.14 0.969 1.54 0.7Nickel NICKEL 0.1 550 550 167 88 109 51.6Silver SILVER 0.002 603 603 35.7 1.58 2.22 3.7Selenium SELENIUM 0.1 544 386 35.7 1.09 1.9 n/aTin TIN 0.02 603 603 92.9 9.03 12 n/aZinc ZINC 0.05 603 603 6,000 490 630 410Aldrin ALDRIN 0.5 621 22 8.2 4.7 8.2 n/aChloropyrifos CLPYR 1 444 130 78 28 44.4 n/aTotal Chlordane TTL_CHLR 3 612 403 246 44.57 69.5 6Dacthal DACTH 0.2 465 59 25.2 7.51 19 n/aTotal DDT TTL_DDT 5.4 621 507 3,569 235.5 471.9 46.1,
100/OCp',p'Dichlorobenz DICLB 3 465 46 63.3 30.6 35.2 n/aDieldrin DIELDRIN 0.5 618 210 62.6 11.7 16.8 8Endosulfan I ENDO _I 0.5 606 17 19.6 13.4 19.6 n/aEndosulfan II ENDO_II 1 606 59 59.8 10.4 13.8 n/aEndosulfan Sulf. ESO4 2 606 40 163 21 45.6 n/aEndrin ENDRIN 2 618 15 21.8 16.4 21.8 45Ethion ETHION 2 69 4 36.4 36.4 36.4 n/aalpha-HCH HCHA 0.2 465 14 292 26.1 292 n/abeta-HCH HCHB 1 465 6 56.8 56.8 56.8 n/ag-HCH (Lindane) HCHG 0.2 618 43 8.4 2.82 8.24 0.99
(PEL)delta-HCH HCHD 0.5 465 11 99.4 14.4 99.4 n/aHeptachlor HEPTACHLR 0.5 621 58 15.8 4.5 7.3 n/aHeptachlor Epxid HE 0.5 618 27 17.8 2.5 3.1 n/aHexachlorobenz. HCB 0.2 621 174 59.7 3.63 7.07 n/aMethoxychlor METHOXY 1.5 606 60 131 55.3 78.6 n/aMirex MIREX 0.5 620 25 103 2.6 3.74 n/aOxadiazon OXAD 6 465 12 114 45.8 114 n/aOxychlordane OCDAN 0.5 465 37 30.3 10.7 12.3 n/aToxaphene TOXAPH 50 609 10 3,200 3,200 15,700 n/aTributyltin TBT 0.003 555 555 6.21 0.422 0.724 n/aTotal PCB TTL_PCB 9 684 628 19,901 497 865 180

56
Table 10 cont. Concentrations of non-guideline chemicals relative to the BPTCPdatabase.Chemical Name BPTCP
CodeMDL #
Anal.# Above
MDLHighestValue
90th %Threshold
95th %Threshold
ERM
Low Ml Wt PAHs LMW_PAH 60 624 473 92,097 2,585 4,253 3,160High MlWt PAHs HMW_PAH 60 628 606 225,740 15,727 24,473 9,600Total PAHs TTL_PAH 60 628 628 227,801 17,107 27,485 44,792Total Org Carbon TOC n/a 686 686 26.8 3 4.01 n/aERM Sum Quot. ERMQ n/a 548 n/a 4.37 1.11 1.4 n/aPEL Sum Quot. PELQ n/a 553 n/a 7.8 1.52 1.95 n/a
Statistical Analysis of Toxicity Test Data
Samples were defined as toxic if the following two criteria were met: 1) there was asignificant difference (p<0.05) in mean organism response (e.g., percent survival)between a sample and the control as determined using a separate-variance t-test, and 2)mean organism response in the toxicity test, as a percent of the control, was less than thethreshold based on the 90th percentile Minimum Significant Difference (MSD) value, as apercent of the laboratory control value.
Statistical significance in t-tests is determined by dividing an expression of the differencebetween sample and control by an expression of the variance among replicates. We used a"separate variance" t-test that adjusted the degrees of freedom to account for varianceheterogeneity among samples. If the difference between sample and control is largerelative to the variance among replicates, then the difference is determined to besignificant. In many cases, however, low between-replicate variance will cause acomparison to be considered significant, even though the magnitude of the difference canbe small. These samples were identified as “significantly toxic” in this report in order toacknowledge the statistical difference, although it is recognized that the magnitude oftoxicity in some cases may not have been biologically meaningful. A second tier of“significant toxicity” was considered in order to identify those samples where the toxicresponse was considered to be more biologically meaningful. This involved a secondcomparison to the Minimum Significant Difference value specific to each toxicity testprotocol. The magnitude of difference that can be identified as significant is termed theMinimum Significant Difference (MSD), which is dependent on the selected alpha level,the level of between-replicate variation, and the number of replicates specific to theexperiment. With the number of replicates and alpha level held constant, the MSD varieswith the degree of between-replicate variation. The "detectable difference" inherent tothe toxicity test protocol can be determined by identifying the magnitude of differencethat can be detected by the protocol 90% of the time (Schimmel et al., 1994; Thursby andSchlekat, 1993). This is equivalent to setting the level of statistical power at 0.90 forthese comparisons. This is accomplished by determining the MSD for each t-testconducted, ranking them in ascending order, and identifying the 90th percentile MSD, theMSD that is larger than or equal to 90% of the MSD values generated.

57
Thursby et al. (1997) identify a value of 80% of the control as the detectable differencefor the Ampelisca test, and similar values have been derived for BPTCP test data. Current BPTCP detectable difference (90th percentile MSD) values are listed in Table 11.In the maps and tables presented in this report, samples that were significantly differentrelative to the control value using a t-test are indicated with either a single asterisk (*) inthe toxicity tables, or grey-shaded circles in the maps. Samples that were significantlydifferent from the control value using a t-test and the MSD value are indicated with eithera “T” (= Toxic) in the toxicity tables, or black circles in the maps.
Table 11. Minimum Significant Difference (MSD) values calculated for selected toxicitytests.
Species Name MSD % of control NEe Eohaustorius 25 75 385Hr Haliotis (5 reps) 10 90 131Hr Haliotis (3 reps) 36 64 336Hr Haliotis (all reps) 32 68 467Me Mytilus 20 80 223Na Sv Neanthes Sv 36 64 335Na Wt Neanthes Wt 56 44 335Ra Rhepoxynius 23 77 720Sp Dev Urchin Dev (5 reps) 22 78 309Sp Dev Urchin Dev (3 reps) 45 55 630Sp Dev Urchin Dev (all) 40 60 939Sp Fert Urchin Fert 12 88 79Sp SWI Urchin SWI 41 59 109
Relative Benthic Index
Benthic samples were sieved, sorted and the number of individuals of each species ineach replicate core were identified. A number of summary statistics were calculated foreach station, including summaries of total fauna, number of species, and the 4 majorphyla (Polychaetes, Crustaceans, Molluscs, and Echinoderms).
The Relative Benthic Index (RBI) used in this study utilizes the above summarized faunainformation in a refined version of the benthic index presented in the San Diego andSouthern California Bays and Estuaries BPTCP reports (Fairey et al., 1996; Anderson etal., 1997; Fairey et al., In Press). It is based on toxicology and natural historyconsiderations concerning responses of marine benthic communities to anthropogenic andnatural disturbances. The community patterns used in the index include number ofspecies (all taxa, only molluscs, and only crustaceans); and the number of individuals ofcrustaceans, the number of individuals of selected species that are indicators of relativelydisturbed benthic habitats, and the number of individuals of selected species that areindicators of relatively undisturbed benthic habitats. The RBI is developed for particular

58
areas by selecting different indicator species. It does not require the presence ofuncontaminated reference stations, and does not refer to data beyond that collected ineach study. Often the evaluation of community degradation depends on comparisons touncontaminated reference sites which are difficult to locate and vary for reasons that areunknown and unrelated to contamination.
In addition to review through discussions with other benthic ecologists (B. Thompson, R.Swartz, M. Bergen) involved in ecotoxicological research, the RBI presented here hasundergone peer-review by the Scientific Planning and Review Committee (SPARC)convened by the BPTCP for review of all project activities (SWRCB, 1997). Modifications to the RBI suggested by the SPARC reviewers were incorporated into theindex presented here.
Number of Species
The number of species often decreases with severe disturbances (Oliver et al., 1977,1980; Lenihan and Oliver, 1995) and is the best indicator of biodiversity, particularlywhen species are sampled in relation to habitat area (Hurlbert, 1971; Jumars, 1975, 1976;Abel and Walters, 1979). Therefore, the first community parameter in the RBI is the totalnumber of species found in a standard sample of habitat area. Among the more numerouslarge taxonomic groups, crustaceans are generally more sensitive to environmentalcontaminants and other anthropogenic disturbances than most other components of theinfauna, particularly polychaetes (Pearson and Rosenberg, 1978; Reish et al., 1980;Thistle, 1981; Swartz et al., 1986; Stull et al., 1986; Oliver et al., 1977; Lenihan andOliver, 1995; Lenihan et al., 1995). Speciose and numerically abundant crustacean faunason the Pacific coast of the United States are generally only found in uncontaminatedenvironments (Barnard, 1963), making the number of crustacean species an importantindicator of overall environmental health. To a lesser degree, the number of molluskspecies also increase with decreasing environmental stress (Stull et al., 1986; Swartz etal., 1986; Oliver et al., 1977), and are thus also included in the RBI. Polychaetes,crustaceans, and molluscs are the three dominate groups of benthic macro-invertebratesfrom many nearshore communities (Oliver et al., 1980), but unlike the crustaceans andmolluscs many of the most opportunistic or weedy species are polychaete (Grassle andGrassle, 1974; McCall, 1977; Oliver et al., 1977; Pearson and Rosenberg, 1978; Reish etal., 1980; Sanders et al., 1980; Santos and Simon, 1980; Thistle, 1981; Rhoads et al.,1982; Lenihan and Oliver, 1995). As a result, the number of polychaete species was notused in the RBI, because they do not indicate as clearly either a relatively disturbedhabitat or a relatively undisturbed habitat.
Number of Individuals
An increase in the number of crustacean individuals is also indicative of relatively healthyenvironments (Stull et al., 1986; Swartz et al., 1986; Oliver et al., 1977; Lenihan andOliver, 1995), although sometimes one or two crustacean species can be abundant indisturbed habitats (Vetter, 1995; Okey, 1997), but less so than for other major taxonomic

59
groups, particularly polychaete worms (Pearson and Rosenberg, 1978; Grassle andGrassle, 1974; Oliver et al., 1977). Therefore, the number of individuals of crustaceans isalso used in the RBI, but not the number of individuals in any other major taxonomicgroup.
Indicator Species
Even more than the number of species or the number of crustacean individuals, thepopulation sizes of selected indicator species are strongly associated with benthic habitatsthat are relatively disturbed or undisturbed (Grassle and Grassle, 1974; Oliver et al.,1977; Davis and Spies, 1980; Westin, 1990; Lenihan and Oliver, 1995; Okey, 1997).Therefore, five species were used in the RBI as indicators of either highly disturbed orundisturbed benthic communities and habitats. The number and identity of indicatorspecies can change from one regional study site to another. Selection of indicator specieswas based on known responses to anthropogenic and other disturbances (Grassle andGrassle, 1974; McCall, 1977; Oliver et al., 1977; Pearson and Rosenberg, 1978; Davisand Spies, 1980; Sanders et al., 1980; Santos and Simon, 1980; Thistle, 1981; Lenihanand Oliver, 1995; Okey, 1997) and related natural history such as life history traits(Grassle and Grassle, 1974; Oliver et al., 1977; Rhoads et al., 1978; Rhoads and Boyer,1982; Lenihan and Oliver, 1995) and abundance patterns along environmental gradientsand among the study stations (Oliver et al., 1980; Stull et al., 1986; Swartz et al., 1986;Weston, 1990). The 2 negative indicator species are highly opportunistic annelids whichthrive in disturbed, polluted, or marginal environments, and are generally not found inless disturbed communities. The 3 positive indicator species are generally not found inpolluted habitats and are characteristic of regions where anthropogenic and other severedisturbances do not play major roles in structuring communities. Each indicator species isdiscussed below:
Negative Indicator Species
Capitella capitata
The Capitella species complex is a cosmopolitan group which lives in a wide range ofconditions: fouled or low oxygen, high organic matter and fine sediments. They areabundant around outfalls discharging biological wastes, and have a rapid (1 to 2 month)life cycle. Capitella are capable of surviving for days with little or no oxygen, and areoften considered the best example of a "weedy", opportunistic species (Grassle andGrassle, 1974, 1976; Oliver et al., 1977; McCall, 1977; Pearson and Rosenberg, 1978;Lenihan and Oliver, 1995; Okey, 1995 and many others).
Oligochaetes
Oligochaetes are a poorly known group typically found in peripheral/disturbed habitatssuch as under decaying algae on beaches, and in fouled or low oxygen muds of back bays,estuaries, and harbors (Brinkhurst and Simmons, 1968; Pearson and Rosenberg, 1978;

60
Brinkhurst and Cook, 1980). They often occur in large masses devoid of othermacrofauna. In SF Bay they may comprise 100% of the fauna where there is grosspollution (i.e., large amounts of organic material from sewage). If oxygen levels aresufficient, and there is little toxic waste and high bacterial levels, oligochaete densitiesbecome extremely high (Smith and Carlton, 1975; Brinkhurst and Simmons, 1968). Theyare well known indicators of relatively degraded freshwater ecosystems (Brinkhurst andSimmons, 1968; Pearson and Rosenberg, 1978; Brinkhurst and Cook, 1980).
Positive Indicator Species
Heterophoxus
Heterophoxus is a fossorial phoxocephalid amphipod which requires well-oxygenated,clean sediment (Slattery, 1985). They are shallow burrowers which occur in the top 1 cmof sand. They are major predators on small soft-bodied infauna (Oliver et al., 1982;Oliver and Slattery, 1985a). Phoxocephalids, such as the similar Rhepoxynius spp., areconsidered highly sensitive to sediment contaminants, and are commonly used insediment bioassays (Swartz et al., 1979, 1984; Oakden et al., 1984a,b; Lenihan et al.,1995).
Monoculodes
Monoculodes is a fossorial oedocerotid amphipod which requires well-oxygenated, cleansediment (Oliver et al., 1980). They are shallow burrowers which occur at the sandsurface/water interface. Monoculodes are carnivorous and therefore are probably activeand sensitive to sediment surface quality (Mills, 1962; Bousfield, 1970; Bousfield, 1996).They can also colonize relatively small open patches in sandy habitats (Oliver et al.,1977) and have been selected as sensitive species to use in bioassays (Lenihan et al.,1995).
Tellina
The bivalve mollusc Tellina lives in clean, well-oxygenated sands of shallow water(Oliver et al., 1980). Species in Southern California attain great enough densities to be amajor component of the shallow water, benthic infaunal community (Barnard, 1963).They are not known to be early colonists in disturbed sedimentary habitats (Oliver et al.,1977).
Calculation of RBI
Previous versions of the Benthic Index have used individual impact thresholds fordetermination of degree of negative impact to Total Fauna and Number of CrustaceanSpecies (Fairey et al., 1996). While these thresholds have been useful, the necessarilyarbitrary nature of the selection process introduced potential artifacts for stations whosevalues for Total Fauna, Total Molluscs and Total Crustacea approached the threshold

61
value. To address this problem, calculation of the Relative Benthic Index was revised tobe based on percentages of the total range. The final threshold value for determination ofimpacted versus non-impacted sites was based on the overall Relative Benthic Index andselected using best professional judgment. Justification for this critical threshold value ofthe RBI is discussed below.
For total fauna, number of mollusk species and number of crustacean species, themaximum and minimum values in these parameters over all the stations were determined.For each station, the total number of species, total mollusk species, and total number ofcrustacean species were then converted to the percentage of the total range for theseparameters. The number of crustacean individuals at each station is similarly converted toa percentage of the total range, and is added to the total fauna, mollusk, and crustaceanspecies numbers. The community numbers thus represent four-sixth of the RelativeBenthic Index for each station.
For the positive and negative indicator indices, the final index was weighted towardspresence and absence of key indicator species, with abundance of each species givenadditional incremental weight. Accordingly, the abundance of each indicator species wastransformed using a double square-root transformation to compress the range of values.For each species, the transformed abundance was converted to a percentage of the totalrange. The transformed values of the negative indicator species were summed andsubtracted from the sum of the values for the positive indicator species.
The overall Relative Benthic Index was calculated by summing the values of the TotalFauna, Total Molluscs, Crustacean Species, and Indicator Species, and standardizing it tothe total range. This resulted in a range in values from 0.00 (Most Impacted) to 1.00(Least Impacted).
Use of RBI
It is not possible to compare directly RBI values between different regions. The high andlow ranges of values vary based on the extreme values within each data set. In addition,different indicator species are often used between regions. What the RBI does provide isthe relative "health" of each of the stations in a given data set compared to the otherstations in the same data set.
The RBI does not indicate causality. While a low RBI value could be the result ofchemical toxicity, it also could be the result of other types of anthropogenic disturbance,such as dredging, or could result from a variety of natural disturbances, such asfreshwater runoff, temperature stratification, or storm impacts.
It is not possible to test the RBI to determine significance levels or confidence levels, orto statistically determine what ranking indicates significant impact. However, since adegree of arbitrariness is incorporated into all determinations of significance, whetherstatistical or intuitive, this should not be considered a significant drawback. For this

62
study, the threshold for significantly impacted benthic community structure was set at aRelative Benthic Index less than or equal to 0.30. Several factors were considered inderiving this threshold: the stations below the threshold have few overall species, fewcrustacean species, presence of negative indicator species, and absence of positiveindicator species. While it is recognized that this threshold is somewhat arbitrary, it wasselected based on the best professional judgement of the benthic ecologists whoperformed the analyses to be conservative. Stations having an RBI <0.30 would beconsidered to be significantly degraded by most naturalists familiar with southernCalifornia’s bays and estuaries. The RBI is not intended as a sole indicator of biologicalimpact. For the purposes of this report, it should only be used in combination withchemistry and toxicity test data to provide a "weight-of-evidence" for determination ofthe most impacted stations.
Multivariate and Univariate Techniques for Comparison of Chemistry and ToxicityDataWhile the main objective of this study was to identify stations of concern, the data werealso evaluated to investigate whether certain individual chemicals were found to beassociated with biological impacts. These preliminary evaluations were made usingPrincipal Components Analysis (a multivariate technique) and Correlation analysis (aunivariate technique). Identification of chemicals that were associated with toxicity doesnot demonstrate cause and effect, but it allows the development of hypotheses concerningthe chemical causes of biological impacts. Causes of toxicity can later be investigatedwith TIEs and other more extensive toxicological methods.
Principle Components AnalysisBecause many chemicals tend to co-vary in sediments, Principal Components Analysis(PCA) was used to investigate relationships between chemistry, toxicity, and benthicindicators prior to conducting simple correlation analyses. The PCA was treated asexploratory in nature; therefore, data were not screened for sample size, normality,linearity, outliers or multicolinearity.
Principal components were extracted using SYSTAT statistics software (v. 7.0.1 forWindows; SPSS, 1997). The analysis was run with a correlation matrix and varimaxrotation, and included any factors which accounted for greater than 10% of the totalvariance. A component loading cutoff value of 0.40 was used in selecting variables forinclusion into factors, based on suggestions by Tabachnick and Fidell (1996) that a cut-off of at least 0.32 be used, and that component loadings of greater than 0.45 areconsidered fair or better.
Correlation AnalysisIn order to examine associations between levels of pollutants in sediments and theresponse observed in toxicity tests, Spearman rank correlation coefficients (Rho) werecalculated using Systat 7.0 software. Since the response of the control groups for eachtoxicity test was both acceptable and consistent, the sediment toxicity test data were notnormalized to control results. Rho values, corrected for ties, were determined for each

63
toxicity test and each pollutant or pollutant class, and these Rho values were compared totables at the appropriate n value to determine the level of statistical significanceassociated with the observed correlation.
Strategy for Categorization of Stations Based on Available Monitoring Data
One goal of this study was to identify those sites considered to be of primary concern interms of chemical pollution and potential impacts on beneficial uses identified throughbiological measures. By comparing the relative degree of chemical pollution withdifferent measures of toxic effect, and combining these data with information on benthiccommunity degradation, a weight-of-evidence approach may be employed to identify themost impacted sites.
It is recognized that any conclusions based on interpretation of these data should beconsidered preliminary because of the limited nature of the data set. As with any study ofthis scope, it is difficult to identify all variables that may be associated with biologicalresponses at a particular location. For example, our characterization of organic chemicalcontamination is constrained by the limited number of contaminants measured (AppendixB). Samples often contained un-identified organic compounds that were not furthercharacterized due to the limited scope of the study; these could have contributed to thetoxicity of the samples. In addition, no measures of interstitial water chemicalconcentrations were conducted for substances other than ammonia and hydrogen sulfide. Therefore, our ability to characterize bioavailability of the bulk-phase chemicals islimited to TOC normalization. In addition, a limited number of measures of AcidVolatile Sulfides and associated metals (AVS-SEM) were made, which limits our abilityto predict bioavailability and toxicity of metals. Conclusions regarding benthiccommunity degradation was limited by the lack of in situ sediment dissolved oxygenlevels.
Because of these limitations, characterization of the most impacted stations must rely, toa certain extent, on a qualitative interpretation of the data. To accomplish this, individualstations were evaluated based on a Triad of measures (sensu Chapman et al., 1987):chemical pollution, benthic community structure, and toxicity to various species.
Using this available data, stations were categorized based on chemical concentrations, theseverity of biological impacts, and the completeness of sample characterization. Theconceptual framework for categorizing stations is provided in the listing below. In orderto categorize stations, it was necessary to define terms such as "elevated chemistry" or"sample toxicity" for a large number of samples. To be consistent, thresholds wereestablished for this purpose. Those thresholds are defined below in the description of thefirst category. Toxicity thresholds were based on the t-test plus detectable differencecriteria (MSD). Benthic community degradation was defined as a Relative Benthic Index≤ 0.30, based on the best professional judgement of the ecologists who developed theindex. Elevated chemistry was defined as 6 or more chemicals exceeding ERMguidelines, a ERMQ above 0.5, or one or more chemicals at concentrations high enough

64
to likely be associated with biological effects, based on best professional judgement. TheERMQ value of 0.5 was based on an evaluation by Long et al. (in press) that indicated atleast 50% of samples in a nationwide evaluation exhibited toxicity when this value wasexceeded. The BPTCP has calculated ERMQ values using a different suite of chemicalsthan that used by Long et al. (in press). The primary differences are that Long et al. (inpress) used a number of individual PAHs and the DDT ERM, whereas the BPTCP usedonly the summary low and high molecular weight PAHs (2 values) and the sedimenteffect value reported by Swartz et al. (1994) as the DDT value. When the ERMQ values,as calculated by the BPTCP, were compared with amphipod toxicity in the statewidedatabase, 62% of the samples with ERMQs greater than 0.5 were found to be toxic toamphipods.
These chemistry, toxicity, and benthic community threshold values were derived to allowa consistent interpretation of data from samples throughout the Region and state. It isimportant to note that while these threshold values were selected based on the bestavailable information and best professional judgement of the authors, they are by naturediscretionary. Chemical bioavailability varies from sample to sample, and the exactdefinitions of toxicity and benthic degradation depend on factors not easily analyzed in alarge number of samples. Further data collection and analysis may result in thedetermination of different threshold values and different definitions for biologicalimpacts. The thresholds and station characterizations used here are not intended to beabsolute. They are intended to aid in the screening of data collected from a large numberof locations, in order to support management decisions. In some cases additional studiesmay be undertaken to further evaluate the sites of concern identified in this Region-wideassessment. As more data become available through additional studies, more accuratesite-specific characterizations of sediment quality may result.
The sites were categorized as follows based on the combination of measurements:
Category 1: Stations with elevated chemistry*, recurrent toxicity, and degraded benthos.
Category 2:Stations with elevated chemistry, one (of one) toxicity hit, and degraded benthos.(Only one sample tested and significant toxicity indicated.)
Category 3:Stations with elevated tissue chemical concentrations.Stations where muscle or whole body tissue residues in resident, non-migratoryorganisms exceed levels established by the FDA or NAS for protection of human healthor wildlife. Organisms may be either deployed or collected from resident populations. (FDA and NAS values are given in SWRCB FED on Guidance for THS Cleanup Plans)
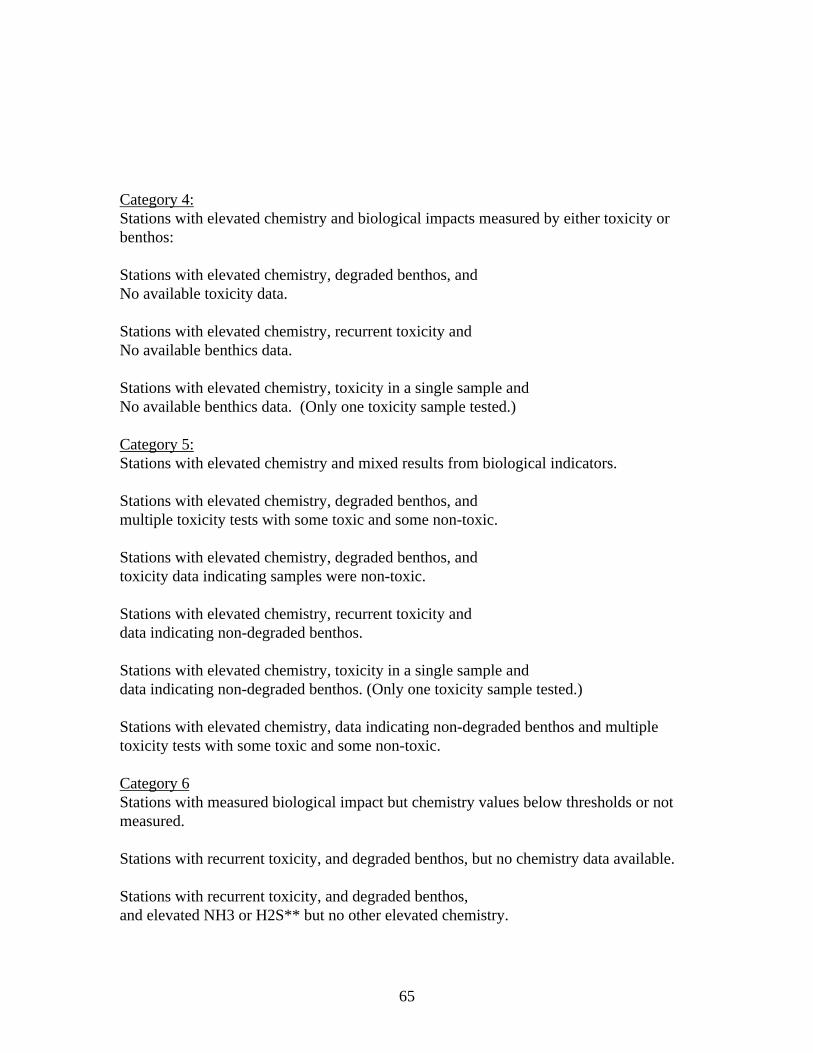
65
Category 4:Stations with elevated chemistry and biological impacts measured by either toxicity orbenthos:
Stations with elevated chemistry, degraded benthos, andNo available toxicity data.
Stations with elevated chemistry, recurrent toxicity andNo available benthics data.
Stations with elevated chemistry, toxicity in a single sample andNo available benthics data. (Only one toxicity sample tested.)
Category 5:Stations with elevated chemistry and mixed results from biological indicators.
Stations with elevated chemistry, degraded benthos, andmultiple toxicity tests with some toxic and some non-toxic.
Stations with elevated chemistry, degraded benthos, andtoxicity data indicating samples were non-toxic.
Stations with elevated chemistry, recurrent toxicity anddata indicating non-degraded benthos.
Stations with elevated chemistry, toxicity in a single sample anddata indicating non-degraded benthos. (Only one toxicity sample tested.)
Stations with elevated chemistry, data indicating non-degraded benthos and multipletoxicity tests with some toxic and some non-toxic.
Category 6Stations with measured biological impact but chemistry values below thresholds or notmeasured.
Stations with recurrent toxicity, and degraded benthos, but no chemistry data available.
Stations with recurrent toxicity, and degraded benthos,and elevated NH3 or H2S** but no other elevated chemistry.

66
Stations with recurrent toxicity, and degraded benthos,but existing chemistry data indicates five or fewer chemicals measured at elevatedconcentrations.
Stations with a single indicator of biological effect (either recurrent toxicity or degradedbenthos), but existing chemistry data indicates five or fewer chemicals measured atelevated concentrations.
Stations with a single toxic sample, but existing chemistry data has no chemicalsmeasured at elevated concentrations.
Category 7Stations with elevated chemistry but biological measures below thresholds.
Category 8Stations with chemistry, toxicity, and benthic degradation below thresholds, or notmeasured.
Category 9--Reference StationsThese should be selected using best professional judgment of available information,including grain size, salinity, chemistry, benthic ecology, and toxicity data, as well asstation location relative to pollutant sources. The parameter to be compared to reference(e.g., toxicity) should not be the primary measure used in reference site selection.
Prioritization within these major categories should be determined by the actual datavalues, such as 20% survival would rank above 55% survival, etc. Best professionaljudgment will be necessary to balance chemical versus biological data values.
*Elevated Chemistry could be indicated by:1) Guideline mean quotient value above 0.5, indicating a mixture of pollutants, or2) At least 6 guideline exceedences, or an individual chemical at very highconcentrations, such as many times the guideline value, or in the highest 10th percentilefor all samples in the Region (or State).
**Elevated concentrations of NH3 or H2S thought to have resulted from human activitymay be considered equivalent to elevated concentrations of other anthropogenicchemicals for prioritization purposes, based on best professional judgement. In caseswhere NH3 and H2S are thought to result from natural processes, high concentrations maybe considered as interferences in toxicity or benthic assessments.
Chemistry, toxicity, benthic community data, bioaccumulation or other data fromprevious studies may be considered as part of the categorization described above.

67
Quality Assurance/Quality Control
Summary of Methods
Summaries of quality assurance and quality control procedures are described underseparate cover in the Bay Protection and Toxic Cleanup Program Quality AssuranceProject Plan (Stephenson et al., 1994). This document describes procedures within theprogram which ensure data quality and integrity. In addition, individual laboratoriesprepare quality assurance evaluations of each discrete set of samples analyzed andauthorized by task order. These documents were submitted to the California Departmentof Fish and Game for review, then forwarded to the State Water Resources Control Boardfor further review.

68
RESULTS/DISCUSSION
This report consolidates ecotoxicological analyses from 267 sediment samples collectedfrom 138 stations. Due to differences in toxicant sources, physical environments, andbeneficial uses, the results and discussion of data collected in the Los Angeles Region aredivided into three sections, one for each of the three key waterbody types: IndustrialHarbors (Los Angeles and Long Beach Harbors, Palos Verdes, Port Hueneme), Marinas(Shoreline Marina, Los Alamitos Bay, King Harbor, Marina Del Rey, Ballona Creek,Channel Islands Harbor, Ventura Harbor), and Lagoons (Malibu Lagoon, Mugu Lagoon,Colorado Lagoon/Simm’s Pond, Santa Clara and Ventura River estuaries, and McGrathLake). The specific Industrial Harbor, Marina, and Lagoon stations are shown in thesampling stations maps shown in the methods section of the report (Figures 2-9). Theremaining figures and tables presenting results of chemical and biological monitoring atthese stations are provided at the end of the report and in the Appendices.
Industrial Harbors
Chemistry Data
Data Relative to Quality Assurance Criteria
All trace metal analyses met all quality assurance criteria as described by Stephenson etal. (1994). Many trace organic analyses had minor deviations from QA criteria, asindicated by "-5" QA codes (Appendix C). Most of these deviations involved blankresponses outside of control chart guidelines, in which case the chemical concentrationsmeasured were corrected based on blank response prior to reporting. If criticalmanagement decisions must be based on data for which a "-5" code is assigned inAppendix C, the reader is advised to consult the data QA reports on file at the SWRCB.
Primary Chemicals of Concern
A summary of chemicals at the Industrial Harbor stations that exceeded the ERM/ERLguideline values is presented in Figure 10. Five trace metals were found in relatively highconcentrations with copper, mercury, and zinc most often exceeding the chemicalguideline values. Copper exceedances of ERM values occurred at Inner Fish Harbor inLong Beach Harbor (Station No.s 40019.1, 40019.2 and 40019.3), and at Cabrillo BeachPier, Consolidated Slip, and the Kaiser International Berth No. 49 in Los Angeles Harbor(Station No.s 40010.0, 47005.0, and 49004.0, respectively; Figure 11 a-c and Figure 12a-b). Mercury concentrations greater than the ERM value were measured at Southwest Slip(40001.2) and Consolidated Slip (40006.1, 47005) in Los Angeles Harbor, and at InnerFish Harbor (40019.1, 40019.2, and 40019.3) Long Beach Harbor Channel 2 (40007.2)and Long Beach Inner Harbor Channel 3 (40011.3; Appendix C). Elevated zincconcentrations (>ERM) were measured in several Consolidated Slip samples in LosAngeles Harbor (Appendix C), and Inner Fish Harbor in Long Beach Harbor.

69
In addition to the metals discussed above, tribuyltin (TBT) concentrations were elevatedin some of the Industrial Harbor sediments relative to the BPTCP database (Appendix C).TBT concentrations in sediment from the East Turning Basin (40005) and Inner FishHarbor (40019.1, 40019.2, and 40019.3) were greater than the 95th percentile thresholdfor the statewide BPTCP database. The second highest TBT concentration in thestatewide BPTCP database was measured in sediment from Consolidated Slip (40006.2).In addition, concentrations of TBT from Port Hueneme sediment (44013) were elevatedrelative to those collected throughout the state, exceeding the 90th percentile threshold. Selenium concentrations in sediments from several Industrial Harbor stations were alsoelevated relative to those measured throughout the state. Sediments from Long Beachouter harbor (40033), Inner Fish Harbor (40019.1-40019.3), and Terminal Island STP(40016) all exceeded the 90th percentile threshold from the BPTCP database. Sedimentfrom Lower Main Channel (40024.2 and 40024.3) contained selenium concentrations thatwere twice the 95th percentile threshold from the BPTCP database.
Several pesticides exceeded the chemical guideline values. As in previous BPTCPmonitoring studies (Fairey et al., 1996; Anderson et al., 1997; Hunt et al., 1998) totalchlordane was one of the pesticides most commonly measured at elevated concentrations(Figure 10). Total chlordane is the summation of the major constituents of technicalgrade chlordane and its metabolites (in this case cis- and trans-Chlordane, Oxychlordane,and cis- and trans-Nonachlor; Appendix C), and comprise a group of nonsystemicstomach and contact insecticides which until the mid 1970's had been used extensively inhome and agricultural applications. Although the use of this compound was discontinuedin this country due to it's widespread occurrence, biomagnification through the foodchain,and persistence in non-target systems, chlordane continues to occur in aquaticecosystems. Due to their limited water solubility, chlordane compounds tend to bind toorganic carbon and settle out of the water column, accumulating in sediments (Wilcok etal., 1993). Elevated chlordane was found at the East Turning Basin (Station No.40005.1), Inner Queensway Bay (40013.1 and 40013.2), Los Cerritos Channel (44011.0),and at Long Beach Outer Harbor (40018.3; Figure 13). High total chlordaneconcentrations were also found at several Consolidated Slip stations (Figure 14); the totalchlordane concentration at one station (Station No. 47004.0) was 41 times the ERMvalue.
Total DDT (Σ of ortho and para DDE, DDD, and DDT) exceeding the sediment effectconcentration (= 100 µg Total DDT / gram of organic carbon; Swartz et al., 1994) wasfound only at the Palos Verdes off shore stations (No.s 40031.1, 40031.2, and 40031.3,Appendix C). DDT and its metabolites are a class of relatively water insoluble organo-chlorine compounds which also tend to bind to organic particulates and thus accumulatein the sediments. Concentrations of these compounds have generally declined in aquaticecosystems since they were banned for most insecticide applications in 1972, althoughconcentrations of some DDT metabolites have increased. Like chlordane and dieldrin, itis persistent in sediments and may be of significant environmental concern at higherconcentrations (Hoke et al., 1994; Swartz et al., 1994). Elevated concentrations of total

70
DDT have been found off the Palos Verdes Peninsula in previous studies (MacDonald,1994). Elevated dieldrin concentrations were measured in sediments from severalstations in Consolidated Slip (No.s 47002.0, 47003.0, 47009.0; Appendix C).
In addition to the pesticides listed above, endosulfan concentrations were elevated insediment from Kaiser International Berth 49 (49004) relative to the 90th percentilethreshold from the BPTCP database. The chlorpyrifos concentration in sediment fromConsolidated Slip (47009) exceeded the 90th percentile threshold for the BTPCP database(Appendix C).
Total PCB concentrations (the sum of 18 congeners) were the chemical compounds thatmost commonly exceeded the chemical guideline guideline values (Figure 10). PCBs arebase-neutral compounds that are formed by direct chlorination of biphynel. There are 209numerically designated individual compounds, called congeners (e.g., PCB #101), basedon the possible chlorine substitution patterns. Mixtures of various PCB congeners havebeen manufactured in the U.S. since 1929 (Phillips, 1987) and are used commerciallyunder the trade name Aroclor. Each PCB mixture has a number designation (e.g.,Aroclor 1254) with the last two numbers indicating the percentage of chlorine in themixture. PCB mixtures were used extensively in the U.S. prior to 1979 for industrialapplications which required fluids with thermal stability, fire and oxidation resistance andsolubility in organic compounds (Hodges, 1977). PCBs have proven to be extremelypersistent in the environment and have demonstrated a variety of adverse carcinogenicand non-carcinogenic effects (U.S. EPA, 1993c). These substances are highly lipophilicand have a high potential to accumulate in the tissues of aquatic organisms and canrepresent a significant human health hazard (Moore and Walker, 1991).
High concentrations of total PCBs were measured in sediment samples from throughoutthe Los Angeles and Long Beach Harbor area (Figure 15). Elevated PCB concentrationswere found in Southwest Slip (Station No. 40001), Lower Main Channel (40004), EastTurning Basin (40005), Inner Fish Harbor (40019), Hugo Neuproler #1 and #2 (46001,46002), Kaiser International Berth 49 (49004), San Pedro Bay Outer Harbor (48009),Long Beach Harbor Channel 2 (40007), and Palos Verdes (40031). The highest totalPCB concentrations measured in the Industrial Harbor samples were from ConsolidatedSlip (Figure 16). Concentrations above the ERM value were found throughout this area;sediment concentrations of PCBs were 5x, 11x, 8x, and 9x the ERM value atConsolidated Slip stations 47001, 47002, 47003, and 47005, respectively.
Polycyclic aromatic hydrocarbons (PAHs) are base-neutral organic compounds that arecomponents of crude and refined petroleum products and a product of incompletecombustion of hydrocarbons. These compounds are common components ofcontaminated sediments and are toxic to infaunal invertebrates (Eisler, 1987; Neff, 1979;Neff and Anderson, 1981), in particular amphipods (Swartz et al., 1995). Due to theirsimilar modes of toxicity, individual PAHs are combined into low and high molecularweight groups. Elevated concentrations of low molecular weight PAHs were found inSouthwest Slip (40001), and extremely high concentrations were found at Kaiser

71
International Berth 49 (29x the ERM, Station No. 49004); these are due to onshore coalloading facilities at this site. High molecular weight PAHs were found in Southwest Slip(40001, 40006), Consolidated Slip (47002, 47004, 47009), and Kaiser International Berth49 (5x the ERM, Station No. 49004). Total PAH concentrations were also 3x above theERM value at Kaiser International Berth 49 (Figures 17 and 18).
Chemical MixturesAs discussed earlier, the majority of sediments contain mixtures of chemicals. In thisreport, The ERM guidelines developed by Long et al. (1995) and the PEL guidelinesdeveloped by McDonald (1996) were used to calculate average ERM Quotients (ERMQ)and PEL Quotients (PELQ). These quotient values do not imply synergism, additivity, orantagonism between chemicals, but instead are used here to indicate the relative degree ofpollution due to chemical mixtures. In a recent evaluation of the average ERM and PELguideline values using chemistry and toxicological data collected throughout the coastalUnited States, Long et al. (1998) determined that when the average ERMQ exceeded1.00, the probability of significant amphipod toxicity occurring in these samples was71%. When the average PELQ exceeded 1.00, the probability of significant toxicityoccurring was 56%. In addition, these authors found that when samples contained 11 ormore ERM exceedances or 21 or more PEL exceedances, the percentage of significantlytoxic samples was 85% and 100%, respectively. As discussed earlier (p 66), for thepurposes of this report, stations are considered to have elevated chemistry if the ERMQ is>0.5, if there are more than 6 or more individual guideline exceedances, or if individualchemicals are considered to be elevated relative to the BPTCP database. In the BPTCPdatabase, when the ERMQ exceeded 0.5, the percentage of samples that weresignificantly toxic to amphipods was 62%. For mapping purposes, the ERMQ is dividedinto 4 categories: ERMQ<0.1; ERMQ >0.1<0.5; ERMQ >0.5<1.0; and ERMQ >1.0. Forthe following discussion, stations that had the greatest pollution by chemical mixtures arehighlighted. These are stations with ERMQ values >1.0. Although both ERMQs andPELQs are provided in the Appendix, data maps in this report emphasize chemicalconcentrations relative to the ERM values. This does not advocate one set of guidelinevalues over another, but was necessary to simplify data presentation.
Except for the Kaiser International Berth 49 station (Station No. 49004), the majority ofIndustrial Harbor stations which had ERMQ values greater than 1.00 were located in theConsolidated Slip area (Table 12; Figure 19 a-b, Figure 20a-b). The relatively highERMQ from the Consolidated Slip sample 47004 was driven to a large extent by totalchlordane which was 41 times the ERM value, and by Total PCBs. The high ERMQ atthe Kaiser International Berth 49 station was driven to a large extent by Low MolecularWeight PAHs which were 29 times the ERM for this chemical group. Two samples hadmore than 11 ERM exceedances, one was the Kaiser Int. Berth 49 station (49004), theother was a deep sediment sample (90-150 cm) from Consolidated Slip (47004; ERMQTable 12).

72
Toxicity Testing Data
Data Relative to Quality Assurance Criteria
All toxicity test data were evaluated for acceptability using the quality assuranceguidelines presented in the BPTCP Quality Assurance Project Plan (Stephenson et al.,1994). Most of the data reported here met test acceptability standards for each protocol. Deparatures from acceptability standards are summarized in Appendix E. Almost all ofthese were departures in water quality parameters such as dissolved oxygen and wereconsidered to be of minimal concern in terms of data quality. These are coded “–3” inAppendix E. Some of the samples tested with the amphipods Rhepoxynius abronius andEohaustorius estuarius also had deviations from the salinity criteria. In the case ofRhepoxynius, these were generally samples with final overlying water salinities that weregreater than 2‰ from the Granite Canyon seawater control salinity; this usually resultedin salinities of 32‰. In the case of Eohaustorius, the final salinities were 24‰, whichexceeded the salinity criteria for this protocol by more than 2‰. These salinities arewithin the tolerance range for these species and are listed in Appendix E. One samplefrom Port Hueneme (Station No. 44012, IDORG 612) had a final interstitial water salinityof 37‰. It is not clear whether this value is high enough to affect the test results. Resultsof the sea urchin fertilization and embryo development tests used to assess this sampleshould be considered with caution.
Several sediment-water interface samples tested with sea urchin development in Leg 48had low dissolved oxygen values at the end of the exposure (IDORGs 1700, 1703, 1704,1706-1708; Appendix E). It is not clear whether these values are low enough to affectdevelopment of sea urchin larvae. Results of these tests are coded “-5” and should beconsidered with caution.
Sea urchin fertilization tests were conducted on a number of pore water samples from theLos Angeles Region. Many of these samples were retested because of poor response inbrine controls. Bay et al. (1993) discussed commonly observed problems with using theStrongylocentrotus purpuratus fertilization test in samples requiring salinity adjustmentwith hypersaline brine; these include poor control response. Through numerous repeatedtests, we were able to achieve acceptable brine control results for all but one sample. However, an additional control treatment to account for the effects of frozen samplestorage in Teflon bottles was included in tests from later sampling legs. These additionalcontrols, which were not specified in the BPTCP QAPP, indicated that toxicity using thisprotocol may be associated with frozen sample storage in Teflon bottles. Because allsamples for the fertilization tests were stored frozen in Teflon bottles, we have noassurance that the data from any of these tests is truly indicative of sample toxicity. Anyobserved toxicity may be wholly or partially due to storage effects. For this reason, allsamples were retested with the sea urchin development test. The sea urchin developmenttest was unaffected by these storage artifacts, as indicated by response in frozen storagebottle controls. While sea urchin fertilization data are included in the appendix of thisreport, we do not have confidence in their validity because of possible false positives

73
related to sample storage, and these data were not used in the site characterizations orcomparisons with chemical concentrations.
The majority of the stations monitored during this project were tested with the amphipod10-d survival protocol using either Rhepoxynius abronius or Eohaustorius estuarius, orwith abalone development in pore water. The following section therefore emphasizes theresults of these toxicity test protocols. Because the other toxicity test protocols were notused consistently, the results from these tests are provided in the Appendices.
Twenty-eight percent (55/192) of the Industrial Harbor station sediments weresignificantly toxic to amphipods (Table 13). Amphipod survival in the outer Los Angelesand Long Beach Harbor stations was variable but generally higher than the Inner Harborstations (Figures 21 and 22). Inner Harbor samples that were consistently toxic toamphipods were in Consolidated Slip (47001 – 47010), Southwest Slip (40001), andSouthest Basin (40012). The majority of samples from Consolidated Slip were toxic toamphipods. Both surficial and deeper sediments at this site were toxic, although in manycases surface sediments were more toxic than deeper sediments (Table 13). Although thePalos Verdes offshore station (40031) had elevated concentrations of PCBs and DDTmetabolites, none of these samples were significantly toxic to amphipods in these acuteexposures.
Considerably more samples were significantly toxic to abalone larvae exposed tosediment pore water. In the Industrial Harbor stations, 79% (61/77) of the samples weretoxic to abalone embryo-larval development (Table 14). Many of these samples hadunionized ammonia concentrations above the effect threshold for this protocol (AppendixE). In situations where pore water unionized ammonia concentrations were greater than0.06 mg/L, it is useful to assess toxicity at lower pore water concentrations. In thesecases, if toxicity persists in 50 and 25% pore water but ammonia and hydrogen sulfideconcentrations are less than the effect threshold, then the toxicity in these samples may beascribed to other chemical constituents or factors. It should be noted that even insituations where the ammonia threshold is exceeded, other chemicals may be responsiblefor toxicity. In these situations, TIEs are useful for resolving the confounding effects ofammonia.
Statistical correlations between solid phase and pore water toxicity and bulk-phasechemical concentrations were examined using Spearman Rank Correlations. For theseanalyses the results of toxicity tests with the two amphipod species Rhepoxynius abroniusand Eohaustorius estuarius were combined. Correlations between sediment chemistryand amphipod survival in the Industrial Harbor stations indicated significant negativecorrelations with several metals (eg., arsenic, cadmium, copper, mercury, zinc; Table 15). There were also significant negative correlations between amphipod survival and totalchlordane (Figure 25), several PCB congeners, total PCBs, and a number of PAHcompounds. Amphipod survival was negatively correlated with sediment grain size andTOC. Chemicals often co-cary with TOC and grain size because both organic carbon andfine-grained sediments bind trace metal and organic chemical compounds. Without

74
additional studies, it is difficult to separate the effects of these sediment characteristicsfrom those of the chemicals bound to them.
Amphipod survival was also significantly correlated with the ERMQ and the TotalNumber of ERM Exceedances (Table 15; Figure 26). As discussed earlier, correlationsare not used to imply a causal relationship between chemistry and toxicity. Theseanalyses are useful, however, to develop hypotheses between chemicals of concern andobserved bioeffects. These may be addressed through TIE and other toxicologicalinvestigations.
Toxicity to abalone embryos exposed to sediment pore water was negatively correlatedwith tin, total chlordane, two PCB congeners, the ERMQ, and the total number of ERMExceedances (Table 16; Figure 27).
Benthic Community Analysis
Data Relative to Quality Assurance Criteria
All benthic community analyses followed the quality control procedures described in theMethods section of this report and in the BPTCP QAPP (Stephenson et al., 1994). Allresulting data met the quality assurance criteria described in Stephenson et al. (1994).
As discussed earlier, characterizations of benthic community structure were consolidatedinto a single Relative Benthic Index (RBI) value for each sample. The RBI is a singlenumber that incorporates measures of the Total Number of Fauna, Total Number ofCrustacean Species and Individuals, and the relative numbers of Positive and NegativeIndicator Species. Thresholds for degraded, transitional, and undegraded benthos wereestablished based on the best professional judgement of the benthic ecologists whoperformed the analyses. While this was necessary for categorization purposes, it shouldbe noted that the thresholds are somewhat arbitrary. The threshold for degraded benthoswas set at a RBI value of 0.30. Samples having index values greater than 0.30 wereclassified as transitional, even though it is recognized that there is a large difference inbenthic community structure between those stations with a RBI of 0.31, and those with aRBI of 0.60. It should also be noted that a number of factors influence benthiccommunity structure, including salinity, temperature, sedimentation rates, and dissolvedoxygen levels. These need to be considered on a station-by-station basis when classifyingparticular sites. Other limitations on the benthic community data are discussed at the endof this report. As with the other toxicological data used in this report, the RBI valuesshould always be used in conjunction with chemical and toxicity test results in a weight-of evidence approach. More concern should be placed on stations with elevatedchemistry, high toxicity and lower RBI values, even if the RBI values are greater than thethreshold for degraded benthos.
Benthic community structure was assessed at 102 of the Industrial Harbor stations;approximately 13% of these stations had degraded benthos (RBI < 0.30). Outer harbor

75
samples having degraded benthos were in Lower Main Channel (40004), the CabrilloBeach Pier area (40010) and Long Beach Outer Harbor (44018; Figure 28a). In addition,one of the field replicates assessed off Palos Verdes (40031.2) had degraded benthos(Table 17; Figure 28c). Several of the samples with the lowest RBI values were inConsolidated Slip (Table 17; Figure 29b). Although the remaining samples fromConsolidated Slip where benthos were assessed were classified as transitional, many hadrelatively lower RBI values. None of the remaining inner harbor stations were classifiedas degraded, although the majority were considered to have transitional benthos (Figure29a). Samples from Inner Fish Harbor (40019), outer Queensway Bay (40014), and WestBasin Entrance (40009) had relatively low RBI values but were classified as transitional(Table 17; Figure 29).
Benthic community structure, as represented by the relative RBI, was negativelycorrelated with a number of chemicals measured in Industrial Harbor sediments. Spearman Rank Correlations indicated significant negative correlations between the RBIvalues and several metals (eg., arsenic, cadmium, copper and zinc; Table 18). Inaddition, there were significant negative correlations between the RBI and a number ofpesticides, particularly total chlordane, several PAH compounds and PCB congeners, andsediment TOC. There were also significant negative correlations between the RBI andthe ERM Quotient and number of ERM exceedances in the Industrial harbor samples(Table 18; Figure 30).
Principal Components Analyses (PCA) were conducted to investigate co-variancebetween measured chemicals in the Industrial Harbor sediment samples, toxicity testresults, and benthic community structure metrics. The PCA were conducted on twosubsets of the data: first by analyzing all of the data with the abalone toxicity test dataexcluded, then with the abalone data included. Results of the first PCA with the abalonedata confirmed the results of the previous Spearman Rank Correlations by showing thatamphipod survival in the toxicity tests and the Relative Benthic Index were bothnegatively correlated with a number of chemicals (Table 19a; note: variables withopposite signs in Table 19 are negatively correlated). In addition, the PCA showed asignificant positive correlation between higher amphipod survival and a higher RelativeBenthic Index. These results were further investigated with Spearman Rank Correlationscomparing amphipod survival in toxicity tests with benthic community metrics. Theseanalyses showed significant positive correlations between amphipod survival in thetoxicity tests, the total number of crustacean species measured in samples from thesestations, and the total number of species measured in these stations (Table 20).
Results of the second PCA that included sediment chemistry, abalone toxicity test data,and benthic community data indicated that development of abalone embryos in sedimentpore water was negatively correlated with a number of solid phase chemicals, includingpore water unionized ammonia, two metals, a number of pesticides, Total PCBs, and theERM Quotient (Table 19b). In addition, the PCA showed significant positive correlationsbetween abalone development in toxicity tests, the mean number of mollusc individualspecies and individuals, and the total number of species measured at the Industrial Harbor

76
stations. Spearman Rank Correlations confirmed that abalone development waspositively correlated with a number of benthic community metrics (Table 20).
These results imply that the laboratory toxicity tests were indicative of benthic impacts atIndustrial Harbor stations. Increased survival of amphipods was correlated with a greaternumber of crustacean species at these stations, and increased abalone development wascorrelated with greater numbers of mollusc species. The results of the laboratory toxicitytests should not be considered to be predictive of ecological change on a station-by-station basis because these are acute toxicity tests and may not reflect chronic impacts atindividual stations. In addition, as discussed earlier, benthic community structure isinfluenced by environmental factors unrelated to chemical pollution. However, whenused in conjunction with chemical analyses and measurements of benthic communitystructure, they suggest that observed ecological degradation may be associated withsediment pollution detected by chemical analyses and laboratory toxicity tests.
Bioaccumulation Analysis
Because of elevated concentrations of DDT and PCBs in fish collected from selectedstations in the Los Angeles and Long Beach Harbor area, a health advisory againstconsumption of edible non-migratory organisms was issued for the Cabrillo Beach Pierarea of outer Los Angeles Harbor (OEHHA, 1991). To determine whether fish from thisarea continue to accumulate high concentrations of these and other compounds, twospecies of fish (Genyonemus lineatus, Phanerodon furcatus) collected from the outerharbor area were analyzed for metals and organic chemical compounds using the methodsdescribed above. Fish tissue concentrations were compared to US EPA screening valuesand National Academy of Science (NAS) guideline values. A quotient value wascalculated for selected chemicals of concern by dividing the measured tissueconcentration by the US EPA screening value (note: this should not be confused with theERM and PEL quotient values discussed earlier). This quotient value indicates themagnitude of the screening value exceedance.
In order to determine whether chemicals in sediment at these stations were bioavailable toinfaunal organisms, a 28-d bioaccumulation test was conducted with the clam Macomanasuta using the methods described above. Three laboratory replicates from each stationwere compared to replicates of control sediment, in this case the Yaquina Bay homesediment used in the amphipod tests. Concentrations of chemicals in the clam tissueswere compared using t-tests. Chemical concentrations in the clams were also comparedto those in the fish to determine whether there appeared to be any qualitative trendsbetween bioaccumulation in bivalves exposed to sediment in the laboratory and fieldcollected fish from the same stations. Concentrations of chemicals in the sediments werealso measured in conjunction with these experiments.

77
Fish Tissues
Results indicate that concentrations of DDT and PCBs in fish tissues continue to beelevated at Cabrillo Beach and the Long Beach Outer Harbor (Table 21a). Total DDTand Total PCBs in white croaker exceeded EPA screening values at all stations analyzed.Concentrations of these compounds were highest in fish collected from the CabrilloBeach Pier Central station (Station No. 49002); Total DDT (TTL DDT) and Total PCBs(TTL PCBs) at this station were 16 times and 68 times the EPA screening values,respectively. The high TTL DDT concentrations in these fish were dominated by higherproportions of P’P’ DDE, and to a lesser extent P’P’ DDD (Appendix C).
Concentrations in white surfperch were considerably lower in all samples. This could bedue to several factors including differences in the lipid concentrations in the fish. Themean percent lipid concentrations in white croaker and white surfperch were 13.7% and11.9%, respectively. While this may have influenced uptake of these highly lipophiliccompounds, the proportionately large differences in concentrations of TTL DDT and TTLPCBs between species suggests this is not the only explanation. Differences in feedingbehavior, metabolic rates for biotransformation, and proximity to the sediments may alsohave played a role in tissue bioaccumulation in these species. Only concentrations ofPCBs exceeded the EPA screening value in white surfperch tissues.
Macoma Tissues
As with the fish tissue analyses, results of the Macoma laboratory bioaccumulationexperiments indicated that Total DDT and PCB concentrations were elevated in bivalvesexposed to sediments from these stations (Station No.s 40009, 49002, 49003; Table 21b). Concentrations of Total DDT were significantly higher in clams exposed to West Basinand all Cabrillo Beach Pier sediments when compared to control clams exposed toYaquina Bay home sediment (t-tests; p < 0.05). Concentrations of TTL DDT wereelevated in clams exposed to West Basin Entrance sediments (Station No. 40009); thesewere approximately 4 times the concentrations measured in the control clams. The trendsin TTL DDT and TTL PCBs in the Macoma experiments were similar to those observedin the fish tissue analyzed from these stations. Cabrillo Beach Pier Central (Station No.49002) had the highest concentration of TTL DDT in fish tissue, and the highestconcentration in Macoma exposed to sediment from this station.
TTL PCB concentrations in Macoma were also statistically higher in these sediments,particularly in those from West Basin sediments (Table 21b). The West Basin Entranceclams also accumulated several PAH compounds (Appendix C). Although TTL PCBs inthe clams exposed to Cabrillo Beach Pier Central station sediments were elevated, theywere not significantly different than controls because of higher between-replicatevariability.
Sediments collected synoptically from the Cabrillo Beach Pier stations had measurableconcentrations of DDT and PCBs, but the levels did not exceed the sediment effect value

78
reported by Swartz et al. (1994) values for these compounds (Appendix C). While it isdifficult to determine the relationship between fish tissue and sediment concentrations ofDDT and PCBs at these stations, the bioaccumulation experiments demonstrate thatsediment-bound DDT and PCBs are bioavailable to infaunal species, and that laboratoryexposed animals may accumulate PCBs to levels exceeding EPA screening levels. Previous exposures of Macoma nasuta to sediments contaminated with DDT havedemonstrated that 28 days is probably not sufficient for DDT to accumulate toequilibrium levels (Lee et al., 1994). These authors suggest that at least 42 days isnecessary to reach steady state. Therefore, the concentrations of DDT measured in clamsin these experiments were probably lower than steady-state. It is likely that residentinfauna from these stations have higher concentrations of these compounds. This isparticularly true for species that ingest sediment. Infaunal prey species are a likely sourceof these compounds to resident fish. It should be recognized that these fish species aremobile and forage over relatively large areas. Therefore, it is impossible to ascribeconcentrations of DDT and PCBs in sediments at these stations to those in fish collectedin the vicinity. Future studies should assess concentrations of these compounds in likelyprey species (eg., infaunal crustacean species), and measure these chemicals in non-migratory fish species. This information, combined with laboratory experiments designedto investigate DDT and PCBs in sediments with food web relationships would clarify thelink between sediment concentrations and fish tissue levels.
Industrial Harbor Station Categorization
As discussed earlier, all Industrial Harbor stations were categorized based on a weight-of-evidence approach. Using various combinations of chemical analyses, toxicity tests,benthic community characterizations, and in some cases bioaccumulation studies, stationswere placed in one of 9 categories. Categorization is intended as an aid to furtherdecision making by Regional Board staff regarding site dispositions.
In this study, stations are grouped by station number for categorization purposes. In somecases, stations were visited several times and various chemical and toxicologicalmeasures were made on different occasions. For clarity, the following stationcategorizations group individual stations based on a worst-case basis. Therefore, if aparticular station had elevated chemistry and biological impacts on one sampling date butnot on another, the station was categorized based on the worst-case characteristics. Theadditional information from preceding or subsequent sampling at that station wereincluded in the same category for comparison, even though these data might not meet thecriteria for that category. It is assumed that reviewers will take this apparent temporal orspatial variability into consideration in the decision making process.
All Industrial Harbor stations are categorized in Table 22. The structure for this table issimilar to that of the Marina and Lagoon station categorization tables presented later. This table presents a synthesis of relevant weight-of-evidence information including:Station Number and Name, Sample (IDORG) Number, the ERM Quotient value, selectedchemicals exceeding the ERM values and the magnitude of the ERM Exceedance, TOC

79
and Grain Size, all relevant toxicity test results, and the Relative Benthic Index value. Inaddition, Table 22 includes bioaccumulation results for stations where this was measured.
Station No. 40006.1 in Consolidated Slip met all of the criteria for Category 1. Surfacesamples from this station contained a number of chemicals exceeding sediment qualityguideline values or were elevated relative to the BPTCP database. Significant toxicity toamphipods was measured in 3 of 4 field replicates, and benthic community structure wasdegraded in the one sample in which it was quantified. Several other stations in theConsolidated Slip area met the criteria for Category 2 (Station No.s 47002, 47003, 47009and 47010). These were samples where toxicity was detected on the only occasion it wasmeasured. The Category 2 chemistry data presented in Table 22 is for Consolidated Slipsurface samples only; in many cases deeper samples measured at selected stations at thissite were more contaminated than surface samples (Appendix C). The remaining stationsfrom Consolidated Slip met the criteria for Category 6. These were stations that hadelevated chemistry and were usually toxic to amphipods. Many of these stations did notexceed the threshold for classification as degraded benthos, even though most hadrelatively lower Relative Benthic Index values.
Because Consolidated Slip was identified by the Los Angeles Regional Board as a site ofconcern, the vertical and horizontal extent of chemical pollution and toxicity wasestimated by a separate study where both were measured at various depths, and along agradient extending west from the Dominguez Channel. The results indicated thatsignificant pollution was measured at most stations in Consolidated Slip and that in somecases deeper samples were more polluted than surface samples (Table 12; Figure 20b). The majority of these samples were significantly toxic to amphipods; toxicity wassometimes greater in the surface samples (Table 13; Figure 22b). In addition, several ofthese stations had degraded benthos, and the rest were categorized as having transitionalbenthos. The aerial extent of chemical pollution and toxicity was estimated for the site byconsidering the stations with elevated chemistry and toxicity and estimating the surfacearea covered by these stations. Surface area was estimated using the MapInfo GPSmapping program. This assumed that toxicity and chemistry was consistent between thestations and to the edge of the channel. The area significantly polluted and toxic wasestimated to be 0.080 square miles. Although it is recognized that this is a preliminaryestimate and that more sampling would be required to account for spatial heterogeneity,most of this site appears to be polluted and toxic to at least 90cm depth. The few sampleswhere deeper samples were analyzed indicate that chemical pollution extends deeper atthis site.
A majority of the Industrial Harbor stations met criteria for either Categories 5 or 6(Table 22). Some stations at Cabrillo Beach Pier exhibited elevated tissue concentrationsin field-collected fish and laboratory exposed bivalves, and were placed in Category 3(Table 22). Based on sediment chemistry, toxicity test results, and benthic communitystructure, these stations also met the Category 6 criteria.

80
One station off shore of Palos Verdes (40031.2) had high concentrations of p’p DDE, andelevated concentrations of Total DDT and PCBs relative to sediment quality guidelines,although the ERM quotient value at this station was lower than the threshold necessary tocategorize a site as having elevated chemistry (ie., ERMQ = 0.5). This station also haddegraded benthic community structure at two of the three sub-field replicates monitored. However, amphipod survival at this station was generally high. It is possible that thisanalysis is limited by the use of a relatively short-term toxicity test. Swartz et al. (1985,1986) suggest that the absence of acute toxicity does not demonstrate the absence ofbenthic degradation. Because the other Sediment Quality Triad elements suggest thatchronic effects may be associated with elevated concentrations of DDT and PCBcompounds, this is a situation where further investigation using a chronic toxicity test(incorporating measures of amphipod growth, survival and fecundity) is warranted.
Some Industrial Harbor stations were categorized as potential reference stations(Category 9; Table 22). These were located in Fish Harbor (40015.3), East Basin(40008.1), Terminal Island (40016.1), and the Turning Basin (48010.0). Although mostof these stations had relatively low chemical concentrations, all but one had at least oneexceedance of a guideline value. In addition, although benthic community structure wasnot degraded or transitional at these stations, the Relative Benthic Index values weresomewhat low at several of these stations. One goal of this study was to use referencesite data to assess biological impacts at polluted stations. There were not a sufficientnumber of reference sites identified in this study to allow for calculation of referenceenvelope tolerance limits. Hunt et al. (1998) suggested that a minimum of 20 referencesamples was necessary to provide statistical confidence in calculation of referenceenvelope tolerance limits. To identify more reference sites additional monitoring wouldbe required. By definition, reference sites require low chemical concentrations andundegraded benthic community structure (SWRCB, 1997). Several of the stations listedunder Category 8 (Table 22) had low chemical concentrations but benthic structure wasnot characterized. Because these stations had high amphipod survival as well, they mayserve as appropriate reference sites for future monitoring studies. Undegraded benthiccommunity structure at these sites will need to be verified before they can be used for thispurpose.
Marinas
Chemistry Data
Primary Chemicals of Concern
A summary of chemicals at the Marina stations that exceeded the sediment qualityguideline values is presented in Figure 31. Although the chemicals most often exceedingsediment quality guideline values were similar at the Industrial Harbor and Marinastations, the relative proportion of chemicals exceeding guidelines differed between thetwo waterbody types. The relative proportion of stations with metal concentrations abovethe ERM guidelines was greater in the Marina stations (Figures 32-37). Copper, mercury

81
and zinc exceedances of ERM values were all found in Marina Del Rey (Station No.s44014, 48001, 48002, 48003, and 48006; Figure 33b and 36b).
In addition to the metals discussed above, tributyltin (TBT) concentrations in sedimentfrom one station in Marina Del Rey (44014) were greater than the 90th percentilethreshold for the statewide BPTCP database. Selenium concentrations in Marina Del Rey(44014) and Shoreline Marina (48007) also exceeded the 90th percentile threshold fromthe statewide BPTCP database.
While elevated pesticide concentrations were not widely detected in most Marinastations, a relative high proportion of Marina stations exceeded the ERM values for totalchlordane. Total chlordane concentrations above the ERM value were measured at theentrance of Alamitos Bay (40022, and 40023), at two stations in Shoreline Marina (44020and 48008), and throughout Marina Del Rey (44014, and Stations 48001 through 48006;Figures 38-39).
A majority of the Marina Station samples exceeded the ERL value for total PCBs and alarge proportion of sediments had concentrations above the ERM for total PCBs. Stationsamples with the highest PCB concentrations were in Shoreline Marina (44020, 48006;Figure 41a-b), Marina Del Rey (44014, 48003, 48005), and King Harbor (48011; Figure42 a-b). While elevated concentrations of PAHs were found at many Industrial Harborstations, few samples in the Marinas had concentrations of these chemicals above theguideline values.
A number of samples from Marina Del Rey (48001 – 48005, and 44014) had elevatedchemistry relative to ERM Quotient values or the number of guideline exceedances(Table 23, Figures 44-46). Two samples from Shoreline Marina (44020 and 48006) hadelevated chemistry based on ERMQ values.
Toxicity Testing Data
Of the 35 Marina samples tested with the amphipod 10-d survival protocol, 31% weresignificantly toxic (Table 24). As with the Industrial Harbor stations, toxicity was greaterin inner station sediments. This was particularly evident in Los Alamitos Bay (Figure47b), and Marina Del Rey (Figure 48b). Additional toxicity tests were used occasionallyto provide additional information for assessing Marina sediment toxicity. Results ofthese tests are presented in Appendix E.
In contrast to the Industrial Harbor toxicity data where amphipod survival was negativelycorrelated with metals, pesticides, PAHs and PCBs, Spearman Rank Correlationsindicated that in the Marina stations, amphipod survival was negatively correlatedprimarily with metals (eg., arsenic, copper, lead, mercury, and zinc), tributlytin, and thenumber of ERM exceedances at these stations (Table 25; Figure 50). In addition,amphipod survival at the Marina stations was negatively correlated with percent clay inthe sediment. Toxicity of some of the Marina samples was also assessed by exposing sea

82
urchin embryos to intact sediment cores at the sediment-water interface (Appendix E). Seventeen percent (2/12) of these samples were significantly toxic. Spearman Rankcorrelations were used to examine associations between chemistry and embryo-larvaldevelopment for those samples analyzed for chemistry. The results indicate that seaurchin development was negatively correlated with several chemicals in the Marinasamples including three pesticides, a number of PCB congeners, as well as unionizedammonia and hydrogen sulfide in the samples (Table 26).
Benthic Community Analysis
Only 1 of the 22 Marina stations was classified as having degraded benthic communitystructure (Table 27); this station was in Shoreline Marina (Station No. 48007; Figure51a). A number of stations in Shoreline Marina (48006, 48020; Figure 51a) and MarinaDel Rey (44014, 48003; Figure 52b) were classified as transitional but had relatively lowRBI values. Stations closer to the mouth of Marina Del Rey had undegraded benthos. Limitations on benthic community analyses are discussed at the end of this report. Benthic community structure (ie., the RBI) at the Marina stations was negativelycorrelated with a number of metals (eg., antimony, chromium, copper, lead, mercury,silver, and zinc), several pesticides (chlordanes, DDT metabolites, and dieldrin), andseveral PCBs. The RBI was also negatively correlated with the ERM Quotient, thenumber of ERM exceedances in the samples (Table 28), and with sediment grain size andTOC.
Marina Station Categorization
The majority of Marina stations met the criteria for Categories 5 and 6 (Table 29). Significant chemical pollution and toxicity to amphipods was measured at several stationsin Marina del Rey. The Relative Benthic Index at those Marina Del Rey stations wherebenthics were analyzed (48001.0-48003.) indicated transitional benthic communitystructure, although the RBI values at these stations were relatively low (Table 29).
Shoreline Marina (Station No. 44020.0) had elevated chemistry in all samples assessed,and recurrent toxicity to amphipods (toxic in 3 of 5 samples). Benthic communitystructure was not analyzed at this station. The one station in Shoreline Marina wherebenthic community structure was characterized indicated degraded benthos (48007; Table29), although this sample was not toxic and only Nickel was elevated relative to theguideline values.
Few Marina stations were categorized as potential reference stations (Category 9; Table29). These were located in Alamitos Bay. Although most of these stations had relativelylow chemical concentrations, two had elevated concentrations of Chlordane. In addition,benthic community structure was not measured at these stations. Because designation asa reference site for the BPTCP requires undegraded benthic community structure coupledwith low chemistry (Hunt et al., 1998), benthic community structure at these stationswould have to be measured prior to their designation as reference sites. One station in

83
Channel Islands Harbor (48012) was placed in Category 6 due to low amphipod survival.Because this station had relatively undegraded benthos and few chemicals at elevatedconcentrations it might also serve as a potential reference site.
Lagoons
Chemistry Data
Primary Chemicals of Concern
A summary of chemicals at the Lagoon stations that exceeded the sediment qualityguideline values is presented in Figure 54. The list of the primary chemicals of concernat the Lagoon stations was similar to those found in the Marina and Industrial Harborstations, but the relative proportions of the various chemical compounds was different inthe Lagoon sediment samples, reflecting the different pollutant inputs to thesewaterbodys.
Unlike the Marina and Industrial Harbor stations, few metals exceeded the ERMguideline values. Exceedances of the ERM for zinc were found in samples from BallonaCreek and one sample from Colorado Lagoon (Figures 55 and 56). In addition, theselenium concentration at one sample in Mugu Lagoon (48017) exceeded the 90th
percentile threshold derived from the statewide BPTCP database.
There was a greater relative proportion of Lagoon samples having ERM exceedances ofpesticides than were found in the Industrial Harbor or Marina stations. Stations withERM exceedances for total chlordane were found in Colorado Lagoon (Station No. 44017was greater than 21x the ERM for total chlordane), and Ballona Creek (44024 was 18xthe ERM for total chlordane). Total chlordane in McGrath Lake sediments weremeasured from 25 to 39x the ERM value. High chlordane concentrations were alsomeasured in several Mugu Lagoon samples (Figure 57 and 58). Relative to the ERMguidelines, elevated concentrations of several pesticides were found in McGrath Lakesediments including total DDT, and Dieldrin (Station No. 44027; Figure 60). HighDieldrin concentrations were also found in Ballona Creek (44024) and Colorado Lagoon(44017). Sediments from some of these sites also contained elevated concentrations oftotal PCBs (Figures 61-62).
In addition to pesticides for which sediment quality guideline values have been derived,several stations had elevated concentrations of pesticides for which no guideline valuesexist. Toxaphene and endosulfan concentrations were elevated in McGrath Lake(44027); toxaphene was greater than the 90th percentile threshold derived from thestatewide BPTCP database, and the endosulfan concentration in McGrath Lake sedimentwas 3 times the 95th percentile threshold. This was the second highest endosulfanconcentration measured in sediments as part of the Bay Protection Program. In additionto these pesticides, elevated chlorpyrifos concentrations were found in Ballona Creek

84
(44024; 2x the 95th percentile threshold of the BPTCP database) and Mugu Lagoon(48015; > the 90th percentile threshold of the BPTCP database).
One sample from McGrath Lake (44027) had the second highest average ERM Quotientvalue measured in the Los Angeles region (Table 30; Figures 63-64). This was due toelevated concentrations of a number of pesticides. Total chlordane in sediment from thisstation was 39 times the ERM value, total DDT was 3 times the effect concentrationreported by Swartz et al. (1994), and Dieldrin was 3 times the ERM value. Sedimentchemistry at this station was measured twice, once in January 1993 (IDORG = 627), thenagain in June 1996 (IDORG = 1628). Concentrations of these pesticides increased insediment at this station between the first and second sampling (Table 30). The ERMQ inone sample from Colorado Lagoon (44017) had an ERMQ of 2.27 (Table 30). This wasdue to elevated concentrations of total chlordane (21 x the ERM value), and Dieldrin (3xthe ERM value). In addition to these stations, several samples from Ballona Creek(Station number 44024), had an ERMQ greater than 1.00. The relatively high ERMQfrom Ballona Creek was primarily due to elevated total chlordane (18x the ERM value),Dieldrin (3x the ERM value), and total PCBs (2x the ERM value).
Toxicity Testing Data
Fifty-eight percent (19/33) of Lagoon station sediments were significantly toxic toamphipods. This was a greater proportion of toxic samples than was found in theIndustrial Harbor and Marina station sediments (Table 31). A majority of the stationsmonitored in Mugu Lagoon (Figure 65), and all of the stations in Ballona Creek weretoxic to amphipods (Figure 66b). Stations in McGrath Lake that were toxic to theamphipod Rhepoxynius abronius were not toxic to Eohaustorius abronius when tested ata later date (Table 31; Figure 66a). None of the sediments from the Ventura or SantaClara River Estuaries, or from Malibu Lagoon were significantly toxic to amphipods orany of the other protocols used (Figure 67; Appendix E).
Spearman Rank correlations indicated that amphipod survival in the Lagoon samples wasweakly correlated with several metals (eg., antimony, copper, mercury, silver, zinc, andtin) and a number of PCB congeners (Table 32). There were more significant negativecorrelations with pesticides measured in the Lagoon stations, particularly total chlordaneand dieldrin (Figure 68). There were also significant negative correlations with a numberof PAHs, the ERM Quotient and the number of ERM exceedances calculated for thesestations (Table 32; Figure 69).
Benthic Community Analysis
The only Lagoon stations where benthic community structure was analyzed were in MuguLagoon (48013.0-48018.0), all of these were classified as degraded (Table 33; Figure 70). Two of the stations in Mugu Lagoon had essentially no benthic infaunal organisms
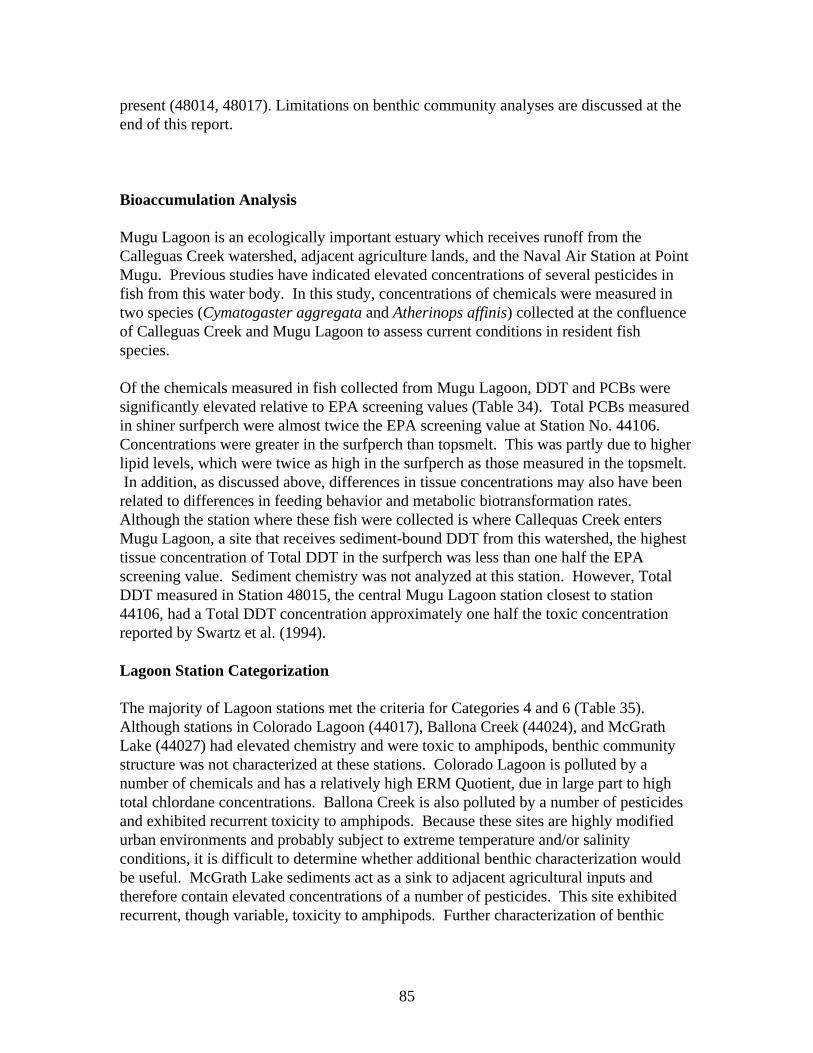
85
present (48014, 48017). Limitations on benthic community analyses are discussed at theend of this report.
Bioaccumulation Analysis
Mugu Lagoon is an ecologically important estuary which receives runoff from theCalleguas Creek watershed, adjacent agriculture lands, and the Naval Air Station at PointMugu. Previous studies have indicated elevated concentrations of several pesticides infish from this water body. In this study, concentrations of chemicals were measured intwo species (Cymatogaster aggregata and Atherinops affinis) collected at the confluenceof Calleguas Creek and Mugu Lagoon to assess current conditions in resident fishspecies.
Of the chemicals measured in fish collected from Mugu Lagoon, DDT and PCBs weresignificantly elevated relative to EPA screening values (Table 34). Total PCBs measuredin shiner surfperch were almost twice the EPA screening value at Station No. 44106. Concentrations were greater in the surfperch than topsmelt. This was partly due to higherlipid levels, which were twice as high in the surfperch as those measured in the topsmelt. In addition, as discussed above, differences in tissue concentrations may also have beenrelated to differences in feeding behavior and metabolic biotransformation rates. Although the station where these fish were collected is where Callequas Creek entersMugu Lagoon, a site that receives sediment-bound DDT from this watershed, the highesttissue concentration of Total DDT in the surfperch was less than one half the EPAscreening value. Sediment chemistry was not analyzed at this station. However, TotalDDT measured in Station 48015, the central Mugu Lagoon station closest to station44106, had a Total DDT concentration approximately one half the toxic concentrationreported by Swartz et al. (1994).
Lagoon Station Categorization
The majority of Lagoon stations met the criteria for Categories 4 and 6 (Table 35). Although stations in Colorado Lagoon (44017), Ballona Creek (44024), and McGrathLake (44027) had elevated chemistry and were toxic to amphipods, benthic communitystructure was not characterized at these stations. Colorado Lagoon is polluted by anumber of chemicals and has a relatively high ERM Quotient, due in large part to hightotal chlordane concentrations. Ballona Creek is also polluted by a number of pesticidesand exhibited recurrent toxicity to amphipods. Because these sites are highly modifiedurban environments and probably subject to extreme temperature and/or salinityconditions, it is difficult to determine whether additional benthic characterization wouldbe useful. McGrath Lake sediments act as a sink to adjacent agricultural inputs andtherefore contain elevated concentrations of a number of pesticides. This site exhibitedrecurrent, though variable, toxicity to amphipods. Further characterization of benthic

86
community structure at this site would be useful to determine whether ecological impactsare associated with chemical contaminants.
Stations in Mugu Lagoon all met the criteria for Category 6. Chemical and biologicalresults at these sites were variable. Although individual pesticides sometimes exceededguideline values, the ERM quotients at these stations were generally low (Table 35). Amphipod survival was lowest at the Mugu Lagoon Entrance (44054), Mugu/OxnardDitch (44053), and Central Mugu Lagoon (48015), though survival throughout theLagoon was variable. Benthic community structure was significantly degraded at allstations where it was characterized. In addition, concentrations of PCBs were elevated infish caught at the confluence of Calleguas Creek and Mugu Lagoon (44016). Asdiscussed above relative to results at the Palos Verdes stations, this analysis may belimited by the use of relatively acute toxicity test protocols. Analysis of Mugu Lagoonstations with a chronic toxicity test assessing amphipod survival, growth, and fecunditycould help confirm whether the observed benthic community degradation at this site isassociated with pollution.
STUDY LIMITATIONS
As discussed previously, this data set was limited by lack of information useful forevaluating the bioavailability of sediment-associated chemicals. There were limitedmeasurements of interstitial water chemical concentrations, and sediment Acid-VolatileSulfides or Simultaneously Extracted Metals (AVS-SEM). The lack of in situ measuresof dissolved oxygen concentrations limited conclusions regarding effects of anoxia onbenthic community structure. Additional unmeasured factors that may have influencedbenthic community structure included seasonal variations in salinity, temperature,freshwater flow, and sedimentation rates. These factors need to be considered byresource managers when considering the effects of chemical pollutants on ecologicalmetrics. In addition, the toxicity tests used in these surveys were generally short-termacute toxicity tests. In situations where stations were dominated by high concentrationsof chemicals considered to exhibit chronic toxicity, conclusions based on acute toxicitytests should be treated cautiously.
Because of these limitations, characterization of the most impacted stations must rely, toa certain extent, on a qualitative interpretation of the data. To accomplish this, individualstations were evaluated based on a Triad of measures (sensu Chapman et al., 1987):chemical pollution, benthic community structure, and toxicity to various species.
Stations were categorized based on this information, and the completeness of samplecharacterization. In order to categorize stations, it was necessary to define terms such as"elevated chemistry" or "sample toxicity" for a large number of samples. To beconsistent, thresholds were established for this purpose, and these are described above. The chemistry, toxicity, and benthic community threshold values were derived to allow aconsistent interpretation of data from samples throughout the Region and state. It isimportant to note that while these threshold values were selected based on the best
87
available information and best professional judgement of the authors, they are by naturearbitrary. Chemical bioavailability varies from sample to sample, and the exactdefinitions of toxicity and benthic degradation depend on factors not easily analyzed in alarge number of samples. Further data collection and analysis may result in thedetermination of different threshold values and different definitions for biologicalimpacts. The thresholds and station characterizations used here are not intended to beabsolute. They are intended to aid in the screening of data collected from a large numberof locations, in order to support management decisions. In some cases additional studiesmay be undertaken to further evaluate the sites of concern identified in this Region-wideassessment. As more data become available through additional studies, more accuratesite-specific characterizations of sediment quality may result.
It should also be noted that this research provides limited information on spatial extent ortemporal variability of chemical pollution and ecotoxicological effect at these sites. These topics should be emphasized in future investigations.
CONCLUSIONS
1. Through a cooperative agreement this study achieved the combined programobjectives of the State Water Resources Control Board’s Bay Protection and ToxicCleanup Program, and the National Oceanic and Atmospheric Administration’s Statusand Trends Program.
2. Using a weight-of-evidence approach based on the Sediment Quality Triad, measuresof chemical pollution, toxicity, benthic community structure, and bioaccumulation werecompleted at Industrial Harbor, Marina, and Lagoon stations over a five year period todetermine relative degradation in selected water bodies in the Los Angeles Region. Whencombined with measures of other sediment characteristics such as grain size, TOC,unionized ammonia, and hydrogen sulfide, these measures were useful for determiningthe relative level of pollution and biological impacts at a wide range of stations.
3. Degree of chemical contamination was assessed using two sets of sediment qualityguidelines: the ERL/ERM guidelines developed by NOAA (Long et al., 1995), and theTEL/PEL guidelines developed for the State of Florida (MacDonald, 1996). In addition,non-guideline chemicals were compared to the BPTCP database to compare relativeconcentrations with those measured statewide. Copper, mercury, zinc, TBT, totalchlordane, total PCBs, and high molecular weight PAHs were found to be the chemicalsor chemical groups of greatest concern at the Industrial Harbor stations. Copper, lead,mercury, zinc, total chlordane, and total PCBs were found to be the chemicals orchemical groups of greatest concern at the Marina stations. PCBs, and a number ofpesticides, including chlordane, dieldrin, endosulfan, and DDT, were the chemicals ofgreatest concern in the Lagoon stations.
4. Of the 192 Industrial Harbor stations where toxicity was assessed, 29 % showedsignificant toxicity to amphipods. Toxicity was highest in the inner Industrial Harbor

88
sediment samples. Pore water samples demonstrated higher toxicity than sedimentsamples; 79% of the Industrial Harbor stations were toxic to abalone embryos exposed tosediment pore water. Of the 35 Marina stations tested for amphipod toxicity, sedimentsamples were toxic to amphipods at 31% of the stations. Of the 33 Lagoon stationsediment samples tested, 58% were significantly toxic.
5. Many of the chemicals that correlated with toxicity also exceeded sediment qualityguideline values. Amphipod survival in Industrial Harbor stations was negativelycorrelated with a number of chemicals or chemical groups, including copper, mercury,nickel, lead, zinc, chlordane, total PCBs, low and high molecular weight, and total PAHs,the ERM Quotient, and the number of ERM Exceedances in the samples. In additionamphipod survival in the Industrial Harbor samples was negatively correlated withsediment grain size and TOC. Because chemicals bind to TOC and fine-grainedsediments, it is not possible without further study to separate bioeffects due to thesebinding phases from those due to pollutants. Abalone development in Industrial Harborpore water samples was negatively correlated with tin, total chlordane, two PCBcongeners, the ERM Quotient value, and the number of ERM Exceedances in thesesamples. Amphipod survival in Marina sediments was negatively correlated primarilywith metals (As, Cu, Pb, Hg, Ni, and zinc), as well as TBT. Amphipod survival in thesesamples was also negatively correlated with the PEL Quotient, the number of ERMExceedances, and percent clay in the samples. Amphipod survival in Lagoon sedimentsamples was negatively correlated with metals (Cu, Hg, Ag, Zn), pesticides such aschlordane, DDT, and dieldrin, and a number of PCB congeners and PAH compounds. Inaddition, amphipod survival in Lagoons was negatively correlated with the ERMQuotient and the number of ERM Exceedances in these samples.
6. Of the 102 Industrial Harbor stations where benthic community structure wascharacterized, 13% were considered to be degraded. The Relative Benthic Index (RBI)was negatively correlated with a number of metals, pesticides, PCBs and PAHs. Inaddition, the RBI was negatively correlated with sediment TOC, the ERM Quotient, andthe number of ERM Exceedances. Multivariate and univariate correlations betweentoxicity test results and benthic community metrics indicated that amphipod survival intoxicity tests was positively correlated with the total number of crustacean individualsand species at these stations. Abalone development in toxicity tests was positivelycorrelated with the number of mollusc individual and species. Only one of 22 Marinasamples had significantly degraded benthic community structure (RBI < 0.30), althoughseveral stations had lower RBI values. Benthic community structure at the Marinastations was negatively correlated with metals, pesticides, PCBs, grain size, TOC, and theERM Quotient and number of ERM Exceedances. All 6 of the Lagoon samples assessedin Mugu Lagoon had degraded benthos.
7. Bioaccumulation measured in field collected fish and laboratory exposed bivalves(Macoma nasuta) indicated that field collected fish in the West Basin and Cabrillo BeachPier areas of Los Angeles Harbor contained DDT and PCB tissue concentrations thatexceeded EPA screening values. Bivalves exposed to sediments from the Cabrillo Beach

89
Pier area accumulated significantly higher concentrations of DDT and PCBs than clamsexposed to control sediment. Fish collected from one station in Mugu Lagoon also hadelevated levels of PCBs.
8.The results of these studies were consolidated into weight-of-evidence categorizationtables. Stations were grouped based on chemical and ecotoxicological results into 9possible categories that considered the magnitude of contamination by chemicals ofconcern, occurrence of toxicity using multiple toxicity test protocols, benthic communitydegradation, and in some cases, tissue bioaccumulation. Specific thresholds wereestablished for each measure, beyond which stations were considered to have elevatedchemistry, significant toxicity, degraded benthic community structure, or elevated tissueconcentrations.
Stations in the Consolidated Slip area were the Industrial Harbor stations that met all thecriteria for Category 1. Samples from these stations had elevated chemistry, recurrenttoxicity, and degraded benthic community structure. A majority of the Industrial Harborstations met the criteria for Categories 5 or 6. These were stations with either, elevatedchemistry and mixed results from biological measures (Cat. 5), or with measuredbiological impact but chemistry values below thresholds or not measured (Cat. 6).
The majority of Marina stations met the criteria for Categories 5 and 6. Some stations inMarina Del Rey had sediments with elevated chemistry; these stations were alsosignificantly toxic to amphipods. The RBI at some of these stations was relatively low,but did not exceed the threshold for significant benthic community degradation.
The majority of Lagoon stations also met the criteria for Categories 5 and 6. Stations inColorado Lagoon, Ballona Creek, and McGrath Lake had elevated chemistry and weresignificantly toxic to amphipods, but benthic community structure was not characterizedat these stations. Stations in Mugu Lagoon all met the criteria for Category 6. Individualpesticides exceeded some guideline values in Mugu Lagoon, and amphipod survival wasvariable. Benthic community structure was degraded at all of the 6 Mugu Lagoon stationsanalyzed.

90
REFERENCES
Abbott, R. 1974 (2nd ed.). American Seashells. New York: Van Nostrand Reinhold. 663 pp.
Allen, H.E., G. Fu, B. Deng. 1993. Analysis of acid volatile sulfide (AVS) andsimultaneously extracted metals (SEM) for the estimation of potential toxicity in aquaticsediments. Environ. Toxicol. Chem. 12: 1441-1453.
Abele, L.G. and K. Walters. 1979. Marine benthic diversity: a critique and alternateexplanation. Journal Biogeography 6: 115-126.
American Society for Testing and Materials. 1992. Standard guide for collection,storage, characterization, and manipulation of sediments for toxicological testing. GuideNo. E 1392-90. Vol. 11.04, 1139-1153. Philadelphia, PA.
American Society for Testing and Materials. 1993. Standard guide for conductingsediment toxicity tests with freshwater invertebrates. Guide No. E 1387-93. Vol. 11.04,1173-1199. Philadelphia, PA.
Anderson, B.S., J.W. Hunt, M.M. Hester and B.M. Phillips. 1996. Assessment ofsediment toxicity at the sediment-water interface. In: G.K. Ostrander (ed.) Techniques inAquatic Toxicology. Lewis Publishers, Ann Arbor, MI.
Anderson, B.S., J. Hunt, S. Tudor, J. Newman, R. Tjeerdema, R. Fairey, J. Oakden, C.Bretz, C.J. Wilson, F. LaCaro, G. Kapahi, M. Stephenson, M. Puckett, J. Anderson, K.R.Long, T. Fleming, K. Summers. 1997. Chemistry, toxicity and benthic communityconditions in sediments of selected southern California bays and estuaries. Final Report,California State Water Resources Control Board.
Baker, J.H. 1975. Distribution, ecology, and life histories of selected Cypridinacea(Myodocopida, Ostracoda) from the Southern California mainland shlef. PhD Thesis U.Houston.
Barnard, J. 1963. Relationship of benthic Amphipoda to invertebrate communities ofinshore sublittoral sands of southern California. Pacific Naturalist. 3: 437-467.
Bay, S., R. Burgess, and D. Greenstein. 1993. Status and applications in the Echinoid(Phylum Echinodermata) toxicity test methods. In: W.G. Landis, J.S. Hughes and M.A.Lewis, eds. Environmental Toxicology and Risk Assessment. ASTM, STP 1179, Philadelphia, PA.
Becker, D.S. and T.C. Ginn. 1995. Effects of storage time on toxicity of sediments fromPuget Sound, Washington. Environ. Toxicol. Chem. 14:829-835.

91
Bender, M., W. Martin, J. Hess, F. Sayles, L. Ball, and C. Lambert. 1987. A whole coresqueezer for interfacial pore water sampling. Limnology and Oceanography. 32(6):1214-1255.
Bousfield, E. 1970. Adaptive radiation in sand-burrowing crustaceans. ChesapeakeScience 11 (3): 143-154.
Bousfield, E. 1996. The amphipod family Oedicerotida on the Pacific Coast of NorthAmerica. Part 1. The Monoculodes and Synchelidium generic complexes: systematicsand distributional ecology.
Brinkhurst, R.O. and M.L. Simmons. 1968. The aquatic Oligochaeta of the SanFrancisco Bay system. California Fish and Game 54: 180-194.
Brinkhurst, R.O. and D.G. Cook. 1980. Aquatic oligochaete biology. Plenum Press,New York, 529p.
Burgess, R.M., K.A. Schweitzer, R.A. McKinney, and D.K. Phelps. 1993. Contaminatedmarine sediments: water column and interstitial toxic effects. Environ. Toxicol. Chem. 12: 127-138.
California Department of Fish and Game. 1990. Water Pollution Control LaboratoryStandard Operating Procedure for Determination of Arsenic in Biological Tissue,Sediment, and Water.
California Department of Fish and Game. 1990. Water Pollution Control LaboratoryStandard Operating Procedure for Determination of Selenium in Biological Tissue,Sediment, and Water.
California Environmnetal Resources Evaluation System (CERES). 1998. SouthernCalifornia Wetlands Inventory. Website address:http://ceres.ca.gov/wetlands/geo_info/so_cal.html
California State Mussel Watch Program. 1988. Ten Year Data Summary 1977-1987. Water Quality Monitoring Report No. 87-3. Division of Water Quality. State WaterResources Control Board.
California State Water Resources Control Board. 1997. Scientific Planning and ReviewCommittee: Recommendations on the Bay Protection and Toxic Cleanup ProgramMonitoring Activities. SWRCB, Sacramento, CA.
Carr, R.S., J. Williams and C.T. Fragata. 1989. Development and Evaluation of a NovelMarine Sediment Pore Water Toxicity Test with the Polychaete Dinophilus gyrociliatus. Environ. Toxicol. Chem. 8: 533-543.

92
Carr, R.S., and D.C. Chapman. 1992. Comparison of Solid-phase and Pore-waterApproaches for Assessing the Quality of Marine and Estuarine Sediments. Chem. Ecol. 7: 19-30.
Carr, R.S., and D.C. Chapman. 1995. Comparison of Methods for Conducting Marineand Estuarine Sediment Porewater Toxicity Tests - Extraction, Storage, and HandlingTechniques. Arch. Environ. Contam. Toxicol. 28: 69-77.
Chapman, P.M., R.N. Dexter, and E.R. Long. 1987. Synoptic measurements of sedimentcontamination, toxicity, and infaunal community composition (the Sediment qualityTriad) in San Francisco Bay. Marine Ecology Progress Series. 37: 75-96.
Connell, J.H. 1978. Diversity in tropical rain forests and coral reefs. Science 199: 1302-1310.
Cross, J.N., Hardy, J.T., Hose, J.E., Hershelman, G.P., Antrim, L.D., Gossett, R.W.,Crecelius, E.A. 1987. Contaminant concentrations and toxicity of sea-surface microlayernear Los Angeles, California. Mar. Environ. Res. 23: 307-323.
Davis, P.H. and R.B. Spies. 1980. Infaunal benthos of a natural petroleum seep: study ofcommunity structure. Marine Biology 59: 31-41.
Diaz, R.J. 1992. Ecosystem assessment using estuarine and marine benthic communitystructure. In: G.A. Burton (ed): Sediment Toxicity Assessment. Lewis Publishers, BocaRaton, FL. 67-85.
Dillon, T.M., D.W. Moore, and A.B. Gibson. 1993. Development of a chronic sublethalbioassay for evaluating contaminated sediment with the marine polychaete worm Nereis(Neanthes) arenaceodentata. Environ. Toxicol. Chem. 12: 589-605.
Dinnel, P.A., J.M. Link, and Q.J. Stober. 1987. Improved methodology for a sea urchinsperm cell bioassay for marine waters. Arch. Environ. Contam. Toxicol. 16: 23-32.
Evans, D. and P. Hanson. 1993. Analytical methods for trace elements in sediments byatomic absorption spectrophotometry. In Sampling and Analytical Methods of theNational Status and Trends Program National Benthic Surveillance and Mussel WatchProject 1984-1992, vol. 3. Lauenstein, G. and A. Cantillo (eds.). NOAA Tech. Mem.NOS ORCA 71. 53-81.
Fairey, R. 1992. Sampling and analysis of trace metals in sedimnet interstitial waters. American Geophysical Union. Fall Beeting, 042A-06.

93
Fairey, R., C. Bretz, S. Lamerdin, J. Hunt, B. Anderson, S. Tudor, C. Wilson, F. LaCaro,M. Stephenson, H. Puckett, E. Long. 1996. Chemistry, toxicity and benthic communityconditions in sediment of the San Diego Bay region. Final Report, California State WaterResources Control Board.
Fairey, R., Roberts, C., Jacobi, M., Lamerdin, S, Clark, R., Downing, J., Long, E., Hunt, J., Anderson, B, Newman, J., Stephenson, M., Wilson, C.J. In Press. Patterns of sediment toxicityand chemistry in the San Diego Bay region. Environ. Toxicol. and Chem.
Fenwick, G. 1984. Life history and popualtion biology of the giant ostracod Leuroleberiszealandica (Baird, 1850, Myodocopida). J. Exp. Mar. Biol. Ecol. 77(3): 255-390.
Folk, R. 1974. Petrology of Sedimentary Rocks. Hemphill Publ. Co., Austin, TX. 182pp.
Franson, M. A. (Ed). 1981. 505 Organic carbon (total) p. 471-475. In: Standard MethodsFor the Examination of Water and Wastewater. 15th ed. Am. Public Health Ass.
Froelich, P.M. 1980. Analysis of Organic Carbon in Marine Sediments. Limnology andOceanography. 25: 564-572.
Giesy, J.P. and R.A. Hoke. 1990. Freshwater Sediment Quality Criteria: ToxicityBioassessment. Pp. 265-348 in Sediments: Chemistry and Toxicity of In-Place Pollutants.R. Baudo, J. Giesy, and H. Muntau, eds. Lewis Publishers. Michigan.
Grassle, J.F. and J.P. Grassle. 1974. Opportunisitic life histories and genetic systems inmarine benthic polychaetes. Journal of Marine Research. 32(2): 253-283.
Grassle, J.P. and J.F. Grassle. 1976. Sibling species in the marine pollution indicatorCapitella (Polychaeta). Science 192: 567-569.
Hedges, J.I. and Stern J.H. 1983. Carbon and Nitrogen Determination of CarbonateContaining Solids. Limnology and Oceanography. 29: 658-663.
Hoke, R.A., G.T. Ankley, A.M. Cotter, T. Goldenstein, P.A. Kosian, G.L. Phipps, F.M.VanderMeiden. 1994. Evaluation of equilibrium partitioning theory for predicting acutetoxicity of field-collected sediments contaminated with DDE, DDE and DDD to theamphipod Hyalella azteca. Environ. Toxicol. Chem. 13: 157-166.
Hunt, J.W., Anderson, B.S., Tudor, S., Phillips, B.M., Newman, J., Stephenson, M.,Puckett, H.M., Fairey, R., Smith, R.W., and Taberski, K. 1998. Evaluation of sedimenttoxicity tests and reference sites in San Francisco Bay. Final Report. San FranciscoRegional Water Quality Control Board, Oakland, California.

94
Hurlbert, S.N. 1971. The non-concept of species diversity: a critique and alternateparameters. Ecology. 52: 577-586.
IRIS (Integrated Risk Information System). 1992. U.S. Environmental ProtectionAgency, Duluth, MN.
Jumars, P.A. 1975. Environmental grain and polychaete species diversity in a bathyalbenthic community. Marine Biology 30: 253-266.
Jumars, P.A. 1976. Deep-sea species diversity: does it have a characteristic scale? Journal of Marine Research. 34: 217-246.
Kennish, M.J. 1991. Ecology of Estuaries: Anthropogenic Effects. CRC Press, BocaRaton, FL 494 pp.
Khoo, K.H., C.H. Culberson, and R.G. Bates. 1977. Thermodynamics of dissociation ofammonium ion in seawater from 5° to 40°C. J. Solution Chem. 6: 281-290.
Klaus, A.D., J.S. Oliver and R.G. Kvitek. 1990. The effects of gray whale, walrus, andice gouging disturbance on benthic communities in the Bering Sea and Chukchi Sea,Alaska. National Geographic research 694): 470-484.
Knezovich, J.P., D.J. Steichen, J.A. Jelinski, and S.L. Anderson. 1996. Sulfide Toleranceof Four Marine Species Used to Evaluate Sediment and Pore Water Toxicity. Bull.Environ. Contam. Toxicol. 57: 450-457.
Lange, G.J., R.E. Cranston, D.H. Hydes, and D. Boust. 1992. Extraction of Pore Waterfrom Marine Sediments: A Review of Possible Artifacts with Pertinent Examples fromthe North Atlantic. Mar. Geol. 109: 53-76.
Lee, H.L., Lincoff, A., Boese, B.L., Cole, F., Ferraro, S.P., Lamberson, J.O., Ozretich,R.J., Randall, R.C., Rukavina, K.R., Schults, D.W., Sercu, K.A., Specht, D.T., Swartz,R.C., and Young, D.R. 1994. Ecological risk assessment of the marine sediments at theUnited Heckathorn superfund site. Final Report. U.S. EPA ERL-Narrangansett. ERL-N:N269.
Lenihan, H. S. and J.S. Oliver. 1995. Anthropogenic and natural disturbances to marinebenthic communities in Antarctica. Ecological Applications 5(2): 311-326.
Lenihan, H.L., K.A. Kiest, K.E. Conlan, P.N. Slattery, B.H. Konar and J.S. Oliver. 1995.Patterns of survival and behavior in Antarctic benthic invertebrates exposed tocontaminated sediments: field and laboratory bioassay experiments. Journal ofExperimental Marine Biology and Ecology. 192: 233-255.

95
Levin, L. 1981. Dispersion, feeding behavior and competition in two spionidpolychaetes. J. Mar. Res. 39: 99-117.
Levin, L.A. 1983. Drift tube studies of Bay-ocean water exchange and implications forlarval dispersal. Estuaries 6(4): 364-371.
Lewis, D.W. 1984 Practical Sedimentology. Hutchinson Ross Publishing Co., 230pp.
Light, W. 1980. Invertebrates of the San Francisco Bay estuary system: Spionidae,Polychaeta, Annelida.
Long, E.R., M.F. Buchman, S.M. Bay, R.J. Breteler, R.S. Carr, P.M. Chapman, J.E. Hose,A.L. Lissner, J. Scott, and D.A. Wolfe. 1990. Comparative evaluation of five toxicitytests with sediments from San Francisco Bay and Tomales Bay, California. Environ.Contam. and Toxicol. 9: 1193-1214.
Long, E.R. M.F. Buchman. 1989. The potential for biological effects of sediment-sorbedcontaminants tested in the National Status and Trends Program. NOAA TechnicalMemorandum NOS OMA 45.
Long, E.R. and L.G. Morgan. 1990. The potential for biological effects of sediment-sorbed contaminants tested in the National Status and Trends Program. NOAA TechnicalMemorandum NOS OMA 62. National Oceanic and Atmospheric Administration,Seattle, WA.86 pp.
Long, E.R., D.A. Wolfe, R.S. Carr, K.J. Scott, G.B. Thursby, H.L. Windom, R. Lee, F.D.Calder, G.M. Sloane, and T. Seal. 1994. Magnitude and extent of sediment toxicity inTampa Bay, Florida. National Oceanic and Atmospheric Administration. NOAATechnical Memorandum NOS ORCA 78.
Long, E.R., D.L. MacDonald, S.L. Smith and F.D. Calder. 1995. Incidence of AdverseBiological Effects Within Ranges of Chemical Concentration in Marine and EstuarineSediments. Environmental Management. 19 (1): 81-97.
Long, E.R., Field, L.J., and D.D. MacDonald. 1998. Predicting toxicity in marinesediments with numerical sediment quality guidelines. Environ. Toxicol. and Chem. 17(4): 714-727.
Long, E.R., and D.D. MacDonald. In press. Recommended uses of empirically-derived,sediment quality guidelines for marine and estuarine ecosystems. Human and Ecolog.Risk Assess.

96
Los Angeles Regional Water Quality Control Board, Region (4). 1995. Water QualityControl Plan- Los Angeles Region. Basin Plan for the Coastal Watersheds of LosAngeles and Ventura Counties. LARWQCB, Monterey Park, CA.
Los Angeles Regional Water Quality Control Board, Region (4). 1997. BPTCPProposed Regional Toxic Hot Spot Cleanup Plan. LARWQCB, Monterey Park, CA.
Los Angeles Regional Water Quality Control Board, Region (4). 1996. Callequas CreekWatershed. LARWQCB, Monterey Park, CA.
MARPCPN I. 1992. The analysis of carbon and nitrogen form sediments and theparticulate fraction of water from estuarine/coastal systems using elemental analysis. Method MARPCPN I. University of Maryland System for environmental and EstuarineStudies, Chesapeake Biological Laboratory. Revision 1.1. Environmental MonitoringSystems Laboratory, Office of Research and Development, U.S. EnvironmentalProtection Agency.
MacDonald, D.D. 1992. Development of an integrated approach to the assessment ofsediment quality in Florida. Prepared for the Florida Department of EnvironmentalRegulation. MacDonald Environmental Services, Ltd. Ladysmith, British Columbia. 114pp.
MacDonald, D.D. 1994. Approach to the Assessment of Sediment Quality in FloridaCoastal Waters. Volume 1 - Development and Evaluation of Sediment QualityAssessment Guidelines. Prepared for the Florida Department of EnvironmentalRegulation. MacDonald Environmental Services, Ltd. Ladysmith, British Columbia. 126pp.
MacDonald, D.D. 1994. Approach to the Assessment of Sediment Quality in FloridaCoastal Waters. Volume 2 - Application of the Sediment Quality Assessment Guidelines. Prepared for the Florida Department of Environmental Regulation. MacDonaldEnvironmental Services, Ltd. Ladysmith, British Columbia. 52 pp.
MacDonald, D.D., R.S. Carr, F.D. Calder and E.R. Long. In Press. Development andEvaluation of Sediment Quality Guidelines for Florida Coastal Waters. Ecotoxicology
Maurer, D. 1967. Mode of feeding and diet, and synthesis of studies on marinepelecypods from Tomales Bay, California. Veliger 10(1): 72-76.
McCall, P.L. 1977. Community patterns and adaptive strategies of the infaunal benthosof Long Island Sound. Journal of Marine Research 35: 221-226.
Menzies, R. 1962. The marine isopod fauna of Bahia de San Quintin, Baja California,Mexico. Pac. Natur. 3: 337-348.

97
Mills, E. 1962. Amphipod crustaceans of the Pacific coast of Canada. I. FamilyOedicerotidae. Nat. Hist. Papers, Nat. Mus. Canada 15: 1-21.
Mills, E. 1967. Biology of an ampelscid amphipod crustacean sibling species pair. J.Fish. Res. Bd. Canada. 24: 305-355.
Neff, J. M. 1979. Polycyclic Aromatic Hydrocarbons in the Aquatic Environment: sources, fates and biological effects. Applied Science Publishers, London, 262 pp.
Neff, J. M. and J. W. Anderson. 1981. Response of Marine Animals to Petroleum andSpecific Petroleum Hydrocarbons. Applied Science Publishers, London, 177 pp.
Oakden, J.M., J.S. Oliver and A.R. Flegal. 1984a. Behavioral responses ofphoxocephalid amphipods to organic enrichment and trace metals in sediment. MarineEcology Progress Series. 14: 253-257.
Oakden, J.M., J.S. Oliver and A.R. Flegal. 1984b. EDTA chelation and zinc antagonismwith cadmium in sediments: effects on behavior and mortality of two infaunalamphipods. Marine Biology. 84: 125-130.
Okey, T.A. 1997. Sediment flushing observations, earthquake slumping, and benthiccommunity changes in Monterey Canyon head. Continental Shelf Research. 17: 877-897.
Oliver, J.S., P.N. Slattery, L.W. Hulberg and J.W. Nybakken 1977. Patterns ofsuccession in benthic infaunal communities following dredging and dredged materialdisposal in Monterey Bay. Dredged Material Research Program, U.S. Army EngineersWaterways Expeiment Station, Technical Report 0-77-27, Vickberg, Mississippi.
Oliver, J.S., P.N. Slattery, L.W. Hulberg and J.W. Nybakken. 1980. Relationshipsbetween wave disturbance and zonation of benthic invertebrate communities along asubtidal high energy beach in Monterey Bay, California. Fishery Bulletin. 78: 437-454.
Oliver, J.S., J.M. Oakden and P.N. Slattery. 1982. Phoxocephalid amphipod crustaceansas predators on larvae and juveniles in marine soft bottom communities. Marine EcologyProgress Series. 7: 179-184.
Oliver, J.S., P.N. Slattery, M.A. Silberstein and E.F. O'Connor. 1983. A comparison ofgray whale, Eschrichtius robutus, feeding in the Bering Sea and Baja California. FisheryBulletin. 81: 513-522.
Oliver, J.S., P.N. Slattery, M.A. Silberstein and E.F. O'Connor. 1984. Gray whalefeeding on dense ampleliscid amphipod communities near Bamfield, British Columbia. Canadian Journal of Zoology. 62: 41-49.

98
Oliver, J.S. and P.N. Slattery. 1985a. Effects of crustacean predators on speciescomposition and population structure of soft-bodied infauna from McMurdo Sound,Antarctica. Ophelia. 24: 155-175.
Oliver, J.S. and P.N. Slattery. 1985b. Destruction and opportunity on the sea floor:effects of gray whale feeding. Ecology. 66(6): 1966-1975.
Pearson, T.H. and R. Rosenberg. 1978. Macrobenthic succession in relation to organicenrichment and pollution of the marine environment. Oceanogr. Mar. Biol. Annu. Rev.16: 229-311.
Peeling, T.J. 1974. A proximate biological survey of San Diego Bay, California. NavalUndersea Center. Report number: NUC TP 389.
Phillips B.M., B.S. Anderson and J.W. Hunt. 1997. Measurement and distribution ofinterstitial and overlying water ammonia and hydrogen sulfide in sediment toxicity tests. Mar. Environ. Res. 44: 117-126.
Port of Los Angeles. 1992. Los Angeles/Long Beach Harbors Improvement EIR/EIS. Port of Los Angeles and the U.S. Army Corps of Engineers. Los Angeles, CA.
PSEP. 1991. Interim final recommended guidelines for conducting laboratory bioassayson Puget Sound sediments. U.S. Environmental Protection Agency, Region 10, Office ofPuget Sound, Seattle, WA.
Reid, G. and A. Reid. 1969. Feeding processes of members of the genus Macoma(Mollusca: Bivalvia). Can. J. Zool. 47: 649-657.
Reish, D. and J. Barnard. 1960. Field toxicity tests in marine waters utilizing thepolychaetous annelid Capitella capitata (Fabricius). Pac. Natur. 1: 1-12.
Reish, D.J., D.F. Soule and J.D. Soule. 1980. The benthic biological conditions of LosAngeles-Long Beach Harbours: results of 28 years of investigations and monitoring. Helgolander Meersunters. 34: 193-205.
Rhoads, D.C., P.L. McCall, and Y.Y. Yingst. 1978. Disturbance and production on theestuarine seafloor. American Scientist. 66: 577-586.
Rhoads, D.C. and L.F. Boyer. 1982. The effects of marine benthos on the physicalproperties of sediment: a successional perspective. In Animal-Sediment Relations: TheBiogenic Alteration of Sediments, ed. P.L. McCall and M.J.S. Tevesz, pp. 3-43. PlenumPress, New York.

99
Sanders, H.L., J.F. Grassle, G.R. Hampson, L.S. Morse, S. Garner-Price and C.C. Jones. 1980. Anatomy of an oil spill: long-term effects from the grounding of the barge Floridaoff West Falmouth, Massachusetts. Journal of Marine Research. 38: 265-380.
Santos, S.L. and J.L. Simon. 1980. Response of soft-bottom benthos to annualcatastrophic disturbance in a south Florida estuary. Marine Ecology Progress Series. 3:347-355.
Savenko, V.S. 1977. Marine chemistry: the dissociation of hydrogen sulfide in seawater.Oceanology. 16:347-350
Schimmel, S.C., B.D. Melzian, D.E. Campbell, C.J. Strobel, S.J. Benyi, J.S. Rosen, H.W.Buffum, and N.I. Rubinstein. 1994. Statistical Summary EMAP-Estuaries VirginianProvince - 1991. EPA /620/R-94/005.
Schultz, G. 1969. How to know the marine isopod crustaceans. W. C. Brown Co.
Schuster, S. 1987. Alternative reproductive behaviors: three discrete male morphs inParacerceis sculpta, an intertidal isopod from the northern Gulf of California. J. Crust.Biol. 7: 318-327.
Slattery, P. 1980. Ecology and life histories of dominant infaunal crustaceans inhabitingthe subtidal high energy beach at Moss Landing, California. MS. Thesis, San Jose StateUniversity.
Slattery, P.N. 1985. Life histories of infaunal amphipods from subtidal sands ofMonterey Bay, California. Journal of Crustacean Biology. 5: 635-649.
Sloan, C.A., N.G. Adams, R.W. Pearce, D.W. Brown, and S.L. Chan. 1993. NorthwestFisheries Science Center Organic Analytical Procedures. In Sampling and AnalyticalMethods of The National Status and Trends Program National Benthic Surveillance andMussel Watch Projects 1984-1992 - Volume VI Comprehensive descriptions of the traceorganic analytical methods. G.G. Lauenstein and A.Y. Cantillo (Eds). NOAA TechnicalMemorandum NOS ORCA 71, p 53-97.
Smith, R. and J. Carlton (eds). 1975 (3rd ed). Light's manual: Intertidal invertebrates ofthe central California coast. UC Press. 716p.
Soule, D.F., Oguri, M., and Pieper, R.E. 1997. The marine environment of Marina Delrey, July 1995-June 1996. A report to the Department of Beaches and Harbors, County ofLos Angeles. Harbors Environmental Projects, University of Southern California, LosAngeles, CA.
SPSS, Inc. 1997. SYSTAT Statistical Program, Version 7.0. Chicago, IL USA.

100
State Water Resources Control Board. 1990. Evaluation of the AET Approach forAssessing Contamination of Marine Sediments in California. Division of Water Quality.Report No. 90-3 WQ. Sacramento, CA.
State Water Resources Control Board. 1993. Staff Report: Status of the Bay Protectionand Toxic Cleanup Program. Division of Water Quality. Sacramento, CA.
Stephenson, M., M. Puckett, N. Morgan, and M. Reid. 1994. Bay Protection and ToxicCleanup Program: Quality Assurance Project Plan. Bay Protection and Toxic CleanupProgram, State Water Resources Control Board, Sacramento, CA.
Stull, J.K., Haydock, C.I., Smith, R.W. and D.E. Montagne. 1986. Long-term changes inthe benthic community on the coastal shelf off Palos Verdes, southern California. MarineBiology. 91: 539-551.
Swartz, R.C., W.A. DeBen and F.A. Cole. 1979. A bioassay for the toxicity of sedimentto marine macrobenthos. Water Pollution Control Federation. 51: 944-950.
Swartz, R.C., D.W. Shults, G.R. Ditworth and W.A. DeBen. 1984. Toxicity of sewagesludge to Rhepoxnius abronius, a marine amphipod. Archives of EnvironmentalContamination and Toxicity. 13: 207-216.
Swartz, R.C., W.A. DeBen, J.K.P. Jones, J.O. Lamberson and F.A. Cole. 1985. Phoxocephalid amphipod bioassay for marine sediment toxicity. In, Aquatic toxicity andhazard assessment, Seventh Symposium: ASTM STP 854, eds, R.D. Cradwell. R. Purdyand R.C. Bahner, American Society for Testing and Materials, Philadelphia, pp. 284-307.
Swartz, R.C., Cole, F.A., Shults, D.W. and W.A. Deben. 1986. Ecological changes inthe southern California bight near a large sewage outfall; benthic conditions 1980-1983. Marine Ecology Progress Series. 31: 1-13.
Swartz, R.C., F.A Cole, J.O. Lamberson, S.P. Ferraro, D.W. Schults, D.W. Schults, W.A.Deben, H. Lee II, R.J. Ozretich. 1994 Sediment toxicity, contamination and amphipodabundance at a DDT- and Dieldrin-contaminated site in San Francisco Bay. Environ.Toxicol. Chem. 13: 949-962.
Tabachnick, B.G. and L.S. Fidell. 1996. Using Multivariate Statistics. Harper CollinsCollege Publishers. New York, NY USA. 880 pp.
Tang, A., J.G. Kalocai, S. Santos, B. Jamil, J. Stewart. 1997. Sensitivity of blue musseland purple sea urchin larvae to ammonia. Poster, Society of Environmental Toxicologyand Chemistry, 18th Annual Meeting, San Francisco.
Thistle, D. 1981. Natural physical disturbances and communities of marine soft bottoms.Marine Ecology Progress Series. 6: 223-228.

101
Thursby, G.B. and C.E. Schlekat. 1993. Statistical analysis of 10-day solid phasetoxicity data for amphipods. Abstract, 14th Annual Meeting, Society of EnvironmentalToxicology and Chemistry.
Thursby, G.B., J. Heltshe, K.J. Scott. 1997. Revised approach to toxicity testacceptability criteria using a statistical performance assessment. Environ. Toxicol. Chem. 16: 1322-1329.
U.S. Environmental Protection Agency. 1988. Briefing Report to the EPA ScienceAdvisory Board: The Apparent Effects Threshold Approach. Puget Sound EstuaryProgram. U.S. Environmental Protection Agency, Region 10. Seattle, Washington.
U.S. Environmental Protection Agency. 1989. Report of the Sediment CriteriaSubcommittee: Evaluation of the Apparent Effects Threshold (AET) Approach forAssessing Sediment Quality. Office of the Administrator. Science Advisory Board.Washington, D.C.
U.S. Environmental Protection Agency. 1990. Exposure Factors Handbook. Office ofHealth and Environmental Assessment, Washington, DC. EPA-600/8-89-043.
U.S. Environmental Protection Agency/ U.S. Army Corps of Engineers. 1991. Evaluation of Dredged Material Proposed for Ocean Disposal: Testing Manual. EPA –503/8-91/001. February 1991.
U.S. Environmental Protection Agency. 1993a. Workshop Report on DevelopmentalNeurotoxic Effects Associated with Exposure to PCBs. September 14-15. 1992. Research Triangle Park, NC. Risk Assessment Forum. Washington D.C.
U.S. Environmental Protection Agency. 1993b. Methods for measuring the acutetoxicity of effluents and receiving waters to freshwater and marine organisms. Office ofResearch and Development. EPA/600/4-90/027F. August 1993.
U.S. Environmental Protection Agency. 1994. Methods for Assessing the Toxicity ofSediment-associated Contaminants with Estuarine and Marine Amphipods. Office ofResearch and Development. EPA 600-R-94-025. June 1994.
U.S. Environmental Protection Agency. 1995a. Guidance for Assessing ChemicalContaminant Data For Use In Fish Advisories- Volume 1 Fish Sampling and Analysis2nd Edition. Office of Water. EPA 823-R-95-007. September 1995.
U.S. Environmental Protection Agency. 1995b. Short-term methods for estimating thechronic toxicity of effluents and receiving waters to west coast marine and estuarineorganisms. Office of Research and Development. EPA/600/R-95/136. August 1995.

102
VanBlaricom, G.R. 1982. Experimental analysis of structural regulation in a marine sandcommunity exposed to oceanic swell. Ecological Monographs. 52: 283-305.
Vetter, E.W. 1995. Detritus-based patches of high secondary production in the nearshorebenthos. Marine Ecology Progress Series. 120: 251-262.
Weston, D.P. 1990. Quantitative examination of macro-benthic community changesalong an organic enrichment gradient. Marine Ecology Progress Series. 61: 233-244.
Whitfield, M. 1974. The hydrolysis of ammonium ions in sea water - a theoreticalapproach. J. Mar. Biol. Ass. U.K. 54: 565-580.
Whitfield, M. 1978. The hydrolysis of ammonium ions in sea water - experimentalconfirmation of predicted constants at one atmosphere pressure. J. Mar. Biol. Ass. U.K.58: 781-787.
Wilcock, R.J., T.J. Smith, R.D. Primore, S.F. Thrush, V. Cumming, J.E. Hewitt. 1993. Bioaccumulation and elimination of chlordane by selected intertidal benthic fauna. Environ. Toxicol. Chem. 12: 733-742.

103
Table 12. ERM and PEL Quotients and Number of Sediment Quality GuidelineExceedances at Industrial Harbor Stations. Stations are ranked in descending order byERM Quotient.
STANUM STATION IDORG LEG ERMQ PELQ ERM PELEXCDS EXCDS
47004.0 Consolidated Slip - 200E - Depth 2 1657 46 4.38 6.30 15 2747004.0 Consolidated Slip - 200E - Surface 1656 46 1.29 1.86 6 1749004.0 Kaiser Intl.- Berth 49 1793 54 2.70 5.71 17 1940006.1 Consolidated Slip - Rep 1 1050 25 1.95 2.66 7 1440006.1 Consolidated Slip - Rep 2 1051 25 1.65 2.28 7 1640006.1 Consolidated Slip - Rep 3 1052 25 1.47 2.05 8 1940006.1 Consolidated Slip 16 1 1.27 1.76 6 1347002.0 Consolidated Slip – 200 - Surface 1650 46 1.92 2.45 8 1547002.0 Consolidated Slip – 200 - Depth 2 1651 46 1.57 2.06 4 1047009.0 Consolidated Slip - 200G - Surface 1664 46 1.66 2.23 8 1747003.0 Consolidated Slip - 200B - Surface 1653 46 1.63 2.14 6 1247008.0 Consolidated Slip - Storm Drain 1663 46 1.61 2.12 6 1247001.0 Consolidated Slip – 198 - Surface 1647 46 1.43 1.88 5 847001.0 Consolidated Slip – 198 - Depth 2 1648 46 1.42 1.95 5 1240006.2 Consolidated Slip 17 1 1.29 1.77 5 1847007.0 Consolidated Slip – End – Surface 1662 46 1.01 1.32 4 540019.3 Inner Fish Harbor 57 2 0.91 1.27 7 1447010.0 Dominguez - H. Ford Bridge - Surface 1665 46 0.80 1.10 3 540019.2 Inner Fish Harbor 56 2 0.66 0.90 5 640019.1 Inner Fish Harbor 55 2 0.62 0.89 4 1240007.2 Long Beach Harbor - Channel 2 20 3 0.59 0.81 4 1440011.3 Inner Harbor - Channel 3 33 3 0.57 0.69 3 340001.3 Southwest Slip 3 1 0.56 0.84 10 1644012.0 Port Hueneme - Wharf B 1626 45 0.54 0.79 7 1540031.1 Palos Verdes - Swartz 6 76 3 0.52 0.67 3 540001.2 Southwest Slip - Rep 1 1062 25 0.52 0.75 5 1240001.2 Southwest Slip - Rep 2 1063 25 0.50 0.72 5 1340001.2 Southwest Slip 2 1 0.42 0.56 4 940001.2 Southwest Slip - Rep 3 1064 25 0.32 0.44 1 440013.1 Inner Queensway Bay - Rep 3 1058 25 0.52 0.73 1 240013.1 Inner Queensway Bay 37 3 0.38 0.54 1 240013.1 Inner Queensway Bay - Rep 2 1057 25 0.31 0.43 1 140013.1 Inner Queensway Bay - Rep 1 1056 25 0.28 0.41 1 140014.2 Outer Queensway Bay 41 3 0.49 0.67 2 240014.3 Outer Queensway Bay 42 3 0.48 0.64 2 140031.3 Palos Verdes - Swartz 6 78 3 0.47 0.58 3 340013.2 Inner Queensway Bay 38 3 0.44 0.63 1 340031.2 Palos Verdes (Swartz 6) – Rep 2 1039 25 0.43 0.57 3 540031.2 Palos Verdes (Swartz 6) – Rep 3 1004 23 0.39 0.52 2 4

104
Table 12 cont. ERM and PEL Quotients and Number of Sediment Quality GuidelineExceedances at Industrial Harbor Stations. Stations are ranked in descending order byERMQ.
STANUM STATION IDORG LEG ERMQ PELQ ERM PELEXCDS EXCDS
40031.2 Palos Verdes (Swartz 6) - Rep 1 1038 25 0.38 0.49 3 440031.2 Palos Verdes (Swartz 6) 77 3 0.37 0.49 3 440031.2 Palos Verdes (Swartz 6) - Rep 2 1003 23 0.36 0.49 3 440031.2 Palos Verdes (Swartz 6) - Rep 1 1002 23 0.32 0.44 2 340031.2 Palos Verdes (Swartz 6) - Rep 3 1040 25 0.30 0.41 3 440031.2 Palos V.(Swartz 6) - Rep 4 Blind 1005 23 0.29 0.42 1 040031.2 Palos Verdes (Swartz 6) - Rep 1 1189 30 NA NA NA NA40031.2 Palos Verdes (Swartz 6) - Rep 2 1190 30 NA NA NA NA40031.2 Palos Verdes (Swartz 6) - Rep 3 1191 30 NA NA NA NA40005.1 East Basin - Turning Basin 13 1 0.41 0.54 3 348009.0 San Pedro Bay Outer Harbor 1694 48 0.39 0.52 2 140001.1 Southwest Slip 1 1 0.38 0.51 1 1340004.2 Lower Main Channel 11 1 0.37 0.55 1 240004.2 Lower Main Channel - Rep 3 832 20 0.24 0.35 1 040004.2 Lower Main Channel - Rep 2 831 20 0.21 0.29 1 040004.2 Lower Main Channel - Rep 1 830 20 0.20 0.28 1 040004.2 Lower Main Channel 789 18 NA NA NA NA40010.1 Off Cabrillo Beach - Rep 2 1069 26 0.36 0.60 2 240010.1 Off Cabrillo Beach - Rep 3 1070 26 0.34 0.57 2 240010.1 Off Cabrillo Beach - Rep 1 1068 26 0.33 0.55 1 240010.1 Off Cabrillo Beach - Rep 1 1006 23 0.31 0.47 1 240010.1 Off Cabrillo Beach 28 2 0.28 0.44 1 140010.1 Off Cabrillo Beach 136 4 0.26 0.37 1 140010.1 Off Cabrillo Beach 810 19 NA NA NA NA40010.1 Off Cabrillo Beach 1331 32 NA NA NA NA49005.0 Kaiser Intl.- Berth 48 1794 54 0.34 0.63 1 540004.3 Lower Main Channel 12 1 0.34 0.48 2 344013.0 Port Hueneme – Wharf #1 1627 45 0.34 0.55 1 1240010.3 Off Cabrillo Beach - Rep 2 1075 26 0.33 0.53 1 240010.3 Off Cabrillo Beach - Rep 1 1074 26 0.32 0.50 1 140010.3 Off Cabrillo Beach - Rep 3 1008 23 0.30 0.47 1 240010.3 Off Cabrillo Beach 30 2 0.28 0.43 1 140010.3 Off Cabrillo Beach - Rep 3 1076 26 0.26 0.43 1 140010.3 Off Cabrillo Beach 138 4 NA NA NA NA40010.3 Off Cabrillo Beach 1333 32 NA NA NA NA40011.1 Inner Harbor - Channel 3 31 3 0.33 0.43 1 140010.2 Off Cabrillo Beach - Rep 1 1071 26 0.32 0.51 1 240010.2 Off Cabrillo Beach - Rep 2 1072 26 0.30 0.48 1 140010.2 Off Cabrillo Beach - Rep 2 1007 23 0.30 0.44 1 0

105
Table 12 cont. ERM and PEL Quotients and Number of Sediment Quality GuidelineExceedances at Industrial Harbor Stations. Stations are ranked in descending order byERMQ.
STANUM STATION IDORG LEG ERMQ PELQ ERM PELEXCDS EXCDS
40010.2 Off Cabrillo Beach - Rep 3 1073 26 0.27 0.44 1 140010.2 Off Cabrillo Beach 29 2 0.26 0.38 1 040010.2 Off Cabrillo Beach 137 4 NA NA NA NA40010.2 Off Cabrillo Beach 1332 32 NA NA NA NA40011.2 Inner Harbor - Channel 3 32 3 0.30 0.45 1 244011.0 Los Cerritos Channel Tidal P - Rep3 1079 26 0.30 0.41 1 144011.0 Los Cerritos Channel Tidal P - Rep1 1077 26 0.29 0.39 1 144011.0 Los Cerritos Channel Tidal P - Rep2 1078 26 0.27 0.37 1 244011.0 Los Cerritos Channel Tidal P 611 11 NA NA NA NA40033.1 Outer Harbor - Pola 10 82 1 0.28 0.40 1 440018.3 Long Beach Outer Harbor – 18 – Rep 2 1042 25 0.27 0.37 2 140018.3 Long Beach Outer Harbor – 18 – Rep 3 886 22 0.26 0.35 2 140018.3 Long Beach Outer Harbor – 18 – Rep 2 885 22 0.25 0.35 1 140018.3 Long Beach Outer Harbor – 18 – Rep 1 884 22 0.23 0.32 1 140018.3 Long Beach Outer Harbor – 18 – Rep1 1041 25 0.22 0.31 1 140018.3 Long Beach Outer Harbor – 18 1695 48 0.25 0.37 2 140018.3 Long Beach Outer Harbor – 18 – Rep3 1043 25 0.21 0.30 1 140018.3 Long Beach Outer Harbor – 18 54 3 0.21 0.28 1 040018.3 Long Beach Outer Harbor – 18 – Rep 1 1192 30 NA NA NA NA40018.3 Long Beach Outer Harbor – 18 – Rep 2 1193 30 NA NA NA NA40018.3 Long Beach Outer Harbor – 18 – Rep 3 1194 30 NA NA NA NA40018.3 Long Beach Outer Harbor – 18 1334 32 NA NA NA NA40018.3 Long Beach Outer Harbor – 18 1770 53 NA NA 0 040012.0 Southeast Basin 1632 45 0.25 0.33 1 140020.2 Long Beach Outer Harbor - 20 1696 48 0.23 0.31 2 140012.1 Southeast Basin - Rep 1 1047 25 0.23 0.30 1 140012.1 Southeast Basin - Rep 2 1048 25 0.21 0.28 1 040012.1 Southeast Basin 34 2 0.20 0.27 1 040012.1 Southeast Basin - Rep 3 1049 25 0.18 0.23 1 040012.1 Southeast Basin 812 19 NA NA NA NA40008.1 East Basin - Pier C 22 2 0.23 0.30 1 048010.0 Turning Basin 1697 48 0.22 0.31 1 040017.3 Long Beach Channel - Rep 2 1060 25 0.21 0.29 1 040017.3 Long Beach Channel - Rep 1 1059 25 0.19 0.26 1 040017.3 Long Beach Channel - Rep 3 1061 25 0.17 0.22 1 040017.3 Long Beach Channel 51 3 0.16 0.21 1 040002.2 West Basin - Pier 143 5 1 0.21 0.29 1 040016.3 Terminal Island Stp 48 2 0.20 0.26 1 140012.2 Southeast Basin 35 2 0.20 0.26 1 1

106
Table 12 cont. ERM and PEL Quotients and Number of Sediment Quality GuidelineExceedances at Industrial Harbor Stations. Stations are ranked in descending order by ERMQ.
STANUM STATION IDORG LEG ERMQ PELQ ERM PELEXCDS EXCDS
40009.0 West Basin Entrance 1699 48 0.20 0.25 0 040009.1 West Basin Entrance - Ref 1 834 20 0.18 0.24 1 040009.1 West Basin Entrance - Ref 3 836 20 0.18 0.24 0 040009.1 West Basin Entrance - Ref 2 835 20 0.17 0.23 1 040009.1 West Basin Entrance 25 2 0.16 0.19 0 040008.3 East Basin - Pier C 24 2 0.18 0.23 0 040015.1 Fish Harbor Entrance 43 2 0.18 0.23 1 040016.1 Terminal Island Stp 46 2 0.18 0.23 1 140015.3 Fish Harbor Entrance 45 2 0.17 0.22 1 040003.1 Turning Basin - Pier 151 7 1 0.17 0.23 1 140020.3 Long Beach Outer Harbor - 20 60 3 0.16 0.23 1 040009.3 West Basin Entrance 27 2 0.15 0.20 0 040020.2 Long Beach Outer Harbor - 20 59 3 0.15 0.21 1 040015.1 Fish Harbor Entrance 1698 48 0.15 0.21 1 040020.1 Long Beach Outer Harbor - 20 58 3 0.14 0.19 1 040032.3 San Pedro Bay - POLA 19 105 2 0.14 0.17 1 040032.3 San Pedro Bay - POLA 19 81 1 0.11 0.14 1 040015.2 Fish Harbor Entrance 44 2 0.13 0.18 1 040003.2 Turning Basin, Pier 151 - Rep 3 1055 25 0.13 0.18 0 040003.2 Turning Basin, Pier 151 - Rep 2 1054 25 0.11 0.14 0 040003.2 Turning Basin, Pier 151 8 1 0.11 0.15 0 040003.2 Turning Basin, Pier 151 - Rep 1 1053 25 0.11 0.13 0 040016.2 Terminal Island Stp 47 2 0.13 0.16 0 040030.1 San Pedro Breakwater 73 2 0.11 0.13 1 040030.2 San Pedro Breakwater 74 2 0.11 0.13 1 040032.1 San Pedro Bay - POLA 19 103 2 0.10 0.16 1 040032.2 San Pedro Bay - POLA 19 104 2 0.10 0.13 1 040002.1 West Basin - Pier 143 4 1 NA NA NA NA40002.3 West Basin - Pier 143 6 1 NA NA NA NA40003.3 Turning Basin - Pier 151 9 1 NA NA NA NA40004.1 Lower Main Channel 10 1 NA NA NA NA40005.2 East Basin - Turning Basin 14 1 NA NA NA NA40005.3 East Basin - Turning Basin 15 1 NA NA NA NA40006.3 Consolidated Slip 18 1 NA NA NA NA40032.1 San Pedro Bay - POLA 19 79 1 NA NA NA NA40032.2 San Pedro Bay - POLA 19 80 1 NA NA NA NA40033.2 Outer Harbor - POLA 10 83 1 NA NA NA NA40033.3 Outer Harbor - POLA 10 84 1 NA NA NA NA

107
Table 12 cont. ERM and PEL Quotients and Number of Sediment Quality GuidelineExceedances at Industrial Harbor Stations. Stations are ranked in descending order by ERMQ.
STANUM STATION IDORG LEG ERMQ PELQ ERM PELEXCDS EXCDS
40008.2 East Basin - Pier C 23 2 NA NA NA NA40009.2 West Basin Entrance 26 2 NA NA NA NA40012.3 Southeast Basin 36 2 NA NA NA NA40030.3 San Pedro Breakwater 75 2 NA NA 1 040007.1 Long Beach Harbor - Channel 2 19 3 NA NA NA NA40007.3 Long Beach Harbor - Channel 2 21 3 NA NA NA NA40013.3 Inner Queensway Bay 39 3 NA NA NA NA40014.1 Outer Queensway Bay 40 3 NA NA NA NA40017.1 Long Beach Channel 49 3 NA NA NA NA40017.2 Long Beach Channel 50 3 NA NA NA NA40018.1 Long Beach Outer Harbor - 18 52 3 NA NA NA NA40018.2 Long Beach Outer Harbor - 18 53 3 NA NA NA NA44012.0 Port Hueneme - Wharf B 612 11 NA NA NA NA44013.0 Port Hueneme - Wharf #1 613 11 NA NA NA NA40009.1 West Basin Entrance 790 18 NA NA NA NA40013.1 Inner Queensway Bay 791 18 NA NA NA NA40015.3 Fish Harbor Entrance 792 18 NA NA NA NA40016.2 Terminal Island Stp 793 18 NA NA NA NA40017.3 Long Beach Channel 811 19 NA NA NA NA44055.0 L.B. Naval Station - Pier 3 - Rep 1 1198 30 NA NA NA NA44055.0 L.B. Naval Station - Pier 3 - Rep 2 1199 30 NA NA NA NA44055.0 L.B. Naval Station - Pier 3 - Rep 3 1200 30 NA NA NA NA46001.0 Hugo Neuproler - #1 1623 45 NA NA 1 146002.0 Hugo Neuproler - #2 1624 45 NA NA 1 146003.0 Hugo Neuproler - #3 1625 45 NA NA 0 047003.0 Consolidated Slip – 200B – Depth 2 1654 46 NA NA 7 1047005.0 Consolidated Slip – 200T – Surface 1659 46 NA NA 10 1147005.0 Consolidated Slip – 200T – Depth 2 1660 46 NA NA 9 947005.0 Consolidated Slip – 200T – Depth 3 1661 46 NA NA 5 948009.0 San Pedro Bay Outer Harbor 1769 53 NA NA 0 040020.2 Long Beach Outer Harbor - 20 1771 53 NA NA 0 048010.0 Turning Basin 1772 53 NA NA 0 040015.1 Fish Harbor Entrance 1773 53 NA NA 0 040009.0 West Basin Entrance 1774 53 NA NA 0 049001.0 Cabrillo Beach Pier - West 1778 53 NA NA 1 149002.0 Cabrillo Beach Pier - Central 1779 53 NA NA 1 049003.0 Cabrillo Beach Pier - East 1780 53 NA NA 1 0

108
Table 13. Survival of Amphipods Rhepoxynius abronius (RA) or Eohaustorius estuarius (EE) in Industrial Harbor Station Sediments. MN and SD = mean survival and standard deviation. * = significantly toxic using a t-test. ns = not significant. T = toxic using a t-test and relative to the MSD value for these protocols. NT = Not Toxic. NA = Not Analyzed.STANUM STATION IDORG LEG RA MN RA SD RA t-test RA MSD EE MN EE SD EE t-test EE MSD47004.0 Consolidated Slip - 200E - Depth 2 1657 46 NA NA NA NA 33.00 23.00 * T47004.0 Consolidated Slip - 200E - Surface 1656 46 NA NA NA NA 40.00 27.00 * T49004.0 Kaiser Intl. - Berth 49 1793 54 NA NA NA NA 84.00 5.00 * NT40006.1 Consolidated Slip - Rep 1 1050 25 62.00 21.68 * T NA NA NA NA40006.1 Consolidated Slip - Rep 2 1051 25 65.00 9.35 * T NA NA NA NA40006.1 Consolidated Slip - Rep 3 1052 25 80.00 11.18 * NT NA NA NA NA40006.1 Consolidated Slip 16 1 58.00 17.20 * T NA NA NA NA47002.0 Consolidated Slip – 200 - Surface 1650 46 NA NA NA NA 54.00 7.00 * T47002.0 Consolidated Slip – 200 - Depth 2 1651 46 NA NA NA NA 86.00 4.00 * NT47009.0 Consolidated Slip - 200g - Surface 1664 46 NA NA NA NA 50.00 20.00 * T47003.0 Consolidated Slip - 200b - Surface 1653 46 NA NA NA NA 70.00 7.00 * T47008.0 Consolidated Slip - Storm Drain 1663 46 NA NA NA NA 52.00 21.00 * T47001.0 Consolidated Slip – 198 - Surface 1647 46 NA NA NA NA 61.00 19.00 * T47001.0 Consolidated Slip – 198 - Depth 2 1648 46 NA NA NA NA 64.00 13.00 * T40006.2 Consolidated Slip 17 1 59.00 16.40 * T NA NA NA NA47007.0 Consolidated Slip – End - Surface 1662 46 NA NA NA NA 65.00 15.00 * T40019.3 Inner Fish Harbor 57 2 54.00 21.00 * T NA NA NA NA47010.0 Dominguez - H. Ford Bridge - Surface 1665 46 NA NA NA NA 61.00 21.00 * T40019.2 Inner Fish Harbor 56 2 73.00 4.50 * NT NA NA NA NA40019.1 Inner Fish Harbor 55 2 83.00 18.90 ns NT NA NA NA NA40007.2 Long Beach Harbor - Channel 2 20 3 88.00 11.50 ns NT NA NA NA NA40011.3 Inner Harbor - Channel 3 33 3 82.00 2.50 * NT NA NA NA NA40001.3 Southwest Slip 3 1 71.00 13.40 * NT NA NA NA NA44012.0 Port Hueneme - Wharf B 1626 45 NA NA NA NA 98.00 4.00 ns NT
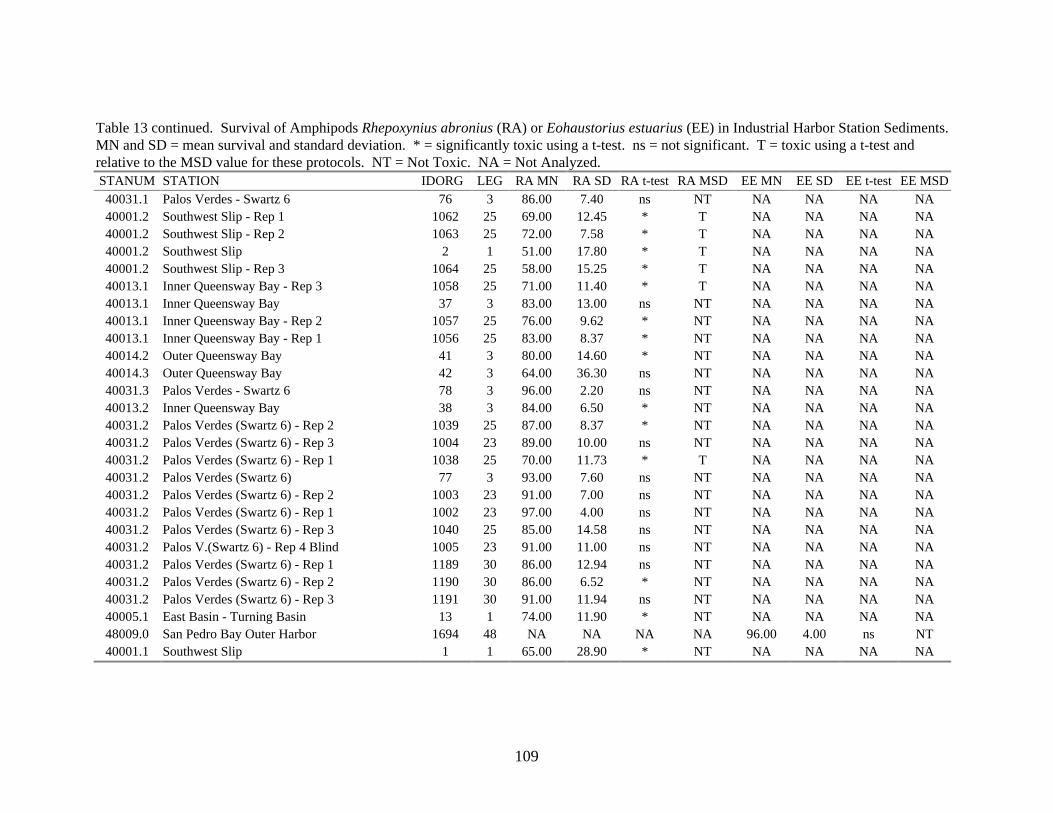
109
Table 13 continued. Survival of Amphipods Rhepoxynius abronius (RA) or Eohaustorius estuarius (EE) in Industrial Harbor Station Sediments. MN and SD = mean survival and standard deviation. * = significantly toxic using a t-test. ns = not significant. T = toxic using a t-test andrelative to the MSD value for these protocols. NT = Not Toxic. NA = Not Analyzed.STANUM STATION IDORG LEG RA MN RA SD RA t-test RA MSD EE MN EE SD EE t-test EE MSD40031.1 Palos Verdes - Swartz 6 76 3 86.00 7.40 ns NT NA NA NA NA40001.2 Southwest Slip - Rep 1 1062 25 69.00 12.45 * T NA NA NA NA40001.2 Southwest Slip - Rep 2 1063 25 72.00 7.58 * T NA NA NA NA40001.2 Southwest Slip 2 1 51.00 17.80 * T NA NA NA NA40001.2 Southwest Slip - Rep 3 1064 25 58.00 15.25 * T NA NA NA NA40013.1 Inner Queensway Bay - Rep 3 1058 25 71.00 11.40 * T NA NA NA NA40013.1 Inner Queensway Bay 37 3 83.00 13.00 ns NT NA NA NA NA40013.1 Inner Queensway Bay - Rep 2 1057 25 76.00 9.62 * NT NA NA NA NA40013.1 Inner Queensway Bay - Rep 1 1056 25 83.00 8.37 * NT NA NA NA NA40014.2 Outer Queensway Bay 41 3 80.00 14.60 * NT NA NA NA NA40014.3 Outer Queensway Bay 42 3 64.00 36.30 ns NT NA NA NA NA40031.3 Palos Verdes - Swartz 6 78 3 96.00 2.20 ns NT NA NA NA NA40013.2 Inner Queensway Bay 38 3 84.00 6.50 * NT NA NA NA NA40031.2 Palos Verdes (Swartz 6) - Rep 2 1039 25 87.00 8.37 * NT NA NA NA NA40031.2 Palos Verdes (Swartz 6) - Rep 3 1004 23 89.00 10.00 ns NT NA NA NA NA40031.2 Palos Verdes (Swartz 6) - Rep 1 1038 25 70.00 11.73 * T NA NA NA NA40031.2 Palos Verdes (Swartz 6) 77 3 93.00 7.60 ns NT NA NA NA NA40031.2 Palos Verdes (Swartz 6) - Rep 2 1003 23 91.00 7.00 ns NT NA NA NA NA40031.2 Palos Verdes (Swartz 6) - Rep 1 1002 23 97.00 4.00 ns NT NA NA NA NA40031.2 Palos Verdes (Swartz 6) - Rep 3 1040 25 85.00 14.58 ns NT NA NA NA NA40031.2 Palos V.(Swartz 6) - Rep 4 Blind 1005 23 91.00 11.00 ns NT NA NA NA NA40031.2 Palos Verdes (Swartz 6) - Rep 1 1189 30 86.00 12.94 ns NT NA NA NA NA40031.2 Palos Verdes (Swartz 6) - Rep 2 1190 30 86.00 6.52 * NT NA NA NA NA40031.2 Palos Verdes (Swartz 6) - Rep 3 1191 30 91.00 11.94 ns NT NA NA NA NA40005.1 East Basin - Turning Basin 13 1 74.00 11.90 * NT NA NA NA NA48009.0 San Pedro Bay Outer Harbor 1694 48 NA NA NA NA 96.00 4.00 ns NT40001.1 Southwest Slip 1 1 65.00 28.90 * NT NA NA NA NA

110
Table 13 continued. Survival of Amphipods Rhepoxynius abronius (RA) or Eohaustorius estuarius (EE) in Industrial Harbor Station Sediments. MN and SD =mean survival and standard deviation. * = significantly toxic using a t-test. ns = not significant. T = toxic using a t-test and relative to the MSD value for theseprotocols. NT = Not Toxic. NA = Not Analyzed.STANUM STATION IDORG LEG RA MN RA SD RA t-test RA MSD EE MN EE SD EE t-test EE MSD40004.2 Lower Main Channel 11 1 80.00 7.90 * NT NA NA NA NA40004.2 Lower Main Channel - Rep 3 832 20 93.00 8.00 ns NT NA NA NA NA40004.2 Lower Main Channel - Rep 2 831 20 91.00 12.00 ns NT NA NA NA NA40004.2 Lower Main Channel - Rep 1 830 20 91.00 4.00 ns NT NA NA NA NA40004.2 Lower Main Channel 789 18 68.00 18.20 * T NA NA NA NA40010.1 Off Cabrillo Beach - Rep 2 1069 26 48.00 11.51 * T NA NA NA NA40010.1 Off Cabrillo Beach - Rep 3 1070 26 46.00 16.36 * T NA NA NA NA40010.1 Off Cabrillo Beach - Rep 1 1068 26 80.00 16.96 * NT NA NA NA NA40010.1 Off Cabrillo Beach - Rep 1 1006 23 68.00 10.00 * NT NA NA NA NA40010.1 Off Cabrillo Beach 28 2 92.00 7.60 ns NT NA NA NA NA40010.1 Off Cabrillo Beach 136 4 89.00 14.30 ns NT NA NA NA NA40010.1 Off Cabrillo Beach 810 19 58.00 11.00 * T NA NA NA NA40010.1 Off Cabrillo Beach 1331 32 92.00 2.74 ns NT NA NA NA NA49005.0 Kaiser Intl. - Berth 48 1794 54 NA NA NA NA 96.00 4.00 ns NT40004.3 Lower Main Channel 12 1 81.00 9.60 * NT NA NA NA NA44013.0 Port Hueneme - Wharf #1 1627 45 NA NA NA NA 99.00 2.00 ns NT40010.3 Off Cabrillo Beach - Rep 2 1075 26 64.00 15.57 * T NA NA NA NA40010.3 Off Cabrillo Beach - Rep 1 1074 26 60.00 14.14 * T NA NA NA NA40010.3 Off Cabrillo Beach - Rep 3 1008 23 69.00 10.00 * NT NA NA NA NA40010.3 Off Cabrillo Beach 30 2 91.00 9.60 ns NT NA NA NA NA40010.3 Off Cabrillo Beach - Rep 3 1076 26 48.00 18.91 * T NA NA NA NA40010.3 Off Cabrillo Beach 138 4 84.00 5.50 * NT NA NA NA NA40010.3 Off Cabrillo Beach 1333 32 91.00 5.48 ns NT NA NA NA NA40011.1 Inner Harbor - Channel 3 31 3 85.00 6.90 ns NT NA NA NA NA40010.2 Off Cabrillo Beach - Rep 1 1071 26 78.00 13.04 * NT NA NA NA NA40010.2 Off Cabrillo Beach -Rep 2 1072 26 63.00 14.83 * T NA NA NA NA40010.2 Off Cabrillo Beach - Rep 2 1007 23 90.00 7.00 ns NT NA NA NA NA40010.2 Off Cabrillo Beach - Rep 3 1073 26 72.00 14.83 * NT NA NA NA NA

111
Table 13 continued. Survival of Amphipods Rhepoxynius abronius (RA) or Eohaustorius estuarius (EE) in Industrial Harbor Station Sediments. MN and SD =mean survival and standard deviation. * = significantly toxic using a t-test. ns = not significant. T = toxic using a t-test and relative to the MSD value for theseprotocols. NT = Not Toxic. NA = Not Analyzed.STANUM STATION IDORG LEG RA MN RA SD RA t-test RA MSD EE MN EE SD EE t-test EE MSD40010.2 Off Cabrillo Beach 29 2 88.00 9.10 ns NT NA NA NA NA40010.2 Off Cabrillo Beach 137 4 89.00 5.50 ns NT NA NA NA NA40010.2 Off Cabrillo Beach 1332 32 82.50 10.41 * NT NA NA NA NA40011.2 Inner Harbor - Channel 3 32 3 84.00 5.30 ns NT NA NA NA NA44011.0 Los Cerritos Channel Tidal P - Rep 3 1079 26 62.00 17.54 * T NA NA NA NA44011.0 Los Cerritos Channel Tidal P - Rep 1 1077 26 66.00 14.75 * NT NA NA NA NA44011.0 Los Cerritos Channel Tidal P - Rep 2 1078 26 62.00 18.23 * T NA NA NA NA44011.0 Los Cerritos Channel Tidal P 611 11 65.00 19.40 * T NA NA NA NA40033.1 Outer Harbor - POLA 10 82 1 71.00 20.40 * NT NA NA NA NA40018.3 Long Beach Outer Harbor – 18 - Rep 2 1042 25 70.00 10.61 * T NA NA NA NA40018.3 Long Beach Outer Harbor – 18 - Rep 3 886 22 89.00 4.00 * NT NA NA NA NA40018.3 Long Beach Outer Harbor – 18 - Rep 2 885 22 91.00 5.00 ns NT NA NA NA NA40018.3 Long Beach Outer Harbor – 18 - Rep 1 884 22 93.00 7.00 ns NT NA NA NA NA40018.3 Long Beach Outer Harbor – 18 - Rep 1 1041 25 56.00 15.97 * T NA NA NA NA40018.3 Long Beach Outer Harbor – 18 1695 48 NA NA NA NA 75.00 23.00 ns NT40018.3 Long Beach Outer Harbor – 18 - Rep 3 1043 25 72.00 13.04 * T NA NA NA NA40018.3 Long Beach Outer Harbor – 18 54 3 93.00 4.50 ns NT NA NA NA NA40018.3 Long Beach Outer Harbor – 18 - Rep 1 1192 30 88.00 7.58 * NT NA NA NA NA40018.3 Long Beach Outer Harbor – 18 - Rep 2 1193 30 89.00 5.48 * NT NA NA NA NA40018.3 Long Beach Outer Harbor – 18 - Rep 3 1194 30 81.00 12.45 * NT NA NA NA NA40018.3 Long Beach Outer Harbor – 18 1334 32 90.00 10.00 ns NT NA NA NA NA40018.3 Long Beach Outer Harbor – 18 1770 53 NA NA NA NA 59.00 30.00 * T40012.0 Southeast Basin 1632 45 NA NA NA NA 99.00 2.00 ns NT40020.2 Long Beach Outer Harbor - 20 1696 48 NA NA NA NA 81.00 15.00 * NT40012.1 Southeast Basin - Rep1 1047 25 39.00 15.17 * T NA NA NA NA40012.1 Southeast Basin - Rep2 1048 25 51.00 15.17 * T NA NA NA NA40012.1 Southeast Basin 34 2 77.00 14.00 * NT NA NA NA NA40012.1 Southeast Basin - Rep3 1049 25 66.00 4.18 * T NA NA NA NA

112
Table 13 continued. Survival of Amphipods Rhepoxynius abronius (RA) or Eohaustorius estuarius (EE) in Industrial Harbor Station Sediments. MN and SD =mean survival and standard deviation. * = significantly toxic using a t-test. ns = not significant. T = toxic using a t-test and relative to the MSD value for theseprotocols. NT = Not Toxic. NA = Not Analyzed.STANUM STATION IDORG LEG RA MN RA SD RA t-test RA MSD EE MN EE SD EE t-test EE MSD40012.1 Southeast Basin 812 19 34.00 21.00 * T NA NA NA NA40008.1 East Basin - Pier C 22 2 80.00 16.20 ns NT NA NA NA NA48010.0 Turning Basin 1697 48 NA NA NA NA 95.00 5.00 ns NT40017.3 Long Beach Channel - Rep 2 1060 25 47.00 17.89 * T NA NA NA NA40017.3 Long Beach Channel - Rep 1 1059 25 71.00 10.84 * T NA NA NA NA40017.3 Long Beach Channel - Rep 3 1061 25 61.00 8.22 * T NA NA NA NA40017.3 Long Beach Channel 51 3 88.00 8.40 ns NT NA NA NA NA40002.2 West Basin- Pier 143 5 1 78.00 13.00 * NT NA NA NA NA40016.3 Terminal Island Stp 48 2 80.00 12.70 * NT NA NA NA NA40012.2 Southeast Basin 35 2 78.00 13.50 * NT NA NA NA NA40009.0 West Basin Entrance 1699 48 NA NA NA NA 86.00 7.00 * NT40009.1 West Basin Entrance - Ref 1 834 20 97.00 4.00 ns NT NA NA NA NA40009.1 West Basin Entrance - Ref 3 836 20 91.00 7.00 ns NT NA NA NA NA40009.1 West Basin Entrance - Ref 2 835 20 86.00 10.00 ns NT NA NA NA NA40009.1 West Basin Entrance 25 2 88.00 5.70 ns NT NA NA NA NA40008.3 East Basin - Pier C 24 2 76.00 8.90 * NT NA NA NA NA40015.1 Fish Harbor Entrance 43 2 83.00 5.00 * NT NA NA NA NA40016.1 Terminal Island Stp 46 2 72.00 5.70 * NT NA NA NA NA40015.3 Fish Harbor Entrance 45 2 92.00 7.60 ns NT NA NA NA NA40003.1 Turning Basin - Pier 151 7 1 64.00 16.40 * NT NA NA NA NA40020.3 Long Beach Outer Harbor - 20 60 3 84.00 9.60 * NT NA NA NA NA40009.3 West Basin Entrance 27 2 87.00 5.70 ns NT NA NA NA NA40020.2 Long Beach Outer Harbor - 20 59 3 92.00 11.00 ns NT NA NA NA NA40015.1 Fish Harbor Entrance 1698 48 NA NA NA NA 89.00 10.00 ns NT40020.1 Long Beach Outer Harbor - 20 58 3 83.00 7.60 * NT NA NA NA NA40032.3 San Pedro Bay - POLA 19 105 2 86.00 15.20 ns NT NA NA NA NA40032.3 San Pedro Bay - POLA 19 81 1 93.00 2.70 ns NT NA NA NA NA40015.2 Fish Harbor Entrance 44 2 83.00 7.60 * NT NA NA NA NA

113
Table 13 continued. Survival of Amphipods Rhepoxynius abronius (RA) or Eohaustorius estuarius (EE) in Industrial Harbor Station Sediments. MN and SD =mean survival and standard deviation. * = significantly toxic using a t-test. ns = not significant. T = toxic using a t-test and relative to the MSD value for theseprotocols. NT = Not Toxic. NA = Not Analyzed.STANUM STATION IDORG LEG RA MN RA SD RA t-test RA MSD EE MN EE SD EE t-test EE MSD40003.2 Turning Basin, Pier 151 - Rep 3 1055 25 82.00 12.55 * NT NA NA NA NA40003.2 Turning Basin, Pier 151 - Rep 2 1054 25 91.00 6.52 ns NT NA NA NA NA40003.2 Turning Basin, Pier 151 8 1 63.00 29.90 * NT NA NA NA NA40003.2 Turning Basin, Pier 151 - Rep 1 1053 25 85.00 10.00 * NT NA NA NA NA40016.2 Terminal Island Stp 47 2 88.00 8.40 ns NT NA NA NA NA40030.1 San Pedro Breakwater 73 2 90.00 3.50 ns NT NA NA NA NA40030.2 San Pedro Breakwater 74 2 94.00 6.50 ns NT NA NA NA NA40032.1 San Pedro Bay - POLA 19 103 2 94.00 5.50 ns NT NA NA NA NA40032.2 San Pedro Bay - POLA 19 104 2 94.00 5.50 ns NT NA NA NA NA40002.1 West Basin - Pier 143 4 1 75.00 13.90 * NT NA NA NA NA40002.3 West Basin - Pier 143 6 1 74.00 10.80 * NT NA NA NA NA40003.3 Turning Basin - Pier 151 9 1 81.00 9.60 * NT NA NA NA NA40004.1 Lower Main Channel 10 1 78.00 6.70 * NT NA NA NA NA40005.2 East Basin - Turning Basin 14 1 73.00 7.60 * NT NA NA NA NA40005.3 East Basin - Turning Basin 15 1 79.00 15.60 ns NT NA NA NA NA40006.3 Consolidated Slip 18 1 67.00 11.50 * NT NA NA NA NA40032.1 San Pedro Bay - POLA 19 79 1 86.00 4.20 * NT NA NA NA NA40032.2 San Pedro Bay - POLA 19 80 1 85.00 9.40 ns NT NA NA NA NA40033.2 Outer Harbor - POLA 10 83 1 70.00 21.80 * NT NA NA NA NA40033.3 Outer Harbor - POLA 10 84 1 65.00 17.30 * NT NA NA NA NA40008.2 East Basin - Pier C 23 2 78.00 11.50 * NT NA NA NA NA40009.2 West Basin Entrance 26 2 81.00 2.20 * NT NA NA NA NA40012.3 Southeast Basin 36 2 69.00 16.40 * NT NA NA NA NA40030.3 San Pedro Breakwater 75 2 95.00 6.10 ns NT NA NA NA NA40007.1 Long Beach Harbor - Channel 2 19 3 82.00 10.40 * NT NA NA NA NA40007.3 Long Beach Harbor - Channel 2 21 3 78.00 14.40 * NT NA NA NA NA40013.3 Inner Queensway Bay 39 3 81.00 10.80 * NT NA NA NA NA40014.1 Outer Queensway Bay 40 3 78.00 10.40 * NT NA NA NA NA

114
Table 13 continued. Survival of Amphipods Rhepoxynius abronius (RA) or Eohaustorius estuarius (EE) in Industrial Harbor Station Sediments. MN and SD =mean survival and standard deviation. * = significantly toxic using a t-test. ns = not significant. T = toxic w/ t-test & MSD. NT = Not Toxic; NA = Not Anlyz.STANUM STATION IDORG LEG RA MN RA SD RA t-test RA MSD EE MN EE SD EE t-test EE MSD40017.1 Long Beach Channel 49 3 76.00 11.40 * NT NA NA NA NA40017.2 Long Beach Channel 50 3 82.00 9.70 * NT NA NA NA NA40018.1 Long Beach Outer Harbor - 18 52 3 67.00 14.40 * T NA NA NA NA40018.2 Long Beach Outer Harbor - 18 53 3 79.00 11.40 * NT NA NA NA NA44012.0 Port Hueneme - Wharf B 612 11 70.00 15.40 * T NA NA NA NA44013.0 Port Hueneme - Wharf #1 613 11 73.00 11.50 * T NA NA NA NA40009.1 West Basin Entrance 790 18 60.00 18.40 * T NA NA NA NA40013.1 Inner Queensway Bay 791 18 50.00 19.00 * T NA NA NA NA40015.3 Fish Harbor Entrance 792 18 75.00 21.50 ns NT NA NA NA NA40016.2 Terminal Island Stp 793 18 63.00 28.00 * T NA NA NA NA40017.3 Long Beach Channel 811 19 54.00 26.30 * T NA NA NA NA44055.0 L.B. Naval Station - Pier 3 - Rep 1 1198 30 77.00 13.51 * NT NA NA NA NA44055.0 L.B. Naval Station - Pier 3 - Rep 2 1199 30 86.00 6.52 * NT NA NA NA NA44055.0 L.B. Naval Station - Pier 3 - Rep 3 1200 30 82.00 2.74 * NT NA NA NA NA46001.0 Hugo Neuproler - #1 1623 45 NA NA NA NA 95.00 6.00 ns NT46002.0 Hugo Neuproler - #2 1624 45 NA NA NA NA 98.00 3.00 ns NT46003.0 Hugo Neuproler - #3 1625 45 NA NA NA NA 92.00 6.00 * NT47003.0 Consolidated Slip – 200B - Depth 2 1654 46 NA NA NA NA 8.00 12.00 * T47005.0 Consolidated Slip – 200T - Surface 1659 46 NA NA NA NA 0.00 0.00 * T47005.0 Consolidated Slip – 200T - Depth 2 1660 46 NA NA NA NA 18.00 40.00 * T47005.0 Consolidated Slip – 200T - Depth 3 1661 46 NA NA NA NA 13.00 29.00 * T48009.0 San Pedro Bay Outer Harbor 1769 53 NA NA NA NA 85.00 10.00 * NT40020.2 Long Beach Outer Harbor - 20 1771 53 NA NA NA NA 85.00 13.00 * NT48010.0 Turning Basin 1772 53 NA NA NA NA 69.00 43.00 ns NT40015.1 Fish Harbor Entrance 1773 53 NA NA NA NA 72.00 19.00 * T40009.0 West Basin Entrance 1774 53 NA NA NA NA 74.00 12.00 * NT49001.0 Cabrillo Beach Pier - West 1778 53 NA NA NA NA NA NA NA NA49002.0 Cabrillo Beach Pier - Central 1779 53 NA NA NA NA NA NA NA NA49003.0 Cabrillo Beach Pier - East 1780 53 NA NA NA NA NA NA NA NA

115
Table 14a. Development of abalone embryos (Haliotis rufescens) in Industrial Harborstation pore waters (100% concentration). HRP 100 MN = Mean percent normaldevelopment of Haliotis rufescens in 100% pore water. SD = Standard Deviation. * =Significantly Toxic using a t-test. T= Toxic using a t-test and relative to the MSD criteriafor this protocol. NT = Not toxic. NA = Not Analyzed.
STANUM STATION IDORG LEG HRP HRP HRP HRP100 MN 100 SD 100 t-test 100 MSD
47004.0 Consolidated Slip - 200E - Depth 2 1657 46 NA NA NA NA47004.0 Consolidated Slip - 200E - Surface 1656 46 NA NA NA NA49004.0 Kaiser Intl.- Berth 49 1793 54 NA NA NA NA40006.1 Consolidated Slip - Rep 1 1050 25 NA NA NA NA40006.1 Consolidated Slip - Rep 2 1051 25 NA NA NA NA40006.1 Consolidated Slip - Rep 3 1052 25 NA NA NA NA40006.1 Consolidated Slip 16 1 0.00 0.00 * T47002.0 Consolidated Slip – 200 – Surface 1650 46 NA NA NA NA47002.0 Consolidated Slip – 200 – Depth 2 1651 46 NA NA NA NA47009.0 Consolidated Slip – 200G – Surface 1664 46 NA NA NA NA47003.0 Consolidated Slip – 200B – Surface 1653 46 NA NA NA NA47008.0 Consolidated Slip – Storm Drain 1663 46 NA NA NA NA47001.0 Consolidated Slip – 198 – Surface 1647 46 NA NA NA NA47001.0 Consolidated Slip – 198 – Dept h 2 1648 46 NA NA NA NA40006.2 Consolidated Slip 17 1 0.00 0.00 * T47007.0 Consolidated Slip – End - Surface 1662 46 NA NA NA NA40019.3 Inner Fish Harbor 57 2 0.00 0.00 * T47010.0 Dominguez - H. Ford Bridge – Surface 1665 46 NA NA NA NA40019.2 Inner Fish Harbor 56 2 88.60 6.10 ns NT40019.1 Inner Fish Harbor 55 2 0.00 0.00 * T40007.2 Long Beach Harbor - Channel 2 20 3 0.00 0.00 * T40011.3 Inner Harbor - Channel 3 33 3 0.00 0.00 * T40001.3 Southwest Slip 3 1 0.70 0.60 * T44012.0 Port Hueneme - Wharf B 1626 45 NA NA NA NA40031.1 Palos Verdes - Swartz 6 76 3 0.00 0.00 * T40001.2 Southwest Slip – Rep 1 1062 25 NA NA NA NA40001.2 Southwest Slip – Rep 2 1063 25 NA NA NA NA40001.2 Southwest Slip 2 1 81.40 7.90 * NT40001.2 Southwest Slip – Rep 3 1064 25 NA NA NA NA40013.1 Inner Queensway Bay - Rep 3 1058 25 NA NA NA NA40013.1 Inner Queensway Bay 37 3 0.00 0.00 * T40013.1 Inner Queensway Bay - Rep 2 1057 25 NA NA NA NA40013.1 Inner Queensway Bay - Rep 1 1056 25 NA NA NA NA40014.2 Outer Queensway Bay 41 3 0.00 0.00 * T40014.3 Outer Queensway Bay 42 3 0.00 0.00 * T40031.3 Palos Verdes - Swartz 6 78 3 55.60 26.70 * NT40013.2 Inner Queensway Bay 38 3 0.00 0.00 * T40031.2 Palos Verdes (Swartz 6) - Rep 2 1039 25 NA NA NA NA40031.2 Palos Verdes (Swartz 6) - Rep 3 1004 23 NA NA NA NA

116
Table 14a continued. Development of abalone embryos (Haliotis rufescens) in Industrial Harborstation pore waters (100% concentration). HRP 100 MN = Mean percent normal development ofHaliotis rufescens in 100% pore water. SD = Standard Deviation. * = Significantly Toxic usinga t-test. T= Toxic using a t-test and relative to the MSD criteria for this protocol. NT = Nottoxic. NA = Not Analyzed.STANUM STATION IDORG LEG HRP HRP HRP HRP
100 MN 100 SD 100 t-test 100 MSD
40031.2 Palos Verdes (Swartz 6) – Rep 1 1038 25 NA NA NA NA40031.2 Palos Verdes (Swartz 6) 77 3 0.00 0.00 * T40031.2 Palos Verdes (Swartz 6) – Rep 2 1003 23 NA NA NA NA40031.2 Palos Verdes (Swartz 6) – Rep 1 1002 23 NA NA NA NA40031.2 Palos Verdes (Swartz 6) – Rep 3 1040 25 NA NA NA NA40031.2 Palos V.(Swartz 6) - Rep 4 Blind 1005 23 NA NA NA NA40031.2 Palos Verdes (Swartz 6) – Rep 1 1189 30 NA NA NA NA40031.2 Palos Verdes (Swartz 6) – Rep 2 1190 30 NA NA NA NA40031.2 Palos Verdes (Swartz 6) – Rep 3 1191 30 NA NA NA NA40005.1 East Basin - Turning Basin 13 1 0.00 0.00 * T48009.0 San Pedro Bay Outer Harbor 1694 48 NA NA NA NA40001.1 Southwest Slip 1 1 72.30 15.90 ns NT40004.2 Lower Main Channel 11 1 69.10 29.80 ns NT40004.2 Lower Main Channel - Rep 3 832 20 NA NA NA NA40004.2 Lower Main Channel - Rep 2 831 20 NA NA NA NA40004.2 Lower Main Channel - Rep 1 830 20 NA NA NA NA40004.2 Lower Main Channel 789 18 NA NA NA NA40010.1 Off Cabrillo Beach - Rep 2 1069 26 NA NA NA NA40010.1 Off Cabrillo Beach - Rep 3 1070 26 NA NA NA NA40010.1 Off Cabrillo Beach - Rep 1 1068 26 NA NA NA NA40010.1 Off Cabrillo Beach - Rep 1 1006 23 NA NA NA NA40010.1 Off Cabrillo Beach 28 2 92.70 3.40 ns NT40010.1 Off Cabrillo Beach 136 4 1.70 2.90 * T40010.1 Off Cabrillo Beach 810 19 NA NA NA NA40010.1 Off Cabrillo Beach 1331 32 NA NA NA NA49005.0 Kaiser Intl.- Berth 48 1794 54 NA NA NA NA40004.3 Lower Main Channel 12 1 78.70 28.20 ns NT44013.0 Port Hueneme - Wharf #1 1627 45 NA NA NA NA40010.3 Off Cabrillo Beach - Rep 2 1075 26 NA NA NA NA40010.3 Off Cabrillo Beach - Rep 1 1074 26 NA NA NA NA40010.3 Off Cabrillo Beach - Rep 3 1008 23 NA NA NA NA40010.3 Off Cabrillo Beach 30 2 95.60 2.40 ns NT40010.3 Off Cabrillo Beach - Rep 3 1076 26 NA NA NA NA40010.3 Off Cabrillo Beach 138 4 0.00 0.00 * T40010.3 Off Cabrillo Beach 1333 32 NA NA NA NA40011.1 Inner Harbor - Channel 3 31 3 0.00 0.00 * T40010.2 Off Cabrillo Beach - Rep 1 1071 26 NA NA NA NA40010.2 Off Cabrillo Beach - Rep 2 1072 26 NA NA NA NA40010.2 Off Cabrillo Beach - Rep 2 1007 23 NA NA NA NA40010.2 Off Cabrillo Beach - Rep 3 1073 26 NA NA NA NA

117
Table 14a continued. Development of abalone embryos (Haliotis rufescens) in Industrial Harborstation pore waters (100% concentration). HRP 100 MN = Mean percent normal development ofHaliotis rufescens in 100% pore water. SD = Standard Deviation. * = Significantly Toxic usinga t-test. T= Toxic using a t-test and relative to the MSD criteria for this protocol. NT = Nottoxic. NA = Not Analyzed.
STANUM STATION IDORG LEG HRP HRP HRP HRP100 MN 100 SD 100 t-test 100 MSD
40010.2 Off Cabrillo Beach 29 2 93.80 1.80 ns NT40010.2 Off Cabrillo Beach 137 4 0.00 0.00 * T40010.2 Off Cabrillo Beach 1332 32 NA NA NA NA40011.2 Inner Harbor - Channel 3 32 3 0.00 0.00 * T44011.0 Los Cerritos Channel Tidal P - Rep3 1079 26 NA NA NA NA44011.0 Los Cerritos Channel Tidal P - Rep1 1077 26 NA NA NA NA44011.0 Los Cerritos Channel Tidal P - Rep2 1078 26 NA NA NA NA44011.0 Los Cerritos Channel Tidal P 611 11 NA NA NA NA40033.1 Outer Harbor - POLA 10 82 1 0.70 1.30 * T40018.3 Long Beach Outer Harbor – 18 - Rep2 1042 25 NA NA NA NA40018.3 Long Beach Outer Harbor – 18 - Rep 3 886 22 NA NA NA NA40018.3 Long Beach Outer Harbor – 18 - Rep 2 885 22 NA NA NA NA40018.3 Long Beach Outer Harbor – 18 - Rep 1 884 22 NA NA NA NA40018.3 Long Beach Outer Harbor – 18 - Rep1 1041 25 NA NA NA NA40018.3 Long Beach Outer Harbor – 18 1695 48 NA NA NA NA40018.3 Long Beach Outer Harbor – 18 - Rep3 1043 25 NA NA NA NA40018.3 Long Beach Outer Harbor – 18 54 3 92.30 4.40 ns NT40018.3 Long Beach Outer Harbor – 18 - Rep 1 1192 30 NA NA NA NA40018.3 Long Beach Outer Harbor – 18 - Rep 2 1193 30 NA NA NA NA40018.3 Long Beach Outer Harbor – 18 - Rep 3 1194 30 NA NA NA NA40018.3 Long Beach Outer Harbor – 18 1334 32 NA NA NA NA40018.3 Long Beach Outer Harbor – 18 1770 53 NA NA NA NA40012.0 Southeast Basin 1632 45 NA NA NA NA40020.2 Long Beach Outer Harbor- 20 1696 48 NA NA NA NA40012.1 Southeast Basin - Rep1 1047 25 NA NA NA NA40012.1 Southeast Basin - Rep2 1048 25 NA NA NA NA40012.1 Southeast Basin 34 2 23.50 37.40 * T40012.1 Southeast Basin - Rep3 1049 25 NA NA NA NA40012.1 Southeast Basin 812 19 NA NA NA NA40008.1 East Basin - Pier C 22 2 93.10 1.30 ns NT48010.0 Turning Basin 1697 48 NA NA NA NA40017.3 Long Beach Channel - Rep 2 1060 25 NA NA NA NA40017.3 Long Beach Channel - Rep 1 1059 25 NA NA NA NA40017.3 Long Beach Channel - Rep 3 1061 25 NA NA NA NA40017.3 Long Beach Channel 51 3 50.70 7.50 * T40002.2 West Basin - Pier 143 5 1 0.00 0.00 * T40016.3 Terminal Island Stp 48 2 94.50 1.40 ns NT40012.2 Southeast Basin 35 2 94.30 2.20 ns NT40009.0 West Basin Entrance 1699 48 NA NA NA NA

118
Table 14a continued. Development of abalone embryos (Haliotis rufescens) in Industrial Harborstation pore waters (100% concentration). HRP 100 MN = Mean percent normal development ofHaliotis rufescens in 100% pore water. SD = Standard Deviation. * = Significantly Toxic usinga t-test. T= Toxic using a t-test and relative to the MSD criteria for this protocol. NT = Nottoxic. NA = Not Analyzed.
STANUM STATION IDORG LEG HRP HRP HRP HRP100 MN 100 SD 100 t-test 100 MSD
40009.1 West Basin Entrance - Ref 1 834 20 NA NA NA NA40009.1 West Basin Entrance - Ref 3 836 20 NA NA NA NA40009.1 West Basin Entrance - Ref 2 835 20 NA NA NA NA40009.1 West Basin Entrance 25 2 1.10 1.10 * T40008.3 East Basin - Pier C 24 2 0.00 0.00 * T40015.1 Fish Harbor Entrance 43 2 51.30 24.00 * T40016.1 Terminal Island Stp 46 2 91.60 2.50 * NT40015.3 Fish Harbor Entrance 45 2 9.80 9.50 * T40003.1 Turning Basin - Pier 151 7 1 0.00 0.00 * T40020.3 Long Beach Outer Harbor - 20 60 3 24.20 18.30 * T40009.3 West Basin Entrance 27 2 0.00 0.00 * T40020.2 Long Beach Outer Harbor - 20 59 3 0.00 0.00 * T40015.1 Fish Harbor Entrance 1698 48 NA NA NA NA40020.1 Long Beach Outer Harbor - 20 58 3 0.00 0.00 * T40032.3 San Pedro Bay – POLA 19 105 2 0.00 0.00 * T40032.3 San Pedro Bay – POLA 19 81 1 0.00 0.00 * T40015.2 Fish Harbor Entrance 44 2 34.90 21.30 * T40003.2 Turning Basin, Pier 151 - Rep 3 1055 25 NA NA NA NA40003.2 Turning Basin, Pier 151 - Rep 2 1054 25 NA NA NA NA40003.2 Turning Basin, Pier 151 8 1 1.50 2.60 * T40003.2 Turning Basin, Pier 151 - Rep 1 1053 25 NA NA NA NA40016.2 Terminal Island Stp 47 2 71.20 27.10 ns NT40030.1 San Pedro Breakwater 73 2 0.00 0.00 * T40030.2 San Pedro Breakwater 74 2 0.00 0.00 * T40032.1 San Pedro Bay - POLA 19 103 2 0.00 0.00 * T40032.2 San Pedro Bay - POLA 19 104 2 0.00 0.00 * T40002.1 West Basin - Pier 143 4 1 0.00 0.00 * T40002.3 West Basin - Pier 143 6 1 0.00 0.00 * T40003.3 Turning Basin - Pier 151 9 1 23.30 38.70 * T40004.1 Lower Main Channel 10 1 26.20 33.50 * T40005.2 East Basin - Turning Basin 14 1 0.70 1.30 * T40005.3 East Basin - Turning Basin 15 1 0.00 0.00 * T40006.3 Consolidated Slip 18 1 0.00 0.00 * T40032.1 San Pedro Bay - POLA 19 79 1 65.70 23.90 ns NT40032.2 San Pedro Bay - POLA 19 80 1 30.70 53.10 ns NT40033.2 Outer Harbor - POLA 10 83 1 8.80 10.20 * T40033.3 Outer Harbor - POLA 10 84 1 3.30 5.70 * T40008.2 East Basin - Pier C 23 2 2.80 2.50 * T40009.2 West Basin Entrance 26 2 0.00 0.00 * T

119
Table 14a continued. Development of abalone embryos (Haliotis rufescens) in Industrial Harborstation pore waters (100% concentration). HRP 100 MN = Mean percent normal development ofHaliotis rufescens in 100% pore water. SD = Standard Deviation. * = Significantly Toxic usinga t-test. T= Toxic using a t-test and relative to the MSD criteria for this protocol. NT = Nottoxic. NA = Not Analyzed.
STANUM STATION IDORG LEG HRP HRP HRP HRP100 MN 100 SD 100 t-test 100 MSD
40012.3 Southeast Basin 36 2 7.50 12.20 * T40030.3 San Pedro Breakwater 75 2 0.00 0.00 * T40007.1 Long Beach Harbor - Channel 2 19 3 0.00 0.00 * T40007.3 Long Beach Harbor - Channel 2 21 3 0.00 0.00 * T40013.3 Inner Queensway Bay 39 3 5.50 7.70 * T40014.1 Outer Queensway Bay 40 3 0.00 0.00 * T40017.1 Long Beach Channel 49 3 0.00 0.00 * T40017.2 Long Beach Channel 50 3 20.60 8.90 * T40018.1 Long Beach Outer Harbor - 18 52 3 0.00 0.00 * T40018.2 Long Beach Outer Harbor - 18 53 3 0.00 0.00 * T44012.0 Port Hueneme - Wharf B 612 11 NA NA NA NA44013.0 Port Hueneme - Wharf #1 613 11 NA NA NA NA40009.1 West Basin Entrance 790 18 NA NA NA NA40013.1 Inner Queensway Bay 791 18 NA NA NA NA40015.3 Fish Harbor Entrance 792 18 NA NA NA NA40016.2 Terminal Island Stp 793 18 NA NA NA NA40017.3 Long Beach Channel 811 19 NA NA NA NA44055.0 L.B. Naval Station - Pier 3 - Rep 1 1198 30 NA NA NA NA44055.0 L.B. Naval Station - Pier 3 - Rep 2 1199 30 NA NA NA NA44055.0 L.B. Naval Station - Pier 3 - Rep 3 1200 30 NA NA NA NA46001.0 Hugo Neuproler - #1 1623 45 NA NA NA NA46002.0 Hugo Neuproler - #2 1624 45 NA NA NA NA46003.0 Hugo Neuproler - #3 1625 45 NA NA NA NA47003.0 Consolidated Slip – 200B - Depth 2 1654 46 NA NA NA NA47005.0 Consolidated Slip – 200T - Surface 1659 46 NA NA NA NA47005.0 Consolidated Slip – 200T - Depth 2 1660 46 NA NA NA NA47005.0 Consolidated Slip – 200T - Depth 3 1661 46 NA NA NA NA48009.0 San Pedro Bay Outer Harbor 1769 53 NA NA NA NA40020.2 Long Beach Outer Harbor - 20 1771 53 NA NA NA NA48010.0 Turning Basin 1772 53 NA NA NA NA40015.1 Fish Harbor Entrance 1773 53 NA NA NA NA40009.0 West Basin Entrance 1774 53 NA NA NA NA49001.0 Cabrillo Beach Pier - West 1778 53 NA NA NA NA49002.0 Cabrillo Beach Pier - Central 1779 53 NA NA NA NA49003.0 Cabrillo Beach Pier - East 1780 53 NA NA NA NA

120
Table 14b. Development of abalone embryos (Haliotis rufescens) in Industrial Harborstation pore waters (50% concentration). HRP 50 MN = Mean percent normaldevelopment of Haliotis rufescens in 50% pore water. SD = Standard Deviation. * =Significantly Toxic using a t-test. T= Toxic using a t-test and relative to the MSD criteriafor this protocol. NT = Not toxic. NA = Not Analyzed.
STANUM STATION IDORG LEG HRP HRP HRP HRP50 MN 50 SD 50 t-test 50 MSD
47004.0 Consolidated Slip - 200E - Depth 2 1657 46 NA NA NA NA47004.0 Consolidated Slip - 200E - Surface 1656 46 NA NA NA NA49004.0 Kaiser Intl. - Berth 49 1793 54 NA NA NA NA40006.1 Consolidated Slip - Rep 1 1050 25 NA NA NA NA40006.1 Consolidated Slip - Rep 2 1051 25 NA NA NA NA40006.1 Consolidated Slip - Rep 3 1052 25 NA NA NA NA40006.1 Consolidated Slip 16 1 90.30 4.50 ns NT47002.0 Consolidated Slip – 200 - Surface 1650 46 NA NA NA NA47002.0 Consolidated Slip – 200 - Depth 2 1651 46 NA NA NA NA47009.0 Consolidated Slip – 200G - Surface 1664 46 NA NA NA NA47003.0 Consolidated Slip – 200B - Surface 1653 46 NA NA NA NA47008.0 Consolidated Slip - Storm Drain 1663 46 NA NA NA NA47001.0 Consolidated Slip – 198 - Surface 1647 46 NA NA NA NA47001.0 Consolidated Slip – 198 - Depth 2 1648 46 NA NA NA NA40006.2 Consolidated Slip 17 1 0.00 0.00 * T47007.0 Consolidated Slip – End - Surface 1662 46 NA NA NA NA40019.3 Inner Fish Harbor 57 2 0.00 0.00 * T47010.0 Dominguez - H. Ford Bridge - Surface 1665 46 NA NA NA NA40019.2 Inner Fish Harbor 56 2 95.80 1.60 ns NT40019.1 Inner Fish Harbor 55 2 0.00 0.00 * T40007.2 Long Beach Harbor - Channel 2 20 3 0.40 0.70 * T40011.3 Inner Harbor - Channel 3 33 3 0.00 0.00 * T40001.3 Southwest Slip 3 1 40.70 24.20 * T44012.0 Port Hueneme - Wharf B 1626 45 NA NA NA NA40031.1 Palos Verdes - Swartz 6 76 3 88.10 3.20 ns NT40001.2 Southwest Slip - Rep 1 1062 25 NA NA NA NA40001.2 Southwest Slip - Rep 2 1063 25 NA NA NA NA40001.2 Southwest Slip 2 1 86.60 8.40 ns NT40001.2 Southwest Slip - Rep 3 1064 25 NA NA NA NA40013.1 Inner Queensway Bay - Rep 3 1058 25 NA NA NA NA40013.1 Inner Queensway Bay 37 3 89.40 0.80 ns NT40013.1 Inner Queensway Bay - Rep 2 1057 25 NA NA NA NA40013.1 Inner Queensway Bay - Rep 1 1056 25 NA NA NA NA40014.2 Outer Queensway Bay 41 3 0.00 0.00 * T40014.3 Outer Queensway Bay 42 3 90.40 5.10 ns NT40031.3 Palos Verdes - Swartz 6 78 3 72.00 1.70 * T40013.2 Inner Queensway Bay 38 3 87.10 2.10 * NT40031.2 Palos Verdes (Swartz 6) - Rep 2 1039 25 NA NA NA NA40031.2 Palos Verdes (Swartz 6) - Rep 3 1004 23 NA NA NA NA

121
Table 14b continued. Development of abalone embryos (Haliotis rufescens) in Industrial Harborstation pore waters (50% concentration). HRP 50 MN = Mean percent normal development ofHaliotis rufescens in 50% pore water. SD = Standard Deviation. * = Significantly Toxic using at-test. T= Toxic using a t-test and relative to the MSD criteria for this protocol. NT = Not toxic. NA = Not Analyzed.
STANUM STATION IDORG LEG HRP HRP HRP HRP50 MN 50 SD 50 t-test 50 MSD
40031.2 Palos Verdes (Swartz 6) - Rep 1 1038 25 NA NA NA NA40031.2 Palos Verdes (Swartz 6) 77 3 90.30 3.80 ns NT40031.2 Palos Verdes (Swartz 6) - Rep 2 1003 23 NA NA NA NA40031.2 Palos Verdes (Swartz 6) - Rep 1 1002 23 NA NA NA NA40031.2 Palos Verdes (Swartz 6) - Rep 3 1040 25 NA NA NA NA40031.2 Palos V.(Swartz 6) – Rep 4 Blind 1005 23 NA NA NA NA40031.2 Palos Verdes (Swartz 6) - Rep 1 1189 30 NA NA NA NA40031.2 Palos Verdes (Swartz 6) - Rep 2 1190 30 NA NA NA NA40031.2 Palos Verdes (Swartz 6) - Rep 3 1191 30 NA NA NA NA40005.1 East Basin - Turning Basin 13 1 41.90 42.10 ns NT48009.0 San Pedro Bay Outer Harbor 1694 48 NA NA NA NA40001.1 Southwest Slip 1 1 92.50 2.90 ns NT40004.2 Lower Main Channel 11 1 94.60 0.90 ns NT40004.2 Lower Main Channel - Rep 3 832 20 NA NA NA NA40004.2 Lower Main Channel - Rep 2 831 20 NA NA NA NA40004.2 Lower Main Channel - Rep 1 830 20 NA NA NA NA40004.2 Lower Main Channel 789 18 NA NA NA NA40010.1 Off Cabrillo Beach - Rep 2 1069 26 NA NA NA NA40010.1 Off Cabrillo Beach - Rep 3 1070 26 NA NA NA NA40010.1 Off Cabrillo Beach - Rep 1 1068 26 NA NA NA NA40010.1 Off Cabrillo Beach - Rep 1 1006 23 NA NA NA NA40010.1 Off Cabrillo Beach 28 2 96.40 1.20 ns NT40010.1 Off Cabrillo Beach 136 4 2.20 0.90 * T40010.1 Off Cabrillo Beach 810 19 NA NA NA NA40010.1 Off Cabrillo Beach 1331 32 NA NA NA NA49005.0 Kaiser Intl. - Berth 48 1794 54 NA NA NA NA40004.3 Lower Main Channel 12 1 91.30 2.90 ns NT44013.0 Port Hueneme - Wharf #1 1627 45 NA NA NA NA40010.3 Off Cabrillo Beach - Rep 2 1075 26 NA NA NA NA40010.3 Off Cabrillo Beach - Rep 1 1074 26 NA NA NA NA40010.3 Off Cabrillo Beach - Rep 3 1008 23 NA NA NA NA40010.3 Off Cabrillo Beach 30 2 93.00 0.70 ns NT40010.3 Off Cabrillo Beach - Rep 3 1076 26 NA NA NA NA40010.3 Off Cabrillo Beach 138 4 7.10 3.50 * T40010.3 Off Cabrillo Beach 1333 32 NA NA NA NA40011.1 Inner Harbor - Channel 3 31 3 75.10 12.00 ns NT40010.2 Off Cabrillo Beach - Rep 1 1071 26 NA NA NA NA40010.2 Off Cabrillo Beach - Rep 2 1072 26 NA NA NA NA40010.2 Off Cabrillo Beach - Rep 2 1007 23 NA NA NA NA

122
Table 14b continued. Development of abalone embryos (Haliotis rufescens) in Industrial Harborstation pore waters (50% concentration). HRP 50 MN = Mean percent normal development ofHaliotis rufescens in 50% pore water. SD = Standard Deviation. * = Significantly Toxic using at-test. T= Toxic using a t-test and relative to the MSD criteria for this protocol. NT = Not toxic. NA = Not Analyzed.
STANUM STATION IDORG LEG HRP HRP HRP HRP50 MN 50 SD 50 t-test 50 MSD
40010.2 Off Cabrillo Beach - Rep 3 1073 26 NA NA NA NA40010.2 Off Cabrillo Beach 29 2 96.70 2.90 ns NT40010.2 Off Cabrillo Beach 137 4 1.00 1.80 * T40010.2 Off Cabrillo Beach 1332 32 NA NA NA NA40011.2 Inner Harbor - Channel 3 32 3 0.00 0.00 * T44011.0 Los Cerritos Channel Tidal P - Rep3 1079 26 NA NA NA NA44011.0 Los Cerritos Channel Tidal P - Rep1 1077 26 NA NA NA NA44011.0 Los Cerritos Channel Tidal P - Rep2 1078 26 NA NA NA NA44011.0 Los Cerritos Channel Tidal P 611 11 NA NA NA NA40033.1 Outer Harbor - POLA 10 82 1 0.00 0.00 * T40018.3 Long Beach Outer Harbor - 18 - Rep2 1042 25 NA NA NA NA40018.3 Long Beach Outer Harbor - 18 - Rep 3 886 22 NA NA NA NA40018.3 Long Beach Outer Harbor - 18 - Rep 2 885 22 NA NA NA NA40018.3 Long Beach Outer Harbor - 18 - Rep 1 884 22 NA NA NA NA40018.3 Long Beach Outer Harbor - 18 - Rep1 1041 25 NA NA NA NA40018.3 Long Beach Outer Harbor – 18 1695 48 NA NA NA NA40018.3 Long Beach Outer Harbor - 18 - Rep3 1043 25 NA NA NA NA40018.3 Long Beach Outer Harbor – 18 54 3 91.40 2.50 ns NT40018.3 Long Beach Outer Harbor - 18 - Rep 1 1192 30 NA NA NA NA40018.3 Long Beach Outer Harbor - 18 - Rep 2 1193 30 NA NA NA NA40018.3 Long Beach Outer Harbor - 18 - Rep 3 1194 30 NA NA NA NA40018.3 Long Beach Outer Harbor – 18 1334 32 NA NA NA NA40018.3 Long Beach Outer Harbor – 18 1770 53 NA NA NA NA40012.0 Southeast Basin 1632 45 NA NA NA NA40020.2 Long Beach Outer Harbor - 20 1696 48 NA NA NA NA40012.1 Southeast Basin – Rep 1 1047 25 NA NA NA NA40012.1 Southeast Basin – Rep 2 1048 25 NA NA NA NA40012.1 Southeast Basin 34 2 94.20 4.60 ns NT40012.1 Southeast Basin – Rep 3 1049 25 NA NA NA NA40012.1 Southeast Basin 812 19 NA NA NA NA40008.1 East Basin - Pier C 22 2 0.30 0.50 * T48010.0 Turning Basin 1697 48 NA NA NA NA40017.3 Long Beach Channel - Rep 2 1060 25 NA NA NA NA40017.3 Long Beach Channel - Rep 1 1059 25 NA NA NA NA40017.3 Long Beach Channel - Rep 3 1061 25 NA NA NA NA40017.3 Long Beach Channel 51 3 90.20 1.40 ns NT40002.2 West Basin - Pier 143 5 1 0.00 0.00 * T40016.3 Terminal Island Stp 48 2 96.60 0.50 ns NT40012.2 Southeast Basin 35 2 96.80 0.60 ns NT

123
Table 14b continued. Development of abalone embryos (Haliotis rufescens) in Industrial Harborstation pore waters (50% concentration). HRP 50 MN = Mean percent normal development ofHaliotis rufescens in 50% pore water. SD = Standard Deviation. * = Significantly Toxic using at-test. T= Toxic using a t-test and relative to the MSD criteria for this protocol. NT = Not toxic. NA = Not Analyzed.
STANUM STATION IDORG LEG HRP HRP HRP HRP50 MN 50 SD 50 t-test 50 MSD
40009.0 West Basin Entrance 1699 48 NA NA NA NA40009.1 West Basin Entrance - Ref 1 834 20 NA NA NA NA40009.1 West Basin Entrance - Ref 3 836 20 NA NA NA NA40009.1 West Basin Entrance - Ref 2 835 20 NA NA NA NA40009.1 West Basin Entrance 25 2 95.30 1.60 ns NT40008.3 East Basin - Pier C 24 2 93.20 3.70 ns NT40015.1 Fish Harbor Entrance 43 2 97.90 2.20 ns NT40016.1 Terminal Island Stp 46 2 97.70 1.40 ns NT40015.3 Fish Harbor Entrance 45 2 95.80 0.80 ns NT40003.1 Turning Basin - Pier 151 7 1 63.20 24.10 ns NT40020.3 Long Beach Outer Harbor - 20 60 3 88.70 0.60 ns NT40009.3 West Basin Entrance 27 2 96.80 0.60 ns NT40020.2 Long Beach Outer Harbor - 20 59 3 14.60 4.10 * T40015.1 Fish Harbor Entrance 1698 48 NA NA NA NA40020.1 Long Beach Outer Harbor - 20 58 3 6.30 11.00 * T40032.3 San Pedro Bay - POLA 19 105 2 0.00 0.00 * T40032.3 San Pedro Bay - POLA 19 81 1 15.00 7.80 * T40015.2 Fish Harbor Entrance 44 2 95.90 0.30 ns NT40003.2 Turning Basin, Pier 151 - Rep 3 1055 25 NA NA NA NA40003.2 Turning Basin, Pier 151 - Rep 2 1054 25 NA NA NA NA40003.2 Turning Basin, Pier 151 8 1 97.90 1.40 ns NT40003.2 Turning Basin, Pier 151 - Rep 1 1053 25 NA NA NA NA40016.2 Terminal Island Stp 47 2 96.90 0.90 ns NT40030.1 San Pedro Breakwater 73 2 0.00 0.00 * T40030.2 San Pedro Breakwater 74 2 48.50 14.00 * T40032.1 San Pedro Bay - POLA 19 103 2 11.00 17.20 * T40032.2 San Pedro Bay - POLA 19 104 2 16.30 23.80 * T40002.1 West Basin - Pier 143 4 1 1.40 1.20 * T40002.3 West Basin - Pier 143 6 1 0.00 0.00 * T40003.3 Turning Basin - Pier 151 9 1 93.40 5.20 ns NT40004.1 Lower Main Channel 10 1 93.30 0.70 ns NT40005.2 East Basin - Turning Basin 14 1 88.60 4.60 ns NT40005.3 East Basin - Turning Basin 15 1 54.00 9.40 * T40006.3 Consolidated Slip 18 1 0.70 1.20 * T40032.1 San Pedro Bay - POLA 19 79 1 89.90 4.50 ns NT40032.2 San Pedro Bay - POLA 19 80 1 19.90 34.50 * T40033.2 Outer Harbor - POLA 10 83 1 86.50 10.80 ns NT40033.3 Outer Harbor - POLA 10 84 1 93.60 5.60 ns NT40008.2 East Basin - Pier C 23 2 95.20 2.80 ns NT

124
Table 14b continued. Development of abalone embryos (Haliotis rufescens) in Industrial Harborstation pore waters (50% concentration). HRP 50 MN = Mean percent normal development ofHaliotis rufescens in 50% pore water. SD = Standard Deviation. * = Significantly Toxic using at-test. T= Toxic using a t-test and relative to the MSD criteria for this protocol. NT = Not toxic. NA = Not Analyzed.
STANUM STATION IDORG LEG HRP HRP HRP HRP50 MN 50 SD 50 t-test 50 MSD
40009.2 West Basin Entrance 26 2 95.70 2.50 ns NT40012.3 Southeast Basin 36 2 62.50 50.40 ns NT40030.3 San Pedro Breakwater 75 2 59.50 25.30 ns NT40007.1 Long Beach Harbor - Channel 2 19 3 91.60 4.10 ns NT40007.3 Long Beach Harbor - Channel 2 21 3 0.40 0.60 * T40013.3 Inner Queensway Bay 39 3 90.00 3.20 ns NT40014.1 Outer Queensway Bay 40 3 92.50 5.20 ns NT40017.1 Long Beach Channel 49 3 72.20 8.60 * T40017.2 Long Beach Channel 50 3 86.80 7.60 ns NT40018.1 Long Beach Outer Harbor - 18 52 3 86.90 10.40 ns NT40018.2 Long Beach Outer Harbor - 18 53 3 1.10 1.90 * T44012.0 Port Hueneme - Wharf B 612 11 NA NA NA NA44013.0 Port Hueneme - Wharf #1 613 11 NA NA NA NA40009.1 West Basin Entrance 790 18 NA NA NA NA40013.1 Inner Queensway Bay 791 18 NA NA NA NA40015.3 Fish Harbor Entrance 792 18 NA NA NA NA40016.2 Terminal Island Stp 793 18 NA NA NA NA40017.3 Long Beach Channel 811 19 NA NA NA NA44055.0 L.B. Naval Station - Pier 3 - Rep 1 1198 30 NA NA NA NA44055.0 L.B. Naval Station - Pier 3 - Rep 2 1199 30 NA NA NA NA44055.0 L.B. Naval Station - Pier 3 - Rep 3 1200 30 NA NA NA NA46001.0 Hugo Neuproler - #1 1623 45 NA NA NA NA46002.0 Hugo Neuproler - #2 1624 45 NA NA NA NA46003.0 Hugo Neuproler - #3 1625 45 NA NA NA NA47003.0 Consolidated Slip –200B – Depth 2 1654 46 NA NA NA NA47005.0 Consolidated Slip –200T – Surface 1659 46 NA NA NA NA47005.0 Consolidated Slip –200T – Depth 2 1660 46 NA NA NA NA47005.0 Consolidated Slip –200T – Depth 3 1661 46 NA NA NA NA48009.0 San Pedro Bay Outer Harbor 1769 53 NA NA NA NA40020.2 Long Beach Outer Harbor - 20 1771 53 NA NA NA NA48010.0 Turning Basin 1772 53 NA NA NA NA40015.1 Fish Harbor Entrance 1773 53 NA NA NA NA40009.0 West Basin Entrance 1774 53 NA NA NA NA49001.0 Cabrillo Beach Pier - West 1778 53 NA NA NA NA49002.0 Cabrillo Beach Pier - Central 1779 53 NA NA NA NA49003.0 Cabrillo Beach Pier - East 1780 53 NA NA NA NA

125
Table 14c. Development of abalone embryos (Haliotis rufescens) in Industrial Harborstation pore waters (25% concentration). HRP 25 MN = Mean percent normaldevelopment of Haliotis rufescens in 25% pore water. SD = Standard Deviation. * =Significantly Toxic using a t-test. T= Toxic using a t-test and relative to the MSD criteriafor this protocol. NT = Not toxic. NA = Not Analyzed.
STANUM STATION IDORG LEG HRP HRP HRP HRP25 MN 25 SD 25 t-test 25 MSD
47004.0 Consolidated Slip – 200E - Depth 2 1657 46 NA NA NA NA47004.0 Consolidated Slip – 200E - Surface 1656 46 NA NA NA NA49004.0 Kaiser Intl.- Berth 49 1793 54 NA NA NA NA40006.1 Consolidated Slip - Rep 1 1050 25 NA NA NA NA40006.1 Consolidated Slip - Rep 2 1051 25 NA NA NA NA40006.1 Consolidated Slip - Rep 3 1052 25 NA NA NA NA40006.1 Consolidated Slip 16 1 92.90 3.10 ns NT47002.0 Consolidated Slip – 200 - Surface 1650 46 NA NA NA NA47002.0 Consolidated Slip – 200 - Depth 2 1651 46 NA NA NA NA47009.0 Consolidated Slip – 200G - Surface 1664 46 NA NA NA NA47003.0 Consolidated Slip – 200B - Surface 1653 46 NA NA NA NA47008.0 Consolidated Slip – Storm Drain 1663 46 NA NA NA NA47001.0 Consolidated Slip – 198 - Surface 1647 46 NA NA NA NA47001.0 Consolidated Slip – 198 - Depth 2 1648 46 NA NA NA NA40006.2 Consolidated Slip 17 1 0.40 0.70 * T47007.0 Consolidated Slip – End - Surface 1662 46 NA NA NA NA40019.3 Inner Fish Harbor 57 2 93.00 3.20 ns NT47010.0 Dominguez - H. Ford Bridge - Surface 1665 46 NA NA NA NA40019.2 Inner Fish Harbor 56 2 95.80 0.50 ns NT40019.1 Inner Fish Harbor 55 2 0.00 0.00 * T40007.2 Long Beach Harbor - Channel 2 20 3 36.60 20.50 * T40011.3 Inner Harbor - Channel 3 33 3 62.20 30.60 ns NT40001.3 Southwest Slip 3 1 76.50 7.90 * T44012.0 Port Hueneme - Wharf B 1626 45 NA NA NA NA40031.1 Palos Verdes - Swartz 6 76 3 88.60 2.60 ns NT40001.2 Southwest Slip - Rep 1 1062 25 NA NA NA NA40001.2 Southwest Slip - Rep 2 1063 25 NA NA NA NA40001.2 Southwest Slip 2 1 72.80 18.90 ns NT40001.2 Southwest Slip - Rep 3 1064 25 NA NA NA NA40013.1 Inner Queensway Bay - Rep 3 1058 25 NA NA NA NA40013.1 Inner Queensway Bay 37 3 90.80 1.50 ns NT40013.1 Inner Queensway Bay - Rep 2 1057 25 NA NA NA NA40013.1 Inner Queensway Bay- Rep 1 1056 25 NA NA NA NA40014.2 Outer Queensway Bay 41 3 90.80 4.00 ns NT40014.3 Outer Queensway Bay 42 3 89.20 3.80 ns NT40031.3 Palos Verdes - Swartz 6 78 3 88.20 0.90 * NT40013.2 Inner Queensway Bay 38 3 88.40 1.20 ns NT40031.2 Palos Verdes (Swartz 6) - Rep 2 1039 25 NA NA NA NA40031.2 Palos Verdes (Swartz 6) - Rep 3 1004 23 NA NA NA NA40031.2 Palos Verdes (Swartz 6) - Rep 1 1038 25 NA NA NA NA

126
Table 14c continued. Development of abalone embryos (Haliotis rufescens) in Industrial Harborstation pore waters (25% concentration). HRP 25 MN = Mean percent normal development ofHaliotis rufescens in 25% pore water. SD = Standard Deviation. * = Significantly Toxic using at-test. T= Toxic using a t-test and relative to the MSD criteria for this protocol. NT = Not toxic. NA = Not Analyzed.
STANUM STATION IDORG LEG HRP HRP HRP HRP25 MN 25 SD 25 t-test 25 MSD
40031.2 Palos Verdes (Swartz 6) 77 3 92.00 2.70 ns NT40031.2 Palos Verdes (Swartz 6) - Rep 2 1003 23 NA NA NA NA40031.2 Palos Verdes (Swartz 6) - Rep 1 1002 23 NA NA NA NA40031.2 Palos Verdes (Swartz 6) - Rep 3 1040 25 NA NA NA NA40031.2 Palos V.(Swartz 6) – Rep 4 Blind 1005 23 NA NA NA NA40031.2 Palos Verdes (Swartz 6) - Rep 1 1189 30 NA NA NA NA40031.2 Palos Verdes (Swartz 6) - Rep 2 1190 30 NA NA NA NA40031.2 Palos Verdes (Swartz 6) - Rep 3 1191 30 NA NA NA NA40005.1 East Basin - Turning Basin 13 1 97.50 2.70 ns NT48009.0 San Pedro Bay Outer Harbor 1694 48 NA NA NA NA40001.1 Southwest Slip 1 1 92.80 3.90 ns NT40004.2 Lower Main Channel 11 1 95.20 3.10 ns NT40004.2 Lower Main Channel - Rep 3 832 20 NA NA NA NA40004.2 Lower Main Channel - Rep 2 831 20 NA NA NA NA40004.2 Lower Main Channel - Rep 1 830 20 NA NA NA NA40004.2 Lower Main Channel 789 18 NA NA NA NA40010.1 Off Cabrillo Beach – Rep 2 1069 26 NA NA NA NA40010.1 Off Cabrillo Beach – Rep 3 1070 26 NA NA NA NA40010.1 Off Cabrillo Beach – Rep 1 1068 26 NA NA NA NA40010.1 Off Cabrillo Beach – Rep 1 1006 23 NA NA NA NA40010.1 Off Cabrillo Beach 28 2 96.90 2.20 ns NT40010.1 Off Cabrillo Beach 136 4 52.90 31.90 ns NT40010.1 Off Cabrillo Beach 810 19 NA NA NA NA40010.1 Off Cabrillo Beach 1331 32 NA NA NA NA49005.0 Kaiser Intl. - Berth 48 1794 54 NA NA NA NA40004.3 Lower Main Channel 12 1 96.90 1.20 ns NT44013.0 Port Hueneme - Wharf #1 1627 45 NA NA NA NA40010.3 Off Cabrillo Beach - Rep 2 1075 26 NA NA NA NA40010.3 Off Cabrillo Beach - Rep 1 1074 26 NA NA NA NA40010.3 Off Cabrillo Beach - Rep 3 1008 23 NA NA NA NA40010.3 Off Cabrillo Beach 30 2 92.40 8.20 ns NT40010.3 Off Cabrillo Beach - Rep 3 1076 26 NA NA NA NA40010.3 Off Cabrillo Beach 138 4 50.10 19.20 * T40010.3 Off Cabrillo Beach 1333 32 NA NA NA NA40011.1 Inner Harbor - Channel 3 31 3 90.00 1.70 ns NT40010.2 Off Cabrillo Beach - Rep 1 1071 26 NA NA NA NA40010.2 Off Cabrillo Beach - Rep 2 1072 26 NA NA NA NA40010.2 Off Cabrillo Beach - Rep 2 1007 23 NA NA NA NA40010.2 Off Cabrillo Beach - Rep 3 1073 26 NA NA NA NA40010.2 Off Cabrillo Beach 29 2 96.10 1.50 ns NT

127
Table 14c continued. Development of abalone embryos (Haliotis rufescens) in Industrial Harborstation pore waters (25% concentration). HRP 25 MN = Mean percent normal development ofHaliotis rufescens in 25% pore water. SD = Standard Deviation. * = Significantly Toxic using at-test. T= Toxic using a t-test and relative to the MSD criteria for this protocol. NT = Not toxic. NA = Not Analyzed.
STANUM STATION IDORG LEG HRP HRP HRP HRP25 MN 25 SD 25 t-test 25 MSD
40010.2 Off Cabrillo Beach 137 4 47.60 7.10 * T40010.2 Off Cabrillo Beach 1332 32 NA NA NA NA40011.2 Inner Harbor - Channel 3 32 3 87.60 3.60 ns NT44011.0 Los Cerritos Chnl Tidal P - Rep3 1079 26 NA NA NA NA44011.0 Los Cerritos Chnl Tidal P - Rep1 1077 26 NA NA NA NA44011.0 Los Cerritos Chnl Tidal P - Rep2 1078 26 NA NA NA NA44011.0 Los Cerritos Chnl Tidal P 611 11 NA NA NA NA40033.1 Outer Harbor- Pola 10 82 1 25.50 20.90 * T40018.3 Long Beach Outer Harbor - 18 - Rep 2 1042 25 NA NA NA NA40018.3 Long Beach Outer Harbor - 18 - Rep 3 886 22 NA NA NA NA40018.3 Long Beach Outer Harbor - 18 - Rep 2 885 22 NA NA NA NA40018.3 Long Beach Outer Harbor - 18 - Rep 1 884 22 NA NA NA NA40018.3 Long Beach Outer Harbor - 18 - Rep 1041 25 NA NA NA NA40018.3 Long Beach Outer Harbor – 18 1695 48 NA NA NA NA40018.3 Long Beach Outer Harbor - 18 - Rep 1043 25 NA NA NA NA40018.3 Long Beach Outer Harbor – 18 54 3 93.30 2.30 ns NT40018.3 Long Beach Outer Harbor - 18 - Rep 1 1192 30 NA NA NA NA40018.3 Long Beach Outer Harbor - 18 - Rep 2 1193 30 NA NA NA NA40018.3 Long Beach Outer Harbor - 18 - Rep 3 1194 30 NA NA NA NA40018.3 Long Beach Outer Harbor - 18 1334 32 NA NA NA NA40018.3 Long Beach Outer Harbor - 18 1770 53 NA NA NA NA40012.0 Southeast Basin 1632 45 NA NA NA NA40020.2 Long Beach Outer Harbor - 20 1696 48 NA NA NA NA40012.1 Southeast Basin - Rep1 1047 25 NA NA NA NA40012.1 Southeast Basin - Rep2 1048 25 NA NA NA NA40012.1 Southeast Basin 34 2 95.80 2.60 ns NT40012.1 Southeast Basin - Rep3 1049 25 NA NA NA NA40012.1 Southeast Basin 812 19 NA NA NA NA40008.1 East Basin - Pier C 22 2 94.70 3.10 ns NT48010.0 Turning Basin 1697 48 NA NA NA NA40017.3 Long Beach Channel - Rep 2 1060 25 NA NA NA NA40017.3 Long Beach Channel - Rep 1 1059 25 NA NA NA NA40017.3 Long Beach Channel - Rep 3 1061 25 NA NA NA NA40017.3 Long Beach Channel 51 3 91.70 2.10 ns NT40002.2 West Basin - Pier 143 5 1 28.90 27.60 * T40016.3 Terminal Island Stp 48 2 95.80 2.70 ns NT40012.2 Southeast Basin 35 2 97.50 0.80 ns NT40009.0 West Basin Entrance 1699 48 NA NA NA NA40009.1 West Basin Entrance - Ref 1 834 20 NA NA NA NA40009.1 West Basin Entrance - Ref 3 836 20 NA NA NA NA

128
Table 14c continued. Development of abalone embryos (Haliotis rufescens) in Industrial Harborstation pore waters (25% concentration). HRP 25 MN = Mean percent normal development ofHaliotis rufescens in 25% pore water. SD = Standard Deviation. * = Significantly Toxic using at-test. T= Toxic using a t-test and relative to the MSD criteria for this protocol. NT = Not toxic. NA = Not Analyzed.
STANUM STATION IDORG LEG HRP HRP HRP HRP25 MN 25 SD 25 t-test 25 MSD
40009.1 West Basin Entrance - Ref 2 835 20 NA NA NA NA40009.1 West Basin Entrance 25 2 95.20 1.10 ns NT40008.3 East Basin - Pier C 24 2 92.80 3.00 ns NT40015.1 Fish Harbor Entrance 43 2 95.70 1.50 ns NT40016.1 Terminal Island Stp 46 2 97.10 1.70 ns NT40015.3 Fish Harbor Entrance 45 2 97.70 1.40 ns NT40003.1 Turning Basin - Pier 151 7 1 88.30 8.80 ns NT40020.3 Long Beach Outer Harbor - 20 60 3 91.10 3.00 ns NT40009.3 West Basin Entrance 27 2 94.70 3.00 ns NT40020.2 Long Beach Outer Harbor - 20 59 3 90.60 2.20 ns NT40015.1 Fish Harbor Entrance 1698 48 NA NA NA NA40020.1 Long Beach Outer Harbor - 20 58 3 64.30 47.60 ns NT40032.3 San Pedro Bay - POLA 19 105 2 60.60 31.70 ns NT40032.3 San Pedro Bay - POLA 19 81 1 91.60 5.00 ns NT40015.2 Fish Harbor Entrance 44 2 98.20 1.00 ns NT40003.2 Turning Basin, Pier 151 - Rep 3 1055 25 NA NA NA NA40003.2 Turning Basin, Pier 151 - Rep 2 1054 25 NA NA NA NA40003.2 Turning Basin, Pier 151 8 1 95.80 2.00 ns NT40003.2 Turning Basin, Pier 151 - Rep 1 1053 25 NA NA NA NA40016.2 Terminal Island Stp 47 2 96.50 1.50 ns NT40030.1 San Pedro Breakwater 73 2 35.50 6.50 * T40030.2 San Pedro Breakwater 74 2 90.00 5.60 ns NT40032.1 San Pedro Bay - POLA 19 103 2 90.10 8.10 ns NT40032.2 San Pedro Bay - POLA 19 104 2 9.60 5.60 * T40002.1 West Basin - Pier 143 4 1 87.70 1.80 * NT40002.3 West Basin - Pier 143 6 1 65.20 23.00 ns NT40003.3 Turning Basin - Pier 151 9 1 92.20 6.30 ns NT40004.1 Lower Main Channel 10 1 93.70 1.20 ns NT40005.2 East Basin- Turning Basin 14 1 94.00 3.70 ns NT40005.3 East Basin- Turning Basin 15 1 77.90 10.40 ns NT40006.3 Consolidated Slip 18 1 44.80 38.00 * T40032.1 San Pedro Bay - POLA 19 79 1 97.90 2.70 ns NT40032.2 San Pedro Bay - POLA 19 80 1 83.80 8.20 ns NT40033.2 Outer Harbor - POLA 10 83 1 96.90 2.90 ns NT40033.3 Outer Harbor - POLA 10 84 1 90.60 5.10 ns NT40008.2 East Basin - Pier C 23 2 97.60 0.70 ns NT40009.2 West Basin Entrance 26 2 94.90 1.90 ns NT40012.3 Southeast Basin 36 2 93.70 1.20 ns NT40030.3 San Pedro Breakwater 75 2 94.70 1.30 ns NT

129
Table 14c continued. Development of abalone embryos (Haliotis rufescens) in Industrial Harborstation pore waters (25% concentration). HRP 25 MN = Mean percent normal development ofHaliotis rufescens in 25% pore water. SD = Standard Deviation. * = Significantly Toxic using at-test. T= Toxic using a t-test and relative to the MSD criteria for this protocol. NT = Not toxic. NA = Not Analyzed.
STANUM STATION IDORG LEG HRP HRP HRP HRP25 MN 25 SD 25 t-test 25 MSD
40007.1 Long Beach Harbor - Channel 2 19 3 90.70 2.60 ns NT40007.3 Long Beach Harbor - Channel 2 21 3 88.20 5.10 ns NT40013.3 Inner Queensway Bay 39 3 92.20 2.80 ns NT40014.1 Outer Queensway Bay 40 3 86.90 1.40 * NT40017.1 Long Beach Channel 49 3 93.70 0.30 ns NT40017.2 Long Beach Channel 50 3 91.60 2.00 ns NT40018.1 Long Beach Outer Harbor - 18 52 3 90.00 5.30 ns NT40018.2 Long Beach Outer Harbor - 18 53 3 94.20 1.80 ns NT44012.0 Port Hueneme - Wharf B 612 11 NA NA NA NA44013.0 Port Hueneme - Wharf #1 613 11 NA NA NA NA40009.1 West Basin Entrance 790 18 NA NA NA NA40013.1 Inner Queensway Bay 791 18 NA NA NA NA40015.3 Fish Harbor Entrance 792 18 NA NA NA NA40016.2 Terminal Island Stp 793 18 NA NA NA NA40017.3 Long Beach Channel 811 19 NA NA NA NA44055.0 L.B. Naval Station - Pier 3 - Rep 1 1198 30 NA NA NA NA44055.0 L.B. Naval Station - Pier 3 - Rep 2 1199 30 NA NA NA NA44055.0 L.B. Naval Station - Pier 3 - Rep 3 1200 30 NA NA NA NA46001.0 Hugo Neuproler - #1 1623 45 NA NA NA NA46002.0 Hugo Neuproler - #2 1624 45 NA NA NA NA46003.0 Hugo Neuproler - #3 1625 45 NA NA NA NA47003.0 Consolidated Slip – 200B - Depth 2 1654 46 NA NA NA NA47005.0 Consolidated Slip – 200T - Surface 1659 46 NA NA NA NA47005.0 Consolidated Slip – 200T - Depth 2 1660 46 NA NA NA NA47005.0 Consolidated Slip – 200T - Depth 3 1661 46 NA NA NA NA48009.0 San Pedro Bay Outer Harbor 1769 53 NA NA NA NA40020.2 Long Beach Outer Harbor - 20 1771 53 NA NA NA NA48010.0 Turning Basin 1772 53 NA NA NA NA40015.1 Fish Harbor Entrance 1773 53 NA NA NA NA40009.0 West Basin Entrance 1774 53 NA NA NA NA49001.0 Cabrillo Beach Pier - West 1778 53 NA NA NA NA49002.0 Cabrillo Beach Pier - Central 1779 53 NA NA NA NA49003.0 Cabrillo Beach Pier - East 1780 53 NA NA NA NA

130
Table 15. Spearman Rank Correlation Coefficients for selected chemicals significantlycorrelated with amphipod survival at Industrial Harbor stations. * indicates significanceat p<0.05; ** indicates significance at p<0.01; *** indicates significance at p<0.001; N =126.
Chemical Spearman rho SignificanceMetalsArsenic -0.410 ***Cadmium -0.360 ***Copper -0.463 ***Lead -0.455 ***Mercury -0.388 ***Nickel -0.489 ***Zinc -0.546 ***PesticidesTotal Chlordane -0.403 ***PCBsPCB 5 -0.573 ***PCB 31 -0.644 ***Total PCBs -0.274 **PAHsBenz(a)anthracene -0.346 ***Benzo(a)pyrene -0.446 ***Benzo[e]pyrene -0.401 ***Coronene -0.720 ***Dibenz[a,h]anthracene -0.427 ***1-Methylnaphthalene -0.455 ***2-Methylnaphthalene -0.424 ***Naphthalene -0.417 ***LMW PAH -0.341 ***HMW PAH -0.411 ***Total PAH -0.399 ***Fines -0.350 ***TOC -0.369 ***ERM Quotient -0.353 ***# ERM Exceedances -0.291 ***

131
Table 16. Spearman Rank Correlation Coefficients for selected chemicals significantlycorrelated with abalone development in 25% pore water at Industrial Harbor stations. *indicates significance at p<0.05; ** indicates significance at p<0.01; *** indicatessignificance at p<0.001; N = 54.
Chemical Spearman rho SignificanceMetalsTin -0.306 *PesticidesTotal Chlordane -0.354 **PCBsPCB 8 -0.267 *PCB187 -0.265 *ERM Quotient* -0.229 *# ERM Exceedances* -0.400 ***correlations with 50% pore water concentration data

132
Table 17. Relative Benthic Index values for Industrial Harbor stations. Station categorieswere D = Degraded (RBI<0.30); T = Transitional (RBI>0.31<0.60); U = Undegraded(RBI >0.61). NA = Not Analyzed.
STANUM STATION IDORG LEG Benthic Index Category47004.0 Consolidated Slip – 200E - Depth 2 1657 46 NA NA47004.0 Consolidated Slip – 200E - Surface 1656 46 0.34 T49004.0 Kaiser Intl.- Berth 49 1793 54 0.58 T40006.1 Consolidated Slip - Rep 1 1050 25 NA NA40006.1 Consolidated Slip - Rep 2 1051 25 NA NA40006.1 Consolidated Slip - Rep 3 1052 25 NA NA40006.1 Consolidated Slip 16 1 0.29 D47002.0 Consolidated Slip – 200 - Surface 1650 46 0.25 D47002.0 Consolidated Slip – 200 - Depth 2 1651 46 NA NA47009.0 Consolidated Slip – 200G - Surface 1664 46 0.24 D47003.0 Consolidated Slip – 200B - Surface 1653 46 0.3 D47008.0 Consolidated Slip – Storm Drain 1663 46 0.4 T47001.0 Consolidated Slip – 198 - Surface 1647 46 0.39 T47001.0 Consolidated Slip – 198 - Depth 2 1648 46 NA NA40006.2 Consolidated Slip 17 1 0.38 T47007.0 Consolidated Slip – End - Surface 1662 46 0.46 T40019.3 Inner Fish Harbor 57 2 0.35 T47010.0 Dominguez - H. Ford Bridge - Surface 1665 46 0.21 D40019.2 Inner Fish Harbor 56 2 0.38 T40019.1 Inner Fish Harbor 55 2 0.36 T40007.2 Long Beach Harbor - Channel 2 20 3 0.53 T40011.3 Inner Harbor - Channel 3 33 3 0.7 U40001.3 Southwest Slip 3 1 0.57 T44012.0 Port Hueneme - Wharf B 1626 45 NA NA40031.1 Palos Verdes - Swartz 6 76 3 0.63 U40001.2 Southwest Slip - Rep 1 1062 25 NA NA40001.2 Southwest Slip - Rep 2 1063 25 NA NA40001.2 Southwest Slip 2 1 0.50 T40001.2 Southwest Slip - Rep 3 1064 25 NA NA40013.1 Inner Queensway Bay - Rep 3 1058 25 NA NA40013.1 Inner Queensway Bay 37 3 0.47 T40013.1 Inner Queensway Bay - Rep 2 1057 25 NA NA40013.1 Inner Queensway Bay - Rep 1 1056 25 NA NA40014.2 Outer Queensway Bay 41 3 0.41 T40014.3 Outer Queensway Bay 42 3 0.41 T40031.3 Palos Verdes - Swartz 6 78 3 1 U40013.2 Inner Queensway Bay 38 3 0.47 T40031.2 Palos Verdes (Swartz 6) - Rep 2 1039 25 NA NA40031.2 Palos Verdes (Swartz 6) - Rep 3 1004 23 0.28 D40031.2 Palos Verdes (Swartz 6) - Rep 1 1038 25 NA NA40031.2 Palos Verdes (Swartz 6) 77 3 0.77 U40031.2 Palos Verdes (Swartz 6) - Rep 2 1003 23 0.44 T40031.2 Palos Verdes (Swartz 6) - Rep 1 1002 23 0.28 D

133
Table 17 continued. Relative Benthic Index values for Industrial Harbor stations. Stationcategories were D = Degraded (RBI<0.30); T = Transitional (RBI>0.31<0.60); U = Undegraded(RBI >0.61). NA = Not Analyzed.
STANUM STATION IDORG LEG Benthic Index Category40031.2 Palos Verdes (Swartz 6) - Rep 3 1040 25 NA NA40031.2 Palos V.(Swartz 6) - Rep 4 Blind 1005 23 NA NA40031.2 Palos Verdes (Swartz 6) - Rep 1 1189 30 NA NA40031.2 Palos Verdes (Swartz 6) - Rep 2 1190 30 NA NA40031.2 Palos Verdes (Swartz 6) - Rep 3 1191 30 NA NA40005.1 East Basin - Turning Basin 13 1 0.42 T48009.0 San Pedro Bay Outer Harbor 1694 48 0.7 U40001.1 Southwest Slip 1 1 0.47 T40004.2 Lower Main Channel 11 1 0.57 T40004.2 Lower Main Channel - Rep 3 832 20 0.30 D40004.2 Lower Main Channel - Rep 2 831 20 0.25 D40004.2 Lower Main Channel - Rep 1 830 20 0.40 T40004.2 Lower Main Channel 789 18 NA NA40010.1 Off Cabrillo Beach - Rep 2 1069 26 NA NA40010.1 Off Cabrillo Beach - Rep 3 1070 26 NA NA40010.1 Off Cabrillo Beach - Rep 1 1068 26 NA NA40010.1 Off Cabrillo Beach - Rep 1 1006 23 0.34 T40010.1 Off Cabrillo Beach 28 2 0.67 U40010.1 Off Cabrillo Beach 136 4 NA NA40010.1 Off Cabrillo Beach 810 19 NA NA40010.1 Off Cabrillo Beach 1331 32 NA NA49005.0 Kaiser Intl.- Berth 48 1794 54 0.65 U40004.3 Lower Main Channel 12 1 0.54 T44013.0 Port Hueneme - Wharf #1 1627 45 NA NA40010.3 Off Cabrillo Beach - Rep 2 1075 26 NA NA40010.3 Off Cabrillo Beach - Rep 1 1074 26 NA NA40010.3 Off Cabrillo Beach - Rep 3 1008 23 0.43 T40010.3 Off Cabrillo Beach 30 2 1.00 U40010.3 Off Cabrillo Beach - Rep 3 1076 26 NA NA40010.3 Off Cabrillo Beach 138 4 NA NA40010.3 Off Cabrillo Beach 1333 32 NA NA40011.1 Inner Harbor - Channel 3 31 3 0.63 U40010.2 Off Cabrillo Beach - Rep 1 1071 26 NA NA40010.2 Off Cabrillo Beach - Rep 2 1072 26 NA NA40010.2 Off Cabrillo Beach - Rep 2 1007 23 0.27 D40010.2 Off Cabrillo Beach - Rep 3 1073 26 NA NA40010.2 Off Cabrillo Beach 29 2 0.75 U40010.2 Off Cabrillo Beach 137 4 NA NA40010.2 Off Cabrillo Beach 1332 32 NA NA

134
Table 17 continued. Relative Benthic Index values for Industrial Harbor stations. Stationcategories were D = Degraded (RBI<0.30); T = Transitional (RBI>0.31<0.60); U = Undegraded(RBI >0.61). NA = Not Analyzed.
STANUM STATION IDORG LEG Benthic Index Category40011.2 Inner Harbor - Channel 3 32 3 0.53 T44011.0 Los Cerritos Channel Tidal P - Rep3 1079 26 NA NA44011.0 Los Cerritos Channel Tidal P - Rep1 1077 26 NA NA44011.0 Los Cerritos Channel Tidal P - Rep2 1078 26 NA NA44011.0 Los Cerritos Channel Tidal P 611 11 NA NA40033.1 Outer Harbor - POLA 10 82 1 0.72 U40018.3 Long Beach Outer Harbor – 18 - Rep 2 1042 25 NA NA40018.3 Long Beach Outer Harbor – 18 - Rep 3 886 22 0.23 D40018.3 Long Beach Outer Harbor – 18 - Rep 2 885 22 0.31 T40018.3 Long Beach Outer Harbor – 18 - Rep 1 884 22 0.23 D40018.3 Long Beach Outer Harbor – 18 - Rep 1 1041 25 NA NA40018.3 Long Beach Outer Harbor – 18 1695 48 0.58 T40018.3 Long Beach Outer Harbor – 18 - Rep 3 1043 25 NA NA40018.3 Long Beach Outer Harbor – 18 54 3 0.52 T40018.3 Long Beach Outer Harbor – 18 - Rep 1 1192 30 NA NA40018.3 Long Beach Outer Harbor – 18 - Rep 2 1193 30 NA NA40018.3 Long Beach Outer Harbor – 18 - Rep 3 1194 30 NA NA40018.3 Long Beach Outer Harbor – 18 1334 32 NA NA40018.3 Long Beach Outer Harbor – 18 1770 53 NA NA40012.0 Southeast Basin 1632 45 0.56 T40020.2 Long Beach Outer Harbor - 20 1696 48 0.81 U40012.1 Southeast Basin - Rep1 1047 25 NA NA40012.1 Southeast Basin - Rep2 1048 25 NA NA40012.1 Southeast Basin 34 2 0.61 U40012.1 Southeast Basin - Rep3 1049 25 NA NA40012.1 Southeast Basin 812 19 NA NA40008.1 East Basin - Pier C 22 2 0.61 T48010.0 Turning Basin 1697 48 0.69 U40017.3 Long Beach Channel - Rep 2 1060 25 NA NA40017.3 Long Beach Channel - Rep 1 1059 25 NA NA40017.3 Long Beach Channel - Rep 3 1061 25 NA NA40017.3 Long Beach Channel 51 3 0.68 U40002.2 West Basin - Pier 143 5 1 0.50 T40016.3 Terminal Island Stp 48 2 0.68 U40012.2 Southeast Basin 35 2 0.5 T40009.0 West Basin Entrance 1699 48 0.57 T40009.1 West Basin Entrance - Ref 1 834 20 0.46 T40009.1 West Basin Entrance - Ref 3 836 20 0.32 T40009.1 West Basin Entrance - Ref 2 835 20 0.38 T40009.1 West Basin Entrance 25 2 0.53 T40008.3 East Basin - Pier C 24 2 0.62 U40015.1 Fish Harbor Entrance 43 2 0.66 U40016.1 Terminal Island Stp 46 2 0.76 U

135
Table 17 continued. Relative Benthic Index values for Industrial Harbor stations. Stationcategories were D = Degraded (RBI<0.30); T = Transitional (RBI>0.31<0.60); U = Undegraded(RBI >0.61). NA = Not Analyzed.
STANUM STATION IDORG LEG Benthic Index Category40015.3 Fish Harbor Entrance 45 2 0.79 U40003.1 Turning Basin - Pier 151 7 1 0.66 U40020.3 Long Beach Outer Harbor - 20 60 3 0.6 T40009.3 West Basin Entrance 27 2 0.60 T40020.2 Long Beach Outer Harbor - 20 59 3 0.83 U40015.1 Fish Harbor Entrance 1698 48 0.78 U40020.1 Long Beach Outer Harbor - 20 58 3 0.63 U40032.3 San Pedro Bay - POLA 19 105 2 NA NA40032.3 San Pedro Bay - POLA 19 81 1 0.84 U40015.2 Fish Harbor Entrance 44 2 0.68 U40003.2 Turning Basin, Pier 151 - Rep 3 1055 25 NA NA40003.2 Turning Basin, Pier 151 - Rep 2 1054 25 NA NA40003.2 Turning Basin, Pier 151 8 1 0.50 T40003.2 Turning Basin, Pier 151 - Rep 1 1053 25 NA NA40016.2 Terminal Island Stp 47 2 0.75 U40030.1 San Pedro Breakwater 73 2 NA NA40030.2 San Pedro Breakwater 74 2 NA NA40032.1 San Pedro Bay - POLA 19 103 2 NA NA40032.2 San Pedro Bay - POLA 19 104 2 NA NA40002.1 West Basin - Pier 143 4 1 0.48 T40002.3 West Basin - Pier 143 6 1 0.48 T40003.3 Turning Basin - Pier 151 9 1 0.54 T40004.1 Lower Main Channel 10 1 0.69 U40005.2 East Basin- Turning Basin 14 1 0.47 T40005.3 East Basin- Turning Basin 15 1 0.46 T40006.3 Consolidated Slip 18 1 0.30 D40032.1 San Pedro Bay - POLA 19 79 1 0.79 U40032.2 San Pedro Bay - POLA 19 80 1 0.92 U40033.2 Outer Harbor - POLA 10 83 1 0.62 U40033.3 Outer Harbor - POLA 10 84 1 0.57 T40008.2 East Basin - Pier C 23 2 0.52 T40009.2 West Basin Entrance 26 2 0.71 U40012.3 Southeast Basin 36 2 0.68 U40030.3 San Pedro Breakwater 75 2 NA NA40007.1 Long Beach Harbor - Channel 2 19 3 0.52 T40007.3 Long Beach Harbor - Channel 2 21 3 0.52 T40013.3 Inner Queensway Bay 39 3 0.46 T40014.1 Outer Queensway Bay 40 3 0.42 T40017.1 Long Beach Channel 49 3 0.52 T40017.2 Long Beach Channel 50 3 0.55 T

136
Table 17 continued. Relative Benthic Index values for Industrial Harbor stations. Stationcategories were D = Degraded (RBI<0.30); T = Transitional (RBI>0.31<0.60); U = Undegraded(RBI >0.61). NA = Not Analyzed.
STANUM STATION IDORG LEG Benthic Index Category40018.1 Long Beach Outer Harbor - 18 52 3 0.51 T40018.2 Long Beach Outer Harbor - 18 53 3 0.50 T44012.0 Port Hueneme - Wharf B 612 11 NA NA44013.0 Port Hueneme - Wharf #1 613 11 NA NA40009.1 West Basin Entrance 790 18 NA NA40013.1 Inner Queensway Bay 791 18 NA NA40015.3 Fish Harbor Entrance 792 18 NA NA40016.2 Terminal Island Stp 793 18 NA NA40017.3 Long Beach Channel 811 19 NA NA44055.0 L.B. Naval Station - Pier 3 - Rep 1 1198 30 NA NA44055.0 L.B. Naval Station - Pier 3 - Rep 2 1199 30 NA NA44055.0 L.B. Naval Station - Pier 3 - Rep 3 1200 30 NA NA46001.0 Hugo Neuproler - #1 1623 45 NA NA46002.0 Hugo Neuproler - #2 1624 45 NA NA46003.0 Hugo Neuproler - #3 1625 45 NA NA47003.0 Consolidated Slip – 200B – Depth 2 1654 46 NA NA47005.0 Consolidated Slip – 200T – Surface 1659 46 0.54 T47005.0 Consolidated Slip – 200T – Depth 2 1660 46 NA NA47005.0 Consolidated Slip – 200T – Depth 3 1661 46 NA NA48009.0 San Pedro Bay Outer Harbor 1769 53 NA NA40020.2 Long Beach Outer Harbor - 20 1771 53 NA NA48010.0 Turning Basin 1772 53 NA NA40015.1 Fish Harbor Entrance 1773 53 NA NA40009.0 West Basin Entrance 1774 53 NA NA49001.0 Cabrillo Beach Pier - West 1778 53 NA NA49002.0 Cabrillo Beach Pier - Central 1779 53 NA NA49003.0 Cabrillo Beach Pier - East 1780 53 NA NA

137
Table 18. Spearman Rank Correlation Coefficients for selected chemicals significantlynegatively correlated with Benthic Community Structure (as Relative Benthic Index) atIndustrial Harbor stations. * indicates significance at p<0.05; ** indicates significance atp<0.01; *** indicates significance at p<0.001; N = 68 or 80 depending on chemical.
Chemical Spearman rho Sig. Chemical Spearman rho Sig.Metals PesticidesAntimony -0.304 ** Aldrin -0.252 *Arsenic -0.392 *** Cis Chlordane -0.357 ***Cadmium -0.462 *** Trans Chlordane -0.335 *Chromium -0.305 ** OP DDD -0.392 ***Copper -0.402 *** PP DDD -0.462 ***Lead -0.440 *** Total DDT -0.312 **Mercury -0.219 * Heptachlor -0.414 ***Silver -0.304 ** Trans Nonachlor -0.404 ***Zinc -0.414 *** Total Chlordane -0.533 ***
PAHs PCBsAnthracene -0.354 *** PCB 28 -0.449 ***Benzo(a)pyrene -0.360 *** PCB 52 -0.549 ***Benzo[e]pyrene -0.355 *** PCB 66 -0.470 ***Dibenz[a,h]anthracene -0.388 *** PCB 101 -0.472 ***Fluoranthene -0.397 *** PCB 138 -0.452 ***1-Methylnaphthalene -0.344 *** PCB 153 -0.462 ***2-Methylnaphthalene -0.377 *** PCB 187 -0.477 ***1-Methylphenanthrene -0.497 *** Total PCBs -0.464 ***LMW PAH -0.390 ***HMW PAH -0.436 ***Total PAH -0.428 *** Other
TOC -0.555 ***Organotins ERM Quotient -0.443 ***Tributyltin -0.547 *** # ERM Exceedances -0.316 **

138
Table 19a. Results of Prinicipal Components Analysis (PCA) of amphipod survival intoxicity tests, benthic community structure metrics, and chemicals measured in IndustrialHarbor sediments. Significantly correlated variables are indicated in 12 point bold type.
Rotated Loadings1 2 3 4
Amphipod Survival -0.675 0.005 0.117 -0.318No. of Gammarid Amph. Species 0.127 0.869 -0.076 0.077No. of Gammarid Amph. Indiv.s -0.098 0.648 0.018 -0.184No. of Other Crustacean Indiv.s -0.099 0.898 0.150 0.023Mean No. of Crustacean Indiv.s 0.099 0.903 -0.047 0.072Tot. No. of Crustacean Species -0.215 0.658 0.137 -0.301Mean No. of Echinoderm Indiv.s -0.151 0.015 0.695 -0.221Mean No. of Mollusc Indiv.s -0.175 -0.022 0.079 -0.547Mean No. of Mollusc Species -0.333 -0.029 -0.051 -0.550Mean No. of Individuals 0.332 0.788 -0.173 -0.022Total No. of Species -0.079 0.308 -0.202 -0.511Relative Benthic Index -0.472 0.173 0.013 -0.290ANTIMONY 0.721 0.154 -0.087 0.357CADMIUM 0.687 0.223 0.163 0.051COPPER 0.366 0.009 0.151 0.738IRON 0.102 -0.099 -0.473 0.686LEAD 0.821 -0.005 0.029 0.288MANGANESE -0.163 -0.117 -0.684 0.202MERCURY 0.102 -0.095 0.129 0.667ZINC 0.747 0.005 0.010 0.474ALDRIN 0.574 -0.097 0.204 -0.083CisChlordane 0.798 0.072 0.013 0.009Total DDT 0.053 0.003 0.924 -0.192DIELDRIN 0.894 0.070 -0.054 -0.076METHOXY 0.798 -0.116 -0.020 -0.062Total Chlordane 0.942 0.138 -0.017 -0.022Total PCB 0.786 -0.044 0.167 0.073HMW PAH 0.694 -0.011 -0.015 0.434FINES 0.135 -0.015 -0.066 0.594TOC 0.751 0.101 0.316 0.300ERMQ 0.930 0.060 0.149 0.195ERMEXCDS 0.759 -0.034 0.251 0.325PELEXCDS 0.750 -0.115 0.222 0.383% of total variance explained 26.89 10.317 11.549 11.352

139
Table 19b. Results of Prinicipal Components Analysis (PCA) of Abalone Devlopment intoxicity tests, Benthic Community Structure Metrics, and Chemicals measured inIndustrial Harbor sediments. Significantly correlated variables are indicated in 12 pointbold type.
Rotated Loadings1 2 3 4 5
Mean amphipod survival -0.284 0.205 -0.417 -0.416 -0.293Mean ab dev. (100% PW) 0.380 -0.027 -0.341 -0.183 -0.393Mean ab dev. (50% PW) -0.032 0.037 -0.138 0.025 -0.697Mean ab dev. (25% PW) -0.029 -0.031 -0.122 -0.161 -0.642Unionized ammonia 0.038 -0.100 0.201 0.283 0.721Mean No. of Gammarid Indiv.s 0.017 -0.097 -0.938 0.074 -0.041No. of Other Crustacean Indiv.s -0.054 0.141 -0.893 -0.058 -0.097Tot. No. of Crustacean Indiv.s -0.010 -0.008 -0.960 0.026 -0.065Mean No. of Echinoderm Indiv.s -0.227 0.824 -0.001 -0.134 -0.144Mean No. of Echinoderm Sp. -0.102 0.816 0.036 -0.186 -0.289Mean No. of Mollusc Indiv.s -0.255 0.124 0.244 0.181 -0.566Mean No. of Mollusc Sp. -0.287 0.048 0.132 -0.129 -0.534Mean No. of Polychaete Sp. -0.036 -0.082 -0.034 -0.489 -0.510Mean No. of Individuals 0.083 -0.206 -0.804 -0.192 -0.318Total No. of Species -0.168 0.064 -0.257 -0.429 -0.619Relative Benthic Index -0.318 0.203 -0.488 -0.473 -0.326ALUMINUM -0.319 -0.638 0.052 -0.302 -0.077ANTIMONY 0.609 0.013 0.296 0.567 0.284CADMIUM 0.240 0.443 -0.281 0.738 0.131COPPER 0.596 0.169 -0.012 0.196 0.590MANGANESE 0.312 -0.536 0.357 -0.280 -0.046MERCURY 0.501 0.127 0.144 0.007 0.465ZINC 0.555 0.061 0.031 0.677 0.391TTL_DDT -0.210 0.950 -0.039 0.010 -0.054DIELDRIN -0.003 -0.079 -0.154 0.874 -0.027TOXAPH 0.014 0.048 0.108 0.896 -0.024TBT 0.163 0.087 0.084 0.579 0.421TTL_CHLR 0.011 0.020 0.108 0.965 0.065TTL_PCB 0.341 0.478 0.117 0.546 0.508HMW_PAH 0.444 0.014 0.159 0.201 0.496FINES 0.760 0.011 -0.135 0.277 -0.038TOC 0.399 0.251 -0.043 0.686 0.259ERMQ 0.356 0.326 0.138 0.743 0.393ERMEXCDS 0.318 0.345 0.178 0.359 0.511PELEXCDS 0.378 0.243 0.224 0.455 0.527% of Total Var explained 15.235 14.037 11.149 18.742 13.902

140
Table 20. Spearman Rank Correlation Coefficients for amphipod survival or abaloneembryo development in laboratory toxicity tests significantly correlated with BenthicCommunity Structure metrics measured at Industrial Harbor stations. * indicatessignificance at p<0.05; ** indicates significance at p<0.01; *** indicates significance atp<0.001; N = 80 (amphipods) or 47 (abalone).
Benthic Community MetricCorrelated. with Amphipod Survival Spearman rho SignificanceTotal Number of Custacean Species 0.373 ***Total Number of Species 0.367 ***Benthic Index 0.276 **Benthic Community MetricCorrelated with Abalone Development Spearman rho SignificanceTotal Number of Mollusc Individuals 0.280 *Total Number of Mollusc Species 0.363 **Total Number of Individuals 0.490 **Total Number of Species 0.290 *

141
Table 21a. Results of total DDT and Total PCB tissue analyses of fish collected atselected Industrial Harbor stations (ng/g wet weight concentrations).
Station Station IDORG Fish LEG TTL TTL TTL TTL EPA %Number Name Species DDT DDT PCB PCB Excds Lipid
(ng/g) Quot. (ng/g) Quot.40020.2 Long Bch Out. Harb. 20 1781.0 Croaker 53 1096.7 3.7 465.2 46.5 2 9.849001.0 Cabr. Bch Pier- West 1782.0 Croaker 53 406.3 1.4 170.2 17.0 2 16.249002.0 Cabr. Bch Pier- Cent. 1783.0 Croaker 53 4984.8 16.6 686.6 68.7 2 14.549003.0 Cabr. Bch Pier- East 1784.0 Croaker 53 1839.2 6.1 407.3 40.7 2 14.349001.0 Cabr. Bch Pier- West 1785.0 Surfperch 53 51.2 0.2 40.1 4.0 1 14.249002.0 Cabr. Bch Pier- Cent. 1786.0 Surfperch 53 68.5 0.2 37.9 3.8 1 9.649003.0 Cabr. Bch Pier- East 1787.0 Surfperch 53 76.7 0.3 53.5 5.4 1 11.9
NAS Wildlife Guideline (whole fish) 50 500USEPA Screening Value (edible portion) 300 10

142
Table 21b. Results of tisue analyses of Macoma nasuta bioaccumulation tests using selected Industrial Harbor sediments. Tissueconcentrations are shown for those compounds that were elevated relative to the US EPA screening values (Total DDT and TotalPCBs only; as ng/g wet weight concentrations). * = significantly elevated concentrations, NS = not significant, NA = not analyzed.
Station Station IDORG Tissue TTL Sig. TTL Sig. TTL DDT TTL PCB EPANumber Name TYPE DDT PCB Quot. Quot. Exceedances40009.0 West Basin Entrance - 1 1774.1 Macoma 15.49 * 16.526 * 0.052 1.6526 240009.0 West Basin Entrance - 2 1774.2 Macoma 11.02 * 11.088 * 0.037 1.1088 140009.0 West Basin Entrance - 3 1774.3 Macoma 18.86 * 17.598 * 0.063 1.7598 249001.0 Cabrillo Beach Pr – West - 1 1778.1 Macoma 9.59 NA 6.072 NA 0.032 0.6072 049002.0 Cabrillo Beach Pr – Center - 1 1779.1 Macoma 11.96 * 5.530 NS 0.040 0.5530 049002.0 Cabrillo Beach Pr – Center - 2 1779.2 Macoma 18.74 * 8.406 NS 0.062 0.8406 049002.0 Cabrillo Beach Pr – Center - 3 1779.3 Macoma 18.16 * 15.338 NS 0.061 1.5338 149003.0 Cabrillo Beach Pr – East - 1 1780.1 Macoma 9.10 * 4.546 * 0.030 0.4546 049003.0 Cabrillo Beach Pr – East - 2 1780.2 Macoma 13.43 * 5.272 * 0.045 0.5272 049003.0 Cabrillo Beach Pr – East - 3 1780.3 Macoma 10.64 * 5.536 * 0.035 0.5536 0
GC - Home Control - 1 1806.1 Macoma 2.21 3.624 0.3624 0GC - Home Control - 2 1806.2 Macoma 2.18 4.370 0.4370 0GC - Home Control - 3 1806.3 Macoma 2.14 3.902 0.3902 0GC - Initial Before Exp - 1 1805.1 Macoma 2.31 3.600 0.3600 0GC - Initial Before Exp - 2 1805.2 Macoma 2.07 3.886 0.3886 0GC - Initial Before Exp - 3 1805.3 Macoma 2.15 3.716 0.3716 0
NAS Wildlife Guideline (whole fish) 50 500USEPA Screening Val. (edible portion) 300 10* = significant relative to home sediment control using a separate variance t-test at p <0.05 (n=3);

143
Table 22. Categorization of Los Angeles Region Industrial Harbor stations based on chemistry, toxicity and benthic communityanalysis. Shading indicates significant toxicity or benthic degradation. na = Not Analyzed; N = [ammonia] > than threshold effectvalue; S = [sulfide] > than threshold effect value; PW = Pore Water; SWI = Sediment-Water Interface.
Amphipod Larval Development - Ab or Urch.StationNumber
Station Name IDOrg ERMQ Selected Chemicals and factors by whichthey exceed ERM values
%TOC
%Fines
%Surv.
NH3
H2S100%PW
NH3
H2S50%PW
NH3
H2S25%PW
NH3
H2SUrchSWI
BenthicIndex
Category 1 - Stations with elevated chemistry, recurrent toxicity and degraded benthos40006.1 Consolidated Slip 16 1.273 p'p,DDE (13) 4.6 90.9 58 0 90 93 na 0.2940006.1 Consolidated Slip- R1 1050 1.949 TTL Chlordane (18) 4.3 93.6 62 na na na na na40006.1 Consolidated Slip- R2 1051 1.654 TTL PCB (3), Zn, Hg (1) 4.3 94.0 65 na na na na na40006.1 Consolidated Slip- R3 1052 1.473 HMWPAH (1) 4.5 94.6 80 na na na na na
Category 2 - Stations with elevated chemistry, one (of one) toxicity hit and degraded benthos.47002.0 Consolidated Slip- 200- Surface 1650 1.917 p'p,DDE (7), TTL Chl. (8), HMWPAH (1) 4.1 80.7 54 na na na na 0.25
47002.0 Consolidated Slip- 200- Depth 2 1651 1.567 TTL. PCB (11), Dieldrin (1), Zn (1) 2.1 70.2 86 na na na na na
47003.0 Consolidated Slip- 200B- Surface 1653 1.629 p'p,DDE (6), TTL Chl. (9), 3.4 62.6 70 na na na na 0.30
47003.0 Consolidated Slip- 200B- Depth 2 1654 na TTL PCB (8), Dieldrin (1), DBA (1) 3.6 80.6 8 na na na na na
47009.0 Consolidated Slip- 200G- Surface 1664 1.659 p'p,DDE (10), TTL Chl. (11), HMWPAH (1) 4.9 92.8 50 na na na na 0.24
TTL PCB (2), Dieldrin, Zn (1), Chlorpyr (90th)
47010.0 Dominguez- H. Ford Bridge- Surf. 1665 0.801 p'p,DDE (4), TTL Chl. (11), TTL PCB (2) 3.5 99.5 61 N na na na na 0.21
Category 4 - Elevated Chemistry, one measure of Biological Impact (no data for second biological indicator)44012.0 Port Hueneme- Wharf B 612 na TTL PCB (2), ANT (1), BAA (1), BAP (1) 1.4 78.0 70 0 na na na na
44012.0 Port Hueneme- Wharf B 1626 0.536 CHR (1), DBA (1), HMWPAH (2) 1.3 38.1 98 0 S na na na na
Category 5 - Stations with elevated chemistry and mixed results from biological indicators40001.2 Southwest Slip 2 0.420 Hg (1), p'p,DDE (3), 1.4 71.7 51 81 N 87 N 73 na 0.5040001.2 Southwest Slip- R1 1062 0.518 TTL PCB (1), BAP (1), DBA (1) 1.3 62.6 69 na na na na na40001.2 Southwest Slip- R2 1063 0.496 HMWPAH (2) 1.3 63.5 72 na na na na na40001.2 Southwest Slip- R3 1064 0.324 0.8 46.4 58 na na na na na
40006.2 Consolidated Slip 17 1.289 Zn (1), TTL Chl. (4), p'p,DDE (10) 4.3 92.9 59 N 0 N 0 N 0 N na 0.38TTL PCB (3), TBT (>95th)

144
Table 22 continued. Categorization of Los Angeles Region Industrial Harbor stations based on chemistry, toxicity and benthiccommunity analysis. Shading indicates significant toxicity or benthic degradation. na = Not Analyzed; N = [ammonia] > thanthreshold effect value; S = [sulfide] > than threshold effect value; PW = Pore Water; SWI = Sediment-Water Interface.
Amphipod Larval Development - Ab or Urch.StationNumber
Station Name IDOrg ERMQ Selected Chemicals and factors by whichthey exceed ERM values
%TOC
%Fines
%Surv.
NH3
H2S100%PW
NH3
H2S50%PW
NH3
H2S25%PW
NH3
H2SUrchSWI
BenthicIndex
Category 5 - Stations with elevated chemistry and mixed results from biological indicators40013.1 Inner Queensway Bay 37 0.383 TTL Chlordane (4), p'p,DDE (1) 2.0 94.6 83 0 N 89 N 91 na 0.4740013.1 Inner Queensway Bay 791 na 1.4 76.0 50 95 93 90 na na40013.1 Inner Queensway Bay- R1 1056 0.282 0.3 20.5 83 na na na na na40013.1 Inner Queensway Bay- R2 1057 0.308 1.1 21.5 76 na na na na na40013.1 Inner Queensway Bay- R3 1058 0.515 2.0 38.3 71 na na na na na
40019.3 Inner Fish Harbor 57 0.914 Cu (2), Hg (3), Zn (1), p'p,DDE (9) 3.0 91.1 54 0 N 0 N 93 N na 0.35TBT (>95th)
47001.0 Consolidated Slip- 198- Surface 1647 1.429 TTL Chl. (9), p'p,DDE (7) 3.2 84.2 61 na na na na 0.3947001.0 Consolidated Slip- 198- Depth 2 1648 1.424 TTL PCB (5), DBA (1) 2.1 72.6 64 na na na na na
47004.0 Consolidated Slip- 200E- Surface 1656 1.289 Zn (1), TTL Chl. (9), p'p,DDE (7) 4.3 68.3 40 na na na na 0.3447004.0 Consolidated Slip- 200E- Depth 2 1657 4.377 TTL PCB (2), DBA (2), HMWPAH (1) 4.4 86.1 33 N na na na na na
47005.0 Consolidated Slip- 200T- Surface 1659 na Cr (1), Cu (2), Pb (2), Hg (4), Zn (1) 6.4 78.5 0 na na na na 0.5447005.0 Consolidated Slip- 200T- Depth 2 1660 na p'p,DDE (5), TTL PCB (8) 5.2 76.9 18 N na na na na na47005.0 Consolidated Slip- 200T- Depth 3 1661 na BAP (1), DBA (1) 6.9 87.2 13 N na na na na na
TBT (>95th)
47008.0 Consolidated Slip- Storm Drain 1663 1.608 Cd(1), TTL Chl (9), p'pDDE (6), TTL PCB (5) 4.0 75.4 52 na na na na 0.40
Category 6 - Stations with measured biological impact but chemistry values below thresholds or not measured.40002.1 West Basin- Pier 143 4 na 1.5 54.0 75 0 N 1 88 na 0.48
40002.2 West Basin- Pier 143 5 0.212 p'p,DDE (1) 0.9 75.5 78 0 N 0 N 29 na 0.50
40003.1 Turning Basin- Pier 151 7 0.168 p'p,DDE (1) 0.7 37.5 64 0 N 63 N 88 na 0.66
40003.3 Turning Basin- Pier 151 9 na 0.8 32.0 81 23 N 93 N 92 na 0.54

145
Table 22 continued. Categorization of Los Angeles Region Industrial Harbor stations based on chemistry, toxicity and benthiccommunity analysis. Shading indicates significant toxicity or benthic degradation. na = Not Analyzed; N = [ammonia] > thanthreshold effect value; S = [sulfide] > than threshold effect value; PW = Pore Water; SWI = Sediment-Water Interface.
Amphipod Larval Development - Ab or Urch.StationNumber
Station Name IDOrg ERMQ Selected Chemicals and factors by whichthey exceed ERM values
%TOC
%Fines
%Surv.
NH3
H2S100%PW
NH3
H2S50%PW
NH3
H2S25%PW
NH3
H2SUrchSWI
BenthicIndex
Category 6 - Stations with measured biological impact but chemistry values below thresholds or not measured.40004.1 Lower Main Channel 10 na 1.3 44.0 78 26 N 93 N 94 na 0.69
40004.2 Lower Main Channel 11 0.368 p'p,DDE (10) 3.4 88.7 80 69 N 95 N 95 na 0.5740004.2 Lower Main Channel 789 na 0.7 81.0 68 97 96 90 na na40004.2 Lower Main Channel- R1 830 0.195 1.6 36.1 91 0 N 0 0 na 0.4040004.2 Lower Main Channel- R2 831 0.209 1.2 37.0 91 0 0 41 na 0.2540004.2 Lower Main Channel- R3 832 0.242 2.1 54.4 93 0 13 63 na 0.30
40005.2 East Basin- Turning Basin 14 na 0.6 71.0 73 1 N 89 94 na 0.4740005.3 East Basin- Turning Basin 15 na 0.6 77.0 79 0 N 54 N 78 na 0.46
40006.3 Consolidated Slip 18 na 4.4 78.0 67 0 N 1 45 na 0.30
40007.1 Long Beach Harbor- Channel 2 19 na 1.2 75.0 82 0 92 91 na 0.52
40007.3 Long Beach Harbor- Channel 2 21 na 0.7 77.0 78 0 0 88 na 0.52
40008.2 East Basin- Pier C 23 na 0.5 63.0 78 3 N 95 98 na 0.52
40008.3 East Basin- Pier C 24 0.182 p'p,DDE (1) 0.8 70.9 76 0 N 93 93 na 0.62
40009.2 West Basin Entrance 26 na 0.4 73.0 81 0 N 96 95 na 0.71
40009.1 West Basin Entrance 25 0.160 p'p,DDE (1) 0.4 57.0 88 1 95 95 na 0.5340009.1 West Basin Entrance 790 na 0.8 77.0 60 99 81 88 na na40009.1 West Basin Entrance- R1 834 0.184 0.8 71.8 97 0 N 14 79 na 0.4640009.1 West Basin Entrance- R2 835 0.173 0.7 70.9 86 0 15 89 na 0.3840009.1 West Basin Entrance- R3 836 0.181 1.0 66.3 91 55 N 76 88 na 0.32
40009.3 West Basin Entrance 27 0.154 0.4 83.0 87 0 N 97 95 na 0.60

146
Table 22 continued. Categorization of Los Angeles Region Industrial Harbor stations based on chemistry, toxicity and benthiccommunity analysis. Shading indicates significant toxicity or benthic degradation. na = Not Analyzed; N = [ammonia] > thanthreshold effect value; S = [sulfide] > than threshold effect value; PW = Pore Water; SWI = Sediment-Water Interface.
Amphipod Larval Development - Ab or Urch.StationNumber
Station Name IDOrg ERMQ Selected Chemicals and factors by whichthey exceed ERM values
%TOC
%Fines
%Surv.
NH3
H2S100%PW
NH3
H2S50%PW
NH3
H2S25%PW
NH3
H2SUrchSWI
BenthicIndex
Category 6 - Stations with measured biological impact but chemistry values below thresholds or not measured.
40010.1 Off Cabrillo Beach 28 0.282 Cu (1), p'p,DDE (9) 2.9 93.0 92 93 96 97 na 0.6740010.1 Off Cabrillo Beach 136 0.260 2.3 88.1 89 2 2 53 na na40010.1 Off Cabrillo Beach 810 na 2.7 92.6 58 0 N 93 na na na40010.1 Off Cabrillo Beach- 1 1006 0.305 2.8 95.7 68 46 96 96 na 0.3440010.1 Off Cabrillo Beach- 1 1068 0.332 2.5 91.9 80 na na na na na40010.1 Off Cabrillo Beach- 2 1069 0.363 2.6 95.2 48 na na na na na40010.1 Off Cabrillo Beach- 3 1070 0.344 2.6 91.1 46 na na na na na40010.1 Off Cabrillo Beach 1331 na 2.9 96.3 92 na na na na na
40010.2 Off Cabrillo Beach 29 0.260 p'p,DDE (6) 2.5 76.3 88 94 97 96 na 0.7540010.2 Off Cabrillo Beach 137 na 1.3 72.0 89 0 1 48 na na40010.2 Off Cabrillo Beach- R2 1007 0.299 2.3 69.9 90 5 31 38 na 0.2740010.2 Off Cabrillo Beach- R1 1071 0.318 2.3 82.7 78 na na na na na40010.2 Off Cabrillo Beach- R2 1072 0.304 2.1 71.8 63 na na na na na40010.2 Off Cabrillo Beach- R3 1073 0.272 2.2 77.9 72 na na na na na40010.2 Off Cabrillo Beach 1332 na 2.9 95.0 83 na na na na na
40010.3 Off Cabrillo Beach 30 0.282 p'p,DDE (6) 1.1 90.0 91 96 93 92 na 1.0040010.3 Off Cabrillo Beach 138 na 1.3 95.0 84 0 7 50 na na40010.3 Off Cabrillo Beach- R3 1008 0.301 2.0 92.8 69 95 96 64 na 0.4340010.3 Off Cabrillo Beach- R1 1074 0.319 2.2 89.5 60 na na na na na40010.3 Off Cabrillo Beach- R2 1075 0.329 2.3 95.3 64 na na na na 0.6840010.3 Off Cabrillo Beach- R3 1076 0.258 2.0 90.3 48 na na na na na40010.3 Off Cabrillo Beach 1333 na 2.9 97.4 91 na na na na na
40011.1 Inner Harbor- Channel 3 31 0.326 p'p,DDE (2) 1.0 87.0 85 0 75 90 na 0.63
40011.2 Inner Harbor- Channel 3 32 0.304 p'p,DDE (2) 2.1 89.0 84 0 0 88 na 0.53

147
Table 22 continued. Categorization of Los Angeles Region Industrial Harbor stations based on chemistry, toxicity and benthiccommunity analysis. Shading indicates significant toxicity or benthic degradation. na = Not Analyzed; N = [ammonia] > thanthreshold effect value; S = [sulfide] > than threshold effect value; PW = Pore Water; SWI = Sediment-Water Interface.
Amphipod Larval Development - Ab or Urch.StationNumber
Station Name IDOrg ERMQ Selected Chemicals and factors by whichthey exceed ERM values
%TOC
%Fines
%Surv.
NH3
H2S100%PW
NH3
H2S50%PW
NH3
H2S25%PW
NH3
H2SUrchSWI
BenthicIndex
Category 6 - Stations with measured biological impact but chemistry values below thresholds or not measured.40012.1 Southeast Basin 34 0.197 p'p,DDE (2) 1.5 82.3 77 24 94 96 na 0.6140012.1 Southeast Basin 812 na 1.6 83.8 34 52 95 na na na40012.1 Southeast Basin- R1 1047 0.231 1.5 84.4 39 na na na na na40012.1 Southeast Basin- R2 1048 0.211 1.3 78.6 51 na na na na na40012.1 Southeast Basin- R3 1049 0.176 1.0 70.8 66 na na na na na40012.1 Southeast Basin 1632 0.249 1.6 81.1 99 0 S na na na 0.56
40012.3 Southeast Basin 36 na 0.7 79.0 69 8 N 63 94 na 0.68
40013.3 Inner Queensway Bay 39 na 1.7 91.0 81 6 N 90 92 na 0.46
40014.1 Outer Queensway Bay 40 na 0.9 89.0 78 0 N 93 N 87 na 0.42
40015.1 Fish Harbor Entrance 43 0.178 p'p,DDE (2) 0.9 63.1 83 51 N 98 96 na 0.6640015.1 Fish Harbor Entrance 1698 0.146 0.4 43.3 89 na na na na 0.7840015.1 Fish Harbor Entrance 1773 na na na 72 na na na 96 na
40015.2 Fish Harbor Entrance 44 0.134 p'p,DDE (2) 0.6 37.0 83 35 N 96 N 98 na 0.68
40016.2 Terminal Island STP 47 0.126 0.5 68.0 88 71 N 97 97 na 0.7540016.2 Terminal Island STP 793 na 1.0 86.0 63 89 86 87 na na
40017.1 Long Beach Channel 49 na 0.8 80.0 76 0 72 94 na 0.52
40017.2 Long Beach Channel 50 na 1.3 81.0 82 21 87 92 na 0.55
40017.3 Long Beach Channel 51 0.164 p'p,DDE (4) 1.4 83.5 88 51 N 90 92 na 0.6840017.3 Long Beach Channel 811 na 1.0 74.0 54 0 0 na na na40017.3 Long Beach Channel - R1 1059 0.190 1.4 87.5 71 na na na na na40017.3 Long Beach Channel - R2 1060 0.214 1.4 87.6 47 na na na na na40017.3 Long Beach Channel - R3 1061 0.168 1.4 75.9 61 na na na na na

148
Table 22 continued. Categorization of Los Angeles Region Industrial Harbor stations based on chemistry, toxicity and benthiccommunity analysis. Shading indicates significant toxicity or benthic degradation. na = Not Analyzed; N = [ammonia] > thanthreshold effect value; S = [sulfide] > than threshold effect value; PW = Pore Water; SWI = Sediment-Water Interface.
Amphipod Larval Development - Ab or Urch.StationNumber
Station Name IDOrg ERMQ Selected Chemicals and factors by whichthey exceed ERM values
%TOC
%Fines
%Surv.
NH3
H2S100%PW
NH3
H2S50%PW
NH3
H2S25%PW
NH3
H2SUrchSWI
BenthicIndex
Category 6 – Stations with measured biological impact but chemistry values below thresholds or not measured.40018.1 Long Beach Outer Harbor 18 52 na 0.6 71.0 67 0 87 90 na 0.51
40018.2 Long Beach Outer Harbor 18 53 na 0.8 77.0 79 0 1 94 na 0.50
40018.3 Long Beach Outer Harbor 18 54 0.208 p'p,DDE (3), TTL Chlordane (1) 1.4 79.1 93 92 N 91 93 na 0.5240018.3 Long Beach Outer Harbor 18- R1 884 0.233 1.3 75.1 93 0 91 89 na 0.2340018.3 Long Beach Outer Harbor 18- R2 885 0.253 1.5 79.9 91 0 91 94 na 0.3140018.3 Long Beach Outer Harbor 18- R3 886 0.255 1.3 76.5 89 0 34 81 na 0.2340018.3 Long Beach Outer Harbor 18- R1 1041 0.218 1.4 71.9 56 na na na na na40018.3 Long Beach Outer Harbor 18- R2 1042 0.266 1.3 79.1 70 na na na na 0.3040018.3 Long Beach Outer Harbor 18- R3 1043 0.211 1.1 71.4 72 na na na na na40018.3 Long Beach Outer Harbor 18- R1 1192 na 1.5 84.6 88 na na na na na40018.3 Long Beach Outer Harbor 18- R2 1193 na 1.5 88.1 89 na na na na na40018.3 Long Beach Outer Harbor 18- R3 1194 na 1.4 82.9 81 na na na na na40018.3 Long Beach Outer Harbor 18 1334 na 1.3 78.0 90 na na na na na40018.3 Long Beach Outer Harbor 18 1695 0.253 1.2 79.9 75 na na na 97 0.5840018.3 Long Beach Outer Harbor 18 1770 na na na 59 na na na 96 na
40020.1 Long Beach Outer Harbor 20 58 0.141 p'p,DDE (1) 0.5 57.0 83 0 6 64 na 0.63
40020.2 Long Beach Outer Harbor 20 59 0.150 p'p,DDE (2), TTL Chlordane (1) 1.1 64.7 92 0 15 91 na 0.8340020.2 Long Beach Outer Harbor 20 1696 0.232 1.0 81.2 81 na na na 95 0.81
40020.3 Long Beach Outer Harbor 20 60 0.164 p'p,DDE (2) 0.9 69.6 84 24 89 91 na 0.60
40030.1 San Pedro Breakwater 73 0.112 p'p,DDE (3) 0.3 82.0 90 0 N 0 36 na na
40030.2 San Pedro Breakwater 74 0.108 p'p,DDE (3) 0.3 29.0 94 0 N 49 90 na na

149
Table 22 continued. Categorization of Los Angeles Region Industrial Harbor stations based on chemistry, toxicity and benthiccommunity analysis. Shading indicates significant toxicity or benthic degradation. na = Not Analyzed; N = [ammonia] > thanthreshold effect value; S = [sulfide] > than threshold effect value; PW = Pore Water; SWI = Sediment-Water Interface.
Amphipod Larval Development - Ab or Urch.StationNumber
Station Name IDOrg ERMQ Selected Chemicals and factors by whichthey exceed ERM values
%TOC
%Fines
%Surv.
NH3
H2S100%PW
NH3
H2S50%PW
NH3
H2S25%PW
NH3
H2SUrchSWI
BenthicIndex
Category 6 - Stations with measured biological impact but chemistry values below thresholds or not measured.40030.3 San Pedro Breakwater 75 na p'p,DDE (3) 0.8 20.3 95 0 N 60 N 95 na na
40031.2 Palos Verdes- Swartz 6 77 0.366 p'pDDE (112), TTL DDT (1), TTL PCBs (1) 2.8 62.9 93 0 90 92 na 0.77
40031.2 Palos Verdes- Swartz 6- R1 1002 0.318 2.9 60.3 97 0 2 93 na 0.28
40031.2 Palos Verdes- Swartz 6- R2 1003 0.362 2.8 54.5 91 0 0 93 na 0.44
40031.2 Palos Verdes- Swartz 6- R3 1004 0.385 2.8 54.3 89 86 97 97 na 0.28
40031.2 Palos Verdes- Swartz 6- BLIND 1005 0.285 2.5 69.8 91 27 0 12 na na40031.2 Palos Verdes- Swartz 6- R1 1038 0.376 1.9 55.1 70 na na na na na40031.2 Palos Verdes- Swartz 6- R2 1039 0.425 2.0 60.3 87 na na na na na40031.2 Palos Verdes- Swartz 6- R3 1040 0.302 2.0 41.7 85 na na na na na40031.2 Palos Verdes- Swartz 6- R1 1189 na 2.6 58.6 86 na na na na na40031.2 Palos Verdes- Swartz 6- R2 1190 na 2.6 57.8 86 na na na na na40031.2 Palos Verdes- Swartz 6- R3 1191 na 2.8 61.8 91 na na na na na
40031.3 Palos Verdes- Swartz 6 78 0.470 p'p,DDE (81), TTL DDT (3), TTL PCB (1) 0.7 51.8 96 56 72 88 na 1.00
40032.1 San Pedro Bay- POLA 19 79 na p'p,DDE (2) na na 86 66 N 90 N 98 na 0.7940032.1 San Pedro Bay- POLA 19 103 0.104 0.4 26.0 94 0 N 11 N 90 na na
40032.2 San Pedro Bay- POLA 19 80 na p'p,DDE (2) 1.8 15.0 85 31 N 20 N 84 na 0.9240032.2 San Pedro Bay- POLA 19 104 0.099 0.3 40.0 94 0 N 16 N 10 na na40032.3 San Pedro Bay- POLA 19 81 0.112 p'p,DDE (5) 0.5 18.1 93 0 N 15 N 92 na 0.8440032.3 San Pedro Bay- POLA 19 105 0.137 0.3 40.0 86 0 N 0 N 61 na na
40033.1 Outer Harbor- POLA 10 82 0.278 p'p,DDE (16) 1.2 87.4 71 1 N 0 N 26 na 0.72
40033.2 Outer Harbor- POLA 10 83 na 0.6 92.0 70 9 N 87 N 97 na 0.62
40033.3 Outer Harbor- POLA 10 84 na 1.6 94.0 65 3 N 94 N 91 na 0.57
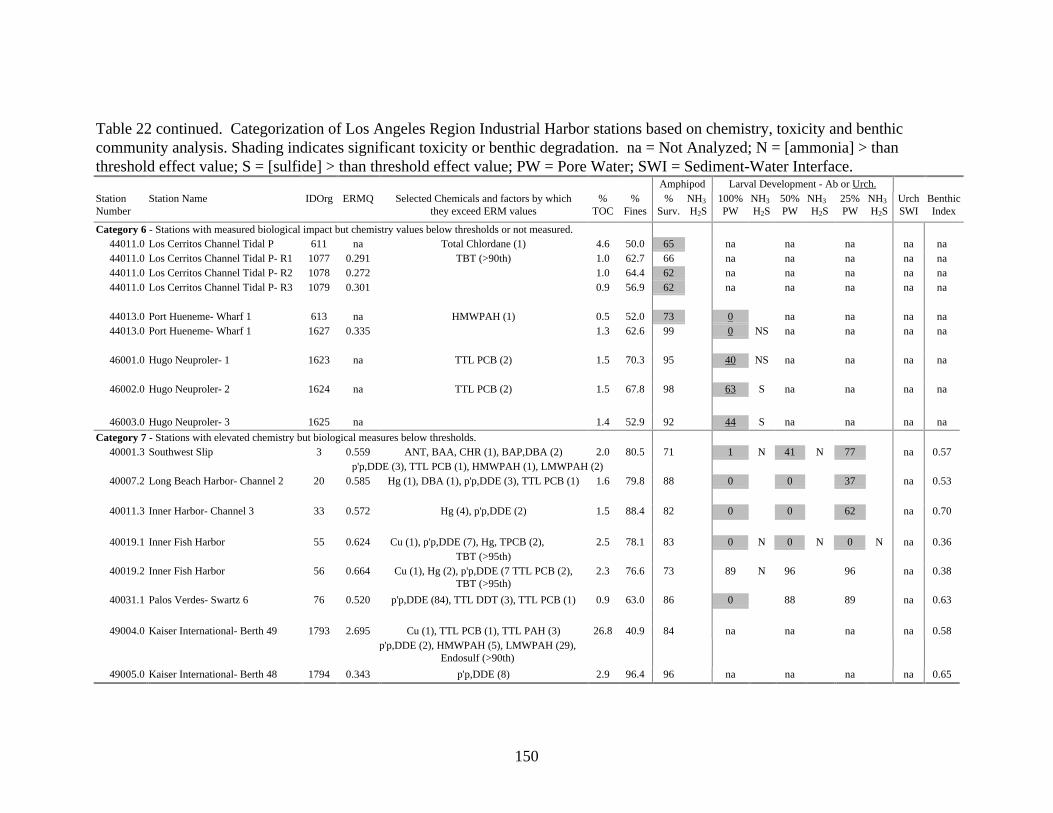
150
Table 22 continued. Categorization of Los Angeles Region Industrial Harbor stations based on chemistry, toxicity and benthiccommunity analysis. Shading indicates significant toxicity or benthic degradation. na = Not Analyzed; N = [ammonia] > thanthreshold effect value; S = [sulfide] > than threshold effect value; PW = Pore Water; SWI = Sediment-Water Interface.
Amphipod Larval Development - Ab or Urch.StationNumber
Station Name IDOrg ERMQ Selected Chemicals and factors by whichthey exceed ERM values
%TOC
%Fines
%Surv.
NH3
H2S100%PW
NH3
H2S50%PW
NH3
H2S25%PW
NH3
H2SUrchSWI
BenthicIndex
Category 6 - Stations with measured biological impact but chemistry values below thresholds or not measured.44011.0 Los Cerritos Channel Tidal P 611 na Total Chlordane (1) 4.6 50.0 65 na na na na na44011.0 Los Cerritos Channel Tidal P- R1 1077 0.291 TBT (>90th) 1.0 62.7 66 na na na na na44011.0 Los Cerritos Channel Tidal P- R2 1078 0.272 1.0 64.4 62 na na na na na44011.0 Los Cerritos Channel Tidal P- R3 1079 0.301 0.9 56.9 62 na na na na na
44013.0 Port Hueneme- Wharf 1 613 na HMWPAH (1) 0.5 52.0 73 0 na na na na44013.0 Port Hueneme- Wharf 1 1627 0.335 1.3 62.6 99 0 NS na na na na
46001.0 Hugo Neuproler- 1 1623 na TTL PCB (2) 1.5 70.3 95 40 NS na na na na
46002.0 Hugo Neuproler- 2 1624 na TTL PCB (2) 1.5 67.8 98 63 S na na na na
46003.0 Hugo Neuproler- 3 1625 na 1.4 52.9 92 44 S na na na na
Category 7 - Stations with elevated chemistry but biological measures below thresholds.40001.3 Southwest Slip 3 0.559 ANT, BAA, CHR (1), BAP,DBA (2) 2.0 80.5 71 1 N 41 N 77 na 0.57
p'p,DDE (3), TTL PCB (1), HMWPAH (1), LMWPAH (2)40007.2 Long Beach Harbor- Channel 2 20 0.585 Hg (1), DBA (1), p'p,DDE (3), TTL PCB (1) 1.6 79.8 88 0 0 37 na 0.53
40011.3 Inner Harbor- Channel 3 33 0.572 Hg (4), p'p,DDE (2) 1.5 88.4 82 0 0 62 na 0.70
40019.1 Inner Fish Harbor 55 0.624 Cu (1), p'p,DDE (7), Hg, TPCB (2), 2.5 78.1 83 0 N 0 N 0 N na 0.36TBT (>95th)
40019.2 Inner Fish Harbor 56 0.664 Cu (1), Hg (2), p'p,DDE (7 TTL PCB (2),TBT (>95th)
2.3 76.6 73 89 N 96 96 na 0.38
40031.1 Palos Verdes- Swartz 6 76 0.520 p'p,DDE (84), TTL DDT (3), TTL PCB (1) 0.9 63.0 86 0 88 89 na 0.63
49004.0 Kaiser International- Berth 49 1793 2.695 Cu (1), TTL PCB (1), TTL PAH (3) 26.8 40.9 84 na na na na 0.58p'p,DDE (2), HMWPAH (5), LMWPAH (29),
Endosulf (>90th)
49005.0 Kaiser International- Berth 48 1794 0.343 p'p,DDE (8) 2.9 96.4 96 na na na na 0.65

151
Table 22 continued. Categorization of Los Angeles Region Industrial Harbor stations based on chemistry, toxicity and benthiccommunity analysis. Shading indicates significant toxicity or benthic degradation. na = Not Analyzed; N = [ammonia] > thanthreshold effect value; S = [sulfide] > than threshold effect value; PW = Pore Water; SWI = Sediment-Water Interface.
Amphipod Larval Development - Ab or Urch.StationNumber
Station Name IDOrg ERMQ Selected Chemicals and factors by whichthey exceed ERM values
%TOC
%Fines
%Surv.
NH3
H2S100%PW
NH3
H2S50%PW
NH3
H2S25%PW
NH3
H2SUrchSWI
BenthicIndex
Category 8 - Stations with chemistry, toxicity and benthic degradation below thresholds, or not measured.40001.1 Southwest Slip 1 0.382 p'p,DDE (3) 1.6 70.1 65 72 N 93 N 93 na 0.47
40002.3 West Basin- Pier 143 6 na 0.9 60.0 74 0 N 0 N 65 N na 0.48
40003.2 Turning Basin- Pier 151 8 0.105 0.6 23.8 63 2 N 98 N 96 na 0.5040003.2 Turning Basin- Pier 152- R1 1053 0.105 0.3 16.3 85 na na na na na40003.2 Turning Basin- Pier 152- R2 1054 0.112 0.3 15.7 91 na na na na na40003.2 Turning Basin- Pier 152- R3 1055 0.133 1.1 20.6 82 na na na na na
40004.3 Lower Main Channel 12 0.336 p'p,DDE (8), TTL PCB (1) 0.9 82.0 81 79 N 91 N 97 na 0.54
40005.1 East Basin- Turning Basin 13 0.410 p'p,DDE (3), TTL PCB (1), TTL Chlr. (1) 2.0 51.6 74 0 N 42 98 na 0.42TBT (>95th)
40009.0 West Basin Entrance 1699 0.195 0.7 75.3 86 na na na 97 0.5740009.0 West Basin Entrance 1774 na na na 74 na na na 93 na
40012.2 Southeast Basin 35 0.198 p'p,DDE (2) 1.5 87.6 78 94 97 98 na 0.50
40013.2 Inner Queensway Bay 38 0.441 TTL Chlordane (3) 1.5 90.0 84 0 N 87 N 88 na 0.47
40014.2 Outer Queensway Bay 41 0.491 p'p,DDE (1), TTL Chlordane (3) 2.8 96.6 80 0 N 0 N 91 N na 0.41
40014.3 Outer Queensway Bay 42 0.475 p'p,DDE (1), TTL Chlordane (3) 2.3 94.4 64 0 N 90 N 89 na 0.41
40020.0 Long Beach Outer Harbor 20 1771 na na na 85 na na na 89 na

152
Table 22 continued. Categorization of Los Angeles Region Industrial Harbor stations based on chemistry, toxicity and benthiccommunity analysis. Shading indicates significant toxicity or benthic degradation. na = Not Analyzed; N = [ammonia] > thanthreshold effect value; S = [sulfide] > than threshold effect value; PW = Pore Water; SWI = Sediment-Water Interface.
Amphipod Larval Development - Ab or Urch.StationNumber
Station Name IDOrg ERMQ Selected Chemicals and factors by whichthey exceed ERM values
%TOC
%Fines
%Surv.
NH3
H2S100%PW
NH3
H2S50%PW
NH3
H2S25%PW
NH3
H2SUrchSWI
BenthicIndex
Category 8 - Stations with chemistry, toxicity and benthic degradation below thresholds, or not measured44055.0 L.B. Naval Station Pier 3- R1 1198 na 2.3 96.8 77 na na na na na44055.0 L.B. Naval Station Pier 3- R2 1199 na 1.2 85.0 86 na na na na na44055.0 L.B. Naval Station Pier 3- R3 1200 na 2.2 86.3 82 na na na na na
48009.0 San Pedro Bay- Outer Harbor 1694 0.391 p'p,DDE (1), TTL Chlordane (3) 0.4 75.9 96 na na na 95 0.7048009.0 San Pedro Bay- Outer Harbor 1769 na na na 85 na na na 63 na
49001.0 Cabrillo Beach Pier- West 1778 na 2.3 81.6 na na na na na na
49002.0 Cabrillo Beach Pier- Central 1779 na 1.4 100 na na na na na na
49003.0 Cabrillo Beach Pier- East 1780 na 1.4 100 na na na na na na
Category 9 - Reference stations.40015.3 Fish Harbor Entrance 45 0.173 0.8 29.4 92 10 N 96 98 na 0.7940015.3 Fish Harbor Entrance 792 na 0.6 61.0 75 91 83 89 na na
40008.1 East Basin- Pier C 22 0.228 p'p,DDE (1) 0.6 88.0 80 0 N 93 95 na 0.61
40016.3 Terminal Island STP 48 0.204 p'p,DDE (3) 0.6 91.0 80 95 N 97 96 na 0.68
40016.1 Terminal Island STP 46 0.175 p'p,DDE (4) 0.7 75.0 72 92 98 97 na 0.76
48010.0 Turning Basin 1697 0.216 TTL PCB (1) 0.3 30.8 95 na na na 72 0.6948010.0 Turning Basin 1772 na na na 69 na na na 87 na

153
Table 22 continued. Categorization of Los Angeles Region Industrial Harbor stations based on tissue chemistry analysis of fieldcollected fish and laboratory exposed bivalves. Shading indicates chemical concentrations in Macoma which were significantlyelevated relative to control values. Quotient value are derived from ratio of measured concentrations to US EPA screening values forTotal DDT and PCBs (refer to Table 21).
Station Tissue DDT PCB EPA
Number Station Name IDOrg Type Total Quotient Total Quotient Exceedances
Category 3 - Stations where field collected or laboratory exposed animals had elevated tissueconcentrations40009.0 West Basin Entrance- R1 1774.1 Macoma 15.49 16.526
40009.0 West Basin Entrance- R2 1774.2 Macoma 11.02 11.088
40009.0 West Basin Entrance- R3 1774.3 Macoma 18.86 17.598
40020.2 Long Beach Outer Harbor 20 1781.0 Croaker 1096.7 3.7 465.2 46.5 2
49001.0 Cabrillo Beach Pier- West 1778.1 Macoma 9.59 6.072
49001.0 Cabrillo Beach Pier- West 1782.0 Croaker 406.3 1.4 170.2 17 2
49001.0 Cabrillo Beach Pier- West 1785.0 Surfperch 51.2 0.2 40.1 4 1
49002.0 Cabrillo Beach Pier- Central- R1 1779.1 Macoma 11.96 5.53
49002.0 Cabrillo Beach Pier- Central- R2 1779.2 Macoma 18.74 8.406
49002.0 Cabrillo Beach Pier- Central- R3 1779.3 Macoma 18.16 15.338
49002.0 Cabrillo Beach Pier- Central 1783.0 Croaker 4984.8 16.6 686.6 68.7 2
49002.0 Cabrillo Beach Pier- Central 1786.0 Surfperch 68.5 0.2 37.9 3.8 1
49003.0 Cabrillo Beach Pier- East- R1 1780.1 Macoma 9.1 4.546
49003.0 Cabrillo Beach Pier- East- R2 1780.2 Macoma 13.43 5.272
49003.0 Cabrillo Beach Pier- East- R3 1780.3 Macoma 10.64 5.536
49003.0 Cabrillo Beach Pier- East 1784.0 Croaker 1839.2 6.1 407.3 40.7 2
49003.0 Cabrillo Beach Pier- East 1787.0 Surfperch 76.7 0.3 53.5 5.4 1

154
Table 23. ERM and PEL Quotients and Number of Sediment Quality GuidelineExceedances at Marina stations. Stations are ranked in descending order by ERMQuotient.
STANUM STATION IDORG LEG ERMQ PELQ ERM PELEXCDS EXCDS
48005.0 Marina Del Rey - C1 (X1) 1690 48 1.14 1.64 3 644014.0 Marina Del Rey - Rep 2 1081 26 1.09 1.59 7 744014.0 Marina Del Rey 614 11 0.92 1.42 8 744014.0 Marina Del Rey 1630 45 0.81 1.20 5 744014.0 Marina Del Rey - Rep 1 1080 26 0.84 1.25 6 744014.0 Marina Del Rey - Rep 3 1082 26 0.72 1.10 5 544020.0 Shoreline Marina - Rep 3 1067 25 0.89 1.20 3 644020.0 Shoreline Marina 1631 45 0.80 1.13 3 544020.0 Shoreline Marina - Rep 1 1065 25 0.73 1.03 3 644020.0 Shoreline Marina - Rep 2 1066 25 0.81 1.10 3 644020.0 Shoreline Marina 620 11 0.63 0.89 3 548006.0 Shoreline Marina - A1 (X1) 1691 48 1.03 1.40 5 548003.0 Marina Del Rey - B1 (X1) 1688 48 0.81 1.26 6 748001.0 Marina Del Rey - A1 (X1) 1686 48 0.65 0.95 6 648004.0 Marina Del Rey - B2 (X2) 1689 48 0.53 0.78 1 348002.0 Marina Del Rey - A2 (X2) 1687 48 0.52 0.81 3 344023.0 Channel Islands Harbor 623 11 0.41 0.64 3 440023.1 Alamitos Bay - Long Beach Marina 1701 48 0.40 0.54 2 240023.1 Alamitos Bay - Long Beach 67 4 NA NA NA NA40023.1 Alamitos Bay - Long Beach Marina 1776 53 NA NA 0 048007.0 Shoreline Marina - B1 (X1) 1692 48 0.38 0.54 2 448008.0 Shoreline Marina - C1 (X1) 1693 48 0.31 0.46 1 148011.0 King Harbor 1700 48 0.30 0.42 2 140022.2 Alamitos Bay - Entrance 65 4 0.25 0.36 2 140022.1 Alamitos Bay - Entrance 64 4 0.24 0.33 2 140022.3 Alamitos Bay - Entrance 66 4 NA NA NA NA40021.3 Alamitos Bay - Marine Stadium 63 4 0.18 0.26 0 048012.0 Channel Island Harbor - Front 1702 48 0.14 0.23 1 140021.1 Alamitos Bay - Marine Stadium 61 4 NA NA NA NA40021.2 Alamitos Bay - Marine Stadium 62 4 NA NA NA NA40023.2 Alamitos Bay - Long Beach 68 4 NA NA NA NA40023.3 Alamitos Bay - Long Beach 69 4 NA NA 0 044021.0 Ventura Marina 621 11 NA NA NA NA44023.0 Channel Islands Harbor – Rep 1 1207 30 NA NA NA NA44023.0 Channel Islands Harbor – Rep 2 1208 30 NA NA NA NA44023.0 Channel Islands Harbor – Rep 3 1209 30 NA NA NA NA48011.0 King Harbor 1775 53 NA NA 0 048012.0 Channel Island Harbor - Front 1777 53 NA NA 0 0

155
Table 24. Survival of Amphipods Rhepoxynius abronius (RA) or Eohaustorius estuarius (EE) in Marina Station Sediments. MN andSD = mean survival and standard deviation. * = significantly toxic using a t-test. ns = not significant. T = toxic using a t-test andrelative to the MSD value for these protocols. NT = Not Toxic. NA = Not Analyzed.
STANUM STATION IDORG LEG RA MN RA SD RA t-test RA MSD EE MN EE SD EE t-test EE MSD48005.0 Marina Del Rey - C1 (X1) 1690 48 NA NA NA NA 77.00 3.00 * NT44014.0 Marina Del Rey -Rep 2 1081 26 42.00 16.43 * T NA NA NA NA44014.0 Marina Del Rey 614 11 53.00 11.00 * T NA NA NA NA44014.0 Marina Del Rey 1630 45 NA NA NA NA 92.00 13.00 ns NT44014.0 Marina Del Rey -Rep 1 1080 26 32.00 14.40 * T NA NA NA NA44014.0 Marina Del Rey -Rep 3 1082 26 35.00 18.03 * T NA NA NA NA44020.0 Shoreline Marina - Rep 3 1067 25 73.00 12.04 * NT NA NA NA NA44020.0 Shoreline Marina 1631 45 NA NA NA NA 90.00 8.00 * NT44020.0 Shoreline Marina - Rep 1 1065 25 32.00 27.97 * T NA NA NA NA44020.0 Shoreline Marina - Rep 2 1066 25 59.00 22.75 * T NA NA NA NA44020.0 Shoreline Marina 620 11 28.00 9.10 * T NA NA NA NA48006.0 Shoreline Marina - A1 (X1) 1691 48 NA NA NA NA 80.00 0.00 * NT48003.0 Marina Del Rey - B1 (X1) 1688 48 NA NA NA NA 51.00 27.00 * T48001.0 Marina Del Rey - A1 (X1) 1686 48 NA NA NA NA 49.00 29.00 * T48004.0 Marina Del Rey - B2 (X2) 1689 48 NA NA NA NA 89.00 7.00 * NT48002.0 Marina Del Rey - A2 (X2) 1687 48 NA NA NA NA 65.00 6.00 * T44023.0 Channel Islands Harbor 623 11 48.00 13.50 * T NA NA NA NA40023.1 Alamitos Bay – Long Beach Marina 1701 48 NA NA NA NA 81.00 10.00 * NT40023.1 Alamitos Bay – Long Beach 67 4 81.00 18.20 ns NT NA NA NA NA40023.1 Alamitos Bay – Long Beach Marina 1776 53 NA NA NA NA 75.00 14.00 * NT48007.0 Shoreline Marina - B1 (X1) 1692 48 NA NA NA NA 71.00 35.00 ns NT48008.0 Shoreline Marina - C1 (X1) 1693 48 NA NA NA NA 91.00 7.00 ns NT48011.0 King Harbor 1700 48 NA NA NA NA 77.00 30.00 ns NT40022.2 Alamitos Bay - Entrance 65 4 92.00 7.60 ns NT NA NA NA NA40022.1 Alamitos Bay - Entrance 64 4 92.00 2.70 ns NT NA NA NA NA40022.3 Alamitos Bay - Entrance 66 4 81.00 7.40 * NT NA NA NA NA40021.3 Alamitos Bay - Marine Stadium 63 4 71.00 12.90 * NT NA NA NA NA

156
Table 24 continued. Survival of Amphipods Rhepoxynius abronius (RA) or Eohaustorius estuarius (EE) in Marina Station Sediments. MN andSD = mean survival and standard deviation. * = significantly toxic using a t-test. ns = not significant. T = toxic using a t-test and relative to theMSD value for these protocols. NT = Not Toxic. NA = Not Analyzed.
STANUM STATION IDORG LEG RA MN RA SD RA t-test RA MSD EE MN EE SD EE t-test EE MSD48012.0 Channel Island Harbor - Front 1702 48 NA NA NA NA 79.00 10.00 * NT40021.1 Alamitos Bay - Marine Stadium 61 4 75.00 11.70 * NT NA NA NA NA40021.2 Alamitos Bay - Marine Stadium 62 4 77.00 16.00 * NT NA NA NA NA40023.2 Alamitos Bay - Long Beach 68 4 79.00 12.90 * NT NA NA NA NA40023.3 Alamitos Bay - Long Beach 69 4 91.00 10.20 ns NT NA NA NA NA44021.0 Ventura Marina 621 11 67.00 8.40 * T NA NA NA NA44023.0 Channel Islands Harbor – Rep 1 1207 30 80.00 11.73 * NT NA NA NA NA44023.0 Channel Islands Harbor – Rep 2 1208 30 78.00 10.95 * NT NA NA NA NA44023.0 Channel Islands Harbor – Rep 3 1209 30 82.00 5.70 * NT NA NA NA NA48011.0 King Harbor 1775 53 NA NA NA NA 26.00 34.00 * T48012.0 Channel Island Harbor - Front 1777 53 NA NA NA NA 58.00 35.00 * T

157
Table 25. Spearman Rank Correlation Coefficients for selected chemicals significantlycorrelated with amphipod survival at Marina stations. * indicates significance at p<0.05;** indicates significance at p<0.01; *** indicates significance at p<0.001; N = 13, 25, or28 depending on chemical.
Chemical Spearman rho Significance
Arsenic -0.517 **
Copper -0.510 **
Lead -0.490 **
Mercury -0.421 **
Nickel -0.408 **
Zinc -0.539 **
Tributyltin -0.594 **
Fines -0.246 NS
Clay -0.542 *
TOC -0.209 NS
ERM Quotient -0.320 NS
PEL Quotient -0.350 *
# ERM Exceedances -0.321 *

158
Table 26. Spearman Rank Correlation Coefficients for selected chemicals significantlycorrelated with sea urchin development at the sediment-water interface at Marina stations. * indicates significance at p<0.05; ** indicates significance at p<0.01; *** indicatessignificance at p<0.001; N = 11 or 14 depending on chemical.
Chemical Spearman rho Significance
Pesticides
OP DDT -0.642 *Endosulfan -0.600 *Mirex -0.580 *PCBs
PCB 138 -0.555 *PCB 153 -0.627 *PCB 157 -0.549 *PCB 170 -0.682 *PCB 177 -0.582 *PCB 180 -0.591 *PCB 183 -0.691 *PCB 187 -0.545 *PCB 194 -0.609 *PCB 201 -0.629 *PCB 206 -0.664 *
Ammonia -0.749 **Hydrogen Sulfide -0.517 *Fines -0.246 NSClay -0.542 NSTOC -0.209 NSERM Quotient -0.320 NS# ERM Exceedances -0.321 NS

159
Table 27. Relative Benthic Index values for Marina stations. Station categories were D =Degraded (RBI<0.30); T = Transitional (RBI>0.31<0.60); U = Undegraded (RBI >0.61). NA = Not Analyzed.
STANUM STATION IDORG LEG Benthic Index Category48005.0 Marina Del Rey- C1 (X1) 1690 48 0.66 U44014.0 Marina Del Rey-Rep 2 1081 26 NA NA44014.0 Marina Del Rey 614 11 NA NA44014.0 Marina Del Rey 1630 45 0.34 T44014.0 Marina Del Rey-Rep 1 1080 26 NA NA44014.0 Marina Del Rey-Rep 3 1082 26 NA NA44020.0 Shoreline Marina- Rep 3 1067 25 NA NA44020.0 Shoreline Marina 1631 45 0.38 T44020.0 Shoreline Marina- Rep 1 1065 25 NA NA44020.0 Shoreline Marina- Rep 2 1066 25 NA NA44020.0 Shoreline Marina 620 11 NA NA48006.0 Shoreline Marina- A1 (X1) 1691 48 0.34 T48003.0 Marina Del Rey- B1 (X1) 1688 48 0.43 T48001.0 Marina Del Rey- A1 (X1) 1686 48 0.43 T48004.0 Marina Del Rey- B2 (X2) 1689 48 0.62 U48002.0 Marina Del Rey- A2 (X2) 1687 48 0.49 T44023.0 Channel Islands Harbor 623 11 NA NA40023.1 Alamitos Bay-Long Beach Marina 1701 48 0.66 U40023.1 Alamitos Bay- Long Beach 67 4 0.80 U40023.1 Alamitos Bay-Long Beach Marina 1776 53 NA NA48007.0 Shoreline Marina- B1 (X1) 1692 48 0.26 D48008.0 Shoreline Marina- C1 (X1) 1693 48 0.51 T48011.0 King Harbor 1700 48 0.64 U40022.2 Alamitos Bay- Entrance 65 4 0.73 U40022.1 Alamitos Bay- Entrance 64 4 0.70 U40022.3 Alamitos Bay- Entrance 66 4 0.70 U40021.3 Alamitos Bay- Marine Stadium 63 4 0.62 U48012.0 Channel Is. Harbor- Front 1702 48 0.75 U40021.1 Alamitos Bay- Marine Stadium 61 4 0.58 T40021.2 Alamitos Bay- Marine Stadium 62 4 0.39 T40023.2 Alamitos Bay- Long Beach 68 4 0.53 T40023.3 Alamitos Bay- Long Beach 69 4 0.58 T44021.0 Ventura Marina 621 11 NA NA44023.0 Channel Islands Harbor-Rep 1 1207 30 NA NA44023.0 Channel Islands Harbor-Rep 2 1208 30 NA NA44023.0 Channel Islands Harbor-Rep 3 1209 30 NA NA48011.0 King Harbor 1775 53 NA NA48012.0 Channel Is. Harbor- Front 1777 53 NA NA

160
Table 28. Spearman Rank Correlation Coefficients for selected chemicals significantlyCorrelated with Benthic Community Structure (as Relative Benthic Index = BI) at Marinastations. * indicates significance at p<0.05; ** indicates significance at p<0.01; ***indicates significance at p<0.001; N = 16.
Chemical Spearman rho Significance
Metals
Antimony -0.743 ***Chromium -0.720 **Copper -0.774 ***Lead -0.723 **Mercury -0.543 *Silver -0.446 *Zinc -0.752 ***
Pesticides
Trans Chlordane -0.500 *PP DDMU -0.675 **Dieldrin -0.525 *Cis Nonachlor -0.473 *Tributyltin -0.711 **
PCBs
PCB 44 -0.527 *PCB 52 -0.538 *PCB 66 -0.569 *PCB 101 -0.532 *PCB 118 -0.549 *PCB 187 -0.429 *PCB 195 -0.671 **PCB 209 -0.629 **Total PCBs -0.512 *
Fines -0.641 **TOC -0.664 **ERMQ -0.586 **ERM Exceedances -0.528 *

161
Table 29. Categorization of Los Angeles Region Marina stations based on chemistry, toxicity and benthic analysis. Shading indicatessignificant toxicity or benthic degradation. Shading indicates significant toxicity or benthic degradation. PW = Pore Water, SWI =Sediment-Water Interface.
Selected chemicals and Amphipod Abalone Development Urchin Dev.StationNumber
Station Name IDOrg ERMQ factors by which the exceedERM values
%TOC
%Fines
%Surv
NH3
H2S100%PW
NH3
H2S50%PW
NH3
H2S25%PW
NH3
H2S100%PW
NH3
H2SUrchin
SWINH3
H2SBenthicIndex
Category 5 - Stations with elevated chemistry and mixed results from biological indicators44014.0 Marina Del Rey 614 0.920 p'p DDE (2) 1.10 93 53 na na na na 2 na na44014.0 Marina Del Rey- R1 1080 0.843 TTL Chlor (4) 2.51 95 32 na na na na na na na44014.0 Marina Del Rey- R2 1081 1.086 TTL PCBs (2) 2.42 85 42 na na na na na na na44014.0 Marina Del Rey- R3 1082 0.720 Zn, Hg, Pb (1) 2.46 98 35 na na na na na na na44014.0 Marina Del Rey 1630 0.811 Cu (2), TBT (>90th) 2.08 88 92 na na na na 88 na na
44020.0 Shoreline Marina 620 0.628 TTL Chlor (8) 1.10 91 28 na 1 na na 87 na na44020.0 Shoreline Marina- R1 1065 0.733 p'p DDE (2) 2.93 62 32 na na na na na na na44020.0 Shoreline Marina- R2 1066 0.805 TTL PCBs (2) 2.86 100 59 na na na na na na na44020.0 Shoreline Marina- R3 1067 0.894 2.85 100 73 na na na na na na na44020.0 Shoreline Marina 1631 0.803 3.40 99 90 na na na na 0 NS na na
48001.0 Marina Del Rey - A1 (X1) 1686 0.651 Cu, Hg, Ni, Zn (1) 1.76 100 49 na na na na na 91 0.43p'pDDE (1), TTL Chlr (2)
48002.0 Marina Del Rey - A2 (X2) 1687 0.522 Cu, Zn (1), TTL Chlor (2) 1.42 100 65 na na na na na 38 0.49
48003.0 Marina Del Rey - B1 (X1) 1688 0.805 Cu, Ni, Zn (1), Hg (2) 2.26 100 51 na na na na na 78 0.43TTL Chlr(2), TTL PCBs (1)
Category 6 - Stations with measured biological impact but chemistry values below thresholds or not40021.1 Alamitos Bay- Mar. Stadium 61 na 0.60 53 75 0 15 97 na na na
40021.2 Alamitos Bay- Mar. Stadium 62 na 1.00 79 77 0 N 3 91 na na na
40023.1 Alamitos Bay- Long Beach 67 na 0.70 58 81 0 2 97 na na na40023.1 Alamitos Bay- Long Beach 1701 0.395 TTL Chlor. (2) 1.70 78 81 na na na40023.1 Alamitos Bay- LB Marina 1776 na p'pDDE (1) 75 na na na
40023.2 Alamitos Bay- Long Beach 68 na 0.80 53 79 0 N 0 N 61 na na na
40023.3 Alamitos Bay- Long Beach 69 na 0.70 32 91 0 N 0 81 na na na
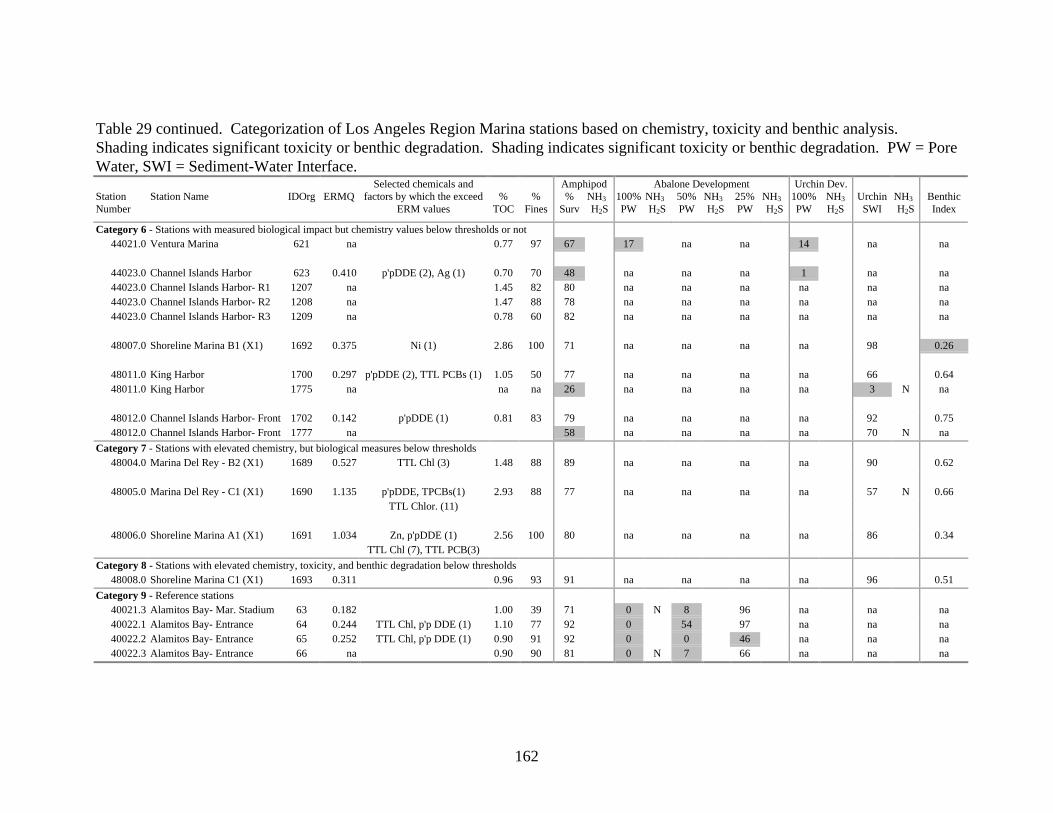
162
Table 29 continued. Categorization of Los Angeles Region Marina stations based on chemistry, toxicity and benthic analysis. Shading indicates significant toxicity or benthic degradation. Shading indicates significant toxicity or benthic degradation. PW = PoreWater, SWI = Sediment-Water Interface.
Selected chemicals and Amphipod Abalone Development Urchin Dev.StationNumber
Station Name IDOrg ERMQ factors by which the exceedERM values
%TOC
%Fines
%Surv
NH3
H2S100%PW
NH3
H2S50%PW
NH3
H2S25%PW
NH3
H2S100%PW
NH3
H2SUrchin
SWINH3
H2SBenthicIndex
Category 6 - Stations with measured biological impact but chemistry values below thresholds or not44021.0 Ventura Marina 621 na 0.77 97 67 17 na na 14 na na
44023.0 Channel Islands Harbor 623 0.410 p'pDDE (2), Ag (1) 0.70 70 48 na na na 1 na na44023.0 Channel Islands Harbor- R1 1207 na 1.45 82 80 na na na na na na44023.0 Channel Islands Harbor- R2 1208 na 1.47 88 78 na na na na na na44023.0 Channel Islands Harbor- R3 1209 na 0.78 60 82 na na na na na na
48007.0 Shoreline Marina B1 (X1) 1692 0.375 Ni (1) 2.86 100 71 na na na na 98 0.26
48011.0 King Harbor 1700 0.297 p'pDDE (2), TTL PCBs (1) 1.05 50 77 na na na na 66 0.6448011.0 King Harbor 1775 na na na 26 na na na na 3 N na
48012.0 Channel Islands Harbor- Front 1702 0.142 p'pDDE (1) 0.81 83 79 na na na na 92 0.7548012.0 Channel Islands Harbor- Front 1777 na 58 na na na na 70 N na
Category 7 - Stations with elevated chemistry, but biological measures below thresholds48004.0 Marina Del Rey - B2 (X1) 1689 0.527 TTL Chl (3) 1.48 88 89 na na na na 90 0.62
48005.0 Marina Del Rey - C1 (X1) 1690 1.135 p'pDDE, TPCBs(1) 2.93 88 77 na na na na 57 N 0.66TTL Chlor. (11)
48006.0 Shoreline Marina A1 (X1) 1691 1.034 Zn, p'pDDE (1) 2.56 100 80 na na na na 86 0.34TTL Chl (7), TTL PCB(3)
Category 8 - Stations with elevated chemistry, toxicity, and benthic degradation below thresholds48008.0 Shoreline Marina C1 (X1) 1693 0.311 0.96 93 91 na na na na 96 0.51
Category 9 - Reference stations40021.3 Alamitos Bay- Mar. Stadium 63 0.182 1.00 39 71 0 N 8 96 na na na40022.1 Alamitos Bay- Entrance 64 0.244 TTL Chl, p'p DDE (1) 1.10 77 92 0 54 97 na na na40022.2 Alamitos Bay- Entrance 65 0.252 TTL Chl, p'p DDE (1) 0.90 91 92 0 0 46 na na na40022.3 Alamitos Bay- Entrance 66 na 0.90 90 81 0 N 7 66 na na na

163
Table 30. ERM and PEL Quotients and Number of Sediment Quality GuidelineExceedances at Lagoon stations. Stations are ranked in descending order by ERMQuotient.
STANUM STATION IDORG LEG ERMQ PELQ ERM PELEXCDS EXCDS
44027.0 McGrath Lake Estuary 1628 45 2.92 4.01 3 444027.0 McGrath Lake Estuary 627 11 2.20 3.03 4 544027.0 McGrath Lake Estuary - Rep 1 1210 30 NA NA NA NA44027.0 McGrath Lake Estuary - Rep 2 1211 30 NA NA NA NA44027.0 McGrath Lake Estuary - Rep 3 1212 30 NA NA NA NA44017.0 Colorado Lagoon 617 11 2.27 3.38 8 1444024.0 Ballona Creek 624 11 1.80 2.68 4 944024.0 Ballona Creek – Rep 3 1085 26 1.61 2.30 5 844024.0 Ballona Creek – Rep 1 1083 26 1.33 1.92 5 644024.0 Ballona Creek – Rep 2 1084 26 1.17 1.68 6 848017.0 East Mugu Lagoon - C1 (X1) 1707 48 0.31 0.43 2 348015.0 Central Mugu Lagoon - B1 (X4) 1705 48 0.28 0.40 2 248016.0 Central Mugu Lagoon - B2 (X3) 1706 48 0.25 0.36 2 248018.0 East Mugu Lagoon - C2 (X2) 1708 48 0.22 0.34 2 248014.0 West Mugu Lagoon - A2 (X3) 1704 48 0.14 0.21 1 248013.0 West Mugu Lagoon - A1 (X2) 1703 48 0.12 0.17 1 144054.0 Mugu/Entrance - Rep 1 1629 45 0.07 0.10 1 044054.0 Mugu/Entrance - Rep 1 1213 30 NA NA NA NA44054.0 Mugu/Entrance - Rep 2 1214 30 NA NA NA NA44054.0 Mugu/Entrance - Rep 3 1215 30 NA NA NA NA44054.0 Mugu/Entrance 655 11 NA NA NA NA44016.0 Mugu Lagoon 616 11 NA NA NA NA44018.0 Malibu Lagoon 618 11 NA NA NA NA44026.0 Sim's Pond 626 11 NA NA NA NA44050.0 Callegus/Oxnard Ditch #3 651 11 NA NA NA NA44051.0 Mugu/Main Lagoon 652 11 NA NA NA NA44052.0 Mugu/Western Arm 653 11 NA NA NA NA44053.0 Mugu/Oxnard Ditch #1 654 11 NA NA NA NA44053.0 Mugu/Oxnard Ditch #1 - Rep 1 1216 30 NA NA NA NA44053.0 Mugu/Oxnard Ditch #1 - Rep 2 1217 30 NA NA NA NA44053.0 Mugu/Oxnard Ditch #1 - Rep 3 1218 30 NA NA NA NA44022.0 Ventura River Estuary 622 13 NA NA NA NA44025.0 Santa Clara River Estuary 625 13 NA NA NA NA

164
Table 31. Survival of Amphipods Rhepoxynius abronius (RA) or Eohaustorius estuarius (EE) in Marina Station Sediments. MN andSD = mean survival and standard deviation. * = significantly toxic using a t-test. ns = not significant. T = toxic using a t-test andrelative to the MSD value for these protocols. NT = Not Toxic. NA = Not Analyzed.
STANUM STATION IDORG LEG RA MN RA SD RA t-test RA MSD EE MN EE SD EE t-test EE MSD44027.0 Mcgrath Lake Estuary 1628 45 NA NA NA NA 81.00 9.00 * NT44027.0 Mcgrath Lake Estuary 627 11 16.00 11.90 * T NA NA NA NA44027.0 Mcgrath Lake Estuary-Rep 1 1210 30 72.00 13.51 * NT NA NA NA NA44027.0 Mcgrath Lake Estuary-Rep 2 1211 30 75.00 21.79 ns NT NA NA NA NA44027.0 Mcgrath Lake Estuary-Rep 3 1212 30 62.00 15.65 * T NA NA NA NA44017.0 Colorado Lagoon 617 11 NA NA NA NA 5.00 8.70 * T44024.0 Ballona Creek 624 11 49.00 12.40 * T NA NA NA NA44024.0 Ballona Creek Rep3 1085 26 42.00 11.51 * T NA NA NA NA44024.0 Ballona Creek-Rep 1 1083 26 54.00 14.75 * T NA NA NA NA44024.0 Ballona Creek-Rep 2 1084 26 60.00 16.83 * T NA NA NA NA48017.0 East Mugu Lagoon- C1 (X1) 1707 48 NA NA NA NA 78.00 9.00 * NT48015.0 Central Mugu Lagoon- B1 (X4) 1705 48 NA NA NA NA 17.00 13.00 * T48016.0 Central Mugu Lagoon- B2 (X3) 1706 48 NA NA NA NA 85.00 8.00 * NT48018.0 East Mugu Lagoon- C2 (X2) 1708 48 NA NA NA NA 84.00 4.00 * NT48014.0 West Mugu Lagoon- A2 (X3) 1704 48 NA NA NA NA 89.00 7.00 * NT48013.0 West Mugu Lagoon- A1 (X2) 1703 48 NA NA NA NA 87.00 10.00 * NT44054.0 Mugu/Entrance-Rep 1 1629 45 NA NA NA NA 99.00 2.00 ns NT44054.0 Mugu/Entrance-Rep 1 1213 30 51.00 5.48 * T NA NA NA NA44054.0 Mugu/Entrance-Rep 2 1214 30 69.00 6.52 * T NA NA NA NA44054.0 Mugu/Entrance-Rep 3 1215 30 78.00 9.08 * NT NA NA NA NA44054.0 Mugu/Entrance 655 11 14.00 17.80 * T NA NA NA NA44016.0 Mugu Lagoon 616 11 NA NA NA NA 66.00 11.40 * T44018.0 Malibu Lagoon 618 11 NA NA NA NA 87.00 9.10 * NT44026.0 Sim's Pond 626 11 NA NA NA NA 91.00 12.40 ns NT

165
Table 31 continued. Survival of Amphipods Rhepoxynius abronius (RA) or Eohaustorius estuarius (EE) in Marina Station Sediments. MN andSD = mean survival and standard deviation. * = significantly toxic using a t-test. ns = not significant. T = toxic using a t-test and relative to theMSD value for these protocols. NT = Not Toxic. NA = Not Analyzed.
STANUM STATION IDORG LEG RA MN RA SD RA t-test RA MSD EE MN EE SD EE t-test EE MSD44050.0 Callegus/Oxnard Ditch #3 651 11 NA NA NA NA 71.00 6.50 * T44051.0 Mugu/Main Lagoon 652 11 68.00 16.00 * T NA NA NA NA44052.0 Mugu/Western Arm 653 11 64.00 9.60 * T NA NA NA NA44053.0 Mugu/Oxnard Ditch #1 654 11 35.00 15.00 * T NA NA NA NA44053.0 Mugu/Oxnard Ditch #1 - Rep 1 1216 30 61.00 14.32 * T NA NA NA NA44053.0 Mugu/Oxnard Ditch #1 - Rep 2 1217 30 61.00 18.17 * T NA NA NA NA44053.0 Mugu/Oxnard Ditch #1 - Rep 3 1218 30 47.00 13.04 * T NA NA NA NA44022.0 Ventura River Estuary 622 13 NA NA NA NA 97.00 2.70 * NT44025.0 Santa Clara River Estuary 625 13 NA NA NA NA 99.00 2.20 ns NT

166
Table 32. Spearman Rank Correlation Coefficients for selected chemicals significantlycorrelated with amphipod survival at Lagoon stations. * indicates significance at p<0.05;** indicates significance at p<0.01; *** indicates significance at p<0.001; N = 12 or 14depending on chemical.
Chemical Spearman rho Significance
Metals
Antimony -0.543 *Copper -0.574 *Mercury -0.552 *Silver -0.495 *Zinc -0.673 *Tin -0.745 **
Pesticides
Total Chlordane -0.780 ***Total DDT -0.490 *Dieldrin -0.833 ***
PCBs
PCB18 -0.487 *PCB52 -0.482 *PCB66 -0.474 *PCB105 -0.501 *PCB138 -0.490 *
PAHs
Benzo)a)pyrene -0.735 **Benzo(e)pyrene -0.767 **Chrysene -0.732 **Fluoranthene -0.697 **1-Methylphenanthrene -0.794 ***Phenanthrene -0.771 ***LMW PAH -0.692 **HMW PAH -0.670 **Total PAHs -0.675 **
Fines -0.345 NSTOC -0.420 NSERM Quotient -0.763 **# ERM Exceedances -0.783 ***

167
Table 33. Relative Benthic Index values for Lagoon stations. Station categories were D= Degraded (RBI<0.30); T = Transitional (RBI>0.31<0.60); U = Undegraded (RBI>0.61). NA = Not Analyzed.
STANUM STATION IDORG LEG Benthic Index Category44027.0 McGrath Lake Estuary 1628 45 NA NA44027.0 McGrath Lake Estuary 627 11 NA NA44027.0 McGrath Lake Estuary - Rep 1 1210 30 NA NA44027.0 McGrath Lake Estuary - Rep 2 1211 30 NA NA44027.0 McGrath Lake Estuary - Rep 3 1212 30 NA NA44017.0 Colorado Lagoon 617 11 NA NA44024.0 Ballona Creek 624 11 NA NA44024.0 Ballona Creek - Rep3 1085 26 NA NA44024.0 Ballona Creek - Rep 1 1083 26 NA NA44024.0 Ballona Creek - Rep 2 1084 26 NA NA48017.0 East Mugu Lagoon - C1 (X1) 1707 48 0.01 D48015.0 Central Mugu Lagoon - B1 (X4) 1705 48 0.14 D48016.0 Central Mugu Lagoon - B2 (X3) 1706 48 0.03 D48018.0 East Mugu Lagoon - C2 (X2) 1708 48 0.03 D48014.0 West Mugu Lagoon - A2 (X3) 1704 48 0 D48013.0 West Mugu Lagoon - A1 (X2) 1703 48 0.13 D44054.0 Mugu/Entrance - Rep 1 1629 45 NA NA44054.0 Mugu/Entrance - Rep 1 1213 30 NA NA44054.0 Mugu/Entrance - Rep 2 1214 30 NA NA44054.0 Mugu/Entrance - Rep 3 1215 30 NA NA44054.0 Mugu/Entrance 655 11 NA NA44016.0 Mugu Lagoon 616 11 NA NA44018.0 Malibu Lagoon 618 11 NA NA44026.0 Sim's Pond 626 11 NA NA44050.0 Callegus/Oxnard Ditch #3 651 11 NA NA44051.0 Mugu/Main Lagoon 652 11 NA NA44052.0 Mugu/Western Arm 653 11 NA NA44053.0 Mugu/Oxnard Ditch #1 654 11 NA NA44053.0 Mugu/Oxnard Ditch #1 - Rep 1 1216 30 NA NA44053.0 Mugu/Oxnard Ditch #1 - Rep 2 1217 30 NA NA44053.0 Mugu/Oxnard Ditch #1 - Rep 3 1218 30 NA NA44022.0 Ventura River Estuary 622 13 NA NA44025.0 Santa Clara River Estuary 625 13 NA NA

168
Table 34. Results of tissue analyses of fish collected from Mugu Lagoon. Tissueconcentrations are shown for those chemicals that were elevated relative to the US EPAscreening values (Total DDT and Total PCBs only, as ng/g wet weight).
Station Station IDORG Fish TTL TTL TTL TTL EPA %Number Name Species DDT DDT PCB PCB Exceeds Lipid
(ng/g) Quot. (ng/g) Quot.
44016.0 Mugu Lagoon 283 Topsmelt 15.98 0.053 5.024 0.502 0 0.5244016.0 Mugu Lagoon 284 Shiner Surfperch 133.53 0.445 17.126 1.713 1 1.08
NAS Wildlife Guideline (whole fish) 50 500USEPA Screening Value (edible portion) 300 10

169
Table 35. Categorization of Los Angeles Region Lagoon stations based on chemistry, toxicity and benthic analysis. Shading indicatessignificant toxicity or benthic degradation. NA = Not Analyzed; N = ammonia concentrations greater than threshold effect value; PW = PoreWater; SSW = Subsurface Water; SWI = Sediment-Water Interface.
Selected chemicals and Amphipod Urch. Dev Ab. Dev Mussel Dev UrchinStationNumber
Station Name IDOrg ERMQ factors by which the exceedERM values
%TOC
%Fines
%Surv
NH3
H2S100%PW
NH3
H2S100%PW
NH3
H2S100%PW
NH3
H2S100%SSW
NH3
H2SSWI NH3
H2SBenthicIndex
Category 4 - Stations with elevated chemistry and biological impacts measured by either toxicity or benthos.44017.0 Colorado Lagoon 617 2.271 TTL PCB (1), TTL Chlr (22) 1.90 30 5 na na 0 N 77 na na
Dieldrin (3), p'pDDE (3)Pb, Zn (2), Phen (1)
44024.0 Ballona Creek 624 1.799 TTL Chlor (18) 3.00 65 49 N 0 N na na 59 na na44024.0 Ballona Creek- R1 1083 1.327 p'pDDE (4) 5.06 52 54 na na na na na na44024.0 Ballona Creek- R2 1084 1.169 TTL DDT, Dieldrin (3) 5.30 66 60 na na na na na na44024.0 Ballona Creek- R3 1085 1.607 Chlorpyr (>95th) 5.67 74 42 na na na na na na
44027.0 McGrath Lake Estuary 627 2.196 TTL Chlor (25) 1.00 97 16 na na 4 N 73 na na44027.0 McGrath Lake Estuary- R1 1210 na p'p DDE (57) 0.81 20 72 na na na na na na44027.0 McGrath Lake Estuary- R2 1211 na Dieldrin, TTL DDT (3) 0.54 12 75 na na na na na na44027.0 McGrath Lake Estuary- R3 1212 na Toxaphen. (>90th) 1.81 51 62 na na na na na na44027.0 McGrath Lake Estuary 1628 2.916 Endosulf. (95th) 2.46 90 81 90 na na na na na
Category 6 - Stations with measured biological impact but chemistry values below thresholds or not measured.44016.0 Mugu Lagoon 616 na 0.73 64 66 na na 100 74 na na
44018.0 Malibu Laboon 618 na 0.93 98 87 na na 100 42 na na
44026.0 Sim's Pond 626 na 2.40 83 91 na na 47 N 72 na na
44050.0 Callegus/Oxnard Ditch 3 651 na 0.45 63 71 na na na na na na
44051.0 Mugu- Main Lagoon 652 na 0.76 92 68 75 12 na na na na
44052.0 Mugu- Western Arm 653 na 0.66 99 64 10 na na na na na

170
Table 35 continued. Categorization of Los Angeles Region Lagoon stations based on chemistry, toxicity and benthic analysis. Shadingindicates significant toxicity or benthic degradation. NA = Not Analyzed; N = ammonia concentrations greater than threshold effect value;PW = Pore Water; SSW = Subsurface Water; SWI = Sediment-Water Interface.
Selected chemicals and Amphipod Urch. Dev Ab. Dev Mussel Dev UrchinStationNumber
Station Name IDOrg ERMQ factors by which the exceedERM values
%TOC
%Fines
%Surv
NH3
H2S100%PW
NH3
H2S100%PW
NH3
H2S100%PW
NH3
H2S100%SSW
NH3
H2SSWI NH3
H2SBenthicIndex
Category 6 - Stations with measured biological impact but chemistry values below thresholds or not measured.44053.0 Mugu/Oxnard Ditch 1 654 na 1.10 91 35 0 na na na na na44053.0 Mugu/Oxnard Ditch 1- R1 1216 na 2.79 84 61 na na na na na na44053.0 Mugu/Oxnard Ditch 1- R2 1217 na 2.96 85 61 na na na na na na44053.0 Mugu/Oxnard Ditch 1- R3 1218 na 2.71 93 47 na na na na na na
44054.0 Mugu- Entrance 655 na 0.70 80 14 N 0 N na na na na na44054.0 Mugu- Entrance- R1 1213 na 0.76 45 51 na na na na na na44054.0 Mugu- Entrance- R2 1214 na 0.38 21 69 na na na na na na44054.0 Mugu- Entrance- R3 1215 na 0.33 21 78 na na na na na na44054.0 Mugu- Entrance- R1 1629 0.068 p'p DDE (1) 0.50 19 99 0 NS na na na na na
48013.0 West Mugu Lagoon- A1 (X2) 1703 0.120 p'p DDE (1) 0.65 38 87 na na na na 97 0.13
48014.0 West Mugu Lagoon- A2 (X2) 1704 0.142 p'p DDE (2) 0.91 37 89 na na na na 82 0.00
48015.0 Central Mugu Lagoon- B1 (X4) 1705 0.280 TTL Chlr (2), p'pDDE (5) 0.56 82 17 na na na na 98 0.14Chlorpyr. (90th)
48016.0 Central Mugu Lagoon- B2 (X3) 1706 0.252 TTL Chlr (2), p'pDDE (4) 1.16 77 85 na na na na 89 0.03
48017.0 East Mugu Lagoon- C1 (X1) 1707 0.307 TTL Chlr (2), p'pDDE (6) 1.74 100 78 na na na na 13 0.01
48018.0 East Mugu Lagoon- C2 (X2) 1708 0.221 TTL Chlr (1), p'pDDE (5) 1.10 61 84 na na na na 22 N 0.03
Category 9 - Reference Stations44022.0 Ventura River Estuary 622 na 1.80 83 97 na na 100 100 na na
44025.0 Santa Clara River Estuary 625 na 0.05 79 99 na na 100 100 na na

171
Table 35 continued. Categorization of Los Angeles Region Lagoon stations based on tissue chemistry analysis of field collected fish. Quotient value are derived from ratio of measured concentrations to US EPA screening values for Total DDT and PCBs (refer to Table 34).
Station Station IDORG Fish TTL TTL TTL TTL EPANumber Name Species DDT DDT PCB PCB Exceeds
Quot. Quot.Category 3 - Stations where field collected animals had elevated tissue concentrations
44016.0 Mugu Lagoon 283 Topsmelt 15.98 0.053 5.024 0.502 0
44016.0 Mugu Lagoon 284 Shiner Surfperch 133.53 0.445 17.126 1.713 1

Figure 10 . Number of Industrial Harbor station samples exceedingeither the ERM or ERL sediment quality guidelines. (Total DDT wascompared to the Swartz et al. sediment effect concentration, 100 ug/g OC.* no ERL exceedances were calculated for Total DDT or Dieldrin; see textfor details).
>
>
ERM
ERL
172
0
20
40
60
80
100
120
* *

Outer Los Angeles/Long Beach Harbor Stations
40010
40033
40004
40015 40016
40032
40030
40017
40014
40018 40020
Port Hueneme
Cabrillo Beach
44012
44013
Solid-phase Toxicity to Amphipods
Toxic to t-test/MSD
Toxic to t-test
Not Toxic
4900549004
48009
40031
Palos Verdes
40031
49002
49003
49001
Copper Concentrations
> ERM; 270 ppm34 ppm to 270 ppm< ERL; 34 ppmNot Analyzed
Figures 11a, 11b, and 11c. Distribution of sediment samples in Outer Los Angeles and Long Beach Harbor (a), Port Hueneme (b), and Palos Verdes (c) exceeding the ERM for Copper.

Inner Los Angeles/Long Beach Harbor Stations
Consolidated Slip of Inner Los Angeles Harbor
Consolidated Slip
40002
4000140003
40005
40019
40011
40007
4000840013
40012
40009
47005
47009
40006
Copper Concentrations
> ERM; 270 ppm34 ppm to 270 ppm< ERL; 34 ppmNot Analyzed
47010
47007
47005
47004
47002
47001
47003
47008
47009
40006
44055
4600346002
4600148010
Figures 12a and 12b. Distribution of sediment samples in Inner Los Angeles and Long Beach Harbor (a) and Consolidated Slip (b) exceeding the ERM for Copper.

Outer Los Angeles/Long Beach Harbor Stations
40010
40033
40004
40015 40016
40032
40030
40017
40014
40018 40020
Port Hueneme
Cabrillo Beach
44012
44013
Solid-phase Toxicity to Amphipods
Toxic to t-test/MSD
Toxic to t-test
Not Toxic
4900549004
48009
40031
Palos Verdes
40031
49002
49003
49001
Total Chlordane Concentrations
> ERM; 6 ppb2 ppb to 6 ppb< ERL; 2 ppbNot Analyzed
175
Figures 13a, 13b, and 13c. Distribution of sediment samples in Outer Los Angeles and Long Beach Harbor (a), Port Hueneme (b), and Palos Verdes (c) exceeding the ERM for Total Chlordane.

Inner Los Angeles/Long Beach Harbor Stations
Consolidated Slip of Inner Los Angeles Harbor
Consolidated Slip
40002
4000140003
40005
40019
40011
40007
4000840013
40012
40009
47005
47009
40006
Total Chlordane Concentrations
> ERM; 6 ppb2 ppb to 6 ppb< ERL; 2 ppbNot Analyzed
47010
47007
47005
47004
47002
47001
47003
47008
47009
40006
44055
4600346002
4600148010
176
Figures 14a and 14b. Distribution of sediment samples in Inner Los Angeles and Long Beach Harbor (a), and Consolidated Slip (b), exceeding the ERM for Total Chlordane.

Outer Los Angeles/Long Beach Harbor Stations
40010
40033
40004
40015 40016
40032
40030
40017
40014
40018 40020
Port Hueneme
Cabrillo Beach
44012
44013
Solid-phase Toxicity to Amphipods
Toxic to t-test/MSD
Toxic to t-test
Not Toxic
4900549004
48009
40031
Palos Verdes
40031
49002
49003
49001
Total PCB Concentrations
> ERM; 180 ppb22.7 ppb to 180 ppb< ERL; 22.7 ppbNot Analyzed
177
Figures 15a, 15b, and 15c. Distribution of sediment samples in Outer Los Angeles and Long Beach Harbor (a), Port Hueneme (b), and Palos Verdes (c) exceeding the ERM for Total PCB.

Inner Los Angeles/Long Beach Harbor Stations
Consolidated Slip of Inner Los Angeles Harbor
Consolidated Slip
40002
4000140003
40005
40019
40011
40007
4000840013
40012
40009
47005
47009
40006
Total PCB Concentrations
> ERM; 180 ppb22.7 ppb to 180 ppb< ERL; 22.7 ppbNot Analyzed
47010
47007
47005
47004
47002
47001
47003
47008
47009
40006
44055
4600346002
4600148010
178
Figures 16a and 16b. Distribution of sediment samples in Inner Los Angeles and Long Beach Harbor (a), and Consolidated Slip (b), exceeding the ERM for Total PCB.

Outer Los Angeles/Long Beach Harbor Stations
40010
40033
40004
40015 40016
40032
40030
40017
40014
40018 40020
Port Hueneme
Cabrillo Beach
44012
44013
Solid-phase Toxicity to Amphipods
Toxic to t-test/MSD
Toxic to t-test
Not Toxic
4900549004
48009
40031
Palos Verdes
40031
49002
49003
49001
HMW PAH Concentrations
> ERM; 9.6 ppm1.7 ppm to 9.6 ppm< ERL; 1.7 ppmNot Analyzed
179
Figures 17a, 17b, and 17c. Distribution of sediment samples in Outer Los Angeles and LongBeach Harbor (a), Port Hueneme (b), and Palos Verdes (c) exceeding the ERM for High Molecular Weight PAH.

Inner Los Angeles/Long Beach Harbor Stations
Consolidated Slip of Inner Los Angeles Harbor
Consolidated Slip
40002
4000140003
40005
40019
40011
40007
4000840013
40012
40009
47005
47009
40006
HMW PAH Concentrations
> ERM; 9.6 ppm1.7 ppm to 9.6 ppm< ERL; 1.7 ppmNot Analyzed
47010
47007
47005
47004
47002
47001
47003
47008
47009
40006
44055
4600346002
4600148010
180
Figures 18a and 18b. Distribution of sediment samples in Inner Los Angeles and Long Beach Harbor (a), and Consolidated Slip (b), exceeding the ERM for High Molecular Weight PAH.

Outer Los Angeles/Long Beach Harbor Stations
40010
40033
40004
40015 40016
40032
40030
40017
40014
40018 40020
Port Hueneme
Cabrillo Beach
44012
44013
Solid-phase Toxicity to Amphipods
Toxic to t-test/MSD
Toxic to t-test
Not Toxic
4900549004
48009
40031
Palos Verdes
40031
49002
49003
49001
ERM Quotients
> 10.5 to 10.1 to 0.5< 0.1Not Analyzed
Figure 19a, 19b, and 19c. ERM values at Outer Los Angeles and Long Beach Harbor (a), Port Hueneme (b), and Palos Verdes (c), Sampling Stations.
181

Inner Los Angeles/Long Beach Harbor Stations
Consolidated Slip of Inner Los Angeles Harbor
Consolidated Slip
40002
4000140003
40005
40019
40011
40007
4000840013
40012
40009
47005
47009
40006
ERM Quotients
> 10.5 to 10.1 to 0.5< 0.1Not Analyzed
47010
47007
47005
47004
47002
47001
47003
47008
47009
40006
44055
4600346002
4600148010
Figures 20a and 20b. ERM values at Inner Los Angeles and Long Beach Harbor (a), and Consolidated Slip (b), Sampling Stations.
182

Outer Los Angeles/Long Beach Harbor Stations
40010
40033
40004
40015 40016
40032
40030
40017
40014
40018 40020
Port Hueneme
Cabrillo Beach
44012
44013
Solid-phase Toxicity to Amphipods
Toxic to t-test/MSD
Toxic to t-test
Not Toxic
4900549004
48009
40031
Palos Verdes
Solid-phase Toxicity to Amphipods
Toxic to t-test/MSD
Toxic to t-test
Not Toxic
40031
Figures 21a, 21b, and 21c. Toxicity of Sediment Samples in Outer Los Angeles and Long BeachHarbor (a), Port Hueneme (b), and Palos Verdes (c).
183

Inner Los Angeles/Long Beach Harbor Stations
Consolidated Slip of Inner Los Angeles Harbor
Consolidated Slip
Solid-phase Toxicity to Amphipods
Toxic to t-test/MSD
Toxic to t-test
Not Toxic
40002
4000148010
40003
46002
40005
40019
40011
40007
40008
40013
40012
40009
44055
47010
47007
47005
47004
47002
47001
47003
47008
47009
40006
46003
46001
Figures 22a and 22b. Toxicity of Sediment Samples in Inner Los Angeles and Long BeachHarbor (a), and Consolidated Slip (b).
184

Outer Los Angeles/Long Beach Harbor Stations
40010
40033
40004
40015 40016
40032
40030
40017
40014
40018 40020
Port Hueneme
Cabrillo Beach
44012
44013
4900549004
48009
40031
Palos Verdes
40031
100% Porewater Toxicity toHaliotis rufescens
Toxic to t-test/MSD
Toxic to t-test
Not Toxic
49003
49002
49001
Not Analyzed
Figures 23a, 23b, and 23c. Toxicity of Porewater Samples in Outer Los Angeles and Long Beach Harbor (a), Port Hueneme (b), and Palos Verdes (c).
185
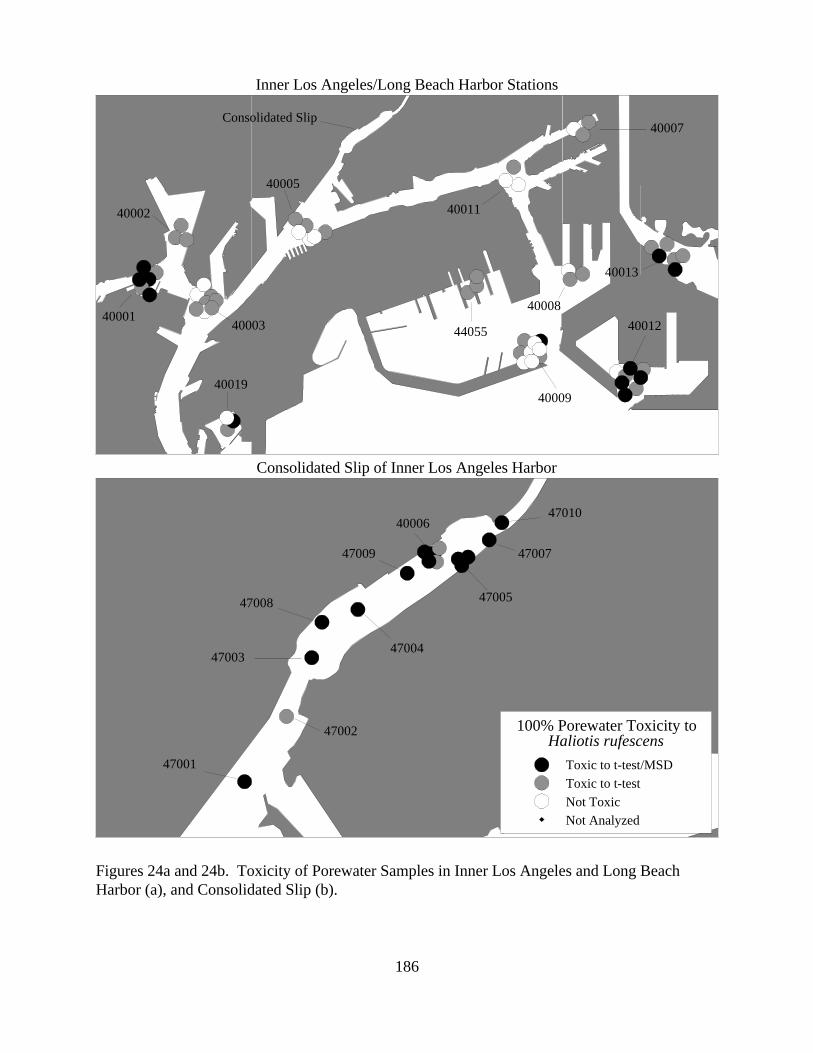
Inner Los Angeles/Long Beach Harbor Stations
Consolidated Slip of Inner Los Angeles Harbor
Consolidated Slip
40002
4000140003
40005
40019
40011
40007
40008
40013
40012
40009
40006
100% Porewater Toxicity toHaliotis rufescens
Toxic to t-test/MSD
Toxic to t-test
Not ToxicNot Analyzed
Figures 24a and 24b. Toxicity of Porewater Samples in Inner Los Angeles and Long Beach Harbor (a), and Consolidated Slip (b).
44055
47010
47007
47005
47004
47002
47001
47003
47008
47009
186

Figure 25. Amphipod survival at Industrial Harborstations in relation to Total Chlordane concentrations.Vertical line indicates ERM value.
B
B
B
B
BB
BB
B
BB
B
B
B
B
BB
B
BB
BB
BB
B
B
B
BB
B
B
B
BBBB
BBBBB BB
B
B
B
B
B
B
BB
BB
BBBB
B
B
BBBB
B
BBB
B
B
BB
BB
B
BB
B
B
B
BB
B
B
B
B B
B
BB
B
B
BB
B
B
BB
B
B
B
B
B
B
B
BB
BBB
B
B
B
B
B
BB
B
B
B
B
B
BBB
B
0.00
10.00
20.00
30.00
40.00
50.00
60.00
70.00
80.00
90.00
100.00
0.000 20.000 40.000 60.000 80.000 100.000 120.000
Total Chlordane (ng/g)
187

B
B
B
B
BB
BB
B
BB
B
B
BB
BB
BBB
BB
BB
B
B
B
BB
B
B
BBBB
BB
BBBBBB
B
B
B
B
B
BB
BB
BBBBB
B
BBBB
B
BBB
B
B
BB
BB
B
BB
B
B
BB
B
B
B
B
B B
B
BB
B
B
BB
B
B
BB
B
B
B
BB
B
BBB
BBB
B
B
B
B
B
BB
B
B
B
B
B
BB
B
B
0.00
10.00
20.00
30.00
40.00
50.00
60.00
70.00
80.00
90.00
100.00
0.000 0.500 1.000 1.500 2.000 2.500 3.000
B
B
B
B
BB
B B
B
BB
B
B
BB
BB
BBB
BB
BB
B
B
B
BB
B
B
BBBBB
BB
BBBBB
B
B
B
B
B
B
BB
BB
BBBBB
B
BBBB
B
BB
B
B
B
B B
BB
B
BB
B
B
BBB
B
B
B
B B
B
BB
B
B
BB
B
B
BB
B
B
B
BB
B
BBB
BBB
B
B
B
B
B
B
BB
B
B
B
B
B
BB
B
B
0.00
10.00
20.00
30.00
40.00
50.00
60.00
70.00
80.00
90.00
100.00
0 2 4 6 8 10 12 14 16 18
Number of ERM Exceedances
ERM Quotient
Figure 26. Amphipod survival at Industrial Harbor stations inrelation to average ERM Quotient and Number of ERMExceedances.
188

Figure 27. Relationship between abalone development in50% pore water concentration, average ERM Quotient,and Number of ERM Exceedances at Industrial Harborstations.
B
B
B
B
B
BBB
B
B
B
B
BB
BBBBBBBBBBBBBB
B
B
BB
B
B
BB
B B
B
B B
BB
B
BBB
B
B
B BB
B
B0.00
10.00
20.00
30.00
40.00
50.00
60.00
70.00
80.00
90.00
100.00
0 2 4 6 8 10 12 14 16 18
Number ERM Exceedances
B
B
B
B
B
BBB
B
B
B
B
BB
BBBBBBBBBBBBBB
B
B
BB
B
BB
B B
B
B B
BB
B
BBB
B
B
B BB
B
B0.00
10.00
20.00
30.00
40.00
50.00
60.00
70.00
80.00
90.00
100.00
0.000 0.500 1.000 1.500 2.000 2.500 3.000
ERM Quotient
189

Outer Los Angeles/Long Beach Harbor Stations
40010
40033
40004
40015 40016
40032
40030
40017
40014
40018 40020
Port Hueneme
Cabrillo Beach
44012
44013
Solid-phase Toxicity to Amphipods
Toxic to t-test/MSD
Toxic to t-test
Not Toxic
4900549004
48009
40031
Palos Verdes
40031
49002
49003
49001
Benthic Index
DegradedTransitionalUndegradedNot Analyzed
Figures 28a, 28b, and 28c. Distribution of Stations in Outer Los Angeles and Long Beach Harbor(a), Port Hueneme (b), and Palos Verdes (c), Demonstrating Benthic Community Structure.
190

Inner Los Angeles/Long Beach Harbor Stations
Consolidated Slip of Inner Los Angeles Harbor
Consolidated Slip
40002
40001
48010 40003
40005
40019
40011
40007
40008
40013
40012
40009
47010
47007
47005
47004
47002
47001
47003
47008
47009
40006
Benthic Index
DegradedTransitionalUndegradedNot Analyzed
Figures 29a and 29b. Distribution of Stations in Inner Los Angeles and Long Beach Harbor (a), and Consolidated Slip (b), Demonstrating Benthic Community Structure.
191

Figure 30. Relative Benthic Index at Industrial Harborstations in relation to ERM Quotient and Number of ERMExceedances
BB
B
B
B
B
BB
B
B
B
B
BB
B
B
B
B
B
B
B
B
B
BBBBB
BB
BBB
BB
B
BB B
B
B
BB
B
B
B
B
B
BB
B
BB
B
B
BB
B
BB
B
B
B
B
BB
B
BB
BB
B
B
B
B
B
B B
B
0.00
0.10
0.20
0.30
0.40
0.50
0.60
0.70
0.80
0.90
1.00
0.000 0.500 1.000 1.500 2.000 2.500 3.000ERM Quotient
BB
B
B
B
B
BB
B
B
B
B
BB
B
B
B
B
B
B
B
B
B
BBBBB
BB
BBB
BB
B
BB B
B
B
BB
B
B
B
B
B
BB
B
BB
B
B
BB
B
BB
B
B
B
B
BBB
B
BB
BB
B
B
B
B
B
B B
B
0.00
0.10
0.20
0.30
0.40
0.50
0.60
0.70
0.80
0.90
1.00
0 2 4 6 8 10 12 14 16 18Number of ERM Exceedances
192

Figure 31 . Number of Marina station samples exceeding either the ERM or ERLsediment quality guidelines. (Total DDT was compared to the Swartz et al.sediment effect concentration, 100 ug/g OC. * no ERL exceedances were calculatedfor Total DDT or Dieldrin; see text for details).
>
> ERL
ERM
0
5
10
15
20
25
**
193

Shoreline Marina
Los Alamitos Bay
48008
48006 44020
48007
40021
44011
4002340022
Copper Concentrations
> ERM; 270 ppm34 ppm to 270 ppm< ERL; 34 ppmNot Analyzed
194
Figures 32a and 32b. Distribution of samples in Shoreline Marina (a), and Los Alamitos Bay (b),exceeding the ERM for Copper.

King Harbor
Marina Del Rey
48011
48001
48002
48004
48005
48003
44014
Copper Concentrations
> ERM; 270 ppm34 ppm to 270 ppm< ERL; 34 ppmNot Analyzed
195
Figures 33a and 33b. Distribution of samples in King Harbor (a), and Marina Del Rey (b), exceeding the ERM for Copper.

Channel Islands Harbor
48012
44023
Copper Concentrations
> ERM; 270 ppm34 ppm to 270 ppm< ERL; 34 ppmNot Analyzed
196
Figure 34. Distribution of samples in Channel Islands Harbor exceeding the ERM for Copper.
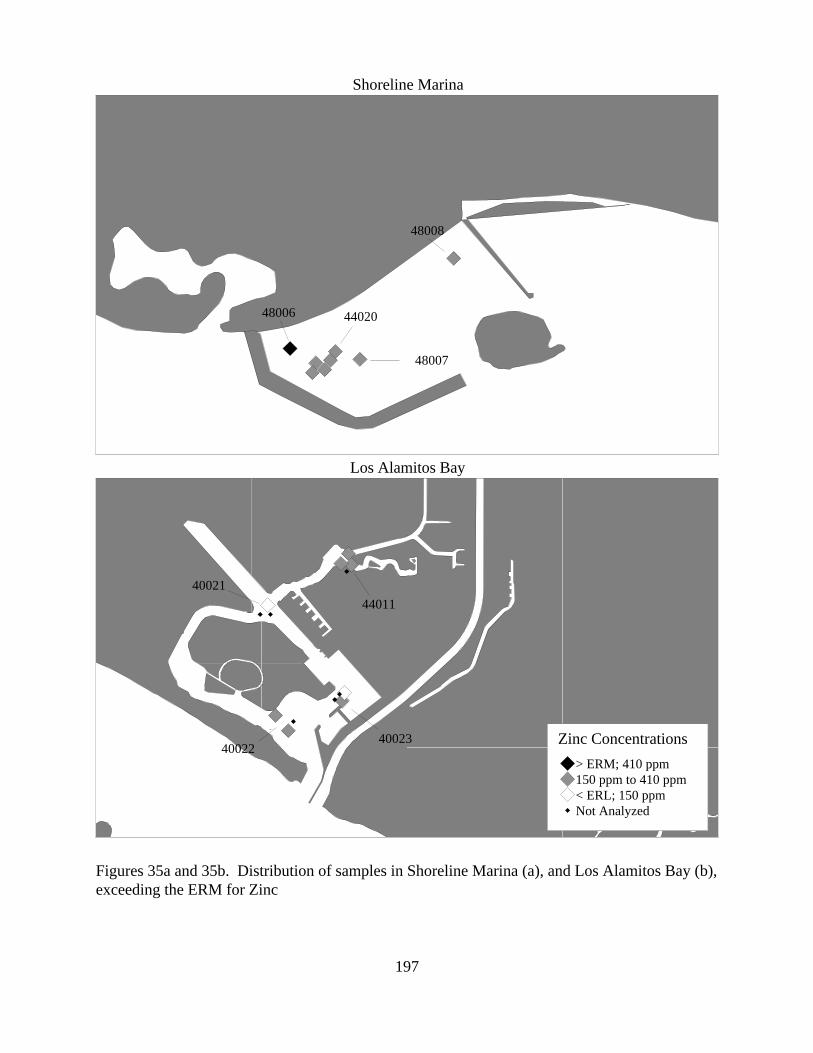
Shoreline Marina
Los Alamitos Bay
48008
48006 44020
48007
40021
44011
4002340022
Zinc Concentrations
> ERM; 410 ppm150 ppm to 410 ppm< ERL; 150 ppmNot Analyzed
197
Figures 35a and 35b. Distribution of samples in Shoreline Marina (a), and Los Alamitos Bay (b),exceeding the ERM for Zinc

King Harbor
Marina Del Rey
48011
48001
48002
48004
48005
48003
44014
Zinc Concentrations
> ERM; 410 ppm150 ppm to 410 ppm< ERL; 150 ppmNot Analyzed
198
Figures 36a and 36b. Distribution of samples in King Harbor (a), and Marina Del Rey (b), exceeding the ERM for Zinc

Channel Islands Harbor
48012
44023
Zinc Concentrations
> ERM; 410 ppm150 ppm to 410 ppm< ERL; 150 ppmNot Analyzed
199
Figure 37. Distribution of samples in Channel Islands Harbor exceeding the ERM for Zinc.

Shoreline Marina
Los Alamitos Bay
48008
48006 44020
48007
40021
44011
4002340022
Total Chlordane Concentrations
> ERM; 6 ppb2 ppb to 6 ppb< ERL; 2 ppbNot Analyzed
200
Figures 38a and 38b. Distribution of samples in Shoreline Marina (a), and Los Alamitos Bay (b),exceeding the ERM for Total Chlordane.

King Harbor
Marina Del Rey
48011
48001
48002
48004
48005
48003
44014
Total Chlordane Concentrations
> ERM; 6 ppb2 ppb to 6 ppb< ERL; 2 ppbNot Analyzed
209
Figures 39a and 39b. Distribution of samples in King Harbor (a), and Marina Del Rey (b), exceeding the ERM for Total Chlordane.

Channel Islands Harbor
48012
44023
Total Chlordane Concentrations
> ERM; 6 ppb2 ppb to 6 ppb< ERL; 2 ppbNot Analyzed
202
Figure 40. Distribution of samples in Channel Islands Harbor exceeding the ERM for TotalChlordane.

Shoreline Marina
Los Alamitos Bay
48008
48006 44020
48007
40021
44011
4002340022 Total PCB Concentrations
> ERM; 180 ppb22.7 ppb to 180 ppb< ERL; 22.7 ppbNot Analyzed
Figures 41a and 41b. Distribution of samples in Shoreline Marina (a), and Los Alamitos Bay (b),exceeding the ERM for Total PCB.
203

King Harbor
Marina Del Rey
48011
48001
48002
48004
48005
48003
44014
Total PCB Concentrations
> ERM; 180 ppb22.7 ppb to 180 ppb< ERL; 22.7 ppbNot Analyzed
Figures 42a and 42b. Distribution of samples in King Harbor (a), and Marina Del Rey (b), exceeding the ERM for Total PCB.
204

Channel Islands Harbor
48012
44023
Total PCB Concentrations
> ERM; 180 ppb22.7 ppb to 180 ppb< ERL; 22.7 ppbNot Analyzed
Figures 43. Distribution of samples in Channel Islands Harbor exceeding the ERM for TotalPCB.
205

Shoreline Marina
Los Alamitos Bay
48008
48006 44020
48007
40021
44011
4002340022
ERM Quotients
> 10.5 to 10.1 to 0.5
<0.1Not Analyzed
Figures 44a and 44b. ERM values at Shoreline Marina (a), and Los Alamitos Bay (b), Sampling Stations.
206

King Harbor
Marina Del Rey
48011
48001
48002
48004
48005
48003
44014
ERM Quotients
> 10.5 to 10.1 to 0.5
<0.1Not Analyzed
Figures 45a and 45b. ERM values at King Harbor (a), and Marina Del Rey (b), Sampling Stations.
207

Channel Islands Harbor
48012
44023
ERM Quotients
> 10.5 to 10.1 to 0.5
<0.1Not Analyzed
Figure 46. ERM values at Channel Islands Harbor Sampling Stations.
208

Shoreline Marina
Los Alamitos Bay
Toxic to t-test/MSDToxic to t-testNot Toxic
Solid-phase Toxicity to Amphipods
48008
4800644020
48007
4002144011
4002340022
Figures 47a and 47b. Toxicity of Sediment Samples in Shoreline Marina (a), and Los AlamitosBay (b).
209

King Harbor
Marina Del Rey
Ballona CreekToxic to t-test/MSD
Toxic to t-test
Not Toxic
Solid-phase Toxicity to Amphipods
48011
48001
48002
48004
48005
48003
44014
Figures 48a and 48b. Toxicity of Sediment Samples in King Harbor (a), and Marina Del Rey (b).
210

Ventura Marina
Channel Islands Harbor
48012
44023
44021
Toxic to t-test/MSD
Toxic to t-test
Not Toxic
Solid-phase Toxicity to Amphipods
Figures 49a and 49b. Toxicity of Sediment Samples in Ventura Harbor (a), and Channel Islands Harbor (b).
211

Figure 50. Amphipod survival at Marina stations in relation tocopper and TBT concentrations. Vertical line indicates ERMvalue for copper.
B
BB
B
B
B
B
B
B
B
B
B
BB
B
B
B
B
BB
B
B
BBB
0.00
10.00
20.00
30.00
40.00
50.00
60.00
70.00
80.00
90.00
100.00
Copper Concentration (ng/g)
B
BB
B
B
B
B
B
B
B
B
B
BB
B
B
B
B
BB
B
B
BBB
0.00
10.00
20.00
30.00
40.00
50.00
60.00
70.00
80.00
90.00
100.00
TBT Concentration (ng/g)
212

Shoreline Marina
Los Alamitos Bay
48008
48006
4402048007
40021
40023
40022
Benthic Index
DegradedTransitionalUndegradedNot Analyzed
Figures 51a and 51b. Distribution of Stations in Shoreline Marina (a), and Los Alamitos Bay (b),Demonstrating Benthic Community Structure.
213

King Harbor
Marina Del Rey
48011
4800148002
48004
48005
48003
44014
BallonaBenthic Index
DegradedTransitionalUndegradedNot Analyzed
Creek
Figures 52a and 52b. Distribution of Stations in King Harbor (a), and Marina Del Rey (b),Demonstrating Benthic Community Structure.
214

Ventura Marina
Channel Islands Harbor
48012
44021
Benthic Index
DegradedTransitionalUndegradedNot Analyzed
Figures 53a and 53b. Distribution of Stations in Ventura Harbor (a), and Channel Islands Harbor (b), Demonstrating Benthic Community Structure.
215

Figure 54 . Number of Lagoon station samples exceeding either the ERM or ERLsediment quality guidelines. (Total DDT was compared to the Swartz et al.sediment effect concentration, 100 ug/g OC. * no ERL exceedances were calculatedfor Total DDT or Dieldrin; see text for details).
>
>
ERM
ERL
0
2
4
6
8
10
12
14
* *
216

Zinc Concentrations
> ERM; 410 ppm150 ppm to 410 ppm< ERL; 150 ppmNot Analyzed
44050
44016
48015
48016
44051
4801344052
48014
4405344054
48017
48018
Figures 55. Distribution of samples in Mugu Lagoon exceeding the ERM for Zinc.

Figures 56a, 56b, and 56c. Distribution of samples in McGrath Lake (a), Ballona Creek (b), and Colorado Lagoon/Sims Pond (c), exceeding the ERM for Zinc.
McGrath Lake
Colorado Lagoon/Sims Pond
Ballona Creek
44017
44026
44024
44027
Colorado Lagoon
Sims PondZinc Concentrations
> ERM; 410 ppm150 ppm to 410 ppm< ERL; 150 ppmNot Analyzed

Total Chlordane Concentrations
> ERM; 6 ppb2 ppb to 6 ppb< ERL; 2 ppbNot Analyzed
44050
44016
48015
48016
44051
4801344052
48014
4405344054
48017
48018
Figures 57. Distribution of samples in Mugu Lagoon exceeding the ERM for Total Chlordane.

Figures 58a, 58b, and 58c. Distribution of samples in McGrath Lake (a), Ballona Creek (b), and Colorado Lagoon/Sims Pond (c), exceeding the ERM for Total Chlordane.
McGrath Lake
Colorado Lagoon/Sims Pond
Ballona Creek
44017
44026
44024
44027
Colorado Lagoon
Sims PondTotal Chlordane Concentrations
> ERM; 6 ppb2 ppb to 6 ppb< ERL; 2 ppbNot Analyzed

Dieldrin Concentrations
> ERM; 8 ppb< ERM; 8 ppbNot Analyzed
44050
44016
48015
48016
44051
4801344052
48014
4405344054
48017
48018
Figures 59. Distribution of samples in Mugu Lagoon exceeding the ERM for Dieldrin.

McGrath Lake
Colorado Lagoon/Sims Pond
Ballona Creek
44017
44026
44027
Colorado Lagoon
Sims Pond
Figures 60a, 60b, and 60c. Distribution of samples in McGrath Lake (a), Ballona Creek (b), and Colorado Lagoon/Sims Pond (c), exceeding the ERM for Dieldrin.
Dieldrin Concentrations
> ERM; 8 ppb< ERM; 8 ppbNot Analyzed

Mugu Lagoon
44050
44016
48015
48016
44051
4801344052
48014
4405344054
48017
48018
Total PCB Concentrations
> ERM; 180 ppb22.7 ppb to 180 ppb< ERL; 22.7 ppbNot Analyzed
223
Figure 61. Distribution of samples in Mugu Lagoon exceeding the ERM for Total PCB.

McGrath Lake
Colorado Lagoon
Colorado Lagoon/Sims Pond
Ballona Creek
44017
44026
44024
Total PCB Concentrations
> ERM; 180 ppb22.7 ppb to 180 ppb< ERL; 22.7 ppbNot Analyzed
44027
Colorado Lagoon
Sims Pond
224
Figures 62a, 62b, and 62c. Distribution of samples in McGrath Lake (a), Ballona Creek (b), and Colorado Lagoon/Sims Pond (c), exceeding the ERM for Total PCB.

Mugu Lagoon
44050
44016
48015
48016
44051
4801344052
48014
4405344054
48017
48018
ERM Quotients
> 10.5 to 10.1 to 0.5< 0.1Not Analyzed
Figure 63. ERM values at Mugu Lagoon Sampling Stations.
225

McGrath Lake
Colorado Lagoon
Colorado Lagoon/Sims Pond
Ballona Creek
44017
44026
44024
ERM Quotients
> 10.5 to 10.1 to 0.5< 0.1Not Analyzed
44027
Figures 64a, 64b, and 64c. ERM values at McGrath Lake (a), Ballona Creek (b), and Colorado Lagoon/Sims Pond (c), Sampling Stations.
226

Mugu Lagoon
Toxic to t-test/MSD
Toxic to t-test
Not Toxic
Solid-phase Toxicity to Amphipods
44050
44016
48015
48016
44051
4801344052
48014
44053 44054
48017
48018
Figure 65. Toxicity of Sediment Samples in Mugu Lagoon.
227

McGrath Lake
Colorado Lagoon
Colorado Lagoon/Sims Pond
Ballona Creek
Toxic to t-test/MSD
Toxic to t-test
Not Toxic
Solid-phase Toxicity to Amphipods
44017
44026
44024
44027
Figure 66a, 66b, and 66c. Toxicity of Sediment Samples in McGrath Lake (a), Ballona Creek (b), and Colorado Lagoon/Sims Pond (c).
228

Malibu Lagoon
Santa Clara River Estuary
Ventura River Estuary
Toxic to t-test/MSD
Toxic to t-test
Not Toxic
Solid-phase Toxicity to Amphipods
44025
44022
44018
Figures 67a, 67b, and 67c. Toxicity of Sediment Samples in Ventura River Estuary (a), SantaClara River Estuary (b), and Malibu Lagoon (c).
229

B
B
B
B
B
B
B
BB
B
B
B
B
0.00
10.00
20.00
30.00
40.00
50.00
60.00
70.00
80.00
90.00
0 5 10 15 20 25 30
Dieldrin Concentration (ng/g)
Figure 68. Amphipod survival at Lagoonstations in relation to Dieldrin concentrations.Vertical line indicates ERM guideline value.
230
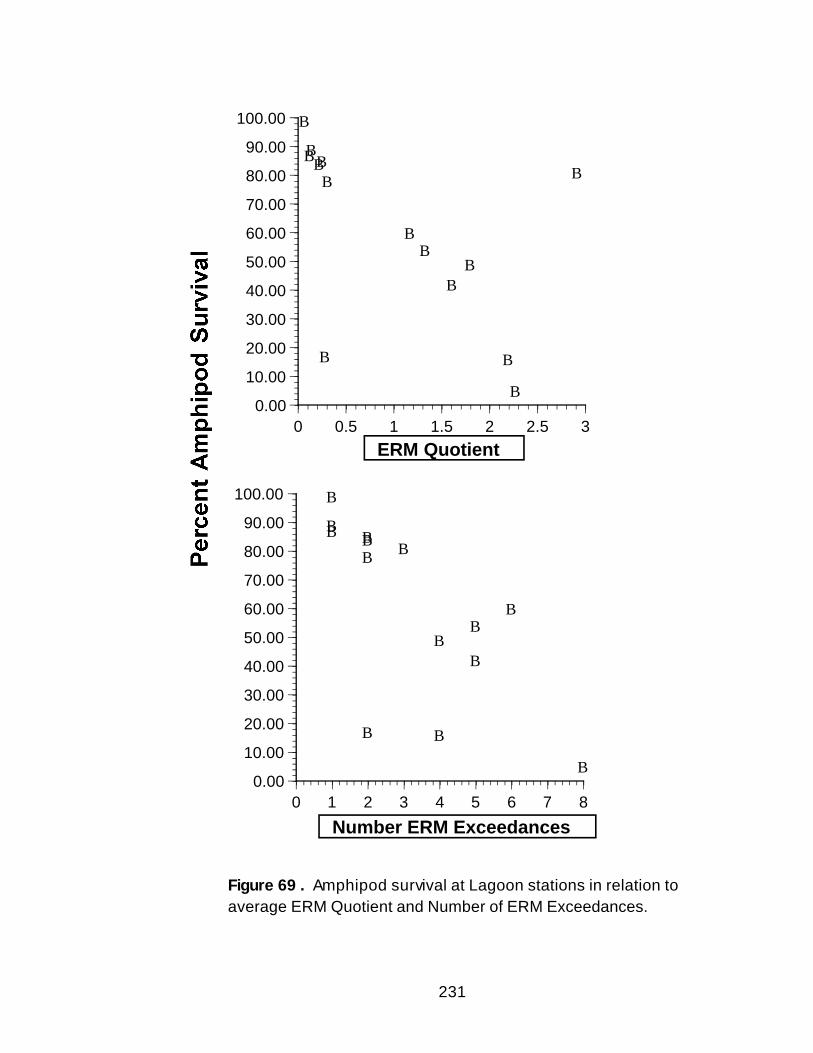
Figure 69 . Amphipod survival at Lagoon stations in relation toaverage ERM Quotient and Number of ERM Exceedances.
B
B
B
B
B
B
B
B
BB
B
B
B
B
0.00
10.00
20.00
30.00
40.00
50.00
60.00
70.00
80.00
90.00
100.00
0 0.5 1 1.5 2 2.5 3
ERM Quotient
B
B
B
B
B
B
B
B
BB
B
B
B
B
0.00
10.00
20.00
30.00
40.00
50.00
60.00
70.00
80.00
90.00
100.00
0 1 2 3 4 5 6 7 8
Number ERM Exceedances
231

Mugu Lagoon
48015
48016
4801348014
48017
48018
Benthic Index
DegradedTransitionalUndegradedNot Analyzed
Figure 70. Distribution of Stations in Mugu Lagoon Demonstrating Benthic Community Structure.
232