sediment quality of lakes, rivers, and estuaries in the mystic river
TRANSCRIPT

Sediment Quality of Lakes, Rivers, and Estuaries in the Mystic River Basin, Eastern Massachusetts, 2001–03
By Robert F. Breault, John L. Durant, and Albert Robbat, Jr.
In cooperation with the Massachusetts Department of Environmental Protection, Massachusetts Department of Conservation and Recreation, and Tufts University
Scientific Investigations Report 2005-5191
U.S. Department of the InteriorU.S. Geological Survey
U.S. Department of the InteriorGale A. Norton, Secretary
U.S. Geological SurveyP. Patrick Leahy, Acting Director
U.S. Geological Survey, Reston, Virginia: 2005
For sale by U.S. Geological Survey, Information Services Box 25286, Denver Federal Center Denver, CO 80225
For more information about the USGS and its products: Telephone: 1-888-ASK-USGS World Wide Web: http://www.usgs.gov/
Any use of trade, product, or firm names in this publication is for descriptive purposes only and does not imply endorsement by the U.S. Government.
Although this report is in the public domain, permission must be secured from the individual copyright owners to reproduce any copyrighted materials contained within this report.
Suggested citation:Breault, R.F., Durant, J.L., and Robbat, Albert, Jr., 2005, Sediment quality of lakes, rivers, and estuaries in the Mystic River Basin, eastern Massachusetts, 2001–03: U.S. Geological Survey Scientific Investigations Report 2005-5191, 110 p.
Contents
Abstract ...........................................................................................................................................................1Introduction.....................................................................................................................................................1
Background............................................................................................................................................3Purpose and Scope ..............................................................................................................................5Previous Studies ...................................................................................................................................5Sample Collection Methods and Analysis ........................................................................................5
Water Depths and Sediment Thickness ...................................................................................5Sample-Collection Design ........................................................................................................10Sample-Collection Techniques ................................................................................................10Chemical Analysis......................................................................................................................10Data-Analysis Methods ............................................................................................................10Bias and Variability ....................................................................................................................16
Water Depths and Sediment Thickness ...................................................................................................18Results for Sediment Grab Samples .........................................................................................................18
Spatial Trends in Sediment Quality ..................................................................................................18Effects of Human Activities on Sediment Quality ..........................................................................21Comparison to Other Urban Rivers ..................................................................................................22
Results for Sediment Core Samples .........................................................................................................24Trends in Sediment Quality ................................................................................................................24Human Activities and Sediment Quality ..........................................................................................25
Toxicity of Contaminated Bottom Sediment ...........................................................................................25Benthic Organisms .............................................................................................................................25Humans .................................................................................................................................................26
Summary........................................................................................................................................................27Acknowledgments .......................................................................................................................................27References Cited..........................................................................................................................................27
Figures 1. Map showing the location of the Mystic River Basin, Massachusetts. ..............................2 2. Photographs showing A, tugboat operation; B, shipping; C, typical industry;
and D, remedial action on a contaminated waterway in the lower Mystic River, Massachusetts ...................................................................................................................4
3, 4. Maps showing: 3. Sediment grab and core sampling locations, Mystic River Basin ..............................9 4. Altitude of streambed, sediment thickness, or both in the Mystic River
Basin: A, Lower Mystic Lake; B, Alewife Brook and its confluence with the upper Mystic River; and C, upper Mystic River and the Malden River above the Amelia Earhart Dam.............................................................................11
iii
5, 6. Photographs showing: 5. A, U.S. Geological Survey personnel collecting a sediment grab sample;
B, sediment collected in the dredge; C, transfer of sediment sample from the dredge into a Teflon bag; and D, a waterlogged sediment sample collected from the lower Mystic River ............................................................15
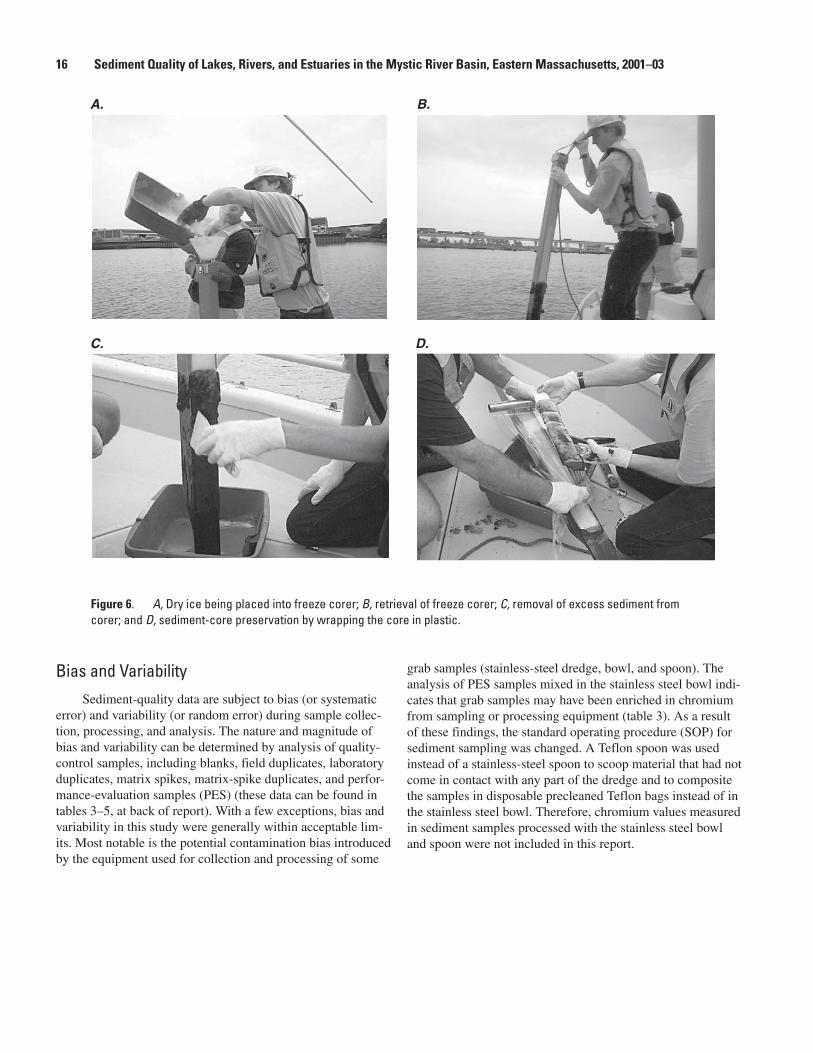
6. A, Dry ice being placed into freeze corer; B, retrieval of freeze corer; C, removal of excess sediment from corer; and D, sediment-core preservation by wrapping the core in plastic ..............................................................16
7. Graph showing population statistics for element and polyaromatic hydrocarbon concentrations measured in grab samples collected from the Mystic River Basin, and other urban rivers (2001–03) ...................................................19
8. Map showing areas dredged as part of the Boston Harbor Navigation Improvement Project, in which the lower Mystic River and Inner Harbor were deepened from 35 feet mean lower low water (MLLW) to about 40 feet MLLW (light blue) and parts of Chelsea Creek from 35 feet MLLW to about 38 feet MLLW (dark blue) ...........................................................................................................23
9–16. Graphs showing: 9. Selected trace element and organic compound concentrations
measured in sediment core samples collected from site 105, Lower Mystic Lake, Mystic River Basin ....................................................................................33
10. Selected trace element and organic compound concentrations measured in sediment core samples collected from site 106, upper Mystic River above Amelia Earhart Dam, Mystic River Basin ..................................34
11. Selected trace element and organic compound concentrations measured in sediment core samples collected from site 107, Malden River, Mystic River Basin .................................................................................................35
12. Selected trace element and organic compound concentrations measured in sediment core samples collected from site 108, upper Mystic River about 180 meters above the Amelia Earhart Dam, Mystic River Basin .........................................................................................................................36
13. Selected trace element and organic compound concentrations measured in sediment core samples collected from site 109, upper Mystic River about 90 meters above Amelia Earhart Dam, Mystic River Basin ...................................................................................................................................37
14. Selected trace element and organic compound concentrations measured in sediment core samples collected from site 110, lower Mystic River about 45 meters below the Amelia Earhart Dam, Mystic River Basin .........................................................................................................................38
15. Selected trace element and organic compound concentrations measured in sediment core samples collected from site 111, lower Mystic River about 475 meters below the Amelia Earhart Dam, Mystic River Basin .........................................................................................................................39
16. Selected trace element and organic compound concentrations measured in sediment core samples collected from site 112, Island End River, Mystic River Basin .........................................................................................40
17. Map showing estimated sediment toxicity to Hyalella azteca and Chiromonus spp. with respect to consensus-based freshwater sediment- quality guidelines ........................................................................................................................41
iv
Tables 1. Bottom-sediment sampling sites in the Mystic River Basin, Massachusetts ....................6 2. Constituents analyzed in sediment samples from the Mystic River Basin
and their common sources and uses ......................................................................................17 3. Distribution of element and organic compound concentrations measured
in sediment grab samples, Mystic River Basin ......................................................................45 4. Distribution of element concentrations measured in sediment core samples,
Mystic River Basin ......................................................................................................................76 5. Distribution of organic compound concentrations measured in sediment
core samples, Mystic River Basin ...........................................................................................91
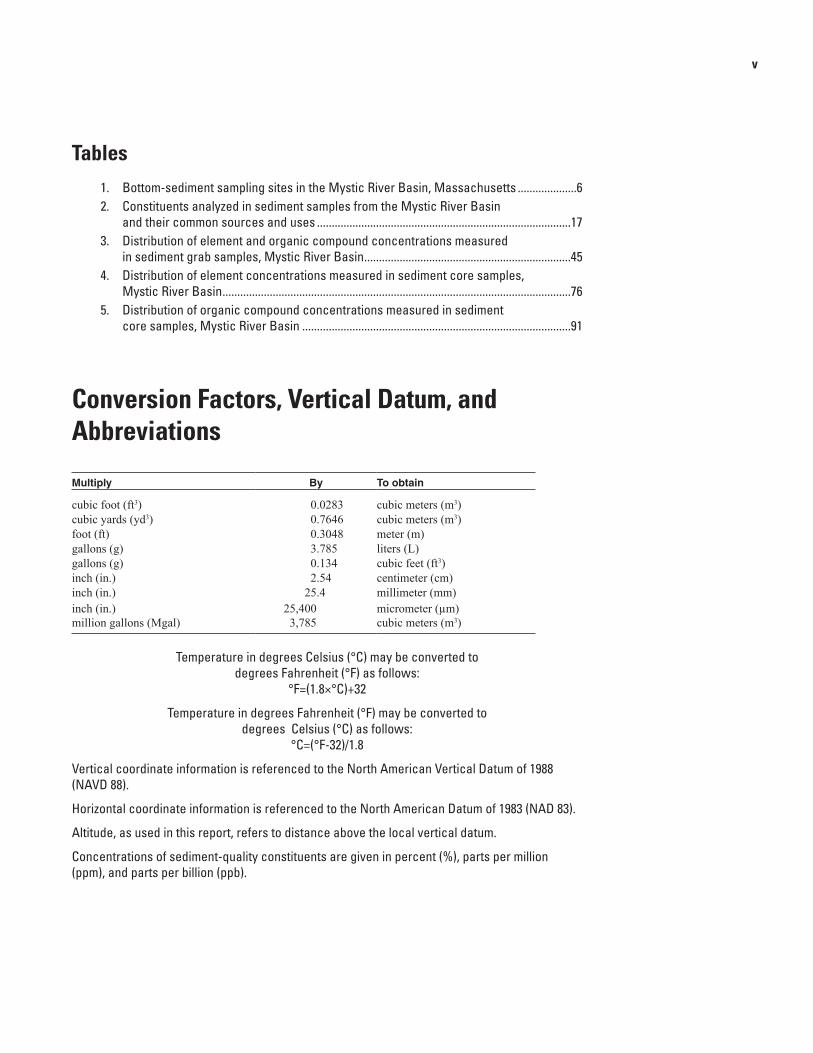
Conversion Factors, Vertical Datum, and Abbreviations
Multiply By To obtain
cubic foot (ft3) 0.0283 cubic meters (m3)cubic yards (yd3) 0.7646 cubic meters (m3)foot (ft) 0.3048 meter (m)gallons (g) 3.785 liters (L)gallons (g) 0.134 cubic feet (ft3)inch (in.) 2.54 centimeter (cm)inch (in.) 25.4 millimeter (mm)inch (in.) 25,400 micrometer (µm)million gallons (Mgal) 3,785 cubic meters (m3)
Temperature in degrees Celsius (°C) may be converted to degrees Fahrenheit (°F) as follows:
°F=(1.8×°C)+32
Temperature in degrees Fahrenheit (°F) may be converted to degrees Celsius (°C) as follows:
°C=(°F-32)/1.8
Vertical coordinate information is referenced to the North American Vertical Datum of 1988 (NAVD 88).
Horizontal coordinate information is referenced to the North American Datum of 1983 (NAD 83).
Altitude, as used in this report, refers to distance above the local vertical datum.
Concentrations of sediment-quality constituents are given in percent (%), parts per million (ppm), and parts per billion (ppb).
v
BHNIP BostonHarborNavigationImprovementProjectCCAG ChelseaCreekActionGroupCSO combinedseweroverflowDCR DepartmentofConservationandRecreationDDD dichlorodiphenyldichloroethaneDDE dichlorodiphenyldichlorethyleneDDT dichlorodiphenyltrichloroethaneGCMS gaschromatographymassspectrometryGIS geographicinformationsystemGPS globalpositioningsystemHCl hydrochloricacidHSSR HydrogeochemicalandStreamSedimentReconnaissanceMDEP MassachusettsDepartmentofEnvironmentalProtectionMassPort MassachusettsPortAuthorityMDCR MassachusettsDepartmentofConservationandRecreationMDC MassachusettsDistrictCommissionMDL methoddetectionlimitMIT MassachusettsInstituteofTechnologyMLLW meanlowerlowwaterMRL minimumreportinglevelMWRA MassachusettsWaterResourcesAuthorityMyRWA MysticRiverWatershedAssociationNAWQA NationalWater-QualityAssessmentNURE NationalUraniumResourceEvaluationPAHs polyaromatichydrocarbonsPCBs polychlorinated biphenyls PEC probable-effectconcentrationPES performance-evaluationsamplesSOP standardoperatingprocedureΣ sumTIN triangularirregularnetworkUSACE U.S.ArmyCorpsofEngineersUSEPA U.S.EnvironmentalProtectionAgency
vi
Sediment Quality of Lakes, Rivers, and Estuaries in the Mystic River Basin, Eastern Massachusetts, 2001–03
By Robert F. Breault1, John L. Durant2, and Albert Robbat, Jr.2
AbstractThe U.S. Geological Survey, in cooperation with the
Massachusetts Department of Environmental Protection, Massachusetts Department of Conservation and Recreation, and Tufts University, completed a study of bottom-sediment quality in selected lakes, rivers, and estuaries in the Mystic River Basin, 2001–03. More than 100 bottom-sediment grab samples and 8 bottom-sediment cores were collected from the study area that included the Lower Mystic Lake, Mystic River, Alewife Brook, Malden River, Island End River, Chelsea and Mill Creeks, and Boston Inner Harbor. Sediment grab and sediment core samples were tested for the presence of pesti-cides, polyaromatic hydrocarbons (PAHs), polychlorinated biphenyls, and trace elements.
Both types of samples were generally enriched in toxic elements, in particular, arsenic, chromium, copper, lead, silver, zinc, and PAHs with respect to background concentrations and concentrations measured in sediment from other urban rivers. There were only a few detections of pesticides and no polychlorinated biphenyl detections above detection limits. Locally, concentrations of most trace elements and PAHs were lower in the sediments in the Mystic River Basin than in the lower Charles River, but higher than or equal to concentration in the Neponset River, with the notable exception of arsenic. Some chemicals also are in sufficiently high concentrations in Mystic River sediment to pose a threat to benthic organisms and potentially to cause health risks to humans if they come in contact with the sediment. Increasing concentrations with sedi-ment depth in cores show that the deposition of trace elements and PAHs has substantially declined over the past 50 years or so. However, concentrations of PAHs are generally higher in the top few centimeters of sediment, indicating that sediment contaminant concentrations in the basin remain elevated above background.
IntroductionRestoration of lakes, rivers, and estuaries in the Boston
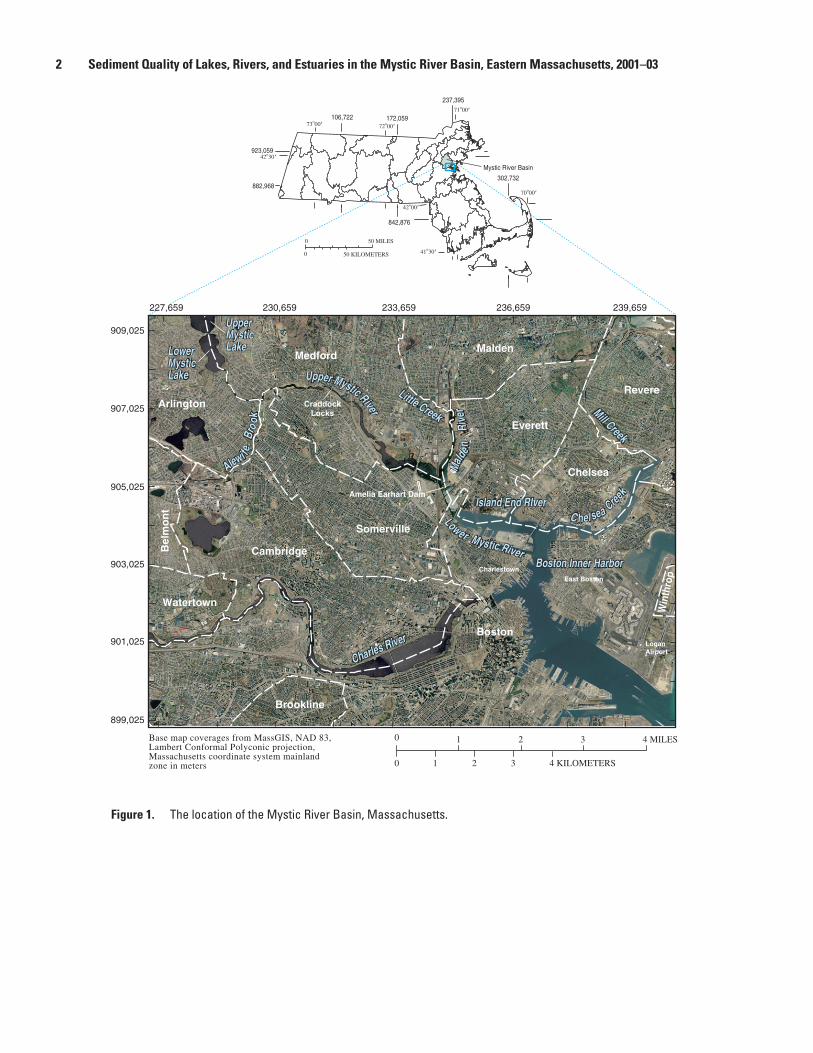
metropolitan area has improved water and sediment quality and has generally made it safer for people to boat, swim, and fish in these waters. For example, during the past 10 years, Federal, State, and local institutions have collaborated to achieve the common goal of restoring the Charles River, a tributary to Boston Harbor (Breault and others, 2000; Zarriello and others, 2003; Weiskel, 2005). This initiative, known locally as Clean Charles River 2005, has realized substantial improvements in the water quality of the Charles River, and now serves as a model for other urban river-restoration proj-ects across the nation. The initiative, which includes water-quality monitoring, collaborative studies, and the removal of illegal sewer connections, has been applied to lakes, rivers, and estuaries of the Mystic River Basin (fig. 1). This new initiative was motivated in part by the former administrator of the U.S. Environmental Protection Agency’s (USEPA) New England Office, John DeVillars, who stated: “Our strategy is working * * * well on the Charles; it’s time to put it to work on the Mystic. For too many years, the Mystic River has suf-fered from discharges of polluted storm water. A comprehen-sive strategy * * * will go a long way to returning this resource to better days” (U.S. Environmental Protection Agency, 2003). On November 30, 1998, the USEPA and the Massachusetts Department of Environmental Protection (MDEP) announced a program designed to improve the quality of the water in the Mystic River Basin, including Lower Mystic Lake, Mystic River, Alewife Brook, Malden River, Island End River, Chelsea and Mill Creeks, and Boston Inner Harbor. This program is known locally as the Clean Mystic River 2010.
1U.S. Geological Survey.
2Tufts University.
2 Sediment Quality of Lakes, Rivers, and Estuaries in the Mystic River Basin, Eastern Massachusetts, 2001–03
Figure 1. The location of the Mystic River Basin, Massachusetts.
50 MILES0
50 KILOMETERS0
Arlington
Bel
mo
nt
MedfordMalden
Revere
Everett
Chelsea
Somerville
Cambridge
Watertown
Boston
Win
thro
p
Mill Creek
Mill Creek
Amelia Earhart Dam
Brookline
East BostonCharlestown
LoganAirport
CraddockLocks
UpperMysticLake
Lower Mystic River
Malde
nRi
ver
Charles River
Upper Mystic River
C hel sea Creek
Boston Inner Harbor
Alewi fe
Bro
ok
Island End RIver
Charles River
Upper Mystic River
C hel sea Creek
Boston Inner Harbor
UpperMysticLakeLower
MysticLake
LowerMysticLake
Malde
nRi
ver
Alewi fe
Bro
ok
Island End RIver
Lower Mystic River
Little Creek
Little Creek
842,876
302,732
106,722 172,059
237,395
923,059
882,968
73o00'
42o30'
42o00'
41o30'
72o00'
71o00'
70o00'
Mystic River Basin
909,025
907,025
905,025
903,025
901,025
899,025
227,659 230,659 233,659 236,659 239,659
0
0
1
1 2 3 4 MILES
2 3 4 KILOMETERS
Base map coverages from MassGIS, NAD 83,Lambert Conformal Polyconic projection,Massachusetts coordinate system mainlandzone in meters
Background
New Englanders and their water resources are closely connected. As early as colonial times, New England rivers were dammed for power production, fished for food, and used for waste disposal and the transportation of goods. The rivers of the Mystic River Basin, just north of Boston, which was the leading commercial port in colonial America, were well suited for these purposes. Tidally influenced until the early 1900s, the Mystic River was the site of mills, brickyards, tanneries, and shipyards (Mystic River Watershed Association, 2004). The “Blessing of the Bay,” the first ocean-going ship built in Massachusetts, was launched from the shores of the Mystic River in 1631. The waters of the Mystic River Basin also have historical importance—the first naval battle of the American Revolution took place in Chelsea Creek on May 27, 1775. In this battle, the colonists destroyed the British schooner Diana (Chelsea Historical Society, 2004).
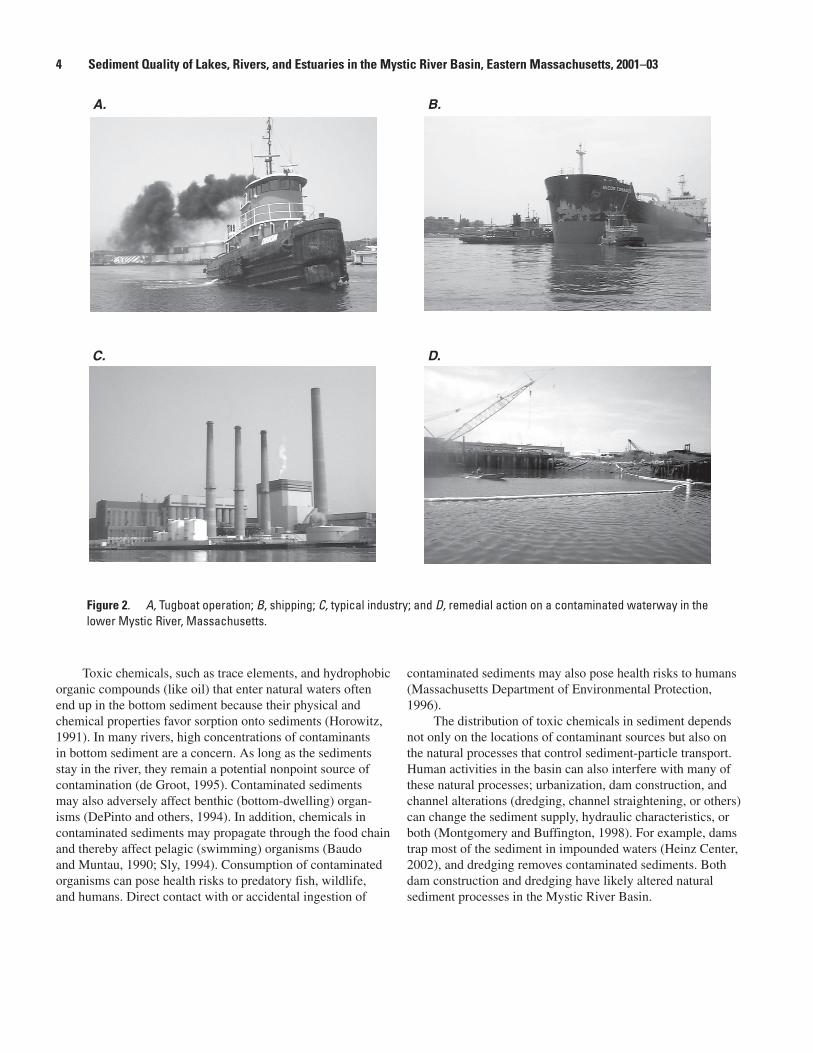
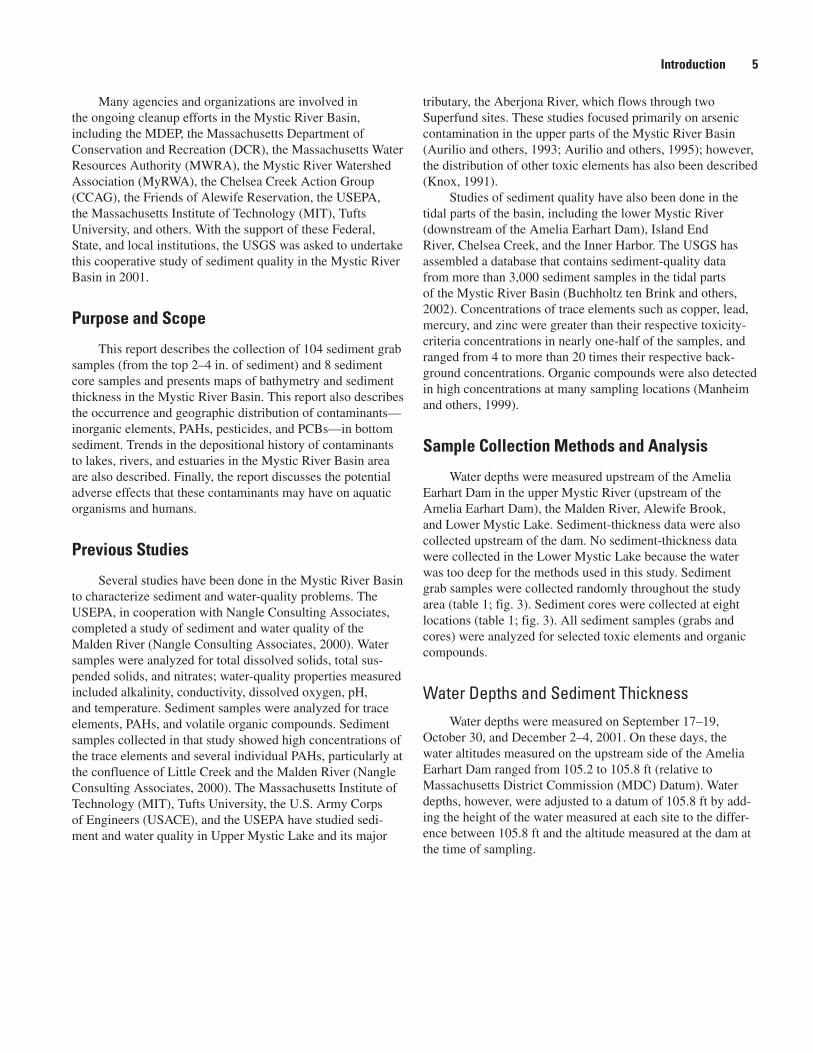
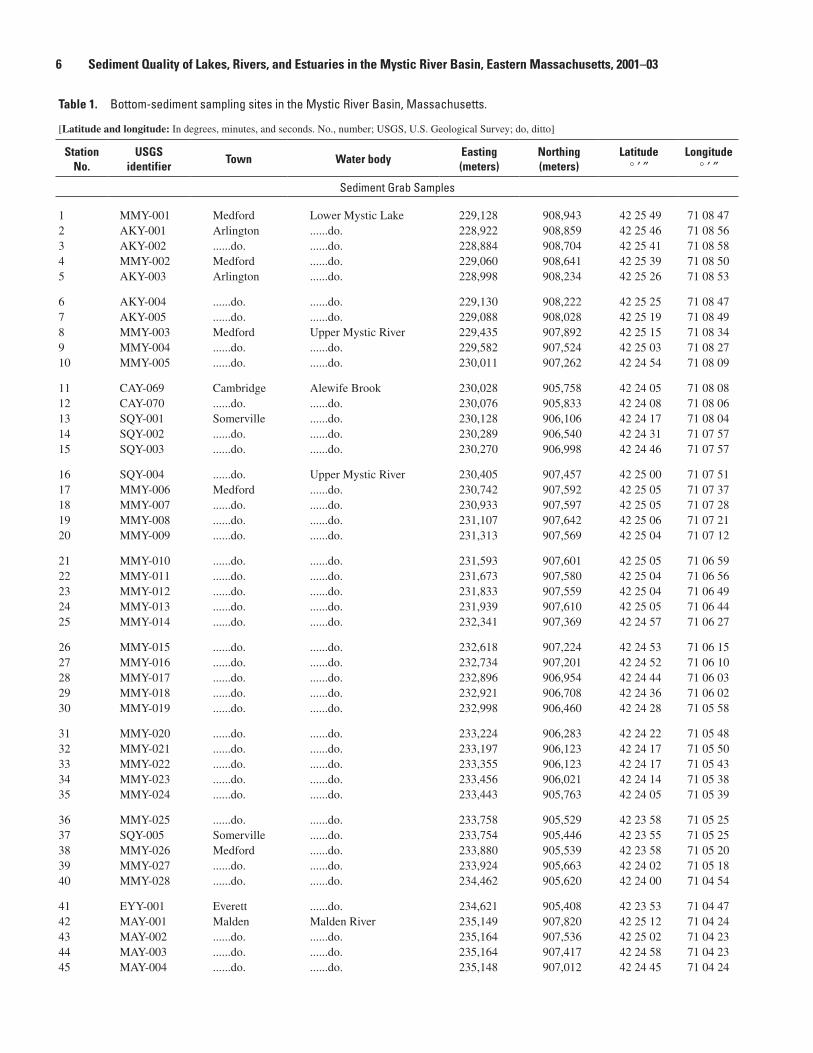
Although many of the old factories have been replaced by housing, and rivers in the upper parts of the basin have been dammed (first by the Craddock Locks in 1909 and then by the Amelia Earhart Dam in 1966), the rivers of the Mystic River Basin are still as important economically today (2005) as they were during colonial times. Modern industries and businesses line the waterways throughout the basin. Commercial vessels (about 500 annually), such as oil tankers, bulk carriers, and container ships, deliver fuel and cargo, including gypsum, salt, cement, and scrap metal, to ports on the Mystic River and Chelsea Creek (fig. 2). Although the Mystic River Basin supports recreational activities such as kayaking, rowing, and fishing, swimming has been limited because of con-tamination, which has been attributed to combined-sewer overflows (CSOs) and urban runoff (Mystic River Watershed Association, 2003).
Because of the long industrial history and the subsequent urbanization of the Mystic River Basin, the Mystic River has had a long history of contamination. In 1865, the decline of fish and shellfish populations in the Mystic River was blamed, in part, on contamination (Mystic River Watershed Association, 2004). Contamination in the upper parts of the basin began as early as the late 1600s. From the mid-1800s to the mid-1900s, leather tanneries and chemical-manufac-turing plants released large quantities of arsenic, chromium, lead, and other chemicals into the Aberjona River, which drains to Lower Mystic Lake, the headwaters of the Mystic
River (Wernstedt and Probst, 1997; Durant and others, 1990, Aurilio and others, 1995, Spliethoff and Hemond, 1996). Two Superfund hazardous-waste-disposal sites—wells G+H and Industri-Plex—are on the Aberjona River, the main tributary to the Mystic Lakes. In recent years, petroleum spills have contributed to the ongoing contamination of the Mystic River Basin. Since 1974 there have been over 40 recorded spills of petroleum into Chelsea Creek; moreover, it has been estimated that ground water in the area may have been contaminated with over one million gallons of oil (U.S. Environmental Protection Agency, 1999). An example of ongoing (2004) contamination in the basin can be found along the shores of the Island End River, a small tributary to the Mystic River. A major coal-gasification plant operated on the Island End River between the 1890s and the late 1950s, and residual waste from this plant continues to discharge into the river (U.S. Environmental Protection Agency, 2003b).
Urbanization has also contributed to the poor quality of the water of the Mystic River Basin. Toxic chemicals, animal waste, sediment, and trash washed from impervious areas such as roads or roof tops often end up in rivers, lakes, and estuaries. For example, 85 percent of the area of the city of Somerville is impervious (fig. 1) (Mystic River Watershed Association, 2004). Urban runoff typically contains high concentrations of bacteria, nutrients, oil and grease. Sewers are another source of contamination in the Mystic River Basin. The sewer systems in parts of the Mystic River Basin carry both sanitary discharge and stormwater, and during heavy rains these combined sewers overflow, sending raw or only marginally treated sewage into the Mystic River and its tribu-taries. Bacterial contamination is the reason for beach clos-ings, shellfishing restrictions, and limitations on boating and swimming. At present, there are 17 active CSOs in the Mystic River Basin, eight of which discharge directly into Alewife Brook, a small tributary to the Mystic River (Kevin Brander, Massachusetts Department of Environmental Protection, written commun., 2004). In addition to CSOs, an aged sewer infrastructure with leaky sanitary sewers and illegal connec-tions between sanitary sewers and storm drains also discharges sewage directly to lakes, rivers, and estuaries in the basin. The cumulative effect of this industrial history and the continu-ing discharge of household waste and urban runoff is that most waters in the basin fail to meet water-quality standards necessary for swimming and boating (U.S. Environmental Protection Agency, 2003a).
Introduction 3
� Sediment Quality of Lakes, Rivers, and Estuaries in the Mystic River Basin, Eastern Massachusetts, 2001–03
Toxic chemicals, such as trace elements, and hydrophobic organic compounds (like oil) that enter natural waters often end up in the bottom sediment because their physical and chemical properties favor sorption onto sediments (Horowitz, 1991). In many rivers, high concentrations of contaminants in bottom sediment are a concern. As long as the sediments stay in the river, they remain a potential nonpoint source of contamination (de Groot, 1995). Contaminated sediments may also adversely affect benthic (bottom-dwelling) organ-isms (DePinto and others, 1994). In addition, chemicals in contaminated sediments may propagate through the food chain and thereby affect pelagic (swimming) organisms (Baudo and Muntau, 1990; Sly, 1994). Consumption of contaminated organisms can pose health risks to predatory fish, wildlife, and humans. Direct contact with or accidental ingestion of
contaminated sediments may also pose health risks to humans (Massachusetts Department of Environmental Protection, 1996).
The distribution of toxic chemicals in sediment depends not only on the locations of contaminant sources but also on the natural processes that control sediment-particle transport. Human activities in the basin can also interfere with many of these natural processes; urbanization, dam construction, and channel alterations (dredging, channel straightening, or others) can change the sediment supply, hydraulic characteristics, or both (Montgomery and Buffington, 1998). For example, dams trap most of the sediment in impounded waters (Heinz Center, 2002), and dredging removes contaminated sediments. Both dam construction and dredging have likely altered natural sediment processes in the Mystic River Basin.
Figure 2. A, Tugboat operation; B, shipping; C, typical industry; and D, remedial action on a contaminated waterway in the lower Mystic River, Massachusetts.
A. B.
D.C.
Many agencies and organizations are involved in the ongoing cleanup efforts in the Mystic River Basin, including the MDEP, the Massachusetts Department of Conservation and Recreation (DCR), the Massachusetts Water Resources Authority (MWRA), the Mystic River Watershed Association (MyRWA), the Chelsea Creek Action Group (CCAG), the Friends of Alewife Reservation, the USEPA, the Massachusetts Institute of Technology (MIT), Tufts University, and others. With the support of these Federal, State, and local institutions, the USGS was asked to undertake this cooperative study of sediment quality in the Mystic River Basin in 2001.
Purpose and Scope
This report describes the collection of 104 sediment grab samples (from the top 2–4 in. of sediment) and 8 sediment core samples and presents maps of bathymetry and sediment thickness in the Mystic River Basin. This report also describes the occurrence and geographic distribution of contaminants— inorganic elements, PAHs, pesticides, and PCBs—in bottom sediment. Trends in the depositional history of contaminants to lakes, rivers, and estuaries in the Mystic River Basin area are also described. Finally, the report discusses the potential adverse effects that these contaminants may have on aquatic organisms and humans.
Previous Studies
Several studies have been done in the Mystic River Basin to characterize sediment and water-quality problems. The USEPA, in cooperation with Nangle Consulting Associates, completed a study of sediment and water quality of the Malden River (Nangle Consulting Associates, 2000). Water samples were analyzed for total dissolved solids, total sus-pended solids, and nitrates; water-quality properties measured included alkalinity, conductivity, dissolved oxygen, pH, and temperature. Sediment samples were analyzed for trace elements, PAHs, and volatile organic compounds. Sediment samples collected in that study showed high concentrations of the trace elements and several individual PAHs, particularly at the confluence of Little Creek and the Malden River (Nangle Consulting Associates, 2000). The Massachusetts Institute of Technology (MIT), Tufts University, the U.S. Army Corps of Engineers (USACE), and the USEPA have studied sedi-ment and water quality in Upper Mystic Lake and its major
tributary, the Aberjona River, which flows through two Superfund sites. These studies focused primarily on arsenic contamination in the upper parts of the Mystic River Basin (Aurilio and others, 1993; Aurilio and others, 1995); however, the distribution of other toxic elements has also been described (Knox, 1991).
Studies of sediment quality have also been done in the tidal parts of the basin, including the lower Mystic River (downstream of the Amelia Earhart Dam), Island End River, Chelsea Creek, and the Inner Harbor. The USGS has assembled a database that contains sediment-quality data from more than 3,000 sediment samples in the tidal parts of the Mystic River Basin (Buchholtz ten Brink and others, 2002). Concentrations of trace elements such as copper, lead, mercury, and zinc were greater than their respective toxicity-criteria concentrations in nearly one-half of the samples, and ranged from 4 to more than 20 times their respective back-ground concentrations. Organic compounds were also detected in high concentrations at many sampling locations (Manheim and others, 1999).
Sample Collection Methods and Analysis
Water depths were measured upstream of the Amelia Earhart Dam in the upper Mystic River (upstream of the Amelia Earhart Dam), the Malden River, Alewife Brook, and Lower Mystic Lake. Sediment-thickness data were also collected upstream of the dam. No sediment-thickness data were collected in the Lower Mystic Lake because the water was too deep for the methods used in this study. Sediment grab samples were collected randomly throughout the study area (table 1; fig. 3). Sediment cores were collected at eight locations (table 1; fig. 3). All sediment samples (grabs and cores) were analyzed for selected toxic elements and organic compounds.
Water Depths and Sediment ThicknessWater depths were measured on September 17–19,
October 30, and December 2–4, 2001. On these days, the water altitudes measured on the upstream side of the Amelia Earhart Dam ranged from 105.2 to 105.8 ft (relative to Massachusetts District Commission (MDC) Datum). Water depths, however, were adjusted to a datum of 105.8 ft by add-ing the height of the water measured at each site to the differ-ence between 105.8 ft and the altitude measured at the dam at the time of sampling.
Introduction �
� Sediment Quality of Lakes, Rivers, and Estuaries in the Mystic River Basin, Eastern Massachusetts, 2001–03
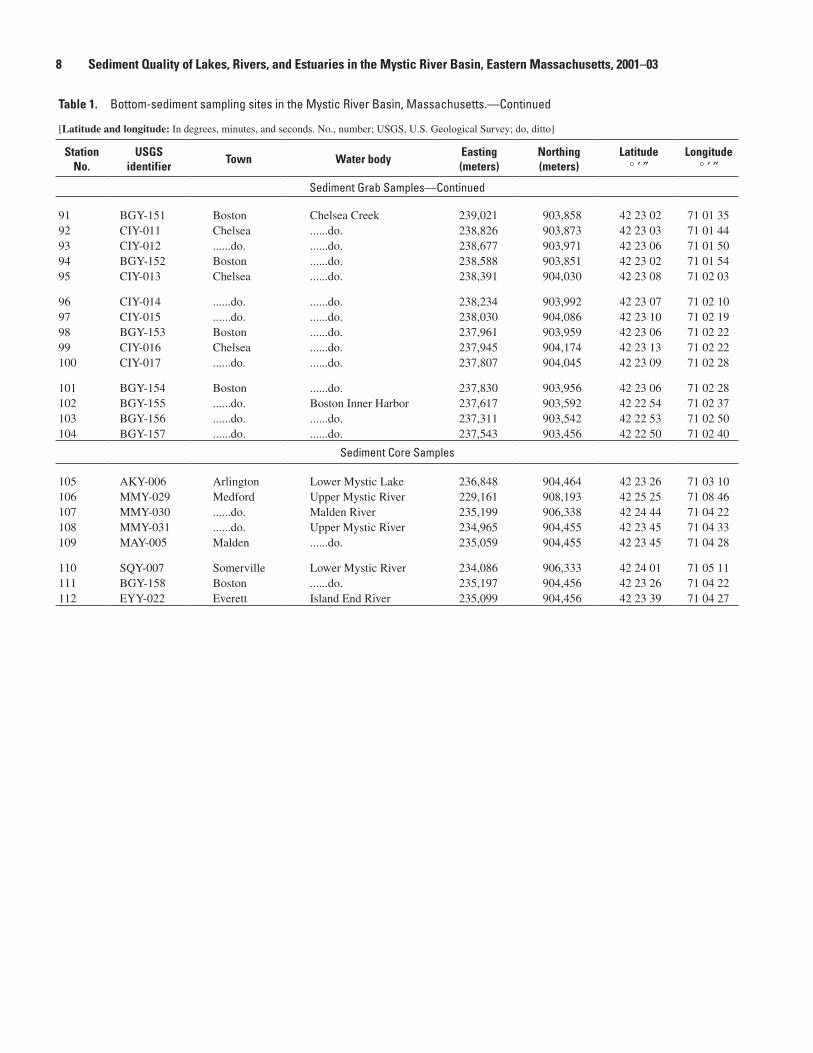
Table 1. Bottom-sediment sampling sites in the Mystic River Basin, Massachusetts.—Continued
[Latitude and longitude: In degrees, minutes, and seconds. No., number; USGS, U.S. Geological Survey; do, ditto]
Station No.
USGS identifier
Town Water bodyEasting (meters)
Northing (meters)
Latitude ° ′ ″
Longitude ° ′ ″
Sediment Grab Samples
1 MMY-001 Medford Lower Mystic Lake 229,128 908,943 42 25 49 71 08 472 AKY-001 Arlington ......do. 228,922 908,859 42 25 46 71 08 563 AKY-002 ......do. ......do. 228,884 908,704 42 25 41 71 08 584 MMY-002 Medford ......do. 229,060 908,641 42 25 39 71 08 505 AKY-003 Arlington ......do. 228,998 908,234 42 25 26 71 08 53
6 AKY-004 ......do. ......do. 229,130 908,222 42 25 25 71 08 477 AKY-005 ......do. ......do. 229,088 908,028 42 25 19 71 08 498 MMY-003 Medford Upper Mystic River 229,435 907,892 42 25 15 71 08 349 MMY-004 ......do. ......do. 229,582 907,524 42 25 03 71 08 2710 MMY-005 ......do. ......do. 230,011 907,262 42 24 54 71 08 09
11 CAY-069 Cambridge Alewife Brook 230,028 905,758 42 24 05 71 08 0812 CAY-070 ......do. ......do. 230,076 905,833 42 24 08 71 08 0613 SQY-001 Somerville ......do. 230,128 906,106 42 24 17 71 08 0414 SQY-002 ......do. ......do. 230,289 906,540 42 24 31 71 07 5715 SQY-003 ......do. ......do. 230,270 906,998 42 24 46 71 07 57
16 SQY-004 ......do. Upper Mystic River 230,405 907,457 42 25 00 71 07 5117 MMY-006 Medford ......do. 230,742 907,592 42 25 05 71 07 3718 MMY-007 ......do. ......do. 230,933 907,597 42 25 05 71 07 2819 MMY-008 ......do. ......do. 231,107 907,642 42 25 06 71 07 2120 MMY-009 ......do. ......do. 231,313 907,569 42 25 04 71 07 12
21 MMY-010 ......do. ......do. 231,593 907,601 42 25 05 71 06 5922 MMY-011 ......do. ......do. 231,673 907,580 42 25 04 71 06 5623 MMY-012 ......do. ......do. 231,833 907,559 42 25 04 71 06 4924 MMY-013 ......do. ......do. 231,939 907,610 42 25 05 71 06 4425 MMY-014 ......do. ......do. 232,341 907,369 42 24 57 71 06 27
26 MMY-015 ......do. ......do. 232,618 907,224 42 24 53 71 06 1527 MMY-016 ......do. ......do. 232,734 907,201 42 24 52 71 06 1028 MMY-017 ......do. ......do. 232,896 906,954 42 24 44 71 06 0329 MMY-018 ......do. ......do. 232,921 906,708 42 24 36 71 06 0230 MMY-019 ......do. ......do. 232,998 906,460 42 24 28 71 05 58
31 MMY-020 ......do. ......do. 233,224 906,283 42 24 22 71 05 4832 MMY-021 ......do. ......do. 233,197 906,123 42 24 17 71 05 5033 MMY-022 ......do. ......do. 233,355 906,123 42 24 17 71 05 4334 MMY-023 ......do. ......do. 233,456 906,021 42 24 14 71 05 3835 MMY-024 ......do. ......do. 233,443 905,763 42 24 05 71 05 39
36 MMY-025 ......do. ......do. 233,758 905,529 42 23 58 71 05 2537 SQY-005 Somerville ......do. 233,754 905,446 42 23 55 71 05 2538 MMY-026 Medford ......do. 233,880 905,539 42 23 58 71 05 2039 MMY-027 ......do. ......do. 233,924 905,663 42 24 02 71 05 1840 MMY-028 ......do. ......do. 234,462 905,620 42 24 00 71 04 54
41 EYY-001 Everett ......do. 234,621 905,408 42 23 53 71 04 4742 MAY-001 Malden Malden River 235,149 907,820 42 25 12 71 04 2443 MAY-002 ......do. ......do. 235,164 907,536 42 25 02 71 04 2344 MAY-003 ......do. ......do. 235,164 907,417 42 24 58 71 04 2345 MAY-004 ......do. ......do. 235,148 907,012 42 24 45 71 04 24
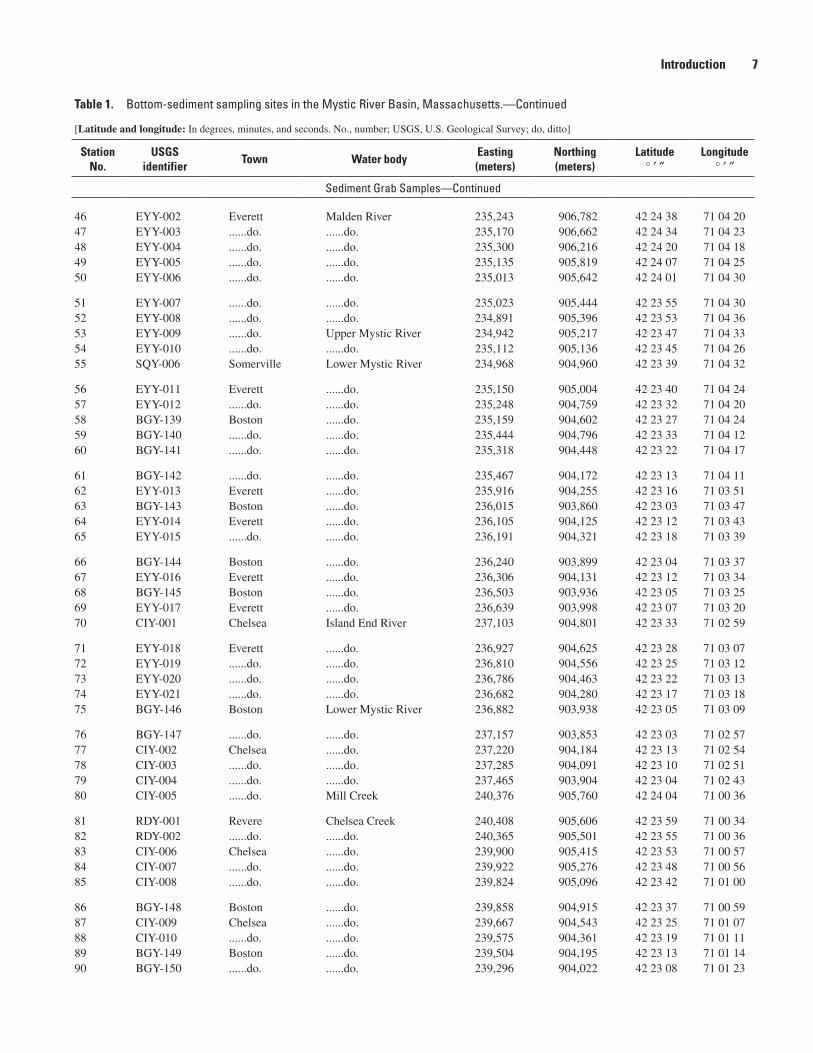
Table 1. Bottom-sediment sampling sites in the Mystic River Basin, Massachusetts.—Continued
[Latitude and longitude: In degrees, minutes, and seconds. No., number; USGS, U.S. Geological Survey; do, ditto]
Station No.
USGS identifier
Town Water bodyEasting (meters)
Northing (meters)
Latitude ° ′ ″
Longitude ° ′ ″
Sediment Grab Samples—Continued
46 EYY-002 Everett Malden River 235,243 906,782 42 24 38 71 04 2047 EYY-003 ......do. ......do. 235,170 906,662 42 24 34 71 04 2348 EYY-004 ......do. ......do. 235,300 906,216 42 24 20 71 04 1849 EYY-005 ......do. ......do. 235,135 905,819 42 24 07 71 04 2550 EYY-006 ......do. ......do. 235,013 905,642 42 24 01 71 04 30
51 EYY-007 ......do. ......do. 235,023 905,444 42 23 55 71 04 3052 EYY-008 ......do. ......do. 234,891 905,396 42 23 53 71 04 3653 EYY-009 ......do. Upper Mystic River 234,942 905,217 42 23 47 71 04 3354 EYY-010 ......do. ......do. 235,112 905,136 42 23 45 71 04 2655 SQY-006 Somerville Lower Mystic River 234,968 904,960 42 23 39 71 04 32
56 EYY-011 Everett ......do. 235,150 905,004 42 23 40 71 04 2457 EYY-012 ......do. ......do. 235,248 904,759 42 23 32 71 04 2058 BGY-139 Boston ......do. 235,159 904,602 42 23 27 71 04 2459 BGY-140 ......do. ......do. 235,444 904,796 42 23 33 71 04 1260 BGY-141 ......do. ......do. 235,318 904,448 42 23 22 71 04 17
61 BGY-142 ......do. ......do. 235,467 904,172 42 23 13 71 04 1162 EYY-013 Everett ......do. 235,916 904,255 42 23 16 71 03 5163 BGY-143 Boston ......do. 236,015 903,860 42 23 03 71 03 4764 EYY-014 Everett ......do. 236,105 904,125 42 23 12 71 03 4365 EYY-015 ......do. ......do. 236,191 904,321 42 23 18 71 03 39
66 BGY-144 Boston ......do. 236,240 903,899 42 23 04 71 03 3767 EYY-016 Everett ......do. 236,306 904,131 42 23 12 71 03 3468 BGY-145 Boston ......do. 236,503 903,936 42 23 05 71 03 2569 EYY-017 Everett ......do. 236,639 903,998 42 23 07 71 03 2070 CIY-001 Chelsea Island End River 237,103 904,801 42 23 33 71 02 59
71 EYY-018 Everett ......do. 236,927 904,625 42 23 28 71 03 0772 EYY-019 ......do. ......do. 236,810 904,556 42 23 25 71 03 1273 EYY-020 ......do. ......do. 236,786 904,463 42 23 22 71 03 1374 EYY-021 ......do. ......do. 236,682 904,280 42 23 17 71 03 1875 BGY-146 Boston Lower Mystic River 236,882 903,938 42 23 05 71 03 09
76 BGY-147 ......do. ......do. 237,157 903,853 42 23 03 71 02 5777 CIY-002 Chelsea ......do. 237,220 904,184 42 23 13 71 02 5478 CIY-003 ......do. ......do. 237,285 904,091 42 23 10 71 02 5179 CIY-004 ......do. ......do. 237,465 903,904 42 23 04 71 02 4380 CIY-005 ......do. Mill Creek 240,376 905,760 42 24 04 71 00 36
81 RDY-001 Revere Chelsea Creek 240,408 905,606 42 23 59 71 00 3482 RDY-002 ......do. ......do. 240,365 905,501 42 23 55 71 00 3683 CIY-006 Chelsea ......do. 239,900 905,415 42 23 53 71 00 5784 CIY-007 ......do. ......do. 239,922 905,276 42 23 48 71 00 5685 CIY-008 ......do. ......do. 239,824 905,096 42 23 42 71 01 00
86 BGY-148 Boston ......do. 239,858 904,915 42 23 37 71 00 5987 CIY-009 Chelsea ......do. 239,667 904,543 42 23 25 71 01 0788 CIY-010 ......do. ......do. 239,575 904,361 42 23 19 71 01 1189 BGY-149 Boston ......do. 239,504 904,195 42 23 13 71 01 1490 BGY-150 ......do. ......do. 239,296 904,022 42 23 08 71 01 23
Introduction �
� Sediment Quality of Lakes, Rivers, and Estuaries in the Mystic River Basin, Eastern Massachusetts, 2001–03
Table 1. Bottom-sediment sampling sites in the Mystic River Basin, Massachusetts.—Continued
[Latitude and longitude: In degrees, minutes, and seconds. No., number; USGS, U.S. Geological Survey; do, ditto]
Station No.
USGS identifier
Town Water bodyEasting (meters)
Northing (meters)
Latitude ° ′ ″
Longitude ° ′ ″
Sediment Grab Samples—Continued
91 BGY-151 Boston Chelsea Creek 239,021 903,858 42 23 02 71 01 3592 CIY-011 Chelsea ......do. 238,826 903,873 42 23 03 71 01 4493 CIY-012 ......do. ......do. 238,677 903,971 42 23 06 71 01 5094 BGY-152 Boston ......do. 238,588 903,851 42 23 02 71 01 5495 CIY-013 Chelsea ......do. 238,391 904,030 42 23 08 71 02 03
96 CIY-014 ......do. ......do. 238,234 903,992 42 23 07 71 02 1097 CIY-015 ......do. ......do. 238,030 904,086 42 23 10 71 02 1998 BGY-153 Boston ......do. 237,961 903,959 42 23 06 71 02 2299 CIY-016 Chelsea ......do. 237,945 904,174 42 23 13 71 02 22100 CIY-017 ......do. ......do. 237,807 904,045 42 23 09 71 02 28
101 BGY-154 Boston ......do. 237,830 903,956 42 23 06 71 02 28102 BGY-155 ......do. Boston Inner Harbor 237,617 903,592 42 22 54 71 02 37103 BGY-156 ......do. ......do. 237,311 903,542 42 22 53 71 02 50104 BGY-157 ......do. ......do. 237,543 903,456 42 22 50 71 02 40
Sediment Core Samples
105 AKY-006 Arlington Lower Mystic Lake 236,848 904,464 42 23 26 71 03 10106 MMY-029 Medford Upper Mystic River 229,161 908,193 42 25 25 71 08 46107 MMY-030 ......do. Malden River 235,199 906,338 42 24 44 71 04 22108 MMY-031 ......do. Upper Mystic River 234,965 904,455 42 23 45 71 04 33109 MAY-005 Malden ......do. 235,059 904,455 42 23 45 71 04 28
110 SQY-007 Somerville Lower Mystic River 234,086 906,333 42 24 01 71 05 11111 BGY-158 Boston ......do. 235,197 904,456 42 23 26 71 04 22112 EYY-022 Everett Island End River 235,099 904,456 42 23 39 71 04 27
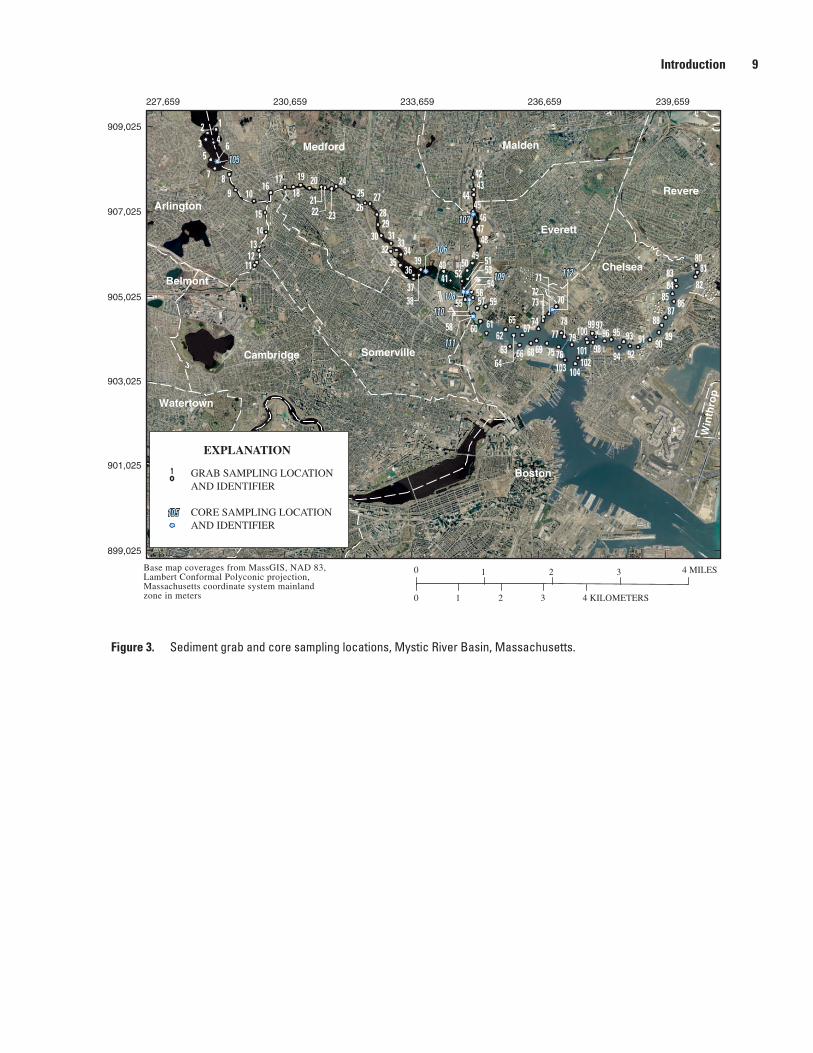
Figure 3. Sediment grab and core sampling locations, Mystic River Basin, Massachusetts.
Introduction �
Arlington
Belmont
Medford Malden
Revere
Everett
Chelsea
SomervilleCambridge
Watertown
Boston
Win
thro
p
112
107
106
109
108110
107
106
109
108
111111
110
105105
11252
76
12
3 4
5
7 89 10
111213
14
15
1617
18
19 20
2122 23
242526
272829
30 3132 33
3435
36
38
39 40
3741
4243
4445
4647
4849
50 515354
555657
58
59
60 6162
6364
65
66
67
68 69
70
717273
74
75
7778
79
8081
828384
8586
8788
899091
92
93
94
959699 97
98
100
101102
104103
6
Base map coverages from MassGIS, NAD 83,Lambert Conformal Polyconic projection,Massachusetts coordinate system mainlandzone in meters
909,025
907,025
905,025
903,025
901,025
899,025
227,659 230,659 233,659 236,659 239,659
0
0
1
1 2 3 4 MILES
2 3 4 KILOMETERS
GRAB SAMPLING LOCATIONAND IDENTIFIER
CORE SAMPLING LOCATIONAND IDENTIFIER
1
EXPLANATION
105105
10 Sediment Quality of Lakes, Rivers, and Estuaries in the Mystic River Basin, Eastern Massachusetts, 2001–03
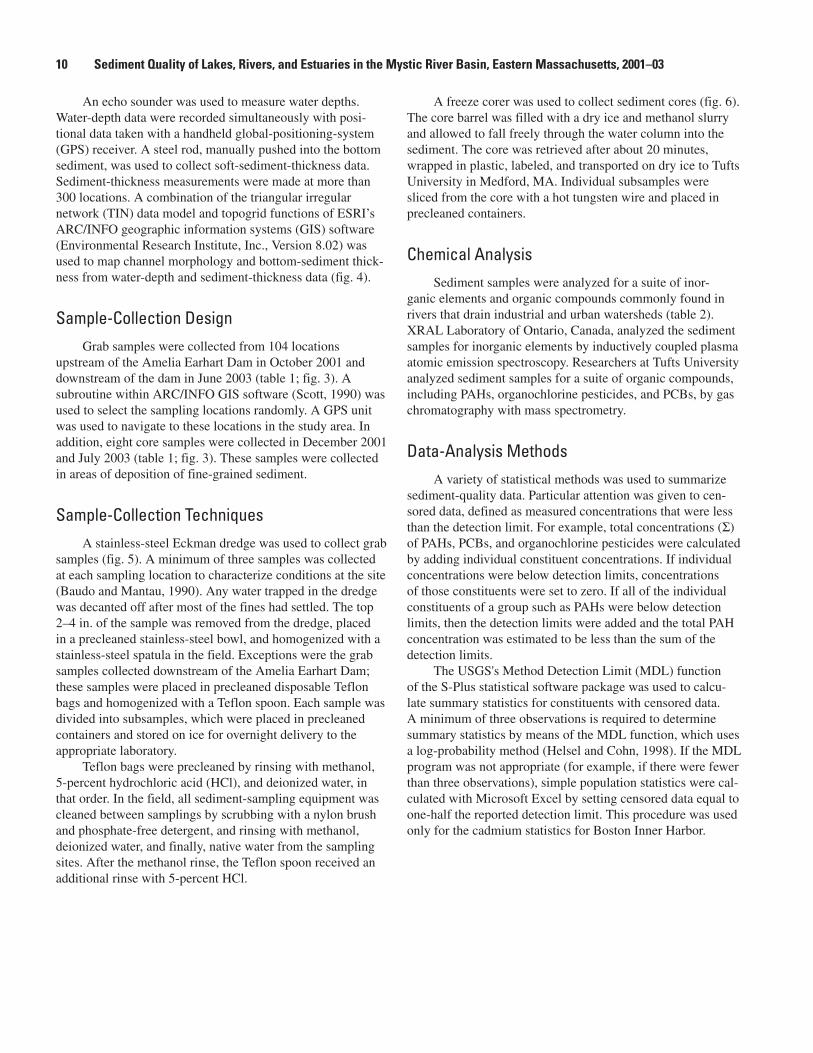
An echo sounder was used to measure water depths. Water-depth data were recorded simultaneously with posi-tional data taken with a handheld global-positioning-system (GPS) receiver. A steel rod, manually pushed into the bottom sediment, was used to collect soft-sediment-thickness data. Sediment-thickness measurements were made at more than 300 locations. A combination of the triangular irregular network (TIN) data model and topogrid functions of ESRI’s ARC/INFO geographic information systems (GIS) software (Environmental Research Institute, Inc., Version 8.02) was used to map channel morphology and bottom-sediment thick-ness from water-depth and sediment-thickness data (fig. 4).
Sample-Collection DesignGrab samples were collected from 104 locations
upstream of the Amelia Earhart Dam in October 2001 and downstream of the dam in June 2003 (table 1; fig. 3). A subroutine within ARC/INFO GIS software (Scott, 1990) was used to select the sampling locations randomly. A GPS unit was used to navigate to these locations in the study area. In addition, eight core samples were collected in December 2001 and July 2003 (table 1; fig. 3). These samples were collected in areas of deposition of fine-grained sediment.
Sample-Collection TechniquesA stainless-steel Eckman dredge was used to collect grab
samples (fig. 5). A minimum of three samples was collected at each sampling location to characterize conditions at the site (Baudo and Mantau, 1990). Any water trapped in the dredge was decanted off after most of the fines had settled. The top 2–4 in. of the sample was removed from the dredge, placed in a precleaned stainless-steel bowl, and homogenized with a stainless-steel spatula in the field. Exceptions were the grab samples collected downstream of the Amelia Earhart Dam; these samples were placed in precleaned disposable Teflon bags and homogenized with a Teflon spoon. Each sample was divided into subsamples, which were placed in precleaned containers and stored on ice for overnight delivery to the appropriate laboratory.
Teflon bags were precleaned by rinsing with methanol, 5-percent hydrochloric acid (HCl), and deionized water, in that order. In the field, all sediment-sampling equipment was cleaned between samplings by scrubbing with a nylon brush and phosphate-free detergent, and rinsing with methanol, deionized water, and finally, native water from the sampling sites. After the methanol rinse, the Teflon spoon received an additional rinse with 5-percent HCl.
A freeze corer was used to collect sediment cores (fig. 6). The core barrel was filled with a dry ice and methanol slurry and allowed to fall freely through the water column into the sediment. The core was retrieved after about 20 minutes, wrapped in plastic, labeled, and transported on dry ice to Tufts University in Medford, MA. Individual subsamples were sliced from the core with a hot tungsten wire and placed in precleaned containers.
Chemical AnalysisSediment samples were analyzed for a suite of inor-
ganic elements and organic compounds commonly found in rivers that drain industrial and urban watersheds (table 2). XRAL Laboratory of Ontario, Canada, analyzed the sediment samples for inorganic elements by inductively coupled plasma atomic emission spectroscopy. Researchers at Tufts University analyzed sediment samples for a suite of organic compounds, including PAHs, organochlorine pesticides, and PCBs, by gas chromatography with mass spectrometry.
Data-Analysis MethodsA variety of statistical methods was used to summarize
sediment-quality data. Particular attention was given to cen-sored data, defined as measured concentrations that were less than the detection limit. For example, total concentrations (S) of PAHs, PCBs, and organochlorine pesticides were calculated by adding individual constituent concentrations. If individual concentrations were below detection limits, concentrations of those constituents were set to zero. If all of the individual constituents of a group such as PAHs were below detection limits, then the detection limits were added and the total PAH concentration was estimated to be less than the sum of the detection limits.
The USGS's Method Detection Limit (MDL) function of the S-Plus statistical software package was used to calcu-late summary statistics for constituents with censored data. A minimum of three observations is required to determine summary statistics by means of the MDL function, which uses a log-probability method (Helsel and Cohn, 1998). If the MDL program was not appropriate (for example, if there were fewer than three observations), simple population statistics were cal-culated with Microsoft Excel by setting censored data equal to one-half the reported detection limit. This procedure was used only for the cadmium statistics for Boston Inner Harbor.
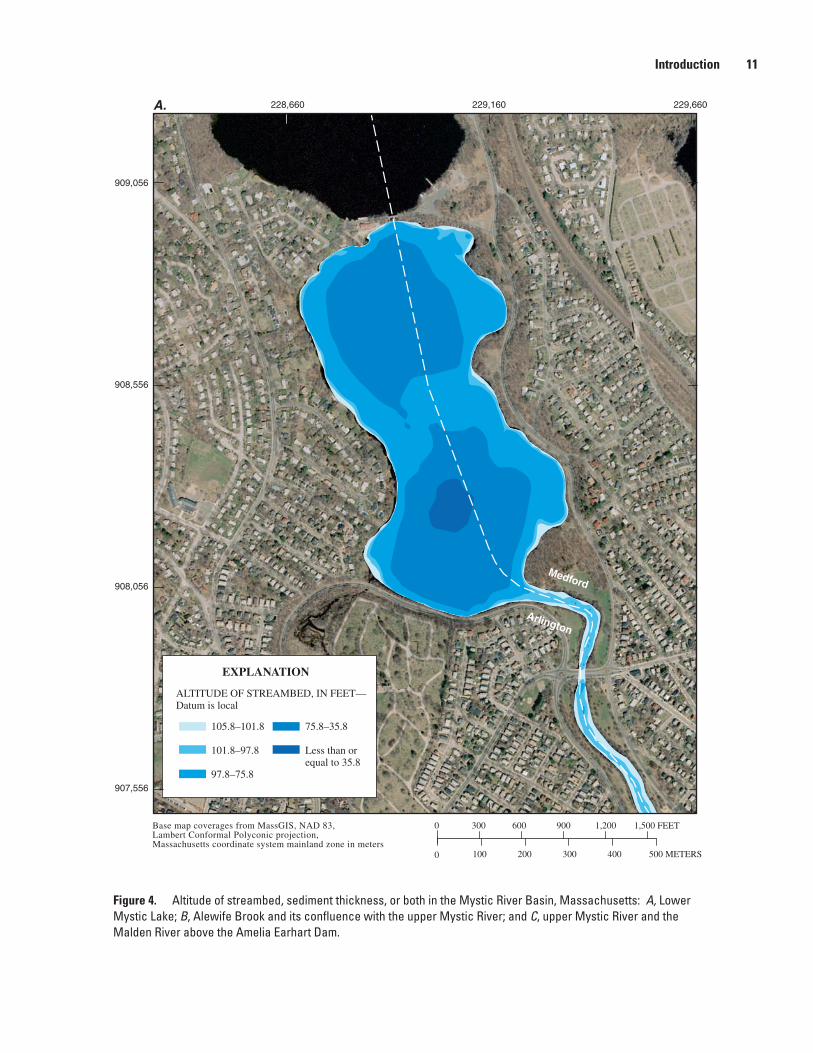
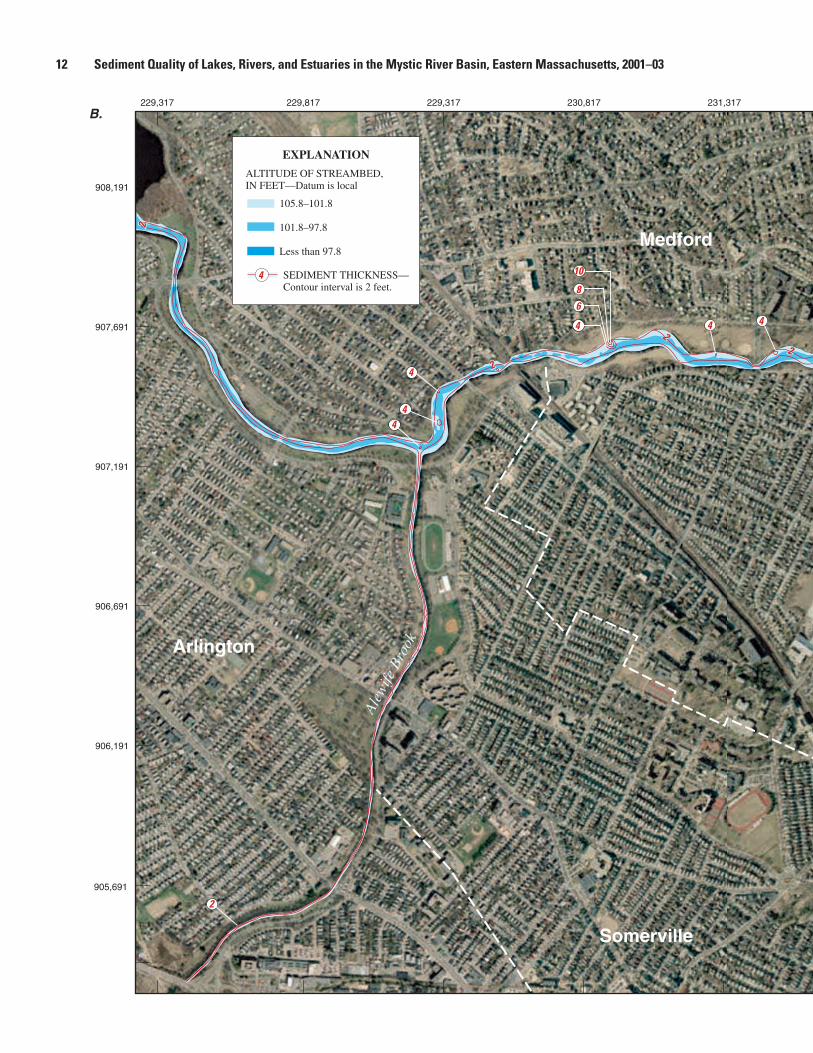
Figure �. Altitude of streambed, sediment thickness, or both in the Mystic River Basin, Massachusetts: A, Lower Mystic Lake; B, Alewife Brook and its confluence with the upper Mystic River; and C, upper Mystic River and the Malden River above the Amelia Earhart Dam.
Introduction 11
EXPLANATION
ALTITUDE OF STREAMBED, IN FEET—Datum is local
105.8–101.8
101.8–97.8
97.8–75.8
75.8–35.8
Less than orequal to 35.8
Arlington
Medford
228,660 229,160 229,660
907,556
908,056
908,556
909,056
0 100 200 300 400 500 METERS
0 300 600 900 1,200 1,500 FEETBase map coverages from MassGIS, NAD 83,Lambert Conformal Polyconic projection,Massachusetts coordinate system mainland zone in meters
A.
12 Sediment Quality of Lakes, Rivers, and Estuaries in the Mystic River Basin, Eastern Massachusetts, 2001–03
Medford
Arlington
Somerville
Alew
ifeBr
ook
4
4
44
4
4
6
6
6
6
222222
222
222
8
4 4
4
4
4
4
4
44
44
4
4
4
10
22
4
2
22
22
22
22
229,317 229,317 230,817229,817 231,317 231,817 232,317 232,817 233,317
908,191
907,691
907,191
906,691
906,191
905,691
.5 1 KILOMETER
1 MILE1/2
0
0
Base map coverages from MassGIS, NAD 83, Lambert Conformal Polyconicprojection, Massachusetts coordinate system mainland zone in meters
4
EXPLANATION
ALTITUDE OF STREAMBED,IN FEET—Datum is local
105.8–101.8
101.8–97.8
Less than 97.8
SEDIMENT THICKNESS—Contour interval is 2 feet.
B.
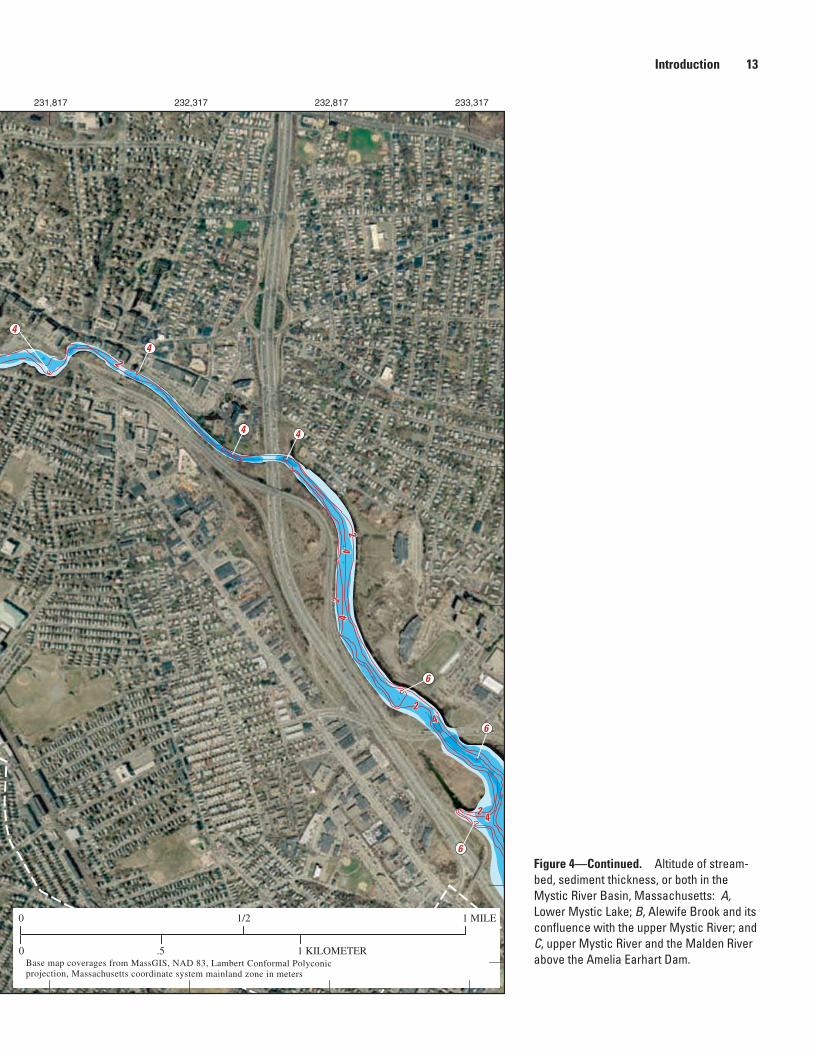
Figure �—Continued. Altitude of stream-bed, sediment thickness, or both in the Mystic River Basin, Massachusetts: A, Lower Mystic Lake; B, Alewife Brook and its confluence with the upper Mystic River; and C, upper Mystic River and the Malden River above the Amelia Earhart Dam.
Introduction 13
Medford
Arlington
Somerville
Alew
ifeBr
ook
4
4
44
4
4
6
6
6
6
222222
222
222
8
4 4
4
4
4
4
4
44
44
4
4
4
10
22
4
2
22
22
22
22
229,317 229,317 230,817229,817 231,317 231,817 232,317 232,817 233,317
908,191
907,691
907,191
906,691
906,191
905,691
.5 1 KILOMETER
1 MILE1/2
0
0
Base map coverages from MassGIS, NAD 83, Lambert Conformal Polyconicprojection, Massachusetts coordinate system mainland zone in meters
4
EXPLANATION
ALTITUDE OF STREAMBED,IN FEET—Datum is local
105.8–101.8
101.8–97.8
Less than 97.8
SEDIMENT THICKNESS—Contour interval is 2 feet.
B.
1� Sediment Quality of Lakes, Rivers, and Estuaries in the Mystic River Basin, Eastern Massachusetts, 2001–03
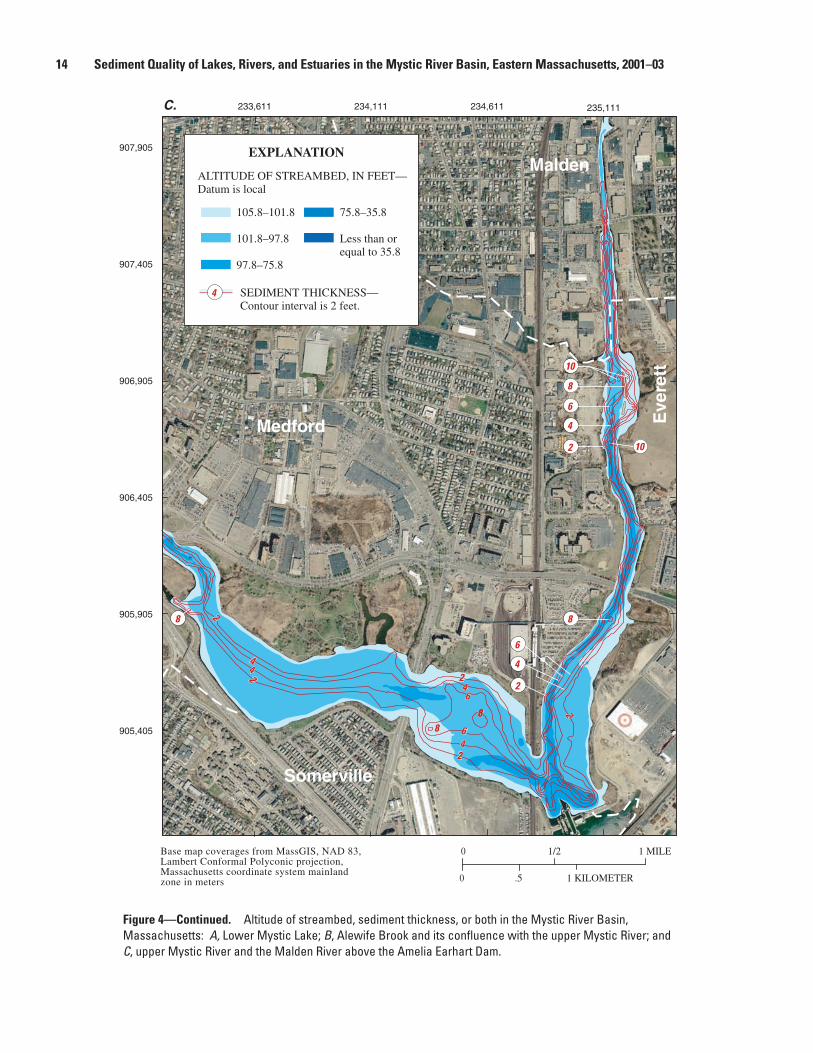
Figure �—Continued. Altitude of streambed, sediment thickness, or both in the Mystic River Basin, Massachusetts: A, Lower Mystic Lake; B, Alewife Brook and its confluence with the upper Mystic River; and C, upper Mystic River and the Malden River above the Amelia Earhart Dam.
Somerville
Medford
Malden
Eve
rett
466
66
88
8888
8
4
44
4444
22
22
22
22
22
6
8
10
4
2
6
8
10
4
2
Base map coverages from MassGIS, NAD 83,Lambert Conformal Polyconic projection,Massachusetts coordinate system mainlandzone in meters
SEDIMENT THICKNESS—Contour interval is 2 feet.
EXPLANATION
ALTITUDE OF STREAMBED, IN FEET—Datum is local
105.8–101.8
101.8–97.8
97.8–75.8
75.8–35.8
Less than orequal to 35.8
4
233,611 234,111 234,611 235,111
905,405
905,905
906,405
906,905
907,405
907,905
.5 1 KILOMETER
1 MILE1/2
0
0
C.
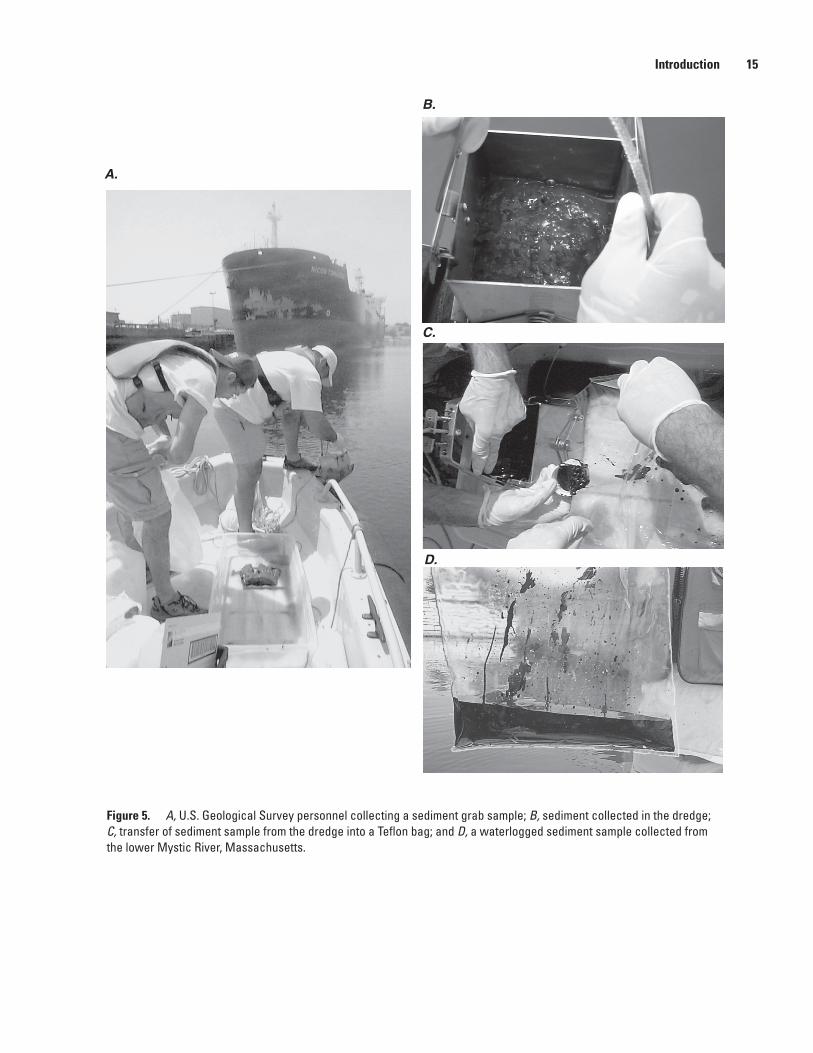
Figure �. A, U.S. Geological Survey personnel collecting a sediment grab sample; B, sediment collected in the dredge; C, transfer of sediment sample from the dredge into a Teflon bag; and D, a waterlogged sediment sample collected from the lower Mystic River, Massachusetts.
Introduction 1�
A.
B.
C.
D.
1� Sediment Quality of Lakes, Rivers, and Estuaries in the Mystic River Basin, Eastern Massachusetts, 2001–03
Bias and VariabilitySediment-quality data are subject to bias (or systematic
error) and variability (or random error) during sample collec-tion, processing, and analysis. The nature and magnitude of bias and variability can be determined by analysis of quality-control samples, including blanks, field duplicates, laboratory duplicates, matrix spikes, matrix-spike duplicates, and perfor-mance-evaluation samples (PES) (these data can be found in tables 3–5, at back of report). With a few exceptions, bias and variability in this study were generally within acceptable lim-its. Most notable is the potential contamination bias introduced by the equipment used for collection and processing of some
grab samples (stainless-steel dredge, bowl, and spoon). The analysis of PES samples mixed in the stainless steel bowl indi-cates that grab samples may have been enriched in chromium from sampling or processing equipment (table 3). As a result of these findings, the standard operating procedure (SOP) for sediment sampling was changed. A Teflon spoon was used instead of a stainless-steel spoon to scoop material that had not come in contact with any part of the dredge and to composite the samples in disposable precleaned Teflon bags instead of in the stainless steel bowl. Therefore, chromium values measured in sediment samples processed with the stainless steel bowl and spoon were not included in this report.
Figure �. A, Dry ice being placed into freeze corer; B, retrieval of freeze corer; C, removal of excess sediment from corer; and D, sediment-core preservation by wrapping the core in plastic.
A. B.
C. D.
Constituent Common source or urban uses
Inorganic Elements
Calcium auto exhaust, brakes, deicersMagnesium .....do.Phosphorus auto exhaust, fuel, lubricants, industrial
and municipal runoff, wastewaterPotassium auto exhaust, deicersSodium .....do.
Antimony flame retardants, car batteriesArsenic production of pesticides and herbicidesBarium motor vehicle brake liningsBeryllium ceramics, steelBismuth malleable irons, medicine
Cadmium Ni-Cd batteries, televisionsChromium bricks, stainless steelCobalt jet engines, gas turbine enginesCopper boats, wiresLanthanum battery electrodes, lighter flints
Lead batteriesLithium .....do.Manganese batteries, steelMolybdenum aircraft parts, electrical partsNickel electronics, automobiles
Scandium high-intensity lightsSilver batteries, electronics, electrical partsStrontium greases, pyrotechnicsTin electronics, food packing, plumbingTitanium automobiles, construction, plastics
Tungsten electrical parts, electronicsVanadium batteries, electronicsYittrium television setsZinc paints, plastic, textiles, electronicsZirconium production of steel, photography
Polyaromatic Hydrocarbons
Acenaphthene automobile exhaustAcenaphthylene production of dyes, plastics, pesticidesAnthracene .....do.Benzo[a]anthracene automobile exhaustBenzo[a]pyrene .....do.
Constituent Common source or urban uses
Polyaromatic Hydrocarbons—Continued
Benzo[(b]fluoranthene automobile exhaustBenzo[ghi]perylene .....do.Benzo[k]fluoranthene automobile exhaust, motor oilChrysene combustion of coal and petroleum productsDibenzo[a,h]anthracene automobile exhaust
Fluoranthene automobile exhaustFluorene production of dyes, plastics, pesticidesIndeno[1,2,3-cd]pyrene automobile exhaustNaphthalene coal tar, gasoline and diesel fuelsPhenanthrene production of dyes, plastics, pesticides,
explosives, and drugsPyrene production of dyes, plastics, pesticides
Organochlorine Pesticides
4,4′-DDD pesticide for vegetables and tobacco
4,4′-DDE breakdown product of DDT
4,4′-DDT pesticide for livestock and cropsAldrin termite controlAlpha Chlordane household insecticidealpha-BHC insecticide
beta-BHC .....do.delta-BHC .....do.Dieldrin .....do.Endosulfan I insecticide for cropsEndosulfan II .....do.
Endosulfan sulfate .....do.Endrin .....do.Endrin aldehyde pesticide to control birds, rodents, insects Endrin ketone .....do.gamma Chlordane insecticide for fire-ant control, lawns
gamma-BHC pesticide for cropsHeptachlor insecticide for home, buildings, corn cropsHeptachlor epoxide .....do.Methoxychlor insecticide for crops, livestock, householdChlordane (technical) insecticide for home lawns, gardens, cropsToxaphene pesticide for crops
Polychlorinated Biphenyls
PCB congeners hydraulic fluids, rubber plasticizer, and adhesives
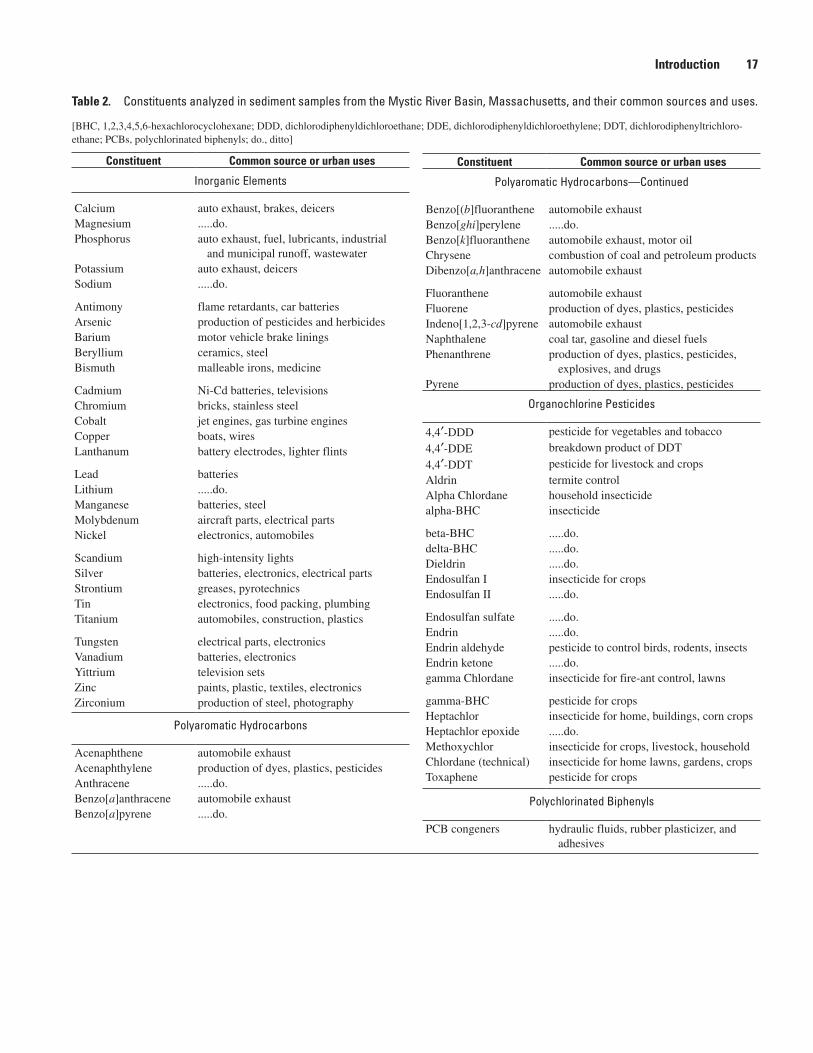
Table 2. Constituents analyzed in sediment samples from the Mystic River Basin, Massachusetts, and their common sources and uses.
[BHC, 1,2,3,4,5,6-hexachlorocyclohexane; DDD, dichlorodiphenyldichloroethane; DDE, dichlorodiphenyldichloroethylene; DDT, dichlorodiphenyltrichloro-ethane; PCBs, polychlorinated biphenyls; do., ditto]
Introduction 1�
1� Sediment Quality of Lakes, Rivers, and Estuaries in the Mystic River Basin, Eastern Massachusetts, 2001–03
Water Depths and Sediment ThicknessThe channel morphology in figures 4A–C shows that
when water levels at the Amelia Earhart Dam are at 105.8 ft relative to MDC’s datum, water depths measured in Lower Mystic Lake upstream of the dam ranged from less than 1 ft to almost 80 ft. Water depths were greatest in the lake and averaged over 33 ft (fig. 4A). In contrast, the average water depth was lowest in Alewife Brook (only about 1 ft; fig. 4B). Water depths measured in the upper Mystic and Malden Rivers averaged about 5 and 6 ft, respectively (figs. 4B–C). Based on measurements of water depth, the estimated volumes of water in the Lower Mystic Lake, Alewife Brook, and upper Mystic and Malden Rivers are about 1,000, 2,300, and 150 Mgal, respectively.
Soft-sediment thicknesses are also shown in figures 4B–C. Sediment thicknesses ranged from less than 1 ft to about 13 ft near the dam. Sediment thicknesses measured in Alewife Book and the upper Mystic and Malden Rivers were about 2, 3, and 4 ft, respectively. Based on measurements of soft-sediment thickness, the estimated sediment volume in Alewife Brook and in the upper Mystic and Malden Rivers is about 0.5, 21, and 12 million ft3, respectively. It was not pos-sible to measure the thickness and the volume of soft sediment in the Lower Mystic Lake by the techniques used in this study. Sediment coring, however, indicates that the sediment is fairly thick (thicker than 4 ft on average) and that there is a substan-tial volume of sediment in the lake.
Results for Sediment Grab SamplesChemical data for surficial sediment can be used by
water-resource managers to ensure that the quality of lakes, rivers, and estuaries in the Mystic River Basin is high enough to make the waterways safe for boating, swimming, and fish-ing. These data (table 3) can also be used to define objectives for managing and monitoring sediment quality. For example, the objectives might be to maintain the present quality of the sediment or to restore contaminant concentrations to background levels (concentrations not affected by human activities), to the levels of other urban rivers, or to levels safe enough for specific designated uses (for example, swimming or boating). Comparisons of contaminant concentrations measured in samples in Mystic River Basin sediments among sediment-sampling locations, to background concentrations, to concentrations from other urban rivers, and to sediment-quality guidelines could help local water-resource managers determine what actions might be needed to restore sediment quality.
A detection indicates that the constituent concentra-tion is greater than the minimum reporting level (MRL) for a given analytical technique. A nondetection can indicate two
possibilities: (1) the constituent is not present in the sample, or (2) the concentration of the constituent in the sample is less than the MRL. Nondetection of a constituent, therefore, does not necessarily indicate its absence. In particular, the organo-chlorine pesticide and PCB data collected for this study should be interpreted carefully because detection limits reported in this study are higher than the detection limits reported for other studies in which gas chromatography with electon-capture detectors was used. In other studies, total Aroclors have been reported; however, in this study, gas chromatogra-phy mass spectrometry (GCMS) was used because it is more accurate.
Spatial Trends in Sediment Quality
Concentrations of the 33 elements measured in grab sam-ples are shown in table 3 by sampling location. The elements most often present at concentrations greater than 1,000 ppm are considered major elements and include calcium, iron, man-ganese, phosphorus, aluminum, potassium, sodium, and tita-nium. Concentrations of these elements differed greatly in the sediment samples collected, likely because the samples were collected in freshwater, estuarine, and saltwater environments.
Conversely, trace elements are those elements whose concentrations are typically less than 1,000 ppm in uncon-taminated sediment. Because of their toxicity, the USEPA has classified a few of these trace elements as priority pollutants (U.S. Environmental Protection Agency, 2002b) including antimony, arsenic, beryllium, cadmium, chromium, copper, lead, mercury, nickel, selenium, silver, thallium, and zinc. In this study, chromium (where data are available), copper, lead, nickel, and zinc were detected in every sample. Concentrations greater than the detection limits of arsenic, silver, beryllium, cadmium, mercury, and antimony were measured in 97, 94, 77, 62, 14, and 1 percent of the samples tested, respectively. Concentrations of selenium and thallium were not measured in this study.
The highest median concentrations of priority pollut-ants—arsenic (70 ppm), cadmium (6 ppm), copper (290 ppm), nickel (37 ppm), and zinc (1,700 ppm)—were measured in sediment collected from Lower Mystic Lake (fig. 7). This was expected on the basis of the history of contamination in Upper Mystic Lake, which discharges directly into Lower Mystic Lake. The median concentrations of beryllium (1.2 ppm), lead (460 ppm), and silver (3.4 ppm) measured in the sample collected from Mill Creek were greater than the median con-centrations of those elements measured in sediment collected from the other Mystic River Basin sites. Median concentra-tions of chromium (230 ppm, measured only downstream of the Amelia Earhart Dam) and tin (18 ppm) were highest in sediment collected from Chelsea Creek and the Malden River, respectively.
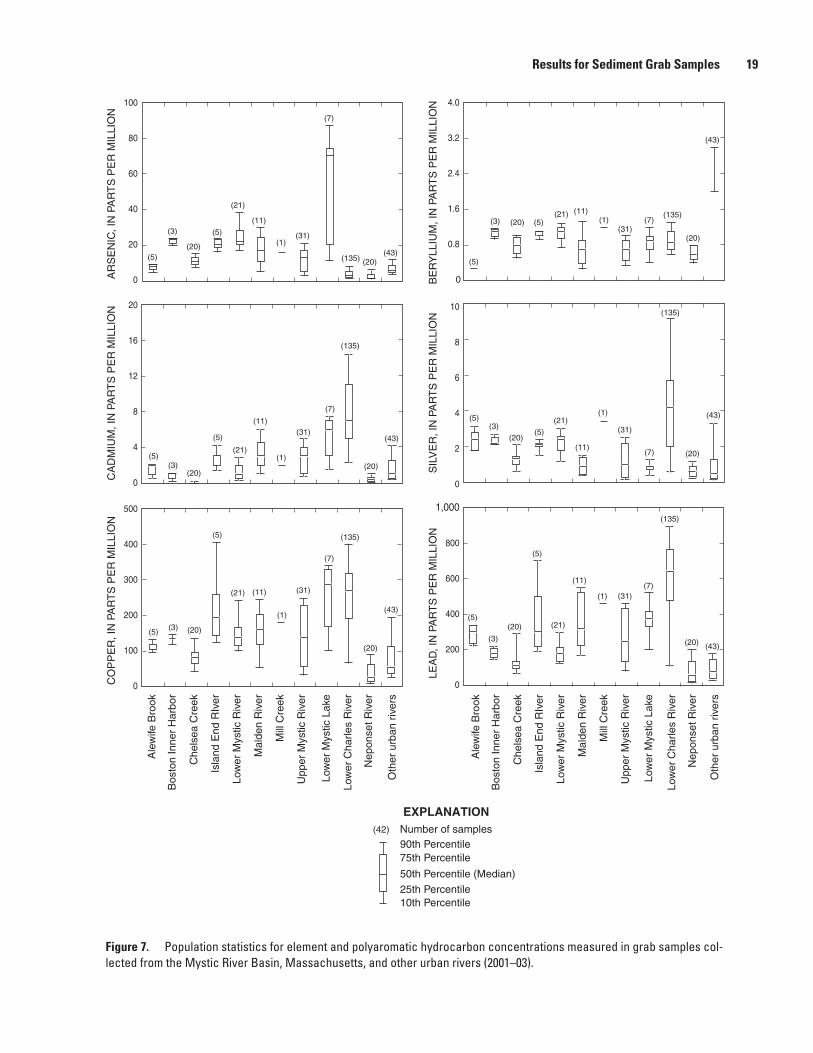
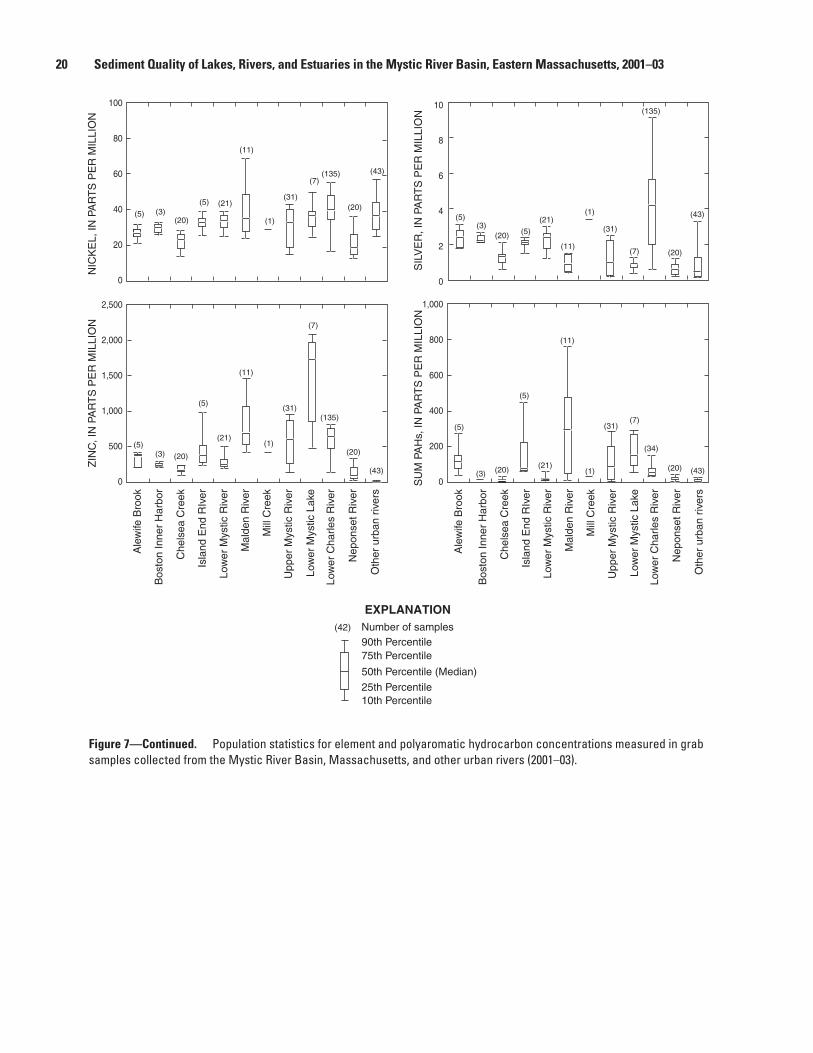
Figure �. Population statistics for element and polyaromatic hydrocarbon concentrations measured in grab samples col-lected from the Mystic River Basin, Massachusetts, and other urban rivers (2001–03).
Results for Sediment Grab Samples 1�
90th Percentile75th Percentile
25th Percentile
50th Percentile (Median)
10th Percentile
Number of samples(42)
EXPLANATION
Ale
wife
Bro
ok
Che
lsea
Cre
ek
Isla
ndE
ndR
Iver
Low
erM
ystic
Riv
er
Mal
den
Riv
er
Mill
Cre
ek
Upp
erM
ystic
Riv
er
Low
erM
ystic
Lake
Ale
wife
Bro
ok
Che
lsea
Cre
ek
Isla
ndE
ndR
Iver
Low
erM
ystic
Riv
er
Mal
den
Riv
er
Mill
Cre
ek
Upp
erM
ystic
Riv
er
Low
erM
ystic
Lake
Bos
ton
Inne
rH
arbo
r
Bos
ton
Inne
rH
arbo
r
(20)(11)
(5) (1)(31)
(21)(7)
(5)
(20)(11)
(5)
(1)
(31)(21)
(7)
(5)(20)
(11)
(5)
(1) (31)
(21)
(7)
(5) (20)
(11)
(5)
(1)
(31)(21)
(7)
(5)(20)
(11)
(5)(1)
(31)
(21)
(7)
(5)
(20)
(11)
(5)
(1)
(31)
(21)
(7)
(5)
(3)
(3)
(3)
(3)
(3)
(3)
AR
SE
NIC
,IN
PAR
TS
PE
RM
ILLI
ON
100
80
60
40
20
0
20
16
12
8
4
0CA
DM
IUM
,IN
PAR
TS
PE
RM
ILLI
ON
500
400
300
200
100
0CO
PP
ER
,IN
PAR
TS
PE
RM
ILLI
ON
4.0
3.2
2.4
1.6
0.8
0BE
RY
LLIU
M,I
NPA
RT
SP
ER
MIL
LIO
N
10
8
6
4
2
0
SIL
VE
R,I
NPA
RT
SP
ER
MIL
LIO
N
1,000
800
600
400
200
0
LEA
D,I
NPA
RT
SP
ER
MIL
LIO
N
(135)
(135)
(135)
(135)
(135)
(135)Lo
wer
Cha
rles
Riv
er
Low
erC
harle
sR
iver
(20)
(20)
(20)(20)
(20)
(20)
Nep
onse
tRiv
er
Nep
onse
tRiv
er
(43)
(43)
(43)
(43)
(43)
(43)
Oth
erur
ban
river
s
Oth
erur
ban
river
s
20 Sediment Quality of Lakes, Rivers, and Estuaries in the Mystic River Basin, Eastern Massachusetts, 2001–03
Figure �—Continued. Population statistics for element and polyaromatic hydrocarbon concentrations measured in grab samples collected from the Mystic River Basin, Massachusetts, and other urban rivers (2001–03).
90th Percentile75th Percentile
25th Percentile
50th Percentile (Median)
10th Percentile
Number of samples(42)
EXPLANATION
100
80
60
40
20
0
NIC
KE
L,IN
PAR
TS
PE
RM
ILLI
ON
10
8
6
4
2
0
SIL
VE
R,I
NPA
RT
SP
ER
MIL
LIO
N
2,500
2,000
1,500
1,000
500
0
ZIN
C,I
NPA
RT
SP
ER
MIL
LIO
N
1,000
800
600
400
200
0SU
MPA
Hs,
INPA
RT
SP
ER
MIL
LIO
N
Ale
wife
Bro
ok
Bos
ton
Inne
rH
arbo
r
Che
lsea
Cre
ek
Isla
ndE
ndR
Iver
Low
erM
ystic
Riv
er
Mal
den
Riv
er
Mill
Cre
ek
Upp
erM
ystic
Riv
er
Low
erM
ystic
Lake
Ale
wife
Bro
ok
Bos
ton
Inne
rH
arbo
r
Che
lsea
Cre
ek
Isla
ndE
ndR
Iver
Low
erM
ystic
Riv
er
Mal
den
Riv
er
Mill
Cre
ek
Upp
erM
ystic
Riv
er
Low
erM
ystic
Lake
(5) (3)(20)
(11)
(5)
(1)
(31)(21)
(7)
(5)(3)
(20)(11)
(5)
(1)
(31)(21)
(7)
(5)(3) (20)
(11)
(5)
(1)
(31)
(21)
(7)
(5)
(3) (20)
(11)
(5)
(1)
(31)
(21)
(7)
(135)
(135)
Low
erC
harle
sR
iver
(135)
(34)
Low
erC
harle
sR
iver
(20)
(20)
Nep
onse
tRiv
er
(20)
(20)
Nep
onse
tRiv
er
(43)
(43)
(43) (43)
Oth
erur
ban
river
s
Oth
erur
ban
river
s
Concentrations of the organic compounds tested are shown by site in table 3. These organic compounds include three major groups: PAHs, organochlorine pesticides, and PCBs, which also appear on the USEPA’s priority pollutant list (U.S. Environmental Protection Agency, 2002b). Group concentrations are expressed as the sum of concentrations of several related compounds; SPAH, for example, is the sum of all tested PAHs; and SDDT is the sum of the concentrations of dichlorodiphenyltrichlorethane (DDT), dichlorodiphenyl-dichloroethane (DDD), and dichlorodiphenyldichlorethylene (DDE). PCBs were not added because no concentrations of PCBs were measured above detection limits.
Of the 15 PAHs analyzed in the grab samples, fluor-anthene was the most commonly detected (in more than 90 percent of the samples). The least commonly detected PAH of those detected was naphthalene (in less than 3 percent). The median SPAH concentration was highest (about 300 ppm) for samples collected from the Malden River (fig. 7). The grab sample with the highest SPAH concentration (780 ppm) was collected from the Malden River at sampling site 43 (table 3). DDT, an insecticide banned in the United States in 1972 or one of its metabolites (DDD and DDE) were detected in only one of the grab samples (sampling site 63). The DDT con-centration at this station was about 0.2 ppm. No other organo-chlorine pesticides were detected (detection limits ranged from 0.151 to 0.874 ppm). No measurable amounts of PCBs were detected in any of the samples collected (detection limits ranged from 0.11 to 0.251 ppm).
Effects of Human Activities on Sediment Quality
Concentrations of elements measured in grab samples from the freshwater part of the study area (upstream of the Amelia Earhart Dam) were compared to median concentra-tions of the same elements measured in fine-grained sediment collected from freshwater streams in Connecticut, Maine, Massachusetts, New Hampshire, New York, and Rhode Island. These sediment samples were collected between 1977 and 1980 as part of the National Uranium Resource Evaluation (NURE) program—specifically the Hydrogeochemical and Stream Sediment Reconnaissance (HSSR) program (Smith, 1998; Grossman, 1998)—and reanalyzed by the National Geochemical Survey by using modern (2000) methods (U.S. Geological Survey, 2003). A brief history of this program, as well as tabulated data, is available online (U.S. Geological
Survey, 2004). Concentrations of elements measured in sediment samples from the estuarine part of the study area (downstream of the Amelia Earhart Dam) were compared to concentrations thought to represent background for estuarine environments (Bowen, 1979).
The NURE HSSR program SOP instructed researchers to collect bottom-sediment samples from small uncontaminated streams (Ferguson and others, 1977), which were assumed to be unaffected by human activities. Element concentrations measured in these sediment samples are assumed to approxi-mate nonurban background concentrations in New England streams. The samples collected by NURE HSSR and the samples collected in this study were processed by different methods (Ferguson and others, 1977). The NURE HSSR sam-ples were passed through a 150-µm sieve, whereas samples collected in this study were not sieved. This difference could affect the comparison because the NURE HSSR samples consisted of a higher proportion of fine-grained sediments, which have a higher surface area per unit weight than coarse sediments, and because contaminants typically adhere to sedi-ment in proportion to surface area (Horowitz, 1991). Thus, concentrations in NURE samples may be high relative to con-centrations in unsieved samples from the same locations; such unsieved samples would be more directly comparable to the samples of this study. The samples collected by NURE HSSR and the samples collected in this study were also analyzed by different methods. The stronger acid digestion used by NURE HSSR than that used in this study probably also resulted in higher concentrations in the NURE HSSR trace-element data.
Despite the possibility that concentrations in the NURE samples would be biased higher than in the Mystic River Basin samples, selected trace-element concentrations in Mystic River Basin samples (excluding antimony, cadmium, and mercury, for which NURE provided no chemical back-ground data) were generally greater than background con-centrations in the NURE samples or concentrations thought to represent background for estuarine environments (Bowen, 1979). Concentrations of arsenic, chromium, copper, lead, or zinc were greater than background at 82 percent or more of the sites sampled. Similarly, concentrations of nickel, beryl-lium, or silver were greater than background concentrations in nearly one-half of the grab samples. The widespread distri-bution of high concentrations of arsenic, chromium, copper, lead, and zinc in sediments throughout the Mystic River Basin strongly suggests the importance of human activities.
Results for Sediment Grab Samples 21

22 Sediment Quality of Lakes, Rivers, and Estuaries in the Mystic River Basin, Eastern Massachusetts, 2001–03
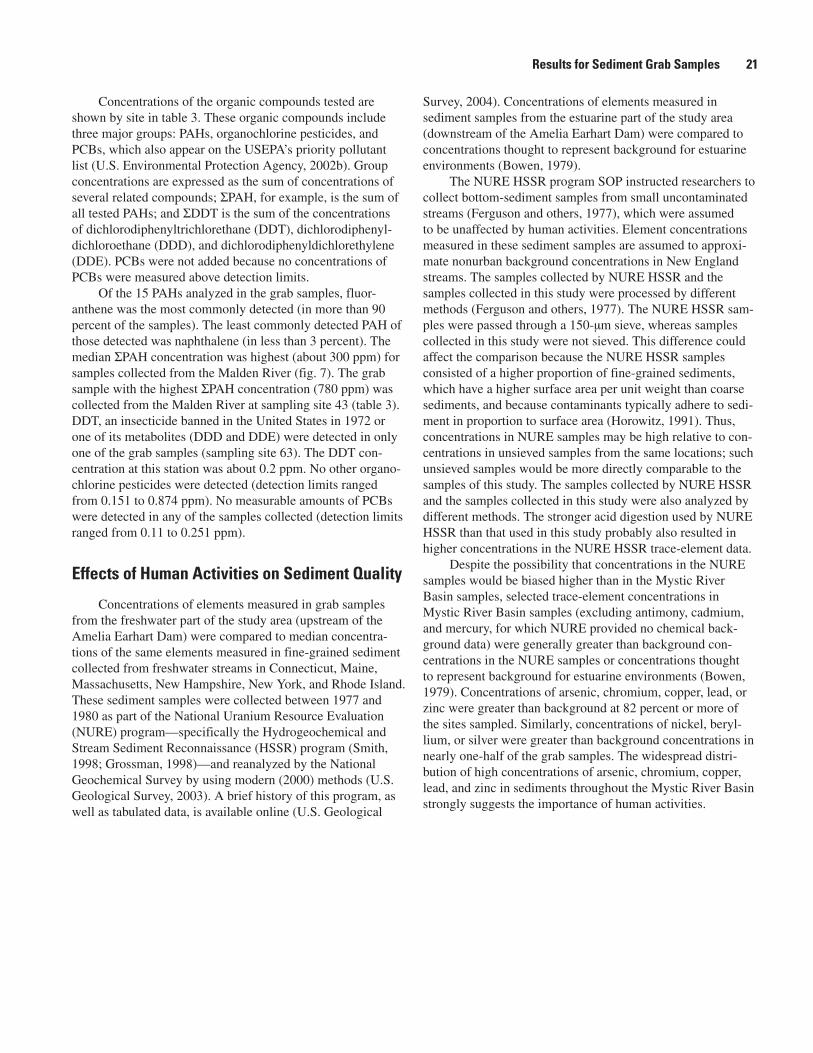
Researchers may erroneously conclude that enrichment is caused by human activity, when the enrichment may actually be caused by natural processes. Many natural factors can cause bottom sediments to become enriched with trace elements above background levels, including differential weathering (related to solubilities of individual elements), physical frac-tionation (for example, the removal of fine particles by wind and water), chemical fractionation, and deposition of enriched atmospheric and biogenic dust (Reimann and De Caritat, 2000). In contrast, the history of dredging and channeliza-tion in the lower Mystic River, Chelsea Creek, and Boston Inner Harbor during the past 100 years may cause research-ers to conclude erroneously that human activities have not affected sediment quality. Most recently (1998–2001), the Boston Harbor Navigation Improvement Project (BHNIP), a cooperative effort by the USACE and the Massachusetts Port Authority (MassPort), removed or redistributed about 3.5 million cubic yards of sediment (fig. 8). The objective of this project was to deepen parts of the lower Mystic River and Inner Harbor from 35 ft mean lower low water1 (MLLW) to about 40 ft MLLW, and parts of Chelsea Creek from 35 ft MLLW to about 38 ft MLLW. Most sediment was placed in confined aquatic disposal cells built within the federal naviga-tion channels and in designated disposal sites in Massachusetts Bay. Those areas dredged by the BHNIP are shown in figure 8. Thus, chemical analysis of grab samples collected from dredged areas during this study likely represents the chemistry of more recently deposited sediment (after 1998–2001) or, less likely, represents the chemistry of sediment deposited much earlier; the interpretation depends on sedimentation rates and resuspension patterns. In either case, grab samples can be used to measure existing (2001–03) sediment quality. Age dating of grab samples is beyond the scope of this project.
In contrast to trace elements, many of which occur naturally in bottom sediments, many organic compounds in sediment—for example, pesticides and PCBs—are not naturally occurring. Exceptions to this are the PAHs that are found in petroleum and in combustion emissions (for example, forest fires). Concentrations of naturally occurring PAHs are typically not very high in bottom sediments (about 1–10 ppm) (Massachusetts Department of Environmental Protection, 2002). Accordingly, the contamination of sediment by PAHs above 10 ppm and many other organic compounds can be attributed to human activities.
Comparison to Other Urban Rivers
Concentrations of the selected trace elements (with the exception of mercury) and organic compounds were com-pared with concentrations of these constituents in samples collected from other urban rivers (whose drainage-basin areas
have greater than 50 percent urban land use) throughout the conterminous United States as part of the National Water-Quality Assessment (NAWQA) Program of the USGS (Rice, 1999). Like the NURE HSSR sediment samples, samples collected by the NAWQA Program for analysis of trace metals and organic compounds were sieved (through 63-µm and 2-mm sieves, respectively). The procedure used by the NAWQA Program also includes a a stronger acid digestion than that used in this study. The sieving procedure and use of a stronger acid digestion probably resulted in higher concentra-tions than would have been obtained if the NAWQA samples had been processed and analyzed by using the methods of this study.
Concentrations of some selected trace elements (arse-nic, chromium, copper, lead, silver, or zinc) in Mystic River sediments were greater than the median concentrations for those elements in sediment collected by the USGS NAWQA Program at 75 percent or more of the sites sampled (fig. 7). Concentrations of cadmium and nickel were also greater than the NAWQA median concentrations at 45 and 23 percent, of the sites, respectively. Beryllium concentrations from the Mystic River Basin were less than the median NAWQA beryl-lium concentration in samples from all of the sites but two. The SPAH concentration in samples collected from the Mystic River Basin was generally greater than the NAWQA median PAH concentration (87 percent of the sites). Total DDT and PCB concentrations could not be compared with NAWQA concentrations because DDT and PCB detection limits for this study were higher than the NAWQA median DDT and PCB concentrations, respectively.
A better comparison might be between concentrations in the Mystic River Basin sediments and in the sediments of the other two rivers tributary to Boston Harbor. Summary statistics of selected trace element and organic compound concentra-tions in bottom sediment collected from the lower Charles and Neponset Rivers, both of which are dammed (Breault and oth-ers 2000, 2004a), allow comparison of the quality of Mystic River Basin sediments to the quality of sediments in nearby urban rivers (fig. 7). Generally, concentrations of the selected trace elements (mercury was not included in the comparison because data for this element from the other rivers were not available) and SPAHs were lower in the Mystic River Basin than in the lower Charles, but higher than in the Neponset River, with a few exceptions. Concentrations of arsenic were generally higher in the Mystic River Basin than in both the Charles and Neponset Rivers (fig. 7). Total DDT and PCB concentrations could not be compared with concentrations in samples from the Charles and Neponset Rivers because the detection limits for the Mystic River Basin samples were higher than for the samples collected in those studies.
1Mean lower low water is defined as the mean altitude of the lower of the two daily low-water altitudes over a period of time, typically 19 years (U.S. Geological Survey, 2005).
Figure �. Areas dredged as part of the Boston Harbor Navigation Improvement Project, in which the lower Mystic River and Inner Harbor, Massachusetts, were deepened from 35 feet mean lower low water (MLLW) to about 40 feet MLLW (light blue) and parts of Chelsea Creek from 35 feet MLLW to about 38 ft MLLW (dark blue).
Results for Sediment Grab Samples 23
Base map coverages from MassGIS, NAD 83,Lambert Conformal Polyconic projection,Massachusetts coordinate system mainlandzone in meters
EXPLANATION
3 feet (from 35 to 38 foot depth)
5 feet (from 35 to 40 foot depth)
DEPTH OF SEDIMENTDREDGED, IN FEET 0
0 1 MILE
1 KILOMETER
Boston
East BostonCharlestown
Everett
Chelsea
Cambridge
So
mer
ville
Som
erville
Winthrop
Med
ford
234,693 235,693 238,693237,693236,693 239,693
905,917
904,917
903,917
902,917
901,917
900,917
2� Sediment Quality of Lakes, Rivers, and Estuaries in the Mystic River Basin, Eastern Massachusetts, 2001–03
Results for Sediment Core SamplesChemical data from sediment cores can be used to
(1) assess trends in contaminant concentrations, (2) deter-mine the effects of human activities on sediment quality, and (3) investigate the distribution of new contaminants. Data from core samples can also be used by water-resources manag-ers to monitor, assess, and plan restoration efforts aimed at improving sediment quality. Trends in sediment quality can be observed from concentration profiles measured in sediment cores. The effects of human activities on sediment quality can be inferred by correlating human activities with contaminant peaks in the cores collected in undisturbed areas.
Trends in Sediment Quality
Sediment core results for trace elements (table 4) show variability in concentration with depth at some sites and con-centrations that are elevated relative to background (figs. 9–16, at back of report). For example, in the Lower Mystic Lake core from site 105, arsenic concentration was highest (310 ppm) at 77.5 to 81 cm. These levels were substantially higher than background (about 20–40 ppm) as measured in deeper sedi-ment strata. Although concentrations from the lake were lower in surface sediments (110 ppm) than at their peak, the concen-trations were still much higher than background. This suggests either that there are contemporary inputs of arsenic to the lake or that arsenic in deeper sediment is remobilized to surface-sediment strata. Other results show that some trace-element concentrations are remaining constant, are only slightly lower in near-surface sediments, or show no trend at all with depth. For example, arsenic, beryllium, cadmium, lead, nickel, and silver concentrations measured in near-surface sediment sam-ples collected from Island End River appear to remain constant with depth; other examples are shown in figures 9–16.
Concentrations of PAHs vary with depth at most sites (table 5). Some core samples show substantially lower con-centrations of PAHs in surface layers compared to deeper layers. For example, in the Island End River core (sampling site 112, fig. 16), concentrations of PAHs decrease from 1,300 ppm (measured in the sediment at a depth of 40–44 cm) to 72 ppm in surficial sediment. It is likely that residual wastes from a coal-gasification plant that operated on the Island End River are the source of PAH contamination in the river (U.S. Environmental Protection Agency, 1999). In contrast, plots of SPAHs measured in core samples from sampling sites 107, 108, 109, 110, and 111 show a continuous increase in PAH concentrations with time. This trend is mirrored in cores from other urban areas across the United States (Van Metre and others, 2000). One possible source of contemporary PAHs is vehicular traffic, a byproduct of urban development, espe-cially during the past 20–40 years. The Mystic River Basin has undergone considerable population growth during this time. There were only a few detections (fewer than six) of the
pesticides; DDD (48–65 cm), DDT (73–77), and methoxy-chlor (61–81 cm) in cores collected from Lower Mystic Lake, one detection of methoxychlor in the core collected from the Malden River (75–78) and no detection of PCBs above the detection limit in core samples.
Sediment-concentration profiles can be greatly affected by several factors, most notably grain-size differences, bio-turbation, diagenetic chemical processes, physical transport of contaminated sediment, and dredging. Generally, because fine sediment grains have much larger surface areas per unit weight than coarse sediment grains, fine grains of sediment have larger surface areas to which contaminants can adhere (Horowitz, 1991). Thus, observed increases or decreases in contaminant concentrations within a core might simply be a result of increases or decreases in grain sizes instead of changes in contaminant loading. Although grain-size information was unavailable for core-sample data from the Mystic River Basin, “conservative elements” like aluminum and titanium can be used as an empirical proxy (Horowitz, 1991). Fine-grained sediment would be expected to have a greater proportion of these elements per unit weight than coarse-grained sediment. Plots of contaminant concentrations divided by aluminum (aluminum-normalized) or titanium (titanium-normalized) concentrations can, therefore, be used to elucidate trends (figs. 9–16; Horowitz, 1991). Aluminum-normalized trace-element concentrations were calculated by dividing each trace-element concentration, in parts per million, by the concentration of aluminum (in percent) measured in the same sample. Similarly, titanium-normalized trace element concentrations were calculated by dividing the concentra-tion of each contaminant by the concentration of titanium. Concentrations of titanium (in percent) were first multiplied by 10 (figs. 9–13, and 15) and by 100 (fig. 14) for purposes of scale (figs. 9–16). These plots show little change in depo-sitional history, therefore, changes in contaminant concentra-tions can be interpreted as changes in contaminant loading.
Bioturbation refers to the mixing of the upper layers of bottom sediment by organisms that live in and on the bottom sediment—for example, worms, snails or crabs. As these crea-tures move through or ingest the sediment, they can homog-enize sediment layers that may have been deposited over several tens of centimeters (Berner, 1980; Matisoff, 1995). Bioturbation can also increase the exchange of contaminants from the sediment into the water column (Bencala and other, 1984; Berg and others, 2001). For example, researchers work-ing with lugworms have shown that the remobilization of cad-mium from sediments with lugworms was three to five times greater than from sediment without lugworms (Rasmussen and others, 2004). Diagenetic chemical processes take place after a chemical is deposited in the sediment. Several pro-cesses might redistribute a given chemical after deposition, including equilibrium processes, homogeneous reactions, microbial reactions, precipitation, dissolution, and authigenic processes (Berner, 1980). The physical transport of contami-nated sediment by waves, currents, or other physical processes
can also affect down-core chemistry. Physical transport of contaminants with suspended sediment might also result in the sorbtion or desorption of contaminants (Bonner and others, 1994). Finally, recent dredging of parts of the lower Mystic River, Boston Inner Harbor, and Chelsea Creek has affected the observed contaminant trends.
Human Activities and Sediment Quality
It may be possible to reconstruct the history of human influence in the Mystic River Basin on sediment quality by using core samples. This is particularly true for samples collected from Lower Mystic Lake, because the history of human activities in the drainage basin just upstream of the lake has been well documented (Splietfhoff and Hemond, 1996). Although dates were not assigned to sediment depths in the cores collected in this study, sediment samples from Upper Mystic Lake collected, chemically analyzed, and dated by others could be used to corroborate the interpreta-tion of sediment-quality data in Lower Mystic Lake. Possible coincidences can be identified between peak concentrations of specific contaminants in the core sample collected at site 105 in Lower Mystic Lake and activities that produced those contaminants in the lake’s drainage area.
The Aberjona River flows into Upper Mystic Lake, which drains into Lower Mystic Lake. The Aberjona River flows through one of the best-known Superfund sites in the Nation—the Industri-Plex in Woburn, MA. Between the 1860s and 1980s, six different chemical manufacturing companies oper-ated on this site, and produced chemicals used by the leather and textile industries, arsenic- and lead-based pesticides, sulfuric acid, and explosives used during both World Wars. Byproducts of these manufacturing processes were often disposed of in areas near and directly adjacent to the Aberjona River. The arsenic-concentration maximum measured in the Lower Mystic Lake sediment core (sampling site 105, fig. 9) may correspond with the first of two major episodes of arsenic contamination in the basin in the early 1900s (Spliethoff and Hemond, 1996; Knox, 1991). The source of this arsenic is believed to be pyrites used in the manufacturing of sulfu-ric acid at the Industri-Plex site (Aurilio and others, 1995). Additionally, the arsenic peak measured at site 105 roughly corresponds with peaks of other contaminant concentrations. These peaks may indicate a period of substantial contaminant transport in the basin.
Concentrations of lead can also be related to human activities in the basin. For example, the use of lead as a gaso-line additive reached a maximum in the mid-1970s, at which time it was phased out by the USEPA. A high concentration of lead (1,600 ppm) was measured at a depth of 32.5 cm to 36.5 cm in the sediment core collected from site 105 in Lower Mystic Lake. The highest concentrations of lead and other metals were at depths between 61 and 97 cm in sediment cores from the lake. This depth may correspond to the years between
1914 and 1947 when munitions used in both World Wars were manufactured in industrial plants just upstream of Lower Mystic Lake.
The maximum SPAH concentration (1,200 ppm) mea-sured at sample site 105 in Lower Mystic Lake occurred at a depth of 73 to 77 cm, which may correspond approximately to the period 1930–35. The most likely source of these PAHs is tar from a coal-gasification plant that operated in Arlington between 1900 and 1930. Finally, a large spike in the concen-tration of silver (8.3 ppm) was measured at sample site 105 at a depth of 40.5 to 44.5 cm (fig. 9). The source of this silver is unknown.
Toxicity of Contaminated Bottom Sediment
Contaminant concentrations in sediment-grab samples were compared to sediment-quality guidelines and to exposure-based soil standards to assess the potential health risks posed by the Mystic River Basin sediments to bottom-dwelling organisms and to humans.
Benthic Organisms
One way to assess whether a river can support a healthy and diverse population of fish is to test the health of their food source, particularly benthic organisms. Benthic organisms (for example, worms, snails, or crabs) live and feed on the river bottom, where they come in direct contact with contaminated sediment. Contaminants can accumulate in the tissues of these organisms as they ingest sediment contaminated with elements and organic compounds or sorb these contaminants directly from sediment and water (Forstner and Whittman, 1983). Accumulation of these constituents in benthic organisms can cause physiological problems, reproductive problems, and death. Subsequent ingestion of contaminated benthic organ-isms by other organisms higher in the food chain (for example, fish) can cause similar health effects.
The potential toxicity of Mystic River sediment to benthic organisms can be estimated by comparing measured concentrations for individual contaminants and contaminant types to probable effect concentrations (PECs), which are pub-lished guidelines (Ingersoll and others, 2000). The guidelines are based on the results of laboratory tests in which organisms such as the amphipod Hyalella azteca and the insect larva Chironomus spp. were exposed to different concentrations of contaminants. The predicted potential for toxicity depends on the organism and on the test conditions in general; however, concentrations higher than the PECs are considered likely to be toxic to benthic organisms. Average PEC quotients can be calculated for individual sediment samples in which concen-trations of more than one contaminant have been measured. The quotient for a given sample is a measure of the toxicity
Toxicity of Contaminated Bottom Sediment 2�
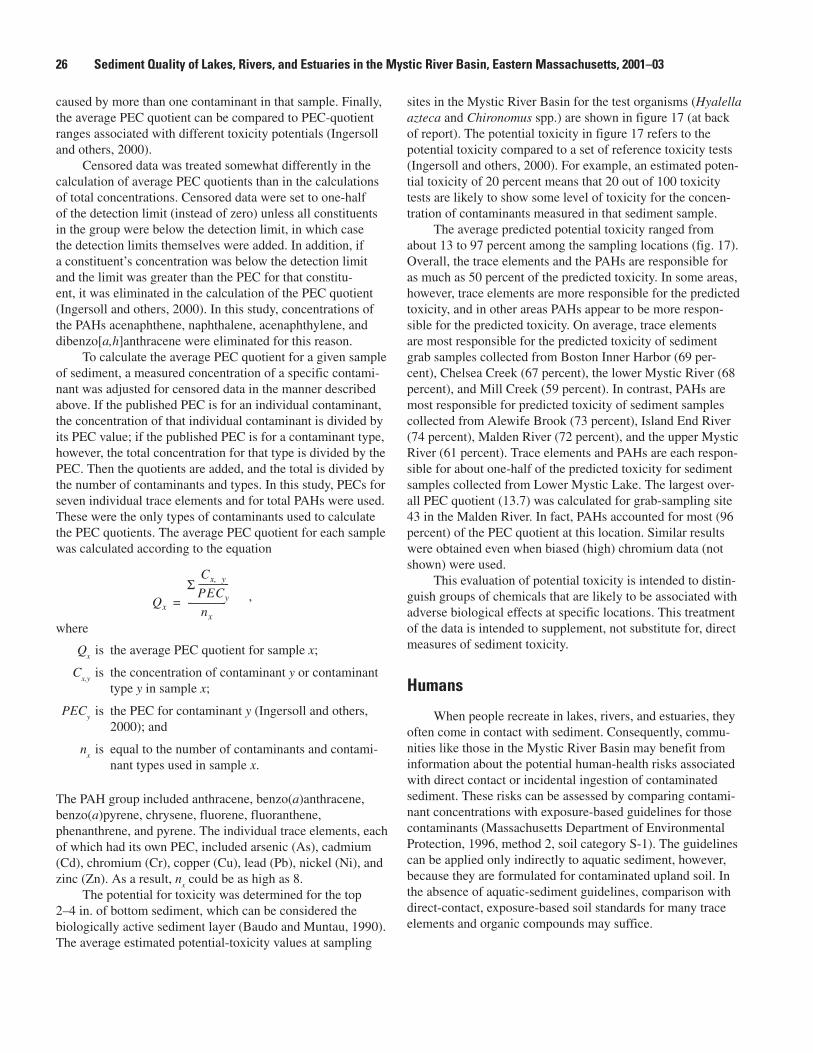
2� Sediment Quality of Lakes, Rivers, and Estuaries in the Mystic River Basin, Eastern Massachusetts, 2001–03
caused by more than one contaminant in that sample. Finally, the average PEC quotient can be compared to PEC-quotient ranges associated with different toxicity potentials (Ingersoll and others, 2000).
Censored data was treated somewhat differently in the calculation of average PEC quotients than in the calculations of total concentrations. Censored data were set to one-half of the detection limit (instead of zero) unless all constituents in the group were below the detection limit, in which case the detection limits themselves were added. In addition, if a constituent’s concentration was below the detection limit and the limit was greater than the PEC for that constitu-ent, it was eliminated in the calculation of the PEC quotient (Ingersoll and others, 2000). In this study, concentrations of the PAHs acenaphthene, naphthalene, acenaphthylene, and dibenzo[a,h]anthracene were eliminated for this reason.
To calculate the average PEC quotient for a given sample of sediment, a measured concentration of a specific contami-nant was adjusted for censored data in the manner described above. If the published PEC is for an individual contaminant, the concentration of that individual contaminant is divided by its PEC value; if the published PEC is for a contaminant type, however, the total concentration for that type is divided by the PEC. Then the quotients are added, and the total is divided by the number of contaminants and types. In this study, PECs for seven individual trace elements and for total PAHs were used. These were the only types of contaminants used to calculate the PEC quotients. The average PEC quotient for each sample was calculated according to the equation
,
where
Qx
is the average PEC quotient for sample x;
Cx,y
is the concentration of contaminant y or contaminant type y in sample x;
PECy
is the PEC for contaminant y (Ingersoll and others, 2000); and
nx
is equal to the number of contaminants and contami-nant types used in sample x.
The PAH group included anthracene, benzo(a)anthracene, benzo(a)pyrene, chrysene, fluorene, fluoranthene, phenanthrene, and pyrene. The individual trace elements, each of which had its own PEC, included arsenic (As), cadmium (Cd), chromium (Cr), copper (Cu), lead (Pb), nickel (Ni), and zinc (Zn). As a result, n
x could be as high as 8.
The potential for toxicity was determined for the top 2–4 in. of bottom sediment, which can be considered the biologically active sediment layer (Baudo and Muntau, 1990). The average estimated potential-toxicity values at sampling
sites in the Mystic River Basin for the test organisms (Hyalella azteca and Chironomus spp.) are shown in figure 17 (at back of report). The potential toxicity in figure 17 refers to the potential toxicity compared to a set of reference toxicity tests (Ingersoll and others, 2000). For example, an estimated poten-tial toxicity of 20 percent means that 20 out of 100 toxicity tests are likely to show some level of toxicity for the concen-tration of contaminants measured in that sediment sample.
The average predicted potential toxicity ranged from about 13 to 97 percent among the sampling locations (fig. 17). Overall, the trace elements and the PAHs are responsible for as much as 50 percent of the predicted toxicity. In some areas, however, trace elements are more responsible for the predicted toxicity, and in other areas PAHs appear to be more respon-sible for the predicted toxicity. On average, trace elements are most responsible for the predicted toxicity of sediment grab samples collected from Boston Inner Harbor (69 per-cent), Chelsea Creek (67 percent), the lower Mystic River (68 percent), and Mill Creek (59 percent). In contrast, PAHs are most responsible for predicted toxicity of sediment samples collected from Alewife Brook (73 percent), Island End River (74 percent), Malden River (72 percent), and the upper Mystic River (61 percent). Trace elements and PAHs are each respon-sible for about one-half of the predicted toxicity for sediment samples collected from Lower Mystic Lake. The largest over-all PEC quotient (13.7) was calculated for grab-sampling site 43 in the Malden River. In fact, PAHs accounted for most (96 percent) of the PEC quotient at this location. Similar results were obtained even when biased (high) chromium data (not shown) were used.
This evaluation of potential toxicity is intended to distin-guish groups of chemicals that are likely to be associated with adverse biological effects at specific locations. This treatment of the data is intended to supplement, not substitute for, direct measures of sediment toxicity.
Humans
When people recreate in lakes, rivers, and estuaries, they often come in contact with sediment. Consequently, commu-nities like those in the Mystic River Basin may benefit from information about the potential human-health risks associated with direct contact or incidental ingestion of contaminated sediment. These risks can be assessed by comparing contami-nant concentrations with exposure-based guidelines for those contaminants (Massachusetts Department of Environmental Protection, 1996, method 2, soil category S-1). The guidelines can be applied only indirectly to aquatic sediment, however, because they are formulated for contaminated upland soil. In the absence of aquatic-sediment guidelines, comparison with direct-contact, exposure-based soil standards for many trace elements and organic compounds may suffice.
Qx
Cx y,
PECy
--------------�
nx
-----------------=Σ
Comparing sediment concentrations to soil-based human-health standards likely overestimates the potential human-health risk. As people wade or swim near contami-nated sediment, the sediment is washed quickly from their skin. On the other hand, people exposed to contaminated soils typically experience extended contact with the soil; therefore, the contaminant is more likely to enter the body. Nonetheless, the comparison can provide a sense of the risk associated with contacting the sediment. These comparisons, however, are not intended to replace direct measures of the health risk.
Several of the constituents were detected at concentra-tions near or above their respective human-health standards for soil. Of the trace elements, concentrations of antimony (at 1 sample site), arsenic (9 sample sites), beryllium (61 sample sites), lead (39 sample sites), and zinc (1 sample site) were closest to their respective standards for soil. Of particular interest is the beryllium concentration that was measured at Chelsea Creek (sample site 99) at more than 11 times the standard for soil. Lead and zinc concentrations at this site were also greater than the soil-standard concentrations of lead and zinc by six and two times, respectively. Of the organic compounds tested, the PAHs—benzo[a]anthracene (at 72 grab-sampling sites), benzo(b)fluoranthene and benzo[k]-fluoranthene (38 sample sites), benzo[a]pyrene (83 sample sites), chrysene (36 sample sites), dibenzo[a,h]anthracene (22 sample sites), indeno[1,2,3-cd]pyrene (54 sample sites), and naphtalene (1 sample site)—were closest to human-health standards for soil. On the basis of the analysis methods described previously for censored data, none of the organo-chlorine pesticides tested showed potential for adverse human-health risk based on soil standards. The human-health effects of PCBs could not be assessed because of the high detection limits in this study.
SummarySurface-sediment and sediment-core samples from Lower
Mystic Lake, Mystic River, Alewife Brook, Malden River, Island End River, Chelsea and Mill Creeks in the Mystic River Basin were tested for the presence of pesticides, polyaromatic hydrocarbons (PAHs), polychlorinated biphenyls, and selected elements, including antimony, arsenic, beryllium, cadmium, chromium, copper, lead, mercury, nickel, silver, and zinc. Both types of samples were generally enriched in toxic ele-ments and organic compounds when compared to background concentrations. In addition, most constituent concentra-tions—in particular, arsenic, chromium, copper, lead, silver, or zinc, and PAHs—were equal to or greater than those found in the sediments of other urban rivers. With a few excep-tions, concentrations of the selected trace elements and PAHs were lower in the Mystic River Basin sediments than in the sediments of the lower Charles, but higher than or equal to concentrations in the sediments of the Neponset River—each a tributary to Boston Harbor. Concentrations of arsenic were
generally higher in the Mystic River Basin than in both the lower Charles and Neponset Rivers. Some chemicals are in sufficiently high concentrations in sediment samples collected from the Mystic River Basin to pose a threat to benthic organ-isms and, based on guidelines developed for upland soils, and may cause human-health risks if humans come in contact with the sediment.
Sediment core results show that trace-element concentrations within the upper parts of the cores (more recently deposited sediment) have remained constant or have slightly declined, on average. In contrast, concentrations of PAHs appear to be increasing in near-surface sediment compared to sediment deposited earlier. Taken as a whole, however, graphs of sediment-core data show that the concen-trations of trace elements and PAHs in surficial sediment are substantially lower than in sediment at depth. These trends imply that, although the sediment quality in the Mystic River Basin remains impaired and shows little improvement over recent years, the sediment quality has improved markedly since the turn of the century.
AcknowledgmentsThe authors express their gratitude to the following
USGS employees for their cooperation and assistance: Stacey Archfield, Jason Sorenson, and Joseph Zanca for assistance with sampling; and Marcus Waldron, John Colman, Jonathan Morrison, and Leslie DeSimone for technical and editorial assistance: Alex Gorshteyn and Zinoviy Katayenko (Tuft University) for chemical analysis of sediment samples.
References Cited
Aurilio, A., Durant, J.L., and Hemond, H.F., 1995, Sources and distribution of arsenic contamination in the Aberjona Watershed, eastern Massachusetts: Water, Air, and Soil Pollution, v. 81, p. 265–282.
Aurilio, A., Mason, R., and Hemond, H.F., 1993, Speciation and fate of arsenic in three lakes of the Aberjona water-shed, eastern Massachusetts: Environmental Science and Technology v. 28, p. 577–585.
Baudo, R., and Muntau, H., 1990, Lesser known in-place pollutants and diffuse source problems, in Baudo, R., Giesy, J., and Muntau, H., eds., Sediment chemistry and toxicity of in-place pollutants: Boston, MA, Lewis Publishers, Inc., 405 p.
References Cited 2�
2� Sediment Quality of Lakes, Rivers, and Estuaries in the Mystic River Basin, Eastern Massachusetts, 2001–03
Bencala, K.E., Kennedy, V.C., Zellweger, G.W., Jackman, A.P., and Avanzino, R.J., 1984, Interactions of solutes and streambed sediment, 1. An experimental analysis of cation and anion transport in a mountain stream: Water Resources Research, v. 20, p. 1797–1803.
Berg, P., Rysgaard, S., Funch, P., and Sejr, M.K., 2001, Effects of bioturbation on solutes and solids in marine sediments:Aquatic Microbial Ecology, v. 26, p. 81–94.
Berner, R.A., 1980, Early diagenesis—A theoretical approach: Princeton, NJ, Princeton University Press, 241 p.
Bonner, J.S., Ernest, A.N., Autenrieth, R.L., and Ducharme, S.L., 1994, Parameterizing models for contaminated sedi-ment transport, in DePinto, J.V., Lick, W., and Paul, J.P., eds., Transport and transformation of contaminants near the sediment-water interface: Ann Arbor, MI, CRC Press, Inc., 351 p.
Bowen, H.J.M., 1979, Environmental chemistry of the ele-ments: London, England, Academic Press, 316 p.
Breault, R.F., Cooke, M.G., and Merrill, Michael, 2004a, Data on sediment quality and concentrations of polychlorinated biphenyls from the lower Neponset River, Massachusetts, 2002–03: U.S. Geological Survey Open-File Report 2004-1280, 55 p.
Breault, R.F., Reisig, K.R., Barlow, L.K., and Weiskel P.K., 2000, Distribution and potential for adverse biological effects of inorganic elements and organic compounds in bottom sediment, Lower Charles River, Massachusetts: U.S. Geological Survey Water-Resources Investigations Report 00-4180, 70 p.
Buchholtz ten Brink, M.R., Manheim, F.T., Mecray, E.L., Hastings, M.E., and Currence, J.M., along with Farrington, J.W., Fredette, T.J., Jones, S.H., Larsen, P.F., Liebman, M.L., Smith Leo, W., Tripp, B.W., Wallace, G.T., Jr., and Ward, L.G., 2002, Contaminated sediments database for the Gulf of Maine, U.S. Geological Survey Open-File Report 02-403, accessed on March 23, 2004, at http:// pubs.usgs.gov/of/2002/of02-403/
Chelsea Historical Society, 2004, The second engagement of the Revolutionary War, accessed on March 17, 2004, at http://www.olgp.net/chs/war/second.htm
de Groot, A.J., 1995, Metals and sediments—A global per-spective, in Allen, H.E., eds., Metal contaminated aquatic sediments: Chelsea, MI, Ann Arbor Press, Inc., 292 p.
DePinto, J.V., Lick, W., and Paul, J.F., 1994, in DePinto, J.V., Lick, W., and Paul, J.F., eds., Transport and transformation of contaminants near the sediment-water interface: Boca Raton, FL, CRC Press, Inc., 351 p.
Durant, J.L., Zemach, J.J., and Hemond, H.F., 1990, The history of leather industry waste contamination in the Aberjona River watershed—A mass balance approach: Civil Engineering Practice, v. 5, p. 41–66.
Ferguson, R.B., Price, Van, and Baucom, E.I., 1977, Field manual for stream water and sediment reconnaissance: E.I. du Pont de Nemours & Co., Savannah River Laboratory, Aiken, S.C., SRL Internal Doc. DPST-76-363, U.S. Department of Energy, Grand Junction, Colorado, GJBX-80(77), 78 p.
Forstner, U., and Wittman, G.T.W., eds., 1983, Metal pollu-tion in the benthic environment: New York, Springer Verlag, 486 p.
Grossman, J.N., 1998, National geochemical atlas—The geochemical landscape of the conterminous United States derived from stream sediment and other solid sample media analyzed by the national uranium evaluation (NURE): U.S. Geological Survey Open-File Report 98-622, ver. 3.01, 1 CD-ROM.
Heinz Center, 2002, Dam removal science and decision mak-ing: Washington, D.C., The H. John Heinz III Center for Science, Economics, and the Environment, 221 p.
Helsel, D.R., and Cohn, T.A., 1998, Estimation of descriptive statistics for multiply-censored water-quality data: Water-Resources Research, v. 24, n. 12, p. 1997–2004.
Horowitz, A.J., 1991, A primer on sediment-inorganic element chemistry (2d ed.): Boca Raton, FL, Lewis Publishers, 136 p.
Ingersoll, C.G., MacDonald, D.D., Wang, N., Crane, J.L., Field, L.J., Haverland, P.S., Kemble, N.E., Lindskoog, R.A., Severn, C., and Smorong, D.E., 2000, Prediction of sediment toxicity using consensus-based freshwater sedi-ment quality guidelines: Chicago, IL, U.S. Environmental Protection Agency, EPA 905/R-00/007, June 2000, 25 p.
Knox, M.L., 1991, The distribution and depositional history of metals in surface sediments of the Aberjona River water-shed: Boston, MA, M.S. Thesis, Massachusetts Institute of Technology, variously paged.
Manheim, F., Buchholtz ten Brink, M., Hastings, P., and Mecray, E., 1999, Contaminated-sediment database devel-opment assessment in Boston Harbor: U.S. Geological Survey Fact Sheet FS-078-99, accessed on March 22, 2004, at http://pubs.usgs.gov/fs/fs78-99/
Matisoff, G., 1995, Effects of bioturbation on solute and par-ticle transport in sediments, in Allen, H.E., ed., Metal con-taminated sediment: Chelsea, MI, Ann Arbor Press, 292 p.
Massachusetts Department of Environmental Protection, 1996, Massachusetts contingency plan: Boston, MA, Massachusetts Department of Environmental Protection, variously paged.
Massachusetts Department of Environmental Protection, 2002, Background levels of polycyclic aromatic hydrocarbons and metals in soil, accessed on February 11, 2004, at http://www.state.ma.us/dep/ors/files/backtu.pdf.
Montgomery, D.R., and Buffington, J.M., 1998, Channel processes, classification, and response, in Naiman, R.J., and Bilby, R.E., eds., River ecology and management: New York, Springer-Verlag, 705 p.
Mystic River Watershed Association, 2003, Mystic River Watershed Association water quality monitoring: Malden River May 28, 2002, accessed on March 17, 2004, at http://www.mysticriver.org/publications/malden2002.pdf.
Mystic River Watershed Association, 2004, Water pollution, accessed on March 18, 2004, at http://www.mysticriver.org/ about_watershed/pollution.html
Nangle Consulting Associates, 2000, Interim data submittal, Malden River Corridor, U.S. EPA Brownfields Program, TeleCom City Everett-Malden-Medford, Massachusetts: Canton, MA, Nangle Consulting Associates, variously paged.
Rasmussen, D., Banta, G., and Andersen, O., 2004, Lugworm bioturbation affects cadmium water/sediment transfer and distribution, accessed on July 22, 2004, at http://www.aslo.org/meetings/santafe99/abstracts/SS30FR1145S.html
Reimann, C., and DeCaritat, P., 2000, Intrinsic flaws of elemental enrichment factors in environmental geochemis-try, Environmental Science and Technology, v. 34, n. 24, p. 5084-5091.
Rice, K.C., 1999, Inorganic-element concentrations in streambed sediment across the conterminous United States: Environmental Science & Technology, v. 33, n. 15, p. 2499–2504.
Scott, J.C., 1990, Computerized stratified random site-selection approached across the conterminous United States: Environmental Science and Technology; v. 33, n. 15, p. 2499–2504.
Smith, S.M., 1998, History of the national uranium resource evaluation hydrogeochemical and stream sediment recon-naissance program: U.S. Geological Survey National Geochemical Database, Open-File Report 97-492, accessed on March 12, 2003, at http://pubs.usgs.gov/of/1997/ ofr-97-0492/nurehist.htm
Spliethoff, H.M., Mason, R.P., and Hemond, H.F., 1995, Interannual variability in the speciation and mobility of arsenic in a dimictic lake: Environmental Science and Technology, v. 29, n. 8, p. 2157–2161.
Spliethoff, H.M., and Hemond, H.F., 1996, History of toxic metal discharge to surface waters of the Aberjona water-shed: Environmental Science and Technology, v. 30, no.1, p. 121–128.
Sly, P.G., 1994, The impact of physical processes at the sediment/water interface in large lakes, in DePinto, J.V., Lick, W., and Paul, J.P., eds., Transport and transformation of contaminants near the sediment-water interface: Ann Arbor, MI, CRC Press, Inc., 351 p.
U.S. Environmental Protection Agency, 1999, Chelsea River oil hazards survey: Boston, MA, U.S. Environmental Protection Agency, variously paged.
U.S. Environmental Protection Agency, 2002a, National recommended water-quality criteria: U.S. Environmental Protection Agency EPA-822-R-02-047, 36 p.
U.S. Environmental Protection Agency, 2002b, EPA Numeric criteria, accessed on July 19, 2004, at http:// oaspub.epa.govwqsdatabase/wqsi_epa_criteria.rep_ parameter
References Cited 2�
30 Sediment Quality of Lakes, Rivers, and Estuaries in the Mystic River Basin, Eastern Massachusetts, 2001–03
U.S. Environmental Protection Agency, 2003a, EPA, DEP to focus on Mystic River Cleanup: U.S. Environmental Protection Agency, Boston, MA, 14 p., accessed on March 17, 2004, at http://www.epa.gov/NE/pr/1998/113098.html
U.S. Environmental Protection Agency, 2003b, Waste site cleanup and reuse in New England, accessed on September 12, 2005, at http://yosemite.epa.gov/r1/npl_pad.nsf/0/7692eb076450cc585256da900065d4be?opendocument#toc
U.S. Geological Survey, 2003, Arsenic in New England—Geology, geochemistry, database and statistics, accessed on February 2, 2004, at http://minerals.usgs.gov/east/ environment/indexAsNEng.htm#overview
U.S. Geological Survey, 2004, The National geochemical survey—Database and documentation: U.S. Geological Survey Open-File Report 2004-1001, accessed on February 2, 2004, at http://tin.er.usgs.gov/geochem
U.S. Geological Survey, 2005, Glossary, in Welcome to the USGS research site for sfports, accessed October 4, 2005, at http://sfports.wr.usgs.gov/SFPORTS/glossary.html
Van Metre, P., Mahler, B.J., and Furlong, E.T., 2000, Urban sprawl leaves its PAH signature: Environmental Science and Technology, v. 34, no.19, p. 4064–4070.
Weiskel, P.K., Barlow, L.K., and Smieszek, T.W., 2005, Water resources and the urban environment, lower Charles River watershed, Massachusetts, 1630–2005: U.S. Geological Survey Circular 1280, 46 p.
Wernstedt, K., and Probst, K.N., 1997, Land use and rem-edy selection—Experience from the field—the Industri-Plex Site, Resources for the future, Washington, D.C., 49 p., accessed on July 21, 2004, at http://www.rff.org/Documents/RFF-DP-97-27.pdf.
Zarriello, P.J., Breault, R.F., and Weiskel, P.K., 2003, Potential effects of structural controls and street sweeping on storm-water loads to the lower Charles River, Massachusetts: U.S. Geological Survey Water-Resources Investigations Report 02-4220, 48 p.

Figures �–1�

32 Sediment Quality of Lakes, Rivers, and Estuaries in the Mystic River Basin, Eastern Massachusetts, 2001–03
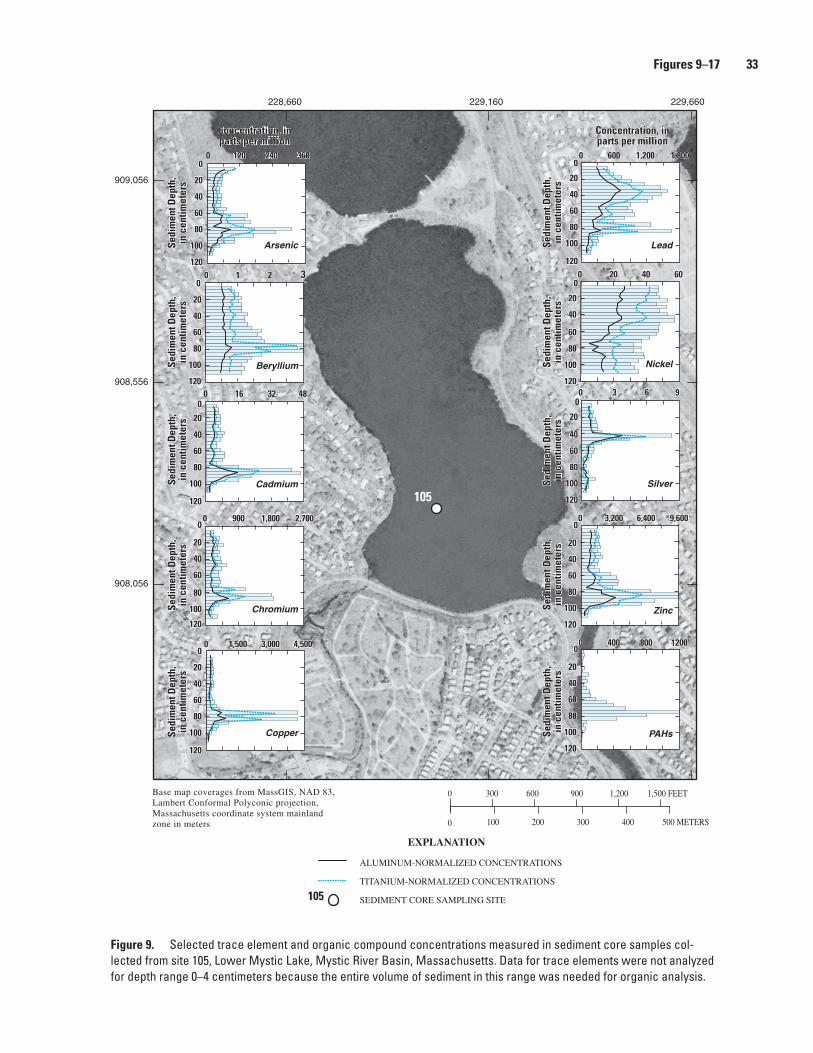
Figure �. Selected trace element and organic compound concentrations measured in sediment core samples col-lected from site 105, Lower Mystic Lake, Mystic River Basin, Massachusetts. Data for trace elements were not analyzed for depth range 0–4 centimeters because the entire volume of sediment in this range was needed for organic analysis.
Figures �–1� 33
0
20
40
60
80
100
120
0 120 240 360
0
20
40
60
80
100
120
0 1 2 3
0
20
40
60
80
100
120
0 16 32 48
0
20
40
60
80
100
120
0 900 1,800 2,700
0
20
40
60
80
100
120
0 1,500 3,000 4,500
0
20
40
60
80
100
120
0 600 1,200 1,800
0
20
40
60
80
100
120
0 20 40 60
0
20
40
60
80
100
120
0 3,200 6,400 9,600
0
20
40
60
80
100
120
0 3 6 9
0
20
40
60
80
100
120
0 400 800 1200
Arsenic
Beryllium
Cadmium
Chromium
Copper
Lead
Nickel
Silver
Zinc
PAHs
Concentration, inparts per million
Concentration, inparts per million
Sedi
men
tDep
th,
ince
ntim
eter
sSe
dim
entD
epth
,in
cent
imet
ers
Sedi
men
tDep
th,
ince
ntim
eter
sSe
dim
entD
epth
,in
cent
imet
ers
Sedi
men
tDep
th,
ince
ntim
eter
s
Sedi
men
tDep
th,
ince
ntim
eter
sSe
dim
entD
epth
,in
cent
imet
ers
Sedi
men
tDep
th,
ince
ntim
eter
sSe
dim
entD
epth
,in
cent
imet
ers
Sedi
men
tDep
th,
ince
ntim
eter
s
228,660 229,160 229,660
908,056
908,556
909,056
0 100 200 300 400 500 METERS
0 300 600 900 1,200 1,500 FEETBase map coverages from MassGIS, NAD 83,Lambert Conformal Polyconic projection,Massachusetts coordinate system mainlandzone in meters
105
EXPLANATION
ALUMINUM-NORMALIZED CONCENTRATIONS
TITANIUM-NORMALIZED CONCENTRATIONS
SEDIMENT CORE SAMPLING SITE
105
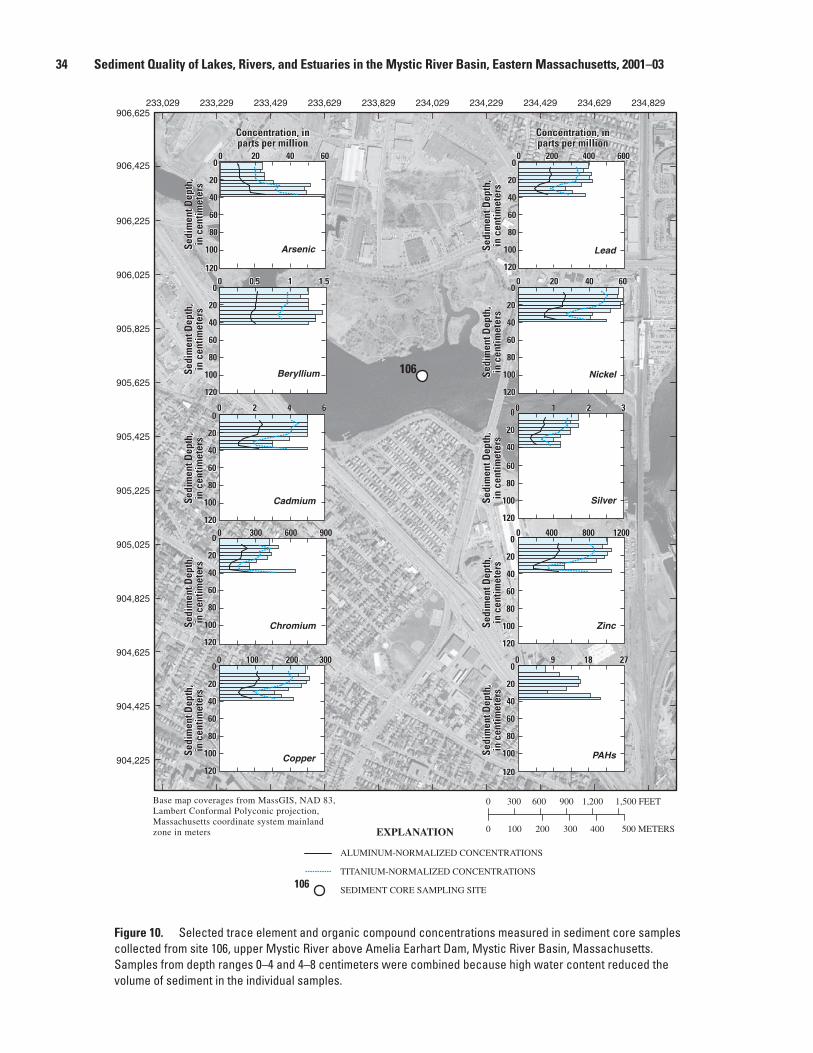
3� Sediment Quality of Lakes, Rivers, and Estuaries in the Mystic River Basin, Eastern Massachusetts, 2001–03
Figure 10. Selected trace element and organic compound concentrations measured in sediment core samples collected from site 106, upper Mystic River above Amelia Earhart Dam, Mystic River Basin, Massachusetts. Samples from depth ranges 0–4 and 4–8 centimeters were combined because high water content reduced the volume of sediment in the individual samples.
233,029 233,229 233,429 233,629 233,829 234,029 234,229 234,429 234,629 234,829
904,225
904,425
904,625
904,825
905,025
905,225
905,425
905,625
905,825
906,025
906,225
906,425
906,625
Base map coverages from MassGIS, NAD 83,Lambert Conformal Polyconic projection,Massachusetts coordinate system mainlandzone in meters
0
0 100 200 300 400 500 METERS
300 600 900 1,200 1,500 FEET
EXPLANATION
ALUMINUM-NORMALIZED CONCENTRATIONS
TITANIUM-NORMALIZED CONCENTRATIONS
SEDIMENT CORE SAMPLING SITE106
Arsenic
Beryllium
Cadmium
Chromium
Copper
Lead
Nickel
Silver
Zinc
PAHs
Concentration, inparts per million
Concentration, inparts per million
Sedi
men
tDep
th,
ince
ntim
eter
sSe
dim
entD
epth
,in
cent
imet
ers
Sedi
men
tDep
th,
ince
ntim
eter
sSe
dim
entD
epth
,in
cent
imet
ers
Sedi
men
tDep
th,
ince
ntim
eter
s
Sedi
men
tDep
th,
ince
ntim
eter
sSe
dim
entD
epth
,in
cent
imet
ers
Sedi
men
tDep
th,
ince
ntim
eter
sSe
dim
entD
epth
,in
cent
imet
ers
Sedi
men
tDep
th,
ince
ntim
eter
s
106
0
20
40
60
80
100
120
20
40
60
80
100
120
20
40
60
80
100
120
20
40
60
80
100
120
20
40
60
80
100
120
20 40 60 0 200 400 600
100
120
100
120
100
120
100
120
100
120
0
0
0
0 20 40 60
0 1 2 3
0
0
0 400 800 1200
0 9 18 27
20
40
60
80
0
20
40
60
80
0
20
40
60
80
0
20
40
60
80
0
20
40
60
80
0
0 0.5 1 1.5
0 2 4 6
0 300 600 900
0 100 200 300
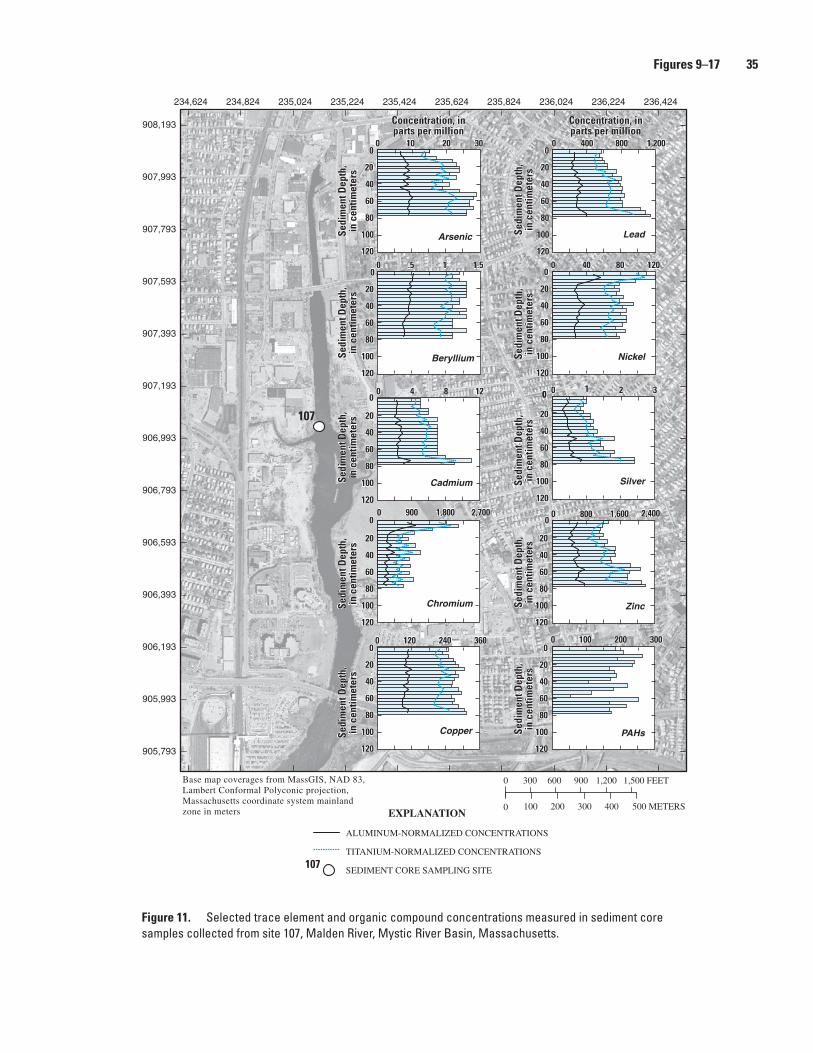
Figure 11. Selected trace element and organic compound concentrations measured in sediment core samples collected from site 107, Malden River, Mystic River Basin, Massachusetts.
Figures �–1� 3�
Base map coverages from MassGIS, NAD 83,Lambert Conformal Polyconic projection,Massachusetts coordinate system mainlandzone in meters
234,624 234,824 235,024 235,224 235,424 235,624 235,824 236,024 236,224 236,424
905,793
905,993
906,193
906,393
906,593
906,793
906,993
907,193
907,393
907,593
907,793
907,993
908,193
0 100 200 300 400 500 METERS
0 300 600 900 1,200 1,500 FEET
107
107
Sedi
men
tDep
th,
ince
ntim
eter
s
120
100
80
60
40
20
0
EXPLANATION
ALUMINUM-NORMALIZED CONCENTRATIONS
TITANIUM-NORMALIZED CONCENTRATIONS
SEDIMENT CORE SAMPLING SITE
Arsenic
Beryllium
Cadmium
Chromium
Copper
Lead
Nickel
Silver
Zinc
PAHs
Sedi
men
tDep
th,
ince
ntim
eter
sSe
dim
entD
epth
,in
cent
imet
ers
Sedi
men
tDep
th,
ince
ntim
eter
sSe
dim
entD
epth
,in
cent
imet
ers
Sedi
men
tDep
th,
ince
ntim
eter
s
Sedi
men
tDep
th,
ince
ntim
eter
sSe
dim
entD
epth
,in
cent
imet
ers
Sedi
men
tDep
th,
ince
ntim
eter
sSe
dim
entD
epth
,in
cent
imet
ers
Concentration, inparts per million
Concentration, inparts per million
0
20
40
60
80
100
120
0
20
40
60
80
100
120
0
20
40
60
80
100
120
0
20
40
60
80
100
120
20
40
60
80
100
120
0
20
40
60
80
100
120
0
20
40
60
80
100
120
0
0
20
40
60
80
100
120
00
20
40
60
80
100
120
0 10 20 30
0 .5 1 1.5
0 4 8 12
0 120 240 360
0 400 800 1,200
0 40 80 120
0 1 2 3
0 900 1,800 2,700
0 100 200 300
0 800 1,600 2,400
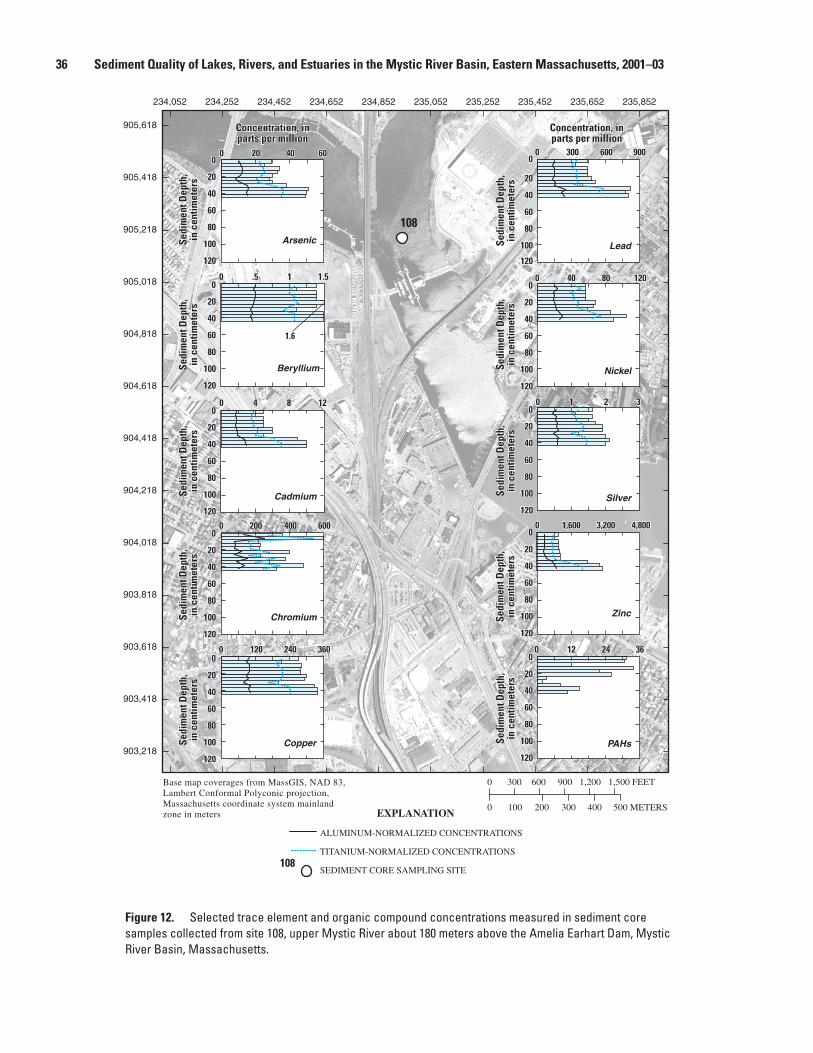
3� Sediment Quality of Lakes, Rivers, and Estuaries in the Mystic River Basin, Eastern Massachusetts, 2001–03
Figure 12. Selected trace element and organic compound concentrations measured in sediment core samples collected from site 108, upper Mystic River about 180 meters above the Amelia Earhart Dam, Mystic River Basin, Massachusetts.
108
234,052 234,252 234,452 234,652 234,852 235,052 235,252 235,452 235,652 235,852
903,218
903,418
903,618
903,818
904,018
904,218
904,418
904,618
904,818
905,018
905,218
905,418
905,618
Base map coverages from MassGIS, NAD 83,Lambert Conformal Polyconic projection,Massachusetts coordinate system mainlandzone in meters
0
0 100 200 300 400 500 METERS
300 600 900 1,200 1,500 FEET
Arsenic
Beryllium
Cadmium
Chromium
Copper
Lead
Nickel
Silver
Zinc
PAHs
Concentration, inparts per million
Concentration, inparts per million
Sedi
men
tDep
th,
ince
ntim
eter
sSe
dim
entD
epth
,in
cent
imet
ers
Sedi
men
tDep
th,
ince
ntim
eter
sSe
dim
entD
epth
,in
cent
imet
ers
Sedi
men
tDep
th,
ince
ntim
eter
s
Sedi
men
tDep
th,
ince
ntim
eter
sSe
dim
entD
epth
,in
cent
imet
ers
Sedi
men
tDep
th,
ince
ntim
eter
sSe
dim
entD
epth
,in
cent
imet
ers
Sedi
men
tDep
th,
ince
ntim
eter
s20
40
60
80
100
120
00 120 240 360
0
20
40
60
80
100
120
0
20
40
60
80
100
120
0
20
40
60
80
100
120
0
20
40
60
80
100
120
0
20
40
60
80
100
120
0
20
40
60
80
100
120
0
20
40
60
80
100
120
0
20
40
60
80
100
120
0
20
40
60
80
100
120
0 20 40 60
0 .5 1 1.5
0 4 8 12
0 200 400 600
0 300 600 900
0 40 80 120
0 1 2 3
0 1,600 3,200 4,800
0 12 24 36
1.6
EXPLANATION
ALUMINUM-NORMALIZED CONCENTRATIONS
TITANIUM-NORMALIZED CONCENTRATIONS
SEDIMENT CORE SAMPLING SITE108
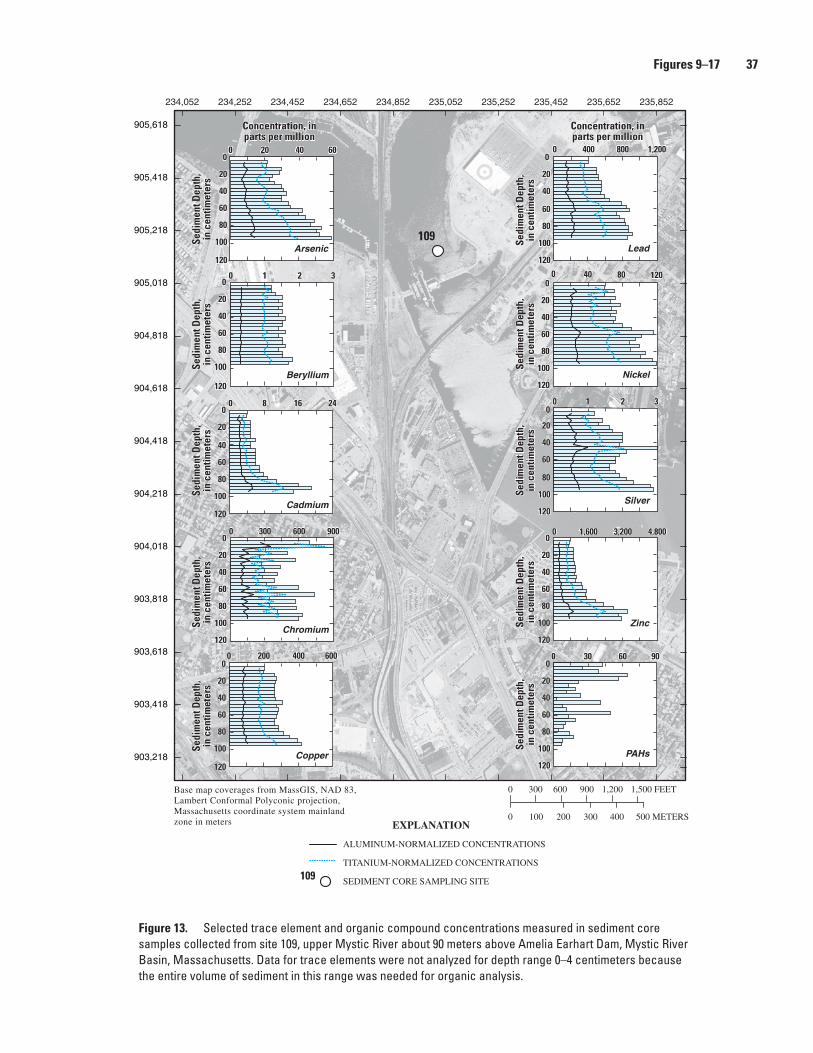
Figure 13. Selected trace element and organic compound concentrations measured in sediment core samples collected from site 109, upper Mystic River about 90 meters above Amelia Earhart Dam, Mystic River Basin, Massachusetts. Data for trace elements were not analyzed for depth range 0–4 centimeters because the entire volume of sediment in this range was needed for organic analysis.
Figures �–1� 3�
234,052 234,252 234,452 234,652 234,852 235,052 235,252 235,452 235,652 235,852
903,218
903,418
903,618
903,818
904,018
904,218
904,418
904,618
904,818
905,018
905,218
905,418
905,618
Base map coverages from MassGIS, NAD 83,Lambert Conformal Polyconic projection,Massachusetts coordinate system mainlandzone in meters
0
0 100 200 300 400 500 METERS
300 600 900 1,200 1,500 FEET
0
20
40
60
80
100
120
0
20
40
60
80
100
120
0
20
40
60
80
100
120
0
20
40
60
80
100
120
0
20
40
60
80
100
120
0
20
40
60
80
100
120
0
20
40
60
80
100
120
0
20
40
60
80
100
120
0
20
40
60
80
100
120
0
20
40
60
80
100
120
0 20 40 60
0 1 2 3
0 8 16 24
0 300 600 900
0 400 800 1,200
0 40 80 120
0 1 2 3
0 1,600 3,200 4,800
0 200 400 600 0 30 60 90
Arsenic
Beryllium
Cadmium
Chromium
Copper
Lead
Nickel
Silver
Zinc
PAHs
Concentration, inparts per million
Concentration, inparts per million
Sedi
men
tDep
th,
ince
ntim
eter
sSe
dim
entD
epth
,in
cent
imet
ers
Sedi
men
tDep
th,
ince
ntim
eter
sSe
dim
entD
epth
,in
cent
imet
ers
Sedi
men
tDep
th,
ince
ntim
eter
s
Sedi
men
tDep
th,
ince
ntim
eter
sSe
dim
entD
epth
,in
cent
imet
ers
Sedi
men
tDep
th,
ince
ntim
eter
sSe
dim
entD
epth
,in
cent
imet
ers
Sedi
men
tDep
th,
ince
ntim
eter
s
109
EXPLANATION
ALUMINUM-NORMALIZED CONCENTRATIONS
TITANIUM-NORMALIZED CONCENTRATIONS
SEDIMENT CORE SAMPLING SITE
109
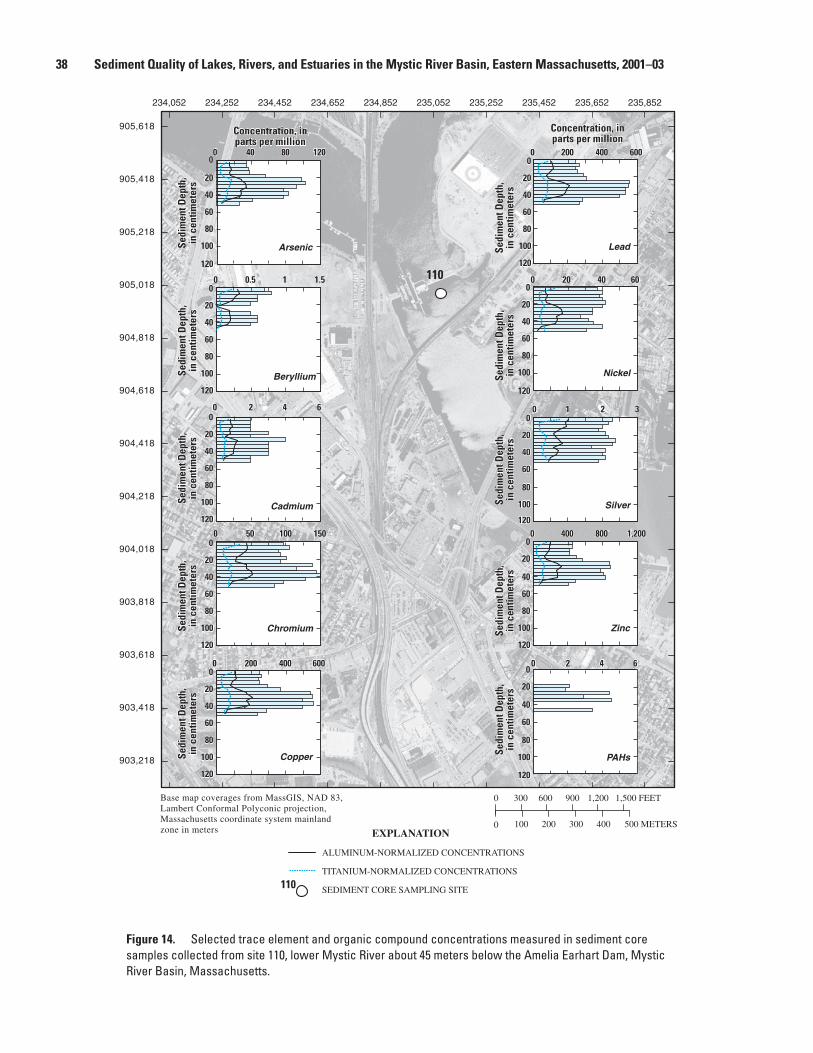
3� Sediment Quality of Lakes, Rivers, and Estuaries in the Mystic River Basin, Eastern Massachusetts, 2001–03
Figure 1�. Selected trace element and organic compound concentrations measured in sediment core samples collected from site 110, lower Mystic River about 45 meters below the Amelia Earhart Dam, Mystic River Basin, Massachusetts.
0
20
40
60
80
100
120
0
20
40
60
80
100
120
0
20
40
60
80
100
120
0
20
40
60
80
100
120
0
20
40
60
80
100
120
0
20
40
60
80
100
120
0
20
40
60
80
100
120
0
20
40
60
80
100
120
0
20
40
60
80
100
120
0
20
40
60
80
100
120
0 40 80 120
0 0.5 1 1.5
0 2 4 6
0 200 400 600
0 200 400 600
0 20 40 60
0 1 2 3
0 400 800 1,2000 50 100 150
0 2 4 6
234,052 234,252 234,452 234,652 234,852 235,052 235,252 235,452 235,652 235,852
903,218
903,418
903,618
903,818
904,018
904,218
904,418
904,618
904,818
905,018
905,218
905,418
905,618
0 100 200 300 400 500 METERS
0 300 600 900 1,200 1,500 FEETBase map coverages from MassGIS, NAD 83,Lambert Conformal Polyconic projection,Massachusetts coordinate system mainlandzone in meters
110
Arsenic
Beryllium
Cadmium
Chromium
Copper
Lead
Nickel
Silver
Zinc
PAHs
Sedi
men
tDep
th,
ince
ntim
eter
sSe
dim
entD
epth
,in
cent
imet
ers
Sedi
men
tDep
th,
ince
ntim
eter
sSe
dim
entD
epth
,in
cent
imet
ers
Sedi
men
tDep
th,
ince
ntim
eter
s
Sedi
men
tDep
th,
ince
ntim
eter
sSe
dim
entD
epth
,in
cent
imet
ers
Sedi
men
tDep
th,
ince
ntim
eter
sSe
dim
entD
epth
,in
cent
imet
ers
Sedi
men
tDep
th,
ince
ntim
eter
s
Concentration, inparts per million
Concentration, inparts per million
ALUMINUM-NORMALIZED CONCENTRATIONS
TITANIUM-NORMALIZED CONCENTRATIONS
SEDIMENT CORE SAMPLING SITE110
EXPLANATION
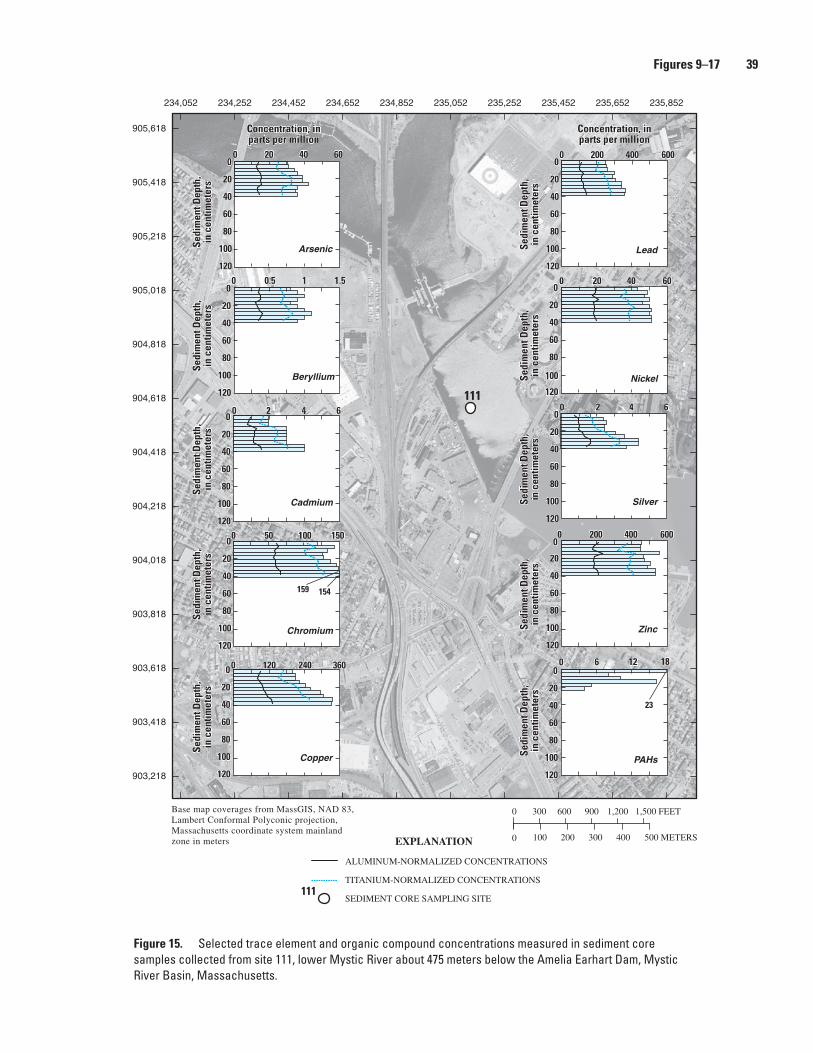
Figure 1�. Selected trace element and organic compound concentrations measured in sediment core samples collected from site 111, lower Mystic River about 475 meters below the Amelia Earhart Dam, Mystic River Basin, Massachusetts.
Figures �–1� 3�
Base map coverages from MassGIS, NAD 83,Lambert Conformal Polyconic projection,Massachusetts coordinate system mainlandzone in meters 0 100 200 300 400 500 METERS
0 300 600 900 1,200 1,500 FEET
234,052 234,252 234,452 234,652 234,852 235,052 235,252 235,452 235,652 235,852
903,218
903,418
903,618
903,818
904,018
904,218
904,418
904,618
904,818
905,018
905,218
905,418
905,618
ALUMINUM-NORMALIZED CONCENTRATIONS
TITANIUM-NORMALIZED CONCENTRATIONS
SEDIMENT CORE SAMPLING SITE
Arsenic
Beryllium
Cadmium
Chromium
Copper
Lead
Nickel
Silver
Zinc
PAHs
Concentration, inparts per million
Concentration, inparts per million
Sedi
men
tDep
th,
ince
ntim
eter
sSe
dim
entD
epth
,in
cent
imet
ers
Sedi
men
tDep
th,
ince
ntim
eter
sSe
dim
entD
epth
,in
cent
imet
ers
Sedi
men
tDep
th,
ince
ntim
eter
s
Sedi
men
tDep
th,
ince
ntim
eter
sSe
dim
entD
epth
,in
cent
imet
ers
Sedi
men
tDep
th,
ince
ntim
eter
sSe
dim
entD
epth
,in
cent
imet
ers
Sedi
men
tDep
th,
ince
ntim
eter
s
0
20
40
60
80
100
120
0
20
40
60
80
100
120
0
20
40
60
80
100
120
0
20
40
60
80
100
120
0
20
40
60
80
100
120
0
20
40
60
80
100
120
0
20
40
60
80
100
120
0
20
40
60
80
100
120
0
20
40
60
80
100
120
0
20
40
60
80
100
120
0 20 40 60
0 0.5 1 1.5
0 2 4 6
0 50 100 150
0 200 400 600
0 20 40 60
0 2 4 6
0 200 400 600
0 120 240 360 0 6 12 18
154159
23
111
EXPLANATION
111
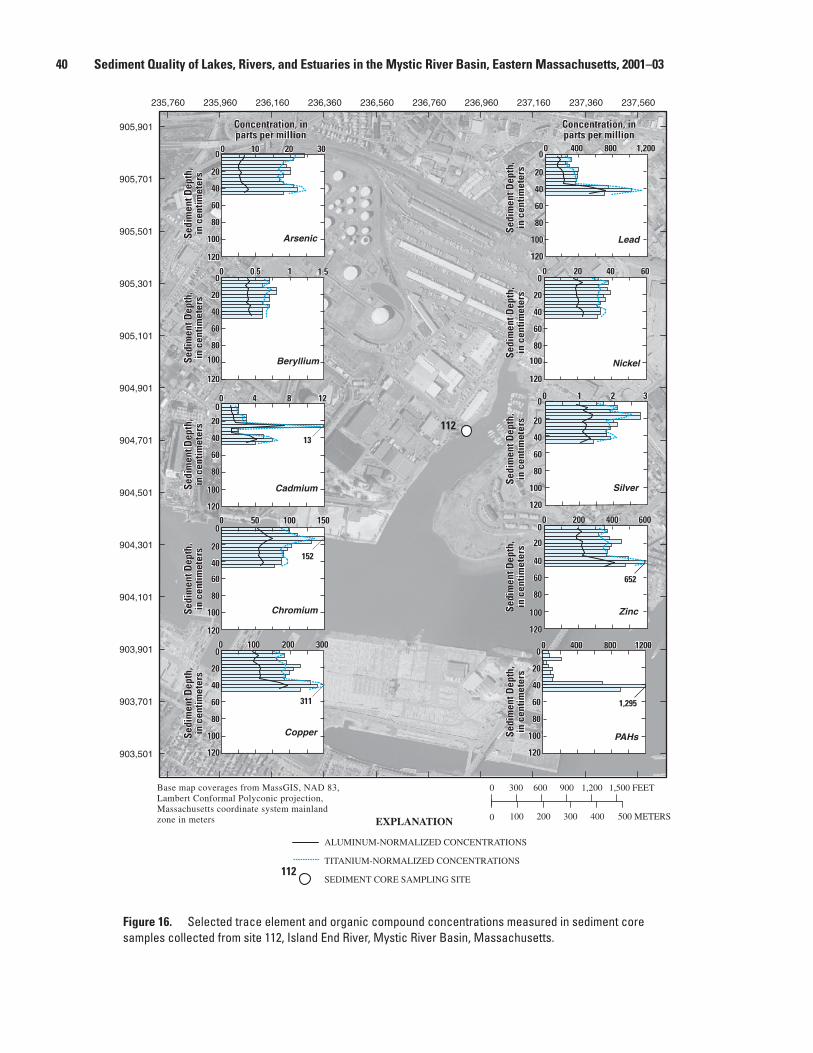
�0 Sediment Quality of Lakes, Rivers, and Estuaries in the Mystic River Basin, Eastern Massachusetts, 2001–03
Figure 1�. Selected trace element and organic compound concentrations measured in sediment core samples collected from site 112, Island End River, Mystic River Basin, Massachusetts.
Arsenic
Beryllium
Cadmium
Chromium
Copper
Lead
Nickel
Silver
Zinc
PAHs
Concentration, inparts per million
Concentration, inparts per million
Sedi
men
tDep
th,
ince
ntim
eter
sSe
dim
entD
epth
,in
cent
imet
ers
Sedi
men
tDep
th,
ince
ntim
eter
sSe
dim
entD
epth
,in
cent
imet
ers
Sedi
men
tDep
th,
ince
ntim
eter
s
Sedi
men
tDep
th,
ince
ntim
eter
sSe
dim
entD
epth
,in
cent
imet
ers
Sedi
men
tDep
th,
ince
ntim
eter
sSe
dim
entD
epth
,in
cent
imet
ers
Sedi
men
tDep
th,
ince
ntim
eter
s
235,760 235,960 236,160 236,360 236,560 236,760 236,960 237,160 237,360 237,560
903,501
903,701
903,901
904,101
904,301
904,501
904,701
904,901
905,101
905,301
905,501
905,701
905,901
Base map coverages from MassGIS, NAD 83,Lambert Conformal Polyconic projection,Massachusetts coordinate system mainlandzone in meters 0 100 200 300 400 500 METERS
0 300 600 900 1,200 1,500 FEET
00
20
40
60
80
100
120
0
20
40
60
80
100
120
20
40
60
80
100
120
0
20
40
60
80
100
120
0
20
40
60
80
100
120
0
20
40
60
80
100
120
0
20
40
60
80
100
120
0 10 20 30
0 0.5 1 1.5
0 4 8 12
0 50 100 150
0 100 200 300
0
20
40
60
80
100
120
0 1 2 3
0
20
40
60
80
100
120
0 200 400 600
0
20
40
60
80
100
120
0 400 800 1200
400 800 1,200
0 20 40 60
0
13
152
311
652
1,295
112
EXPLANATION
ALUMINUM-NORMALIZED CONCENTRATIONS
TITANIUM-NORMALIZED CONCENTRATIONS
SEDIMENT CORE SAMPLING SITE
112
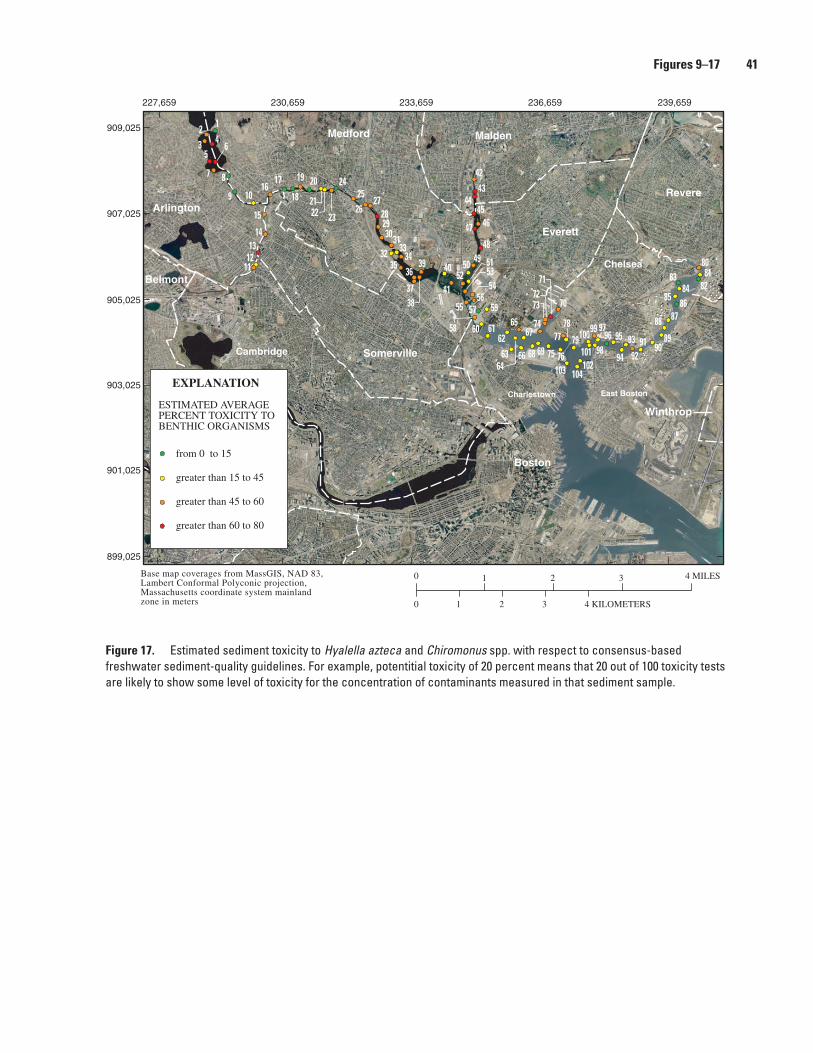
Figure 1�. Estimated sediment toxicity to Hyalella azteca and Chiromonus spp. with respect to consensus-based freshwater sediment-quality guidelines. For example, potentitial toxicity of 20 percent means that 20 out of 100 toxicity tests are likely to show some level of toxicity for the concentration of contaminants measured in that sediment sample.
Figures �–1� �1
Arlington
Belmont
Medford Malden
Revere
Everett
Chelsea
SomervilleCambridge
Charlestown
Boston
Winthrop
East Boston
52
76
123 4
5
7 8
9 10
111213
14
15
1617
18
19 20
2122 23
2425
2627
282930 31
32 3334
3536
38
39 40
37 41
4243
4445
4647
484950 51
5354
5556
57
58
59
60 616263
64
65
66
67
68 69
70
717273
74
75
7778
79
8081
8283
8485
868788
899091
92
93
94
959699 97
98100
101102
104103
6
ESTIMATED AVERAGEPERCENT TOXICITY TOBENTHIC ORGANISMS
EXPLANATION
from 0 to 15
greater than 15 to 45
greater than 45 to 60
greater than 60 to 80
Base map coverages from MassGIS, NAD 83,Lambert Conformal Polyconic projection,Massachusetts coordinate system mainlandzone in meters
909,025
907,025
905,025
903,025
901,025
899,025
227,659 230,659 233,659 236,659 239,659
0
0
1
1 2 3 4 MILES
2 3 4 KILOMETERS

�2 Sediment Quality of Lakes, Rivers, and Estuaries in the Mystic River Basin, Eastern Massachusetts, 2001–03

Tables 3–�

�� Sediment Quality of Lakes, Rivers, and Estuaries in the Mystic River Basin, Eastern Massachusetts, 2001–03

Table 3. Distribution of element and organic compound concentrations measured in sediment grab samples, Mystic River Basin, Massachusetts.—Continued
[Station number: USGS sample identifiers and geographical coordinates are given in table 1; sampling locations shown on figure 3. BHC, 1,2,3,4,5,6-hexa-chlorocyclohexane; D, duplicate; DDD, dichlorodiphenyldichloroethane; DDE, dichlorodiphenyldichloroethylene; DDT, dichlorodiphenyltrichloroethane; do., ditto; LD, lab duplicate; No., number; PES, Performance Evaluation Standard; RPD, relative percent difference; USGS, U.S. Geological Survey; ppm, parts per million; %, percent; <, actual value shown is less than the minimum reporting limit; *, PES reported value was less than detection; --, not analyzed]
Station No.
Town Water bodyCalcium
(%)
Magne- sium (%)
Sodium (%)
Potas- sium (%)
Phos- phorus
(%)
Alum- inum (%)
Antimony (ppm)
Arsenic (ppm)
Barium (ppm)
1 Medford Lower Mystic Lake 0.30 0.48 0.04 0.15 0.05 0.8 <5 <3 382 Arlington .....do. .56 .60 .20 .22 .27 1.6 <5 92 2203 .....do. .....do. .45 .57 .21 .20 .31 1.5 <5 85 2304 Medford .....do. .50 .56 .20 .20 .25 1.6 <5 87 2005 Arlington .....do. .58 .61 .07 .23 .16 1.5 <5 20 140
6 .....do. .....do. .58 1.0 2.0 .34 .24 1.5 <5 38 1707 .....do. .....do. 1.2 1.1 .16 .38 .26 2.6 <5 70 2508 Medford Upper Mystic River .46 .52 .05 .19 .09 1.0 <5 <3 469 .....do. .....do. .30 .34 .03 .14 .05 .65 <5 7 4510 .....do. .....do. .42 .45 .04 .18 .08 1.0 <5 12 82
11 Cambridge Alewife Brook .41 .37 .04 .16 .11 .88 <5 8 12012 .....do. .....do. .30 .26 .03 .11 .07 .60 <5 4 12013 Somerville .....do. .31 .28 .04 .12 .07 .63 <5 6 7214 .....do. .....do. .37 .38 .04 .15 .10 .89 <5 9 11015 .....do. .....do. .34 .34 .04 .16 .10 .89 <5 9 130
16 .....do. Mystic River .59 .50 .06 .24 .14 1.3 <5 17 15017 Medford .....do. .33 .35 .04 .14 .06 .74 <5 3 4218 .....do. .....do. .23 .23 .03 .11 .05 .57 <5 4 4319 .....do. .....do. .28 .37 .03 .16 .07 .90 <5 7 5720 .....do. .....do. .27 .34 .03 .16 .06 .82 <5 4 65
21 .....do. .....do. .22 .26 .03 .11 .05 .62 <5 3 4422 .....do. .....do. .37 .51 .04 .22 .08 1.1 <5 12 6223 .....do. .....do. .52 .55 .05 .26 .14 1.5 <5 14 14024 .....do. .....do. .39 .77 .05 .49 .06 1.8 <5 <3 6425 .....do. .....do. .38 .45 .07 .19 .08 1.0 <5 10 72
26 .....do. .....do. .46 .59 .12 .28 .16 1.5 <5 19 14027 .....do. .....do. .23 .21 .03 .09 .05 .44 <5 4 5828 .....do. .....do. .24 .31 .06 .18 .07 .75 <5 7 7429 .....do. .....do. .46 .51 .10 .24 .14 1.3 <5 13 14030 .....do. .....do. .48 .59 .14 .28 .16 1.5 <5 16 160
31 .....do. .....do. .53 .72 .14 .36 .18 1.8 <5 22 18032 .....do. .....do. .18 .19 .03 .09 .05 .46 <5 5 5633 .....do. .....do. .35 .52 .08 .27 .11 1.3 <5 7 10034 .....do. .....do. .46 .68 .13 .35 .17 1.7 <5 19 17035 .....do. .....do. .49 .70 .13 .34 .18 1.7 <5 17 170
Tables 3–� ��
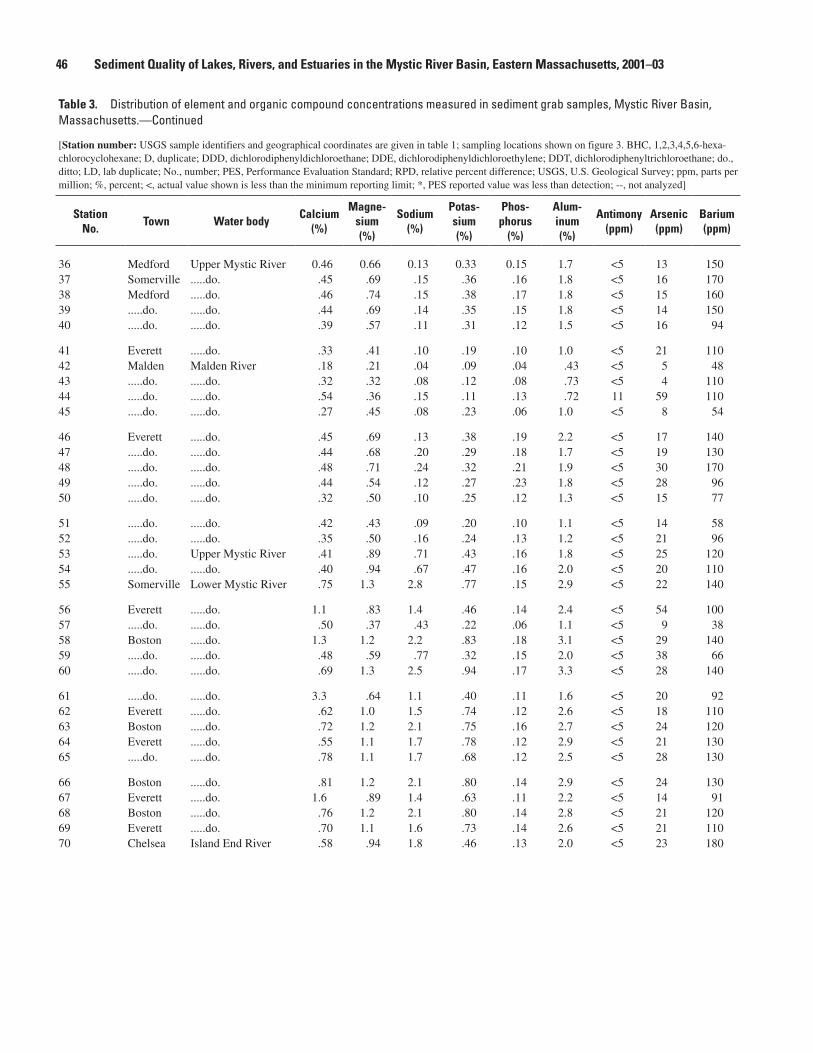
�� Sediment Quality of Lakes, Rivers, and Estuaries in the Mystic River Basin, Eastern Massachusetts, 2001–03
Table 3. Distribution of element and organic compound concentrations measured in sediment grab samples, Mystic River Basin, Massachusetts.—Continued
[Station number: USGS sample identifiers and geographical coordinates are given in table 1; sampling locations shown on figure 3. BHC, 1,2,3,4,5,6-hexa-chlorocyclohexane; D, duplicate; DDD, dichlorodiphenyldichloroethane; DDE, dichlorodiphenyldichloroethylene; DDT, dichlorodiphenyltrichloroethane; do., ditto; LD, lab duplicate; No., number; PES, Performance Evaluation Standard; RPD, relative percent difference; USGS, U.S. Geological Survey; ppm, parts per million; %, percent; <, actual value shown is less than the minimum reporting limit; *, PES reported value was less than detection; --, not analyzed]
Station No.
Town Water bodyCalcium
(%)
Magne- sium (%)
Sodium (%)
Potas- sium (%)
Phos- phorus
(%)
Alum- inum (%)
Antimony (ppm)
Arsenic (ppm)
Barium (ppm)
36 Medford Upper Mystic River 0.46 0.66 0.13 0.33 0.15 1.7 <5 13 15037 Somerville .....do. .45 .69 .15 .36 .16 1.8 <5 16 17038 Medford .....do. .46 .74 .15 .38 .17 1.8 <5 15 16039 .....do. .....do. .44 .69 .14 .35 .15 1.8 <5 14 15040 .....do. .....do. .39 .57 .11 .31 .12 1.5 <5 16 94
41 Everett .....do. .33 .41 .10 .19 .10 1.0 <5 21 11042 Malden Malden River .18 .21 .04 .09 .04 .43 <5 5 4843 .....do. .....do. .32 .32 .08 .12 .08 .73 <5 4 11044 .....do. .....do. .54 .36 .15 .11 .13 .72 11 59 11045 .....do. .....do. .27 .45 .08 .23 .06 1.0 <5 8 54
46 Everett .....do. .45 .69 .13 .38 .19 2.2 <5 17 14047 .....do. .....do. .44 .68 .20 .29 .18 1.7 <5 19 13048 .....do. .....do. .48 .71 .24 .32 .21 1.9 <5 30 17049 .....do. .....do. .44 .54 .12 .27 .23 1.8 <5 28 9650 .....do. .....do. .32 .50 .10 .25 .12 1.3 <5 15 77
51 .....do. .....do. .42 .43 .09 .20 .10 1.1 <5 14 5852 .....do. .....do. .35 .50 .16 .24 .13 1.2 <5 21 9653 .....do. Upper Mystic River .41 .89 .71 .43 .16 1.8 <5 25 12054 .....do. .....do. .40 .94 .67 .47 .16 2.0 <5 20 11055 Somerville Lower Mystic River .75 1.3 2.8 .77 .15 2.9 <5 22 140
56 Everett .....do. 1.1 .83 1.4 .46 .14 2.4 <5 54 10057 .....do. .....do. .50 .37 .43 .22 .06 1.1 <5 9 3858 Boston .....do. 1.3 1.2 2.2 .83 .18 3.1 <5 29 14059 .....do. .....do. .48 .59 .77 .32 .15 2.0 <5 38 6660 .....do. .....do. .69 1.3 2.5 .94 .17 3.3 <5 28 140
61 .....do. .....do. 3.3 .64 1.1 .40 .11 1.6 <5 20 9262 Everett .....do. .62 1.0 1.5 .74 .12 2.6 <5 18 11063 Boston .....do. .72 1.2 2.1 .75 .16 2.7 <5 24 12064 Everett .....do. .55 1.1 1.7 .78 .12 2.9 <5 21 13065 .....do. .....do. .78 1.1 1.7 .68 .12 2.5 <5 28 130
66 Boston .....do. .81 1.2 2.1 .80 .14 2.9 <5 24 13067 Everett .....do. 1.6 .89 1.4 .63 .11 2.2 <5 14 9168 Boston .....do. .76 1.2 2.1 .80 .14 2.8 <5 21 12069 Everett .....do. .70 1.1 1.6 .73 .14 2.6 <5 21 11070 Chelsea Island End River .58 .94 1.8 .46 .13 2.0 <5 23 180
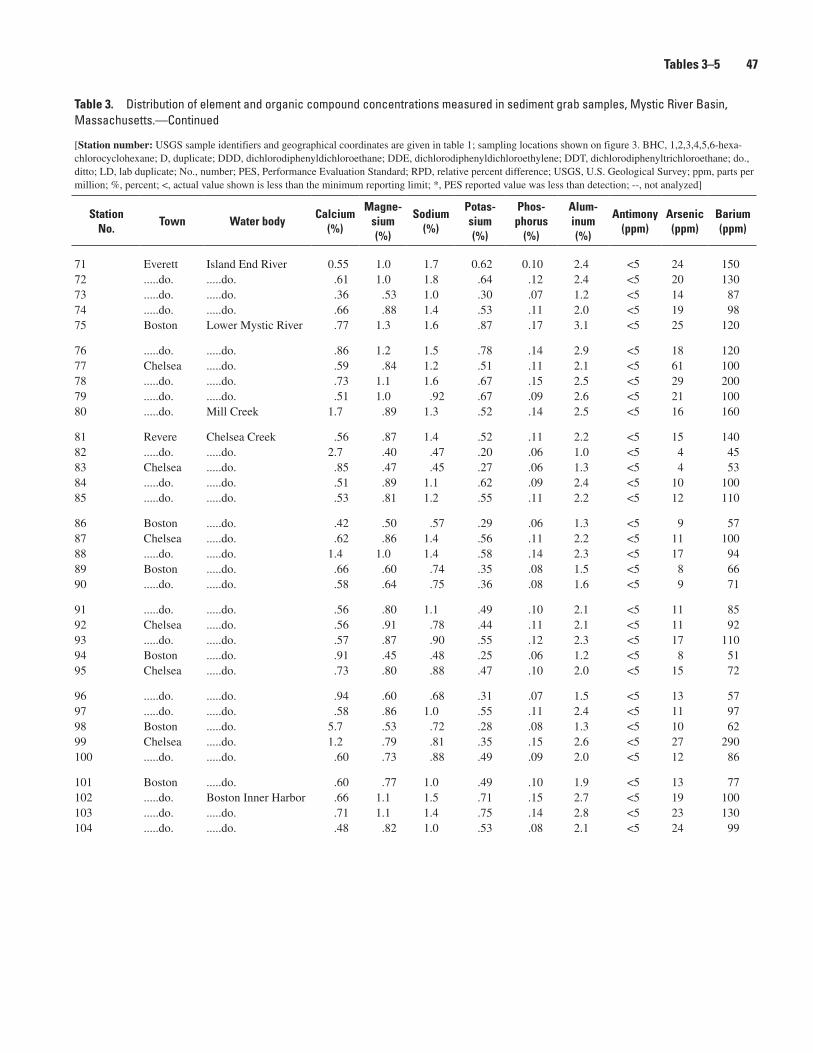
Table 3. Distribution of element and organic compound concentrations measured in sediment grab samples, Mystic River Basin, Massachusetts.—Continued
[Station number: USGS sample identifiers and geographical coordinates are given in table 1; sampling locations shown on figure 3. BHC, 1,2,3,4,5,6-hexa-chlorocyclohexane; D, duplicate; DDD, dichlorodiphenyldichloroethane; DDE, dichlorodiphenyldichloroethylene; DDT, dichlorodiphenyltrichloroethane; do., ditto; LD, lab duplicate; No., number; PES, Performance Evaluation Standard; RPD, relative percent difference; USGS, U.S. Geological Survey; ppm, parts per million; %, percent; <, actual value shown is less than the minimum reporting limit; *, PES reported value was less than detection; --, not analyzed]
Station No.
Town Water bodyCalcium
(%)
Magne- sium (%)
Sodium (%)
Potas- sium (%)
Phos- phorus
(%)
Alum- inum (%)
Antimony (ppm)
Arsenic (ppm)
Barium (ppm)
71 Everett Island End River 0.55 1.0 1.7 0.62 0.10 2.4 <5 24 15072 .....do. .....do. .61 1.0 1.8 .64 .12 2.4 <5 20 13073 .....do. .....do. .36 .53 1.0 .30 .07 1.2 <5 14 8774 .....do. .....do. .66 .88 1.4 .53 .11 2.0 <5 19 9875 Boston Lower Mystic River .77 1.3 1.6 .87 .17 3.1 <5 25 120
76 .....do. .....do. .86 1.2 1.5 .78 .14 2.9 <5 18 12077 Chelsea .....do. .59 .84 1.2 .51 .11 2.1 <5 61 10078 .....do. .....do. .73 1.1 1.6 .67 .15 2.5 <5 29 20079 .....do. .....do. .51 1.0 .92 .67 .09 2.6 <5 21 10080 .....do. Mill Creek 1.7 .89 1.3 .52 .14 2.5 <5 16 160
81 Revere Chelsea Creek .56 .87 1.4 .52 .11 2.2 <5 15 14082 .....do. .....do. 2.7 .40 .47 .20 .06 1.0 <5 4 4583 Chelsea .....do. .85 .47 .45 .27 .06 1.3 <5 4 5384 .....do. .....do. .51 .89 1.1 .62 .09 2.4 <5 10 10085 .....do. .....do. .53 .81 1.2 .55 .11 2.2 <5 12 110
86 Boston .....do. .42 .50 .57 .29 .06 1.3 <5 9 5787 Chelsea .....do. .62 .86 1.4 .56 .11 2.2 <5 11 10088 .....do. .....do. 1.4 1.0 1.4 .58 .14 2.3 <5 17 9489 Boston .....do. .66 .60 .74 .35 .08 1.5 <5 8 6690 .....do. .....do. .58 .64 .75 .36 .08 1.6 <5 9 71
91 .....do. .....do. .56 .80 1.1 .49 .10 2.1 <5 11 8592 Chelsea .....do. .56 .91 .78 .44 .11 2.1 <5 11 9293 .....do. .....do. .57 .87 .90 .55 .12 2.3 <5 17 11094 Boston .....do. .91 .45 .48 .25 .06 1.2 <5 8 5195 Chelsea .....do. .73 .80 .88 .47 .10 2.0 <5 15 72
96 .....do. .....do. .94 .60 .68 .31 .07 1.5 <5 13 5797 .....do. .....do. .58 .86 1.0 .55 .11 2.4 <5 11 9798 Boston .....do. 5.7 .53 .72 .28 .08 1.3 <5 10 6299 Chelsea .....do. 1.2 .79 .81 .35 .15 2.6 <5 27 290100 .....do. .....do. .60 .73 .88 .49 .09 2.0 <5 12 86
101 Boston .....do. .60 .77 1.0 .49 .10 1.9 <5 13 77102 .....do. Boston Inner Harbor .66 1.1 1.5 .71 .15 2.7 <5 19 100103 .....do. .....do. .71 1.1 1.4 .75 .14 2.8 <5 23 130104 .....do. .....do. .48 .82 1.0 .53 .08 2.1 <5 24 99
Tables 3–� ��
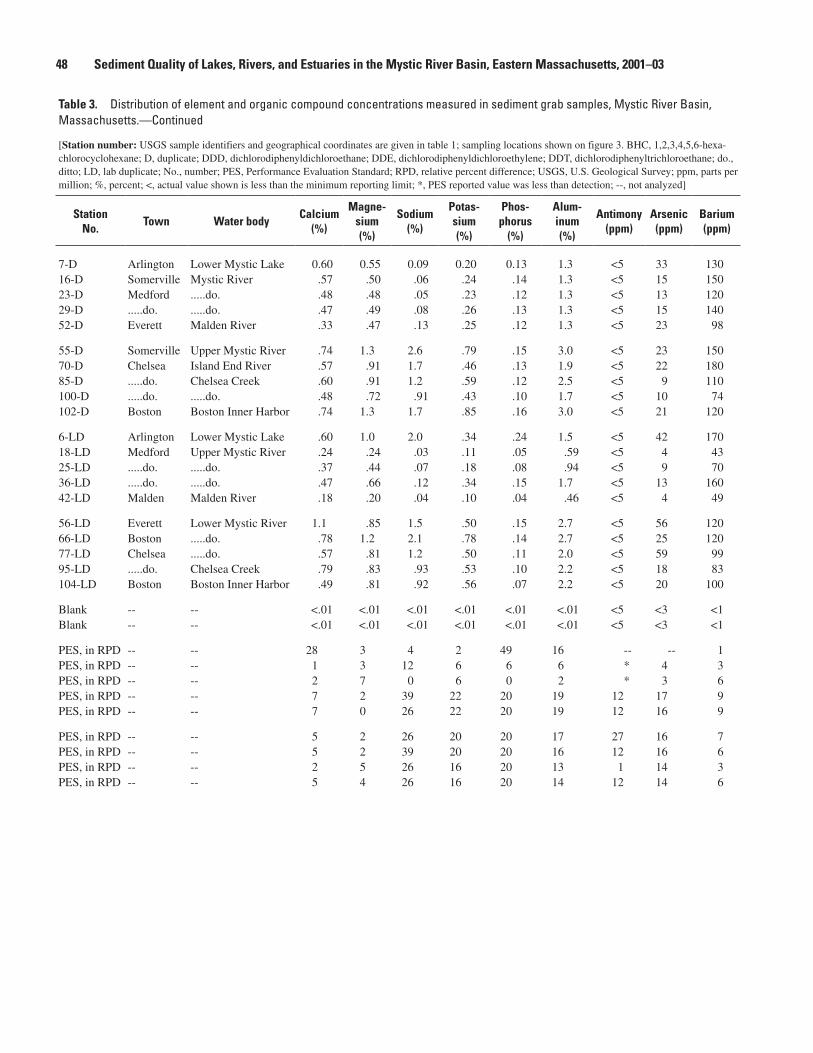
�� Sediment Quality of Lakes, Rivers, and Estuaries in the Mystic River Basin, Eastern Massachusetts, 2001–03
Table 3. Distribution of element and organic compound concentrations measured in sediment grab samples, Mystic River Basin, Massachusetts.—Continued
[Station number: USGS sample identifiers and geographical coordinates are given in table 1; sampling locations shown on figure 3. BHC, 1,2,3,4,5,6-hexa-chlorocyclohexane; D, duplicate; DDD, dichlorodiphenyldichloroethane; DDE, dichlorodiphenyldichloroethylene; DDT, dichlorodiphenyltrichloroethane; do., ditto; LD, lab duplicate; No., number; PES, Performance Evaluation Standard; RPD, relative percent difference; USGS, U.S. Geological Survey; ppm, parts per million; %, percent; <, actual value shown is less than the minimum reporting limit; *, PES reported value was less than detection; --, not analyzed]
Station No.
Town Water bodyCalcium
(%)
Magne- sium (%)
Sodium (%)
Potas- sium (%)
Phos- phorus
(%)
Alum- inum (%)
Antimony (ppm)
Arsenic (ppm)
Barium (ppm)
7-D Arlington Lower Mystic Lake 0.60 0.55 0.09 0.20 0.13 1.3 <5 33 13016-D Somerville Mystic River .57 .50 .06 .24 .14 1.3 <5 15 15023-D Medford .....do. .48 .48 .05 .23 .12 1.3 <5 13 12029-D .....do. .....do. .47 .49 .08 .26 .13 1.3 <5 15 14052-D Everett Malden River .33 .47 .13 .25 .12 1.3 <5 23 98
55-D Somerville Upper Mystic River .74 1.3 2.6 .79 .15 3.0 <5 23 15070-D Chelsea Island End River .57 .91 1.7 .46 .13 1.9 <5 22 18085-D .....do. Chelsea Creek .60 .91 1.2 .59 .12 2.5 <5 9 110100-D .....do. .....do. .48 .72 .91 .43 .10 1.7 <5 10 74102-D Boston Boston Inner Harbor .74 1.3 1.7 .85 .16 3.0 <5 21 120
6-LD Arlington Lower Mystic Lake .60 1.0 2.0 .34 .24 1.5 <5 42 17018-LD Medford Upper Mystic River .24 .24 .03 .11 .05 .59 <5 4 4325-LD .....do. .....do. .37 .44 .07 .18 .08 .94 <5 9 7036-LD .....do. .....do. .47 .66 .12 .34 .15 1.7 <5 13 16042-LD Malden Malden River .18 .20 .04 .10 .04 .46 <5 4 49
56-LD Everett Lower Mystic River 1.1 .85 1.5 .50 .15 2.7 <5 56 12066-LD Boston .....do. .78 1.2 2.1 .78 .14 2.7 <5 25 12077-LD Chelsea .....do. .57 .81 1.2 .50 .11 2.0 <5 59 9995-LD .....do. Chelsea Creek .79 .83 .93 .53 .10 2.2 <5 18 83104-LD Boston Boston Inner Harbor .49 .81 .92 .56 .07 2.2 <5 20 100
Blank -- -- <.01 <.01 <.01 <.01 <.01 <.01 <5 <3 <1Blank -- -- <.01 <.01 <.01 <.01 <.01 <.01 <5 <3 <1
PES, in RPD -- -- 28 3 4 2 49 16 -- -- 1PES, in RPD -- -- 1 3 12 6 6 6 * 4 3PES, in RPD -- -- 2 7 0 6 0 2 * 3 6PES, in RPD -- -- 7 2 39 22 20 19 12 17 9PES, in RPD -- -- 7 0 26 22 20 19 12 16 9
PES, in RPD -- -- 5 2 26 20 20 17 27 16 7PES, in RPD -- -- 5 2 39 20 20 16 12 16 6PES, in RPD -- -- 2 5 26 16 20 13 1 14 3PES, in RPD -- -- 5 4 26 16 20 14 12 14 6
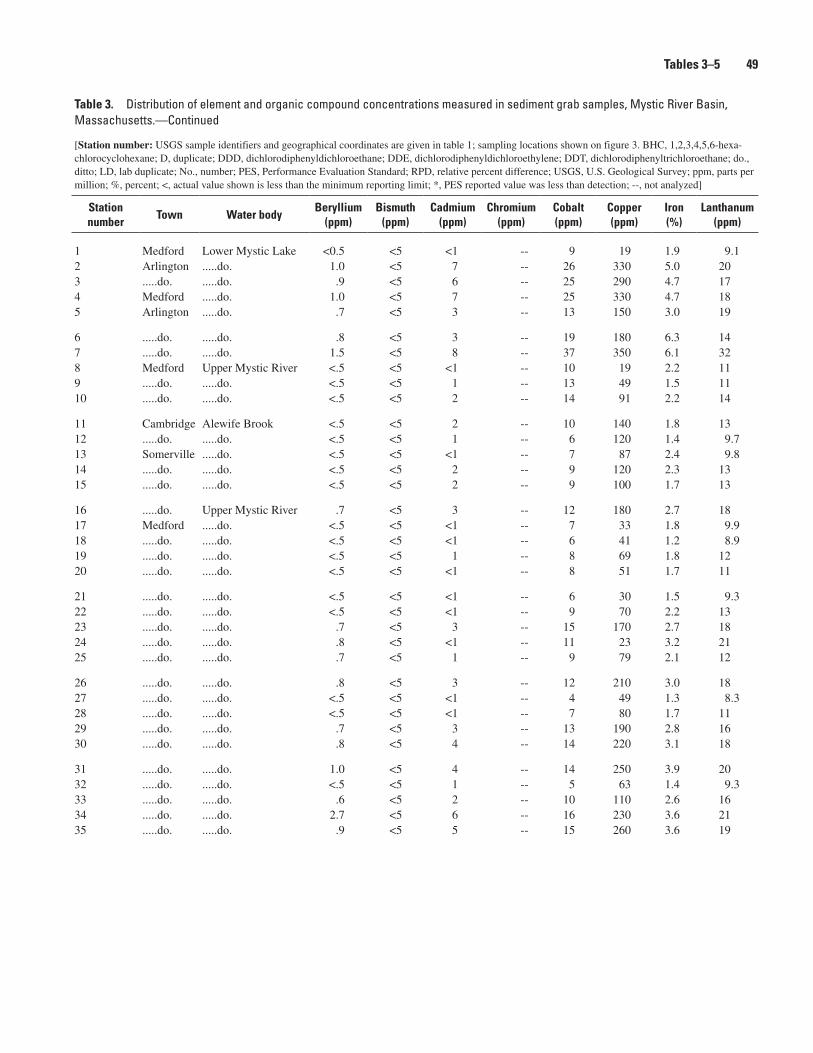
Table 3. Distribution of element and organic compound concentrations measured in sediment grab samples, Mystic River Basin, Massachusetts.—Continued
[Station number: USGS sample identifiers and geographical coordinates are given in table 1; sampling locations shown on figure 3. BHC, 1,2,3,4,5,6-hexa-chlorocyclohexane; D, duplicate; DDD, dichlorodiphenyldichloroethane; DDE, dichlorodiphenyldichloroethylene; DDT, dichlorodiphenyltrichloroethane; do., ditto; LD, lab duplicate; No., number; PES, Performance Evaluation Standard; RPD, relative percent difference; USGS, U.S. Geological Survey; ppm, parts per million; %, percent; <, actual value shown is less than the minimum reporting limit; *, PES reported value was less than detection; --, not analyzed]
Station number
Town Water bodyBeryllium
(ppm)Bismuth
(ppm)Cadmium
(ppm)Chromium
(ppm)Cobalt (ppm)
Copper (ppm)
Iron (%)
Lanthanum (ppm)
1 Medford Lower Mystic Lake <0.5 <5 <1 -- 9 19 1.9 9.12 Arlington .....do. 1.0 <5 7 -- 26 330 5.0 203 .....do. .....do. .9 <5 6 -- 25 290 4.7 174 Medford .....do. 1.0 <5 7 -- 25 330 4.7 185 Arlington .....do. .7 <5 3 -- 13 150 3.0 19
6 .....do. .....do. .8 <5 3 -- 19 180 6.3 147 .....do. .....do. 1.5 <5 8 -- 37 350 6.1 328 Medford Upper Mystic River <.5 <5 <1 -- 10 19 2.2 119 .....do. .....do. <.5 <5 1 -- 13 49 1.5 1110 .....do. .....do. <.5 <5 2 -- 14 91 2.2 14
11 Cambridge Alewife Brook <.5 <5 2 -- 10 140 1.8 1312 .....do. .....do. <.5 <5 1 -- 6 120 1.4 9.713 Somerville .....do. <.5 <5 <1 -- 7 87 2.4 9.814 .....do. .....do. <.5 <5 2 -- 9 120 2.3 1315 .....do. .....do. <.5 <5 2 -- 9 100 1.7 13
16 .....do. Upper Mystic River .7 <5 3 -- 12 180 2.7 1817 Medford .....do. <.5 <5 <1 -- 7 33 1.8 9.918 .....do. .....do. <.5 <5 <1 -- 6 41 1.2 8.919 .....do. .....do. <.5 <5 1 -- 8 69 1.8 1220 .....do. .....do. <.5 <5 <1 -- 8 51 1.7 11
21 .....do. .....do. <.5 <5 <1 -- 6 30 1.5 9.322 .....do. .....do. <.5 <5 <1 -- 9 70 2.2 1323 .....do. .....do. .7 <5 3 -- 15 170 2.7 1824 .....do. .....do. .8 <5 <1 -- 11 23 3.2 2125 .....do. .....do. .7 <5 1 -- 9 79 2.1 12
26 .....do. .....do. .8 <5 3 -- 12 210 3.0 1827 .....do. .....do. <.5 <5 <1 -- 4 49 1.3 8.328 .....do. .....do. <.5 <5 <1 -- 7 80 1.7 1129 .....do. .....do. .7 <5 3 -- 13 190 2.8 1630 .....do. .....do. .8 <5 4 -- 14 220 3.1 18
31 .....do. .....do. 1.0 <5 4 -- 14 250 3.9 2032 .....do. .....do. <.5 <5 1 -- 5 63 1.4 9.333 .....do. .....do. .6 <5 2 -- 10 110 2.6 1634 .....do. .....do. 2.7 <5 6 -- 16 230 3.6 2135 .....do. .....do. .9 <5 5 -- 15 260 3.6 19
Tables 3–� ��
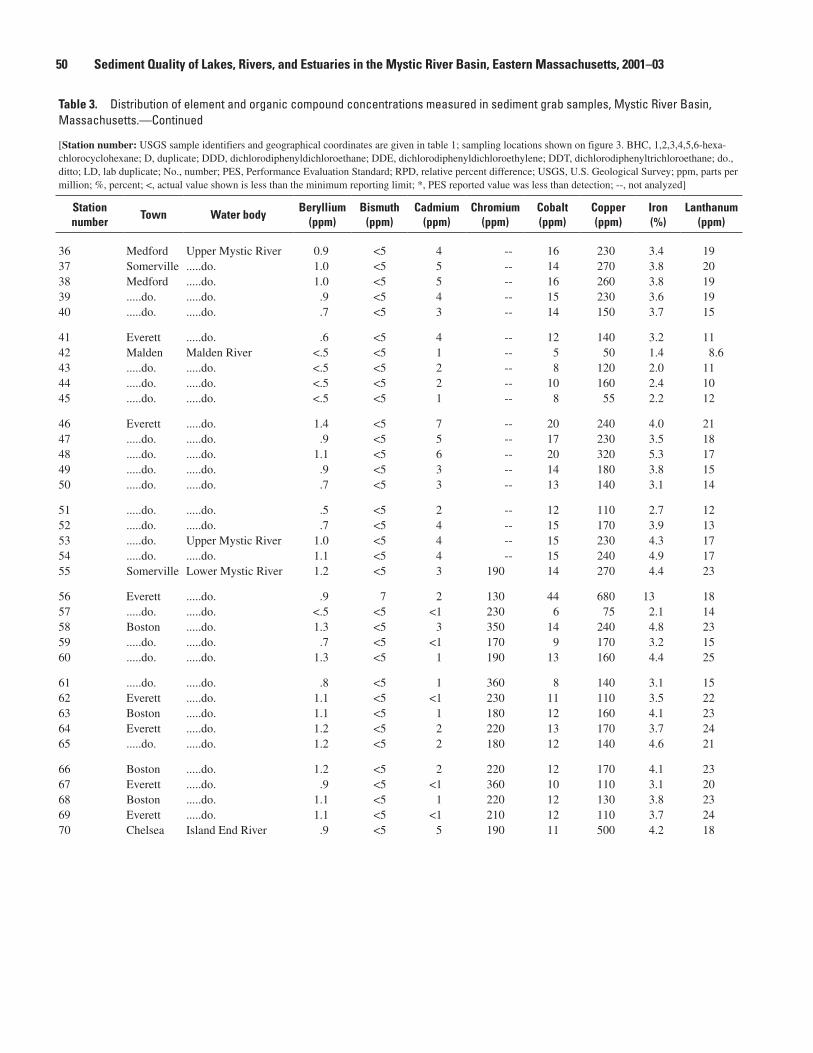
�0 Sediment Quality of Lakes, Rivers, and Estuaries in the Mystic River Basin, Eastern Massachusetts, 2001–03
Table 3. Distribution of element and organic compound concentrations measured in sediment grab samples, Mystic River Basin, Massachusetts.—Continued
[Station number: USGS sample identifiers and geographical coordinates are given in table 1; sampling locations shown on figure 3. BHC, 1,2,3,4,5,6-hexa-chlorocyclohexane; D, duplicate; DDD, dichlorodiphenyldichloroethane; DDE, dichlorodiphenyldichloroethylene; DDT, dichlorodiphenyltrichloroethane; do., ditto; LD, lab duplicate; No., number; PES, Performance Evaluation Standard; RPD, relative percent difference; USGS, U.S. Geological Survey; ppm, parts per million; %, percent; <, actual value shown is less than the minimum reporting limit; *, PES reported value was less than detection; --, not analyzed]
Station number
Town Water bodyBeryllium
(ppm)Bismuth
(ppm)Cadmium
(ppm)Chromium
(ppm)Cobalt (ppm)
Copper (ppm)
Iron (%)
Lanthanum (ppm)
36 Medford Upper Mystic River 0.9 <5 4 -- 16 230 3.4 1937 Somerville .....do. 1.0 <5 5 -- 14 270 3.8 2038 Medford .....do. 1.0 <5 5 -- 16 260 3.8 1939 .....do. .....do. .9 <5 4 -- 15 230 3.6 1940 .....do. .....do. .7 <5 3 -- 14 150 3.7 15
41 Everett .....do. .6 <5 4 -- 12 140 3.2 1142 Malden Malden River <.5 <5 1 -- 5 50 1.4 8.643 .....do. .....do. <.5 <5 2 -- 8 120 2.0 1144 .....do. .....do. <.5 <5 2 -- 10 160 2.4 1045 .....do. .....do. <.5 <5 1 -- 8 55 2.2 12
46 Everett .....do. 1.4 <5 7 -- 20 240 4.0 2147 .....do. .....do. .9 <5 5 -- 17 230 3.5 1848 .....do. .....do. 1.1 <5 6 -- 20 320 5.3 1749 .....do. .....do. .9 <5 3 -- 14 180 3.8 1550 .....do. .....do. .7 <5 3 -- 13 140 3.1 14
51 .....do. .....do. .5 <5 2 -- 12 110 2.7 1252 .....do. .....do. .7 <5 4 -- 15 170 3.9 1353 .....do. Upper Mystic River 1.0 <5 4 -- 15 230 4.3 1754 .....do. .....do. 1.1 <5 4 -- 15 240 4.9 1755 Somerville Lower Mystic River 1.2 <5 3 190 14 270 4.4 23
56 Everett .....do. .9 7 2 130 44 680 13 1857 .....do. .....do. <.5 <5 <1 230 6 75 2.1 1458 Boston .....do. 1.3 <5 3 350 14 240 4.8 2359 .....do. .....do. .7 <5 <1 170 9 170 3.2 1560 .....do. .....do. 1.3 <5 1 190 13 160 4.4 25
61 .....do. .....do. .8 <5 1 360 8 140 3.1 1562 Everett .....do. 1.1 <5 <1 230 11 110 3.5 2263 Boston .....do. 1.1 <5 1 180 12 160 4.1 2364 Everett .....do. 1.2 <5 2 220 13 170 3.7 2465 .....do. .....do. 1.2 <5 2 180 12 140 4.6 21
66 Boston .....do. 1.2 <5 2 220 12 170 4.1 2367 Everett .....do. .9 <5 <1 360 10 110 3.1 2068 Boston .....do. 1.1 <5 1 220 12 130 3.8 2369 Everett .....do. 1.1 <5 <1 210 12 110 3.7 2470 Chelsea Island End River .9 <5 5 190 11 500 4.2 18
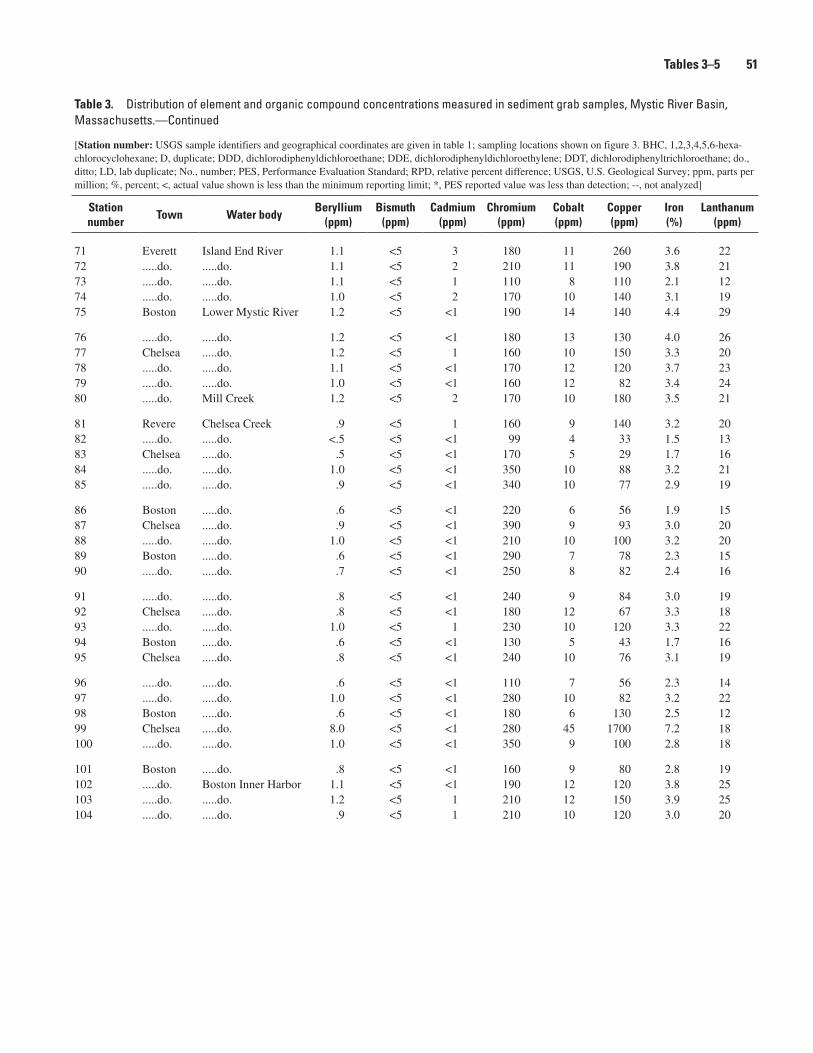
Table 3. Distribution of element and organic compound concentrations measured in sediment grab samples, Mystic River Basin, Massachusetts.—Continued
[Station number: USGS sample identifiers and geographical coordinates are given in table 1; sampling locations shown on figure 3. BHC, 1,2,3,4,5,6-hexa-chlorocyclohexane; D, duplicate; DDD, dichlorodiphenyldichloroethane; DDE, dichlorodiphenyldichloroethylene; DDT, dichlorodiphenyltrichloroethane; do., ditto; LD, lab duplicate; No., number; PES, Performance Evaluation Standard; RPD, relative percent difference; USGS, U.S. Geological Survey; ppm, parts per million; %, percent; <, actual value shown is less than the minimum reporting limit; *, PES reported value was less than detection; --, not analyzed]
Station number
Town Water bodyBeryllium
(ppm)Bismuth
(ppm)Cadmium
(ppm)Chromium
(ppm)Cobalt (ppm)
Copper (ppm)
Iron (%)
Lanthanum (ppm)
71 Everett Island End River 1.1 <5 3 180 11 260 3.6 2272 .....do. .....do. 1.1 <5 2 210 11 190 3.8 2173 .....do. .....do. 1.1 <5 1 110 8 110 2.1 1274 .....do. .....do. 1.0 <5 2 170 10 140 3.1 1975 Boston Lower Mystic River 1.2 <5 <1 190 14 140 4.4 29
76 .....do. .....do. 1.2 <5 <1 180 13 130 4.0 2677 Chelsea .....do. 1.2 <5 1 160 10 150 3.3 2078 .....do. .....do. 1.1 <5 <1 170 12 120 3.7 2379 .....do. .....do. 1.0 <5 <1 160 12 82 3.4 2480 .....do. Mill Creek 1.2 <5 2 170 10 180 3.5 21
81 Revere Chelsea Creek .9 <5 1 160 9 140 3.2 2082 .....do. .....do. <.5 <5 <1 99 4 33 1.5 1383 Chelsea .....do. .5 <5 <1 170 5 29 1.7 1684 .....do. .....do. 1.0 <5 <1 350 10 88 3.2 2185 .....do. .....do. .9 <5 <1 340 10 77 2.9 19
86 Boston .....do. .6 <5 <1 220 6 56 1.9 1587 Chelsea .....do. .9 <5 <1 390 9 93 3.0 2088 .....do. .....do. 1.0 <5 <1 210 10 100 3.2 2089 Boston .....do. .6 <5 <1 290 7 78 2.3 1590 .....do. .....do. .7 <5 <1 250 8 82 2.4 16
91 .....do. .....do. .8 <5 <1 240 9 84 3.0 1992 Chelsea .....do. .8 <5 <1 180 12 67 3.3 1893 .....do. .....do. 1.0 <5 1 230 10 120 3.3 2294 Boston .....do. .6 <5 <1 130 5 43 1.7 1695 Chelsea .....do. .8 <5 <1 240 10 76 3.1 19
96 .....do. .....do. .6 <5 <1 110 7 56 2.3 1497 .....do. .....do. 1.0 <5 <1 280 10 82 3.2 2298 Boston .....do. .6 <5 <1 180 6 130 2.5 1299 Chelsea .....do. 8.0 <5 <1 280 45 1700 7.2 18100 .....do. .....do. 1.0 <5 <1 350 9 100 2.8 18
101 Boston .....do. .8 <5 <1 160 9 80 2.8 19102 .....do. Boston Inner Harbor 1.1 <5 <1 190 12 120 3.8 25103 .....do. .....do. 1.2 <5 1 210 12 150 3.9 25104 .....do. .....do. .9 <5 1 210 10 120 3.0 20
Tables 3–� �1
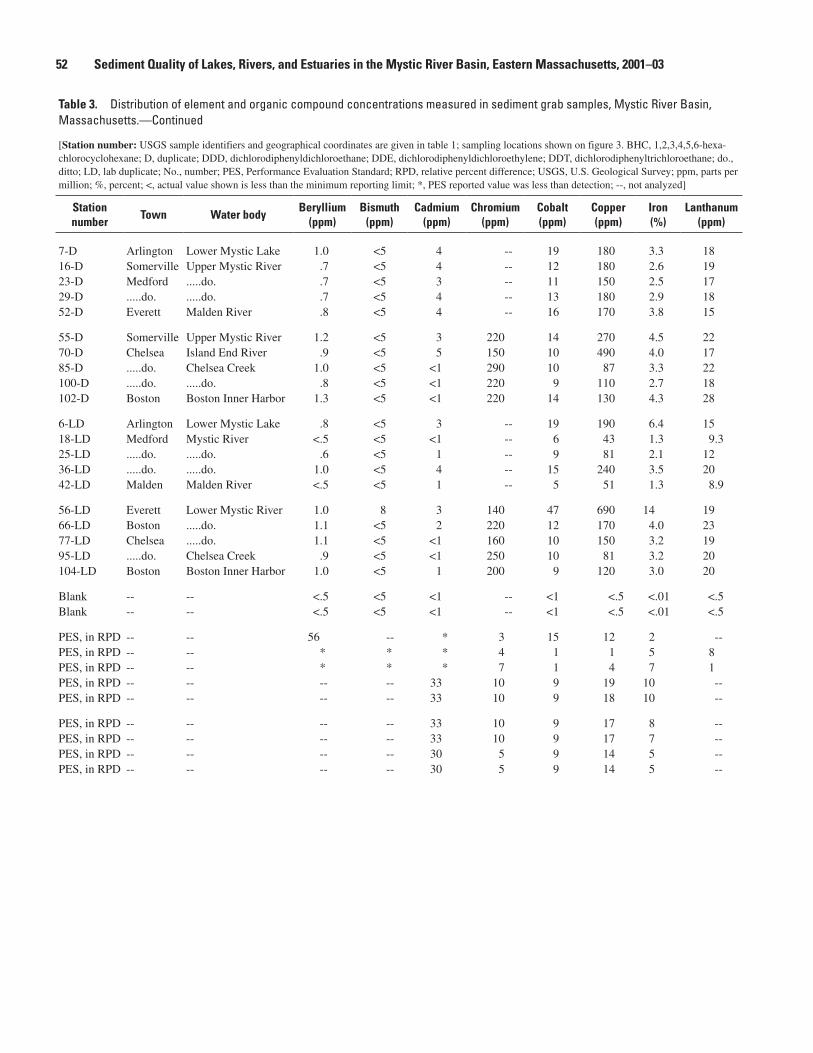
�2 Sediment Quality of Lakes, Rivers, and Estuaries in the Mystic River Basin, Eastern Massachusetts, 2001–03
Table 3. Distribution of element and organic compound concentrations measured in sediment grab samples, Mystic River Basin, Massachusetts.—Continued
[Station number: USGS sample identifiers and geographical coordinates are given in table 1; sampling locations shown on figure 3. BHC, 1,2,3,4,5,6-hexa-chlorocyclohexane; D, duplicate; DDD, dichlorodiphenyldichloroethane; DDE, dichlorodiphenyldichloroethylene; DDT, dichlorodiphenyltrichloroethane; do., ditto; LD, lab duplicate; No., number; PES, Performance Evaluation Standard; RPD, relative percent difference; USGS, U.S. Geological Survey; ppm, parts per million; %, percent; <, actual value shown is less than the minimum reporting limit; *, PES reported value was less than detection; --, not analyzed]
Station number
Town Water bodyBeryllium
(ppm)Bismuth
(ppm)Cadmium
(ppm)Chromium
(ppm)Cobalt (ppm)
Copper (ppm)
Iron (%)
Lanthanum (ppm)
7-D Arlington Lower Mystic Lake 1.0 <5 4 -- 19 180 3.3 1816-D Somerville Upper Mystic River .7 <5 4 -- 12 180 2.6 1923-D Medford .....do. .7 <5 3 -- 11 150 2.5 1729-D .....do. .....do. .7 <5 4 -- 13 180 2.9 1852-D Everett Malden River .8 <5 4 -- 16 170 3.8 15
55-D Somerville Upper Mystic River 1.2 <5 3 220 14 270 4.5 2270-D Chelsea Island End River .9 <5 5 150 10 490 4.0 1785-D .....do. Chelsea Creek 1.0 <5 <1 290 10 87 3.3 22100-D .....do. .....do. .8 <5 <1 220 9 110 2.7 18102-D Boston Boston Inner Harbor 1.3 <5 <1 220 14 130 4.3 28
6-LD Arlington Lower Mystic Lake .8 <5 3 -- 19 190 6.4 1518-LD Medford Mystic River <.5 <5 <1 -- 6 43 1.3 9.325-LD .....do. .....do. .6 <5 1 -- 9 81 2.1 1236-LD .....do. .....do. 1.0 <5 4 -- 15 240 3.5 2042-LD Malden Malden River <.5 <5 1 -- 5 51 1.3 8.9
56-LD Everett Lower Mystic River 1.0 8 3 140 47 690 14 1966-LD Boston .....do. 1.1 <5 2 220 12 170 4.0 2377-LD Chelsea .....do. 1.1 <5 <1 160 10 150 3.2 1995-LD .....do. Chelsea Creek .9 <5 <1 250 10 81 3.2 20104-LD Boston Boston Inner Harbor 1.0 <5 1 200 9 120 3.0 20
Blank -- -- <.5 <5 <1 -- <1 <.5 <.01 <.5Blank -- -- <.5 <5 <1 -- <1 <.5 <.01 <.5
PES, in RPD -- -- 56 -- * 3 15 12 2 --PES, in RPD -- -- * * * 4 1 1 5 8PES, in RPD -- -- * * * 7 1 4 7 1PES, in RPD -- -- -- -- 33 10 9 19 10 --PES, in RPD -- -- -- -- 33 10 9 18 10 --
PES, in RPD -- -- -- -- 33 10 9 17 8 --PES, in RPD -- -- -- -- 33 10 9 17 7 --PES, in RPD -- -- -- -- 30 5 9 14 5 --PES, in RPD -- -- -- -- 30 5 9 14 5 --
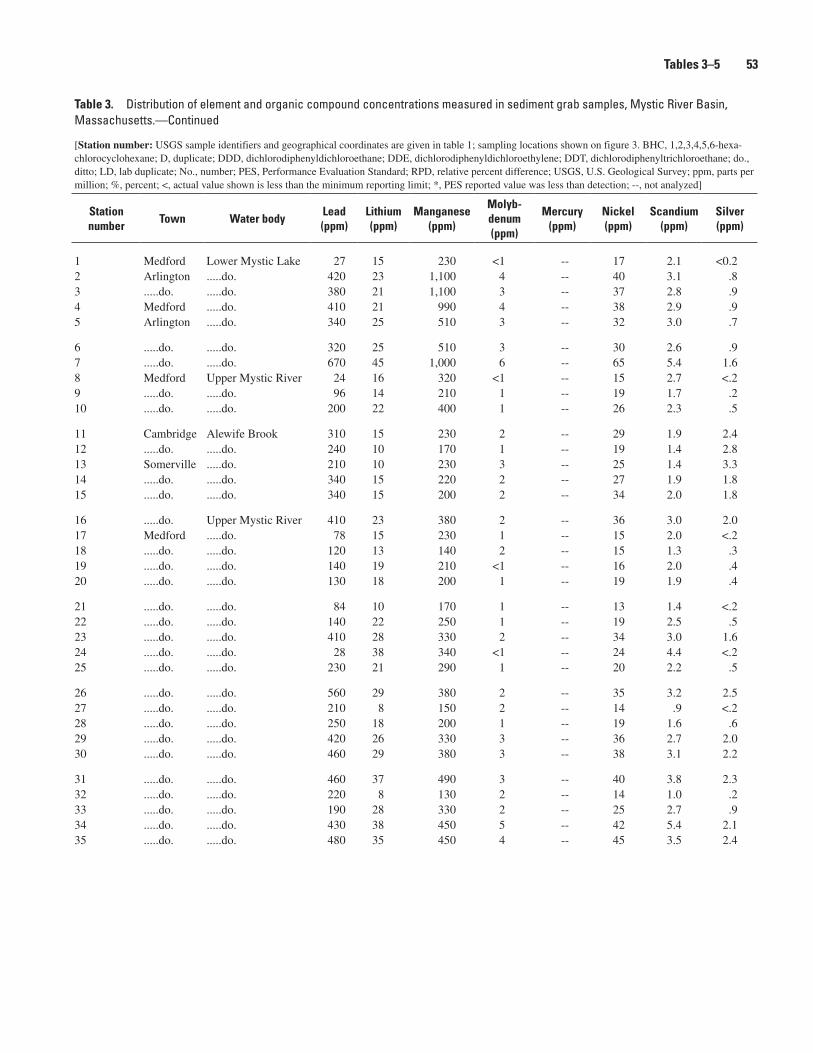
Table 3. Distribution of element and organic compound concentrations measured in sediment grab samples, Mystic River Basin, Massachusetts.—Continued
[Station number: USGS sample identifiers and geographical coordinates are given in table 1; sampling locations shown on figure 3. BHC, 1,2,3,4,5,6-hexa-chlorocyclohexane; D, duplicate; DDD, dichlorodiphenyldichloroethane; DDE, dichlorodiphenyldichloroethylene; DDT, dichlorodiphenyltrichloroethane; do., ditto; LD, lab duplicate; No., number; PES, Performance Evaluation Standard; RPD, relative percent difference; USGS, U.S. Geological Survey; ppm, parts per million; %, percent; <, actual value shown is less than the minimum reporting limit; *, PES reported value was less than detection; --, not analyzed]
Station number
Town Water bodyLead (ppm)
Lithium (ppm)
Manganese (ppm)
Molyb- denum (ppm)
Mercury (ppm)
Nickel (ppm)
Scandium (ppm)
Silver (ppm)
1 Medford Lower Mystic Lake 27 15 230 <1 -- 17 2.1 <0.22 Arlington .....do. 420 23 1,100 4 -- 40 3.1 .83 .....do. .....do. 380 21 1,100 3 -- 37 2.8 .94 Medford .....do. 410 21 990 4 -- 38 2.9 .95 Arlington .....do. 340 25 510 3 -- 32 3.0 .7
6 .....do. .....do. 320 25 510 3 -- 30 2.6 .97 .....do. .....do. 670 45 1,000 6 -- 65 5.4 1.68 Medford Upper Mystic River 24 16 320 <1 -- 15 2.7 <.29 .....do. .....do. 96 14 210 1 -- 19 1.7 .210 .....do. .....do. 200 22 400 1 -- 26 2.3 .5
11 Cambridge Alewife Brook 310 15 230 2 -- 29 1.9 2.412 .....do. .....do. 240 10 170 1 -- 19 1.4 2.813 Somerville .....do. 210 10 230 3 -- 25 1.4 3.314 .....do. .....do. 340 15 220 2 -- 27 1.9 1.815 .....do. .....do. 340 15 200 2 -- 34 2.0 1.8
16 .....do. Upper Mystic River 410 23 380 2 -- 36 3.0 2.017 Medford .....do. 78 15 230 1 -- 15 2.0 <.218 .....do. .....do. 120 13 140 2 -- 15 1.3 .319 .....do. .....do. 140 19 210 <1 -- 16 2.0 .420 .....do. .....do. 130 18 200 1 -- 19 1.9 .4
21 .....do. .....do. 84 10 170 1 -- 13 1.4 <.222 .....do. .....do. 140 22 250 1 -- 19 2.5 .523 .....do. .....do. 410 28 330 2 -- 34 3.0 1.624 .....do. .....do. 28 38 340 <1 -- 24 4.4 <.225 .....do. .....do. 230 21 290 1 -- 20 2.2 .5
26 .....do. .....do. 560 29 380 2 -- 35 3.2 2.527 .....do. .....do. 210 8 150 2 -- 14 .9 <.228 .....do. .....do. 250 18 200 1 -- 19 1.6 .629 .....do. .....do. 420 26 330 3 -- 36 2.7 2.030 .....do. .....do. 460 29 380 3 -- 38 3.1 2.2
31 .....do. .....do. 460 37 490 3 -- 40 3.8 2.332 .....do. .....do. 220 8 130 2 -- 14 1.0 .233 .....do. .....do. 190 28 330 2 -- 25 2.7 .934 .....do. .....do. 430 38 450 5 -- 42 5.4 2.135 .....do. .....do. 480 35 450 4 -- 45 3.5 2.4
Tables 3–� �3
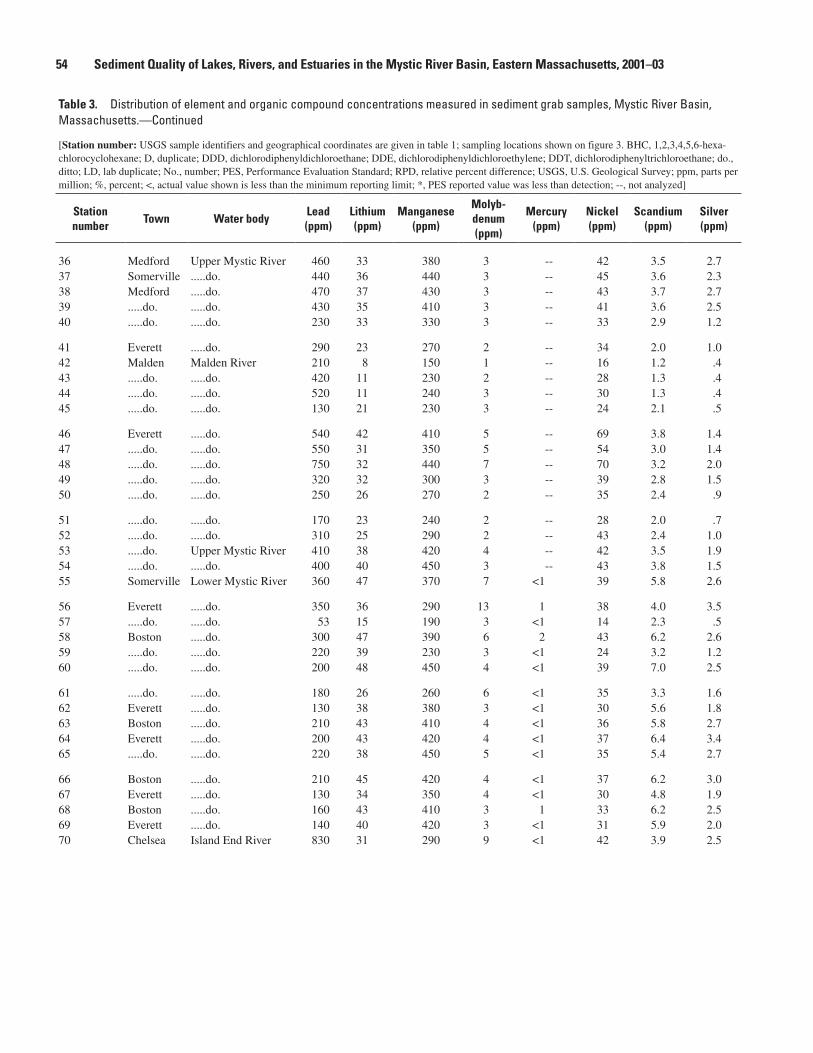
�� Sediment Quality of Lakes, Rivers, and Estuaries in the Mystic River Basin, Eastern Massachusetts, 2001–03
Table 3. Distribution of element and organic compound concentrations measured in sediment grab samples, Mystic River Basin, Massachusetts.—Continued
[Station number: USGS sample identifiers and geographical coordinates are given in table 1; sampling locations shown on figure 3. BHC, 1,2,3,4,5,6-hexa-chlorocyclohexane; D, duplicate; DDD, dichlorodiphenyldichloroethane; DDE, dichlorodiphenyldichloroethylene; DDT, dichlorodiphenyltrichloroethane; do., ditto; LD, lab duplicate; No., number; PES, Performance Evaluation Standard; RPD, relative percent difference; USGS, U.S. Geological Survey; ppm, parts per million; %, percent; <, actual value shown is less than the minimum reporting limit; *, PES reported value was less than detection; --, not analyzed]
Station number
Town Water bodyLead (ppm)
Lithium (ppm)
Manganese (ppm)
Molyb- denum (ppm)
Mercury (ppm)
Nickel (ppm)
Scandium (ppm)
Silver (ppm)
36 Medford Upper Mystic River 460 33 380 3 -- 42 3.5 2.737 Somerville .....do. 440 36 440 3 -- 45 3.6 2.338 Medford .....do. 470 37 430 3 -- 43 3.7 2.739 .....do. .....do. 430 35 410 3 -- 41 3.6 2.540 .....do. .....do. 230 33 330 3 -- 33 2.9 1.2
41 Everett .....do. 290 23 270 2 -- 34 2.0 1.042 Malden Malden River 210 8 150 1 -- 16 1.2 .443 .....do. .....do. 420 11 230 2 -- 28 1.3 .444 .....do. .....do. 520 11 240 3 -- 30 1.3 .445 .....do. .....do. 130 21 230 3 -- 24 2.1 .5
46 Everett .....do. 540 42 410 5 -- 69 3.8 1.447 .....do. .....do. 550 31 350 5 -- 54 3.0 1.448 .....do. .....do. 750 32 440 7 -- 70 3.2 2.049 .....do. .....do. 320 32 300 3 -- 39 2.8 1.550 .....do. .....do. 250 26 270 2 -- 35 2.4 .9
51 .....do. .....do. 170 23 240 2 -- 28 2.0 .752 .....do. .....do. 310 25 290 2 -- 43 2.4 1.053 .....do. Upper Mystic River 410 38 420 4 -- 42 3.5 1.954 .....do. .....do. 400 40 450 3 -- 43 3.8 1.555 Somerville Lower Mystic River 360 47 370 7 <1 39 5.8 2.6
56 Everett .....do. 350 36 290 13 1 38 4.0 3.557 .....do. .....do. 53 15 190 3 <1 14 2.3 .558 Boston .....do. 300 47 390 6 2 43 6.2 2.659 .....do. .....do. 220 39 230 3 <1 24 3.2 1.260 .....do. .....do. 200 48 450 4 <1 39 7.0 2.5
61 .....do. .....do. 180 26 260 6 <1 35 3.3 1.662 Everett .....do. 130 38 380 3 <1 30 5.6 1.863 Boston .....do. 210 43 410 4 <1 36 5.8 2.764 Everett .....do. 200 43 420 4 <1 37 6.4 3.465 .....do. .....do. 220 38 450 5 <1 35 5.4 2.7
66 Boston .....do. 210 45 420 4 <1 37 6.2 3.067 Everett .....do. 130 34 350 4 <1 30 4.8 1.968 Boston .....do. 160 43 410 3 1 33 6.2 2.569 Everett .....do. 140 40 420 3 <1 31 5.9 2.070 Chelsea Island End River 830 31 290 9 <1 42 3.9 2.5
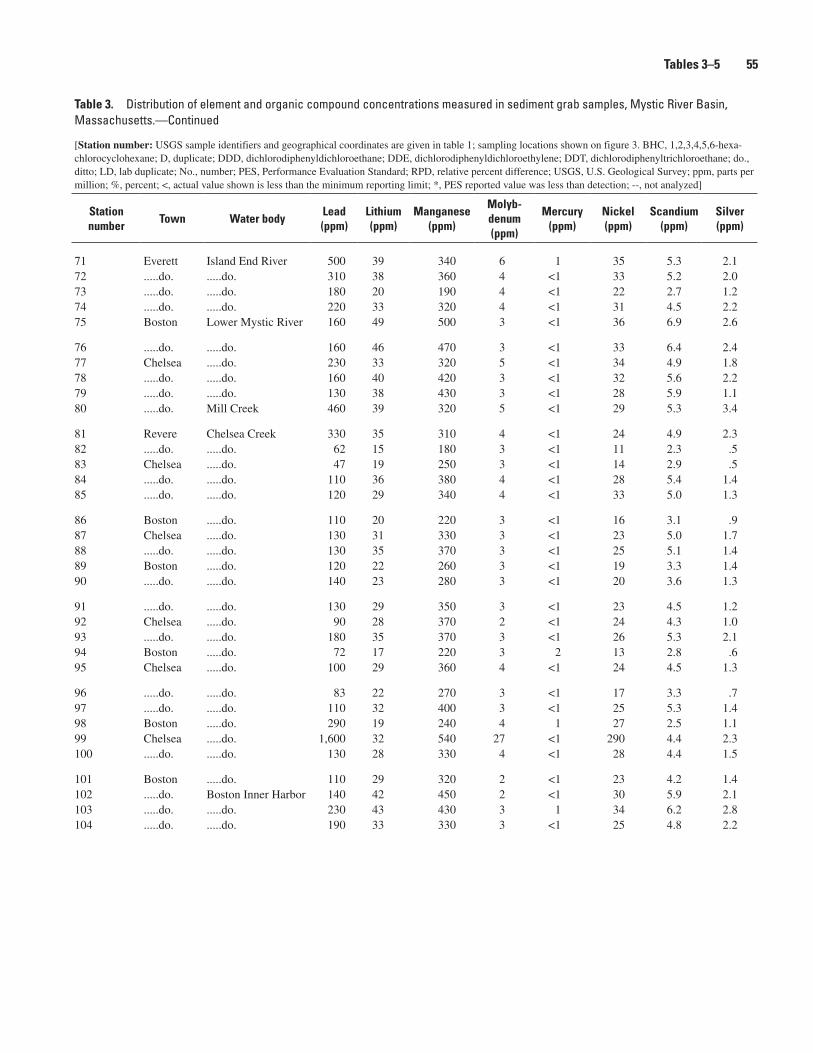
Table 3. Distribution of element and organic compound concentrations measured in sediment grab samples, Mystic River Basin, Massachusetts.—Continued
[Station number: USGS sample identifiers and geographical coordinates are given in table 1; sampling locations shown on figure 3. BHC, 1,2,3,4,5,6-hexa-chlorocyclohexane; D, duplicate; DDD, dichlorodiphenyldichloroethane; DDE, dichlorodiphenyldichloroethylene; DDT, dichlorodiphenyltrichloroethane; do., ditto; LD, lab duplicate; No., number; PES, Performance Evaluation Standard; RPD, relative percent difference; USGS, U.S. Geological Survey; ppm, parts per million; %, percent; <, actual value shown is less than the minimum reporting limit; *, PES reported value was less than detection; --, not analyzed]
Station number
Town Water bodyLead (ppm)
Lithium (ppm)
Manganese (ppm)
Molyb- denum (ppm)
Mercury (ppm)
Nickel (ppm)
Scandium (ppm)
Silver (ppm)
71 Everett Island End River 500 39 340 6 1 35 5.3 2.172 .....do. .....do. 310 38 360 4 <1 33 5.2 2.073 .....do. .....do. 180 20 190 4 <1 22 2.7 1.274 .....do. .....do. 220 33 320 4 <1 31 4.5 2.275 Boston Lower Mystic River 160 49 500 3 <1 36 6.9 2.6
76 .....do. .....do. 160 46 470 3 <1 33 6.4 2.477 Chelsea .....do. 230 33 320 5 <1 34 4.9 1.878 .....do. .....do. 160 40 420 3 <1 32 5.6 2.279 .....do. .....do. 130 38 430 3 <1 28 5.9 1.180 .....do. Mill Creek 460 39 320 5 <1 29 5.3 3.4
81 Revere Chelsea Creek 330 35 310 4 <1 24 4.9 2.382 .....do. .....do. 62 15 180 3 <1 11 2.3 .583 Chelsea .....do. 47 19 250 3 <1 14 2.9 .584 .....do. .....do. 110 36 380 4 <1 28 5.4 1.485 .....do. .....do. 120 29 340 4 <1 33 5.0 1.3
86 Boston .....do. 110 20 220 3 <1 16 3.1 .987 Chelsea .....do. 130 31 330 3 <1 23 5.0 1.788 .....do. .....do. 130 35 370 3 <1 25 5.1 1.489 Boston .....do. 120 22 260 3 <1 19 3.3 1.490 .....do. .....do. 140 23 280 3 <1 20 3.6 1.3
91 .....do. .....do. 130 29 350 3 <1 23 4.5 1.292 Chelsea .....do. 90 28 370 2 <1 24 4.3 1.093 .....do. .....do. 180 35 370 3 <1 26 5.3 2.194 Boston .....do. 72 17 220 3 2 13 2.8 .695 Chelsea .....do. 100 29 360 4 <1 24 4.5 1.3
96 .....do. .....do. 83 22 270 3 <1 17 3.3 .797 .....do. .....do. 110 32 400 3 <1 25 5.3 1.498 Boston .....do. 290 19 240 4 1 27 2.5 1.199 Chelsea .....do. 1,600 32 540 27 <1 290 4.4 2.3100 .....do. .....do. 130 28 330 4 <1 28 4.4 1.5
101 Boston .....do. 110 29 320 2 <1 23 4.2 1.4102 .....do. Boston Inner Harbor 140 42 450 2 <1 30 5.9 2.1103 .....do. .....do. 230 43 430 3 1 34 6.2 2.8104 .....do. .....do. 190 33 330 3 <1 25 4.8 2.2
Tables 3–� ��
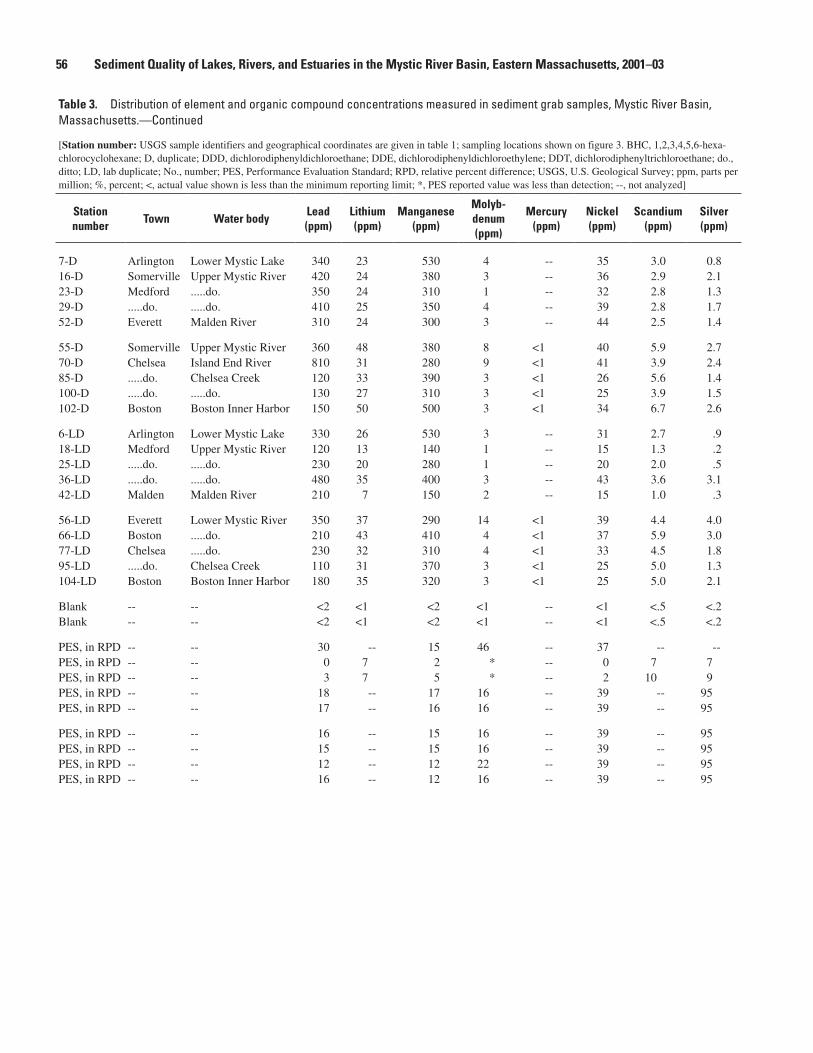
�� Sediment Quality of Lakes, Rivers, and Estuaries in the Mystic River Basin, Eastern Massachusetts, 2001–03
Table 3. Distribution of element and organic compound concentrations measured in sediment grab samples, Mystic River Basin, Massachusetts.—Continued
[Station number: USGS sample identifiers and geographical coordinates are given in table 1; sampling locations shown on figure 3. BHC, 1,2,3,4,5,6-hexa-chlorocyclohexane; D, duplicate; DDD, dichlorodiphenyldichloroethane; DDE, dichlorodiphenyldichloroethylene; DDT, dichlorodiphenyltrichloroethane; do., ditto; LD, lab duplicate; No., number; PES, Performance Evaluation Standard; RPD, relative percent difference; USGS, U.S. Geological Survey; ppm, parts per million; %, percent; <, actual value shown is less than the minimum reporting limit; *, PES reported value was less than detection; --, not analyzed]
Station number
Town Water bodyLead (ppm)
Lithium (ppm)
Manganese (ppm)
Molyb- denum (ppm)
Mercury (ppm)
Nickel (ppm)
Scandium (ppm)
Silver (ppm)
7-D Arlington Lower Mystic Lake 340 23 530 4 -- 35 3.0 0.816-D Somerville Upper Mystic River 420 24 380 3 -- 36 2.9 2.123-D Medford .....do. 350 24 310 1 -- 32 2.8 1.329-D .....do. .....do. 410 25 350 4 -- 39 2.8 1.752-D Everett Malden River 310 24 300 3 -- 44 2.5 1.4
55-D Somerville Upper Mystic River 360 48 380 8 <1 40 5.9 2.770-D Chelsea Island End River 810 31 280 9 <1 41 3.9 2.485-D .....do. Chelsea Creek 120 33 390 3 <1 26 5.6 1.4100-D .....do. .....do. 130 27 310 3 <1 25 3.9 1.5102-D Boston Boston Inner Harbor 150 50 500 3 <1 34 6.7 2.6
6-LD Arlington Lower Mystic Lake 330 26 530 3 -- 31 2.7 .918-LD Medford Upper Mystic River 120 13 140 1 -- 15 1.3 .225-LD .....do. .....do. 230 20 280 1 -- 20 2.0 .536-LD .....do. .....do. 480 35 400 3 -- 43 3.6 3.142-LD Malden Malden River 210 7 150 2 -- 15 1.0 .3
56-LD Everett Lower Mystic River 350 37 290 14 <1 39 4.4 4.066-LD Boston .....do. 210 43 410 4 <1 37 5.9 3.077-LD Chelsea .....do. 230 32 310 4 <1 33 4.5 1.895-LD .....do. Chelsea Creek 110 31 370 3 <1 25 5.0 1.3104-LD Boston Boston Inner Harbor 180 35 320 3 <1 25 5.0 2.1
Blank -- -- <2 <1 <2 <1 -- <1 <.5 <.2Blank -- -- <2 <1 <2 <1 -- <1 <.5 <.2
PES, in RPD -- -- 30 -- 15 46 -- 37 -- --PES, in RPD -- -- 0 7 2 * -- 0 7 7PES, in RPD -- -- 3 7 5 * -- 2 10 9PES, in RPD -- -- 18 -- 17 16 -- 39 -- 95PES, in RPD -- -- 17 -- 16 16 -- 39 -- 95
PES, in RPD -- -- 16 -- 15 16 -- 39 -- 95PES, in RPD -- -- 15 -- 15 16 -- 39 -- 95PES, in RPD -- -- 12 -- 12 22 -- 39 -- 95PES, in RPD -- -- 16 -- 12 16 -- 39 -- 95
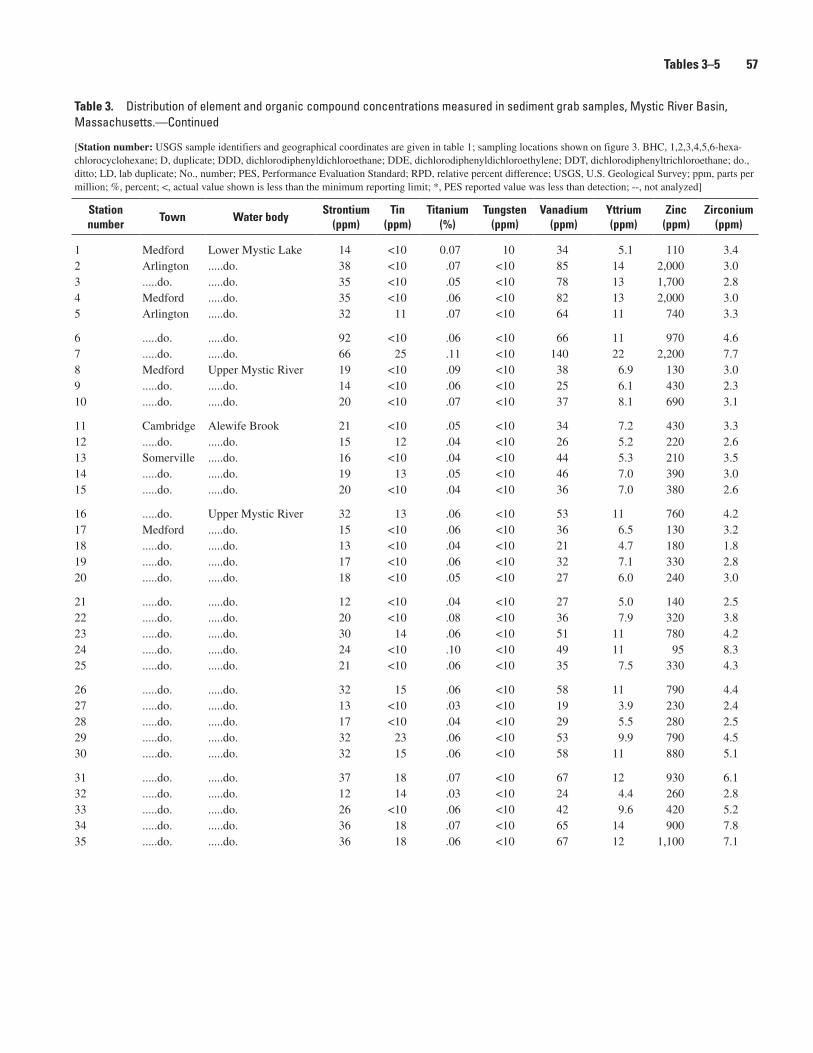
Table 3. Distribution of element and organic compound concentrations measured in sediment grab samples, Mystic River Basin, Massachusetts.—Continued
[Station number: USGS sample identifiers and geographical coordinates are given in table 1; sampling locations shown on figure 3. BHC, 1,2,3,4,5,6-hexa-chlorocyclohexane; D, duplicate; DDD, dichlorodiphenyldichloroethane; DDE, dichlorodiphenyldichloroethylene; DDT, dichlorodiphenyltrichloroethane; do., ditto; LD, lab duplicate; No., number; PES, Performance Evaluation Standard; RPD, relative percent difference; USGS, U.S. Geological Survey; ppm, parts per million; %, percent; <, actual value shown is less than the minimum reporting limit; *, PES reported value was less than detection; --, not analyzed]
Station number
Town Water bodyStrontium
(ppm)Tin
(ppm)Titanium
(%)Tungsten
(ppm)Vanadium
(ppm)Yttrium (ppm)
Zinc (ppm)
Zirconium (ppm)
1 Medford Lower Mystic Lake 14 <10 0.07 10 34 5.1 110 3.42 Arlington .....do. 38 <10 .07 <10 85 14 2,000 3.03 .....do. .....do. 35 <10 .05 <10 78 13 1,700 2.84 Medford .....do. 35 <10 .06 <10 82 13 2,000 3.05 Arlington .....do. 32 11 .07 <10 64 11 740 3.3
6 .....do. .....do. 92 <10 .06 <10 66 11 970 4.67 .....do. .....do. 66 25 .11 <10 140 22 2,200 7.78 Medford Upper Mystic River 19 <10 .09 <10 38 6.9 130 3.09 .....do. .....do. 14 <10 .06 <10 25 6.1 430 2.310 .....do. .....do. 20 <10 .07 <10 37 8.1 690 3.1
11 Cambridge Alewife Brook 21 <10 .05 <10 34 7.2 430 3.312 .....do. .....do. 15 12 .04 <10 26 5.2 220 2.613 Somerville .....do. 16 <10 .04 <10 44 5.3 210 3.514 .....do. .....do. 19 13 .05 <10 46 7.0 390 3.015 .....do. .....do. 20 <10 .04 <10 36 7.0 380 2.6
16 .....do. Upper Mystic River 32 13 .06 <10 53 11 760 4.217 Medford .....do. 15 <10 .06 <10 36 6.5 130 3.218 .....do. .....do. 13 <10 .04 <10 21 4.7 180 1.819 .....do. .....do. 17 <10 .06 <10 32 7.1 330 2.820 .....do. .....do. 18 <10 .05 <10 27 6.0 240 3.0
21 .....do. .....do. 12 <10 .04 <10 27 5.0 140 2.522 .....do. .....do. 20 <10 .08 <10 36 7.9 320 3.823 .....do. .....do. 30 14 .06 <10 51 11 780 4.224 .....do. .....do. 24 <10 .10 <10 49 11 95 8.325 .....do. .....do. 21 <10 .06 <10 35 7.5 330 4.3
26 .....do. .....do. 32 15 .06 <10 58 11 790 4.427 .....do. .....do. 13 <10 .03 <10 19 3.9 230 2.428 .....do. .....do. 17 <10 .04 <10 29 5.5 280 2.529 .....do. .....do. 32 23 .06 <10 53 9.9 790 4.530 .....do. .....do. 32 15 .06 <10 58 11 880 5.1
31 .....do. .....do. 37 18 .07 <10 67 12 930 6.132 .....do. .....do. 12 14 .03 <10 24 4.4 260 2.833 .....do. .....do. 26 <10 .06 <10 42 9.6 420 5.234 .....do. .....do. 36 18 .07 <10 65 14 900 7.835 .....do. .....do. 36 18 .06 <10 67 12 1,100 7.1
Tables 3–� ��
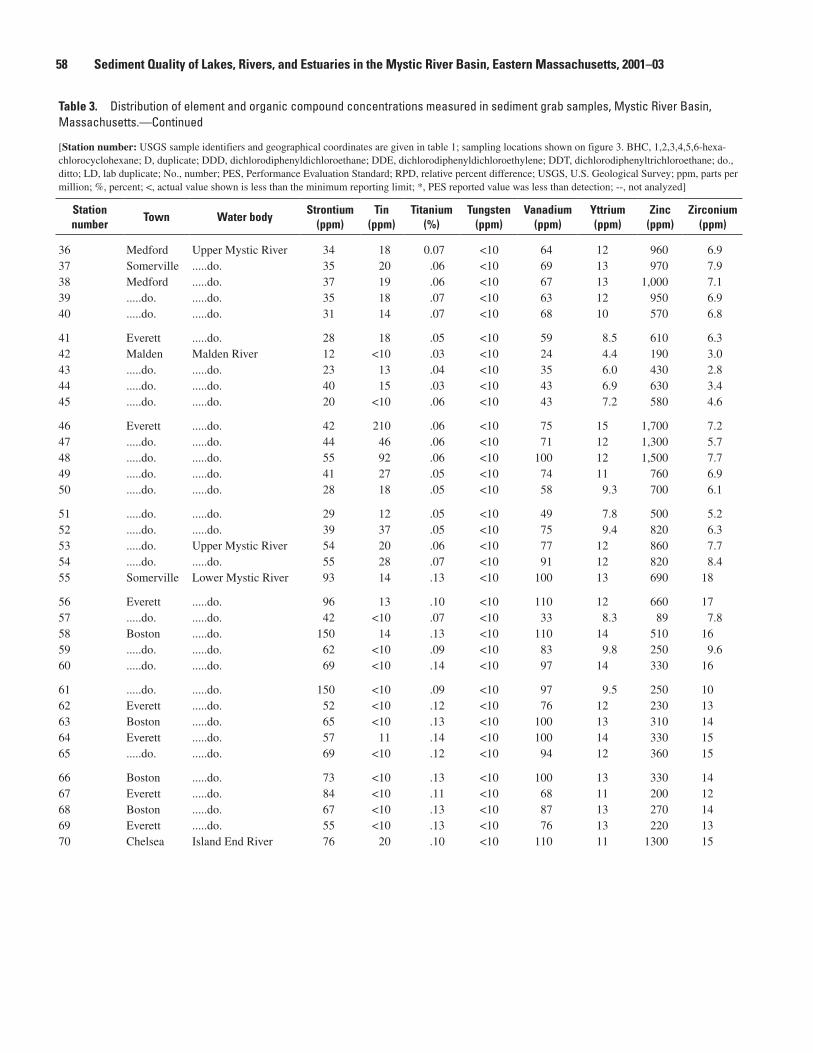
�� Sediment Quality of Lakes, Rivers, and Estuaries in the Mystic River Basin, Eastern Massachusetts, 2001–03
Table 3. Distribution of element and organic compound concentrations measured in sediment grab samples, Mystic River Basin, Massachusetts.—Continued
[Station number: USGS sample identifiers and geographical coordinates are given in table 1; sampling locations shown on figure 3. BHC, 1,2,3,4,5,6-hexa-chlorocyclohexane; D, duplicate; DDD, dichlorodiphenyldichloroethane; DDE, dichlorodiphenyldichloroethylene; DDT, dichlorodiphenyltrichloroethane; do., ditto; LD, lab duplicate; No., number; PES, Performance Evaluation Standard; RPD, relative percent difference; USGS, U.S. Geological Survey; ppm, parts per million; %, percent; <, actual value shown is less than the minimum reporting limit; *, PES reported value was less than detection; --, not analyzed]
Station number
Town Water bodyStrontium
(ppm)Tin
(ppm)Titanium
(%)Tungsten
(ppm)Vanadium
(ppm)Yttrium (ppm)
Zinc (ppm)
Zirconium (ppm)
36 Medford Upper Mystic River 34 18 0.07 <10 64 12 960 6.937 Somerville .....do. 35 20 .06 <10 69 13 970 7.938 Medford .....do. 37 19 .06 <10 67 13 1,000 7.139 .....do. .....do. 35 18 .07 <10 63 12 950 6.940 .....do. .....do. 31 14 .07 <10 68 10 570 6.8
41 Everett .....do. 28 18 .05 <10 59 8.5 610 6.342 Malden Malden River 12 <10 .03 <10 24 4.4 190 3.043 .....do. .....do. 23 13 .04 <10 35 6.0 430 2.844 .....do. .....do. 40 15 .03 <10 43 6.9 630 3.445 .....do. .....do. 20 <10 .06 <10 43 7.2 580 4.6
46 Everett .....do. 42 210 .06 <10 75 15 1,700 7.247 .....do. .....do. 44 46 .06 <10 71 12 1,300 5.748 .....do. .....do. 55 92 .06 <10 100 12 1,500 7.749 .....do. .....do. 41 27 .05 <10 74 11 760 6.950 .....do. .....do. 28 18 .05 <10 58 9.3 700 6.1
51 .....do. .....do. 29 12 .05 <10 49 7.8 500 5.252 .....do. .....do. 39 37 .05 <10 75 9.4 820 6.353 .....do. Upper Mystic River 54 20 .06 <10 77 12 860 7.754 .....do. .....do. 55 28 .07 <10 91 12 820 8.455 Somerville Lower Mystic River 93 14 .13 <10 100 13 690 18
56 Everett .....do. 96 13 .10 <10 110 12 660 1757 .....do. .....do. 42 <10 .07 <10 33 8.3 89 7.858 Boston .....do. 150 14 .13 <10 110 14 510 1659 .....do. .....do. 62 <10 .09 <10 83 9.8 250 9.660 .....do. .....do. 69 <10 .14 <10 97 14 330 16
61 .....do. .....do. 150 <10 .09 <10 97 9.5 250 1062 Everett .....do. 52 <10 .12 <10 76 12 230 1363 Boston .....do. 65 <10 .13 <10 100 13 310 1464 Everett .....do. 57 11 .14 <10 100 14 330 1565 .....do. .....do. 69 <10 .12 <10 94 12 360 15
66 Boston .....do. 73 <10 .13 <10 100 13 330 1467 Everett .....do. 84 <10 .11 <10 68 11 200 1268 Boston .....do. 67 <10 .13 <10 87 13 270 1469 Everett .....do. 55 <10 .13 <10 76 13 220 1370 Chelsea Island End River 76 20 .10 <10 110 11 1300 15
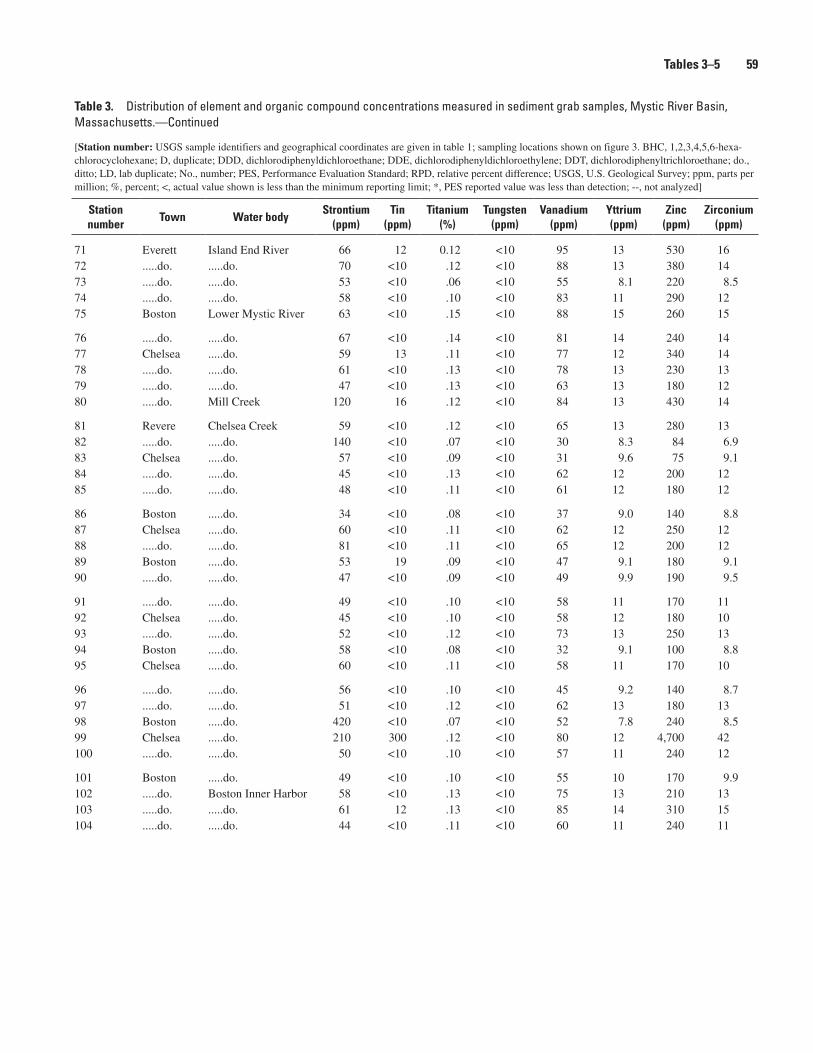
Table 3. Distribution of element and organic compound concentrations measured in sediment grab samples, Mystic River Basin, Massachusetts.—Continued
[Station number: USGS sample identifiers and geographical coordinates are given in table 1; sampling locations shown on figure 3. BHC, 1,2,3,4,5,6-hexa-chlorocyclohexane; D, duplicate; DDD, dichlorodiphenyldichloroethane; DDE, dichlorodiphenyldichloroethylene; DDT, dichlorodiphenyltrichloroethane; do., ditto; LD, lab duplicate; No., number; PES, Performance Evaluation Standard; RPD, relative percent difference; USGS, U.S. Geological Survey; ppm, parts per million; %, percent; <, actual value shown is less than the minimum reporting limit; *, PES reported value was less than detection; --, not analyzed]
Station number
Town Water bodyStrontium
(ppm)Tin
(ppm)Titanium
(%)Tungsten
(ppm)Vanadium
(ppm)Yttrium (ppm)
Zinc (ppm)
Zirconium (ppm)
71 Everett Island End River 66 12 0.12 <10 95 13 530 1672 .....do. .....do. 70 <10 .12 <10 88 13 380 1473 .....do. .....do. 53 <10 .06 <10 55 8.1 220 8.574 .....do. .....do. 58 <10 .10 <10 83 11 290 1275 Boston Lower Mystic River 63 <10 .15 <10 88 15 260 15
76 .....do. .....do. 67 <10 .14 <10 81 14 240 1477 Chelsea .....do. 59 13 .11 <10 77 12 340 1478 .....do. .....do. 61 <10 .13 <10 78 13 230 1379 .....do. .....do. 47 <10 .13 <10 63 13 180 1280 .....do. Mill Creek 120 16 .12 <10 84 13 430 14
81 Revere Chelsea Creek 59 <10 .12 <10 65 13 280 1382 .....do. .....do. 140 <10 .07 <10 30 8.3 84 6.983 Chelsea .....do. 57 <10 .09 <10 31 9.6 75 9.184 .....do. .....do. 45 <10 .13 <10 62 12 200 1285 .....do. .....do. 48 <10 .11 <10 61 12 180 12
86 Boston .....do. 34 <10 .08 <10 37 9.0 140 8.887 Chelsea .....do. 60 <10 .11 <10 62 12 250 1288 .....do. .....do. 81 <10 .11 <10 65 12 200 1289 Boston .....do. 53 19 .09 <10 47 9.1 180 9.190 .....do. .....do. 47 <10 .09 <10 49 9.9 190 9.5
91 .....do. .....do. 49 <10 .10 <10 58 11 170 1192 Chelsea .....do. 45 <10 .10 <10 58 12 180 1093 .....do. .....do. 52 <10 .12 <10 73 13 250 1394 Boston .....do. 58 <10 .08 <10 32 9.1 100 8.895 Chelsea .....do. 60 <10 .11 <10 58 11 170 10
96 .....do. .....do. 56 <10 .10 <10 45 9.2 140 8.797 .....do. .....do. 51 <10 .12 <10 62 13 180 1398 Boston .....do. 420 <10 .07 <10 52 7.8 240 8.599 Chelsea .....do. 210 300 .12 <10 80 12 4,700 42100 .....do. .....do. 50 <10 .10 <10 57 11 240 12
101 Boston .....do. 49 <10 .10 <10 55 10 170 9.9102 .....do. Boston Inner Harbor 58 <10 .13 <10 75 13 210 13103 .....do. .....do. 61 12 .13 <10 85 14 310 15104 .....do. .....do. 44 <10 .11 <10 60 11 240 11
Tables 3–� ��
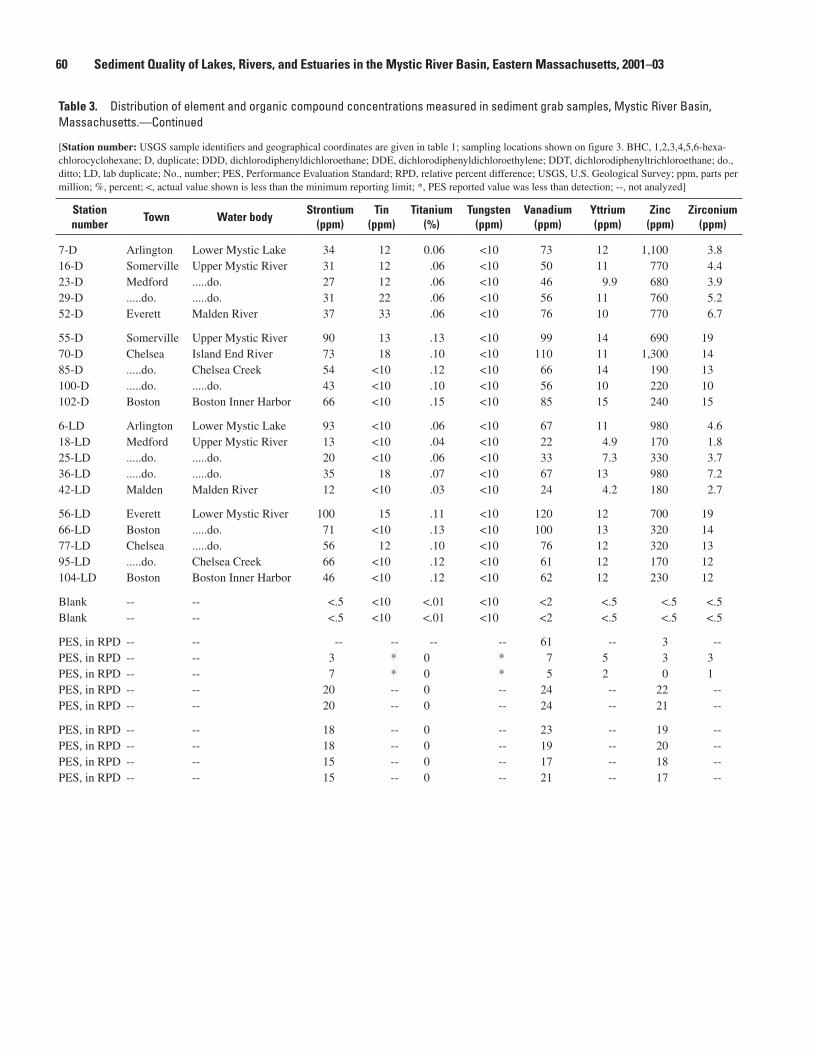
�0 Sediment Quality of Lakes, Rivers, and Estuaries in the Mystic River Basin, Eastern Massachusetts, 2001–03
Table 3. Distribution of element and organic compound concentrations measured in sediment grab samples, Mystic River Basin, Massachusetts.—Continued
[Station number: USGS sample identifiers and geographical coordinates are given in table 1; sampling locations shown on figure 3. BHC, 1,2,3,4,5,6-hexa-chlorocyclohexane; D, duplicate; DDD, dichlorodiphenyldichloroethane; DDE, dichlorodiphenyldichloroethylene; DDT, dichlorodiphenyltrichloroethane; do., ditto; LD, lab duplicate; No., number; PES, Performance Evaluation Standard; RPD, relative percent difference; USGS, U.S. Geological Survey; ppm, parts per million; %, percent; <, actual value shown is less than the minimum reporting limit; *, PES reported value was less than detection; --, not analyzed]
Station number
Town Water bodyStrontium
(ppm)Tin
(ppm)Titanium
(%)Tungsten
(ppm)Vanadium
(ppm)Yttrium (ppm)
Zinc (ppm)
Zirconium (ppm)
7-D Arlington Lower Mystic Lake 34 12 0.06 <10 73 12 1,100 3.816-D Somerville Upper Mystic River 31 12 .06 <10 50 11 770 4.423-D Medford .....do. 27 12 .06 <10 46 9.9 680 3.929-D .....do. .....do. 31 22 .06 <10 56 11 760 5.252-D Everett Malden River 37 33 .06 <10 76 10 770 6.7
55-D Somerville Upper Mystic River 90 13 .13 <10 99 14 690 1970-D Chelsea Island End River 73 18 .10 <10 110 11 1,300 1485-D .....do. Chelsea Creek 54 <10 .12 <10 66 14 190 13100-D .....do. .....do. 43 <10 .10 <10 56 10 220 10102-D Boston Boston Inner Harbor 66 <10 .15 <10 85 15 240 15
6-LD Arlington Lower Mystic Lake 93 <10 .06 <10 67 11 980 4.618-LD Medford Upper Mystic River 13 <10 .04 <10 22 4.9 170 1.825-LD .....do. .....do. 20 <10 .06 <10 33 7.3 330 3.736-LD .....do. .....do. 35 18 .07 <10 67 13 980 7.242-LD Malden Malden River 12 <10 .03 <10 24 4.2 180 2.7
56-LD Everett Lower Mystic River 100 15 .11 <10 120 12 700 1966-LD Boston .....do. 71 <10 .13 <10 100 13 320 1477-LD Chelsea .....do. 56 12 .10 <10 76 12 320 1395-LD .....do. Chelsea Creek 66 <10 .12 <10 61 12 170 12104-LD Boston Boston Inner Harbor 46 <10 .12 <10 62 12 230 12
Blank -- -- <.5 <10 <.01 <10 <2 <.5 <.5 <.5Blank -- -- <.5 <10 <.01 <10 <2 <.5 <.5 <.5
PES, in RPD -- -- -- -- -- -- 61 -- 3 --PES, in RPD -- -- 3 * 0 * 7 5 3 3PES, in RPD -- -- 7 * 0 * 5 2 0 1PES, in RPD -- -- 20 -- 0 -- 24 -- 22 --PES, in RPD -- -- 20 -- 0 -- 24 -- 21 --
PES, in RPD -- -- 18 -- 0 -- 23 -- 19 --PES, in RPD -- -- 18 -- 0 -- 19 -- 20 --PES, in RPD -- -- 15 -- 0 -- 17 -- 18 --PES, in RPD -- -- 15 -- 0 -- 21 -- 17 --
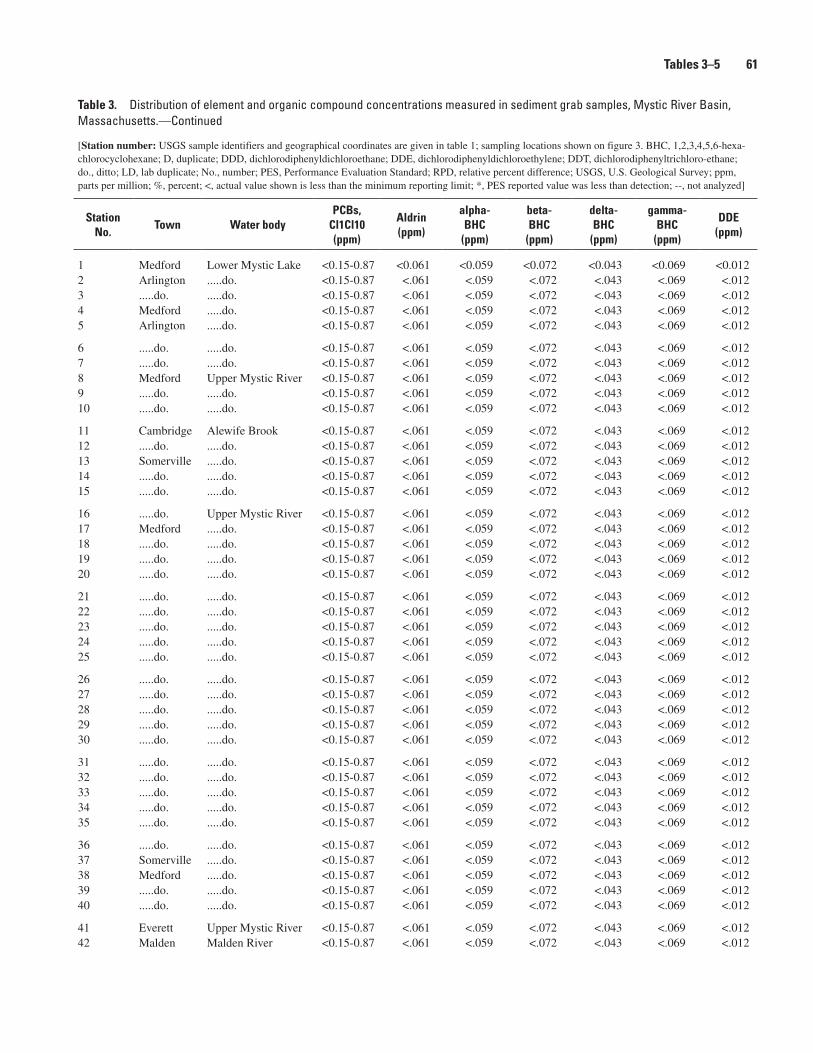
Table 3. Distribution of element and organic compound concentrations measured in sediment grab samples, Mystic River Basin, Massachusetts.—Continued
[Station number: USGS sample identifiers and geographical coordinates are given in table 1; sampling locations shown on figure 3. BHC, 1,2,3,4,5,6-hexa-chlorocyclohexane; D, duplicate; DDD, dichlorodiphenyldichloroethane; DDE, dichlorodiphenyldichloroethylene; DDT, dichlorodiphenyltrichloro-ethane; do., ditto; LD, lab duplicate; No., number; PES, Performance Evaluation Standard; RPD, relative percent difference; USGS, U.S. Geological Survey; ppm, parts per million; %, percent; <, actual value shown is less than the minimum reporting limit; *, PES reported value was less than detection; --, not analyzed]
Station No.
Town Water bodyPCBs,
Cl1Cl10 (ppm)
Aldrin (ppm)
alpha- BHC
(ppm)
beta- BHC
(ppm)
delta- BHC
(ppm)
gamma- BHC
(ppm)
DDE (ppm)
1 Medford Lower Mystic Lake <0.15-0.87 <0.061 <0.059 <0.072 <0.043 <0.069 <0.0122 Arlington .....do. <0.15-0.87 <.061 <.059 <.072 <.043 <.069 <.0123 .....do. .....do. <0.15-0.87 <.061 <.059 <.072 <.043 <.069 <.0124 Medford .....do. <0.15-0.87 <.061 <.059 <.072 <.043 <.069 <.0125 Arlington .....do. <0.15-0.87 <.061 <.059 <.072 <.043 <.069 <.012
6 .....do. .....do. <0.15-0.87 <.061 <.059 <.072 <.043 <.069 <.0127 .....do. .....do. <0.15-0.87 <.061 <.059 <.072 <.043 <.069 <.0128 Medford Upper Mystic River <0.15-0.87 <.061 <.059 <.072 <.043 <.069 <.0129 .....do. .....do. <0.15-0.87 <.061 <.059 <.072 <.043 <.069 <.01210 .....do. .....do. <0.15-0.87 <.061 <.059 <.072 <.043 <.069 <.012
11 Cambridge Alewife Brook <0.15-0.87 <.061 <.059 <.072 <.043 <.069 <.01212 .....do. .....do. <0.15-0.87 <.061 <.059 <.072 <.043 <.069 <.01213 Somerville .....do. <0.15-0.87 <.061 <.059 <.072 <.043 <.069 <.01214 .....do. .....do. <0.15-0.87 <.061 <.059 <.072 <.043 <.069 <.01215 .....do. .....do. <0.15-0.87 <.061 <.059 <.072 <.043 <.069 <.012
16 .....do. Upper Mystic River <0.15-0.87 <.061 <.059 <.072 <.043 <.069 <.01217 Medford .....do. <0.15-0.87 <.061 <.059 <.072 <.043 <.069 <.01218 .....do. .....do. <0.15-0.87 <.061 <.059 <.072 <.043 <.069 <.01219 .....do. .....do. <0.15-0.87 <.061 <.059 <.072 <.043 <.069 <.01220 .....do. .....do. <0.15-0.87 <.061 <.059 <.072 <.043 <.069 <.012
21 .....do. .....do. <0.15-0.87 <.061 <.059 <.072 <.043 <.069 <.01222 .....do. .....do. <0.15-0.87 <.061 <.059 <.072 <.043 <.069 <.01223 .....do. .....do. <0.15-0.87 <.061 <.059 <.072 <.043 <.069 <.01224 .....do. .....do. <0.15-0.87 <.061 <.059 <.072 <.043 <.069 <.01225 .....do. .....do. <0.15-0.87 <.061 <.059 <.072 <.043 <.069 <.012
26 .....do. .....do. <0.15-0.87 <.061 <.059 <.072 <.043 <.069 <.01227 .....do. .....do. <0.15-0.87 <.061 <.059 <.072 <.043 <.069 <.01228 .....do. .....do. <0.15-0.87 <.061 <.059 <.072 <.043 <.069 <.01229 .....do. .....do. <0.15-0.87 <.061 <.059 <.072 <.043 <.069 <.01230 .....do. .....do. <0.15-0.87 <.061 <.059 <.072 <.043 <.069 <.012
31 .....do. .....do. <0.15-0.87 <.061 <.059 <.072 <.043 <.069 <.01232 .....do. .....do. <0.15-0.87 <.061 <.059 <.072 <.043 <.069 <.01233 .....do. .....do. <0.15-0.87 <.061 <.059 <.072 <.043 <.069 <.01234 .....do. .....do. <0.15-0.87 <.061 <.059 <.072 <.043 <.069 <.01235 .....do. .....do. <0.15-0.87 <.061 <.059 <.072 <.043 <.069 <.012
36 .....do. .....do. <0.15-0.87 <.061 <.059 <.072 <.043 <.069 <.01237 Somerville .....do. <0.15-0.87 <.061 <.059 <.072 <.043 <.069 <.01238 Medford .....do. <0.15-0.87 <.061 <.059 <.072 <.043 <.069 <.01239 .....do. .....do. <0.15-0.87 <.061 <.059 <.072 <.043 <.069 <.01240 .....do. .....do. <0.15-0.87 <.061 <.059 <.072 <.043 <.069 <.012
41 Everett Upper Mystic River <0.15-0.87 <.061 <.059 <.072 <.043 <.069 <.01242 Malden Malden River <0.15-0.87 <.061 <.059 <.072 <.043 <.069 <.012
Tables 3–� �1
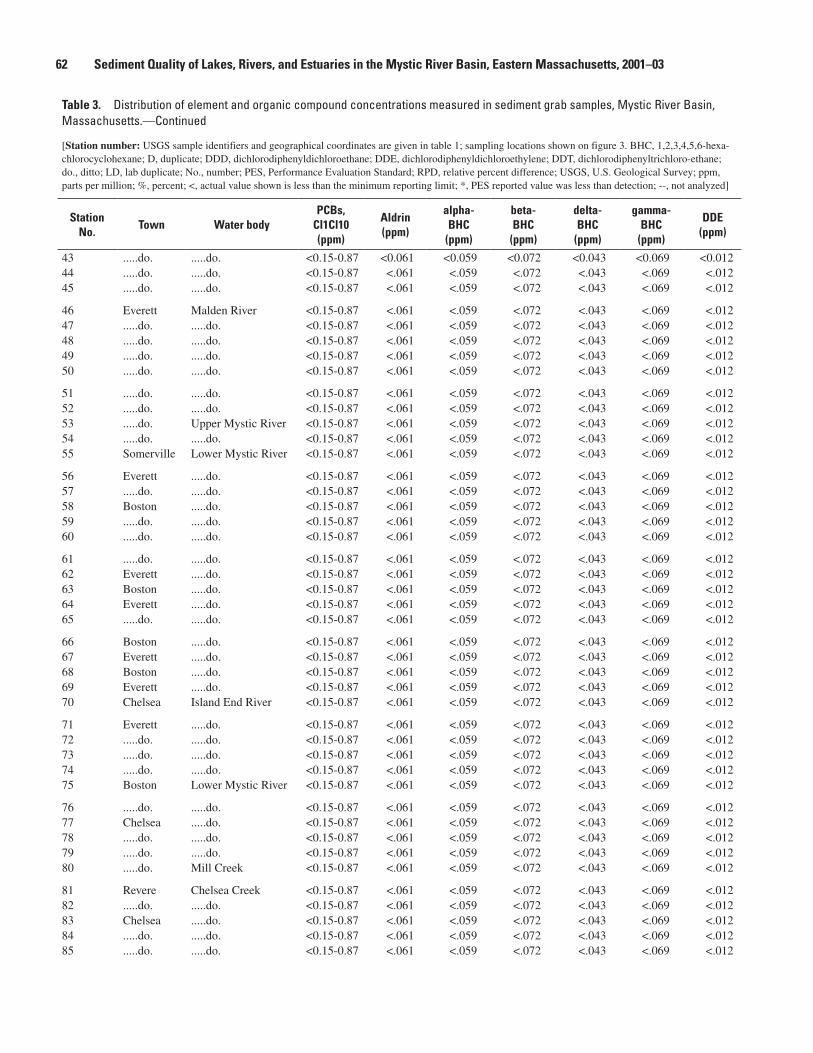
�2 Sediment Quality of Lakes, Rivers, and Estuaries in the Mystic River Basin, Eastern Massachusetts, 2001–03
Table 3. Distribution of element and organic compound concentrations measured in sediment grab samples, Mystic River Basin, Massachusetts.—Continued
[Station number: USGS sample identifiers and geographical coordinates are given in table 1; sampling locations shown on figure 3. BHC, 1,2,3,4,5,6-hexa-chlorocyclohexane; D, duplicate; DDD, dichlorodiphenyldichloroethane; DDE, dichlorodiphenyldichloroethylene; DDT, dichlorodiphenyltrichloro-ethane; do., ditto; LD, lab duplicate; No., number; PES, Performance Evaluation Standard; RPD, relative percent difference; USGS, U.S. Geological Survey; ppm, parts per million; %, percent; <, actual value shown is less than the minimum reporting limit; *, PES reported value was less than detection; --, not analyzed]
Station No.
Town Water bodyPCBs,
Cl1Cl10 (ppm)
Aldrin (ppm)
alpha- BHC
(ppm)
beta- BHC
(ppm)
delta- BHC
(ppm)
gamma- BHC
(ppm)
DDE (ppm)
43 .....do. .....do. <0.15-0.87 <0.061 <0.059 <0.072 <0.043 <0.069 <0.01244 .....do. .....do. <0.15-0.87 <.061 <.059 <.072 <.043 <.069 <.01245 .....do. .....do. <0.15-0.87 <.061 <.059 <.072 <.043 <.069 <.012
46 Everett Malden River <0.15-0.87 <.061 <.059 <.072 <.043 <.069 <.01247 .....do. .....do. <0.15-0.87 <.061 <.059 <.072 <.043 <.069 <.01248 .....do. .....do. <0.15-0.87 <.061 <.059 <.072 <.043 <.069 <.01249 .....do. .....do. <0.15-0.87 <.061 <.059 <.072 <.043 <.069 <.01250 .....do. .....do. <0.15-0.87 <.061 <.059 <.072 <.043 <.069 <.012
51 .....do. .....do. <0.15-0.87 <.061 <.059 <.072 <.043 <.069 <.01252 .....do. .....do. <0.15-0.87 <.061 <.059 <.072 <.043 <.069 <.01253 .....do. Upper Mystic River <0.15-0.87 <.061 <.059 <.072 <.043 <.069 <.01254 .....do. .....do. <0.15-0.87 <.061 <.059 <.072 <.043 <.069 <.01255 Somerville Lower Mystic River <0.15-0.87 <.061 <.059 <.072 <.043 <.069 <.012
56 Everett .....do. <0.15-0.87 <.061 <.059 <.072 <.043 <.069 <.01257 .....do. .....do. <0.15-0.87 <.061 <.059 <.072 <.043 <.069 <.01258 Boston .....do. <0.15-0.87 <.061 <.059 <.072 <.043 <.069 <.01259 .....do. .....do. <0.15-0.87 <.061 <.059 <.072 <.043 <.069 <.01260 .....do. .....do. <0.15-0.87 <.061 <.059 <.072 <.043 <.069 <.012
61 .....do. .....do. <0.15-0.87 <.061 <.059 <.072 <.043 <.069 <.01262 Everett .....do. <0.15-0.87 <.061 <.059 <.072 <.043 <.069 <.01263 Boston .....do. <0.15-0.87 <.061 <.059 <.072 <.043 <.069 <.01264 Everett .....do. <0.15-0.87 <.061 <.059 <.072 <.043 <.069 <.01265 .....do. .....do. <0.15-0.87 <.061 <.059 <.072 <.043 <.069 <.012
66 Boston .....do. <0.15-0.87 <.061 <.059 <.072 <.043 <.069 <.01267 Everett .....do. <0.15-0.87 <.061 <.059 <.072 <.043 <.069 <.01268 Boston .....do. <0.15-0.87 <.061 <.059 <.072 <.043 <.069 <.01269 Everett .....do. <0.15-0.87 <.061 <.059 <.072 <.043 <.069 <.01270 Chelsea Island End River <0.15-0.87 <.061 <.059 <.072 <.043 <.069 <.012
71 Everett .....do. <0.15-0.87 <.061 <.059 <.072 <.043 <.069 <.01272 .....do. .....do. <0.15-0.87 <.061 <.059 <.072 <.043 <.069 <.01273 .....do. .....do. <0.15-0.87 <.061 <.059 <.072 <.043 <.069 <.01274 .....do. .....do. <0.15-0.87 <.061 <.059 <.072 <.043 <.069 <.01275 Boston Lower Mystic River <0.15-0.87 <.061 <.059 <.072 <.043 <.069 <.012
76 .....do. .....do. <0.15-0.87 <.061 <.059 <.072 <.043 <.069 <.01277 Chelsea .....do. <0.15-0.87 <.061 <.059 <.072 <.043 <.069 <.01278 .....do. .....do. <0.15-0.87 <.061 <.059 <.072 <.043 <.069 <.01279 .....do. .....do. <0.15-0.87 <.061 <.059 <.072 <.043 <.069 <.01280 .....do. Mill Creek <0.15-0.87 <.061 <.059 <.072 <.043 <.069 <.012
81 Revere Chelsea Creek <0.15-0.87 <.061 <.059 <.072 <.043 <.069 <.01282 .....do. .....do. <0.15-0.87 <.061 <.059 <.072 <.043 <.069 <.01283 Chelsea .....do. <0.15-0.87 <.061 <.059 <.072 <.043 <.069 <.01284 .....do. .....do. <0.15-0.87 <.061 <.059 <.072 <.043 <.069 <.01285 .....do. .....do. <0.15-0.87 <.061 <.059 <.072 <.043 <.069 <.012
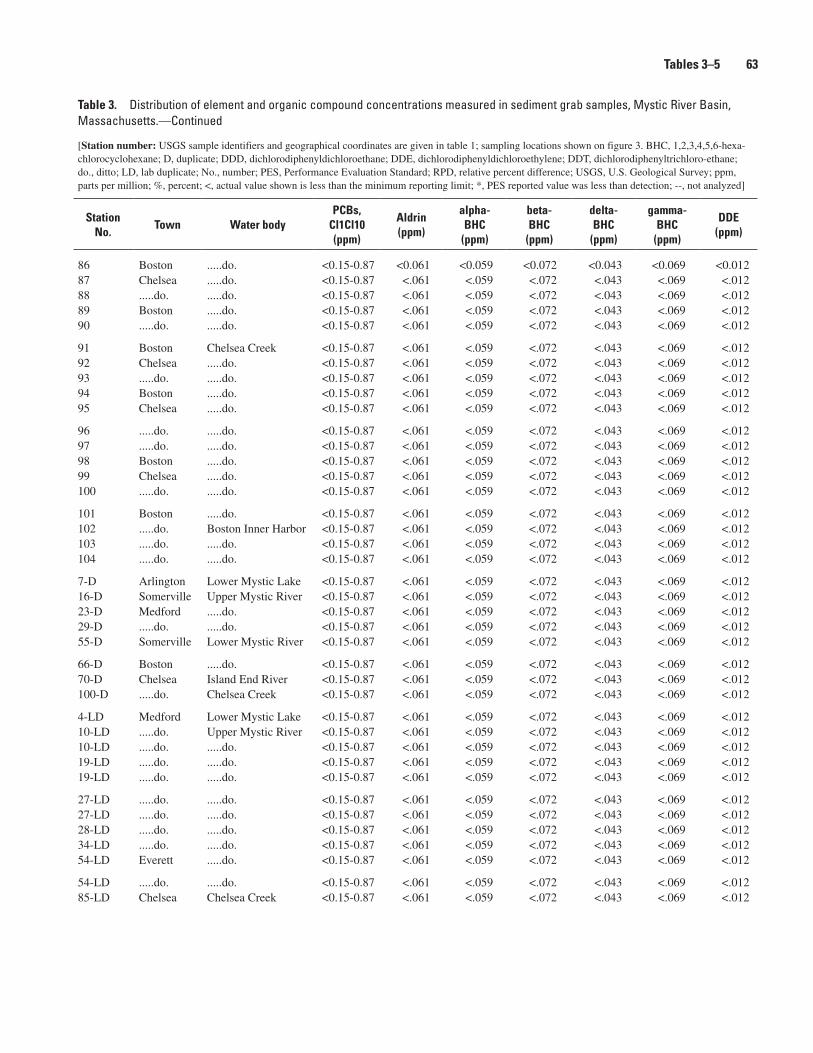
Table 3. Distribution of element and organic compound concentrations measured in sediment grab samples, Mystic River Basin, Massachusetts.—Continued
[Station number: USGS sample identifiers and geographical coordinates are given in table 1; sampling locations shown on figure 3. BHC, 1,2,3,4,5,6-hexa-chlorocyclohexane; D, duplicate; DDD, dichlorodiphenyldichloroethane; DDE, dichlorodiphenyldichloroethylene; DDT, dichlorodiphenyltrichloro-ethane; do., ditto; LD, lab duplicate; No., number; PES, Performance Evaluation Standard; RPD, relative percent difference; USGS, U.S. Geological Survey; ppm, parts per million; %, percent; <, actual value shown is less than the minimum reporting limit; *, PES reported value was less than detection; --, not analyzed]
Station No.
Town Water bodyPCBs,
Cl1Cl10 (ppm)
Aldrin (ppm)
alpha- BHC
(ppm)
beta- BHC
(ppm)
delta- BHC
(ppm)
gamma- BHC
(ppm)
DDE (ppm)
86 Boston .....do. <0.15-0.87 <0.061 <0.059 <0.072 <0.043 <0.069 <0.01287 Chelsea .....do. <0.15-0.87 <.061 <.059 <.072 <.043 <.069 <.01288 .....do. .....do. <0.15-0.87 <.061 <.059 <.072 <.043 <.069 <.01289 Boston .....do. <0.15-0.87 <.061 <.059 <.072 <.043 <.069 <.01290 .....do. .....do. <0.15-0.87 <.061 <.059 <.072 <.043 <.069 <.012
91 Boston Chelsea Creek <0.15-0.87 <.061 <.059 <.072 <.043 <.069 <.01292 Chelsea .....do. <0.15-0.87 <.061 <.059 <.072 <.043 <.069 <.01293 .....do. .....do. <0.15-0.87 <.061 <.059 <.072 <.043 <.069 <.01294 Boston .....do. <0.15-0.87 <.061 <.059 <.072 <.043 <.069 <.01295 Chelsea .....do. <0.15-0.87 <.061 <.059 <.072 <.043 <.069 <.012
96 .....do. .....do. <0.15-0.87 <.061 <.059 <.072 <.043 <.069 <.01297 .....do. .....do. <0.15-0.87 <.061 <.059 <.072 <.043 <.069 <.01298 Boston .....do. <0.15-0.87 <.061 <.059 <.072 <.043 <.069 <.01299 Chelsea .....do. <0.15-0.87 <.061 <.059 <.072 <.043 <.069 <.012100 .....do. .....do. <0.15-0.87 <.061 <.059 <.072 <.043 <.069 <.012
101 Boston .....do. <0.15-0.87 <.061 <.059 <.072 <.043 <.069 <.012102 .....do. Boston Inner Harbor <0.15-0.87 <.061 <.059 <.072 <.043 <.069 <.012103 .....do. .....do. <0.15-0.87 <.061 <.059 <.072 <.043 <.069 <.012104 .....do. .....do. <0.15-0.87 <.061 <.059 <.072 <.043 <.069 <.012
7-D Arlington Lower Mystic Lake <0.15-0.87 <.061 <.059 <.072 <.043 <.069 <.01216-D Somerville Upper Mystic River <0.15-0.87 <.061 <.059 <.072 <.043 <.069 <.01223-D Medford .....do. <0.15-0.87 <.061 <.059 <.072 <.043 <.069 <.01229-D .....do. .....do. <0.15-0.87 <.061 <.059 <.072 <.043 <.069 <.01255-D Somerville Lower Mystic River <0.15-0.87 <.061 <.059 <.072 <.043 <.069 <.012
66-D Boston .....do. <0.15-0.87 <.061 <.059 <.072 <.043 <.069 <.01270-D Chelsea Island End River <0.15-0.87 <.061 <.059 <.072 <.043 <.069 <.012100-D .....do. Chelsea Creek <0.15-0.87 <.061 <.059 <.072 <.043 <.069 <.012
4-LD Medford Lower Mystic Lake <0.15-0.87 <.061 <.059 <.072 <.043 <.069 <.01210-LD .....do. Upper Mystic River <0.15-0.87 <.061 <.059 <.072 <.043 <.069 <.01210-LD .....do. .....do. <0.15-0.87 <.061 <.059 <.072 <.043 <.069 <.01219-LD .....do. .....do. <0.15-0.87 <.061 <.059 <.072 <.043 <.069 <.01219-LD .....do. .....do. <0.15-0.87 <.061 <.059 <.072 <.043 <.069 <.012
27-LD .....do. .....do. <0.15-0.87 <.061 <.059 <.072 <.043 <.069 <.01227-LD .....do. .....do. <0.15-0.87 <.061 <.059 <.072 <.043 <.069 <.01228-LD .....do. .....do. <0.15-0.87 <.061 <.059 <.072 <.043 <.069 <.01234-LD .....do. .....do. <0.15-0.87 <.061 <.059 <.072 <.043 <.069 <.01254-LD Everett .....do. <0.15-0.87 <.061 <.059 <.072 <.043 <.069 <.012
54-LD .....do. .....do. <0.15-0.87 <.061 <.059 <.072 <.043 <.069 <.01285-LD Chelsea Chelsea Creek <0.15-0.87 <.061 <.059 <.072 <.043 <.069 <.012
Tables 3–� �3
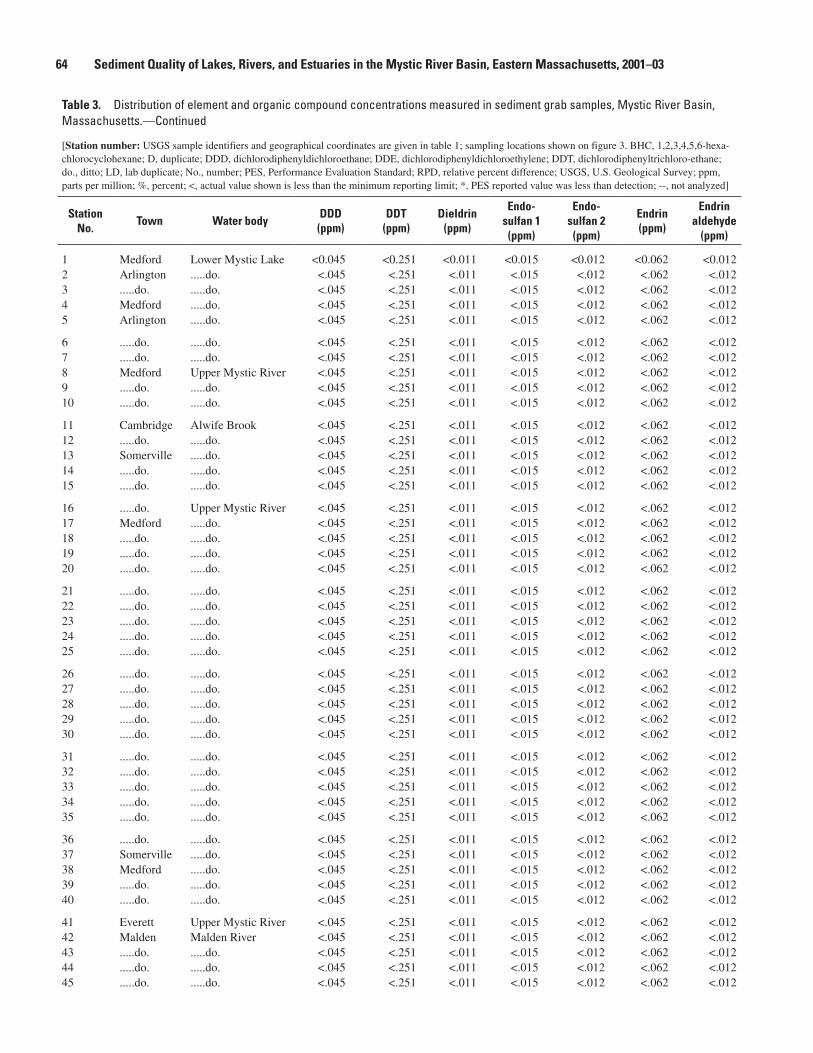
�� Sediment Quality of Lakes, Rivers, and Estuaries in the Mystic River Basin, Eastern Massachusetts, 2001–03
Table 3. Distribution of element and organic compound concentrations measured in sediment grab samples, Mystic River Basin, Massachusetts.—Continued
[Station number: USGS sample identifiers and geographical coordinates are given in table 1; sampling locations shown on figure 3. BHC, 1,2,3,4,5,6-hexa-chlorocyclohexane; D, duplicate; DDD, dichlorodiphenyldichloroethane; DDE, dichlorodiphenyldichloroethylene; DDT, dichlorodiphenyltrichloro-ethane; do., ditto; LD, lab duplicate; No., number; PES, Performance Evaluation Standard; RPD, relative percent difference; USGS, U.S. Geological Survey; ppm, parts per million; %, percent; <, actual value shown is less than the minimum reporting limit; *, PES reported value was less than detection; --, not analyzed]
Station No.
Town Water bodyDDD
(ppm)DDT
(ppm)Dieldrin
(ppm)
Endo- sulfan 1 (ppm)
Endo- sulfan 2 (ppm)
Endrin (ppm)
Endrin aldehyde
(ppm)
1 Medford Lower Mystic Lake <0.045 <0.251 <0.011 <0.015 <0.012 <0.062 <0.0122 Arlington .....do. <.045 <.251 <.011 <.015 <.012 <.062 <.0123 .....do. .....do. <.045 <.251 <.011 <.015 <.012 <.062 <.0124 Medford .....do. <.045 <.251 <.011 <.015 <.012 <.062 <.0125 Arlington .....do. <.045 <.251 <.011 <.015 <.012 <.062 <.012
6 .....do. .....do. <.045 <.251 <.011 <.015 <.012 <.062 <.0127 .....do. .....do. <.045 <.251 <.011 <.015 <.012 <.062 <.0128 Medford Upper Mystic River <.045 <.251 <.011 <.015 <.012 <.062 <.0129 .....do. .....do. <.045 <.251 <.011 <.015 <.012 <.062 <.01210 .....do. .....do. <.045 <.251 <.011 <.015 <.012 <.062 <.012
11 Cambridge Alwife Brook <.045 <.251 <.011 <.015 <.012 <.062 <.01212 .....do. .....do. <.045 <.251 <.011 <.015 <.012 <.062 <.01213 Somerville .....do. <.045 <.251 <.011 <.015 <.012 <.062 <.01214 .....do. .....do. <.045 <.251 <.011 <.015 <.012 <.062 <.01215 .....do. .....do. <.045 <.251 <.011 <.015 <.012 <.062 <.012
16 .....do. Upper Mystic River <.045 <.251 <.011 <.015 <.012 <.062 <.01217 Medford .....do. <.045 <.251 <.011 <.015 <.012 <.062 <.01218 .....do. .....do. <.045 <.251 <.011 <.015 <.012 <.062 <.01219 .....do. .....do. <.045 <.251 <.011 <.015 <.012 <.062 <.01220 .....do. .....do. <.045 <.251 <.011 <.015 <.012 <.062 <.012
21 .....do. .....do. <.045 <.251 <.011 <.015 <.012 <.062 <.01222 .....do. .....do. <.045 <.251 <.011 <.015 <.012 <.062 <.01223 .....do. .....do. <.045 <.251 <.011 <.015 <.012 <.062 <.01224 .....do. .....do. <.045 <.251 <.011 <.015 <.012 <.062 <.01225 .....do. .....do. <.045 <.251 <.011 <.015 <.012 <.062 <.012
26 .....do. .....do. <.045 <.251 <.011 <.015 <.012 <.062 <.01227 .....do. .....do. <.045 <.251 <.011 <.015 <.012 <.062 <.01228 .....do. .....do. <.045 <.251 <.011 <.015 <.012 <.062 <.01229 .....do. .....do. <.045 <.251 <.011 <.015 <.012 <.062 <.01230 .....do. .....do. <.045 <.251 <.011 <.015 <.012 <.062 <.012
31 .....do. .....do. <.045 <.251 <.011 <.015 <.012 <.062 <.01232 .....do. .....do. <.045 <.251 <.011 <.015 <.012 <.062 <.01233 .....do. .....do. <.045 <.251 <.011 <.015 <.012 <.062 <.01234 .....do. .....do. <.045 <.251 <.011 <.015 <.012 <.062 <.01235 .....do. .....do. <.045 <.251 <.011 <.015 <.012 <.062 <.012
36 .....do. .....do. <.045 <.251 <.011 <.015 <.012 <.062 <.01237 Somerville .....do. <.045 <.251 <.011 <.015 <.012 <.062 <.01238 Medford .....do. <.045 <.251 <.011 <.015 <.012 <.062 <.01239 .....do. .....do. <.045 <.251 <.011 <.015 <.012 <.062 <.01240 .....do. .....do. <.045 <.251 <.011 <.015 <.012 <.062 <.012
41 Everett Upper Mystic River <.045 <.251 <.011 <.015 <.012 <.062 <.01242 Malden Malden River <.045 <.251 <.011 <.015 <.012 <.062 <.01243 .....do. .....do. <.045 <.251 <.011 <.015 <.012 <.062 <.01244 .....do. .....do. <.045 <.251 <.011 <.015 <.012 <.062 <.01245 .....do. .....do. <.045 <.251 <.011 <.015 <.012 <.062 <.012
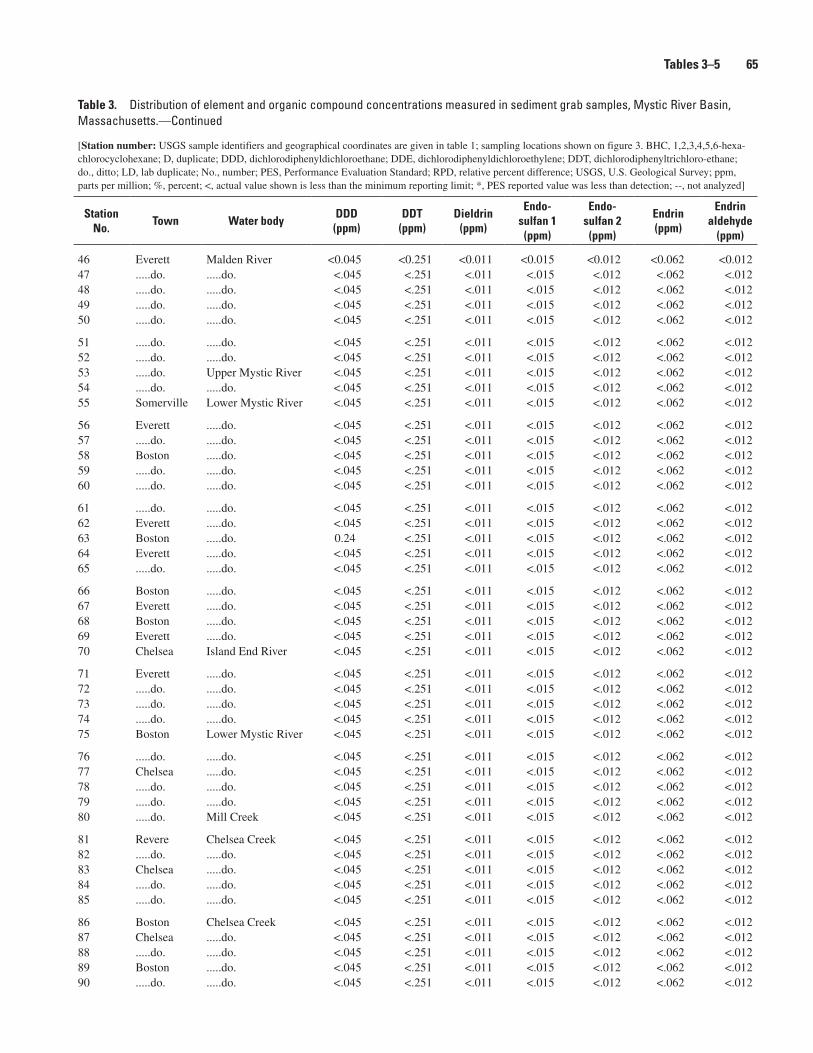
Table 3. Distribution of element and organic compound concentrations measured in sediment grab samples, Mystic River Basin, Massachusetts.—Continued
[Station number: USGS sample identifiers and geographical coordinates are given in table 1; sampling locations shown on figure 3. BHC, 1,2,3,4,5,6-hexa-chlorocyclohexane; D, duplicate; DDD, dichlorodiphenyldichloroethane; DDE, dichlorodiphenyldichloroethylene; DDT, dichlorodiphenyltrichloro-ethane; do., ditto; LD, lab duplicate; No., number; PES, Performance Evaluation Standard; RPD, relative percent difference; USGS, U.S. Geological Survey; ppm, parts per million; %, percent; <, actual value shown is less than the minimum reporting limit; *, PES reported value was less than detection; --, not analyzed]
Station No.
Town Water bodyDDD
(ppm)DDT
(ppm)Dieldrin
(ppm)
Endo- sulfan 1 (ppm)
Endo- sulfan 2 (ppm)
Endrin (ppm)
Endrin aldehyde
(ppm)
46 Everett Malden River <0.045 <0.251 <0.011 <0.015 <0.012 <0.062 <0.01247 .....do. .....do. <.045 <.251 <.011 <.015 <.012 <.062 <.01248 .....do. .....do. <.045 <.251 <.011 <.015 <.012 <.062 <.01249 .....do. .....do. <.045 <.251 <.011 <.015 <.012 <.062 <.01250 .....do. .....do. <.045 <.251 <.011 <.015 <.012 <.062 <.012
51 .....do. .....do. <.045 <.251 <.011 <.015 <.012 <.062 <.01252 .....do. .....do. <.045 <.251 <.011 <.015 <.012 <.062 <.01253 .....do. Upper Mystic River <.045 <.251 <.011 <.015 <.012 <.062 <.01254 .....do. .....do. <.045 <.251 <.011 <.015 <.012 <.062 <.01255 Somerville Lower Mystic River <.045 <.251 <.011 <.015 <.012 <.062 <.012
56 Everett .....do. <.045 <.251 <.011 <.015 <.012 <.062 <.01257 .....do. .....do. <.045 <.251 <.011 <.015 <.012 <.062 <.01258 Boston .....do. <.045 <.251 <.011 <.015 <.012 <.062 <.01259 .....do. .....do. <.045 <.251 <.011 <.015 <.012 <.062 <.01260 .....do. .....do. <.045 <.251 <.011 <.015 <.012 <.062 <.012
61 .....do. .....do. <.045 <.251 <.011 <.015 <.012 <.062 <.01262 Everett .....do. <.045 <.251 <.011 <.015 <.012 <.062 <.01263 Boston .....do. 0.24 <.251 <.011 <.015 <.012 <.062 <.01264 Everett .....do. <.045 <.251 <.011 <.015 <.012 <.062 <.01265 .....do. .....do. <.045 <.251 <.011 <.015 <.012 <.062 <.012
66 Boston .....do. <.045 <.251 <.011 <.015 <.012 <.062 <.01267 Everett .....do. <.045 <.251 <.011 <.015 <.012 <.062 <.01268 Boston .....do. <.045 <.251 <.011 <.015 <.012 <.062 <.01269 Everett .....do. <.045 <.251 <.011 <.015 <.012 <.062 <.01270 Chelsea Island End River <.045 <.251 <.011 <.015 <.012 <.062 <.012
71 Everett .....do. <.045 <.251 <.011 <.015 <.012 <.062 <.01272 .....do. .....do. <.045 <.251 <.011 <.015 <.012 <.062 <.01273 .....do. .....do. <.045 <.251 <.011 <.015 <.012 <.062 <.01274 .....do. .....do. <.045 <.251 <.011 <.015 <.012 <.062 <.01275 Boston Lower Mystic River <.045 <.251 <.011 <.015 <.012 <.062 <.012
76 .....do. .....do. <.045 <.251 <.011 <.015 <.012 <.062 <.01277 Chelsea .....do. <.045 <.251 <.011 <.015 <.012 <.062 <.01278 .....do. .....do. <.045 <.251 <.011 <.015 <.012 <.062 <.01279 .....do. .....do. <.045 <.251 <.011 <.015 <.012 <.062 <.01280 .....do. Mill Creek <.045 <.251 <.011 <.015 <.012 <.062 <.012
81 Revere Chelsea Creek <.045 <.251 <.011 <.015 <.012 <.062 <.01282 .....do. .....do. <.045 <.251 <.011 <.015 <.012 <.062 <.01283 Chelsea .....do. <.045 <.251 <.011 <.015 <.012 <.062 <.01284 .....do. .....do. <.045 <.251 <.011 <.015 <.012 <.062 <.01285 .....do. .....do. <.045 <.251 <.011 <.015 <.012 <.062 <.012
86 Boston Chelsea Creek <.045 <.251 <.011 <.015 <.012 <.062 <.01287 Chelsea .....do. <.045 <.251 <.011 <.015 <.012 <.062 <.01288 .....do. .....do. <.045 <.251 <.011 <.015 <.012 <.062 <.01289 Boston .....do. <.045 <.251 <.011 <.015 <.012 <.062 <.01290 .....do. .....do. <.045 <.251 <.011 <.015 <.012 <.062 <.012
Tables 3–� ��
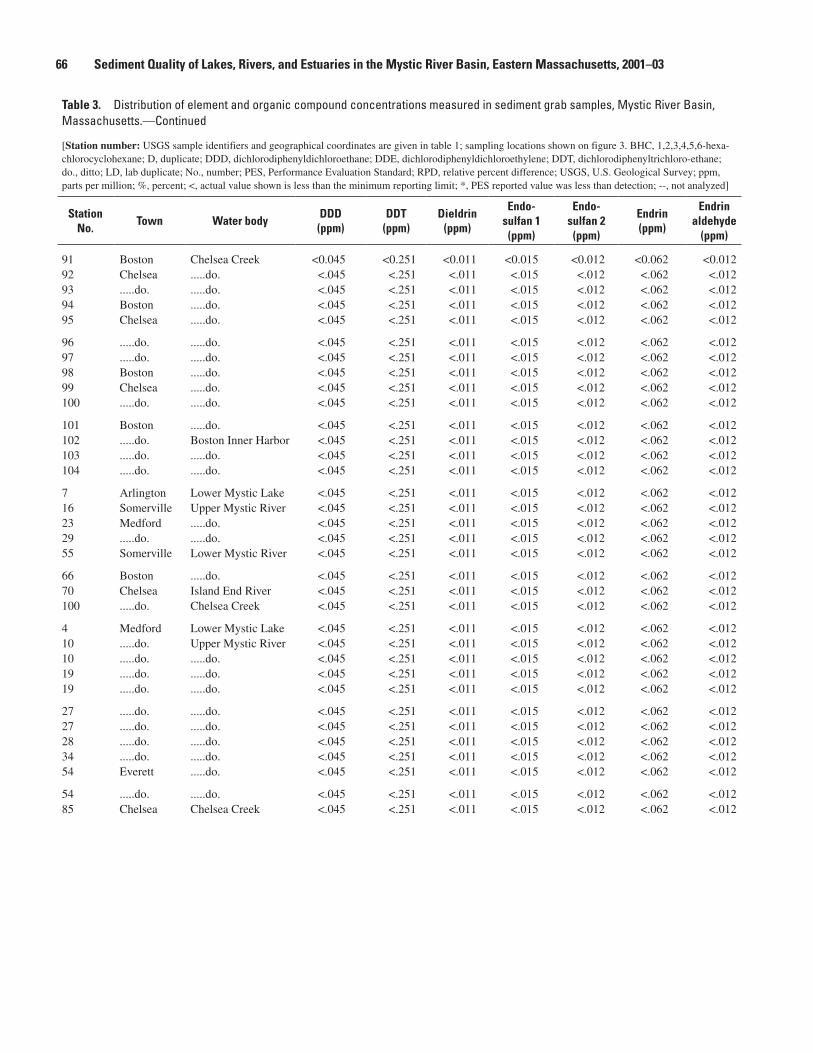
�� Sediment Quality of Lakes, Rivers, and Estuaries in the Mystic River Basin, Eastern Massachusetts, 2001–03
Table 3. Distribution of element and organic compound concentrations measured in sediment grab samples, Mystic River Basin, Massachusetts.—Continued
[Station number: USGS sample identifiers and geographical coordinates are given in table 1; sampling locations shown on figure 3. BHC, 1,2,3,4,5,6-hexa-chlorocyclohexane; D, duplicate; DDD, dichlorodiphenyldichloroethane; DDE, dichlorodiphenyldichloroethylene; DDT, dichlorodiphenyltrichloro-ethane; do., ditto; LD, lab duplicate; No., number; PES, Performance Evaluation Standard; RPD, relative percent difference; USGS, U.S. Geological Survey; ppm, parts per million; %, percent; <, actual value shown is less than the minimum reporting limit; *, PES reported value was less than detection; --, not analyzed]
Station No.
Town Water bodyDDD
(ppm)DDT
(ppm)Dieldrin
(ppm)
Endo- sulfan 1 (ppm)
Endo- sulfan 2 (ppm)
Endrin (ppm)
Endrin aldehyde
(ppm)
91 Boston Chelsea Creek <0.045 <0.251 <0.011 <0.015 <0.012 <0.062 <0.01292 Chelsea .....do. <.045 <.251 <.011 <.015 <.012 <.062 <.01293 .....do. .....do. <.045 <.251 <.011 <.015 <.012 <.062 <.01294 Boston .....do. <.045 <.251 <.011 <.015 <.012 <.062 <.01295 Chelsea .....do. <.045 <.251 <.011 <.015 <.012 <.062 <.012
96 .....do. .....do. <.045 <.251 <.011 <.015 <.012 <.062 <.01297 .....do. .....do. <.045 <.251 <.011 <.015 <.012 <.062 <.01298 Boston .....do. <.045 <.251 <.011 <.015 <.012 <.062 <.01299 Chelsea .....do. <.045 <.251 <.011 <.015 <.012 <.062 <.012100 .....do. .....do. <.045 <.251 <.011 <.015 <.012 <.062 <.012
101 Boston .....do. <.045 <.251 <.011 <.015 <.012 <.062 <.012102 .....do. Boston Inner Harbor <.045 <.251 <.011 <.015 <.012 <.062 <.012103 .....do. .....do. <.045 <.251 <.011 <.015 <.012 <.062 <.012104 .....do. .....do. <.045 <.251 <.011 <.015 <.012 <.062 <.012
7 Arlington Lower Mystic Lake <.045 <.251 <.011 <.015 <.012 <.062 <.01216 Somerville Upper Mystic River <.045 <.251 <.011 <.015 <.012 <.062 <.01223 Medford .....do. <.045 <.251 <.011 <.015 <.012 <.062 <.01229 .....do. .....do. <.045 <.251 <.011 <.015 <.012 <.062 <.01255 Somerville Lower Mystic River <.045 <.251 <.011 <.015 <.012 <.062 <.012
66 Boston .....do. <.045 <.251 <.011 <.015 <.012 <.062 <.01270 Chelsea Island End River <.045 <.251 <.011 <.015 <.012 <.062 <.012100 .....do. Chelsea Creek <.045 <.251 <.011 <.015 <.012 <.062 <.012
4 Medford Lower Mystic Lake <.045 <.251 <.011 <.015 <.012 <.062 <.01210 .....do. Upper Mystic River <.045 <.251 <.011 <.015 <.012 <.062 <.01210 .....do. .....do. <.045 <.251 <.011 <.015 <.012 <.062 <.01219 .....do. .....do. <.045 <.251 <.011 <.015 <.012 <.062 <.01219 .....do. .....do. <.045 <.251 <.011 <.015 <.012 <.062 <.012
27 .....do. .....do. <.045 <.251 <.011 <.015 <.012 <.062 <.01227 .....do. .....do. <.045 <.251 <.011 <.015 <.012 <.062 <.01228 .....do. .....do. <.045 <.251 <.011 <.015 <.012 <.062 <.01234 .....do. .....do. <.045 <.251 <.011 <.015 <.012 <.062 <.01254 Everett .....do. <.045 <.251 <.011 <.015 <.012 <.062 <.012
54 .....do. .....do. <.045 <.251 <.011 <.015 <.012 <.062 <.01285 Chelsea Chelsea Creek <.045 <.251 <.011 <.015 <.012 <.062 <.012
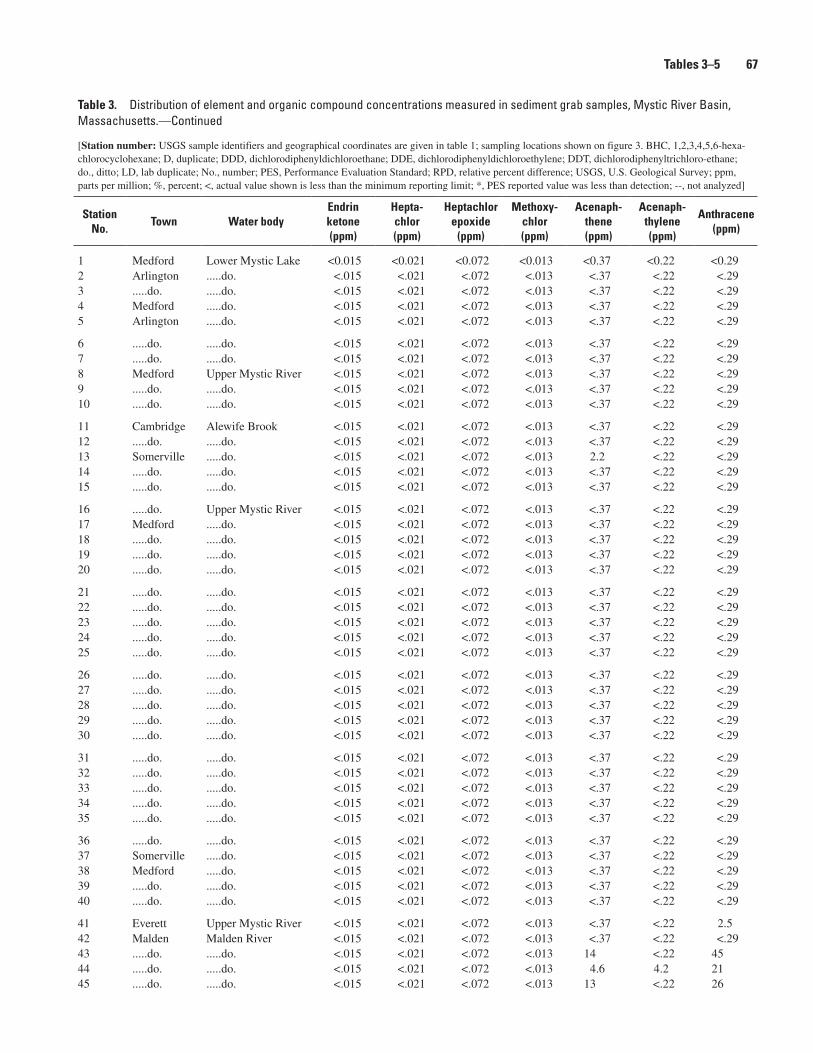
Table 3. Distribution of element and organic compound concentrations measured in sediment grab samples, Mystic River Basin, Massachusetts.—Continued
[Station number: USGS sample identifiers and geographical coordinates are given in table 1; sampling locations shown on figure 3. BHC, 1,2,3,4,5,6-hexa-chlorocyclohexane; D, duplicate; DDD, dichlorodiphenyldichloroethane; DDE, dichlorodiphenyldichloroethylene; DDT, dichlorodiphenyltrichloro-ethane; do., ditto; LD, lab duplicate; No., number; PES, Performance Evaluation Standard; RPD, relative percent difference; USGS, U.S. Geological Survey; ppm, parts per million; %, percent; <, actual value shown is less than the minimum reporting limit; *, PES reported value was less than detection; --, not analyzed]
Station No.
Town Water bodyEndrin ketone (ppm)
Hepta- chlor (ppm)
Heptachlor epoxide
(ppm)
Methoxy- chlor (ppm)
Acenaph- thene (ppm)
Acenaph- thylene (ppm)
Anthracene (ppm)
1 Medford Lower Mystic Lake <0.015 <0.021 <0.072 <0.013 <0.37 <0.22 <0.292 Arlington .....do. <.015 <.021 <.072 <.013 <.37 <.22 <.293 .....do. .....do. <.015 <.021 <.072 <.013 <.37 <.22 <.294 Medford .....do. <.015 <.021 <.072 <.013 <.37 <.22 <.295 Arlington .....do. <.015 <.021 <.072 <.013 <.37 <.22 <.29
6 .....do. .....do. <.015 <.021 <.072 <.013 <.37 <.22 <.297 .....do. .....do. <.015 <.021 <.072 <.013 <.37 <.22 <.298 Medford Upper Mystic River <.015 <.021 <.072 <.013 <.37 <.22 <.299 .....do. .....do. <.015 <.021 <.072 <.013 <.37 <.22 <.2910 .....do. .....do. <.015 <.021 <.072 <.013 <.37 <.22 <.29
11 Cambridge Alewife Brook <.015 <.021 <.072 <.013 <.37 <.22 <.2912 .....do. .....do. <.015 <.021 <.072 <.013 <.37 <.22 <.2913 Somerville .....do. <.015 <.021 <.072 <.013 2.2 <.22 <.2914 .....do. .....do. <.015 <.021 <.072 <.013 <.37 <.22 <.2915 .....do. .....do. <.015 <.021 <.072 <.013 <.37 <.22 <.29
16 .....do. Upper Mystic River <.015 <.021 <.072 <.013 <.37 <.22 <.2917 Medford .....do. <.015 <.021 <.072 <.013 <.37 <.22 <.2918 .....do. .....do. <.015 <.021 <.072 <.013 <.37 <.22 <.2919 .....do. .....do. <.015 <.021 <.072 <.013 <.37 <.22 <.2920 .....do. .....do. <.015 <.021 <.072 <.013 <.37 <.22 <.29
21 .....do. .....do. <.015 <.021 <.072 <.013 <.37 <.22 <.2922 .....do. .....do. <.015 <.021 <.072 <.013 <.37 <.22 <.2923 .....do. .....do. <.015 <.021 <.072 <.013 <.37 <.22 <.2924 .....do. .....do. <.015 <.021 <.072 <.013 <.37 <.22 <.2925 .....do. .....do. <.015 <.021 <.072 <.013 <.37 <.22 <.29
26 .....do. .....do. <.015 <.021 <.072 <.013 <.37 <.22 <.2927 .....do. .....do. <.015 <.021 <.072 <.013 <.37 <.22 <.2928 .....do. .....do. <.015 <.021 <.072 <.013 <.37 <.22 <.2929 .....do. .....do. <.015 <.021 <.072 <.013 <.37 <.22 <.2930 .....do. .....do. <.015 <.021 <.072 <.013 <.37 <.22 <.29
31 .....do. .....do. <.015 <.021 <.072 <.013 <.37 <.22 <.2932 .....do. .....do. <.015 <.021 <.072 <.013 <.37 <.22 <.2933 .....do. .....do. <.015 <.021 <.072 <.013 <.37 <.22 <.2934 .....do. .....do. <.015 <.021 <.072 <.013 <.37 <.22 <.2935 .....do. .....do. <.015 <.021 <.072 <.013 <.37 <.22 <.29
36 .....do. .....do. <.015 <.021 <.072 <.013 <.37 <.22 <.2937 Somerville .....do. <.015 <.021 <.072 <.013 <.37 <.22 <.2938 Medford .....do. <.015 <.021 <.072 <.013 <.37 <.22 <.2939 .....do. .....do. <.015 <.021 <.072 <.013 <.37 <.22 <.2940 .....do. .....do. <.015 <.021 <.072 <.013 <.37 <.22 <.29
41 Everett Upper Mystic River <.015 <.021 <.072 <.013 <.37 <.22 2.542 Malden Malden River <.015 <.021 <.072 <.013 <.37 <.22 <.2943 .....do. .....do. <.015 <.021 <.072 <.013 14 <.22 4544 .....do. .....do. <.015 <.021 <.072 <.013 4.6 4.2 2145 .....do. .....do. <.015 <.021 <.072 <.013 13 <.22 26
Tables 3–� ��
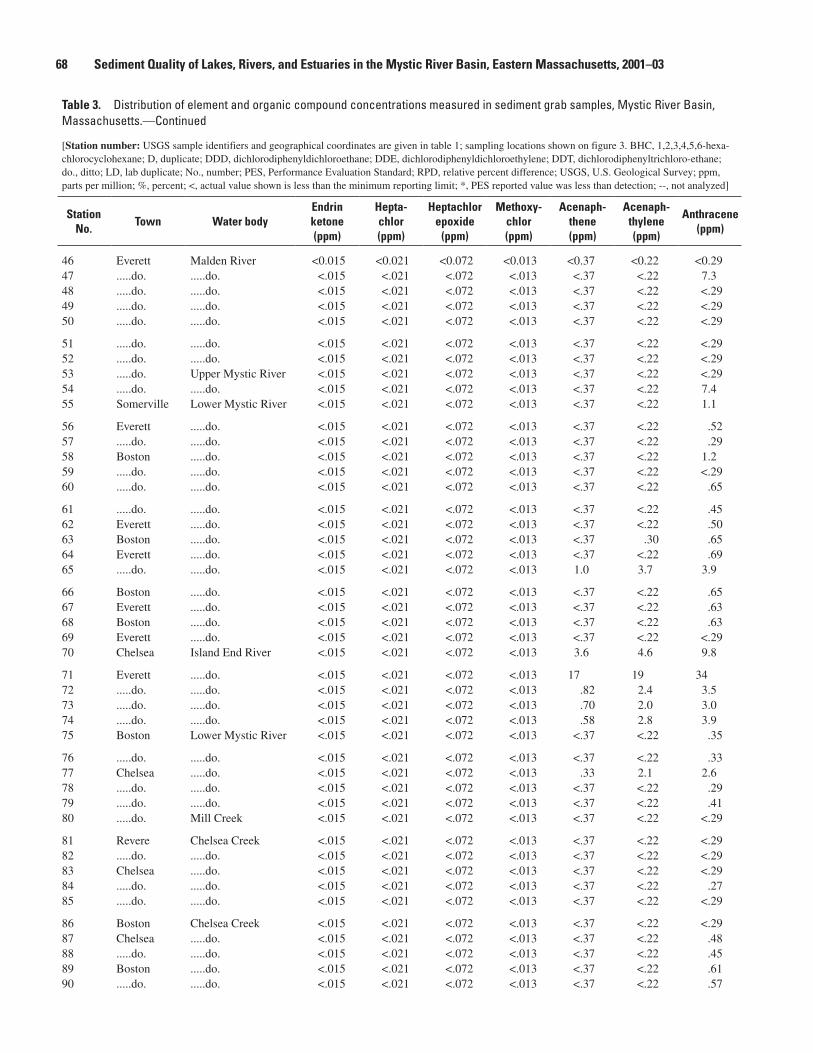
�� Sediment Quality of Lakes, Rivers, and Estuaries in the Mystic River Basin, Eastern Massachusetts, 2001–03
Table 3. Distribution of element and organic compound concentrations measured in sediment grab samples, Mystic River Basin, Massachusetts.—Continued
[Station number: USGS sample identifiers and geographical coordinates are given in table 1; sampling locations shown on figure 3. BHC, 1,2,3,4,5,6-hexa-chlorocyclohexane; D, duplicate; DDD, dichlorodiphenyldichloroethane; DDE, dichlorodiphenyldichloroethylene; DDT, dichlorodiphenyltrichloro-ethane; do., ditto; LD, lab duplicate; No., number; PES, Performance Evaluation Standard; RPD, relative percent difference; USGS, U.S. Geological Survey; ppm, parts per million; %, percent; <, actual value shown is less than the minimum reporting limit; *, PES reported value was less than detection; --, not analyzed]
Station No.
Town Water bodyEndrin ketone (ppm)
Hepta- chlor (ppm)
Heptachlor epoxide
(ppm)
Methoxy- chlor (ppm)
Acenaph- thene (ppm)
Acenaph- thylene (ppm)
Anthracene (ppm)
46 Everett Malden River <0.015 <0.021 <0.072 <0.013 <0.37 <0.22 <0.2947 .....do. .....do. <.015 <.021 <.072 <.013 <.37 <.22 7.348 .....do. .....do. <.015 <.021 <.072 <.013 <.37 <.22 <.2949 .....do. .....do. <.015 <.021 <.072 <.013 <.37 <.22 <.2950 .....do. .....do. <.015 <.021 <.072 <.013 <.37 <.22 <.29
51 .....do. .....do. <.015 <.021 <.072 <.013 <.37 <.22 <.2952 .....do. .....do. <.015 <.021 <.072 <.013 <.37 <.22 <.2953 .....do. Upper Mystic River <.015 <.021 <.072 <.013 <.37 <.22 <.2954 .....do. .....do. <.015 <.021 <.072 <.013 <.37 <.22 7.455 Somerville Lower Mystic River <.015 <.021 <.072 <.013 <.37 <.22 1.1
56 Everett .....do. <.015 <.021 <.072 <.013 <.37 <.22 .5257 .....do. .....do. <.015 <.021 <.072 <.013 <.37 <.22 .2958 Boston .....do. <.015 <.021 <.072 <.013 <.37 <.22 1.259 .....do. .....do. <.015 <.021 <.072 <.013 <.37 <.22 <.2960 .....do. .....do. <.015 <.021 <.072 <.013 <.37 <.22 .65
61 .....do. .....do. <.015 <.021 <.072 <.013 <.37 <.22 .4562 Everett .....do. <.015 <.021 <.072 <.013 <.37 <.22 .5063 Boston .....do. <.015 <.021 <.072 <.013 <.37 .30 .6564 Everett .....do. <.015 <.021 <.072 <.013 <.37 <.22 .6965 .....do. .....do. <.015 <.021 <.072 <.013 1.0 3.7 3.9
66 Boston .....do. <.015 <.021 <.072 <.013 <.37 <.22 .6567 Everett .....do. <.015 <.021 <.072 <.013 <.37 <.22 .6368 Boston .....do. <.015 <.021 <.072 <.013 <.37 <.22 .6369 Everett .....do. <.015 <.021 <.072 <.013 <.37 <.22 <.2970 Chelsea Island End River <.015 <.021 <.072 <.013 3.6 4.6 9.8
71 Everett .....do. <.015 <.021 <.072 <.013 17 19 3472 .....do. .....do. <.015 <.021 <.072 <.013 .82 2.4 3.573 .....do. .....do. <.015 <.021 <.072 <.013 .70 2.0 3.074 .....do. .....do. <.015 <.021 <.072 <.013 .58 2.8 3.975 Boston Lower Mystic River <.015 <.021 <.072 <.013 <.37 <.22 .35
76 .....do. .....do. <.015 <.021 <.072 <.013 <.37 <.22 .3377 Chelsea .....do. <.015 <.021 <.072 <.013 .33 2.1 2.678 .....do. .....do. <.015 <.021 <.072 <.013 <.37 <.22 .2979 .....do. .....do. <.015 <.021 <.072 <.013 <.37 <.22 .4180 .....do. Mill Creek <.015 <.021 <.072 <.013 <.37 <.22 <.29
81 Revere Chelsea Creek <.015 <.021 <.072 <.013 <.37 <.22 <.2982 .....do. .....do. <.015 <.021 <.072 <.013 <.37 <.22 <.2983 Chelsea .....do. <.015 <.021 <.072 <.013 <.37 <.22 <.2984 .....do. .....do. <.015 <.021 <.072 <.013 <.37 <.22 .2785 .....do. .....do. <.015 <.021 <.072 <.013 <.37 <.22 <.29
86 Boston Chelsea Creek <.015 <.021 <.072 <.013 <.37 <.22 <.2987 Chelsea .....do. <.015 <.021 <.072 <.013 <.37 <.22 .4888 .....do. .....do. <.015 <.021 <.072 <.013 <.37 <.22 .4589 Boston .....do. <.015 <.021 <.072 <.013 <.37 <.22 .6190 .....do. .....do. <.015 <.021 <.072 <.013 <.37 <.22 .57
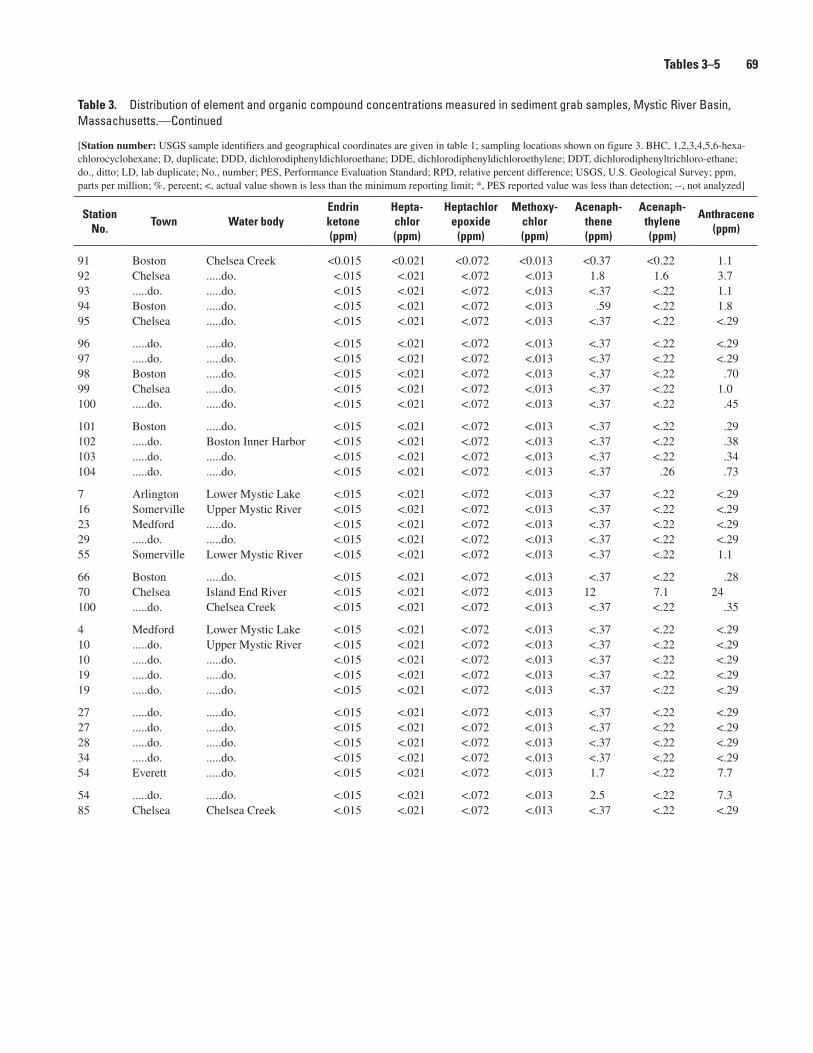
Table 3. Distribution of element and organic compound concentrations measured in sediment grab samples, Mystic River Basin, Massachusetts.—Continued
[Station number: USGS sample identifiers and geographical coordinates are given in table 1; sampling locations shown on figure 3. BHC, 1,2,3,4,5,6-hexa-chlorocyclohexane; D, duplicate; DDD, dichlorodiphenyldichloroethane; DDE, dichlorodiphenyldichloroethylene; DDT, dichlorodiphenyltrichloro-ethane; do., ditto; LD, lab duplicate; No., number; PES, Performance Evaluation Standard; RPD, relative percent difference; USGS, U.S. Geological Survey; ppm, parts per million; %, percent; <, actual value shown is less than the minimum reporting limit; *, PES reported value was less than detection; --, not analyzed]
Station No.
Town Water bodyEndrin ketone (ppm)
Hepta- chlor (ppm)
Heptachlor epoxide
(ppm)
Methoxy- chlor (ppm)
Acenaph- thene (ppm)
Acenaph- thylene (ppm)
Anthracene (ppm)
91 Boston Chelsea Creek <0.015 <0.021 <0.072 <0.013 <0.37 <0.22 1.192 Chelsea .....do. <.015 <.021 <.072 <.013 1.8 1.6 3.793 .....do. .....do. <.015 <.021 <.072 <.013 <.37 <.22 1.194 Boston .....do. <.015 <.021 <.072 <.013 .59 <.22 1.895 Chelsea .....do. <.015 <.021 <.072 <.013 <.37 <.22 <.29
96 .....do. .....do. <.015 <.021 <.072 <.013 <.37 <.22 <.2997 .....do. .....do. <.015 <.021 <.072 <.013 <.37 <.22 <.2998 Boston .....do. <.015 <.021 <.072 <.013 <.37 <.22 .7099 Chelsea .....do. <.015 <.021 <.072 <.013 <.37 <.22 1.0100 .....do. .....do. <.015 <.021 <.072 <.013 <.37 <.22 .45
101 Boston .....do. <.015 <.021 <.072 <.013 <.37 <.22 .29102 .....do. Boston Inner Harbor <.015 <.021 <.072 <.013 <.37 <.22 .38103 .....do. .....do. <.015 <.021 <.072 <.013 <.37 <.22 .34104 .....do. .....do. <.015 <.021 <.072 <.013 <.37 .26 .73
7 Arlington Lower Mystic Lake <.015 <.021 <.072 <.013 <.37 <.22 <.2916 Somerville Upper Mystic River <.015 <.021 <.072 <.013 <.37 <.22 <.2923 Medford .....do. <.015 <.021 <.072 <.013 <.37 <.22 <.2929 .....do. .....do. <.015 <.021 <.072 <.013 <.37 <.22 <.2955 Somerville Lower Mystic River <.015 <.021 <.072 <.013 <.37 <.22 1.1
66 Boston .....do. <.015 <.021 <.072 <.013 <.37 <.22 .2870 Chelsea Island End River <.015 <.021 <.072 <.013 12 7.1 24100 .....do. Chelsea Creek <.015 <.021 <.072 <.013 <.37 <.22 .35
4 Medford Lower Mystic Lake <.015 <.021 <.072 <.013 <.37 <.22 <.2910 .....do. Upper Mystic River <.015 <.021 <.072 <.013 <.37 <.22 <.2910 .....do. .....do. <.015 <.021 <.072 <.013 <.37 <.22 <.2919 .....do. .....do. <.015 <.021 <.072 <.013 <.37 <.22 <.2919 .....do. .....do. <.015 <.021 <.072 <.013 <.37 <.22 <.29
27 .....do. .....do. <.015 <.021 <.072 <.013 <.37 <.22 <.2927 .....do. .....do. <.015 <.021 <.072 <.013 <.37 <.22 <.2928 .....do. .....do. <.015 <.021 <.072 <.013 <.37 <.22 <.2934 .....do. .....do. <.015 <.021 <.072 <.013 <.37 <.22 <.2954 Everett .....do. <.015 <.021 <.072 <.013 1.7 <.22 7.7
54 .....do. .....do. <.015 <.021 <.072 <.013 2.5 <.22 7.385 Chelsea Chelsea Creek <.015 <.021 <.072 <.013 <.37 <.22 <.29
Tables 3–� ��
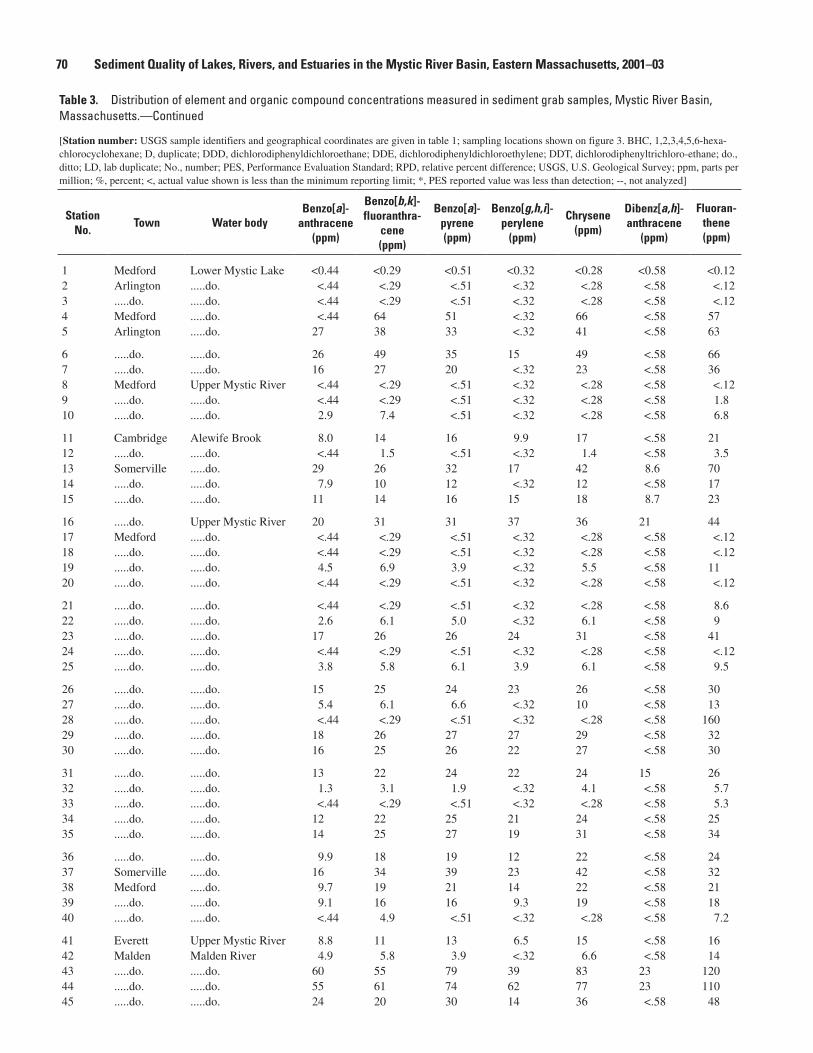
�0 Sediment Quality of Lakes, Rivers, and Estuaries in the Mystic River Basin, Eastern Massachusetts, 2001–03
Table 3. Distribution of element and organic compound concentrations measured in sediment grab samples, Mystic River Basin, Massachusetts.—Continued
[Station number: USGS sample identifiers and geographical coordinates are given in table 1; sampling locations shown on figure 3. BHC, 1,2,3,4,5,6-hexa-chlorocyclohexane; D, duplicate; DDD, dichlorodiphenyldichloroethane; DDE, dichlorodiphenyldichloroethylene; DDT, dichlorodiphenyltrichloro-ethane; do., ditto; LD, lab duplicate; No., number; PES, Performance Evaluation Standard; RPD, relative percent difference; USGS, U.S. Geological Survey; ppm, parts per million; %, percent; <, actual value shown is less than the minimum reporting limit; *, PES reported value was less than detection; --, not analyzed]
Station No.
Town Water bodyBenzo[a]-
anthracene (ppm)
Benzo[b,k]- fluoranthra-
cene (ppm)
Benzo[a]- pyrene (ppm)
Benzo[g,h,i]- perylene
(ppm)
Chrysene (ppm)
Dibenz[a,h]- anthracene
(ppm)
Fluoran- thene (ppm)
1 Medford Lower Mystic Lake <0.44 <0.29 <0.51 <0.32 <0.28 <0.58 <0.122 Arlington .....do. <.44 <.29 <.51 <.32 <.28 <.58 <.123 .....do. .....do. <.44 <.29 <.51 <.32 <.28 <.58 <.124 Medford .....do. <.44 64 51 <.32 66 <.58 575 Arlington .....do. 27 38 33 <.32 41 <.58 63
6 .....do. .....do. 26 49 35 15 49 <.58 667 .....do. .....do. 16 27 20 <.32 23 <.58 368 Medford Upper Mystic River <.44 <.29 <.51 <.32 <.28 <.58 <.129 .....do. .....do. <.44 <.29 <.51 <.32 <.28 <.58 1.810 .....do. .....do. 2.9 7.4 <.51 <.32 <.28 <.58 6.8
11 Cambridge Alewife Brook 8.0 14 16 9.9 17 <.58 2112 .....do. .....do. <.44 1.5 <.51 <.32 1.4 <.58 3.513 Somerville .....do. 29 26 32 17 42 8.6 7014 .....do. .....do. 7.9 10 12 <.32 12 <.58 1715 .....do. .....do. 11 14 16 15 18 8.7 23
16 .....do. Upper Mystic River 20 31 31 37 36 21 4417 Medford .....do. <.44 <.29 <.51 <.32 <.28 <.58 <.1218 .....do. .....do. <.44 <.29 <.51 <.32 <.28 <.58 <.1219 .....do. .....do. 4.5 6.9 3.9 <.32 5.5 <.58 1120 .....do. .....do. <.44 <.29 <.51 <.32 <.28 <.58 <.12
21 .....do. .....do. <.44 <.29 <.51 <.32 <.28 <.58 8.622 .....do. .....do. 2.6 6.1 5.0 <.32 6.1 <.58 923 .....do. .....do. 17 26 26 24 31 <.58 4124 .....do. .....do. <.44 <.29 <.51 <.32 <.28 <.58 <.1225 .....do. .....do. 3.8 5.8 6.1 3.9 6.1 <.58 9.5
26 .....do. .....do. 15 25 24 23 26 <.58 3027 .....do. .....do. 5.4 6.1 6.6 <.32 10 <.58 1328 .....do. .....do. <.44 <.29 <.51 <.32 <.28 <.58 16029 .....do. .....do. 18 26 27 27 29 <.58 3230 .....do. .....do. 16 25 26 22 27 <.58 30
31 .....do. .....do. 13 22 24 22 24 15 2632 .....do. .....do. 1.3 3.1 1.9 <.32 4.1 <.58 5.733 .....do. .....do. <.44 <.29 <.51 <.32 <.28 <.58 5.334 .....do. .....do. 12 22 25 21 24 <.58 2535 .....do. .....do. 14 25 27 19 31 <.58 34
36 .....do. .....do. 9.9 18 19 12 22 <.58 2437 Somerville .....do. 16 34 39 23 42 <.58 3238 Medford .....do. 9.7 19 21 14 22 <.58 2139 .....do. .....do. 9.1 16 16 9.3 19 <.58 1840 .....do. .....do. <.44 4.9 <.51 <.32 <.28 <.58 7.2
41 Everett Upper Mystic River 8.8 11 13 6.5 15 <.58 1642 Malden Malden River 4.9 5.8 3.9 <.32 6.6 <.58 1443 .....do. .....do. 60 55 79 39 83 23 12044 .....do. .....do. 55 61 74 62 77 23 11045 .....do. .....do. 24 20 30 14 36 <.58 48
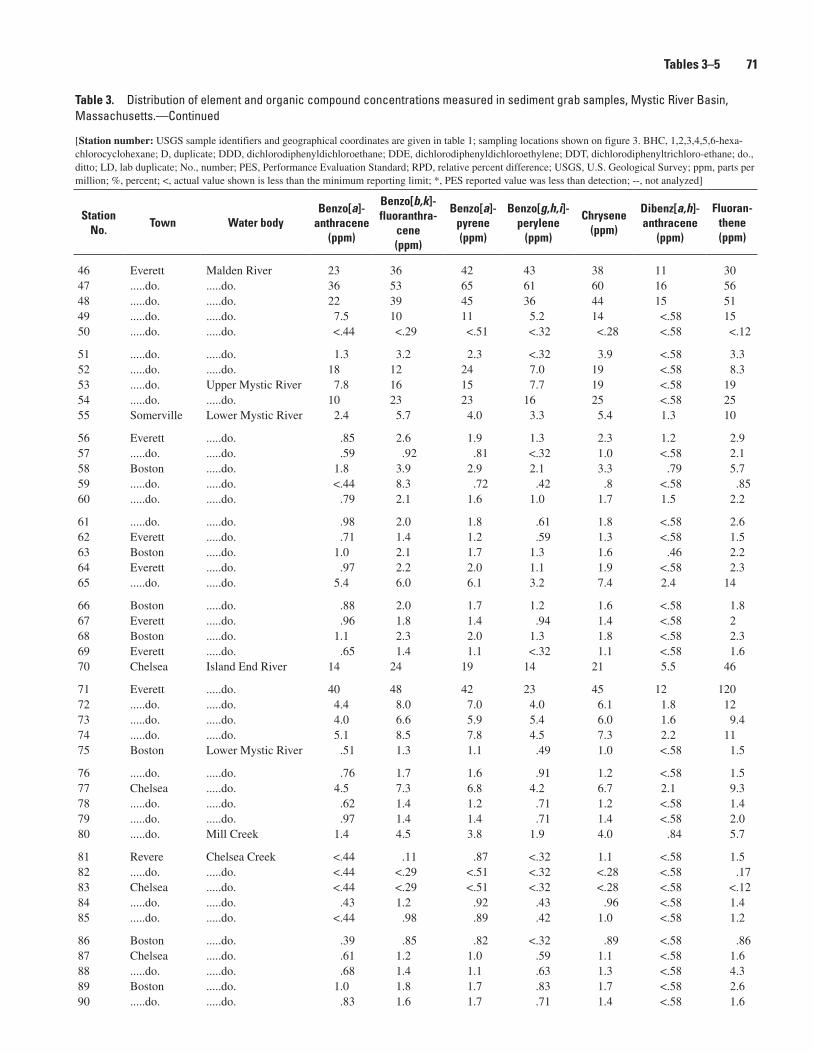
Table 3. Distribution of element and organic compound concentrations measured in sediment grab samples, Mystic River Basin, Massachusetts.—Continued
[Station number: USGS sample identifiers and geographical coordinates are given in table 1; sampling locations shown on figure 3. BHC, 1,2,3,4,5,6-hexa-chlorocyclohexane; D, duplicate; DDD, dichlorodiphenyldichloroethane; DDE, dichlorodiphenyldichloroethylene; DDT, dichlorodiphenyltrichloro-ethane; do., ditto; LD, lab duplicate; No., number; PES, Performance Evaluation Standard; RPD, relative percent difference; USGS, U.S. Geological Survey; ppm, parts per million; %, percent; <, actual value shown is less than the minimum reporting limit; *, PES reported value was less than detection; --, not analyzed]
Station No.
Town Water bodyBenzo[a]-
anthracene (ppm)
Benzo[b,k]- fluoranthra-
cene (ppm)
Benzo[a]- pyrene (ppm)
Benzo[g,h,i]- perylene
(ppm)
Chrysene (ppm)
Dibenz[a,h]- anthracene
(ppm)
Fluoran- thene (ppm)
46 Everett Malden River 23 36 42 43 38 11 3047 .....do. .....do. 36 53 65 61 60 16 5648 .....do. .....do. 22 39 45 36 44 15 5149 .....do. .....do. 7.5 10 11 5.2 14 <.58 1550 .....do. .....do. <.44 <.29 <.51 <.32 <.28 <.58 <.12
51 .....do. .....do. 1.3 3.2 2.3 <.32 3.9 <.58 3.352 .....do. .....do. 18 12 24 7.0 19 <.58 8.353 .....do. Upper Mystic River 7.8 16 15 7.7 19 <.58 1954 .....do. .....do. 10 23 23 16 25 <.58 2555 Somerville Lower Mystic River 2.4 5.7 4.0 3.3 5.4 1.3 10
56 Everett .....do. .85 2.6 1.9 1.3 2.3 1.2 2.957 .....do. .....do. .59 .92 .81 <.32 1.0 <.58 2.158 Boston .....do. 1.8 3.9 2.9 2.1 3.3 .79 5.759 .....do. .....do. <.44 8.3 .72 .42 .8 <.58 .8560 .....do. .....do. .79 2.1 1.6 1.0 1.7 1.5 2.2
61 .....do. .....do. .98 2.0 1.8 .61 1.8 <.58 2.662 Everett .....do. .71 1.4 1.2 .59 1.3 <.58 1.563 Boston .....do. 1.0 2.1 1.7 1.3 1.6 .46 2.264 Everett .....do. .97 2.2 2.0 1.1 1.9 <.58 2.365 .....do. .....do. 5.4 6.0 6.1 3.2 7.4 2.4 14
66 Boston .....do. .88 2.0 1.7 1.2 1.6 <.58 1.867 Everett .....do. .96 1.8 1.4 .94 1.4 <.58 268 Boston .....do. 1.1 2.3 2.0 1.3 1.8 <.58 2.369 Everett .....do. .65 1.4 1.1 <.32 1.1 <.58 1.670 Chelsea Island End River 14 24 19 14 21 5.5 46
71 Everett .....do. 40 48 42 23 45 12 12072 .....do. .....do. 4.4 8.0 7.0 4.0 6.1 1.8 1273 .....do. .....do. 4.0 6.6 5.9 5.4 6.0 1.6 9.474 .....do. .....do. 5.1 8.5 7.8 4.5 7.3 2.2 1175 Boston Lower Mystic River .51 1.3 1.1 .49 1.0 <.58 1.5
76 .....do. .....do. .76 1.7 1.6 .91 1.2 <.58 1.577 Chelsea .....do. 4.5 7.3 6.8 4.2 6.7 2.1 9.378 .....do. .....do. .62 1.4 1.2 .71 1.2 <.58 1.479 .....do. .....do. .97 1.4 1.4 .71 1.4 <.58 2.080 .....do. Mill Creek 1.4 4.5 3.8 1.9 4.0 .84 5.7
81 Revere Chelsea Creek <.44 .11 .87 <.32 1.1 <.58 1.582 .....do. .....do. <.44 <.29 <.51 <.32 <.28 <.58 .1783 Chelsea .....do. <.44 <.29 <.51 <.32 <.28 <.58 <.1284 .....do. .....do. .43 1.2 .92 .43 .96 <.58 1.485 .....do. .....do. <.44 .98 .89 .42 1.0 <.58 1.2
86 Boston .....do. .39 .85 .82 <.32 .89 <.58 .8687 Chelsea .....do. .61 1.2 1.0 .59 1.1 <.58 1.688 .....do. .....do. .68 1.4 1.1 .63 1.3 <.58 4.389 Boston .....do. 1.0 1.8 1.7 .83 1.7 <.58 2.690 .....do. .....do. .83 1.6 1.7 .71 1.4 <.58 1.6
Tables 3–� �1
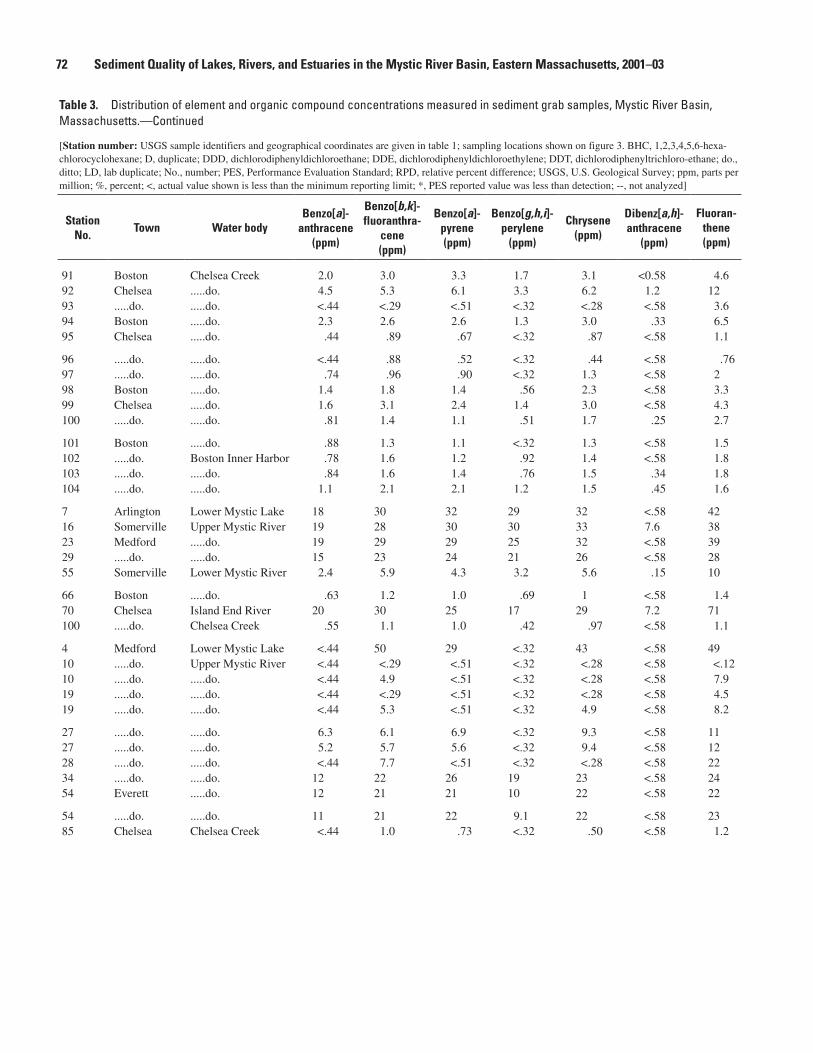
�2 Sediment Quality of Lakes, Rivers, and Estuaries in the Mystic River Basin, Eastern Massachusetts, 2001–03
Table 3. Distribution of element and organic compound concentrations measured in sediment grab samples, Mystic River Basin, Massachusetts.—Continued
[Station number: USGS sample identifiers and geographical coordinates are given in table 1; sampling locations shown on figure 3. BHC, 1,2,3,4,5,6-hexa-chlorocyclohexane; D, duplicate; DDD, dichlorodiphenyldichloroethane; DDE, dichlorodiphenyldichloroethylene; DDT, dichlorodiphenyltrichloro-ethane; do., ditto; LD, lab duplicate; No., number; PES, Performance Evaluation Standard; RPD, relative percent difference; USGS, U.S. Geological Survey; ppm, parts per million; %, percent; <, actual value shown is less than the minimum reporting limit; *, PES reported value was less than detection; --, not analyzed]
Station No.
Town Water bodyBenzo[a]-
anthracene (ppm)
Benzo[b,k]- fluoranthra-
cene (ppm)
Benzo[a]- pyrene (ppm)
Benzo[g,h,i]- perylene
(ppm)
Chrysene (ppm)
Dibenz[a,h]- anthracene
(ppm)
Fluoran- thene (ppm)
91 Boston Chelsea Creek 2.0 3.0 3.3 1.7 3.1 <0.58 4.692 Chelsea .....do. 4.5 5.3 6.1 3.3 6.2 1.2 1293 .....do. .....do. <.44 <.29 <.51 <.32 <.28 <.58 3.694 Boston .....do. 2.3 2.6 2.6 1.3 3.0 .33 6.595 Chelsea .....do. .44 .89 .67 <.32 .87 <.58 1.1
96 .....do. .....do. <.44 .88 .52 <.32 .44 <.58 .7697 .....do. .....do. .74 .96 .90 <.32 1.3 <.58 298 Boston .....do. 1.4 1.8 1.4 .56 2.3 <.58 3.399 Chelsea .....do. 1.6 3.1 2.4 1.4 3.0 <.58 4.3100 .....do. .....do. .81 1.4 1.1 .51 1.7 .25 2.7
101 Boston .....do. .88 1.3 1.1 <.32 1.3 <.58 1.5102 .....do. Boston Inner Harbor .78 1.6 1.2 .92 1.4 <.58 1.8103 .....do. .....do. .84 1.6 1.4 .76 1.5 .34 1.8104 .....do. .....do. 1.1 2.1 2.1 1.2 1.5 .45 1.6
7 Arlington Lower Mystic Lake 18 30 32 29 32 <.58 4216 Somerville Upper Mystic River 19 28 30 30 33 7.6 3823 Medford .....do. 19 29 29 25 32 <.58 3929 .....do. .....do. 15 23 24 21 26 <.58 2855 Somerville Lower Mystic River 2.4 5.9 4.3 3.2 5.6 .15 10
66 Boston .....do. .63 1.2 1.0 .69 1 <.58 1.470 Chelsea Island End River 20 30 25 17 29 7.2 71100 .....do. Chelsea Creek .55 1.1 1.0 .42 .97 <.58 1.1
4 Medford Lower Mystic Lake <.44 50 29 <.32 43 <.58 4910 .....do. Upper Mystic River <.44 <.29 <.51 <.32 <.28 <.58 <.1210 .....do. .....do. <.44 4.9 <.51 <.32 <.28 <.58 7.919 .....do. .....do. <.44 <.29 <.51 <.32 <.28 <.58 4.519 .....do. .....do. <.44 5.3 <.51 <.32 4.9 <.58 8.2
27 .....do. .....do. 6.3 6.1 6.9 <.32 9.3 <.58 1127 .....do. .....do. 5.2 5.7 5.6 <.32 9.4 <.58 1228 .....do. .....do. <.44 7.7 <.51 <.32 <.28 <.58 2234 .....do. .....do. 12 22 26 19 23 <.58 2454 Everett .....do. 12 21 21 10 22 <.58 22
54 .....do. .....do. 11 21 22 9.1 22 <.58 2385 Chelsea Chelsea Creek <.44 1.0 .73 <.32 .50 <.58 1.2
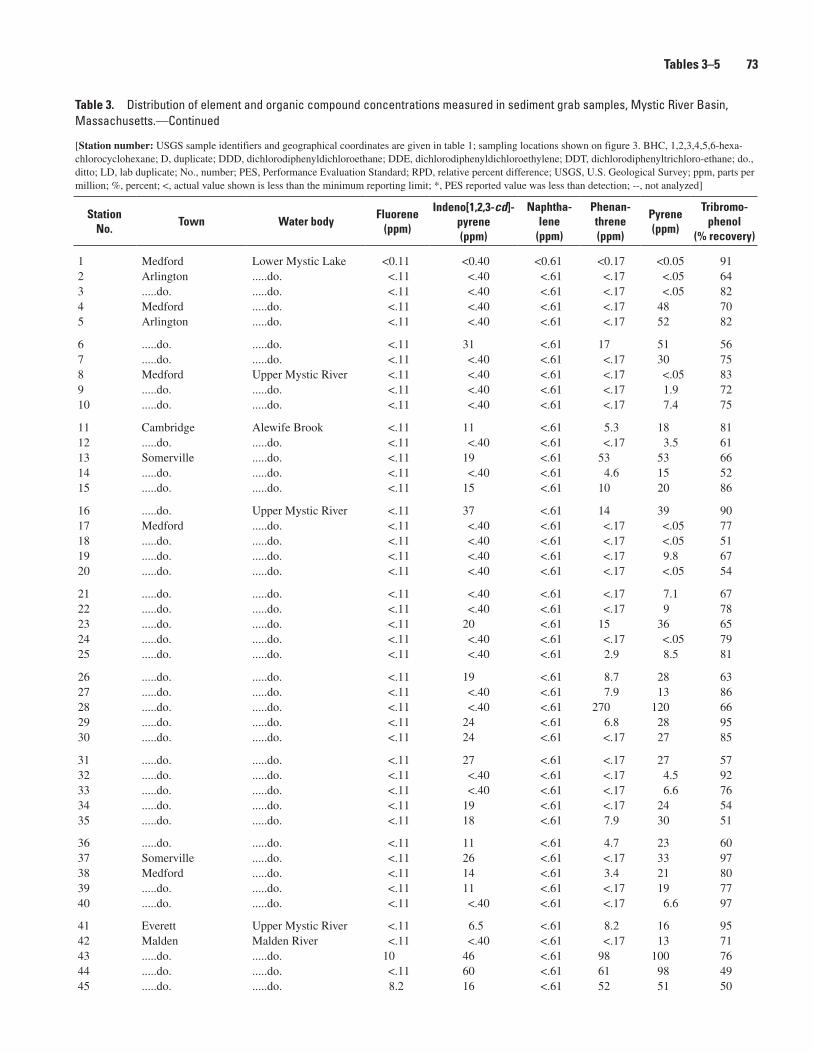
Table 3. Distribution of element and organic compound concentrations measured in sediment grab samples, Mystic River Basin, Massachusetts.—Continued
[Station number: USGS sample identifiers and geographical coordinates are given in table 1; sampling locations shown on figure 3. BHC, 1,2,3,4,5,6-hexa-chlorocyclohexane; D, duplicate; DDD, dichlorodiphenyldichloroethane; DDE, dichlorodiphenyldichloroethylene; DDT, dichlorodiphenyltrichloro-ethane; do., ditto; LD, lab duplicate; No., number; PES, Performance Evaluation Standard; RPD, relative percent difference; USGS, U.S. Geological Survey; ppm, parts per million; %, percent; <, actual value shown is less than the minimum reporting limit; *, PES reported value was less than detection; --, not analyzed]
Station No.
Town Water bodyFluorene
(ppm)
Indeno[1,2,3-cd]- pyrene (ppm)
Naphtha- lene
(ppm)
Phenan- threne (ppm)
Pyrene (ppm)
Tribromo- phenol
(% recovery)
1 Medford Lower Mystic Lake <0.11 <0.40 <0.61 <0.17 <0.05 912 Arlington .....do. <.11 <.40 <.61 <.17 <.05 643 .....do. .....do. <.11 <.40 <.61 <.17 <.05 824 Medford .....do. <.11 <.40 <.61 <.17 48 705 Arlington .....do. <.11 <.40 <.61 <.17 52 82
6 .....do. .....do. <.11 31 <.61 17 51 567 .....do. .....do. <.11 <.40 <.61 <.17 30 758 Medford Upper Mystic River <.11 <.40 <.61 <.17 <.05 839 .....do. .....do. <.11 <.40 <.61 <.17 1.9 7210 .....do. .....do. <.11 <.40 <.61 <.17 7.4 75
11 Cambridge Alewife Brook <.11 11 <.61 5.3 18 8112 .....do. .....do. <.11 <.40 <.61 <.17 3.5 6113 Somerville .....do. <.11 19 <.61 53 53 6614 .....do. .....do. <.11 <.40 <.61 4.6 15 5215 .....do. .....do. <.11 15 <.61 10 20 86
16 .....do. Upper Mystic River <.11 37 <.61 14 39 9017 Medford .....do. <.11 <.40 <.61 <.17 <.05 7718 .....do. .....do. <.11 <.40 <.61 <.17 <.05 5119 .....do. .....do. <.11 <.40 <.61 <.17 9.8 6720 .....do. .....do. <.11 <.40 <.61 <.17 <.05 54
21 .....do. .....do. <.11 <.40 <.61 <.17 7.1 6722 .....do. .....do. <.11 <.40 <.61 <.17 9 7823 .....do. .....do. <.11 20 <.61 15 36 6524 .....do. .....do. <.11 <.40 <.61 <.17 <.05 7925 .....do. .....do. <.11 <.40 <.61 2.9 8.5 81
26 .....do. .....do. <.11 19 <.61 8.7 28 6327 .....do. .....do. <.11 <.40 <.61 7.9 13 8628 .....do. .....do. <.11 <.40 <.61 270 120 6629 .....do. .....do. <.11 24 <.61 6.8 28 9530 .....do. .....do. <.11 24 <.61 <.17 27 85
31 .....do. .....do. <.11 27 <.61 <.17 27 5732 .....do. .....do. <.11 <.40 <.61 <.17 4.5 9233 .....do. .....do. <.11 <.40 <.61 <.17 6.6 7634 .....do. .....do. <.11 19 <.61 <.17 24 5435 .....do. .....do. <.11 18 <.61 7.9 30 51
36 .....do. .....do. <.11 11 <.61 4.7 23 6037 Somerville .....do. <.11 26 <.61 <.17 33 9738 Medford .....do. <.11 14 <.61 3.4 21 8039 .....do. .....do. <.11 11 <.61 <.17 19 7740 .....do. .....do. <.11 <.40 <.61 <.17 6.6 97
41 Everett Upper Mystic River <.11 6.5 <.61 8.2 16 9542 Malden Malden River <.11 <.40 <.61 <.17 13 7143 .....do. .....do. 10 46 <.61 98 100 7644 .....do. .....do. <.11 60 <.61 61 98 4945 .....do. .....do. 8.2 16 <.61 52 51 50
Tables 3–� �3
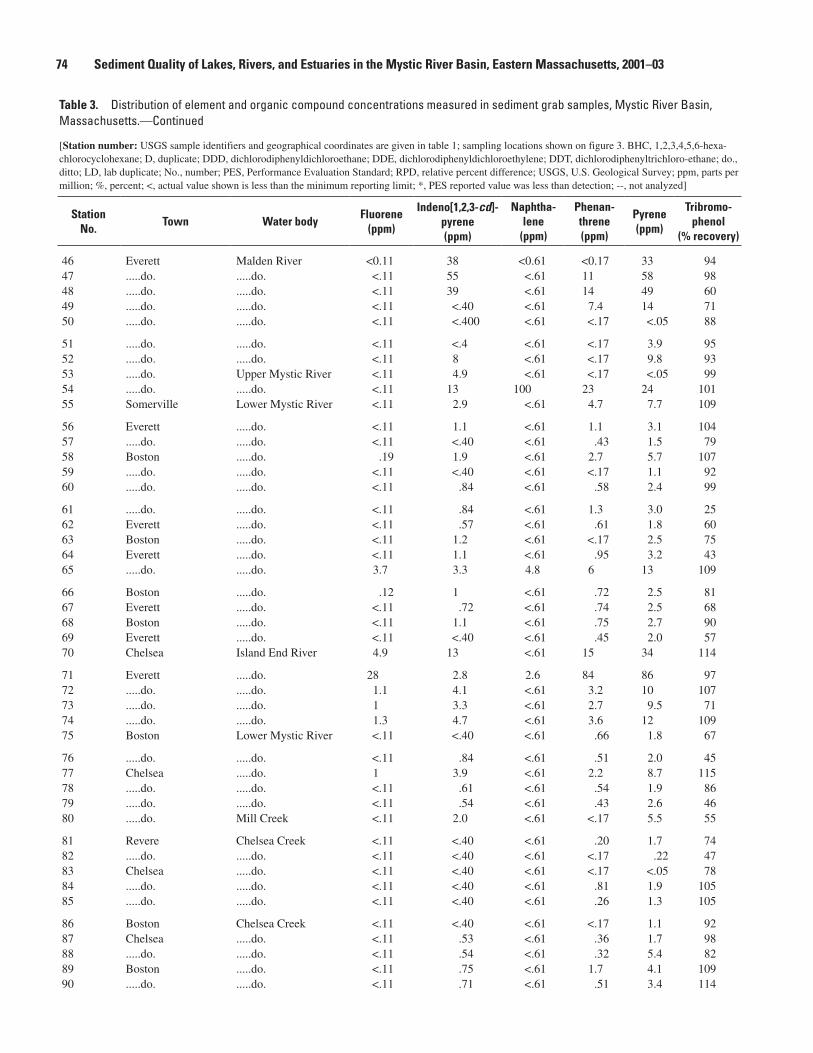
�� Sediment Quality of Lakes, Rivers, and Estuaries in the Mystic River Basin, Eastern Massachusetts, 2001–03
Table 3. Distribution of element and organic compound concentrations measured in sediment grab samples, Mystic River Basin, Massachusetts.—Continued
[Station number: USGS sample identifiers and geographical coordinates are given in table 1; sampling locations shown on figure 3. BHC, 1,2,3,4,5,6-hexa-chlorocyclohexane; D, duplicate; DDD, dichlorodiphenyldichloroethane; DDE, dichlorodiphenyldichloroethylene; DDT, dichlorodiphenyltrichloro-ethane; do., ditto; LD, lab duplicate; No., number; PES, Performance Evaluation Standard; RPD, relative percent difference; USGS, U.S. Geological Survey; ppm, parts per million; %, percent; <, actual value shown is less than the minimum reporting limit; *, PES reported value was less than detection; --, not analyzed]
Station No.
Town Water bodyFluorene
(ppm)
Indeno[1,2,3-cd]- pyrene (ppm)
Naphtha- lene
(ppm)
Phenan- threne (ppm)
Pyrene (ppm)
Tribromo- phenol
(% recovery)
46 Everett Malden River <0.11 38 <0.61 <0.17 33 9447 .....do. .....do. <.11 55 <.61 11 58 9848 .....do. .....do. <.11 39 <.61 14 49 6049 .....do. .....do. <.11 <.40 <.61 7.4 14 7150 .....do. .....do. <.11 <.400 <.61 <.17 <.05 88
51 .....do. .....do. <.11 <.4 <.61 <.17 3.9 9552 .....do. .....do. <.11 8 <.61 <.17 9.8 9353 .....do. Upper Mystic River <.11 4.9 <.61 <.17 <.05 9954 .....do. .....do. <.11 13 100 23 24 10155 Somerville Lower Mystic River <.11 2.9 <.61 4.7 7.7 109
56 Everett .....do. <.11 1.1 <.61 1.1 3.1 10457 .....do. .....do. <.11 <.40 <.61 .43 1.5 7958 Boston .....do. .19 1.9 <.61 2.7 5.7 10759 .....do. .....do. <.11 <.40 <.61 <.17 1.1 9260 .....do. .....do. <.11 .84 <.61 .58 2.4 99
61 .....do. .....do. <.11 .84 <.61 1.3 3.0 2562 Everett .....do. <.11 .57 <.61 .61 1.8 6063 Boston .....do. <.11 1.2 <.61 <.17 2.5 7564 Everett .....do. <.11 1.1 <.61 .95 3.2 4365 .....do. .....do. 3.7 3.3 4.8 6 13 109
66 Boston .....do. .12 1 <.61 .72 2.5 8167 Everett .....do. <.11 .72 <.61 .74 2.5 6868 Boston .....do. <.11 1.1 <.61 .75 2.7 9069 Everett .....do. <.11 <.40 <.61 .45 2.0 5770 Chelsea Island End River 4.9 13 <.61 15 34 114
71 Everett .....do. 28 2.8 2.6 84 86 9772 .....do. .....do. 1.1 4.1 <.61 3.2 10 10773 .....do. .....do. 1 3.3 <.61 2.7 9.5 7174 .....do. .....do. 1.3 4.7 <.61 3.6 12 10975 Boston Lower Mystic River <.11 <.40 <.61 .66 1.8 67
76 .....do. .....do. <.11 .84 <.61 .51 2.0 4577 Chelsea .....do. 1 3.9 <.61 2.2 8.7 11578 .....do. .....do. <.11 .61 <.61 .54 1.9 8679 .....do. .....do. <.11 .54 <.61 .43 2.6 4680 .....do. Mill Creek <.11 2.0 <.61 <.17 5.5 55
81 Revere Chelsea Creek <.11 <.40 <.61 .20 1.7 7482 .....do. .....do. <.11 <.40 <.61 <.17 .22 4783 Chelsea .....do. <.11 <.40 <.61 <.17 <.05 7884 .....do. .....do. <.11 <.40 <.61 .81 1.9 10585 .....do. .....do. <.11 <.40 <.61 .26 1.3 105
86 Boston Chelsea Creek <.11 <.40 <.61 <.17 1.1 9287 Chelsea .....do. <.11 .53 <.61 .36 1.7 9888 .....do. .....do. <.11 .54 <.61 .32 5.4 8289 Boston .....do. <.11 .75 <.61 1.7 4.1 10990 .....do. .....do. <.11 .71 <.61 .51 3.4 114
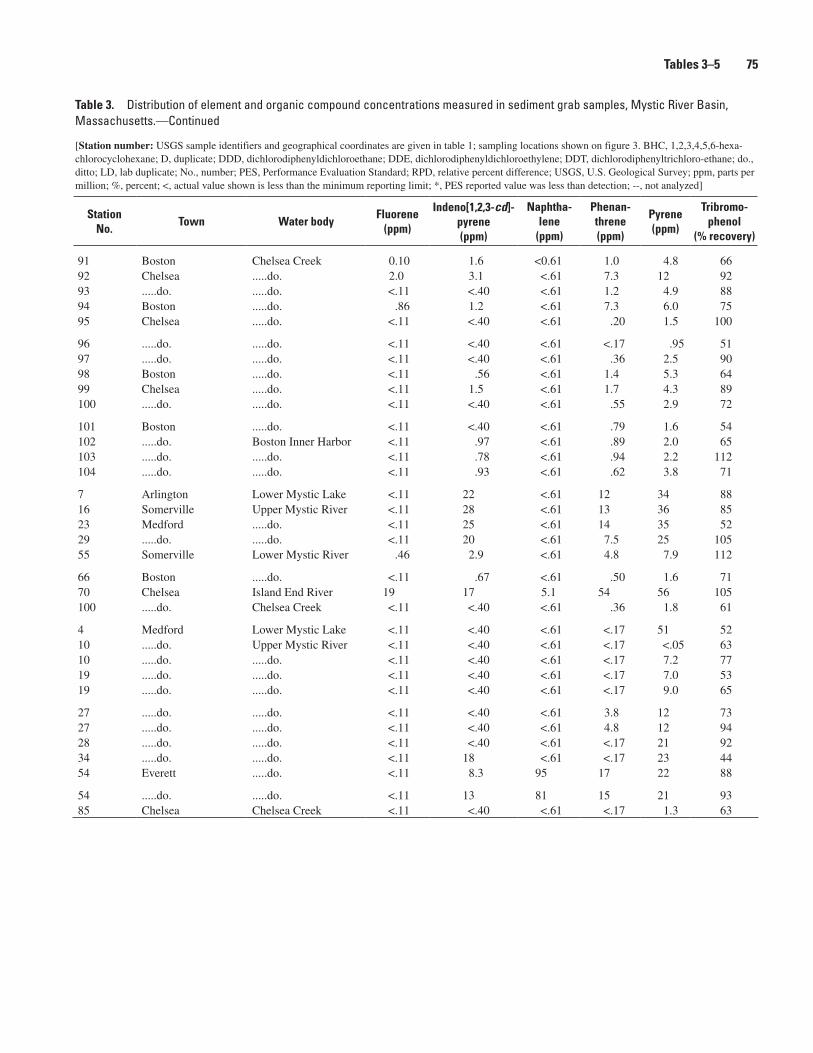
Table 3. Distribution of element and organic compound concentrations measured in sediment grab samples, Mystic River Basin, Massachusetts.—Continued
[Station number: USGS sample identifiers and geographical coordinates are given in table 1; sampling locations shown on figure 3. BHC, 1,2,3,4,5,6-hexa-chlorocyclohexane; D, duplicate; DDD, dichlorodiphenyldichloroethane; DDE, dichlorodiphenyldichloroethylene; DDT, dichlorodiphenyltrichloro-ethane; do., ditto; LD, lab duplicate; No., number; PES, Performance Evaluation Standard; RPD, relative percent difference; USGS, U.S. Geological Survey; ppm, parts per million; %, percent; <, actual value shown is less than the minimum reporting limit; *, PES reported value was less than detection; --, not analyzed]
Station No.
Town Water bodyFluorene
(ppm)
Indeno[1,2,3-cd]- pyrene (ppm)
Naphtha- lene
(ppm)
Phenan- threne (ppm)
Pyrene (ppm)
Tribromo- phenol
(% recovery)
91 Boston Chelsea Creek 0.10 1.6 <0.61 1.0 4.8 6692 Chelsea .....do. 2.0 3.1 <.61 7.3 12 9293 .....do. .....do. <.11 <.40 <.61 1.2 4.9 8894 Boston .....do. .86 1.2 <.61 7.3 6.0 7595 Chelsea .....do. <.11 <.40 <.61 .20 1.5 100
96 .....do. .....do. <.11 <.40 <.61 <.17 .95 5197 .....do. .....do. <.11 <.40 <.61 .36 2.5 9098 Boston .....do. <.11 .56 <.61 1.4 5.3 6499 Chelsea .....do. <.11 1.5 <.61 1.7 4.3 89100 .....do. .....do. <.11 <.40 <.61 .55 2.9 72
101 Boston .....do. <.11 <.40 <.61 .79 1.6 54102 .....do. Boston Inner Harbor <.11 .97 <.61 .89 2.0 65103 .....do. .....do. <.11 .78 <.61 .94 2.2 112104 .....do. .....do. <.11 .93 <.61 .62 3.8 71
7 Arlington Lower Mystic Lake <.11 22 <.61 12 34 8816 Somerville Upper Mystic River <.11 28 <.61 13 36 8523 Medford .....do. <.11 25 <.61 14 35 5229 .....do. .....do. <.11 20 <.61 7.5 25 10555 Somerville Lower Mystic River .46 2.9 <.61 4.8 7.9 112
66 Boston .....do. <.11 .67 <.61 .50 1.6 7170 Chelsea Island End River 19 17 5.1 54 56 105100 .....do. Chelsea Creek <.11 <.40 <.61 .36 1.8 61
4 Medford Lower Mystic Lake <.11 <.40 <.61 <.17 51 5210 .....do. Upper Mystic River <.11 <.40 <.61 <.17 <.05 6310 .....do. .....do. <.11 <.40 <.61 <.17 7.2 7719 .....do. .....do. <.11 <.40 <.61 <.17 7.0 5319 .....do. .....do. <.11 <.40 <.61 <.17 9.0 65
27 .....do. .....do. <.11 <.40 <.61 3.8 12 7327 .....do. .....do. <.11 <.40 <.61 4.8 12 9428 .....do. .....do. <.11 <.40 <.61 <.17 21 9234 .....do. .....do. <.11 18 <.61 <.17 23 4454 Everett .....do. <.11 8.3 95 17 22 88
54 .....do. .....do. <.11 13 81 15 21 9385 Chelsea Chelsea Creek <.11 <.40 <.61 <.17 1.3 63
Tables 3–� ��
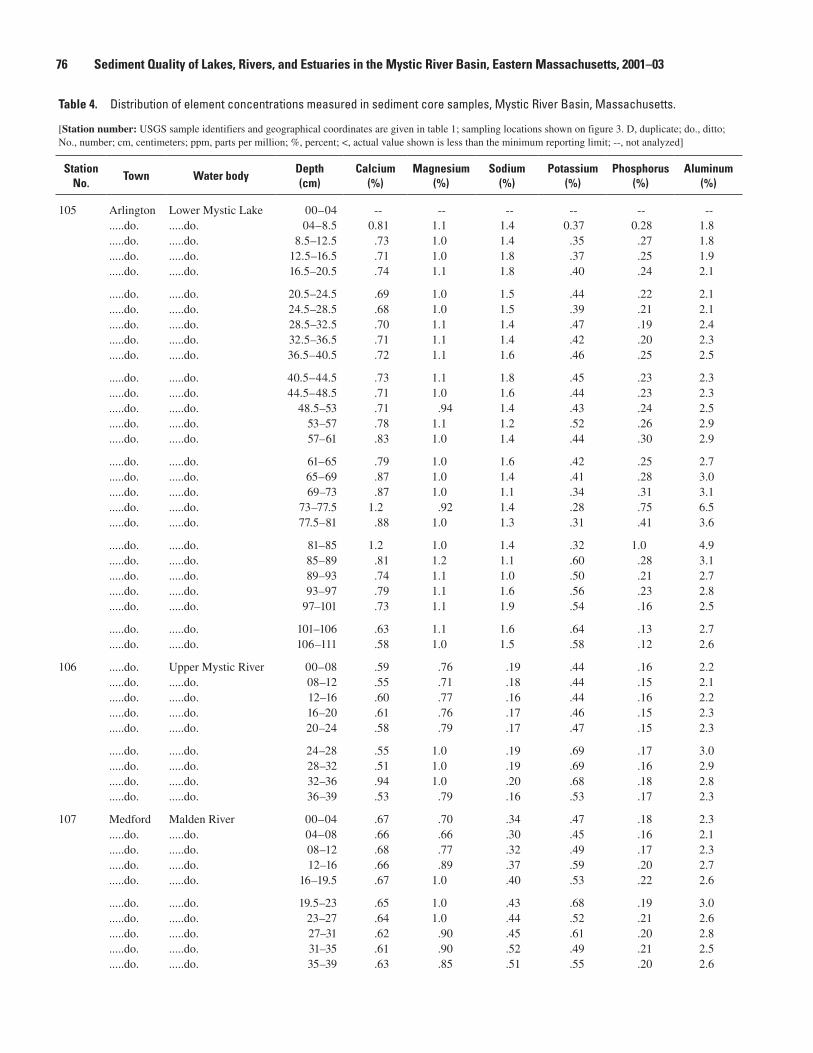
�� Sediment Quality of Lakes, Rivers, and Estuaries in the Mystic River Basin, Eastern Massachusetts, 2001–03
Table �. Distribution of element concentrations measured in sediment core samples, Mystic River Basin, Massachusetts.—Continued
[Station number: USGS sample identifiers and geographical coordinates are given in table 1; sampling locations shown on figure 3. D, duplicate; do., ditto; No., number; cm, centimeters; ppm, parts per million; %, percent; <, actual value shown is less than the minimum reporting limit; --, not analyzed]
Station No.
Town Water bodyDepth (cm)
Calcium (%)
Magnesium (%)
Sodium (%)
Potassium (%)
Phosphorus (%)
Aluminum (%)
105 Arlington Lower Mystic Lake 00–04 -- -- -- -- -- --.....do. .....do. 04–8.5 0.81 1.1 1.4 0.37 0.28 1.8.....do. .....do. 8.5–12.5 .73 1.0 1.4 .35 .27 1.8.....do. .....do. 12.5–16.5 .71 1.0 1.8 .37 .25 1.9.....do. .....do. 16.5–20.5 .74 1.1 1.8 .40 .24 2.1
.....do. .....do. 20.5–24.5 .69 1.0 1.5 .44 .22 2.1
.....do. .....do. 24.5–28.5 .68 1.0 1.5 .39 .21 2.1
.....do. .....do. 28.5–32.5 .70 1.1 1.4 .47 .19 2.4
.....do. .....do. 32.5–36.5 .71 1.1 1.4 .42 .20 2.3
.....do. .....do. 36.5–40.5 .72 1.1 1.6 .46 .25 2.5
.....do. .....do. 40.5–44.5 .73 1.1 1.8 .45 .23 2.3
.....do. .....do. 44.5–48.5 .71 1.0 1.6 .44 .23 2.3
.....do. .....do. 48.5–53 .71 .94 1.4 .43 .24 2.5
.....do. .....do. 53–57 .78 1.1 1.2 .52 .26 2.9
.....do. .....do. 57–61 .83 1.0 1.4 .44 .30 2.9
.....do. .....do. 61–65 .79 1.0 1.6 .42 .25 2.7
.....do. .....do. 65–69 .87 1.0 1.4 .41 .28 3.0
.....do. .....do. 69–73 .87 1.0 1.1 .34 .31 3.1
.....do. .....do. 73–77.5 1.2 .92 1.4 .28 .75 6.5
.....do. .....do. 77.5–81 .88 1.0 1.3 .31 .41 3.6
.....do. .....do. 81–85 1.2 1.0 1.4 .32 1.0 4.9
.....do. .....do. 85–89 .81 1.2 1.1 .60 .28 3.1
.....do. .....do. 89–93 .74 1.1 1.0 .50 .21 2.7
.....do. .....do. 93–97 .79 1.1 1.6 .56 .23 2.8
.....do. .....do. 97–101 .73 1.1 1.9 .54 .16 2.5
.....do. .....do. 101–106 .63 1.1 1.6 .64 .13 2.7
.....do. .....do. 106–111 .58 1.0 1.5 .58 .12 2.6
106 .....do. Upper Mystic River 00–08 .59 .76 .19 .44 .16 2.2.....do. .....do. 08–12 .55 .71 .18 .44 .15 2.1.....do. .....do. 12–16 .60 .77 .16 .44 .16 2.2.....do. .....do. 16–20 .61 .76 .17 .46 .15 2.3.....do. .....do. 20–24 .58 .79 .17 .47 .15 2.3
.....do. .....do. 24–28 .55 1.0 .19 .69 .17 3.0
.....do. .....do. 28–32 .51 1.0 .19 .69 .16 2.9
.....do. .....do. 32–36 .94 1.0 .20 .68 .18 2.8
.....do. .....do. 36–39 .53 .79 .16 .53 .17 2.3
107 Medford Malden River 00–04 .67 .70 .34 .47 .18 2.3.....do. .....do. 04–08 .66 .66 .30 .45 .16 2.1.....do. .....do. 08–12 .68 .77 .32 .49 .17 2.3.....do. .....do. 12–16 .66 .89 .37 .59 .20 2.7.....do. .....do. 16–19.5 .67 1.0 .40 .53 .22 2.6
.....do. .....do. 19.5–23 .65 1.0 .43 .68 .19 3.0
.....do. .....do. 23–27 .64 1.0 .44 .52 .21 2.6
.....do. .....do. 27–31 .62 .90 .45 .61 .20 2.8
.....do. .....do. 31–35 .61 .90 .52 .49 .21 2.5
.....do. .....do. 35–39 .63 .85 .51 .55 .20 2.6
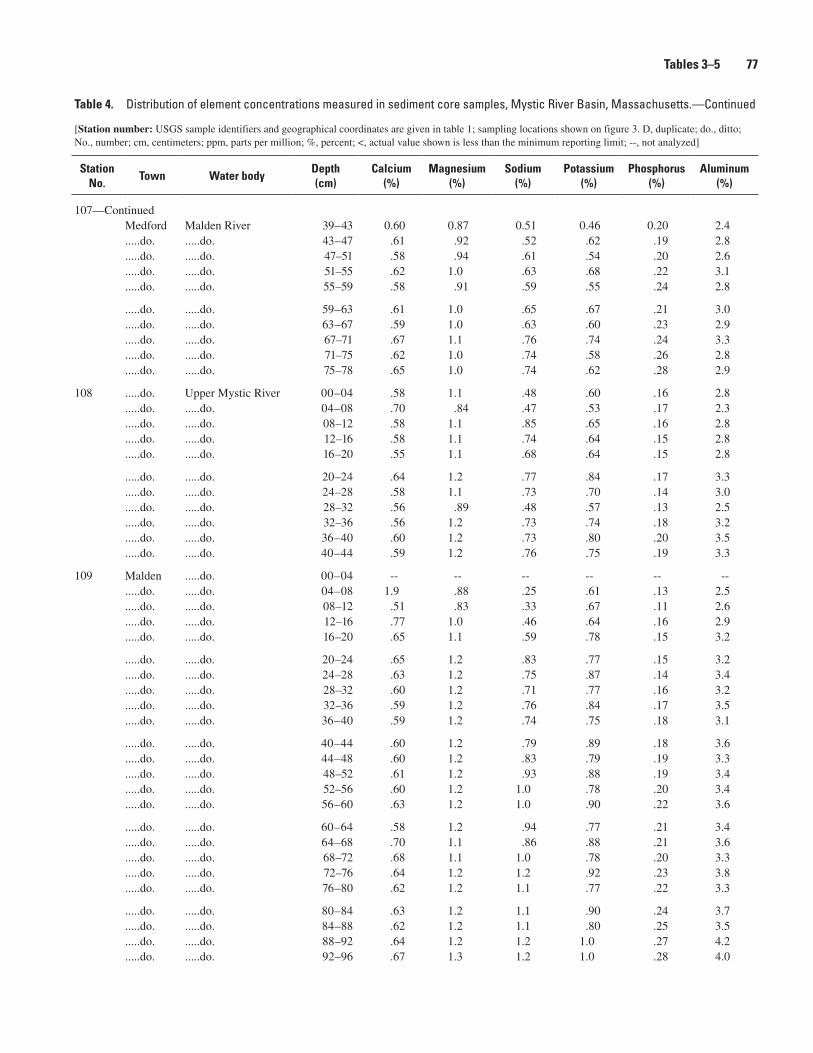
Table �. Distribution of element concentrations measured in sediment core samples, Mystic River Basin, Massachusetts.—Continued
[Station number: USGS sample identifiers and geographical coordinates are given in table 1; sampling locations shown on figure 3. D, duplicate; do., ditto; No., number; cm, centimeters; ppm, parts per million; %, percent; <, actual value shown is less than the minimum reporting limit; --, not analyzed]
Station No.
Town Water bodyDepth (cm)
Calcium (%)
Magnesium (%)
Sodium (%)
Potassium (%)
Phosphorus (%)
Aluminum (%)
107—ContinuedMedford Malden River 39–43 0.60 0.87 0.51 0.46 0.20 2.4.....do. .....do. 43–47 .61 .92 .52 .62 .19 2.8.....do. .....do. 47–51 .58 .94 .61 .54 .20 2.6.....do. .....do. 51–55 .62 1.0 .63 .68 .22 3.1.....do. .....do. 55–59 .58 .91 .59 .55 .24 2.8
.....do. .....do. 59–63 .61 1.0 .65 .67 .21 3.0
.....do. .....do. 63–67 .59 1.0 .63 .60 .23 2.9
.....do. .....do. 67–71 .67 1.1 .76 .74 .24 3.3
.....do. .....do. 71–75 .62 1.0 .74 .58 .26 2.8
.....do. .....do. 75–78 .65 1.0 .74 .62 .28 2.9
108 .....do. Upper Mystic River 00–04 .58 1.1 .48 .60 .16 2.8.....do. .....do. 04–08 .70 .84 .47 .53 .17 2.3.....do. .....do. 08–12 .58 1.1 .85 .65 .16 2.8.....do. .....do. 12–16 .58 1.1 .74 .64 .15 2.8.....do. .....do. 16–20 .55 1.1 .68 .64 .15 2.8
.....do. .....do. 20–24 .64 1.2 .77 .84 .17 3.3
.....do. .....do. 24–28 .58 1.1 .73 .70 .14 3.0
.....do. .....do. 28–32 .56 .89 .48 .57 .13 2.5
.....do. .....do. 32–36 .56 1.2 .73 .74 .18 3.2
.....do. .....do. 36–40 .60 1.2 .73 .80 .20 3.5
.....do. .....do. 40–44 .59 1.2 .76 .75 .19 3.3
109 Malden .....do. 00–04 -- -- -- -- -- --.....do. .....do. 04–08 1.9 .88 .25 .61 .13 2.5.....do. .....do. 08–12 .51 .83 .33 .67 .11 2.6.....do. .....do. 12–16 .77 1.0 .46 .64 .16 2.9.....do. .....do. 16–20 .65 1.1 .59 .78 .15 3.2
.....do. .....do. 20–24 .65 1.2 .83 .77 .15 3.2
.....do. .....do. 24–28 .63 1.2 .75 .87 .14 3.4
.....do. .....do. 28–32 .60 1.2 .71 .77 .16 3.2
.....do. .....do. 32–36 .59 1.2 .76 .84 .17 3.5
.....do. .....do. 36–40 .59 1.2 .74 .75 .18 3.1
.....do. .....do. 40–44 .60 1.2 .79 .89 .18 3.6
.....do. .....do. 44–48 .60 1.2 .83 .79 .19 3.3
.....do. .....do. 48–52 .61 1.2 .93 .88 .19 3.4
.....do. .....do. 52–56 .60 1.2 1.0 .78 .20 3.4
.....do. .....do. 56–60 .63 1.2 1.0 .90 .22 3.6
.....do. .....do. 60–64 .58 1.2 .94 .77 .21 3.4
.....do. .....do. 64–68 .70 1.1 .86 .88 .21 3.6
.....do. .....do. 68–72 .68 1.1 1.0 .78 .20 3.3
.....do. .....do. 72–76 .64 1.2 1.2 .92 .23 3.8
.....do. .....do. 76–80 .62 1.2 1.1 .77 .22 3.3
.....do. .....do. 80–84 .63 1.2 1.1 .90 .24 3.7
.....do. .....do. 84–88 .62 1.2 1.1 .80 .25 3.5
.....do. .....do. 88–92 .64 1.2 1.2 1.0 .27 4.2
.....do. .....do. 92–96 .67 1.3 1.2 1.0 .28 4.0
Tables 3–� ��
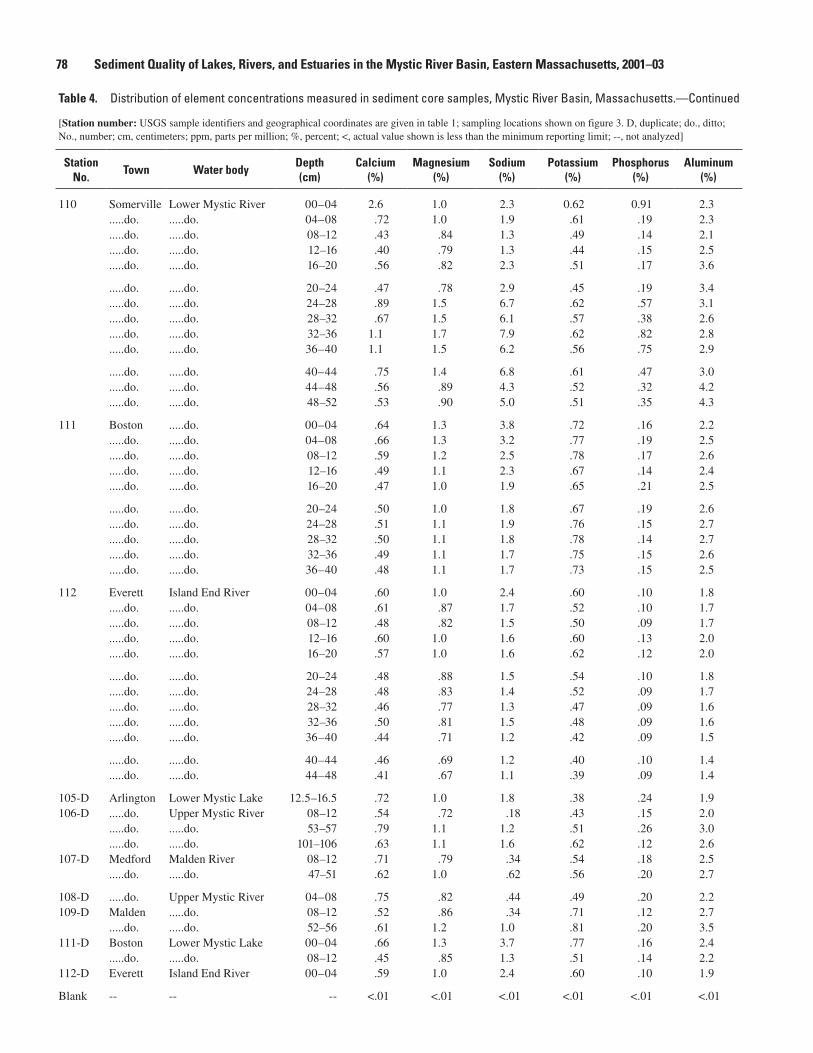
�� Sediment Quality of Lakes, Rivers, and Estuaries in the Mystic River Basin, Eastern Massachusetts, 2001–03
Table �. Distribution of element concentrations measured in sediment core samples, Mystic River Basin, Massachusetts.—Continued
[Station number: USGS sample identifiers and geographical coordinates are given in table 1; sampling locations shown on figure 3. D, duplicate; do., ditto; No., number; cm, centimeters; ppm, parts per million; %, percent; <, actual value shown is less than the minimum reporting limit; --, not analyzed]
Station No.
Town Water bodyDepth (cm)
Calcium (%)
Magnesium (%)
Sodium (%)
Potassium (%)
Phosphorus (%)
Aluminum (%)
110 Somerville Lower Mystic River 00–04 2.6 1.0 2.3 0.62 0.91 2.3.....do. .....do. 04–08 .72 1.0 1.9 .61 .19 2.3.....do. .....do. 08–12 .43 .84 1.3 .49 .14 2.1.....do. .....do. 12–16 .40 .79 1.3 .44 .15 2.5.....do. .....do. 16–20 .56 .82 2.3 .51 .17 3.6
.....do. .....do. 20–24 .47 .78 2.9 .45 .19 3.4
.....do. .....do. 24–28 .89 1.5 6.7 .62 .57 3.1
.....do. .....do. 28–32 .67 1.5 6.1 .57 .38 2.6
.....do. .....do. 32–36 1.1 1.7 7.9 .62 .82 2.8
.....do. .....do. 36–40 1.1 1.5 6.2 .56 .75 2.9
.....do. .....do. 40–44 .75 1.4 6.8 .61 .47 3.0
.....do. .....do. 44–48 .56 .89 4.3 .52 .32 4.2
.....do. .....do. 48–52 .53 .90 5.0 .51 .35 4.3
111 Boston .....do. 00–04 .64 1.3 3.8 .72 .16 2.2.....do. .....do. 04–08 .66 1.3 3.2 .77 .19 2.5.....do. .....do. 08–12 .59 1.2 2.5 .78 .17 2.6.....do. .....do. 12–16 .49 1.1 2.3 .67 .14 2.4.....do. .....do. 16–20 .47 1.0 1.9 .65 .21 2.5
.....do. .....do. 20–24 .50 1.0 1.8 .67 .19 2.6
.....do. .....do. 24–28 .51 1.1 1.9 .76 .15 2.7
.....do. .....do. 28–32 .50 1.1 1.8 .78 .14 2.7
.....do. .....do. 32–36 .49 1.1 1.7 .75 .15 2.6
.....do. .....do. 36–40 .48 1.1 1.7 .73 .15 2.5
112 Everett Island End River 00–04 .60 1.0 2.4 .60 .10 1.8.....do. .....do. 04–08 .61 .87 1.7 .52 .10 1.7.....do. .....do. 08–12 .48 .82 1.5 .50 .09 1.7.....do. .....do. 12–16 .60 1.0 1.6 .60 .13 2.0.....do. .....do. 16–20 .57 1.0 1.6 .62 .12 2.0
.....do. .....do. 20–24 .48 .88 1.5 .54 .10 1.8
.....do. .....do. 24–28 .48 .83 1.4 .52 .09 1.7
.....do. .....do. 28–32 .46 .77 1.3 .47 .09 1.6
.....do. .....do. 32–36 .50 .81 1.5 .48 .09 1.6
.....do. .....do. 36–40 .44 .71 1.2 .42 .09 1.5
.....do. .....do. 40–44 .46 .69 1.2 .40 .10 1.4
.....do. .....do. 44–48 .41 .67 1.1 .39 .09 1.4
105-D Arlington Lower Mystic Lake 12.5–16.5 .72 1.0 1.8 .38 .24 1.9106-D .....do. Upper Mystic River 08–12 .54 .72 .18 .43 .15 2.0
.....do. .....do. 53–57 .79 1.1 1.2 .51 .26 3.0
.....do. .....do. 101–106 .63 1.1 1.6 .62 .12 2.6107-D Medford Malden River 08–12 .71 .79 .34 .54 .18 2.5
.....do. .....do. 47–51 .62 1.0 .62 .56 .20 2.7
108-D .....do. Upper Mystic River 04–08 .75 .82 .44 .49 .20 2.2109-D Malden .....do. 08–12 .52 .86 .34 .71 .12 2.7
.....do. .....do. 52–56 .61 1.2 1.0 .81 .20 3.5111-D Boston Lower Mystic Lake 00–04 .66 1.3 3.7 .77 .16 2.4
.....do. .....do. 08–12 .45 .85 1.3 .51 .14 2.2112-D Everett Island End River 00–04 .59 1.0 2.4 .60 .10 1.9
Blank -- -- -- <.01 <.01 <.01 <.01 <.01 <.01
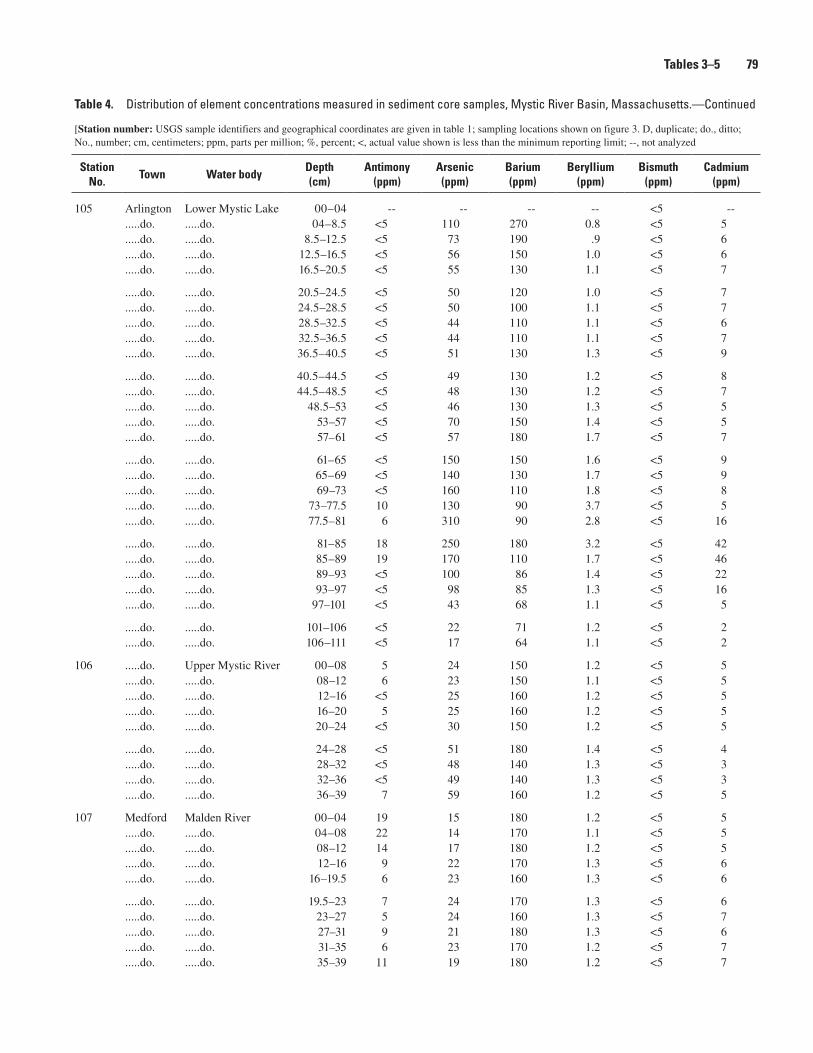
Table �. Distribution of element concentrations measured in sediment core samples, Mystic River Basin, Massachusetts.—Continued
[Station number: USGS sample identifiers and geographical coordinates are given in table 1; sampling locations shown on figure 3. D, duplicate; do., ditto; No., number; cm, centimeters; ppm, parts per million; %, percent; <, actual value shown is less than the minimum reporting limit; --, not analyzed
Station No.
Town Water bodyDepth (cm)
Antimony (ppm)
Arsenic (ppm)
Barium (ppm)
Beryllium (ppm)
Bismuth (ppm)
Cadmium (ppm)
105 Arlington Lower Mystic Lake 00–04 -- -- -- -- <5 --.....do. .....do. 04–8.5 <5 110 270 0.8 <5 5.....do. .....do. 8.5–12.5 <5 73 190 .9 <5 6.....do. .....do. 12.5–16.5 <5 56 150 1.0 <5 6.....do. .....do. 16.5–20.5 <5 55 130 1.1 <5 7
.....do. .....do. 20.5–24.5 <5 50 120 1.0 <5 7
.....do. .....do. 24.5–28.5 <5 50 100 1.1 <5 7
.....do. .....do. 28.5–32.5 <5 44 110 1.1 <5 6
.....do. .....do. 32.5–36.5 <5 44 110 1.1 <5 7
.....do. .....do. 36.5–40.5 <5 51 130 1.3 <5 9
.....do. .....do. 40.5–44.5 <5 49 130 1.2 <5 8
.....do. .....do. 44.5–48.5 <5 48 130 1.2 <5 7
.....do. .....do. 48.5–53 <5 46 130 1.3 <5 5
.....do. .....do. 53–57 <5 70 150 1.4 <5 5
.....do. .....do. 57–61 <5 57 180 1.7 <5 7
.....do. .....do. 61–65 <5 150 150 1.6 <5 9
.....do. .....do. 65–69 <5 140 130 1.7 <5 9
.....do. .....do. 69–73 <5 160 110 1.8 <5 8
.....do. .....do. 73–77.5 10 130 90 3.7 <5 5
.....do. .....do. 77.5–81 6 310 90 2.8 <5 16
.....do. .....do. 81–85 18 250 180 3.2 <5 42
.....do. .....do. 85–89 19 170 110 1.7 <5 46
.....do. .....do. 89–93 <5 100 86 1.4 <5 22
.....do. .....do. 93–97 <5 98 85 1.3 <5 16
.....do. .....do. 97–101 <5 43 68 1.1 <5 5
.....do. .....do. 101–106 <5 22 71 1.2 <5 2
.....do. .....do. 106–111 <5 17 64 1.1 <5 2
106 .....do. Upper Mystic River 00–08 5 24 150 1.2 <5 5.....do. .....do. 08–12 6 23 150 1.1 <5 5.....do. .....do. 12–16 <5 25 160 1.2 <5 5.....do. .....do. 16–20 5 25 160 1.2 <5 5.....do. .....do. 20–24 <5 30 150 1.2 <5 5
.....do. .....do. 24–28 <5 51 180 1.4 <5 4
.....do. .....do. 28–32 <5 48 140 1.3 <5 3
.....do. .....do. 32–36 <5 49 140 1.3 <5 3
.....do. .....do. 36–39 7 59 160 1.2 <5 5
107 Medford Malden River 00–04 19 15 180 1.2 <5 5.....do. .....do. 04–08 22 14 170 1.1 <5 5.....do. .....do. 08–12 14 17 180 1.2 <5 5.....do. .....do. 12–16 9 22 170 1.3 <5 6.....do. .....do. 16–19.5 6 23 160 1.3 <5 6
.....do. .....do. 19.5–23 7 24 170 1.3 <5 6
.....do. .....do. 23–27 5 24 160 1.3 <5 7
.....do. .....do. 27–31 9 21 180 1.3 <5 6
.....do. .....do. 31–35 6 23 170 1.2 <5 7
.....do. .....do. 35–39 11 19 180 1.2 <5 7
Tables 3–� ��
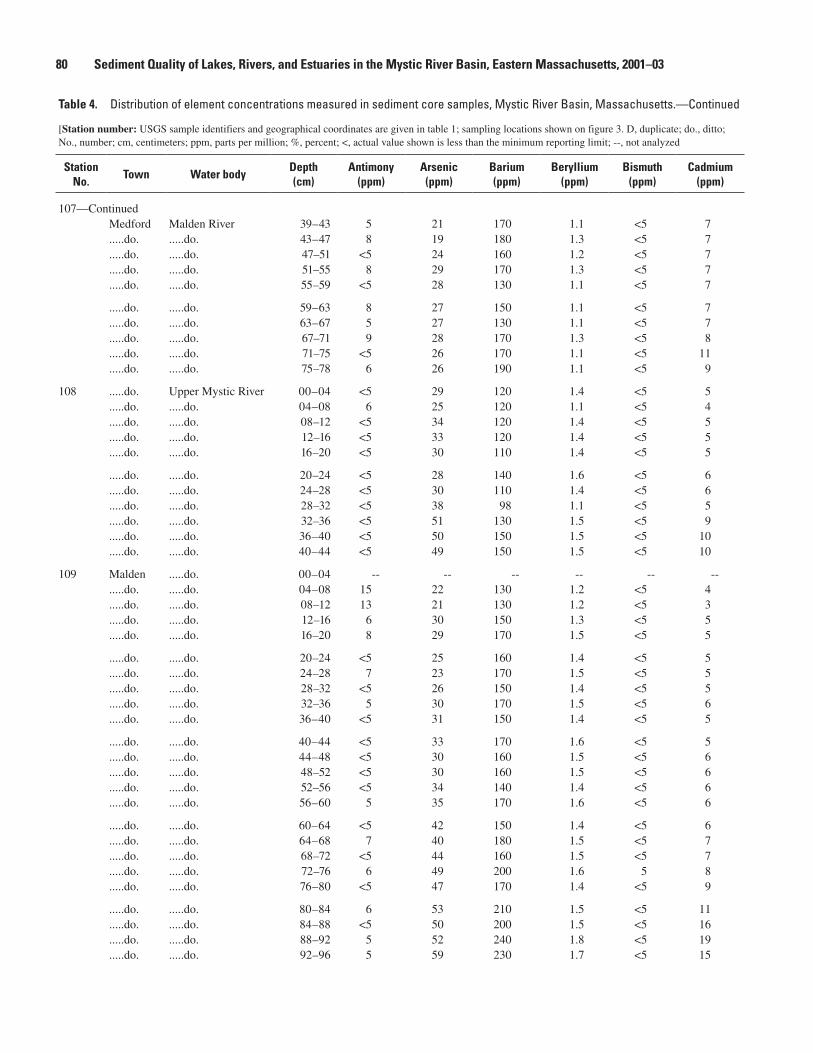
�0 Sediment Quality of Lakes, Rivers, and Estuaries in the Mystic River Basin, Eastern Massachusetts, 2001–03
Table �. Distribution of element concentrations measured in sediment core samples, Mystic River Basin, Massachusetts.—Continued
[Station number: USGS sample identifiers and geographical coordinates are given in table 1; sampling locations shown on figure 3. D, duplicate; do., ditto; No., number; cm, centimeters; ppm, parts per million; %, percent; <, actual value shown is less than the minimum reporting limit; --, not analyzed
Station No.
Town Water bodyDepth (cm)
Antimony (ppm)
Arsenic (ppm)
Barium (ppm)
Beryllium (ppm)
Bismuth (ppm)
Cadmium (ppm)
107—ContinuedMedford Malden River 39–43 5 21 170 1.1 <5 7.....do. .....do. 43–47 8 19 180 1.3 <5 7.....do. .....do. 47–51 <5 24 160 1.2 <5 7.....do. .....do. 51–55 8 29 170 1.3 <5 7.....do. .....do. 55–59 <5 28 130 1.1 <5 7
.....do. .....do. 59–63 8 27 150 1.1 <5 7
.....do. .....do. 63–67 5 27 130 1.1 <5 7
.....do. .....do. 67–71 9 28 170 1.3 <5 8
.....do. .....do. 71–75 <5 26 170 1.1 <5 11
.....do. .....do. 75–78 6 26 190 1.1 <5 9
108 .....do. Upper Mystic River 00–04 <5 29 120 1.4 <5 5.....do. .....do. 04–08 6 25 120 1.1 <5 4.....do. .....do. 08–12 <5 34 120 1.4 <5 5.....do. .....do. 12–16 <5 33 120 1.4 <5 5.....do. .....do. 16–20 <5 30 110 1.4 <5 5
.....do. .....do. 20–24 <5 28 140 1.6 <5 6
.....do. .....do. 24–28 <5 30 110 1.4 <5 6
.....do. .....do. 28–32 <5 38 98 1.1 <5 5
.....do. .....do. 32–36 <5 51 130 1.5 <5 9
.....do. .....do. 36–40 <5 50 150 1.5 <5 10
.....do. .....do. 40–44 <5 49 150 1.5 <5 10
109 Malden .....do. 00–04 -- -- -- -- -- --.....do. .....do. 04–08 15 22 130 1.2 <5 4.....do. .....do. 08–12 13 21 130 1.2 <5 3.....do. .....do. 12–16 6 30 150 1.3 <5 5.....do. .....do. 16–20 8 29 170 1.5 <5 5
.....do. .....do. 20–24 <5 25 160 1.4 <5 5
.....do. .....do. 24–28 7 23 170 1.5 <5 5
.....do. .....do. 28–32 <5 26 150 1.4 <5 5
.....do. .....do. 32–36 5 30 170 1.5 <5 6
.....do. .....do. 36–40 <5 31 150 1.4 <5 5
.....do. .....do. 40–44 <5 33 170 1.6 <5 5
.....do. .....do. 44–48 <5 30 160 1.5 <5 6
.....do. .....do. 48–52 <5 30 160 1.5 <5 6
.....do. .....do. 52–56 <5 34 140 1.4 <5 6
.....do. .....do. 56–60 5 35 170 1.6 <5 6
.....do. .....do. 60–64 <5 42 150 1.4 <5 6
.....do. .....do. 64–68 7 40 180 1.5 <5 7
.....do. .....do. 68–72 <5 44 160 1.5 <5 7
.....do. .....do. 72–76 6 49 200 1.6 5 8
.....do. .....do. 76–80 <5 47 170 1.4 <5 9
.....do. .....do. 80–84 6 53 210 1.5 <5 11
.....do. .....do. 84–88 <5 50 200 1.5 <5 16
.....do. .....do. 88–92 5 52 240 1.8 <5 19
.....do. .....do. 92–96 5 59 230 1.7 <5 15
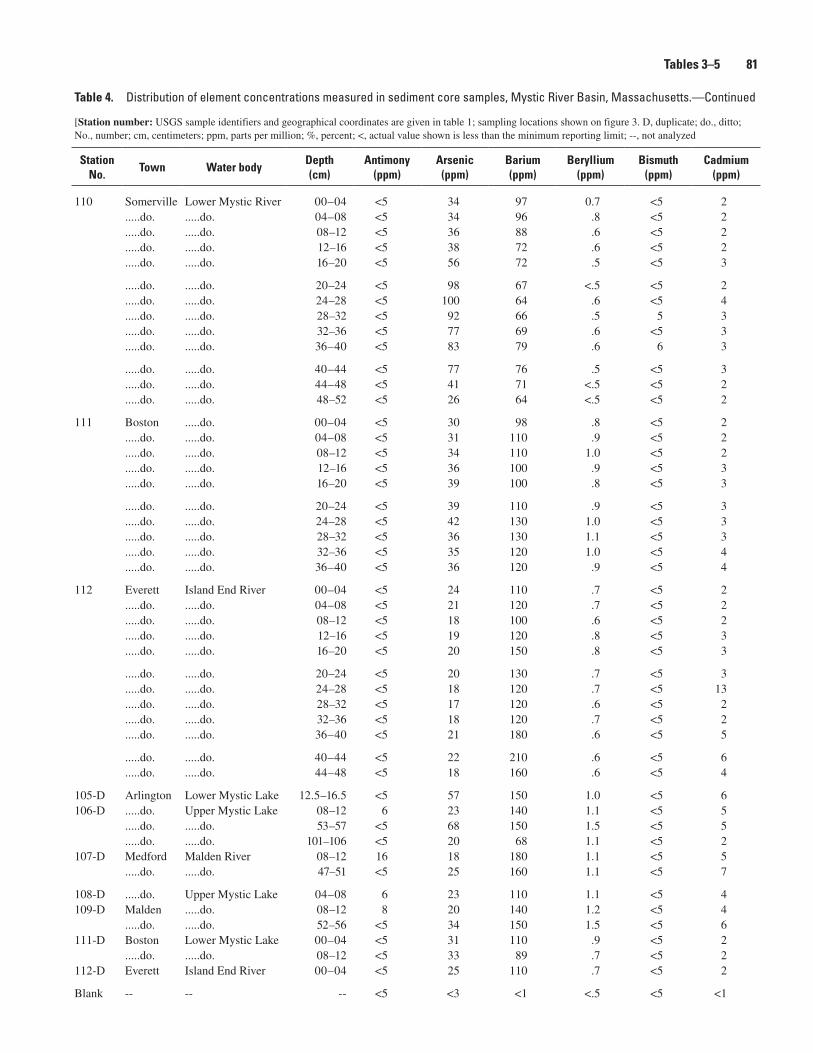
Table �. Distribution of element concentrations measured in sediment core samples, Mystic River Basin, Massachusetts.—Continued
[Station number: USGS sample identifiers and geographical coordinates are given in table 1; sampling locations shown on figure 3. D, duplicate; do., ditto; No., number; cm, centimeters; ppm, parts per million; %, percent; <, actual value shown is less than the minimum reporting limit; --, not analyzed
Station No.
Town Water bodyDepth (cm)
Antimony (ppm)
Arsenic (ppm)
Barium (ppm)
Beryllium (ppm)
Bismuth (ppm)
Cadmium (ppm)
110 Somerville Lower Mystic River 00–04 <5 34 97 0.7 <5 2.....do. .....do. 04–08 <5 34 96 .8 <5 2.....do. .....do. 08–12 <5 36 88 .6 <5 2.....do. .....do. 12–16 <5 38 72 .6 <5 2.....do. .....do. 16–20 <5 56 72 .5 <5 3
.....do. .....do. 20–24 <5 98 67 <.5 <5 2
.....do. .....do. 24–28 <5 100 64 .6 <5 4
.....do. .....do. 28–32 <5 92 66 .5 5 3
.....do. .....do. 32–36 <5 77 69 .6 <5 3
.....do. .....do. 36–40 <5 83 79 .6 6 3
.....do. .....do. 40–44 <5 77 76 .5 <5 3
.....do. .....do. 44–48 <5 41 71 <.5 <5 2
.....do. .....do. 48–52 <5 26 64 <.5 <5 2
111 Boston .....do. 00–04 <5 30 98 .8 <5 2.....do. .....do. 04–08 <5 31 110 .9 <5 2.....do. .....do. 08–12 <5 34 110 1.0 <5 2.....do. .....do. 12–16 <5 36 100 .9 <5 3.....do. .....do. 16–20 <5 39 100 .8 <5 3
.....do. .....do. 20–24 <5 39 110 .9 <5 3
.....do. .....do. 24–28 <5 42 130 1.0 <5 3
.....do. .....do. 28–32 <5 36 130 1.1 <5 3
.....do. .....do. 32–36 <5 35 120 1.0 <5 4
.....do. .....do. 36–40 <5 36 120 .9 <5 4
112 Everett Island End River 00–04 <5 24 110 .7 <5 2.....do. .....do. 04–08 <5 21 120 .7 <5 2.....do. .....do. 08–12 <5 18 100 .6 <5 2.....do. .....do. 12–16 <5 19 120 .8 <5 3.....do. .....do. 16–20 <5 20 150 .8 <5 3
.....do. .....do. 20–24 <5 20 130 .7 <5 3
.....do. .....do. 24–28 <5 18 120 .7 <5 13
.....do. .....do. 28–32 <5 17 120 .6 <5 2
.....do. .....do. 32–36 <5 18 120 .7 <5 2
.....do. .....do. 36–40 <5 21 180 .6 <5 5
.....do. .....do. 40–44 <5 22 210 .6 <5 6
.....do. .....do. 44–48 <5 18 160 .6 <5 4
105-D Arlington Lower Mystic Lake 12.5–16.5 <5 57 150 1.0 <5 6106-D .....do. Upper Mystic Lake 08–12 6 23 140 1.1 <5 5
.....do. .....do. 53–57 <5 68 150 1.5 <5 5
.....do. .....do. 101–106 <5 20 68 1.1 <5 2107-D Medford Malden River 08–12 16 18 180 1.1 <5 5
.....do. .....do. 47–51 <5 25 160 1.1 <5 7
108-D .....do. Upper Mystic Lake 04–08 6 23 110 1.1 <5 4109-D Malden .....do. 08–12 8 20 140 1.2 <5 4
.....do. .....do. 52–56 <5 34 150 1.5 <5 6111-D Boston Lower Mystic Lake 00–04 <5 31 110 .9 <5 2
.....do. .....do. 08–12 <5 33 89 .7 <5 2112-D Everett Island End River 00–04 <5 25 110 .7 <5 2
Blank -- -- -- <5 <3 <1 <.5 <5 <1
Tables 3–� �1
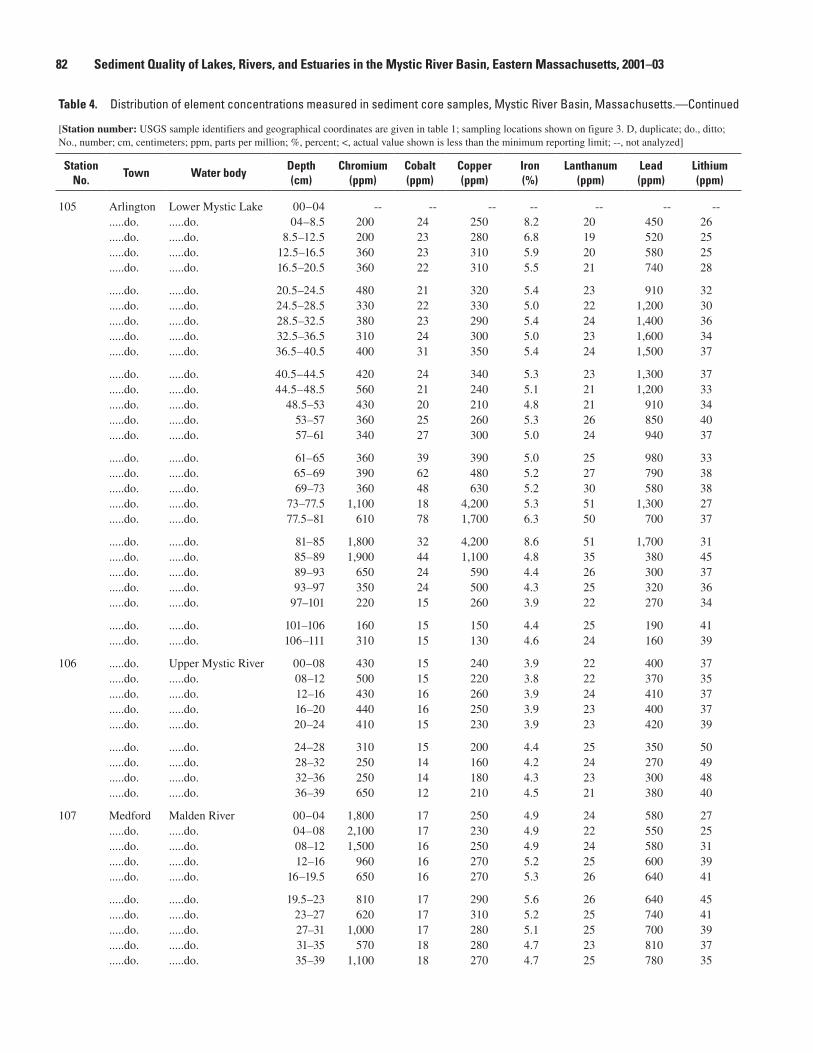
�2 Sediment Quality of Lakes, Rivers, and Estuaries in the Mystic River Basin, Eastern Massachusetts, 2001–03
Table �. Distribution of element concentrations measured in sediment core samples, Mystic River Basin, Massachusetts.—Continued
[Station number: USGS sample identifiers and geographical coordinates are given in table 1; sampling locations shown on figure 3. D, duplicate; do., ditto; No., number; cm, centimeters; ppm, parts per million; %, percent; <, actual value shown is less than the minimum reporting limit; --, not analyzed]
Station No.
Town Water bodyDepth (cm)
Chromium (ppm)
Cobalt (ppm)
Copper (ppm)
Iron (%)
Lanthanum (ppm)
Lead (ppm)
Lithium (ppm)
105 Arlington Lower Mystic Lake 00–04 -- -- -- -- -- -- --.....do. .....do. 04–8.5 200 24 250 8.2 20 450 26.....do. .....do. 8.5–12.5 200 23 280 6.8 19 520 25.....do. .....do. 12.5–16.5 360 23 310 5.9 20 580 25.....do. .....do. 16.5–20.5 360 22 310 5.5 21 740 28
.....do. .....do. 20.5–24.5 480 21 320 5.4 23 910 32
.....do. .....do. 24.5–28.5 330 22 330 5.0 22 1,200 30
.....do. .....do. 28.5–32.5 380 23 290 5.4 24 1,400 36
.....do. .....do. 32.5–36.5 310 24 300 5.0 23 1,600 34
.....do. .....do. 36.5–40.5 400 31 350 5.4 24 1,500 37
.....do. .....do. 40.5–44.5 420 24 340 5.3 23 1,300 37
.....do. .....do. 44.5–48.5 560 21 240 5.1 21 1,200 33
.....do. .....do. 48.5–53 430 20 210 4.8 21 910 34
.....do. .....do. 53–57 360 25 260 5.3 26 850 40
.....do. .....do. 57–61 340 27 300 5.0 24 940 37
.....do. .....do. 61–65 360 39 390 5.0 25 980 33
.....do. .....do. 65–69 390 62 480 5.2 27 790 38
.....do. .....do. 69–73 360 48 630 5.2 30 580 38
.....do. .....do. 73–77.5 1,100 18 4,200 5.3 51 1,300 27
.....do. .....do. 77.5–81 610 78 1,700 6.3 50 700 37
.....do. .....do. 81–85 1,800 32 4,200 8.6 51 1,700 31
.....do. .....do. 85–89 1,900 44 1,100 4.8 35 380 45
.....do. .....do. 89–93 650 24 590 4.4 26 300 37
.....do. .....do. 93–97 350 24 500 4.3 25 320 36
.....do. .....do. 97–101 220 15 260 3.9 22 270 34
.....do. .....do. 101–106 160 15 150 4.4 25 190 41
.....do. .....do. 106–111 310 15 130 4.6 24 160 39
106 .....do. Upper Mystic River 00–08 430 15 240 3.9 22 400 37.....do. .....do. 08–12 500 15 220 3.8 22 370 35.....do. .....do. 12–16 430 16 260 3.9 24 410 37.....do. .....do. 16–20 440 16 250 3.9 23 400 37.....do. .....do. 20–24 410 15 230 3.9 23 420 39
.....do. .....do. 24–28 310 15 200 4.4 25 350 50
.....do. .....do. 28–32 250 14 160 4.2 24 270 49
.....do. .....do. 32–36 250 14 180 4.3 23 300 48
.....do. .....do. 36–39 650 12 210 4.5 21 380 40
107 Medford Malden River 00–04 1,800 17 250 4.9 24 580 27.....do. .....do. 04–08 2,100 17 230 4.9 22 550 25.....do. .....do. 08–12 1,500 16 250 4.9 24 580 31.....do. .....do. 12–16 960 16 270 5.2 25 600 39.....do. .....do. 16–19.5 650 16 270 5.3 26 640 41
.....do. .....do. 19.5–23 810 17 290 5.6 26 640 45
.....do. .....do. 23–27 620 17 310 5.2 25 740 41
.....do. .....do. 27–31 1,000 17 280 5.1 25 700 39
.....do. .....do. 31–35 570 18 280 4.7 23 810 37
.....do. .....do. 35–39 1,100 18 270 4.7 25 780 35
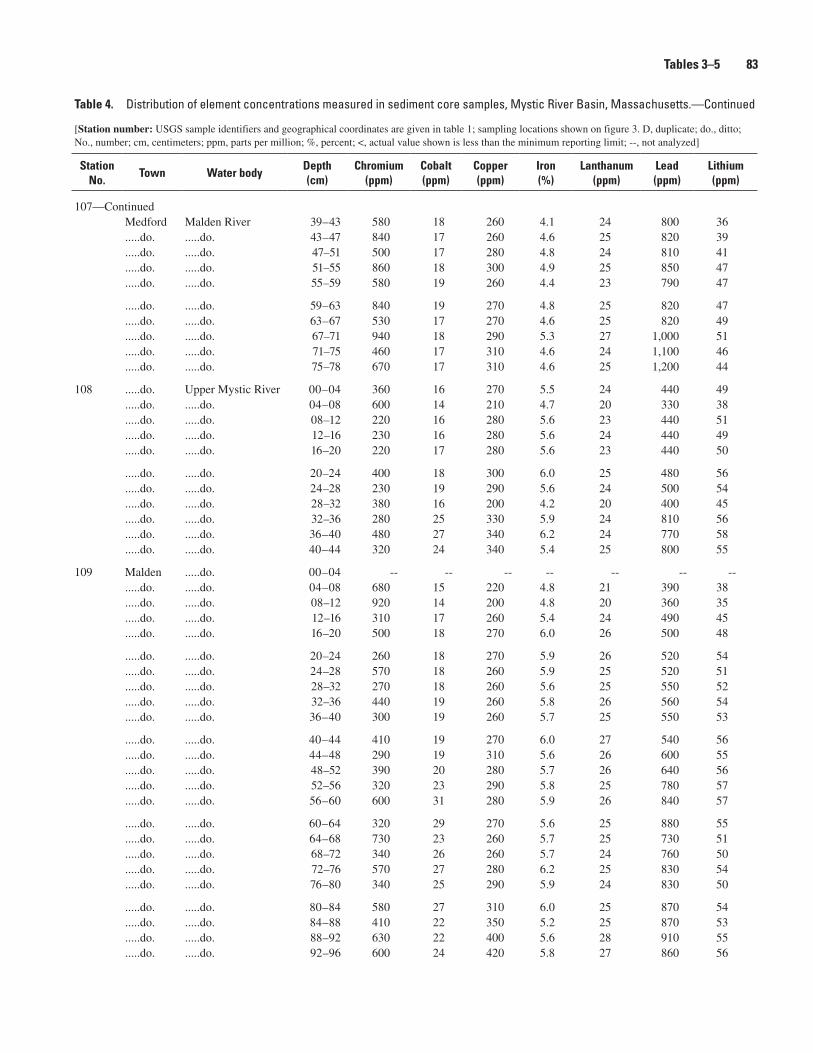
Table �. Distribution of element concentrations measured in sediment core samples, Mystic River Basin, Massachusetts.—Continued
[Station number: USGS sample identifiers and geographical coordinates are given in table 1; sampling locations shown on figure 3. D, duplicate; do., ditto; No., number; cm, centimeters; ppm, parts per million; %, percent; <, actual value shown is less than the minimum reporting limit; --, not analyzed]
Station No.
Town Water bodyDepth (cm)
Chromium (ppm)
Cobalt (ppm)
Copper (ppm)
Iron (%)
Lanthanum (ppm)
Lead (ppm)
Lithium (ppm)
107—ContinuedMedford Malden River 39–43 580 18 260 4.1 24 800 36.....do. .....do. 43–47 840 17 260 4.6 25 820 39.....do. .....do. 47–51 500 17 280 4.8 24 810 41.....do. .....do. 51–55 860 18 300 4.9 25 850 47.....do. .....do. 55–59 580 19 260 4.4 23 790 47
.....do. .....do. 59–63 840 19 270 4.8 25 820 47
.....do. .....do. 63–67 530 17 270 4.6 25 820 49
.....do. .....do. 67–71 940 18 290 5.3 27 1,000 51
.....do. .....do. 71–75 460 17 310 4.6 24 1,100 46
.....do. .....do. 75–78 670 17 310 4.6 25 1,200 44
108 .....do. Upper Mystic River 00–04 360 16 270 5.5 24 440 49.....do. .....do. 04–08 600 14 210 4.7 20 330 38.....do. .....do. 08–12 220 16 280 5.6 23 440 51.....do. .....do. 12–16 230 16 280 5.6 24 440 49.....do. .....do. 16–20 220 17 280 5.6 23 440 50
.....do. .....do. 20–24 400 18 300 6.0 25 480 56
.....do. .....do. 24–28 230 19 290 5.6 24 500 54
.....do. .....do. 28–32 380 16 200 4.2 20 400 45
.....do. .....do. 32–36 280 25 330 5.9 24 810 56
.....do. .....do. 36–40 480 27 340 6.2 24 770 58
.....do. .....do. 40–44 320 24 340 5.4 25 800 55
109 Malden .....do. 00–04 -- -- -- -- -- -- --.....do. .....do. 04–08 680 15 220 4.8 21 390 38.....do. .....do. 08–12 920 14 200 4.8 20 360 35.....do. .....do. 12–16 310 17 260 5.4 24 490 45.....do. .....do. 16–20 500 18 270 6.0 26 500 48
.....do. .....do. 20–24 260 18 270 5.9 26 520 54
.....do. .....do. 24–28 570 18 260 5.9 25 520 51
.....do. .....do. 28–32 270 18 260 5.6 25 550 52
.....do. .....do. 32–36 440 19 260 5.8 26 560 54
.....do. .....do. 36–40 300 19 260 5.7 25 550 53
.....do. .....do. 40–44 410 19 270 6.0 27 540 56
.....do. .....do. 44–48 290 19 310 5.6 26 600 55
.....do. .....do. 48–52 390 20 280 5.7 26 640 56
.....do. .....do. 52–56 320 23 290 5.8 25 780 57
.....do. .....do. 56–60 600 31 280 5.9 26 840 57
.....do. .....do. 60–64 320 29 270 5.6 25 880 55
.....do. .....do. 64–68 730 23 260 5.7 25 730 51
.....do. .....do. 68–72 340 26 260 5.7 24 760 50
.....do. .....do. 72–76 570 27 280 6.2 25 830 54
.....do. .....do. 76–80 340 25 290 5.9 24 830 50
.....do. .....do. 80–84 580 27 310 6.0 25 870 54
.....do. .....do. 84–88 410 22 350 5.2 25 870 53
.....do. .....do. 88–92 630 22 400 5.6 28 910 55
.....do. .....do. 92–96 600 24 420 5.8 27 860 56
Tables 3–� �3
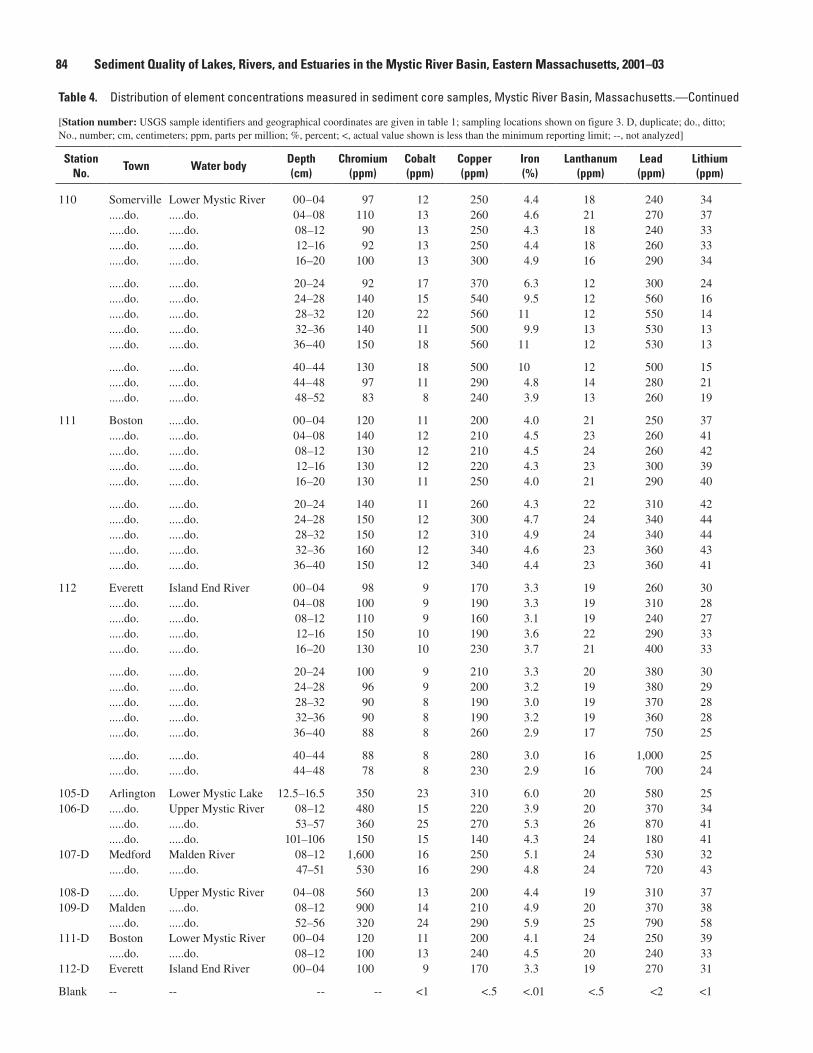
�� Sediment Quality of Lakes, Rivers, and Estuaries in the Mystic River Basin, Eastern Massachusetts, 2001–03
Table �. Distribution of element concentrations measured in sediment core samples, Mystic River Basin, Massachusetts.—Continued
[Station number: USGS sample identifiers and geographical coordinates are given in table 1; sampling locations shown on figure 3. D, duplicate; do., ditto; No., number; cm, centimeters; ppm, parts per million; %, percent; <, actual value shown is less than the minimum reporting limit; --, not analyzed]
Station No.
Town Water bodyDepth (cm)
Chromium (ppm)
Cobalt (ppm)
Copper (ppm)
Iron (%)
Lanthanum (ppm)
Lead (ppm)
Lithium (ppm)
110 Somerville Lower Mystic River 00–04 97 12 250 4.4 18 240 34.....do. .....do. 04–08 110 13 260 4.6 21 270 37.....do. .....do. 08–12 90 13 250 4.3 18 240 33.....do. .....do. 12–16 92 13 250 4.4 18 260 33.....do. .....do. 16–20 100 13 300 4.9 16 290 34
.....do. .....do. 20–24 92 17 370 6.3 12 300 24
.....do. .....do. 24–28 140 15 540 9.5 12 560 16
.....do. .....do. 28–32 120 22 560 11 12 550 14
.....do. .....do. 32–36 140 11 500 9.9 13 530 13
.....do. .....do. 36–40 150 18 560 11 12 530 13
.....do. .....do. 40–44 130 18 500 10 12 500 15
.....do. .....do. 44–48 97 11 290 4.8 14 280 21
.....do. .....do. 48–52 83 8 240 3.9 13 260 19
111 Boston .....do. 00–04 120 11 200 4.0 21 250 37.....do. .....do. 04–08 140 12 210 4.5 23 260 41.....do. .....do. 08–12 130 12 210 4.5 24 260 42.....do. .....do. 12–16 130 12 220 4.3 23 300 39.....do. .....do. 16–20 130 11 250 4.0 21 290 40
.....do. .....do. 20–24 140 11 260 4.3 22 310 42
.....do. .....do. 24–28 150 12 300 4.7 24 340 44
.....do. .....do. 28–32 150 12 310 4.9 24 340 44
.....do. .....do. 32–36 160 12 340 4.6 23 360 43
.....do. .....do. 36–40 150 12 340 4.4 23 360 41
112 Everett Island End River 00–04 98 9 170 3.3 19 260 30.....do. .....do. 04–08 100 9 190 3.3 19 310 28.....do. .....do. 08–12 110 9 160 3.1 19 240 27.....do. .....do. 12–16 150 10 190 3.6 22 290 33.....do. .....do. 16–20 130 10 230 3.7 21 400 33
.....do. .....do. 20–24 100 9 210 3.3 20 380 30
.....do. .....do. 24–28 96 9 200 3.2 19 380 29
.....do. .....do. 28–32 90 8 190 3.0 19 370 28
.....do. .....do. 32–36 90 8 190 3.2 19 360 28
.....do. .....do. 36–40 88 8 260 2.9 17 750 25
.....do. .....do. 40–44 88 8 280 3.0 16 1,000 25
.....do. .....do. 44–48 78 8 230 2.9 16 700 24
105-D Arlington Lower Mystic Lake 12.5–16.5 350 23 310 6.0 20 580 25106-D .....do. Upper Mystic River 08–12 480 15 220 3.9 20 370 34
.....do. .....do. 53–57 360 25 270 5.3 26 870 41
.....do. .....do. 101–106 150 15 140 4.3 24 180 41107-D Medford Malden River 08–12 1,600 16 250 5.1 24 530 32
.....do. .....do. 47–51 530 16 290 4.8 24 720 43
108-D .....do. Upper Mystic River 04–08 560 13 200 4.4 19 310 37109-D Malden .....do. 08–12 900 14 210 4.9 20 370 38
.....do. .....do. 52–56 320 24 290 5.9 25 790 58111-D Boston Lower Mystic River 00–04 120 11 200 4.1 24 250 39
.....do. .....do. 08–12 100 13 240 4.5 20 240 33112-D Everett Island End River 00–04 100 9 170 3.3 19 270 31
Blank -- -- -- -- <1 <.5 <.01 <.5 <2 <1

Table �. Distribution of element concentrations measured in sediment core samples, Mystic River Basin, Massachusetts.—Continued
[Station number: USGS sample identifiers and geographical coordinates are given in table 1; sampling locations shown on figure 3. D, duplicate; do., ditto; No., number; cm, centimeters; ppm, parts per million; %, percent; <, actual value shown is less than the minimum reporting limit; --, not analyzed]
Station No.
Town Water bodyDepth (cm)
Manganese (ppm)
Molybdenum (ppm)
Mercury (ppm)
Nickel (ppm)
Scandium (ppm)
Silver (ppm)
Strontium (ppm)
105 Arlington Lower Mystic Lake 00–04 -- -- -- -- -- -- --.....do. .....do. 04–8.5 1,100 4 -- 47 2.8 0.9 130.....do. .....do. 8.5–12.5 820 5 -- 47 3.0 .8 110.....do. .....do. 12.5–16.5 730 6 -- 46 3.2 1.1 110.....do. .....do. 16.5–20.5 630 4 -- 48 3.6 1.0 110
.....do. .....do. 20.5–24.5 540 6 -- 53 3.8 1.3 96
.....do. .....do. 24.5–28.5 410 4 -- 46 3.8 1.4 91
.....do. .....do. 28.5–32.5 400 5 -- 52 4.2 1.5 92
.....do. .....do. 32.5–36.5 360 5 -- 48 4.0 1.5 92
.....do. .....do. 36.5–40.5 370 5 -- 53 4.3 1.9 110
.....do. .....do. 40.5–44.5 370 15 -- 57 4.4 8.3 98
.....do. .....do. 44.5–48.5 370 32 -- 57 4.3 4.4 100
.....do. .....do. 48.5–53 350 12 -- 48 4.5 1.9 100
.....do. .....do. 53–57 380 8 -- 47 5.7 1.1 110
.....do. .....do. 57–61 310 13 -- 47 5.4 1.2 130
.....do. .....do. 61–65 420 17 -- 46 5.1 1.1 120
.....do. .....do. 65–69 400 9 -- 42 5.5 .9 120
.....do. .....do. 69–73 350 5 -- 37 5.2 .7 120
.....do. .....do. 73–77.5 210 7 -- 32 4.2 .3 280
.....do. .....do. 77.5–81 380 5 -- 37 4.9 .5 150
.....do. .....do. 81–85 340 7 -- 32 4.5 .3 330
.....do. .....do. 85–89 490 12 -- 38 6.2 .7 130
.....do. .....do. 89–93 450 13 -- 39 6.2 .4 89
.....do. .....do. 93–97 390 17 -- 35 5.5 1.3 110
.....do. .....do. 97–101 300 25 -- 30 4.9 .7 87
.....do. .....do. 101–106 380 27 -- 33 5.9 .7 65
.....do. .....do. 106–111 370 27 -- 35 5.3 .5 63
106 .....do. Upper Mystic River 00–08 500 6 -- 57 5.0 1.7 52.....do. .....do. 08–12 460 6 -- 56 4.8 1.5 48.....do. .....do. 12–16 480 5 -- 59 5.2 1.7 51.....do. .....do. 16–20 470 5 -- 58 5.1 1.5 53.....do. .....do. 20–24 470 6 -- 58 5.2 1.5 56
.....do. .....do. 24–28 520 5 -- 52 6.6 1.2 69
.....do. .....do. 28–32 480 5 -- 42 6.4 1.0 62
.....do. .....do. 32–36 450 6 -- 41 6.0 1.2 90
.....do. .....do. 36–39 430 9 -- 50 5.2 1.2 73
107 Medford Malden River 00–04 510 17 -- 110 4.5 .9 65.....do. .....do. 04–08 500 19 -- 120 4.3 1.0 64.....do. .....do. 08–12 490 16 -- 97 4.7 .9 69.....do. .....do. 12–16 520 10 -- 78 5.5 .8 77.....do. .....do. 16–19.5 530 9 -- 73 5.3 .9 81
.....do. .....do. 19.5–23 550 11 -- 79 5.9 1.1 79
.....do. .....do. 23–27 530 9 -- 75 5.3 1.1 80
.....do. .....do. 27–31 530 10 -- 83 5.7 1.2 79
.....do. .....do. 31–35 450 9 -- 78 4.9 1.1 78
.....do. .....do. 35–39 460 11 -- 95 5.2 1.2 76
Tables 3–� ��
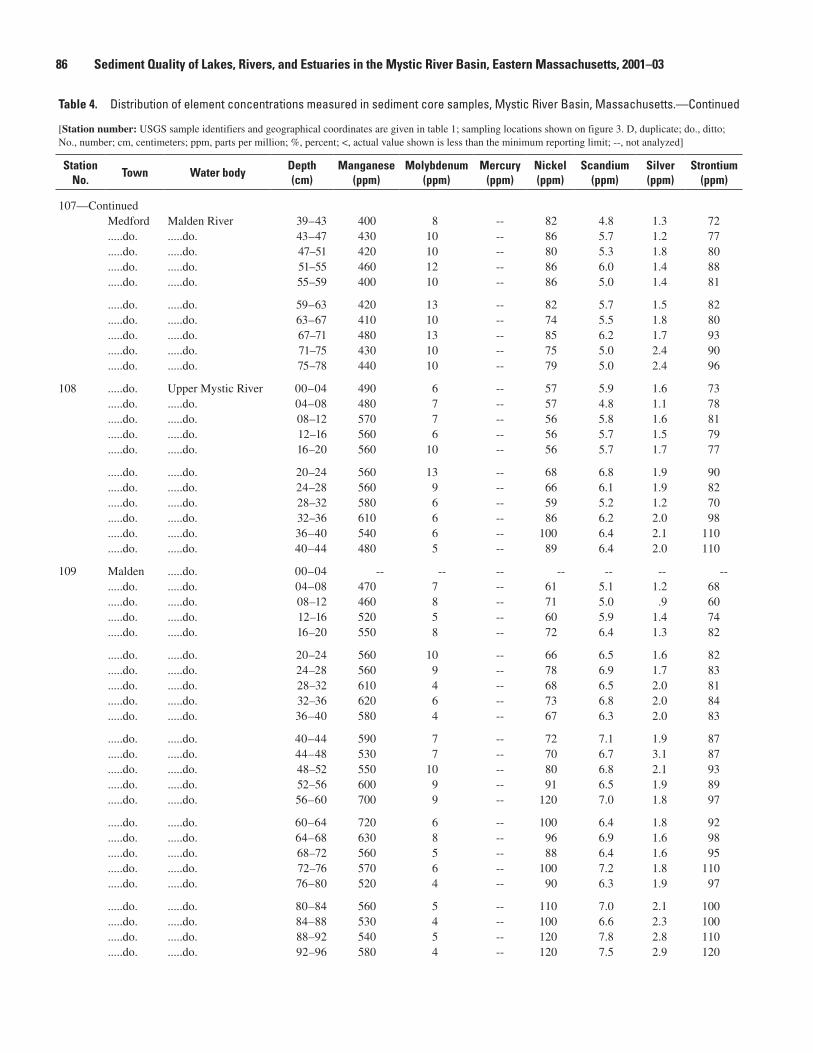
�� Sediment Quality of Lakes, Rivers, and Estuaries in the Mystic River Basin, Eastern Massachusetts, 2001–03
Table �. Distribution of element concentrations measured in sediment core samples, Mystic River Basin, Massachusetts.—Continued
[Station number: USGS sample identifiers and geographical coordinates are given in table 1; sampling locations shown on figure 3. D, duplicate; do., ditto; No., number; cm, centimeters; ppm, parts per million; %, percent; <, actual value shown is less than the minimum reporting limit; --, not analyzed]
Station No.
Town Water bodyDepth (cm)
Manganese (ppm)
Molybdenum (ppm)
Mercury (ppm)
Nickel (ppm)
Scandium (ppm)
Silver (ppm)
Strontium (ppm)
107—ContinuedMedford Malden River 39–43 400 8 -- 82 4.8 1.3 72.....do. .....do. 43–47 430 10 -- 86 5.7 1.2 77.....do. .....do. 47–51 420 10 -- 80 5.3 1.8 80.....do. .....do. 51–55 460 12 -- 86 6.0 1.4 88.....do. .....do. 55–59 400 10 -- 86 5.0 1.4 81
.....do. .....do. 59–63 420 13 -- 82 5.7 1.5 82
.....do. .....do. 63–67 410 10 -- 74 5.5 1.8 80
.....do. .....do. 67–71 480 13 -- 85 6.2 1.7 93
.....do. .....do. 71–75 430 10 -- 75 5.0 2.4 90
.....do. .....do. 75–78 440 10 -- 79 5.0 2.4 96
108 .....do. Upper Mystic River 00–04 490 6 -- 57 5.9 1.6 73.....do. .....do. 04–08 480 7 -- 57 4.8 1.1 78.....do. .....do. 08–12 570 7 -- 56 5.8 1.6 81.....do. .....do. 12–16 560 6 -- 56 5.7 1.5 79.....do. .....do. 16–20 560 10 -- 56 5.7 1.7 77
.....do. .....do. 20–24 560 13 -- 68 6.8 1.9 90
.....do. .....do. 24–28 560 9 -- 66 6.1 1.9 82
.....do. .....do. 28–32 580 6 -- 59 5.2 1.2 70
.....do. .....do. 32–36 610 6 -- 86 6.2 2.0 98
.....do. .....do. 36–40 540 6 -- 100 6.4 2.1 110
.....do. .....do. 40–44 480 5 -- 89 6.4 2.0 110
109 Malden .....do. 00–04 -- -- -- -- -- -- --.....do. .....do. 04–08 470 7 -- 61 5.1 1.2 68.....do. .....do. 08–12 460 8 -- 71 5.0 .9 60.....do. .....do. 12–16 520 5 -- 60 5.9 1.4 74.....do. .....do. 16–20 550 8 -- 72 6.4 1.3 82
.....do. .....do. 20–24 560 10 -- 66 6.5 1.6 82
.....do. .....do. 24–28 560 9 -- 78 6.9 1.7 83
.....do. .....do. 28–32 610 4 -- 68 6.5 2.0 81
.....do. .....do. 32–36 620 6 -- 73 6.8 2.0 84
.....do. .....do. 36–40 580 4 -- 67 6.3 2.0 83
.....do. .....do. 40–44 590 7 -- 72 7.1 1.9 87
.....do. .....do. 44–48 530 7 -- 70 6.7 3.1 87
.....do. .....do. 48–52 550 10 -- 80 6.8 2.1 93
.....do. .....do. 52–56 600 9 -- 91 6.5 1.9 89
.....do. .....do. 56–60 700 9 -- 120 7.0 1.8 97
.....do. .....do. 60–64 720 6 -- 100 6.4 1.8 92
.....do. .....do. 64–68 630 8 -- 96 6.9 1.6 98
.....do. .....do. 68–72 560 5 -- 88 6.4 1.6 95
.....do. .....do. 72–76 570 6 -- 100 7.2 1.8 110
.....do. .....do. 76–80 520 4 -- 90 6.3 1.9 97
.....do. .....do. 80–84 560 5 -- 110 7.0 2.1 100
.....do. .....do. 84–88 530 4 -- 100 6.6 2.3 100
.....do. .....do. 88–92 540 5 -- 120 7.8 2.8 110
.....do. .....do. 92–96 580 4 -- 120 7.5 2.9 120
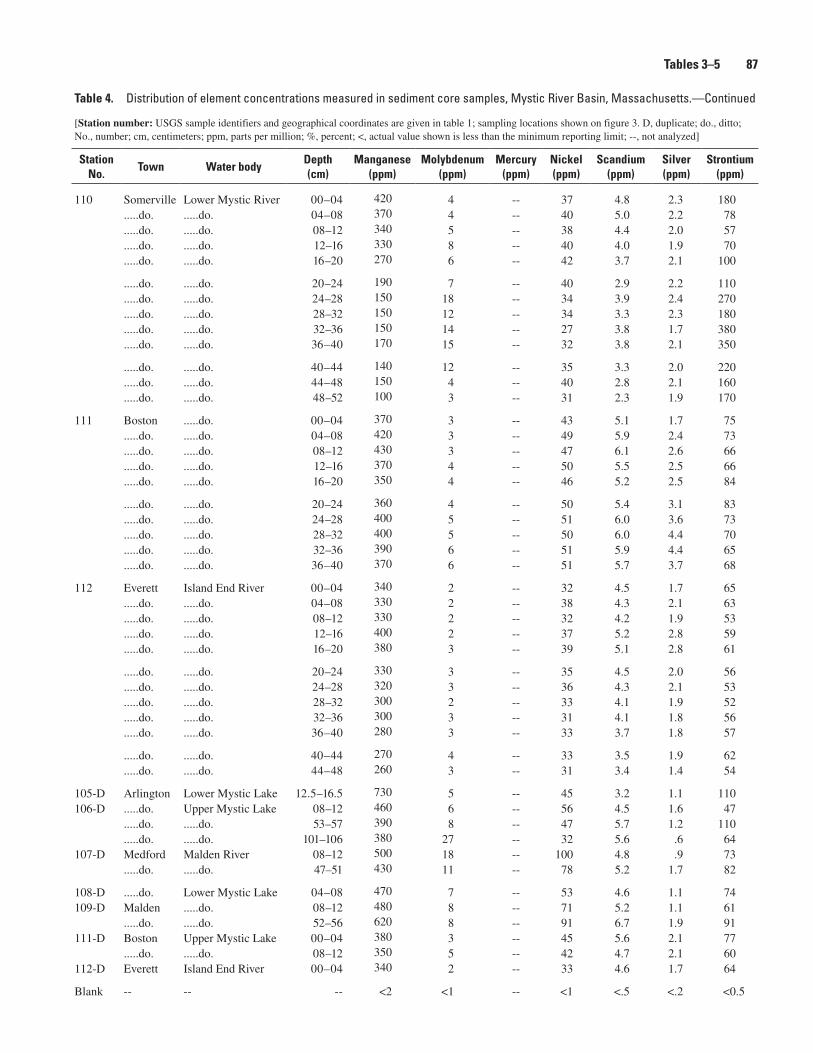
Table �. Distribution of element concentrations measured in sediment core samples, Mystic River Basin, Massachusetts.—Continued
[Station number: USGS sample identifiers and geographical coordinates are given in table 1; sampling locations shown on figure 3. D, duplicate; do., ditto; No., number; cm, centimeters; ppm, parts per million; %, percent; <, actual value shown is less than the minimum reporting limit; --, not analyzed]
Station No.
Town Water bodyDepth (cm)
Manganese (ppm)
Molybdenum (ppm)
Mercury (ppm)
Nickel (ppm)
Scandium (ppm)
Silver (ppm)
Strontium (ppm)
110 Somerville Lower Mystic River 00–04 420 4 -- 37 4.8 2.3 180.....do. .....do. 04–08 370 4 -- 40 5.0 2.2 78.....do. .....do. 08–12 340 5 -- 38 4.4 2.0 57.....do. .....do. 12–16 330 8 -- 40 4.0 1.9 70.....do. .....do. 16–20 270 6 -- 42 3.7 2.1 100
.....do. .....do. 20–24 190 7 -- 40 2.9 2.2 110
.....do. .....do. 24–28 150 18 -- 34 3.9 2.4 270
.....do. .....do. 28–32 150 12 -- 34 3.3 2.3 180
.....do. .....do. 32–36 150 14 -- 27 3.8 1.7 380
.....do. .....do. 36–40 170 15 -- 32 3.8 2.1 350
.....do. .....do. 40–44 140 12 -- 35 3.3 2.0 220
.....do. .....do. 44–48 150 4 -- 40 2.8 2.1 160
.....do. .....do. 48–52 100 3 -- 31 2.3 1.9 170
111 Boston .....do. 00–04 370 3 -- 43 5.1 1.7 75.....do. .....do. 04–08 420 3 -- 49 5.9 2.4 73.....do. .....do. 08–12 430 3 -- 47 6.1 2.6 66.....do. .....do. 12–16 370 4 -- 50 5.5 2.5 66.....do. .....do. 16–20 350 4 -- 46 5.2 2.5 84
.....do. .....do. 20–24 360 4 -- 50 5.4 3.1 83
.....do. .....do. 24–28 400 5 -- 51 6.0 3.6 73
.....do. .....do. 28–32 400 5 -- 50 6.0 4.4 70
.....do. .....do. 32–36 390 6 -- 51 5.9 4.4 65
.....do. .....do. 36–40 370 6 -- 51 5.7 3.7 68
112 Everett Island End River 00–04 340 2 -- 32 4.5 1.7 65.....do. .....do. 04–08 330 2 -- 38 4.3 2.1 63.....do. .....do. 08–12 330 2 -- 32 4.2 1.9 53.....do. .....do. 12–16 400 2 -- 37 5.2 2.8 59.....do. .....do. 16–20 380 3 -- 39 5.1 2.8 61
.....do. .....do. 20–24 330 3 -- 35 4.5 2.0 56
.....do. .....do. 24–28 320 3 -- 36 4.3 2.1 53
.....do. .....do. 28–32 300 2 -- 33 4.1 1.9 52
.....do. .....do. 32–36 300 3 -- 31 4.1 1.8 56
.....do. .....do. 36–40 280 3 -- 33 3.7 1.8 57
.....do. .....do. 40–44 270 4 -- 33 3.5 1.9 62
.....do. .....do. 44–48 260 3 -- 31 3.4 1.4 54
105-D Arlington Lower Mystic Lake 12.5–16.5 730 5 -- 45 3.2 1.1 110106-D .....do. Upper Mystic Lake 08–12 460 6 -- 56 4.5 1.6 47
.....do. .....do. 53–57 390 8 -- 47 5.7 1.2 110
.....do. .....do. 101–106 380 27 -- 32 5.6 .6 64107-D Medford Malden River 08–12 500 18 -- 100 4.8 .9 73
.....do. .....do. 47–51 430 11 -- 78 5.2 1.7 82
108-D .....do. Lower Mystic Lake 04–08 470 7 -- 53 4.6 1.1 74109-D Malden .....do. 08–12 480 8 -- 71 5.2 1.1 61
.....do. .....do. 52–56 620 8 -- 91 6.7 1.9 91111-D Boston Upper Mystic Lake 00–04 380 3 -- 45 5.6 2.1 77
.....do. .....do. 08–12 350 5 -- 42 4.7 2.1 60112-D Everett Island End River 00–04 340 2 -- 33 4.6 1.7 64
Blank -- -- -- <2 <1 -- <1 <.5 <.2 <0.5
Tables 3–� ��
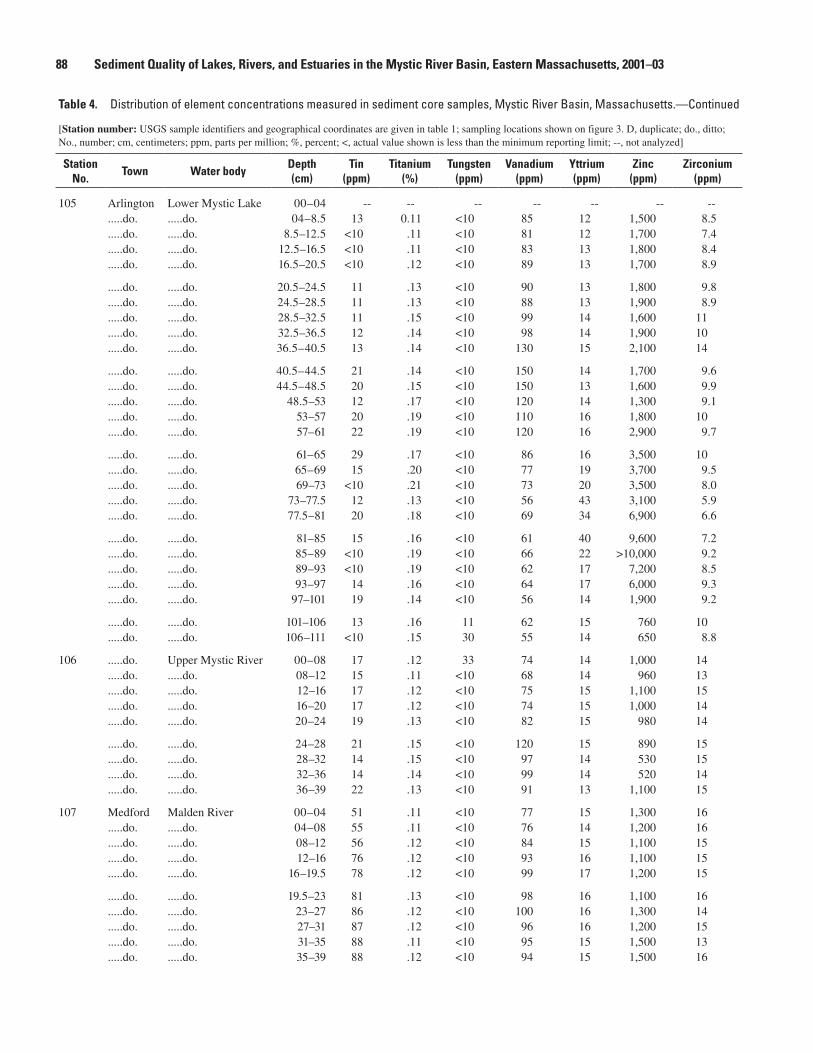
�� Sediment Quality of Lakes, Rivers, and Estuaries in the Mystic River Basin, Eastern Massachusetts, 2001–03
Table �. Distribution of element concentrations measured in sediment core samples, Mystic River Basin, Massachusetts.—Continued
[Station number: USGS sample identifiers and geographical coordinates are given in table 1; sampling locations shown on figure 3. D, duplicate; do., ditto; No., number; cm, centimeters; ppm, parts per million; %, percent; <, actual value shown is less than the minimum reporting limit; --, not analyzed]
Station No.
Town Water bodyDepth (cm)
Tin (ppm)
Titanium (%)
Tungsten (ppm)
Vanadium (ppm)
Yttrium (ppm)
Zinc (ppm)
Zirconium (ppm)
105 Arlington Lower Mystic Lake 00–04 -- -- -- -- -- -- --.....do. .....do. 04–8.5 13 0.11 <10 85 12 1,500 8.5.....do. .....do. 8.5–12.5 <10 .11 <10 81 12 1,700 7.4.....do. .....do. 12.5–16.5 <10 .11 <10 83 13 1,800 8.4.....do. .....do. 16.5–20.5 <10 .12 <10 89 13 1,700 8.9
.....do. .....do. 20.5–24.5 11 .13 <10 90 13 1,800 9.8
.....do. .....do. 24.5–28.5 11 .13 <10 88 13 1,900 8.9
.....do. .....do. 28.5–32.5 11 .15 <10 99 14 1,600 11
.....do. .....do. 32.5–36.5 12 .14 <10 98 14 1,900 10
.....do. .....do. 36.5–40.5 13 .14 <10 130 15 2,100 14
.....do. .....do. 40.5–44.5 21 .14 <10 150 14 1,700 9.6
.....do. .....do. 44.5–48.5 20 .15 <10 150 13 1,600 9.9
.....do. .....do. 48.5–53 12 .17 <10 120 14 1,300 9.1
.....do. .....do. 53–57 20 .19 <10 110 16 1,800 10
.....do. .....do. 57–61 22 .19 <10 120 16 2,900 9.7
.....do. .....do. 61–65 29 .17 <10 86 16 3,500 10
.....do. .....do. 65–69 15 .20 <10 77 19 3,700 9.5
.....do. .....do. 69–73 <10 .21 <10 73 20 3,500 8.0
.....do. .....do. 73–77.5 12 .13 <10 56 43 3,100 5.9
.....do. .....do. 77.5–81 20 .18 <10 69 34 6,900 6.6
.....do. .....do. 81–85 15 .16 <10 61 40 9,600 7.2
.....do. .....do. 85–89 <10 .19 <10 66 22 >10,000 9.2
.....do. .....do. 89–93 <10 .19 <10 62 17 7,200 8.5
.....do. .....do. 93–97 14 .16 <10 64 17 6,000 9.3
.....do. .....do. 97–101 19 .14 <10 56 14 1,900 9.2
.....do. .....do. 101–106 13 .16 11 62 15 760 10
.....do. .....do. 106–111 <10 .15 30 55 14 650 8.8
106 .....do. Upper Mystic River 00–08 17 .12 33 74 14 1,000 14.....do. .....do. 08–12 15 .11 <10 68 14 960 13.....do. .....do. 12–16 17 .12 <10 75 15 1,100 15.....do. .....do. 16–20 17 .12 <10 74 15 1,000 14.....do. .....do. 20–24 19 .13 <10 82 15 980 14
.....do. .....do. 24–28 21 .15 <10 120 15 890 15
.....do. .....do. 28–32 14 .15 <10 97 14 530 15
.....do. .....do. 32–36 14 .14 <10 99 14 520 14
.....do. .....do. 36–39 22 .13 <10 91 13 1,100 15
107 Medford Malden River 00–04 51 .11 <10 77 15 1,300 16.....do. .....do. 04–08 55 .11 <10 76 14 1,200 16.....do. .....do. 08–12 56 .12 <10 84 15 1,100 15.....do. .....do. 12–16 76 .12 <10 93 16 1,100 15.....do. .....do. 16–19.5 78 .12 <10 99 17 1,200 15
.....do. .....do. 19.5–23 81 .13 <10 98 16 1,100 16
.....do. .....do. 23–27 86 .12 <10 100 16 1,300 14
.....do. .....do. 27–31 87 .12 <10 96 16 1,200 15
.....do. .....do. 31–35 88 .11 <10 95 15 1,500 13
.....do. .....do. 35–39 88 .12 <10 94 15 1,500 16
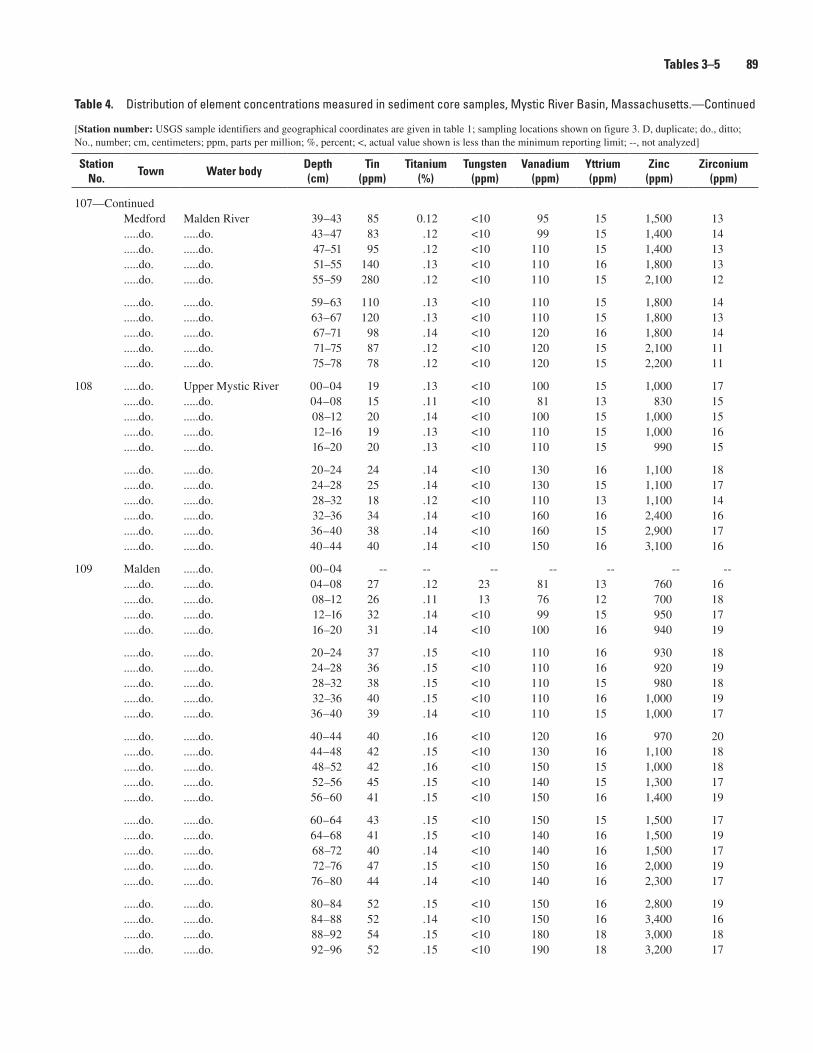
Table �. Distribution of element concentrations measured in sediment core samples, Mystic River Basin, Massachusetts.—Continued
[Station number: USGS sample identifiers and geographical coordinates are given in table 1; sampling locations shown on figure 3. D, duplicate; do., ditto; No., number; cm, centimeters; ppm, parts per million; %, percent; <, actual value shown is less than the minimum reporting limit; --, not analyzed]
Station No.
Town Water bodyDepth (cm)
Tin (ppm)
Titanium (%)
Tungsten (ppm)
Vanadium (ppm)
Yttrium (ppm)
Zinc (ppm)
Zirconium (ppm)
107—ContinuedMedford Malden River 39–43 85 0.12 <10 95 15 1,500 13.....do. .....do. 43–47 83 .12 <10 99 15 1,400 14.....do. .....do. 47–51 95 .12 <10 110 15 1,400 13.....do. .....do. 51–55 140 .13 <10 110 16 1,800 13.....do. .....do. 55–59 280 .12 <10 110 15 2,100 12
.....do. .....do. 59–63 110 .13 <10 110 15 1,800 14
.....do. .....do. 63–67 120 .13 <10 110 15 1,800 13
.....do. .....do. 67–71 98 .14 <10 120 16 1,800 14
.....do. .....do. 71–75 87 .12 <10 120 15 2,100 11
.....do. .....do. 75–78 78 .12 <10 120 15 2,200 11
108 .....do. Upper Mystic River 00–04 19 .13 <10 100 15 1,000 17.....do. .....do. 04–08 15 .11 <10 81 13 830 15.....do. .....do. 08–12 20 .14 <10 100 15 1,000 15.....do. .....do. 12–16 19 .13 <10 110 15 1,000 16.....do. .....do. 16–20 20 .13 <10 110 15 990 15
.....do. .....do. 20–24 24 .14 <10 130 16 1,100 18
.....do. .....do. 24–28 25 .14 <10 130 15 1,100 17
.....do. .....do. 28–32 18 .12 <10 110 13 1,100 14
.....do. .....do. 32–36 34 .14 <10 160 16 2,400 16
.....do. .....do. 36–40 38 .14 <10 160 15 2,900 17
.....do. .....do. 40–44 40 .14 <10 150 16 3,100 16
109 Malden .....do. 00–04 -- -- -- -- -- -- --.....do. .....do. 04–08 27 .12 23 81 13 760 16.....do. .....do. 08–12 26 .11 13 76 12 700 18.....do. .....do. 12–16 32 .14 <10 99 15 950 17.....do. .....do. 16–20 31 .14 <10 100 16 940 19
.....do. .....do. 20–24 37 .15 <10 110 16 930 18
.....do. .....do. 24–28 36 .15 <10 110 16 920 19
.....do. .....do. 28–32 38 .15 <10 110 15 980 18
.....do. .....do. 32–36 40 .15 <10 110 16 1,000 19
.....do. .....do. 36–40 39 .14 <10 110 15 1,000 17
.....do. .....do. 40–44 40 .16 <10 120 16 970 20
.....do. .....do. 44–48 42 .15 <10 130 16 1,100 18
.....do. .....do. 48–52 42 .16 <10 150 15 1,000 18
.....do. .....do. 52–56 45 .15 <10 140 15 1,300 17
.....do. .....do. 56–60 41 .15 <10 150 16 1,400 19
.....do. .....do. 60–64 43 .15 <10 150 15 1,500 17
.....do. .....do. 64–68 41 .15 <10 140 16 1,500 19
.....do. .....do. 68–72 40 .14 <10 140 16 1,500 17
.....do. .....do. 72–76 47 .15 <10 150 16 2,000 19
.....do. .....do. 76–80 44 .14 <10 140 16 2,300 17
.....do. .....do. 80–84 52 .15 <10 150 16 2,800 19
.....do. .....do. 84–88 52 .14 <10 150 16 3,400 16
.....do. .....do. 88–92 54 .15 <10 180 18 3,000 18
.....do. .....do. 92–96 52 .15 <10 190 18 3,200 17
Tables 3–� ��
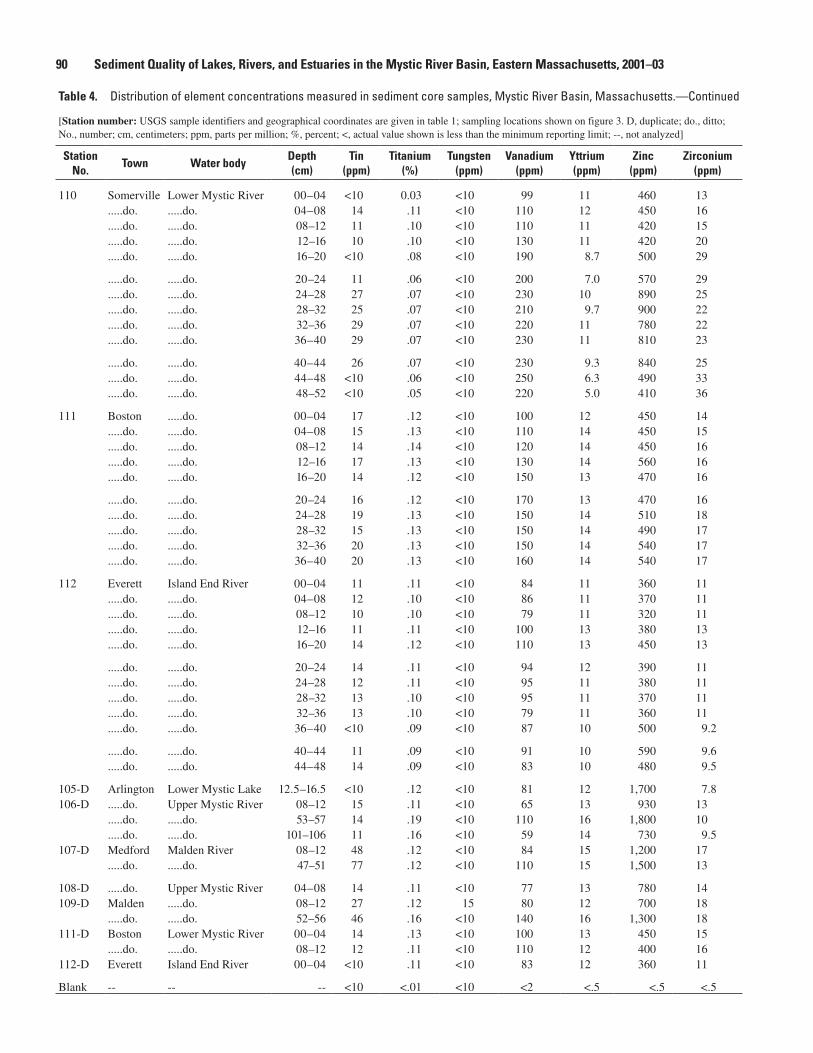
�0 Sediment Quality of Lakes, Rivers, and Estuaries in the Mystic River Basin, Eastern Massachusetts, 2001–03
Table �. Distribution of element concentrations measured in sediment core samples, Mystic River Basin, Massachusetts.—Continued
[Station number: USGS sample identifiers and geographical coordinates are given in table 1; sampling locations shown on figure 3. D, duplicate; do., ditto; No., number; cm, centimeters; ppm, parts per million; %, percent; <, actual value shown is less than the minimum reporting limit; --, not analyzed]
Station No.
Town Water bodyDepth (cm)
Tin (ppm)
Titanium (%)
Tungsten (ppm)
Vanadium (ppm)
Yttrium (ppm)
Zinc (ppm)
Zirconium (ppm)
110 Somerville Lower Mystic River 00–04 <10 0.03 <10 99 11 460 13.....do. .....do. 04–08 14 .11 <10 110 12 450 16.....do. .....do. 08–12 11 .10 <10 110 11 420 15.....do. .....do. 12–16 10 .10 <10 130 11 420 20.....do. .....do. 16–20 <10 .08 <10 190 8.7 500 29
.....do. .....do. 20–24 11 .06 <10 200 7.0 570 29
.....do. .....do. 24–28 27 .07 <10 230 10 890 25
.....do. .....do. 28–32 25 .07 <10 210 9.7 900 22
.....do. .....do. 32–36 29 .07 <10 220 11 780 22
.....do. .....do. 36–40 29 .07 <10 230 11 810 23
.....do. .....do. 40–44 26 .07 <10 230 9.3 840 25
.....do. .....do. 44–48 <10 .06 <10 250 6.3 490 33
.....do. .....do. 48–52 <10 .05 <10 220 5.0 410 36
111 Boston .....do. 00–04 17 .12 <10 100 12 450 14.....do. .....do. 04–08 15 .13 <10 110 14 450 15.....do. .....do. 08–12 14 .14 <10 120 14 450 16.....do. .....do. 12–16 17 .13 <10 130 14 560 16.....do. .....do. 16–20 14 .12 <10 150 13 470 16
.....do. .....do. 20–24 16 .12 <10 170 13 470 16
.....do. .....do. 24–28 19 .13 <10 150 14 510 18
.....do. .....do. 28–32 15 .13 <10 150 14 490 17
.....do. .....do. 32–36 20 .13 <10 150 14 540 17
.....do. .....do. 36–40 20 .13 <10 160 14 540 17
112 Everett Island End River 00–04 11 .11 <10 84 11 360 11.....do. .....do. 04–08 12 .10 <10 86 11 370 11.....do. .....do. 08–12 10 .10 <10 79 11 320 11.....do. .....do. 12–16 11 .11 <10 100 13 380 13.....do. .....do. 16–20 14 .12 <10 110 13 450 13
.....do. .....do. 20–24 14 .11 <10 94 12 390 11
.....do. .....do. 24–28 12 .11 <10 95 11 380 11
.....do. .....do. 28–32 13 .10 <10 95 11 370 11
.....do. .....do. 32–36 13 .10 <10 79 11 360 11
.....do. .....do. 36–40 <10 .09 <10 87 10 500 9.2
.....do. .....do. 40–44 11 .09 <10 91 10 590 9.6
.....do. .....do. 44–48 14 .09 <10 83 10 480 9.5
105-D Arlington Lower Mystic Lake 12.5–16.5 <10 .12 <10 81 12 1,700 7.8106-D .....do. Upper Mystic River 08–12 15 .11 <10 65 13 930 13
.....do. .....do. 53–57 14 .19 <10 110 16 1,800 10
.....do. .....do. 101–106 11 .16 <10 59 14 730 9.5107-D Medford Malden River 08–12 48 .12 <10 84 15 1,200 17
.....do. .....do. 47–51 77 .12 <10 110 15 1,500 13
108-D .....do. Upper Mystic River 04–08 14 .11 <10 77 13 780 14109-D Malden .....do. 08–12 27 .12 15 80 12 700 18
.....do. .....do. 52–56 46 .16 <10 140 16 1,300 18111-D Boston Lower Mystic River 00–04 14 .13 <10 100 13 450 15
.....do. .....do. 08–12 12 .11 <10 110 12 400 16112-D Everett Island End River 00–04 <10 .11 <10 83 12 360 11
Blank -- -- -- <10 <.01 <10 <2 <.5 <.5 <.5
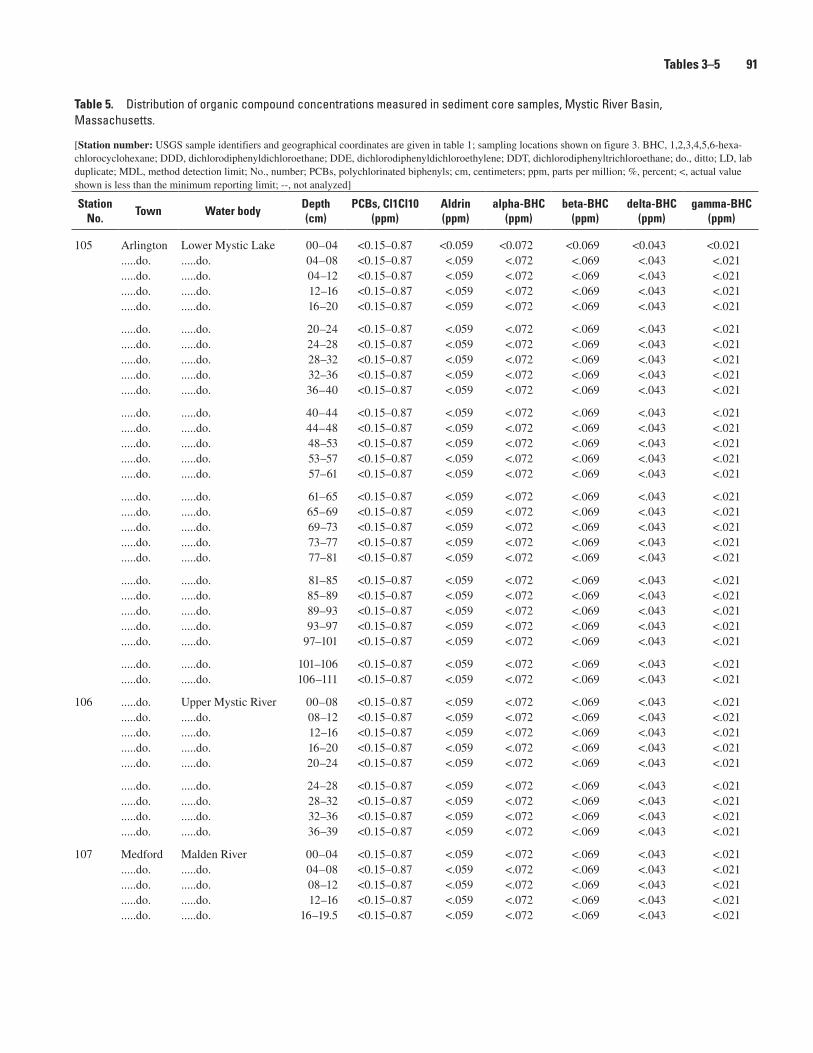
Tables 3–� �1
Table �. Distribution of organic compound concentrations measured in sediment core samples, Mystic River Basin, Massachusetts.—Continued
[Station number: USGS sample identifiers and geographical coordinates are given in table 1; sampling locations shown on figure 3. BHC, 1,2,3,4,5,6-hexa-chlorocyclohexane; DDD, dichlorodiphenyldichloroethane; DDE, dichlorodiphenyldichloroethylene; DDT, dichlorodiphenyltrichloroethane; do., ditto; LD, lab duplicate; MDL, method detection limit; No., number; PCBs, polychlorinated biphenyls; cm, centimeters; ppm, parts per million; %, percent; <, actual value shown is less than the minimum reporting limit; --, not analyzed]
Station No.
Town Water bodyDepth (cm)
PCBs, Cl1Cl10 (ppm)
Aldrin (ppm)
alpha-BHC (ppm)
beta-BHC (ppm)
delta-BHC (ppm)
gamma-BHC (ppm)
105 Arlington Lower Mystic Lake 00–04 <0.15–0.87 <0.059 <0.072 <0.069 <0.043 <0.021.....do. .....do. 04–08 <0.15–0.87 <.059 <.072 <.069 <.043 <.021.....do. .....do. 04–12 <0.15–0.87 <.059 <.072 <.069 <.043 <.021.....do. .....do. 12–16 <0.15–0.87 <.059 <.072 <.069 <.043 <.021.....do. .....do. 16–20 <0.15–0.87 <.059 <.072 <.069 <.043 <.021
.....do. .....do. 20–24 <0.15–0.87 <.059 <.072 <.069 <.043 <.021
.....do. .....do. 24–28 <0.15–0.87 <.059 <.072 <.069 <.043 <.021
.....do. .....do. 28–32 <0.15–0.87 <.059 <.072 <.069 <.043 <.021
.....do. .....do. 32–36 <0.15–0.87 <.059 <.072 <.069 <.043 <.021
.....do. .....do. 36–40 <0.15–0.87 <.059 <.072 <.069 <.043 <.021
.....do. .....do. 40–44 <0.15–0.87 <.059 <.072 <.069 <.043 <.021
.....do. .....do. 44–48 <0.15–0.87 <.059 <.072 <.069 <.043 <.021
.....do. .....do. 48–53 <0.15–0.87 <.059 <.072 <.069 <.043 <.021
.....do. .....do. 53–57 <0.15–0.87 <.059 <.072 <.069 <.043 <.021
.....do. .....do. 57–61 <0.15–0.87 <.059 <.072 <.069 <.043 <.021
.....do. .....do. 61–65 <0.15–0.87 <.059 <.072 <.069 <.043 <.021
.....do. .....do. 65–69 <0.15–0.87 <.059 <.072 <.069 <.043 <.021
.....do. .....do. 69–73 <0.15–0.87 <.059 <.072 <.069 <.043 <.021
.....do. .....do. 73–77 <0.15–0.87 <.059 <.072 <.069 <.043 <.021
.....do. .....do. 77–81 <0.15–0.87 <.059 <.072 <.069 <.043 <.021
.....do. .....do. 81–85 <0.15–0.87 <.059 <.072 <.069 <.043 <.021
.....do. .....do. 85–89 <0.15–0.87 <.059 <.072 <.069 <.043 <.021
.....do. .....do. 89–93 <0.15–0.87 <.059 <.072 <.069 <.043 <.021
.....do. .....do. 93–97 <0.15–0.87 <.059 <.072 <.069 <.043 <.021
.....do. .....do. 97–101 <0.15–0.87 <.059 <.072 <.069 <.043 <.021
.....do. .....do. 101–106 <0.15–0.87 <.059 <.072 <.069 <.043 <.021
.....do. .....do. 106–111 <0.15–0.87 <.059 <.072 <.069 <.043 <.021
106 .....do. Upper Mystic River 00–08 <0.15–0.87 <.059 <.072 <.069 <.043 <.021.....do. .....do. 08–12 <0.15–0.87 <.059 <.072 <.069 <.043 <.021.....do. .....do. 12–16 <0.15–0.87 <.059 <.072 <.069 <.043 <.021.....do. .....do. 16–20 <0.15–0.87 <.059 <.072 <.069 <.043 <.021.....do. .....do. 20–24 <0.15–0.87 <.059 <.072 <.069 <.043 <.021
.....do. .....do. 24–28 <0.15–0.87 <.059 <.072 <.069 <.043 <.021
.....do. .....do. 28–32 <0.15–0.87 <.059 <.072 <.069 <.043 <.021
.....do. .....do. 32–36 <0.15–0.87 <.059 <.072 <.069 <.043 <.021
.....do. .....do. 36–39 <0.15–0.87 <.059 <.072 <.069 <.043 <.021
107 Medford Malden River 00–04 <0.15–0.87 <.059 <.072 <.069 <.043 <.021.....do. .....do. 04–08 <0.15–0.87 <.059 <.072 <.069 <.043 <.021.....do. .....do. 08–12 <0.15–0.87 <.059 <.072 <.069 <.043 <.021.....do. .....do. 12–16 <0.15–0.87 <.059 <.072 <.069 <.043 <.021.....do. .....do. 16–19.5 <0.15–0.87 <.059 <.072 <.069 <.043 <.021
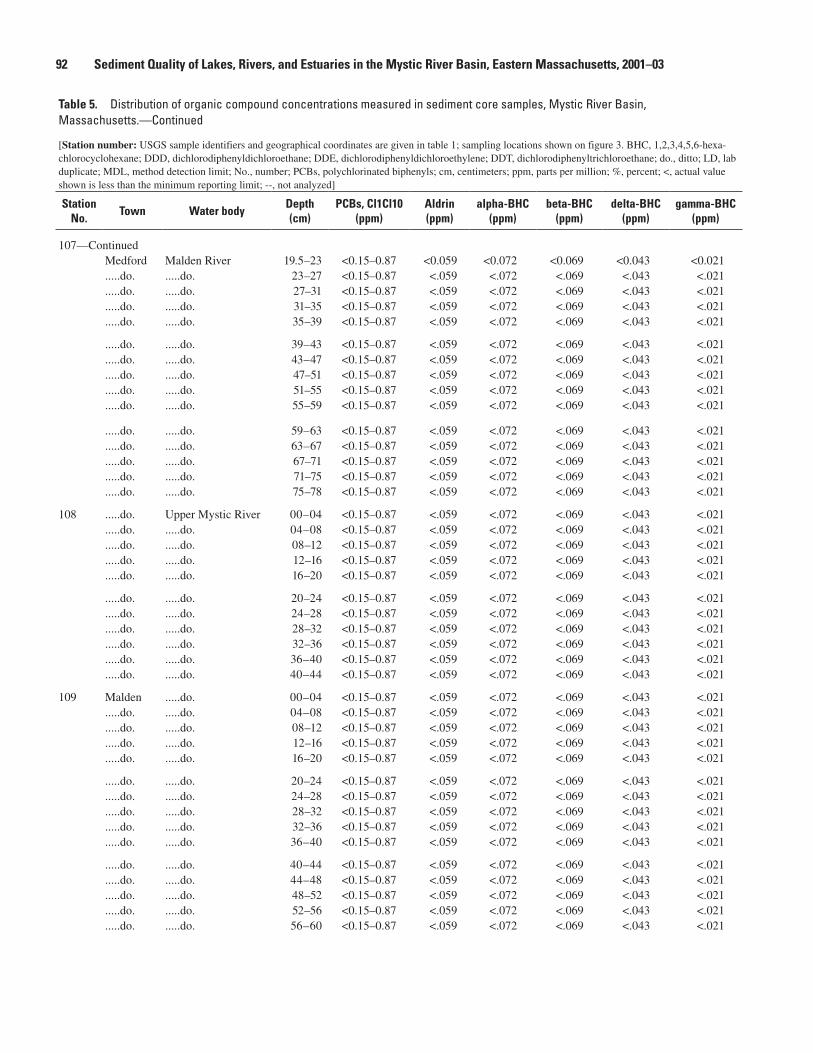
�2 Sediment Quality of Lakes, Rivers, and Estuaries in the Mystic River Basin, Eastern Massachusetts, 2001–03
Table �. Distribution of organic compound concentrations measured in sediment core samples, Mystic River Basin, Massachusetts.—Continued
[Station number: USGS sample identifiers and geographical coordinates are given in table 1; sampling locations shown on figure 3. BHC, 1,2,3,4,5,6-hexa-chlorocyclohexane; DDD, dichlorodiphenyldichloroethane; DDE, dichlorodiphenyldichloroethylene; DDT, dichlorodiphenyltrichloroethane; do., ditto; LD, lab duplicate; MDL, method detection limit; No., number; PCBs, polychlorinated biphenyls; cm, centimeters; ppm, parts per million; %, percent; <, actual value shown is less than the minimum reporting limit; --, not analyzed]
Station No.
Town Water bodyDepth (cm)
PCBs, Cl1Cl10 (ppm)
Aldrin (ppm)
alpha-BHC (ppm)
beta-BHC (ppm)
delta-BHC (ppm)
gamma-BHC (ppm)
107—ContinuedMedford Malden River 19.5–23 <0.15–0.87 <0.059 <0.072 <0.069 <0.043 <0.021.....do. .....do. 23–27 <0.15–0.87 <.059 <.072 <.069 <.043 <.021.....do. .....do. 27–31 <0.15–0.87 <.059 <.072 <.069 <.043 <.021.....do. .....do. 31–35 <0.15–0.87 <.059 <.072 <.069 <.043 <.021.....do. .....do. 35–39 <0.15–0.87 <.059 <.072 <.069 <.043 <.021
.....do. .....do. 39–43 <0.15–0.87 <.059 <.072 <.069 <.043 <.021
.....do. .....do. 43–47 <0.15–0.87 <.059 <.072 <.069 <.043 <.021
.....do. .....do. 47–51 <0.15–0.87 <.059 <.072 <.069 <.043 <.021
.....do. .....do. 51–55 <0.15–0.87 <.059 <.072 <.069 <.043 <.021
.....do. .....do. 55–59 <0.15–0.87 <.059 <.072 <.069 <.043 <.021
.....do. .....do. 59–63 <0.15–0.87 <.059 <.072 <.069 <.043 <.021
.....do. .....do. 63–67 <0.15–0.87 <.059 <.072 <.069 <.043 <.021
.....do. .....do. 67–71 <0.15–0.87 <.059 <.072 <.069 <.043 <.021
.....do. .....do. 71–75 <0.15–0.87 <.059 <.072 <.069 <.043 <.021
.....do. .....do. 75–78 <0.15–0.87 <.059 <.072 <.069 <.043 <.021
108 .....do. Upper Mystic River 00–04 <0.15–0.87 <.059 <.072 <.069 <.043 <.021.....do. .....do. 04–08 <0.15–0.87 <.059 <.072 <.069 <.043 <.021.....do. .....do. 08–12 <0.15–0.87 <.059 <.072 <.069 <.043 <.021.....do. .....do. 12–16 <0.15–0.87 <.059 <.072 <.069 <.043 <.021.....do. .....do. 16–20 <0.15–0.87 <.059 <.072 <.069 <.043 <.021
.....do. .....do. 20–24 <0.15–0.87 <.059 <.072 <.069 <.043 <.021
.....do. .....do. 24–28 <0.15–0.87 <.059 <.072 <.069 <.043 <.021
.....do. .....do. 28–32 <0.15–0.87 <.059 <.072 <.069 <.043 <.021
.....do. .....do. 32–36 <0.15–0.87 <.059 <.072 <.069 <.043 <.021
.....do. .....do. 36–40 <0.15–0.87 <.059 <.072 <.069 <.043 <.021
.....do. .....do. 40–44 <0.15–0.87 <.059 <.072 <.069 <.043 <.021
109 Malden .....do. 00–04 <0.15–0.87 <.059 <.072 <.069 <.043 <.021.....do. .....do. 04–08 <0.15–0.87 <.059 <.072 <.069 <.043 <.021.....do. .....do. 08–12 <0.15–0.87 <.059 <.072 <.069 <.043 <.021.....do. .....do. 12–16 <0.15–0.87 <.059 <.072 <.069 <.043 <.021.....do. .....do. 16–20 <0.15–0.87 <.059 <.072 <.069 <.043 <.021
.....do. .....do. 20–24 <0.15–0.87 <.059 <.072 <.069 <.043 <.021
.....do. .....do. 24–28 <0.15–0.87 <.059 <.072 <.069 <.043 <.021
.....do. .....do. 28–32 <0.15–0.87 <.059 <.072 <.069 <.043 <.021
.....do. .....do. 32–36 <0.15–0.87 <.059 <.072 <.069 <.043 <.021
.....do. .....do. 36–40 <0.15–0.87 <.059 <.072 <.069 <.043 <.021
.....do. .....do. 40–44 <0.15–0.87 <.059 <.072 <.069 <.043 <.021
.....do. .....do. 44–48 <0.15–0.87 <.059 <.072 <.069 <.043 <.021
.....do. .....do. 48–52 <0.15–0.87 <.059 <.072 <.069 <.043 <.021
.....do. .....do. 52–56 <0.15–0.87 <.059 <.072 <.069 <.043 <.021
.....do. .....do. 56–60 <0.15–0.87 <.059 <.072 <.069 <.043 <.021
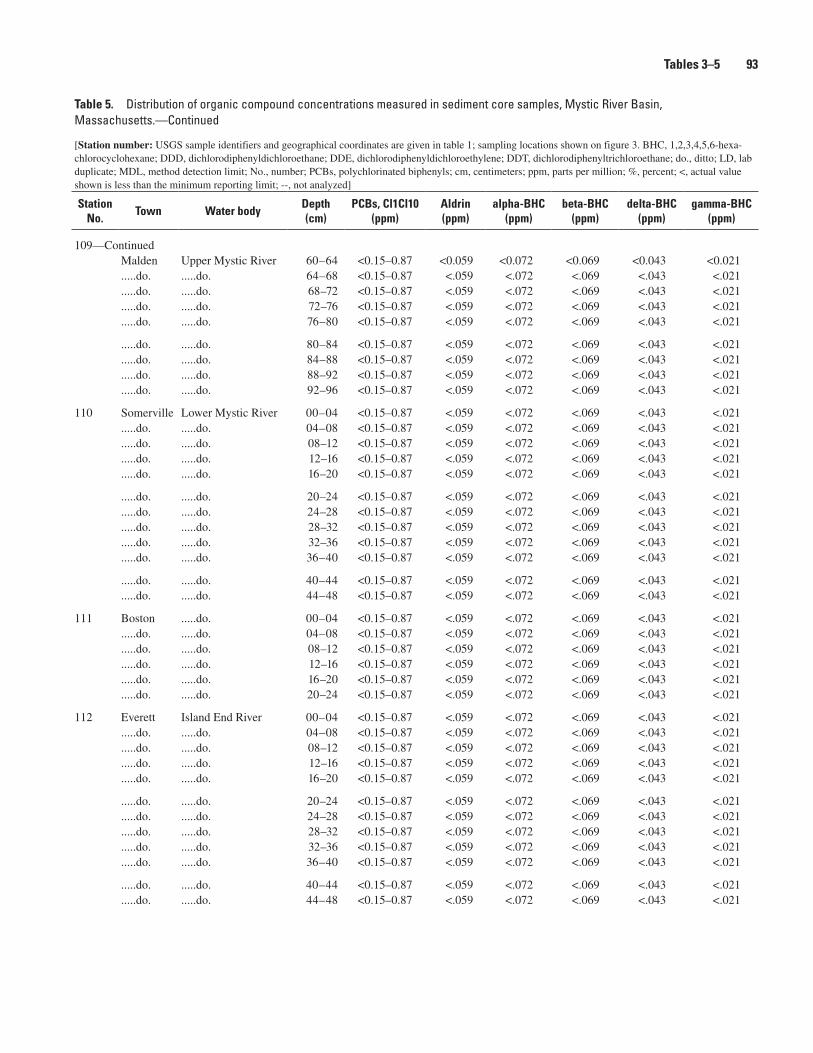
Tables 3–� �3
Table �. Distribution of organic compound concentrations measured in sediment core samples, Mystic River Basin, Massachusetts.—Continued
[Station number: USGS sample identifiers and geographical coordinates are given in table 1; sampling locations shown on figure 3. BHC, 1,2,3,4,5,6-hexa-chlorocyclohexane; DDD, dichlorodiphenyldichloroethane; DDE, dichlorodiphenyldichloroethylene; DDT, dichlorodiphenyltrichloroethane; do., ditto; LD, lab duplicate; MDL, method detection limit; No., number; PCBs, polychlorinated biphenyls; cm, centimeters; ppm, parts per million; %, percent; <, actual value shown is less than the minimum reporting limit; --, not analyzed]
Station No.
Town Water bodyDepth (cm)
PCBs, Cl1Cl10 (ppm)
Aldrin (ppm)
alpha-BHC (ppm)
beta-BHC (ppm)
delta-BHC (ppm)
gamma-BHC (ppm)
109—ContinuedMalden Upper Mystic River 60–64 <0.15–0.87 <0.059 <0.072 <0.069 <0.043 <0.021.....do. .....do. 64–68 <0.15–0.87 <.059 <.072 <.069 <.043 <.021.....do. .....do. 68–72 <0.15–0.87 <.059 <.072 <.069 <.043 <.021.....do. .....do. 72–76 <0.15–0.87 <.059 <.072 <.069 <.043 <.021.....do. .....do. 76–80 <0.15–0.87 <.059 <.072 <.069 <.043 <.021
.....do. .....do. 80–84 <0.15–0.87 <.059 <.072 <.069 <.043 <.021
.....do. .....do. 84–88 <0.15–0.87 <.059 <.072 <.069 <.043 <.021
.....do. .....do. 88–92 <0.15–0.87 <.059 <.072 <.069 <.043 <.021
.....do. .....do. 92–96 <0.15–0.87 <.059 <.072 <.069 <.043 <.021
110 Somerville Lower Mystic River 00–04 <0.15–0.87 <.059 <.072 <.069 <.043 <.021.....do. .....do. 04–08 <0.15–0.87 <.059 <.072 <.069 <.043 <.021.....do. .....do. 08–12 <0.15–0.87 <.059 <.072 <.069 <.043 <.021.....do. .....do. 12–16 <0.15–0.87 <.059 <.072 <.069 <.043 <.021.....do. .....do. 16–20 <0.15–0.87 <.059 <.072 <.069 <.043 <.021
.....do. .....do. 20–24 <0.15–0.87 <.059 <.072 <.069 <.043 <.021
.....do. .....do. 24–28 <0.15–0.87 <.059 <.072 <.069 <.043 <.021
.....do. .....do. 28–32 <0.15–0.87 <.059 <.072 <.069 <.043 <.021
.....do. .....do. 32–36 <0.15–0.87 <.059 <.072 <.069 <.043 <.021
.....do. .....do. 36–40 <0.15–0.87 <.059 <.072 <.069 <.043 <.021
.....do. .....do. 40–44 <0.15–0.87 <.059 <.072 <.069 <.043 <.021
.....do. .....do. 44–48 <0.15–0.87 <.059 <.072 <.069 <.043 <.021
111 Boston .....do. 00–04 <0.15–0.87 <.059 <.072 <.069 <.043 <.021.....do. .....do. 04–08 <0.15–0.87 <.059 <.072 <.069 <.043 <.021.....do. .....do. 08–12 <0.15–0.87 <.059 <.072 <.069 <.043 <.021.....do. .....do. 12–16 <0.15–0.87 <.059 <.072 <.069 <.043 <.021.....do. .....do. 16–20 <0.15–0.87 <.059 <.072 <.069 <.043 <.021.....do. .....do. 20–24 <0.15–0.87 <.059 <.072 <.069 <.043 <.021
112 Everett Island End River 00–04 <0.15–0.87 <.059 <.072 <.069 <.043 <.021.....do. .....do. 04–08 <0.15–0.87 <.059 <.072 <.069 <.043 <.021.....do. .....do. 08–12 <0.15–0.87 <.059 <.072 <.069 <.043 <.021.....do. .....do. 12–16 <0.15–0.87 <.059 <.072 <.069 <.043 <.021.....do. .....do. 16–20 <0.15–0.87 <.059 <.072 <.069 <.043 <.021
.....do. .....do. 20–24 <0.15–0.87 <.059 <.072 <.069 <.043 <.021
.....do. .....do. 24–28 <0.15–0.87 <.059 <.072 <.069 <.043 <.021
.....do. .....do. 28–32 <0.15–0.87 <.059 <.072 <.069 <.043 <.021
.....do. .....do. 32–36 <0.15–0.87 <.059 <.072 <.069 <.043 <.021
.....do. .....do. 36–40 <0.15–0.87 <.059 <.072 <.069 <.043 <.021
.....do. .....do. 40–44 <0.15–0.87 <.059 <.072 <.069 <.043 <.021
.....do. .....do. 44–48 <0.15–0.87 <.059 <.072 <.069 <.043 <.021
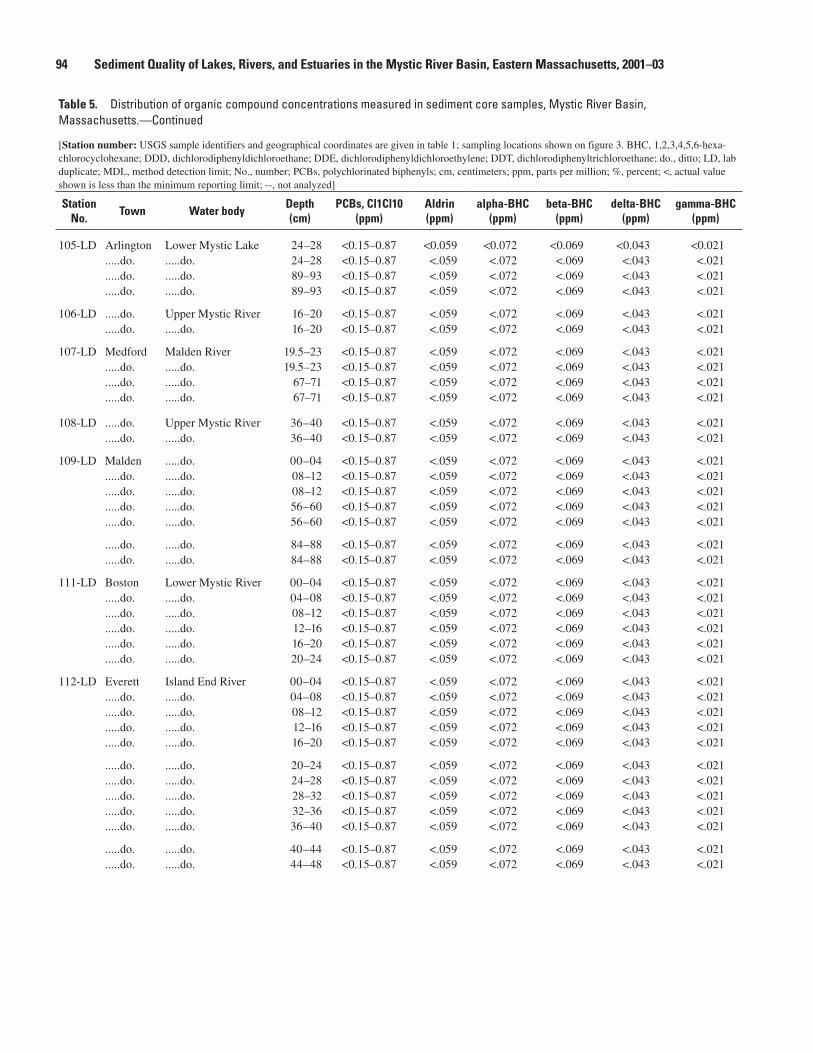
�� Sediment Quality of Lakes, Rivers, and Estuaries in the Mystic River Basin, Eastern Massachusetts, 2001–03
Table �. Distribution of organic compound concentrations measured in sediment core samples, Mystic River Basin, Massachusetts.—Continued
[Station number: USGS sample identifiers and geographical coordinates are given in table 1; sampling locations shown on figure 3. BHC, 1,2,3,4,5,6-hexa-chlorocyclohexane; DDD, dichlorodiphenyldichloroethane; DDE, dichlorodiphenyldichloroethylene; DDT, dichlorodiphenyltrichloroethane; do., ditto; LD, lab duplicate; MDL, method detection limit; No., number; PCBs, polychlorinated biphenyls; cm, centimeters; ppm, parts per million; %, percent; <, actual value shown is less than the minimum reporting limit; --, not analyzed]
Station No.
Town Water bodyDepth (cm)
PCBs, Cl1Cl10 (ppm)
Aldrin (ppm)
alpha-BHC (ppm)
beta-BHC (ppm)
delta-BHC (ppm)
gamma-BHC (ppm)
105-LD Arlington Lower Mystic Lake 24–28 <0.15–0.87 <0.059 <0.072 <0.069 <0.043 <0.021.....do. .....do. 24–28 <0.15–0.87 <.059 <.072 <.069 <.043 <.021.....do. .....do. 89–93 <0.15–0.87 <.059 <.072 <.069 <.043 <.021.....do. .....do. 89–93 <0.15–0.87 <.059 <.072 <.069 <.043 <.021
106-LD .....do. Upper Mystic River 16–20 <0.15–0.87 <.059 <.072 <.069 <.043 <.021.....do. .....do. 16–20 <0.15–0.87 <.059 <.072 <.069 <.043 <.021
107-LD Medford Malden River 19.5–23 <0.15–0.87 <.059 <.072 <.069 <.043 <.021.....do. .....do. 19.5–23 <0.15–0.87 <.059 <.072 <.069 <.043 <.021.....do. .....do. 67–71 <0.15–0.87 <.059 <.072 <.069 <.043 <.021.....do. .....do. 67–71 <0.15–0.87 <.059 <.072 <.069 <.043 <.021
108-LD .....do. Upper Mystic River 36–40 <0.15–0.87 <.059 <.072 <.069 <.043 <.021.....do. .....do. 36–40 <0.15–0.87 <.059 <.072 <.069 <.043 <.021
109-LD Malden .....do. 00–04 <0.15–0.87 <.059 <.072 <.069 <.043 <.021.....do. .....do. 08–12 <0.15–0.87 <.059 <.072 <.069 <.043 <.021.....do. .....do. 08–12 <0.15–0.87 <.059 <.072 <.069 <.043 <.021.....do. .....do. 56–60 <0.15–0.87 <.059 <.072 <.069 <.043 <.021.....do. .....do. 56–60 <0.15–0.87 <.059 <.072 <.069 <.043 <.021
.....do. .....do. 84–88 <0.15–0.87 <.059 <.072 <.069 <.043 <.021
.....do. .....do. 84–88 <0.15–0.87 <.059 <.072 <.069 <.043 <.021
111-LD Boston Lower Mystic River 00–04 <0.15–0.87 <.059 <.072 <.069 <.043 <.021.....do. .....do. 04–08 <0.15–0.87 <.059 <.072 <.069 <.043 <.021.....do. .....do. 08–12 <0.15–0.87 <.059 <.072 <.069 <.043 <.021.....do. .....do. 12–16 <0.15–0.87 <.059 <.072 <.069 <.043 <.021.....do. .....do. 16–20 <0.15–0.87 <.059 <.072 <.069 <.043 <.021.....do. .....do. 20–24 <0.15–0.87 <.059 <.072 <.069 <.043 <.021
112-LD Everett Island End River 00–04 <0.15–0.87 <.059 <.072 <.069 <.043 <.021.....do. .....do. 04–08 <0.15–0.87 <.059 <.072 <.069 <.043 <.021.....do. .....do. 08–12 <0.15–0.87 <.059 <.072 <.069 <.043 <.021.....do. .....do. 12–16 <0.15–0.87 <.059 <.072 <.069 <.043 <.021.....do. .....do. 16–20 <0.15–0.87 <.059 <.072 <.069 <.043 <.021
.....do. .....do. 20–24 <0.15–0.87 <.059 <.072 <.069 <.043 <.021
.....do. .....do. 24–28 <0.15–0.87 <.059 <.072 <.069 <.043 <.021
.....do. .....do. 28–32 <0.15–0.87 <.059 <.072 <.069 <.043 <.021
.....do. .....do. 32–36 <0.15–0.87 <.059 <.072 <.069 <.043 <.021
.....do. .....do. 36–40 <0.15–0.87 <.059 <.072 <.069 <.043 <.021
.....do. .....do. 40–44 <0.15–0.87 <.059 <.072 <.069 <.043 <.021
.....do. .....do. 44–48 <0.15–0.87 <.059 <.072 <.069 <.043 <.021
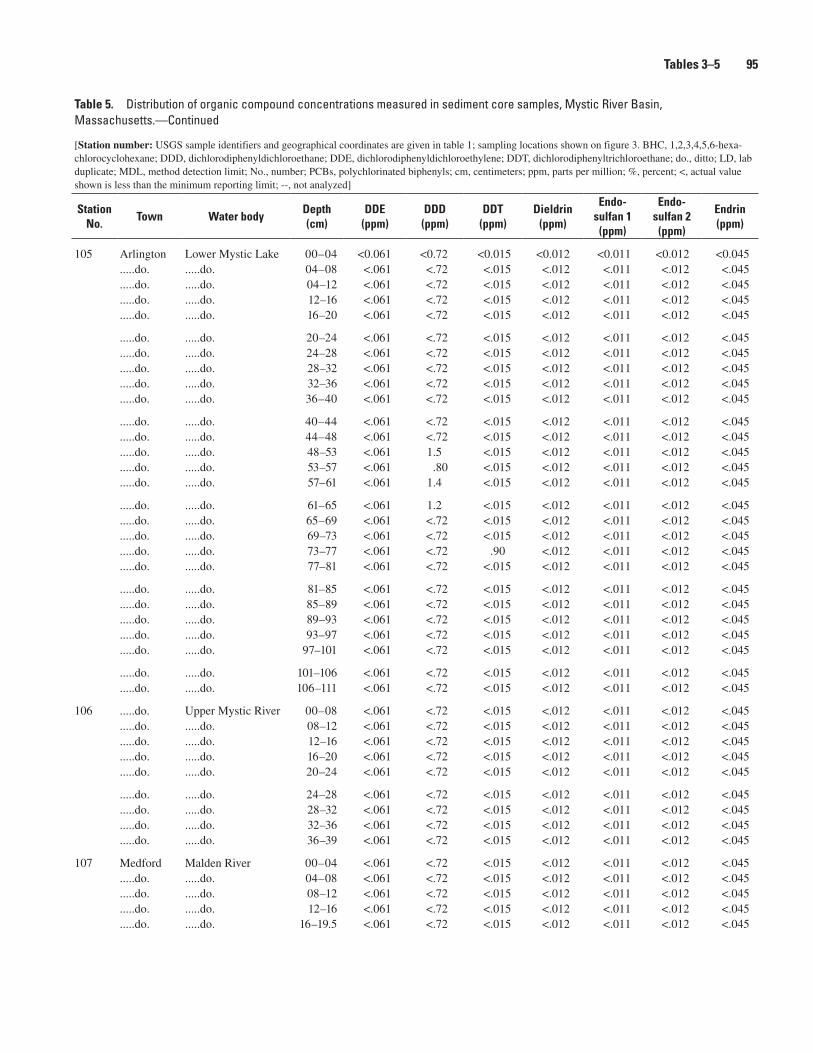
Tables 3–� ��
Table �. Distribution of organic compound concentrations measured in sediment core samples, Mystic River Basin, Massachusetts.—Continued
[Station number: USGS sample identifiers and geographical coordinates are given in table 1; sampling locations shown on figure 3. BHC, 1,2,3,4,5,6-hexa-chlorocyclohexane; DDD, dichlorodiphenyldichloroethane; DDE, dichlorodiphenyldichloroethylene; DDT, dichlorodiphenyltrichloroethane; do., ditto; LD, lab duplicate; MDL, method detection limit; No., number; PCBs, polychlorinated biphenyls; cm, centimeters; ppm, parts per million; %, percent; <, actual value shown is less than the minimum reporting limit; --, not analyzed]
Station No.
Town Water bodyDepth (cm)
DDE (ppm)
DDD (ppm)
DDT (ppm)
Dieldrin (ppm)
Endo- sulfan 1 (ppm)
Endo- sulfan 2 (ppm)
Endrin (ppm)
105 Arlington Lower Mystic Lake 00–04 <0.061 <0.72 <0.015 <0.012 <0.011 <0.012 <0.045.....do. .....do. 04–08 <.061 <.72 <.015 <.012 <.011 <.012 <.045.....do. .....do. 04–12 <.061 <.72 <.015 <.012 <.011 <.012 <.045.....do. .....do. 12–16 <.061 <.72 <.015 <.012 <.011 <.012 <.045.....do. .....do. 16–20 <.061 <.72 <.015 <.012 <.011 <.012 <.045
.....do. .....do. 20–24 <.061 <.72 <.015 <.012 <.011 <.012 <.045
.....do. .....do. 24–28 <.061 <.72 <.015 <.012 <.011 <.012 <.045
.....do. .....do. 28–32 <.061 <.72 <.015 <.012 <.011 <.012 <.045
.....do. .....do. 32–36 <.061 <.72 <.015 <.012 <.011 <.012 <.045
.....do. .....do. 36–40 <.061 <.72 <.015 <.012 <.011 <.012 <.045
.....do. .....do. 40–44 <.061 <.72 <.015 <.012 <.011 <.012 <.045
.....do. .....do. 44–48 <.061 <.72 <.015 <.012 <.011 <.012 <.045
.....do. .....do. 48–53 <.061 1.5 <.015 <.012 <.011 <.012 <.045
.....do. .....do. 53–57 <.061 .80 <.015 <.012 <.011 <.012 <.045
.....do. .....do. 57–61 <.061 1.4 <.015 <.012 <.011 <.012 <.045
.....do. .....do. 61–65 <.061 1.2 <.015 <.012 <.011 <.012 <.045
.....do. .....do. 65–69 <.061 <.72 <.015 <.012 <.011 <.012 <.045
.....do. .....do. 69–73 <.061 <.72 <.015 <.012 <.011 <.012 <.045
.....do. .....do. 73–77 <.061 <.72 .90 <.012 <.011 <.012 <.045
.....do. .....do. 77–81 <.061 <.72 <.015 <.012 <.011 <.012 <.045
.....do. .....do. 81–85 <.061 <.72 <.015 <.012 <.011 <.012 <.045
.....do. .....do. 85–89 <.061 <.72 <.015 <.012 <.011 <.012 <.045
.....do. .....do. 89–93 <.061 <.72 <.015 <.012 <.011 <.012 <.045
.....do. .....do. 93–97 <.061 <.72 <.015 <.012 <.011 <.012 <.045
.....do. .....do. 97–101 <.061 <.72 <.015 <.012 <.011 <.012 <.045
.....do. .....do. 101–106 <.061 <.72 <.015 <.012 <.011 <.012 <.045
.....do. .....do. 106–111 <.061 <.72 <.015 <.012 <.011 <.012 <.045
106 .....do. Upper Mystic River 00–08 <.061 <.72 <.015 <.012 <.011 <.012 <.045.....do. .....do. 08–12 <.061 <.72 <.015 <.012 <.011 <.012 <.045.....do. .....do. 12–16 <.061 <.72 <.015 <.012 <.011 <.012 <.045.....do. .....do. 16–20 <.061 <.72 <.015 <.012 <.011 <.012 <.045.....do. .....do. 20–24 <.061 <.72 <.015 <.012 <.011 <.012 <.045
.....do. .....do. 24–28 <.061 <.72 <.015 <.012 <.011 <.012 <.045
.....do. .....do. 28–32 <.061 <.72 <.015 <.012 <.011 <.012 <.045
.....do. .....do. 32–36 <.061 <.72 <.015 <.012 <.011 <.012 <.045
.....do. .....do. 36–39 <.061 <.72 <.015 <.012 <.011 <.012 <.045
107 Medford Malden River 00–04 <.061 <.72 <.015 <.012 <.011 <.012 <.045.....do. .....do. 04–08 <.061 <.72 <.015 <.012 <.011 <.012 <.045.....do. .....do. 08–12 <.061 <.72 <.015 <.012 <.011 <.012 <.045.....do. .....do. 12–16 <.061 <.72 <.015 <.012 <.011 <.012 <.045.....do. .....do. 16–19.5 <.061 <.72 <.015 <.012 <.011 <.012 <.045
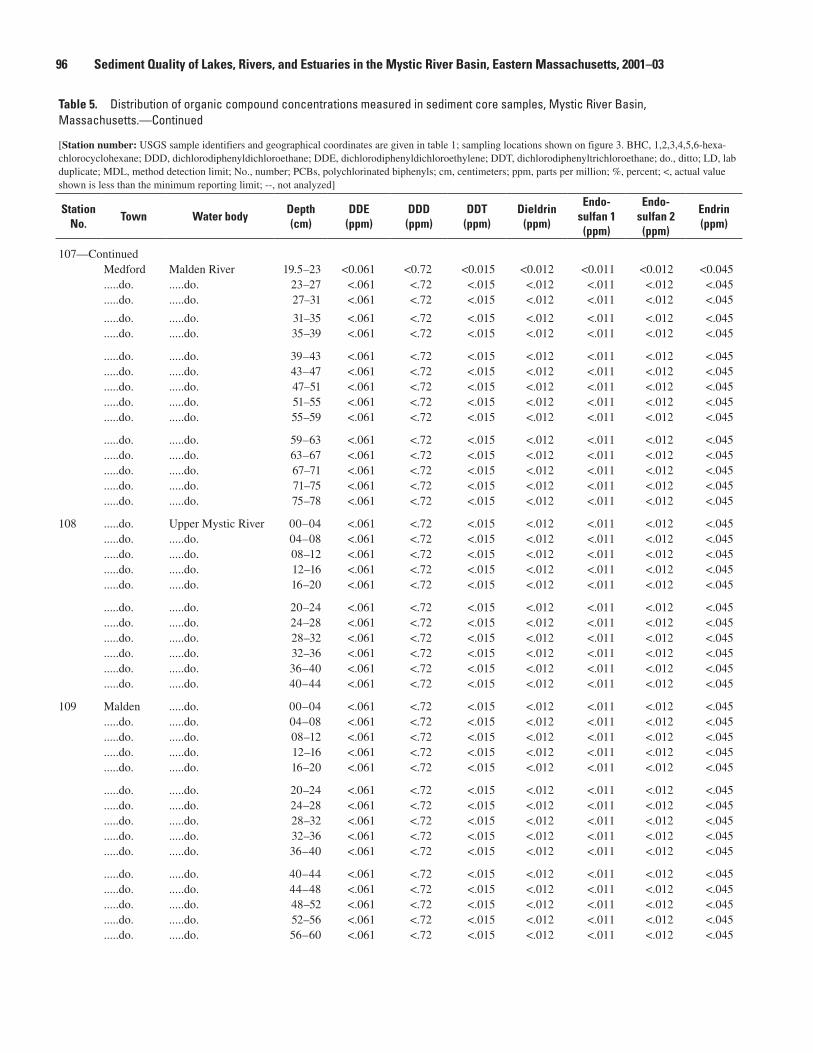
�� Sediment Quality of Lakes, Rivers, and Estuaries in the Mystic River Basin, Eastern Massachusetts, 2001–03
Table �. Distribution of organic compound concentrations measured in sediment core samples, Mystic River Basin, Massachusetts.—Continued
[Station number: USGS sample identifiers and geographical coordinates are given in table 1; sampling locations shown on figure 3. BHC, 1,2,3,4,5,6-hexa-chlorocyclohexane; DDD, dichlorodiphenyldichloroethane; DDE, dichlorodiphenyldichloroethylene; DDT, dichlorodiphenyltrichloroethane; do., ditto; LD, lab duplicate; MDL, method detection limit; No., number; PCBs, polychlorinated biphenyls; cm, centimeters; ppm, parts per million; %, percent; <, actual value shown is less than the minimum reporting limit; --, not analyzed]
Station No.
Town Water bodyDepth (cm)
DDE (ppm)
DDD (ppm)
DDT (ppm)
Dieldrin (ppm)
Endo- sulfan 1 (ppm)
Endo- sulfan 2 (ppm)
Endrin (ppm)
107—ContinuedMedford Malden River 19.5–23 <0.061 <0.72 <0.015 <0.012 <0.011 <0.012 <0.045.....do. .....do. 23–27 <.061 <.72 <.015 <.012 <.011 <.012 <.045.....do. .....do. 27–31 <.061 <.72 <.015 <.012 <.011 <.012 <.045
.....do. .....do. 31–35 <.061 <.72 <.015 <.012 <.011 <.012 <.045
.....do. .....do. 35–39 <.061 <.72 <.015 <.012 <.011 <.012 <.045
.....do. .....do. 39–43 <.061 <.72 <.015 <.012 <.011 <.012 <.045
.....do. .....do. 43–47 <.061 <.72 <.015 <.012 <.011 <.012 <.045
.....do. .....do. 47–51 <.061 <.72 <.015 <.012 <.011 <.012 <.045
.....do. .....do. 51–55 <.061 <.72 <.015 <.012 <.011 <.012 <.045
.....do. .....do. 55–59 <.061 <.72 <.015 <.012 <.011 <.012 <.045
.....do. .....do. 59–63 <.061 <.72 <.015 <.012 <.011 <.012 <.045
.....do. .....do. 63–67 <.061 <.72 <.015 <.012 <.011 <.012 <.045
.....do. .....do. 67–71 <.061 <.72 <.015 <.012 <.011 <.012 <.045
.....do. .....do. 71–75 <.061 <.72 <.015 <.012 <.011 <.012 <.045
.....do. .....do. 75–78 <.061 <.72 <.015 <.012 <.011 <.012 <.045
108 .....do. Upper Mystic River 00–04 <.061 <.72 <.015 <.012 <.011 <.012 <.045.....do. .....do. 04–08 <.061 <.72 <.015 <.012 <.011 <.012 <.045.....do. .....do. 08–12 <.061 <.72 <.015 <.012 <.011 <.012 <.045.....do. .....do. 12–16 <.061 <.72 <.015 <.012 <.011 <.012 <.045.....do. .....do. 16–20 <.061 <.72 <.015 <.012 <.011 <.012 <.045
.....do. .....do. 20–24 <.061 <.72 <.015 <.012 <.011 <.012 <.045
.....do. .....do. 24–28 <.061 <.72 <.015 <.012 <.011 <.012 <.045
.....do. .....do. 28–32 <.061 <.72 <.015 <.012 <.011 <.012 <.045
.....do. .....do. 32–36 <.061 <.72 <.015 <.012 <.011 <.012 <.045
.....do. .....do. 36–40 <.061 <.72 <.015 <.012 <.011 <.012 <.045
.....do. .....do. 40–44 <.061 <.72 <.015 <.012 <.011 <.012 <.045
109 Malden .....do. 00–04 <.061 <.72 <.015 <.012 <.011 <.012 <.045.....do. .....do. 04–08 <.061 <.72 <.015 <.012 <.011 <.012 <.045.....do. .....do. 08–12 <.061 <.72 <.015 <.012 <.011 <.012 <.045.....do. .....do. 12–16 <.061 <.72 <.015 <.012 <.011 <.012 <.045.....do. .....do. 16–20 <.061 <.72 <.015 <.012 <.011 <.012 <.045
.....do. .....do. 20–24 <.061 <.72 <.015 <.012 <.011 <.012 <.045
.....do. .....do. 24–28 <.061 <.72 <.015 <.012 <.011 <.012 <.045
.....do. .....do. 28–32 <.061 <.72 <.015 <.012 <.011 <.012 <.045
.....do. .....do. 32–36 <.061 <.72 <.015 <.012 <.011 <.012 <.045
.....do. .....do. 36–40 <.061 <.72 <.015 <.012 <.011 <.012 <.045
.....do. .....do. 40–44 <.061 <.72 <.015 <.012 <.011 <.012 <.045
.....do. .....do. 44–48 <.061 <.72 <.015 <.012 <.011 <.012 <.045
.....do. .....do. 48–52 <.061 <.72 <.015 <.012 <.011 <.012 <.045
.....do. .....do. 52–56 <.061 <.72 <.015 <.012 <.011 <.012 <.045
.....do. .....do. 56–60 <.061 <.72 <.015 <.012 <.011 <.012 <.045
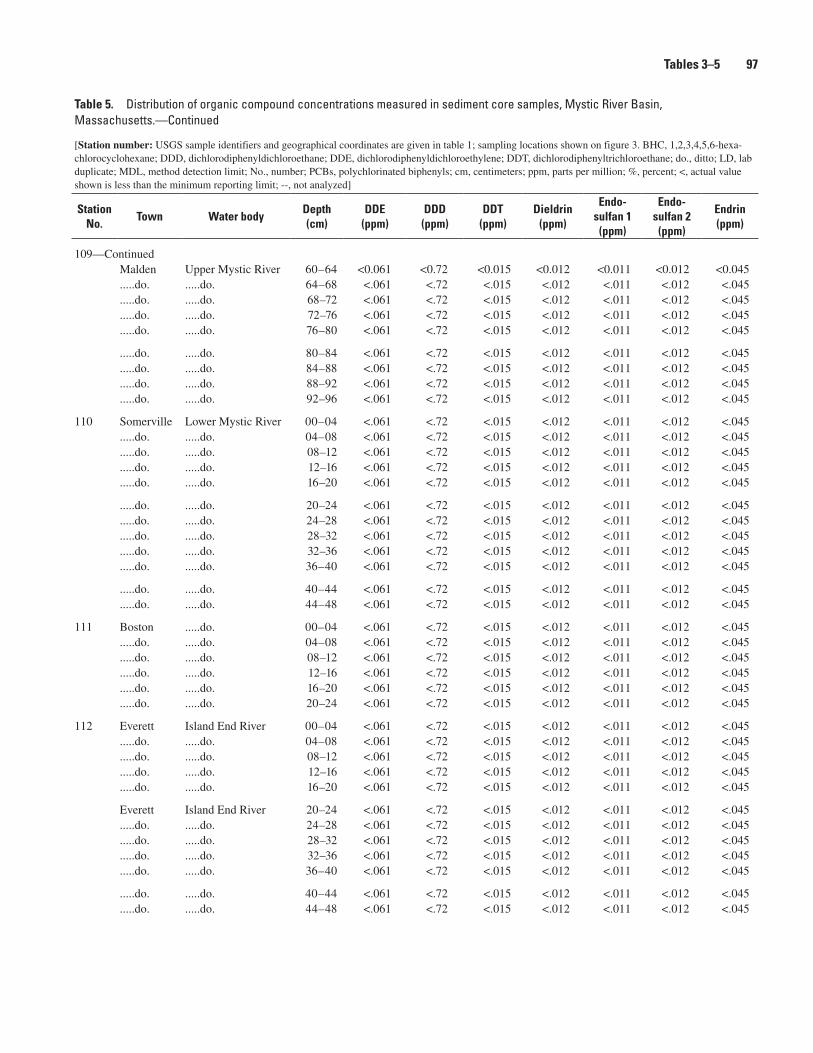
Tables 3–� ��
Table �. Distribution of organic compound concentrations measured in sediment core samples, Mystic River Basin, Massachusetts.—Continued
[Station number: USGS sample identifiers and geographical coordinates are given in table 1; sampling locations shown on figure 3. BHC, 1,2,3,4,5,6-hexa-chlorocyclohexane; DDD, dichlorodiphenyldichloroethane; DDE, dichlorodiphenyldichloroethylene; DDT, dichlorodiphenyltrichloroethane; do., ditto; LD, lab duplicate; MDL, method detection limit; No., number; PCBs, polychlorinated biphenyls; cm, centimeters; ppm, parts per million; %, percent; <, actual value shown is less than the minimum reporting limit; --, not analyzed]
Station No.
Town Water bodyDepth (cm)
DDE (ppm)
DDD (ppm)
DDT (ppm)
Dieldrin (ppm)
Endo- sulfan 1 (ppm)
Endo- sulfan 2 (ppm)
Endrin (ppm)
109—ContinuedMalden Upper Mystic River 60–64 <0.061 <0.72 <0.015 <0.012 <0.011 <0.012 <0.045.....do. .....do. 64–68 <.061 <.72 <.015 <.012 <.011 <.012 <.045.....do. .....do. 68–72 <.061 <.72 <.015 <.012 <.011 <.012 <.045.....do. .....do. 72–76 <.061 <.72 <.015 <.012 <.011 <.012 <.045.....do. .....do. 76–80 <.061 <.72 <.015 <.012 <.011 <.012 <.045
.....do. .....do. 80–84 <.061 <.72 <.015 <.012 <.011 <.012 <.045
.....do. .....do. 84–88 <.061 <.72 <.015 <.012 <.011 <.012 <.045
.....do. .....do. 88–92 <.061 <.72 <.015 <.012 <.011 <.012 <.045
.....do. .....do. 92–96 <.061 <.72 <.015 <.012 <.011 <.012 <.045
110 Somerville Lower Mystic River 00–04 <.061 <.72 <.015 <.012 <.011 <.012 <.045.....do. .....do. 04–08 <.061 <.72 <.015 <.012 <.011 <.012 <.045.....do. .....do. 08–12 <.061 <.72 <.015 <.012 <.011 <.012 <.045.....do. .....do. 12–16 <.061 <.72 <.015 <.012 <.011 <.012 <.045.....do. .....do. 16–20 <.061 <.72 <.015 <.012 <.011 <.012 <.045
.....do. .....do. 20–24 <.061 <.72 <.015 <.012 <.011 <.012 <.045
.....do. .....do. 24–28 <.061 <.72 <.015 <.012 <.011 <.012 <.045
.....do. .....do. 28–32 <.061 <.72 <.015 <.012 <.011 <.012 <.045
.....do. .....do. 32–36 <.061 <.72 <.015 <.012 <.011 <.012 <.045
.....do. .....do. 36–40 <.061 <.72 <.015 <.012 <.011 <.012 <.045
.....do. .....do. 40–44 <.061 <.72 <.015 <.012 <.011 <.012 <.045
.....do. .....do. 44–48 <.061 <.72 <.015 <.012 <.011 <.012 <.045
111 Boston .....do. 00–04 <.061 <.72 <.015 <.012 <.011 <.012 <.045.....do. .....do. 04–08 <.061 <.72 <.015 <.012 <.011 <.012 <.045.....do. .....do. 08–12 <.061 <.72 <.015 <.012 <.011 <.012 <.045.....do. .....do. 12–16 <.061 <.72 <.015 <.012 <.011 <.012 <.045.....do. .....do. 16–20 <.061 <.72 <.015 <.012 <.011 <.012 <.045.....do. .....do. 20–24 <.061 <.72 <.015 <.012 <.011 <.012 <.045
112 Everett Island End River 00–04 <.061 <.72 <.015 <.012 <.011 <.012 <.045.....do. .....do. 04–08 <.061 <.72 <.015 <.012 <.011 <.012 <.045.....do. .....do. 08–12 <.061 <.72 <.015 <.012 <.011 <.012 <.045.....do. .....do. 12–16 <.061 <.72 <.015 <.012 <.011 <.012 <.045.....do. .....do. 16–20 <.061 <.72 <.015 <.012 <.011 <.012 <.045
Everett Island End River 20–24 <.061 <.72 <.015 <.012 <.011 <.012 <.045.....do. .....do. 24–28 <.061 <.72 <.015 <.012 <.011 <.012 <.045.....do. .....do. 28–32 <.061 <.72 <.015 <.012 <.011 <.012 <.045.....do. .....do. 32–36 <.061 <.72 <.015 <.012 <.011 <.012 <.045.....do. .....do. 36–40 <.061 <.72 <.015 <.012 <.011 <.012 <.045
.....do. .....do. 40–44 <.061 <.72 <.015 <.012 <.011 <.012 <.045
.....do. .....do. 44–48 <.061 <.72 <.015 <.012 <.011 <.012 <.045
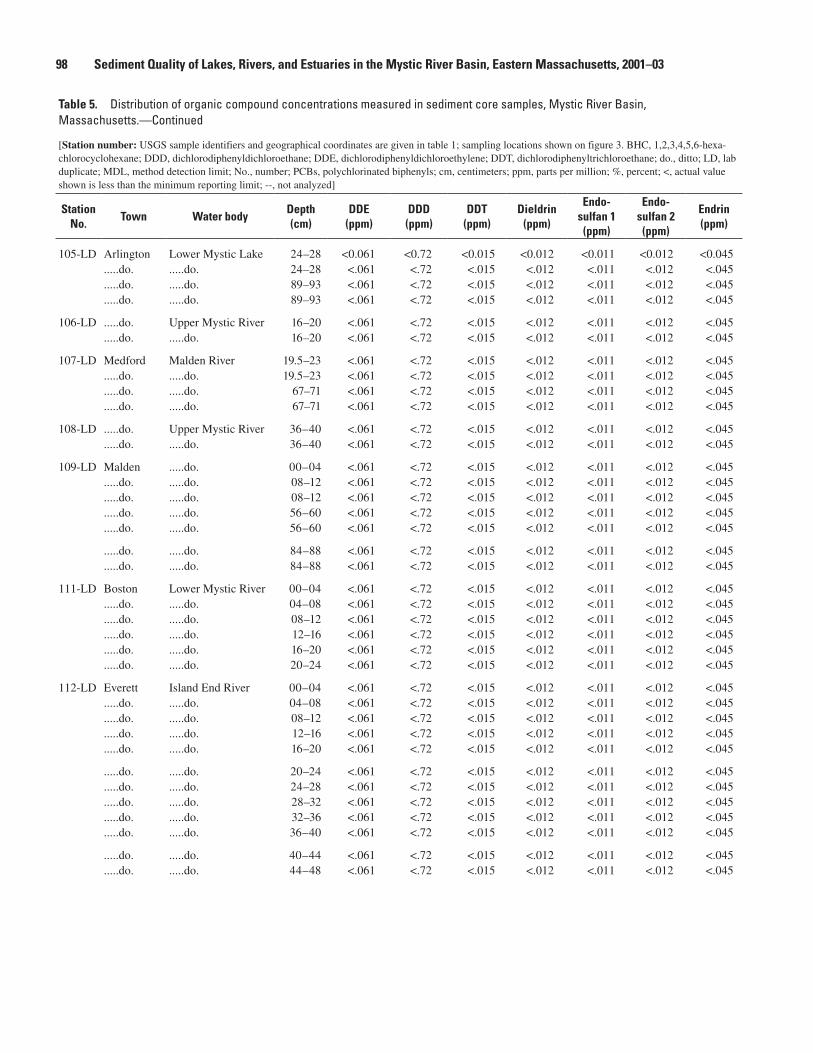
�� Sediment Quality of Lakes, Rivers, and Estuaries in the Mystic River Basin, Eastern Massachusetts, 2001–03
Table �. Distribution of organic compound concentrations measured in sediment core samples, Mystic River Basin, Massachusetts.—Continued
[Station number: USGS sample identifiers and geographical coordinates are given in table 1; sampling locations shown on figure 3. BHC, 1,2,3,4,5,6-hexa-chlorocyclohexane; DDD, dichlorodiphenyldichloroethane; DDE, dichlorodiphenyldichloroethylene; DDT, dichlorodiphenyltrichloroethane; do., ditto; LD, lab duplicate; MDL, method detection limit; No., number; PCBs, polychlorinated biphenyls; cm, centimeters; ppm, parts per million; %, percent; <, actual value shown is less than the minimum reporting limit; --, not analyzed]
Station No.
Town Water bodyDepth (cm)
DDE (ppm)
DDD (ppm)
DDT (ppm)
Dieldrin (ppm)
Endo- sulfan 1 (ppm)
Endo- sulfan 2 (ppm)
Endrin (ppm)
105-LD Arlington Lower Mystic Lake 24–28 <0.061 <0.72 <0.015 <0.012 <0.011 <0.012 <0.045.....do. .....do. 24–28 <.061 <.72 <.015 <.012 <.011 <.012 <.045.....do. .....do. 89–93 <.061 <.72 <.015 <.012 <.011 <.012 <.045.....do. .....do. 89–93 <.061 <.72 <.015 <.012 <.011 <.012 <.045
106-LD .....do. Upper Mystic River 16–20 <.061 <.72 <.015 <.012 <.011 <.012 <.045.....do. .....do. 16–20 <.061 <.72 <.015 <.012 <.011 <.012 <.045
107-LD Medford Malden River 19.5–23 <.061 <.72 <.015 <.012 <.011 <.012 <.045.....do. .....do. 19.5–23 <.061 <.72 <.015 <.012 <.011 <.012 <.045.....do. .....do. 67–71 <.061 <.72 <.015 <.012 <.011 <.012 <.045.....do. .....do. 67–71 <.061 <.72 <.015 <.012 <.011 <.012 <.045
108-LD .....do. Upper Mystic River 36–40 <.061 <.72 <.015 <.012 <.011 <.012 <.045.....do. .....do. 36–40 <.061 <.72 <.015 <.012 <.011 <.012 <.045
109-LD Malden .....do. 00–04 <.061 <.72 <.015 <.012 <.011 <.012 <.045.....do. .....do. 08–12 <.061 <.72 <.015 <.012 <.011 <.012 <.045.....do. .....do. 08–12 <.061 <.72 <.015 <.012 <.011 <.012 <.045.....do. .....do. 56–60 <.061 <.72 <.015 <.012 <.011 <.012 <.045.....do. .....do. 56–60 <.061 <.72 <.015 <.012 <.011 <.012 <.045
.....do. .....do. 84–88 <.061 <.72 <.015 <.012 <.011 <.012 <.045
.....do. .....do. 84–88 <.061 <.72 <.015 <.012 <.011 <.012 <.045
111-LD Boston Lower Mystic River 00–04 <.061 <.72 <.015 <.012 <.011 <.012 <.045.....do. .....do. 04–08 <.061 <.72 <.015 <.012 <.011 <.012 <.045.....do. .....do. 08–12 <.061 <.72 <.015 <.012 <.011 <.012 <.045.....do. .....do. 12–16 <.061 <.72 <.015 <.012 <.011 <.012 <.045.....do. .....do. 16–20 <.061 <.72 <.015 <.012 <.011 <.012 <.045.....do. .....do. 20–24 <.061 <.72 <.015 <.012 <.011 <.012 <.045
112-LD Everett Island End River 00–04 <.061 <.72 <.015 <.012 <.011 <.012 <.045.....do. .....do. 04–08 <.061 <.72 <.015 <.012 <.011 <.012 <.045.....do. .....do. 08–12 <.061 <.72 <.015 <.012 <.011 <.012 <.045.....do. .....do. 12–16 <.061 <.72 <.015 <.012 <.011 <.012 <.045.....do. .....do. 16–20 <.061 <.72 <.015 <.012 <.011 <.012 <.045
.....do. .....do. 20–24 <.061 <.72 <.015 <.012 <.011 <.012 <.045
.....do. .....do. 24–28 <.061 <.72 <.015 <.012 <.011 <.012 <.045
.....do. .....do. 28–32 <.061 <.72 <.015 <.012 <.011 <.012 <.045
.....do. .....do. 32–36 <.061 <.72 <.015 <.012 <.011 <.012 <.045
.....do. .....do. 36–40 <.061 <.72 <.015 <.012 <.011 <.012 <.045
.....do. .....do. 40–44 <.061 <.72 <.015 <.012 <.011 <.012 <.045
.....do. .....do. 44–48 <.061 <.72 <.015 <.012 <.011 <.012 <.045
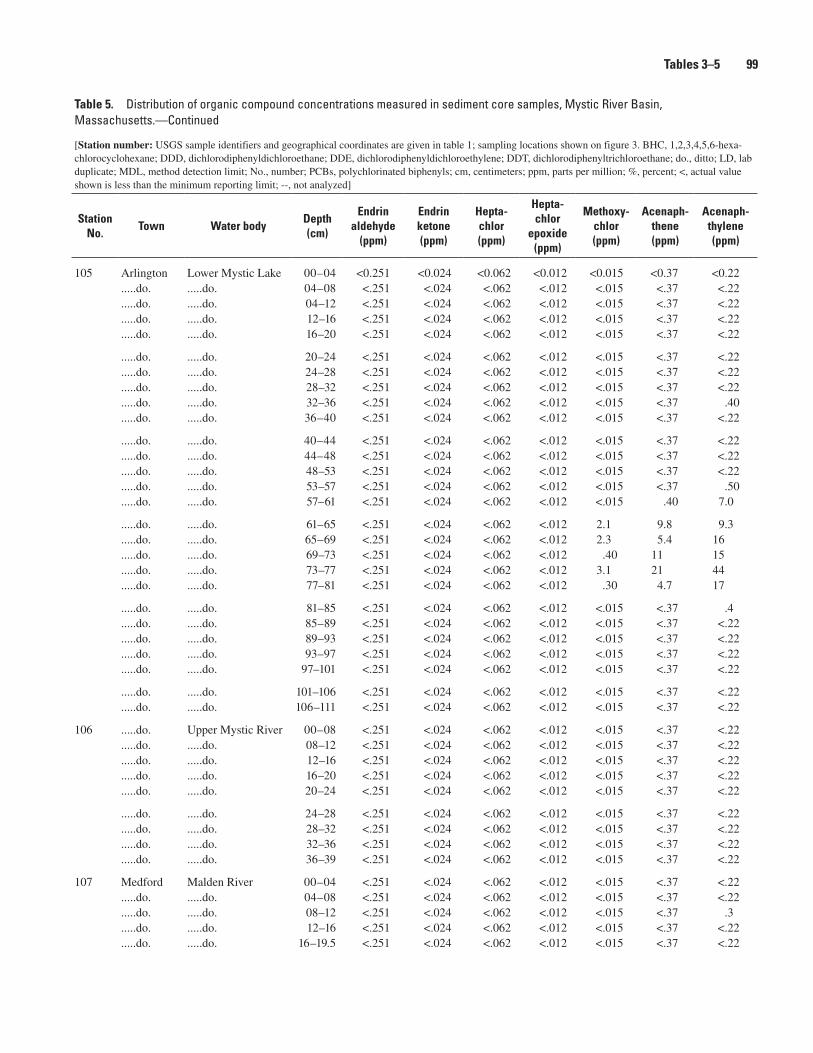
Tables 3–� ��
Table �. Distribution of organic compound concentrations measured in sediment core samples, Mystic River Basin, Massachusetts.—Continued
[Station number: USGS sample identifiers and geographical coordinates are given in table 1; sampling locations shown on figure 3. BHC, 1,2,3,4,5,6-hexa-chlorocyclohexane; DDD, dichlorodiphenyldichloroethane; DDE, dichlorodiphenyldichloroethylene; DDT, dichlorodiphenyltrichloroethane; do., ditto; LD, lab duplicate; MDL, method detection limit; No., number; PCBs, polychlorinated biphenyls; cm, centimeters; ppm, parts per million; %, percent; <, actual value shown is less than the minimum reporting limit; --, not analyzed]
Station No.
Town Water bodyDepth (cm)
Endrin aldehyde
(ppm)
Endrin ketone (ppm)
Hepta- chlor (ppm)
Hepta- chlor
epoxide (ppm)
Methoxy- chlor (ppm)
Acenaph- thene (ppm)
Acenaph- thylene (ppm)
105 Arlington Lower Mystic Lake 00–04 <0.251 <0.024 <0.062 <0.012 <0.015 <0.37 <0.22.....do. .....do. 04–08 <.251 <.024 <.062 <.012 <.015 <.37 <.22.....do. .....do. 04–12 <.251 <.024 <.062 <.012 <.015 <.37 <.22.....do. .....do. 12–16 <.251 <.024 <.062 <.012 <.015 <.37 <.22.....do. .....do. 16–20 <.251 <.024 <.062 <.012 <.015 <.37 <.22
.....do. .....do. 20–24 <.251 <.024 <.062 <.012 <.015 <.37 <.22
.....do. .....do. 24–28 <.251 <.024 <.062 <.012 <.015 <.37 <.22
.....do. .....do. 28–32 <.251 <.024 <.062 <.012 <.015 <.37 <.22
.....do. .....do. 32–36 <.251 <.024 <.062 <.012 <.015 <.37 .40
.....do. .....do. 36–40 <.251 <.024 <.062 <.012 <.015 <.37 <.22
.....do. .....do. 40–44 <.251 <.024 <.062 <.012 <.015 <.37 <.22
.....do. .....do. 44–48 <.251 <.024 <.062 <.012 <.015 <.37 <.22
.....do. .....do. 48–53 <.251 <.024 <.062 <.012 <.015 <.37 <.22
.....do. .....do. 53–57 <.251 <.024 <.062 <.012 <.015 <.37 .50
.....do. .....do. 57–61 <.251 <.024 <.062 <.012 <.015 .40 7.0
.....do. .....do. 61–65 <.251 <.024 <.062 <.012 2.1 9.8 9.3
.....do. .....do. 65–69 <.251 <.024 <.062 <.012 2.3 5.4 16
.....do. .....do. 69–73 <.251 <.024 <.062 <.012 .40 11 15
.....do. .....do. 73–77 <.251 <.024 <.062 <.012 3.1 21 44
.....do. .....do. 77–81 <.251 <.024 <.062 <.012 .30 4.7 17
.....do. .....do. 81–85 <.251 <.024 <.062 <.012 <.015 <.37 .4
.....do. .....do. 85–89 <.251 <.024 <.062 <.012 <.015 <.37 <.22
.....do. .....do. 89–93 <.251 <.024 <.062 <.012 <.015 <.37 <.22
.....do. .....do. 93–97 <.251 <.024 <.062 <.012 <.015 <.37 <.22
.....do. .....do. 97–101 <.251 <.024 <.062 <.012 <.015 <.37 <.22
.....do. .....do. 101–106 <.251 <.024 <.062 <.012 <.015 <.37 <.22
.....do. .....do. 106–111 <.251 <.024 <.062 <.012 <.015 <.37 <.22
106 .....do. Upper Mystic River 00–08 <.251 <.024 <.062 <.012 <.015 <.37 <.22.....do. .....do. 08–12 <.251 <.024 <.062 <.012 <.015 <.37 <.22.....do. .....do. 12–16 <.251 <.024 <.062 <.012 <.015 <.37 <.22.....do. .....do. 16–20 <.251 <.024 <.062 <.012 <.015 <.37 <.22.....do. .....do. 20–24 <.251 <.024 <.062 <.012 <.015 <.37 <.22
.....do. .....do. 24–28 <.251 <.024 <.062 <.012 <.015 <.37 <.22
.....do. .....do. 28–32 <.251 <.024 <.062 <.012 <.015 <.37 <.22
.....do. .....do. 32–36 <.251 <.024 <.062 <.012 <.015 <.37 <.22
.....do. .....do. 36–39 <.251 <.024 <.062 <.012 <.015 <.37 <.22
107 Medford Malden River 00–04 <.251 <.024 <.062 <.012 <.015 <.37 <.22.....do. .....do. 04–08 <.251 <.024 <.062 <.012 <.015 <.37 <.22.....do. .....do. 08–12 <.251 <.024 <.062 <.012 <.015 <.37 .3.....do. .....do. 12–16 <.251 <.024 <.062 <.012 <.015 <.37 <.22.....do. .....do. 16–19.5 <.251 <.024 <.062 <.012 <.015 <.37 <.22
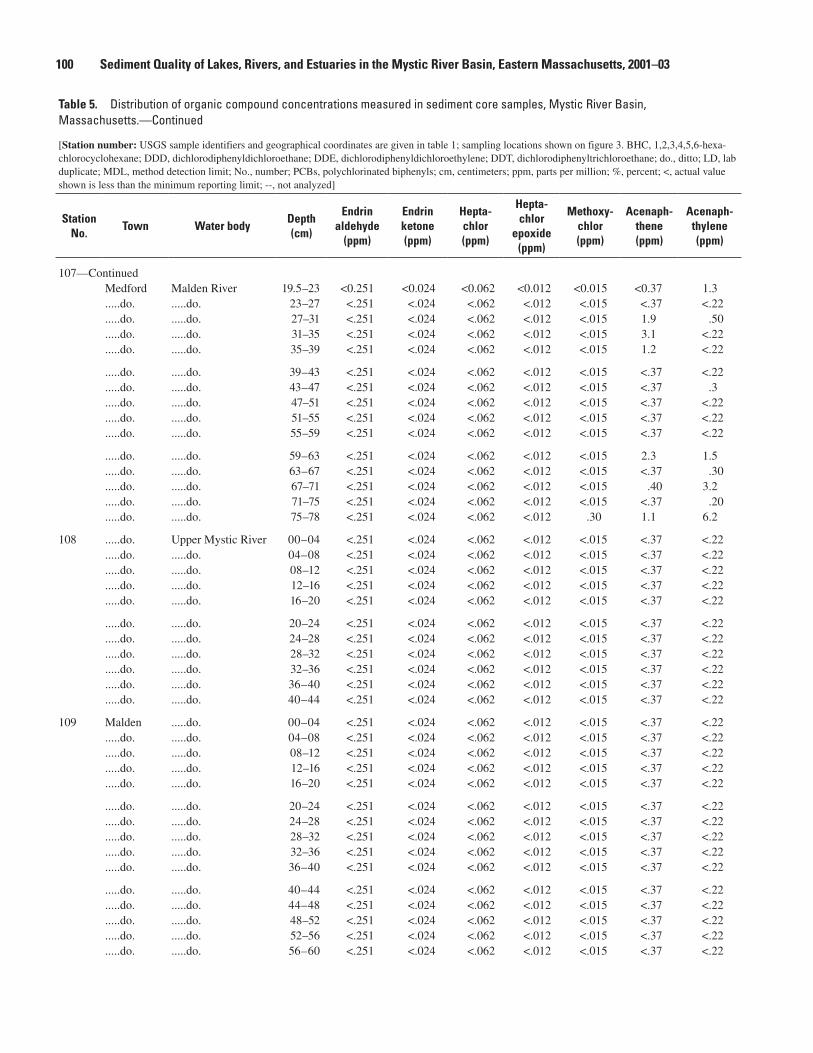
100 Sediment Quality of Lakes, Rivers, and Estuaries in the Mystic River Basin, Eastern Massachusetts, 2001–03
Table �. Distribution of organic compound concentrations measured in sediment core samples, Mystic River Basin, Massachusetts.—Continued
[Station number: USGS sample identifiers and geographical coordinates are given in table 1; sampling locations shown on figure 3. BHC, 1,2,3,4,5,6-hexa-chlorocyclohexane; DDD, dichlorodiphenyldichloroethane; DDE, dichlorodiphenyldichloroethylene; DDT, dichlorodiphenyltrichloroethane; do., ditto; LD, lab duplicate; MDL, method detection limit; No., number; PCBs, polychlorinated biphenyls; cm, centimeters; ppm, parts per million; %, percent; <, actual value shown is less than the minimum reporting limit; --, not analyzed]
Station No.
Town Water bodyDepth (cm)
Endrin aldehyde
(ppm)
Endrin ketone (ppm)
Hepta- chlor (ppm)
Hepta- chlor
epoxide (ppm)
Methoxy- chlor (ppm)
Acenaph- thene (ppm)
Acenaph- thylene (ppm)
107—ContinuedMedford Malden River 19.5–23 <0.251 <0.024 <0.062 <0.012 <0.015 <0.37 1.3.....do. .....do. 23–27 <.251 <.024 <.062 <.012 <.015 <.37 <.22.....do. .....do. 27–31 <.251 <.024 <.062 <.012 <.015 1.9 .50.....do. .....do. 31–35 <.251 <.024 <.062 <.012 <.015 3.1 <.22.....do. .....do. 35–39 <.251 <.024 <.062 <.012 <.015 1.2 <.22
.....do. .....do. 39–43 <.251 <.024 <.062 <.012 <.015 <.37 <.22
.....do. .....do. 43–47 <.251 <.024 <.062 <.012 <.015 <.37 .3
.....do. .....do. 47–51 <.251 <.024 <.062 <.012 <.015 <.37 <.22
.....do. .....do. 51–55 <.251 <.024 <.062 <.012 <.015 <.37 <.22
.....do. .....do. 55–59 <.251 <.024 <.062 <.012 <.015 <.37 <.22
.....do. .....do. 59–63 <.251 <.024 <.062 <.012 <.015 2.3 1.5
.....do. .....do. 63–67 <.251 <.024 <.062 <.012 <.015 <.37 .30
.....do. .....do. 67–71 <.251 <.024 <.062 <.012 <.015 .40 3.2
.....do. .....do. 71–75 <.251 <.024 <.062 <.012 <.015 <.37 .20
.....do. .....do. 75–78 <.251 <.024 <.062 <.012 .30 1.1 6.2
108 .....do. Upper Mystic River 00–04 <.251 <.024 <.062 <.012 <.015 <.37 <.22.....do. .....do. 04–08 <.251 <.024 <.062 <.012 <.015 <.37 <.22.....do. .....do. 08–12 <.251 <.024 <.062 <.012 <.015 <.37 <.22.....do. .....do. 12–16 <.251 <.024 <.062 <.012 <.015 <.37 <.22.....do. .....do. 16–20 <.251 <.024 <.062 <.012 <.015 <.37 <.22
.....do. .....do. 20–24 <.251 <.024 <.062 <.012 <.015 <.37 <.22
.....do. .....do. 24–28 <.251 <.024 <.062 <.012 <.015 <.37 <.22
.....do. .....do. 28–32 <.251 <.024 <.062 <.012 <.015 <.37 <.22
.....do. .....do. 32–36 <.251 <.024 <.062 <.012 <.015 <.37 <.22
.....do. .....do. 36–40 <.251 <.024 <.062 <.012 <.015 <.37 <.22
.....do. .....do. 40–44 <.251 <.024 <.062 <.012 <.015 <.37 <.22
109 Malden .....do. 00–04 <.251 <.024 <.062 <.012 <.015 <.37 <.22.....do. .....do. 04–08 <.251 <.024 <.062 <.012 <.015 <.37 <.22.....do. .....do. 08–12 <.251 <.024 <.062 <.012 <.015 <.37 <.22.....do. .....do. 12–16 <.251 <.024 <.062 <.012 <.015 <.37 <.22.....do. .....do. 16–20 <.251 <.024 <.062 <.012 <.015 <.37 <.22
.....do. .....do. 20–24 <.251 <.024 <.062 <.012 <.015 <.37 <.22
.....do. .....do. 24–28 <.251 <.024 <.062 <.012 <.015 <.37 <.22
.....do. .....do. 28–32 <.251 <.024 <.062 <.012 <.015 <.37 <.22
.....do. .....do. 32–36 <.251 <.024 <.062 <.012 <.015 <.37 <.22
.....do. .....do. 36–40 <.251 <.024 <.062 <.012 <.015 <.37 <.22
.....do. .....do. 40–44 <.251 <.024 <.062 <.012 <.015 <.37 <.22
.....do. .....do. 44–48 <.251 <.024 <.062 <.012 <.015 <.37 <.22
.....do. .....do. 48–52 <.251 <.024 <.062 <.012 <.015 <.37 <.22
.....do. .....do. 52–56 <.251 <.024 <.062 <.012 <.015 <.37 <.22
.....do. .....do. 56–60 <.251 <.024 <.062 <.012 <.015 <.37 <.22
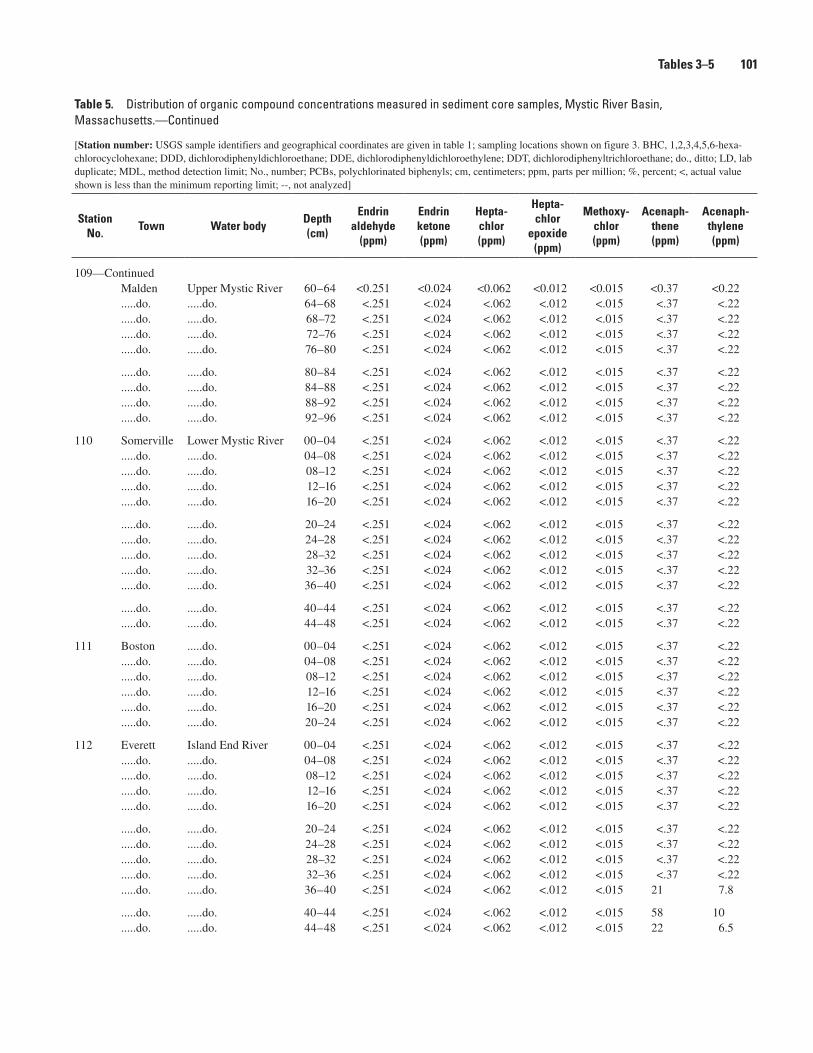
Tables 3–� 101
Table �. Distribution of organic compound concentrations measured in sediment core samples, Mystic River Basin, Massachusetts.—Continued
[Station number: USGS sample identifiers and geographical coordinates are given in table 1; sampling locations shown on figure 3. BHC, 1,2,3,4,5,6-hexa-chlorocyclohexane; DDD, dichlorodiphenyldichloroethane; DDE, dichlorodiphenyldichloroethylene; DDT, dichlorodiphenyltrichloroethane; do., ditto; LD, lab duplicate; MDL, method detection limit; No., number; PCBs, polychlorinated biphenyls; cm, centimeters; ppm, parts per million; %, percent; <, actual value shown is less than the minimum reporting limit; --, not analyzed]
Station No.
Town Water bodyDepth (cm)
Endrin aldehyde
(ppm)
Endrin ketone (ppm)
Hepta- chlor (ppm)
Hepta- chlor
epoxide (ppm)
Methoxy- chlor (ppm)
Acenaph- thene (ppm)
Acenaph- thylene (ppm)
109—ContinuedMalden Upper Mystic River 60–64 <0.251 <0.024 <0.062 <0.012 <0.015 <0.37 <0.22.....do. .....do. 64–68 <.251 <.024 <.062 <.012 <.015 <.37 <.22.....do. .....do. 68–72 <.251 <.024 <.062 <.012 <.015 <.37 <.22.....do. .....do. 72–76 <.251 <.024 <.062 <.012 <.015 <.37 <.22.....do. .....do. 76–80 <.251 <.024 <.062 <.012 <.015 <.37 <.22
.....do. .....do. 80–84 <.251 <.024 <.062 <.012 <.015 <.37 <.22
.....do. .....do. 84–88 <.251 <.024 <.062 <.012 <.015 <.37 <.22
.....do. .....do. 88–92 <.251 <.024 <.062 <.012 <.015 <.37 <.22
.....do. .....do. 92–96 <.251 <.024 <.062 <.012 <.015 <.37 <.22
110 Somerville Lower Mystic River 00–04 <.251 <.024 <.062 <.012 <.015 <.37 <.22.....do. .....do. 04–08 <.251 <.024 <.062 <.012 <.015 <.37 <.22.....do. .....do. 08–12 <.251 <.024 <.062 <.012 <.015 <.37 <.22.....do. .....do. 12–16 <.251 <.024 <.062 <.012 <.015 <.37 <.22.....do. .....do. 16–20 <.251 <.024 <.062 <.012 <.015 <.37 <.22
.....do. .....do. 20–24 <.251 <.024 <.062 <.012 <.015 <.37 <.22
.....do. .....do. 24–28 <.251 <.024 <.062 <.012 <.015 <.37 <.22
.....do. .....do. 28–32 <.251 <.024 <.062 <.012 <.015 <.37 <.22
.....do. .....do. 32–36 <.251 <.024 <.062 <.012 <.015 <.37 <.22
.....do. .....do. 36–40 <.251 <.024 <.062 <.012 <.015 <.37 <.22
.....do. .....do. 40–44 <.251 <.024 <.062 <.012 <.015 <.37 <.22
.....do. .....do. 44–48 <.251 <.024 <.062 <.012 <.015 <.37 <.22
111 Boston .....do. 00–04 <.251 <.024 <.062 <.012 <.015 <.37 <.22.....do. .....do. 04–08 <.251 <.024 <.062 <.012 <.015 <.37 <.22.....do. .....do. 08–12 <.251 <.024 <.062 <.012 <.015 <.37 <.22.....do. .....do. 12–16 <.251 <.024 <.062 <.012 <.015 <.37 <.22.....do. .....do. 16–20 <.251 <.024 <.062 <.012 <.015 <.37 <.22.....do. .....do. 20–24 <.251 <.024 <.062 <.012 <.015 <.37 <.22
112 Everett Island End River 00–04 <.251 <.024 <.062 <.012 <.015 <.37 <.22.....do. .....do. 04–08 <.251 <.024 <.062 <.012 <.015 <.37 <.22.....do. .....do. 08–12 <.251 <.024 <.062 <.012 <.015 <.37 <.22.....do. .....do. 12–16 <.251 <.024 <.062 <.012 <.015 <.37 <.22.....do. .....do. 16–20 <.251 <.024 <.062 <.012 <.015 <.37 <.22
.....do. .....do. 20–24 <.251 <.024 <.062 <.012 <.015 <.37 <.22
.....do. .....do. 24–28 <.251 <.024 <.062 <.012 <.015 <.37 <.22
.....do. .....do. 28–32 <.251 <.024 <.062 <.012 <.015 <.37 <.22
.....do. .....do. 32–36 <.251 <.024 <.062 <.012 <.015 <.37 <.22
.....do. .....do. 36–40 <.251 <.024 <.062 <.012 <.015 21 7.8
.....do. .....do. 40–44 <.251 <.024 <.062 <.012 <.015 58 10
.....do. .....do. 44–48 <.251 <.024 <.062 <.012 <.015 22 6.5
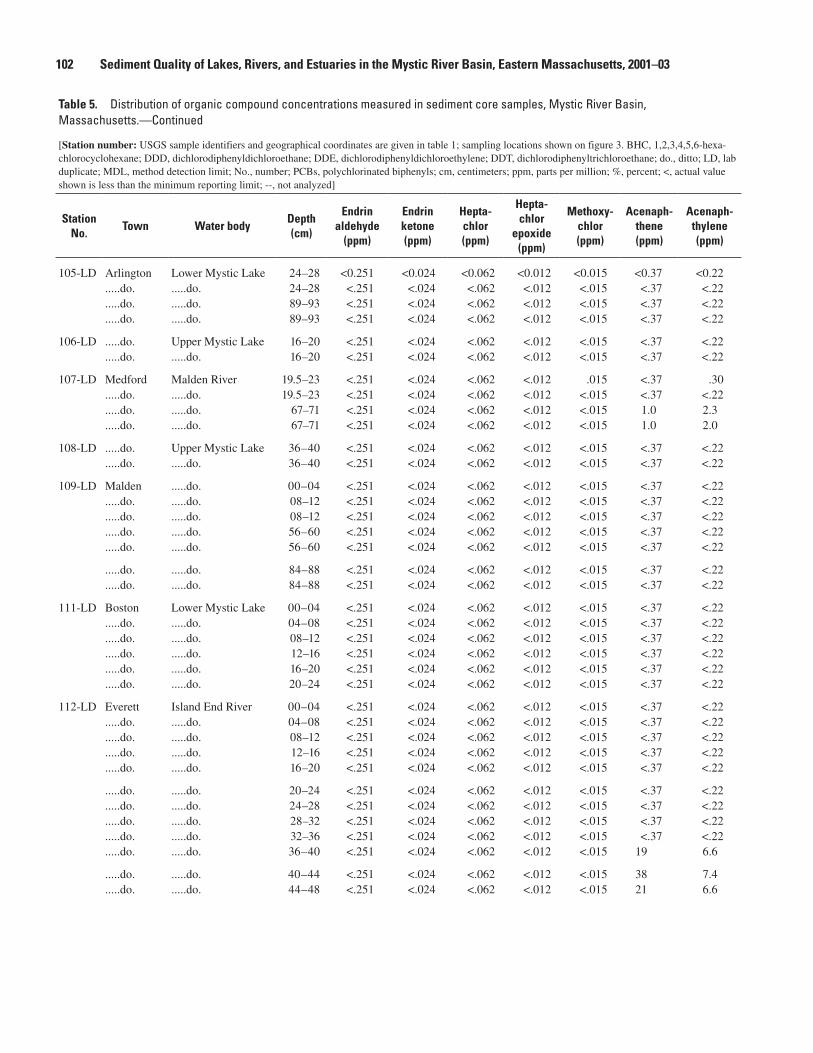
102 Sediment Quality of Lakes, Rivers, and Estuaries in the Mystic River Basin, Eastern Massachusetts, 2001–03
Table �. Distribution of organic compound concentrations measured in sediment core samples, Mystic River Basin, Massachusetts.—Continued
[Station number: USGS sample identifiers and geographical coordinates are given in table 1; sampling locations shown on figure 3. BHC, 1,2,3,4,5,6-hexa-chlorocyclohexane; DDD, dichlorodiphenyldichloroethane; DDE, dichlorodiphenyldichloroethylene; DDT, dichlorodiphenyltrichloroethane; do., ditto; LD, lab duplicate; MDL, method detection limit; No., number; PCBs, polychlorinated biphenyls; cm, centimeters; ppm, parts per million; %, percent; <, actual value shown is less than the minimum reporting limit; --, not analyzed]
Station No.
Town Water bodyDepth (cm)
Endrin aldehyde
(ppm)
Endrin ketone (ppm)
Hepta- chlor (ppm)
Hepta- chlor
epoxide (ppm)
Methoxy- chlor (ppm)
Acenaph- thene (ppm)
Acenaph- thylene (ppm)
105-LD Arlington Lower Mystic Lake 24–28 <0.251 <0.024 <0.062 <0.012 <0.015 <0.37 <0.22.....do. .....do. 24–28 <.251 <.024 <.062 <.012 <.015 <.37 <.22.....do. .....do. 89–93 <.251 <.024 <.062 <.012 <.015 <.37 <.22.....do. .....do. 89–93 <.251 <.024 <.062 <.012 <.015 <.37 <.22
106-LD .....do. Upper Mystic Lake 16–20 <.251 <.024 <.062 <.012 <.015 <.37 <.22.....do. .....do. 16–20 <.251 <.024 <.062 <.012 <.015 <.37 <.22
107-LD Medford Malden River 19.5–23 <.251 <.024 <.062 <.012 .015 <.37 .30.....do. .....do. 19.5–23 <.251 <.024 <.062 <.012 <.015 <.37 <.22.....do. .....do. 67–71 <.251 <.024 <.062 <.012 <.015 1.0 2.3.....do. .....do. 67–71 <.251 <.024 <.062 <.012 <.015 1.0 2.0
108-LD .....do. Upper Mystic Lake 36–40 <.251 <.024 <.062 <.012 <.015 <.37 <.22.....do. .....do. 36–40 <.251 <.024 <.062 <.012 <.015 <.37 <.22
109-LD Malden .....do. 00–04 <.251 <.024 <.062 <.012 <.015 <.37 <.22.....do. .....do. 08–12 <.251 <.024 <.062 <.012 <.015 <.37 <.22.....do. .....do. 08–12 <.251 <.024 <.062 <.012 <.015 <.37 <.22.....do. .....do. 56–60 <.251 <.024 <.062 <.012 <.015 <.37 <.22.....do. .....do. 56–60 <.251 <.024 <.062 <.012 <.015 <.37 <.22
.....do. .....do. 84–88 <.251 <.024 <.062 <.012 <.015 <.37 <.22
.....do. .....do. 84–88 <.251 <.024 <.062 <.012 <.015 <.37 <.22
111-LD Boston Lower Mystic Lake 00–04 <.251 <.024 <.062 <.012 <.015 <.37 <.22.....do. .....do. 04–08 <.251 <.024 <.062 <.012 <.015 <.37 <.22.....do. .....do. 08–12 <.251 <.024 <.062 <.012 <.015 <.37 <.22.....do. .....do. 12–16 <.251 <.024 <.062 <.012 <.015 <.37 <.22.....do. .....do. 16–20 <.251 <.024 <.062 <.012 <.015 <.37 <.22.....do. .....do. 20–24 <.251 <.024 <.062 <.012 <.015 <.37 <.22
112-LD Everett Island End River 00–04 <.251 <.024 <.062 <.012 <.015 <.37 <.22.....do. .....do. 04–08 <.251 <.024 <.062 <.012 <.015 <.37 <.22.....do. .....do. 08–12 <.251 <.024 <.062 <.012 <.015 <.37 <.22.....do. .....do. 12–16 <.251 <.024 <.062 <.012 <.015 <.37 <.22.....do. .....do. 16–20 <.251 <.024 <.062 <.012 <.015 <.37 <.22
.....do. .....do. 20–24 <.251 <.024 <.062 <.012 <.015 <.37 <.22
.....do. .....do. 24–28 <.251 <.024 <.062 <.012 <.015 <.37 <.22
.....do. .....do. 28–32 <.251 <.024 <.062 <.012 <.015 <.37 <.22
.....do. .....do. 32–36 <.251 <.024 <.062 <.012 <.015 <.37 <.22
.....do. .....do. 36–40 <.251 <.024 <.062 <.012 <.015 19 6.6
.....do. .....do. 40–44 <.251 <.024 <.062 <.012 <.015 38 7.4
.....do. .....do. 44–48 <.251 <.024 <.062 <.012 <.015 21 6.6
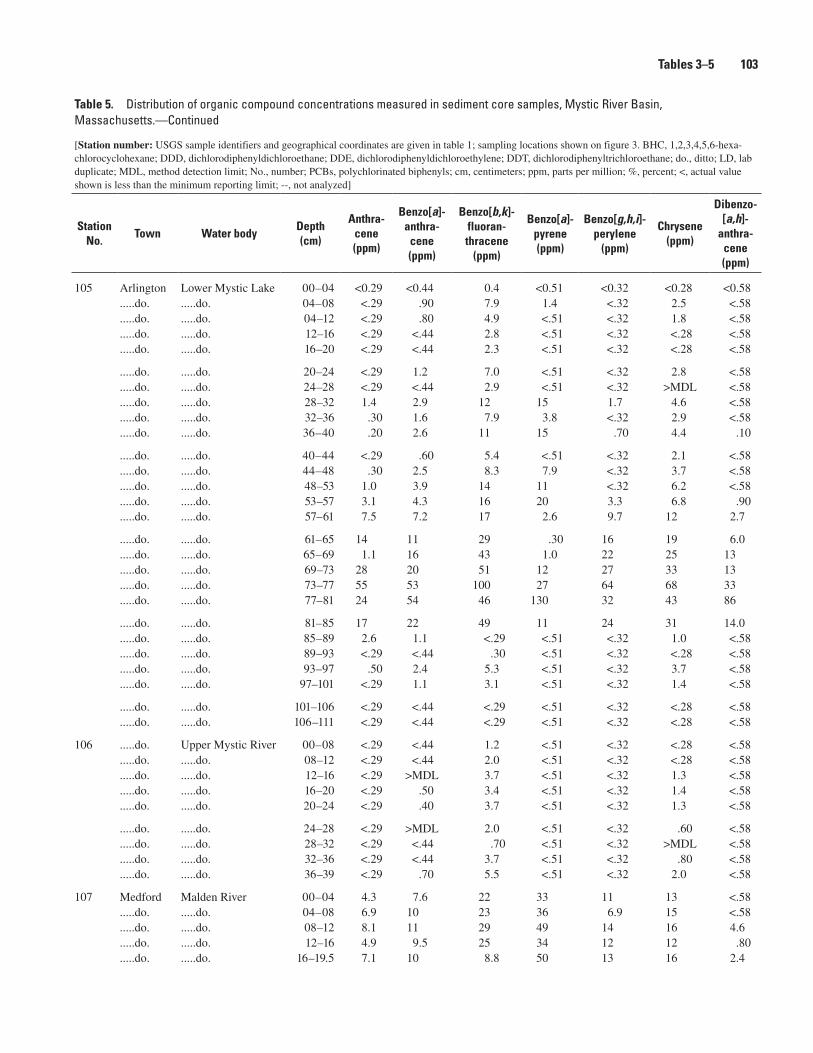
Tables 3–� 103
Table �. Distribution of organic compound concentrations measured in sediment core samples, Mystic River Basin, Massachusetts.—Continued
[Station number: USGS sample identifiers and geographical coordinates are given in table 1; sampling locations shown on figure 3. BHC, 1,2,3,4,5,6-hexa-chlorocyclohexane; DDD, dichlorodiphenyldichloroethane; DDE, dichlorodiphenyldichloroethylene; DDT, dichlorodiphenyltrichloroethane; do., ditto; LD, lab duplicate; MDL, method detection limit; No., number; PCBs, polychlorinated biphenyls; cm, centimeters; ppm, parts per million; %, percent; <, actual value shown is less than the minimum reporting limit; --, not analyzed]
Station No.
Town Water bodyDepth (cm)
Anthra- cene (ppm)
Benzo[a]- anthra-
cene (ppm)
Benzo[b,k]- fluoran- thracene
(ppm)
Benzo[a]- pyrene (ppm)
Benzo[g,h,i]- perylene
(ppm)
Chrysene (ppm)
Dibenzo- [a,h]-
anthra- cene (ppm)
105 Arlington Lower Mystic Lake 00–04 <0.29 <0.44 0.4 <0.51 <0.32 <0.28 <0.58.....do. .....do. 04–08 <.29 .90 7.9 1.4 <.32 2.5 <.58.....do. .....do. 04–12 <.29 .80 4.9 <.51 <.32 1.8 <.58.....do. .....do. 12–16 <.29 <.44 2.8 <.51 <.32 <.28 <.58.....do. .....do. 16–20 <.29 <.44 2.3 <.51 <.32 <.28 <.58
.....do. .....do. 20–24 <.29 1.2 7.0 <.51 <.32 2.8 <.58
.....do. .....do. 24–28 <.29 <.44 2.9 <.51 <.32 >MDL <.58
.....do. .....do. 28–32 1.4 2.9 12 15 1.7 4.6 <.58
.....do. .....do. 32–36 .30 1.6 7.9 3.8 <.32 2.9 <.58
.....do. .....do. 36–40 .20 2.6 11 15 .70 4.4 .10
.....do. .....do. 40–44 <.29 .60 5.4 <.51 <.32 2.1 <.58
.....do. .....do. 44–48 .30 2.5 8.3 7.9 <.32 3.7 <.58
.....do. .....do. 48–53 1.0 3.9 14 11 <.32 6.2 <.58
.....do. .....do. 53–57 3.1 4.3 16 20 3.3 6.8 .90
.....do. .....do. 57–61 7.5 7.2 17 2.6 9.7 12 2.7
.....do. .....do. 61–65 14 11 29 .30 16 19 6.0
.....do. .....do. 65–69 1.1 16 43 1.0 22 25 13
.....do. .....do. 69–73 28 20 51 12 27 33 13
.....do. .....do. 73–77 55 53 100 27 64 68 33
.....do. .....do. 77–81 24 54 46 130 32 43 86
.....do. .....do. 81–85 17 22 49 11 24 31 14.0
.....do. .....do. 85–89 2.6 1.1 <.29 <.51 <.32 1.0 <.58
.....do. .....do. 89–93 <.29 <.44 .30 <.51 <.32 <.28 <.58
.....do. .....do. 93–97 .50 2.4 5.3 <.51 <.32 3.7 <.58
.....do. .....do. 97–101 <.29 1.1 3.1 <.51 <.32 1.4 <.58
.....do. .....do. 101–106 <.29 <.44 <.29 <.51 <.32 <.28 <.58
.....do. .....do. 106–111 <.29 <.44 <.29 <.51 <.32 <.28 <.58
106 .....do. Upper Mystic River 00–08 <.29 <.44 1.2 <.51 <.32 <.28 <.58.....do. .....do. 08–12 <.29 <.44 2.0 <.51 <.32 <.28 <.58.....do. .....do. 12–16 <.29 >MDL 3.7 <.51 <.32 1.3 <.58.....do. .....do. 16–20 <.29 .50 3.4 <.51 <.32 1.4 <.58.....do. .....do. 20–24 <.29 .40 3.7 <.51 <.32 1.3 <.58
.....do. .....do. 24–28 <.29 >MDL 2.0 <.51 <.32 .60 <.58
.....do. .....do. 28–32 <.29 <.44 .70 <.51 <.32 >MDL <.58
.....do. .....do. 32–36 <.29 <.44 3.7 <.51 <.32 .80 <.58
.....do. .....do. 36–39 <.29 .70 5.5 <.51 <.32 2.0 <.58
107 Medford Malden River 00–04 4.3 7.6 22 33 11 13 <.58.....do. .....do. 04–08 6.9 10 23 36 6.9 15 <.58.....do. .....do. 08–12 8.1 11 29 49 14 16 4.6.....do. .....do. 12–16 4.9 9.5 25 34 12 12 .80.....do. .....do. 16–19.5 7.1 10 8.8 50 13 16 2.4
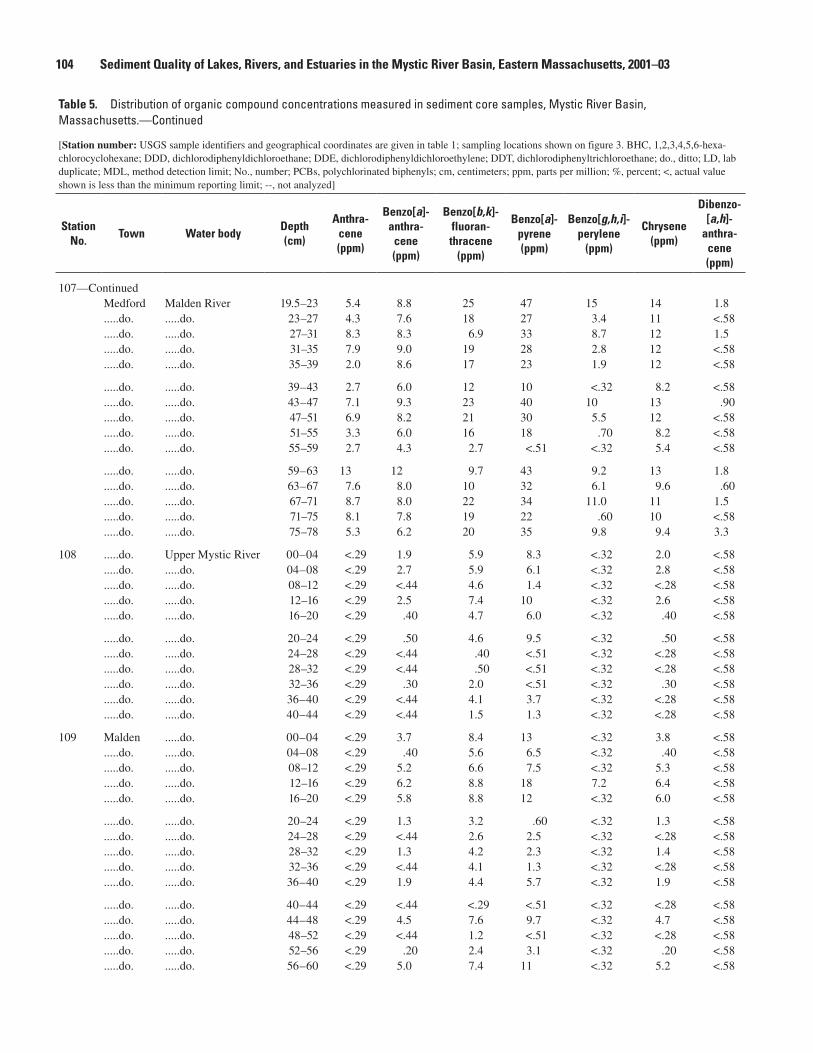
10� Sediment Quality of Lakes, Rivers, and Estuaries in the Mystic River Basin, Eastern Massachusetts, 2001–03
Table �. Distribution of organic compound concentrations measured in sediment core samples, Mystic River Basin, Massachusetts.—Continued
[Station number: USGS sample identifiers and geographical coordinates are given in table 1; sampling locations shown on figure 3. BHC, 1,2,3,4,5,6-hexa-chlorocyclohexane; DDD, dichlorodiphenyldichloroethane; DDE, dichlorodiphenyldichloroethylene; DDT, dichlorodiphenyltrichloroethane; do., ditto; LD, lab duplicate; MDL, method detection limit; No., number; PCBs, polychlorinated biphenyls; cm, centimeters; ppm, parts per million; %, percent; <, actual value shown is less than the minimum reporting limit; --, not analyzed]
Station No.
Town Water bodyDepth (cm)
Anthra- cene (ppm)
Benzo[a]- anthra-
cene (ppm)
Benzo[b,k]- fluoran- thracene
(ppm)
Benzo[a]- pyrene (ppm)
Benzo[g,h,i]- perylene
(ppm)
Chrysene (ppm)
Dibenzo- [a,h]-
anthra- cene (ppm)
107—ContinuedMedford Malden River 19.5–23 5.4 8.8 25 47 15 14 1.8.....do. .....do. 23–27 4.3 7.6 18 27 3.4 11 <.58.....do. .....do. 27–31 8.3 8.3 6.9 33 8.7 12 1.5.....do. .....do. 31–35 7.9 9.0 19 28 2.8 12 <.58.....do. .....do. 35–39 2.0 8.6 17 23 1.9 12 <.58
.....do. .....do. 39–43 2.7 6.0 12 10 <.32 8.2 <.58
.....do. .....do. 43–47 7.1 9.3 23 40 10 13 .90
.....do. .....do. 47–51 6.9 8.2 21 30 5.5 12 <.58
.....do. .....do. 51–55 3.3 6.0 16 18 .70 8.2 <.58
.....do. .....do. 55–59 2.7 4.3 2.7 <.51 <.32 5.4 <.58
.....do. .....do. 59–63 13 12 9.7 43 9.2 13 1.8
.....do. .....do. 63–67 7.6 8.0 10 32 6.1 9.6 .60
.....do. .....do. 67–71 8.7 8.0 22 34 11.0 11 1.5
.....do. .....do. 71–75 8.1 7.8 19 22 .60 10 <.58
.....do. .....do. 75–78 5.3 6.2 20 35 9.8 9.4 3.3
108 .....do. Upper Mystic River 00–04 <.29 1.9 5.9 8.3 <.32 2.0 <.58.....do. .....do. 04–08 <.29 2.7 5.9 6.1 <.32 2.8 <.58.....do. .....do. 08–12 <.29 <.44 4.6 1.4 <.32 <.28 <.58.....do. .....do. 12–16 <.29 2.5 7.4 10 <.32 2.6 <.58.....do. .....do. 16–20 <.29 .40 4.7 6.0 <.32 .40 <.58
.....do. .....do. 20–24 <.29 .50 4.6 9.5 <.32 .50 <.58
.....do. .....do. 24–28 <.29 <.44 .40 <.51 <.32 <.28 <.58
.....do. .....do. 28–32 <.29 <.44 .50 <.51 <.32 <.28 <.58
.....do. .....do. 32–36 <.29 .30 2.0 <.51 <.32 .30 <.58
.....do. .....do. 36–40 <.29 <.44 4.1 3.7 <.32 <.28 <.58
.....do. .....do. 40–44 <.29 <.44 1.5 1.3 <.32 <.28 <.58
109 Malden .....do. 00–04 <.29 3.7 8.4 13 <.32 3.8 <.58.....do. .....do. 04–08 <.29 .40 5.6 6.5 <.32 .40 <.58.....do. .....do. 08–12 <.29 5.2 6.6 7.5 <.32 5.3 <.58.....do. .....do. 12–16 <.29 6.2 8.8 18 7.2 6.4 <.58.....do. .....do. 16–20 <.29 5.8 8.8 12 <.32 6.0 <.58
.....do. .....do. 20–24 <.29 1.3 3.2 .60 <.32 1.3 <.58
.....do. .....do. 24–28 <.29 <.44 2.6 2.5 <.32 <.28 <.58
.....do. .....do. 28–32 <.29 1.3 4.2 2.3 <.32 1.4 <.58
.....do. .....do. 32–36 <.29 <.44 4.1 1.3 <.32 <.28 <.58
.....do. .....do. 36–40 <.29 1.9 4.4 5.7 <.32 1.9 <.58
.....do. .....do. 40–44 <.29 <.44 <.29 <.51 <.32 <.28 <.58
.....do. .....do. 44–48 <.29 4.5 7.6 9.7 <.32 4.7 <.58
.....do. .....do. 48–52 <.29 <.44 1.2 <.51 <.32 <.28 <.58
.....do. .....do. 52–56 <.29 .20 2.4 3.1 <.32 .20 <.58
.....do. .....do. 56–60 <.29 5.0 7.4 11 <.32 5.2 <.58
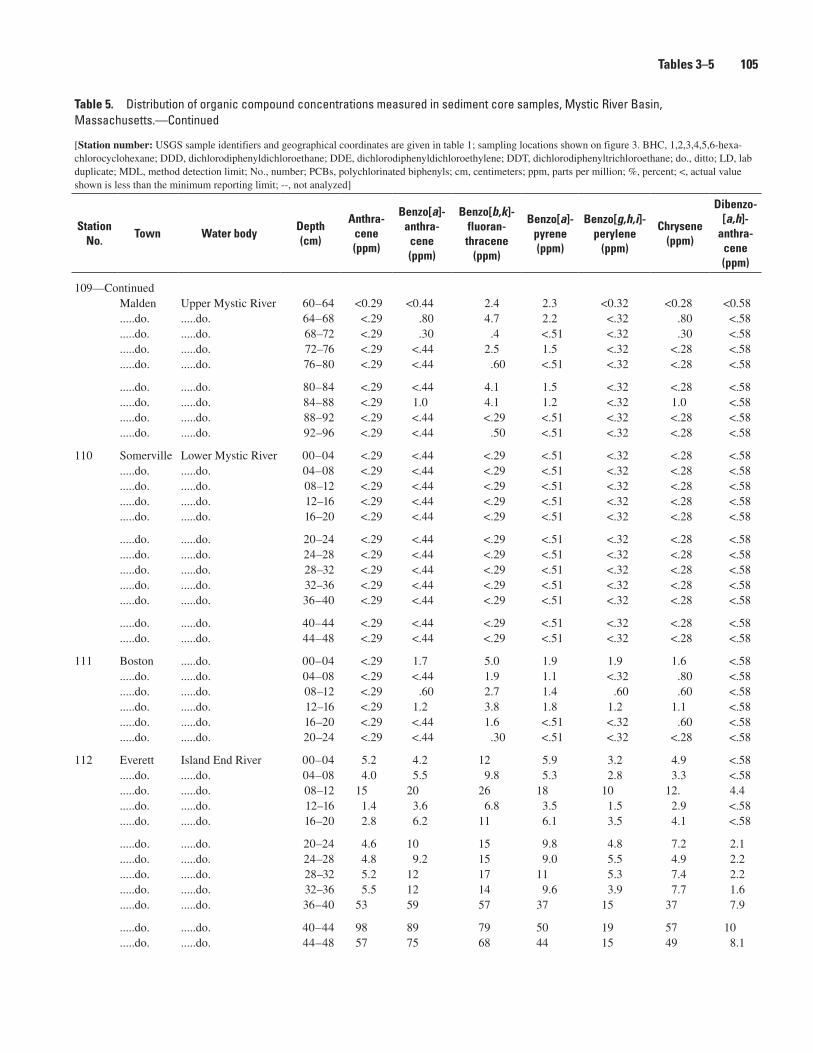
Tables 3–� 10�
Table �. Distribution of organic compound concentrations measured in sediment core samples, Mystic River Basin, Massachusetts.—Continued
[Station number: USGS sample identifiers and geographical coordinates are given in table 1; sampling locations shown on figure 3. BHC, 1,2,3,4,5,6-hexa-chlorocyclohexane; DDD, dichlorodiphenyldichloroethane; DDE, dichlorodiphenyldichloroethylene; DDT, dichlorodiphenyltrichloroethane; do., ditto; LD, lab duplicate; MDL, method detection limit; No., number; PCBs, polychlorinated biphenyls; cm, centimeters; ppm, parts per million; %, percent; <, actual value shown is less than the minimum reporting limit; --, not analyzed]
Station No.
Town Water bodyDepth (cm)
Anthra- cene (ppm)
Benzo[a]- anthra-
cene (ppm)
Benzo[b,k]- fluoran- thracene
(ppm)
Benzo[a]- pyrene (ppm)
Benzo[g,h,i]- perylene
(ppm)
Chrysene (ppm)
Dibenzo- [a,h]-
anthra- cene (ppm)
109—ContinuedMalden Upper Mystic River 60–64 <0.29 <0.44 2.4 2.3 <0.32 <0.28 <0.58.....do. .....do. 64–68 <.29 .80 4.7 2.2 <.32 .80 <.58.....do. .....do. 68–72 <.29 .30 .4 <.51 <.32 .30 <.58.....do. .....do. 72–76 <.29 <.44 2.5 1.5 <.32 <.28 <.58.....do. .....do. 76–80 <.29 <.44 .60 <.51 <.32 <.28 <.58
.....do. .....do. 80–84 <.29 <.44 4.1 1.5 <.32 <.28 <.58
.....do. .....do. 84–88 <.29 1.0 4.1 1.2 <.32 1.0 <.58
.....do. .....do. 88–92 <.29 <.44 <.29 <.51 <.32 <.28 <.58
.....do. .....do. 92–96 <.29 <.44 .50 <.51 <.32 <.28 <.58
110 Somerville Lower Mystic River 00–04 <.29 <.44 <.29 <.51 <.32 <.28 <.58.....do. .....do. 04–08 <.29 <.44 <.29 <.51 <.32 <.28 <.58.....do. .....do. 08–12 <.29 <.44 <.29 <.51 <.32 <.28 <.58.....do. .....do. 12–16 <.29 <.44 <.29 <.51 <.32 <.28 <.58.....do. .....do. 16–20 <.29 <.44 <.29 <.51 <.32 <.28 <.58
.....do. .....do. 20–24 <.29 <.44 <.29 <.51 <.32 <.28 <.58
.....do. .....do. 24–28 <.29 <.44 <.29 <.51 <.32 <.28 <.58
.....do. .....do. 28–32 <.29 <.44 <.29 <.51 <.32 <.28 <.58
.....do. .....do. 32–36 <.29 <.44 <.29 <.51 <.32 <.28 <.58
.....do. .....do. 36–40 <.29 <.44 <.29 <.51 <.32 <.28 <.58
.....do. .....do. 40–44 <.29 <.44 <.29 <.51 <.32 <.28 <.58
.....do. .....do. 44–48 <.29 <.44 <.29 <.51 <.32 <.28 <.58
111 Boston .....do. 00–04 <.29 1.7 5.0 1.9 1.9 1.6 <.58.....do. .....do. 04–08 <.29 <.44 1.9 1.1 <.32 .80 <.58.....do. .....do. 08–12 <.29 .60 2.7 1.4 .60 .60 <.58.....do. .....do. 12–16 <.29 1.2 3.8 1.8 1.2 1.1 <.58.....do. .....do. 16–20 <.29 <.44 1.6 <.51 <.32 .60 <.58.....do. .....do. 20–24 <.29 <.44 .30 <.51 <.32 <.28 <.58
112 Everett Island End River 00–04 5.2 4.2 12 5.9 3.2 4.9 <.58.....do. .....do. 04–08 4.0 5.5 9.8 5.3 2.8 3.3 <.58.....do. .....do. 08–12 15 20 26 18 10 12. 4.4.....do. .....do. 12–16 1.4 3.6 6.8 3.5 1.5 2.9 <.58.....do. .....do. 16–20 2.8 6.2 11 6.1 3.5 4.1 <.58
.....do. .....do. 20–24 4.6 10 15 9.8 4.8 7.2 2.1
.....do. .....do. 24–28 4.8 9.2 15 9.0 5.5 4.9 2.2
.....do. .....do. 28–32 5.2 12 17 11 5.3 7.4 2.2
.....do. .....do. 32–36 5.5 12 14 9.6 3.9 7.7 1.6
.....do. .....do. 36–40 53 59 57 37 15 37 7.9
.....do. .....do. 40–44 98 89 79 50 19 57 10
.....do. .....do. 44–48 57 75 68 44 15 49 8.1
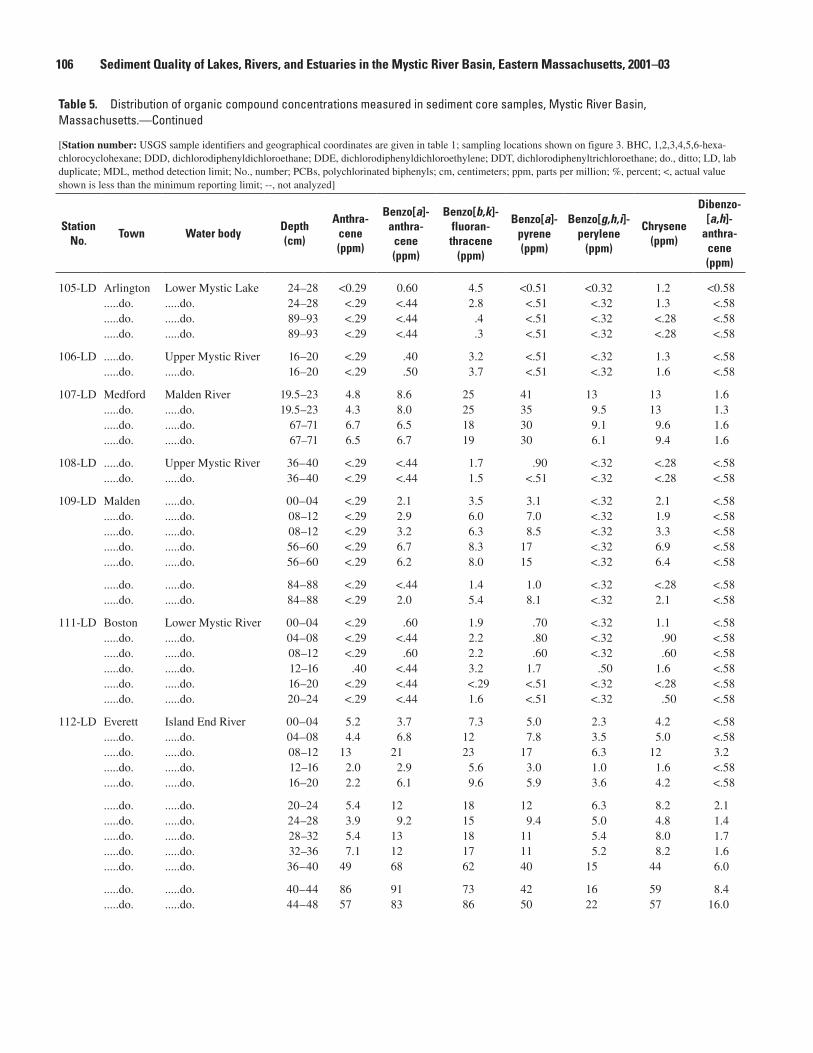
10� Sediment Quality of Lakes, Rivers, and Estuaries in the Mystic River Basin, Eastern Massachusetts, 2001–03
Table �. Distribution of organic compound concentrations measured in sediment core samples, Mystic River Basin, Massachusetts.—Continued
[Station number: USGS sample identifiers and geographical coordinates are given in table 1; sampling locations shown on figure 3. BHC, 1,2,3,4,5,6-hexa-chlorocyclohexane; DDD, dichlorodiphenyldichloroethane; DDE, dichlorodiphenyldichloroethylene; DDT, dichlorodiphenyltrichloroethane; do., ditto; LD, lab duplicate; MDL, method detection limit; No., number; PCBs, polychlorinated biphenyls; cm, centimeters; ppm, parts per million; %, percent; <, actual value shown is less than the minimum reporting limit; --, not analyzed]
Station No.
Town Water bodyDepth (cm)
Anthra- cene (ppm)
Benzo[a]- anthra-
cene (ppm)
Benzo[b,k]- fluoran- thracene
(ppm)
Benzo[a]- pyrene (ppm)
Benzo[g,h,i]- perylene
(ppm)
Chrysene (ppm)
Dibenzo- [a,h]-
anthra- cene (ppm)
105-LD Arlington Lower Mystic Lake 24–28 <0.29 0.60 4.5 <0.51 <0.32 1.2 <0.58.....do. .....do. 24–28 <.29 <.44 2.8 <.51 <.32 1.3 <.58.....do. .....do. 89–93 <.29 <.44 .4 <.51 <.32 <.28 <.58.....do. .....do. 89–93 <.29 <.44 .3 <.51 <.32 <.28 <.58
106-LD .....do. Upper Mystic River 16–20 <.29 .40 3.2 <.51 <.32 1.3 <.58.....do. .....do. 16–20 <.29 .50 3.7 <.51 <.32 1.6 <.58
107-LD Medford Malden River 19.5–23 4.8 8.6 25 41 13 13 1.6.....do. .....do. 19.5–23 4.3 8.0 25 35 9.5 13 1.3.....do. .....do. 67–71 6.7 6.5 18 30 9.1 9.6 1.6.....do. .....do. 67–71 6.5 6.7 19 30 6.1 9.4 1.6
108-LD .....do. Upper Mystic River 36–40 <.29 <.44 1.7 .90 <.32 <.28 <.58.....do. .....do. 36–40 <.29 <.44 1.5 <.51 <.32 <.28 <.58
109-LD Malden .....do. 00–04 <.29 2.1 3.5 3.1 <.32 2.1 <.58.....do. .....do. 08–12 <.29 2.9 6.0 7.0 <.32 1.9 <.58.....do. .....do. 08–12 <.29 3.2 6.3 8.5 <.32 3.3 <.58.....do. .....do. 56–60 <.29 6.7 8.3 17 <.32 6.9 <.58.....do. .....do. 56–60 <.29 6.2 8.0 15 <.32 6.4 <.58
.....do. .....do. 84–88 <.29 <.44 1.4 1.0 <.32 <.28 <.58
.....do. .....do. 84–88 <.29 2.0 5.4 8.1 <.32 2.1 <.58
111-LD Boston Lower Mystic River 00–04 <.29 .60 1.9 .70 <.32 1.1 <.58.....do. .....do. 04–08 <.29 <.44 2.2 .80 <.32 .90 <.58.....do. .....do. 08–12 <.29 .60 2.2 .60 <.32 .60 <.58.....do. .....do. 12–16 .40 <.44 3.2 1.7 .50 1.6 <.58.....do. .....do. 16–20 <.29 <.44 <.29 <.51 <.32 <.28 <.58.....do. .....do. 20–24 <.29 <.44 1.6 <.51 <.32 .50 <.58
112-LD Everett Island End River 00–04 5.2 3.7 7.3 5.0 2.3 4.2 <.58.....do. .....do. 04–08 4.4 6.8 12 7.8 3.5 5.0 <.58.....do. .....do. 08–12 13 21 23 17 6.3 12 3.2.....do. .....do. 12–16 2.0 2.9 5.6 3.0 1.0 1.6 <.58.....do. .....do. 16–20 2.2 6.1 9.6 5.9 3.6 4.2 <.58
.....do. .....do. 20–24 5.4 12 18 12 6.3 8.2 2.1
.....do. .....do. 24–28 3.9 9.2 15 9.4 5.0 4.8 1.4
.....do. .....do. 28–32 5.4 13 18 11 5.4 8.0 1.7
.....do. .....do. 32–36 7.1 12 17 11 5.2 8.2 1.6
.....do. .....do. 36–40 49 68 62 40 15 44 6.0
.....do. .....do. 40–44 86 91 73 42 16 59 8.4
.....do. .....do. 44–48 57 83 86 50 22 57 16.0
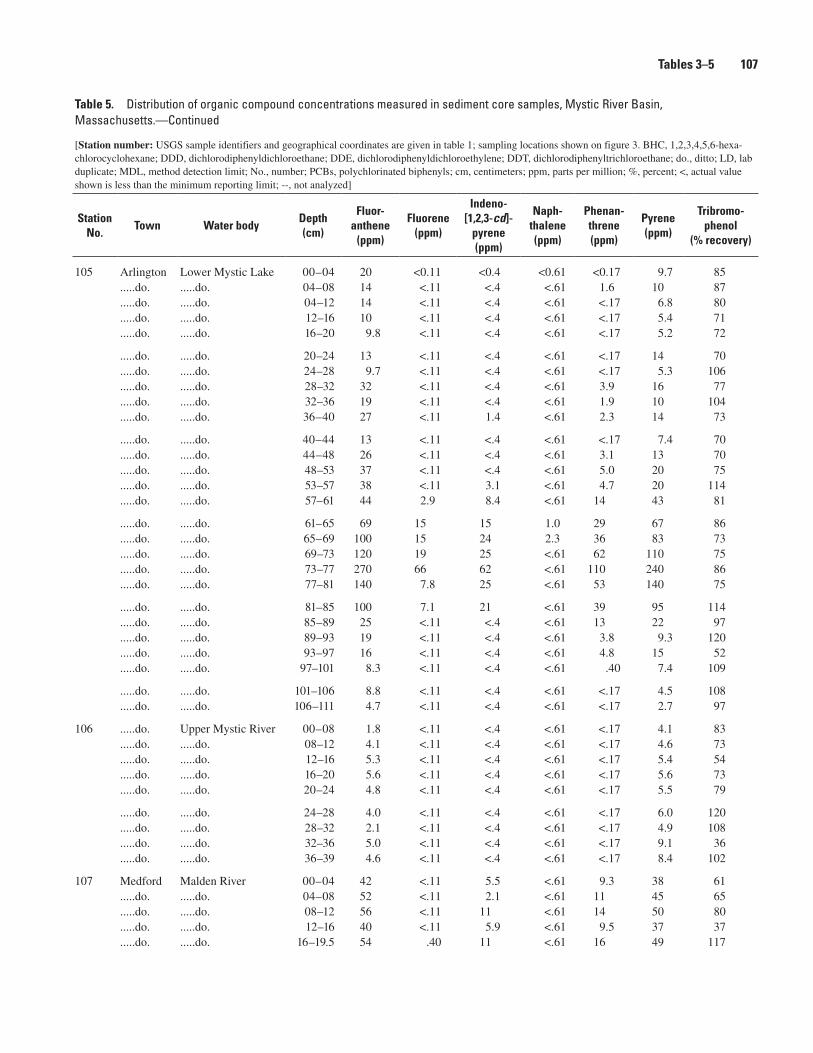
Tables 3–� 10�
Table �. Distribution of organic compound concentrations measured in sediment core samples, Mystic River Basin, Massachusetts.—Continued
[Station number: USGS sample identifiers and geographical coordinates are given in table 1; sampling locations shown on figure 3. BHC, 1,2,3,4,5,6-hexa-chlorocyclohexane; DDD, dichlorodiphenyldichloroethane; DDE, dichlorodiphenyldichloroethylene; DDT, dichlorodiphenyltrichloroethane; do., ditto; LD, lab duplicate; MDL, method detection limit; No., number; PCBs, polychlorinated biphenyls; cm, centimeters; ppm, parts per million; %, percent; <, actual value shown is less than the minimum reporting limit; --, not analyzed]
Station No.
Town Water bodyDepth (cm)
Fluor- anthene
(ppm)
Fluorene (ppm)
Indeno- [1,2,3-cd]-
pyrene (ppm)
Naph- thalene (ppm)
Phenan- threne (ppm)
Pyrene (ppm)
Tribromo- phenol
(% recovery)
105 Arlington Lower Mystic Lake 00–04 20 <0.11 <0.4 <0.61 <0.17 9.7 85.....do. .....do. 04–08 14 <.11 <.4 <.61 1.6 10 87.....do. .....do. 04–12 14 <.11 <.4 <.61 <.17 6.8 80.....do. .....do. 12–16 10 <.11 <.4 <.61 <.17 5.4 71.....do. .....do. 16–20 9.8 <.11 <.4 <.61 <.17 5.2 72
.....do. .....do. 20–24 13 <.11 <.4 <.61 <.17 14 70
.....do. .....do. 24–28 9.7 <.11 <.4 <.61 <.17 5.3 106
.....do. .....do. 28–32 32 <.11 <.4 <.61 3.9 16 77
.....do. .....do. 32–36 19 <.11 <.4 <.61 1.9 10 104
.....do. .....do. 36–40 27 <.11 1.4 <.61 2.3 14 73
.....do. .....do. 40–44 13 <.11 <.4 <.61 <.17 7.4 70
.....do. .....do. 44–48 26 <.11 <.4 <.61 3.1 13 70
.....do. .....do. 48–53 37 <.11 <.4 <.61 5.0 20 75
.....do. .....do. 53–57 38 <.11 3.1 <.61 4.7 20 114
.....do. .....do. 57–61 44 2.9 8.4 <.61 14 43 81
.....do. .....do. 61–65 69 15 15 1.0 29 67 86
.....do. .....do. 65–69 100 15 24 2.3 36 83 73
.....do. .....do. 69–73 120 19 25 <.61 62 110 75
.....do. .....do. 73–77 270 66 62 <.61 110 240 86
.....do. .....do. 77–81 140 7.8 25 <.61 53 140 75
.....do. .....do. 81–85 100 7.1 21 <.61 39 95 114
.....do. .....do. 85–89 25 <.11 <.4 <.61 13 22 97
.....do. .....do. 89–93 19 <.11 <.4 <.61 3.8 9.3 120
.....do. .....do. 93–97 16 <.11 <.4 <.61 4.8 15 52
.....do. .....do. 97–101 8.3 <.11 <.4 <.61 .40 7.4 109
.....do. .....do. 101–106 8.8 <.11 <.4 <.61 <.17 4.5 108
.....do. .....do. 106–111 4.7 <.11 <.4 <.61 <.17 2.7 97
106 .....do. Upper Mystic River 00–08 1.8 <.11 <.4 <.61 <.17 4.1 83.....do. .....do. 08–12 4.1 <.11 <.4 <.61 <.17 4.6 73.....do. .....do. 12–16 5.3 <.11 <.4 <.61 <.17 5.4 54.....do. .....do. 16–20 5.6 <.11 <.4 <.61 <.17 5.6 73.....do. .....do. 20–24 4.8 <.11 <.4 <.61 <.17 5.5 79
.....do. .....do. 24–28 4.0 <.11 <.4 <.61 <.17 6.0 120
.....do. .....do. 28–32 2.1 <.11 <.4 <.61 <.17 4.9 108
.....do. .....do. 32–36 5.0 <.11 <.4 <.61 <.17 9.1 36
.....do. .....do. 36–39 4.6 <.11 <.4 <.61 <.17 8.4 102
107 Medford Malden River 00–04 42 <.11 5.5 <.61 9.3 38 61.....do. .....do. 04–08 52 <.11 2.1 <.61 11 45 65.....do. .....do. 08–12 56 <.11 11 <.61 14 50 80.....do. .....do. 12–16 40 <.11 5.9 <.61 9.5 37 37.....do. .....do. 16–19.5 54 .40 11 <.61 16 49 117
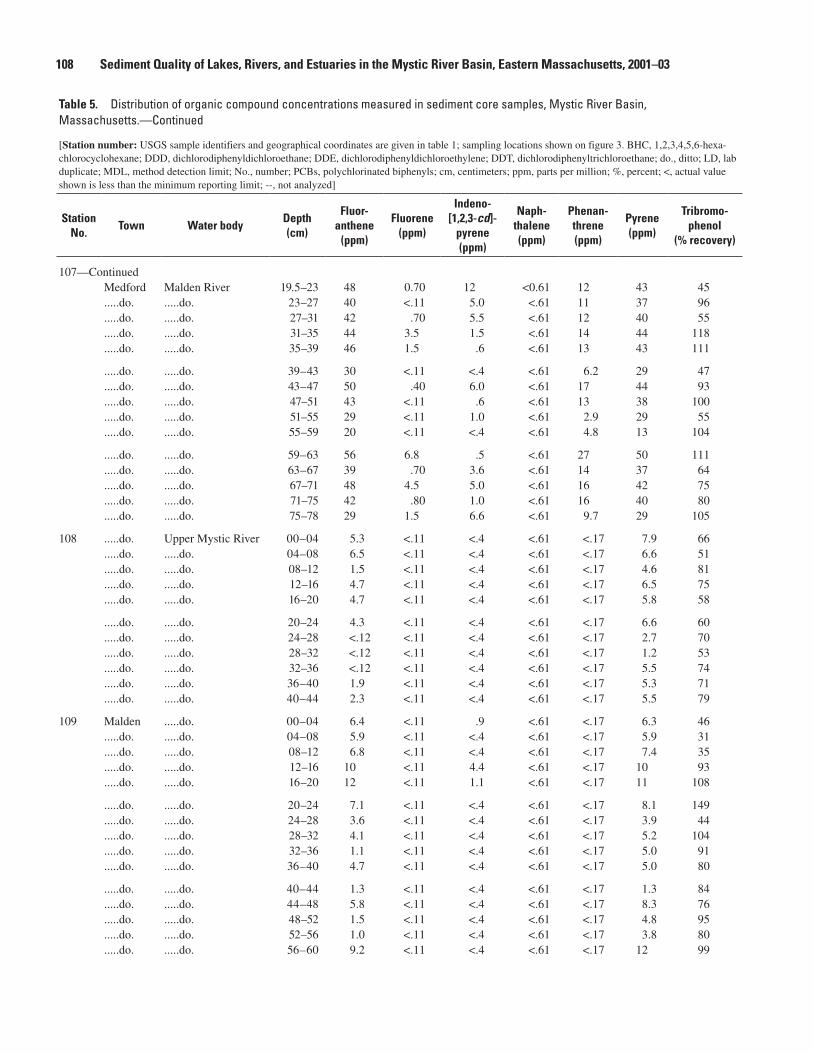
10� Sediment Quality of Lakes, Rivers, and Estuaries in the Mystic River Basin, Eastern Massachusetts, 2001–03
Table �. Distribution of organic compound concentrations measured in sediment core samples, Mystic River Basin, Massachusetts.—Continued
[Station number: USGS sample identifiers and geographical coordinates are given in table 1; sampling locations shown on figure 3. BHC, 1,2,3,4,5,6-hexa-chlorocyclohexane; DDD, dichlorodiphenyldichloroethane; DDE, dichlorodiphenyldichloroethylene; DDT, dichlorodiphenyltrichloroethane; do., ditto; LD, lab duplicate; MDL, method detection limit; No., number; PCBs, polychlorinated biphenyls; cm, centimeters; ppm, parts per million; %, percent; <, actual value shown is less than the minimum reporting limit; --, not analyzed]
Station No.
Town Water bodyDepth (cm)
Fluor- anthene
(ppm)
Fluorene (ppm)
Indeno- [1,2,3-cd]-
pyrene (ppm)
Naph- thalene (ppm)
Phenan- threne (ppm)
Pyrene (ppm)
Tribromo- phenol
(% recovery)
107—ContinuedMedford Malden River 19.5–23 48 0.70 12 <0.61 12 43 45.....do. .....do. 23–27 40 <.11 5.0 <.61 11 37 96.....do. .....do. 27–31 42 .70 5.5 <.61 12 40 55.....do. .....do. 31–35 44 3.5 1.5 <.61 14 44 118.....do. .....do. 35–39 46 1.5 .6 <.61 13 43 111
.....do. .....do. 39–43 30 <.11 <.4 <.61 6.2 29 47
.....do. .....do. 43–47 50 .40 6.0 <.61 17 44 93
.....do. .....do. 47–51 43 <.11 .6 <.61 13 38 100
.....do. .....do. 51–55 29 <.11 1.0 <.61 2.9 29 55
.....do. .....do. 55–59 20 <.11 <.4 <.61 4.8 13 104
.....do. .....do. 59–63 56 6.8 .5 <.61 27 50 111
.....do. .....do. 63–67 39 .70 3.6 <.61 14 37 64
.....do. .....do. 67–71 48 4.5 5.0 <.61 16 42 75
.....do. .....do. 71–75 42 .80 1.0 <.61 16 40 80
.....do. .....do. 75–78 29 1.5 6.6 <.61 9.7 29 105
108 .....do. Upper Mystic River 00–04 5.3 <.11 <.4 <.61 <.17 7.9 66.....do. .....do. 04–08 6.5 <.11 <.4 <.61 <.17 6.6 51.....do. .....do. 08–12 1.5 <.11 <.4 <.61 <.17 4.6 81.....do. .....do. 12–16 4.7 <.11 <.4 <.61 <.17 6.5 75.....do. .....do. 16–20 4.7 <.11 <.4 <.61 <.17 5.8 58
.....do. .....do. 20–24 4.3 <.11 <.4 <.61 <.17 6.6 60
.....do. .....do. 24–28 <.12 <.11 <.4 <.61 <.17 2.7 70
.....do. .....do. 28–32 <.12 <.11 <.4 <.61 <.17 1.2 53
.....do. .....do. 32–36 <.12 <.11 <.4 <.61 <.17 5.5 74
.....do. .....do. 36–40 1.9 <.11 <.4 <.61 <.17 5.3 71
.....do. .....do. 40–44 2.3 <.11 <.4 <.61 <.17 5.5 79
109 Malden .....do. 00–04 6.4 <.11 .9 <.61 <.17 6.3 46.....do. .....do. 04–08 5.9 <.11 <.4 <.61 <.17 5.9 31.....do. .....do. 08–12 6.8 <.11 <.4 <.61 <.17 7.4 35.....do. .....do. 12–16 10 <.11 4.4 <.61 <.17 10 93.....do. .....do. 16–20 12 <.11 1.1 <.61 <.17 11 108
.....do. .....do. 20–24 7.1 <.11 <.4 <.61 <.17 8.1 149
.....do. .....do. 24–28 3.6 <.11 <.4 <.61 <.17 3.9 44
.....do. .....do. 28–32 4.1 <.11 <.4 <.61 <.17 5.2 104
.....do. .....do. 32–36 1.1 <.11 <.4 <.61 <.17 5.0 91
.....do. .....do. 36–40 4.7 <.11 <.4 <.61 <.17 5.0 80
.....do. .....do. 40–44 1.3 <.11 <.4 <.61 <.17 1.3 84
.....do. .....do. 44–48 5.8 <.11 <.4 <.61 <.17 8.3 76
.....do. .....do. 48–52 1.5 <.11 <.4 <.61 <.17 4.8 95
.....do. .....do. 52–56 1.0 <.11 <.4 <.61 <.17 3.8 80
.....do. .....do. 56–60 9.2 <.11 <.4 <.61 <.17 12 99
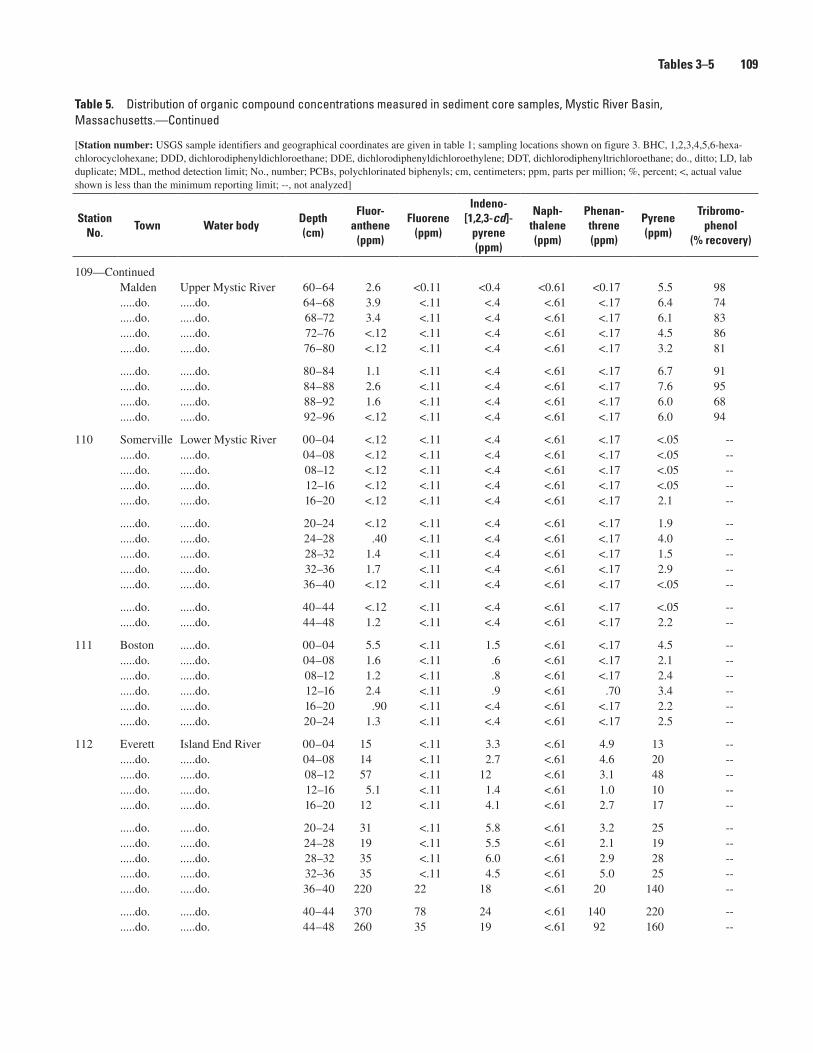
Tables 3–� 10�
Table �. Distribution of organic compound concentrations measured in sediment core samples, Mystic River Basin, Massachusetts.—Continued
[Station number: USGS sample identifiers and geographical coordinates are given in table 1; sampling locations shown on figure 3. BHC, 1,2,3,4,5,6-hexa-chlorocyclohexane; DDD, dichlorodiphenyldichloroethane; DDE, dichlorodiphenyldichloroethylene; DDT, dichlorodiphenyltrichloroethane; do., ditto; LD, lab duplicate; MDL, method detection limit; No., number; PCBs, polychlorinated biphenyls; cm, centimeters; ppm, parts per million; %, percent; <, actual value shown is less than the minimum reporting limit; --, not analyzed]
Station No.
Town Water bodyDepth (cm)
Fluor- anthene
(ppm)
Fluorene (ppm)
Indeno- [1,2,3-cd]-
pyrene (ppm)
Naph- thalene (ppm)
Phenan- threne (ppm)
Pyrene (ppm)
Tribromo- phenol
(% recovery)
109—ContinuedMalden Upper Mystic River 60–64 2.6 <0.11 <0.4 <0.61 <0.17 5.5 98.....do. .....do. 64–68 3.9 <.11 <.4 <.61 <.17 6.4 74.....do. .....do. 68–72 3.4 <.11 <.4 <.61 <.17 6.1 83.....do. .....do. 72–76 <.12 <.11 <.4 <.61 <.17 4.5 86.....do. .....do. 76–80 <.12 <.11 <.4 <.61 <.17 3.2 81
.....do. .....do. 80–84 1.1 <.11 <.4 <.61 <.17 6.7 91
.....do. .....do. 84–88 2.6 <.11 <.4 <.61 <.17 7.6 95
.....do. .....do. 88–92 1.6 <.11 <.4 <.61 <.17 6.0 68
.....do. .....do. 92–96 <.12 <.11 <.4 <.61 <.17 6.0 94
110 Somerville Lower Mystic River 00–04 <.12 <.11 <.4 <.61 <.17 <.05 --.....do. .....do. 04–08 <.12 <.11 <.4 <.61 <.17 <.05 --.....do. .....do. 08–12 <.12 <.11 <.4 <.61 <.17 <.05 --.....do. .....do. 12–16 <.12 <.11 <.4 <.61 <.17 <.05 --.....do. .....do. 16–20 <.12 <.11 <.4 <.61 <.17 2.1 --
.....do. .....do. 20–24 <.12 <.11 <.4 <.61 <.17 1.9 --
.....do. .....do. 24–28 .40 <.11 <.4 <.61 <.17 4.0 --
.....do. .....do. 28–32 1.4 <.11 <.4 <.61 <.17 1.5 --
.....do. .....do. 32–36 1.7 <.11 <.4 <.61 <.17 2.9 --
.....do. .....do. 36–40 <.12 <.11 <.4 <.61 <.17 <.05 --
.....do. .....do. 40–44 <.12 <.11 <.4 <.61 <.17 <.05 --
.....do. .....do. 44–48 1.2 <.11 <.4 <.61 <.17 2.2 --
111 Boston .....do. 00–04 5.5 <.11 1.5 <.61 <.17 4.5 --.....do. .....do. 04–08 1.6 <.11 .6 <.61 <.17 2.1 --.....do. .....do. 08–12 1.2 <.11 .8 <.61 <.17 2.4 --.....do. .....do. 12–16 2.4 <.11 .9 <.61 .70 3.4 --.....do. .....do. 16–20 .90 <.11 <.4 <.61 <.17 2.2 --.....do. .....do. 20–24 1.3 <.11 <.4 <.61 <.17 2.5 --
112 Everett Island End River 00–04 15 <.11 3.3 <.61 4.9 13 --.....do. .....do. 04–08 14 <.11 2.7 <.61 4.6 20 --.....do. .....do. 08–12 57 <.11 12 <.61 3.1 48 --.....do. .....do. 12–16 5.1 <.11 1.4 <.61 1.0 10 --.....do. .....do. 16–20 12 <.11 4.1 <.61 2.7 17 --
.....do. .....do. 20–24 31 <.11 5.8 <.61 3.2 25 --
.....do. .....do. 24–28 19 <.11 5.5 <.61 2.1 19 --
.....do. .....do. 28–32 35 <.11 6.0 <.61 2.9 28 --
.....do. .....do. 32–36 35 <.11 4.5 <.61 5.0 25 --
.....do. .....do. 36–40 220 22 18 <.61 20 140 --
.....do. .....do. 40–44 370 78 24 <.61 140 220 --
.....do. .....do. 44–48 260 35 19 <.61 92 160 --
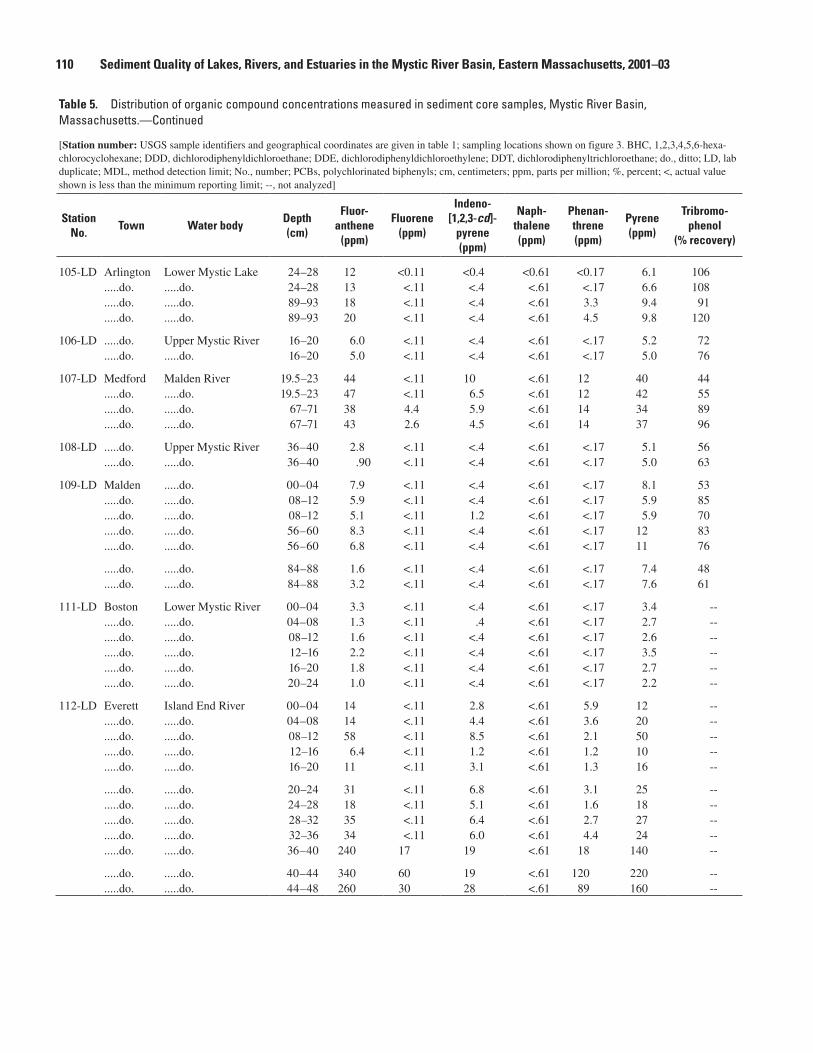
110 Sediment Quality of Lakes, Rivers, and Estuaries in the Mystic River Basin, Eastern Massachusetts, 2001–03
Table �. Distribution of organic compound concentrations measured in sediment core samples, Mystic River Basin, Massachusetts.—Continued
[Station number: USGS sample identifiers and geographical coordinates are given in table 1; sampling locations shown on figure 3. BHC, 1,2,3,4,5,6-hexa-chlorocyclohexane; DDD, dichlorodiphenyldichloroethane; DDE, dichlorodiphenyldichloroethylene; DDT, dichlorodiphenyltrichloroethane; do., ditto; LD, lab duplicate; MDL, method detection limit; No., number; PCBs, polychlorinated biphenyls; cm, centimeters; ppm, parts per million; %, percent; <, actual value shown is less than the minimum reporting limit; --, not analyzed]
Station No.
Town Water bodyDepth (cm)
Fluor- anthene
(ppm)
Fluorene (ppm)
Indeno- [1,2,3-cd]-
pyrene (ppm)
Naph- thalene (ppm)
Phenan- threne (ppm)
Pyrene (ppm)
Tribromo- phenol
(% recovery)
105-LD Arlington Lower Mystic Lake 24–28 12 <0.11 <0.4 <0.61 <0.17 6.1 106.....do. .....do. 24–28 13 <.11 <.4 <.61 <.17 6.6 108.....do. .....do. 89–93 18 <.11 <.4 <.61 3.3 9.4 91.....do. .....do. 89–93 20 <.11 <.4 <.61 4.5 9.8 120
106-LD .....do. Upper Mystic River 16–20 6.0 <.11 <.4 <.61 <.17 5.2 72.....do. .....do. 16–20 5.0 <.11 <.4 <.61 <.17 5.0 76
107-LD Medford Malden River 19.5–23 44 <.11 10 <.61 12 40 44.....do. .....do. 19.5–23 47 <.11 6.5 <.61 12 42 55.....do. .....do. 67–71 38 4.4 5.9 <.61 14 34 89.....do. .....do. 67–71 43 2.6 4.5 <.61 14 37 96
108-LD .....do. Upper Mystic River 36–40 2.8 <.11 <.4 <.61 <.17 5.1 56.....do. .....do. 36–40 .90 <.11 <.4 <.61 <.17 5.0 63
109-LD Malden .....do. 00–04 7.9 <.11 <.4 <.61 <.17 8.1 53.....do. .....do. 08–12 5.9 <.11 <.4 <.61 <.17 5.9 85.....do. .....do. 08–12 5.1 <.11 1.2 <.61 <.17 5.9 70.....do. .....do. 56–60 8.3 <.11 <.4 <.61 <.17 12 83.....do. .....do. 56–60 6.8 <.11 <.4 <.61 <.17 11 76
.....do. .....do. 84–88 1.6 <.11 <.4 <.61 <.17 7.4 48
.....do. .....do. 84–88 3.2 <.11 <.4 <.61 <.17 7.6 61
111-LD Boston Lower Mystic River 00–04 3.3 <.11 <.4 <.61 <.17 3.4 --.....do. .....do. 04–08 1.3 <.11 .4 <.61 <.17 2.7 --.....do. .....do. 08–12 1.6 <.11 <.4 <.61 <.17 2.6 --.....do. .....do. 12–16 2.2 <.11 <.4 <.61 <.17 3.5 --.....do. .....do. 16–20 1.8 <.11 <.4 <.61 <.17 2.7 --.....do. .....do. 20–24 1.0 <.11 <.4 <.61 <.17 2.2 --
112-LD Everett Island End River 00–04 14 <.11 2.8 <.61 5.9 12 --.....do. .....do. 04–08 14 <.11 4.4 <.61 3.6 20 --.....do. .....do. 08–12 58 <.11 8.5 <.61 2.1 50 --.....do. .....do. 12–16 6.4 <.11 1.2 <.61 1.2 10 --.....do. .....do. 16–20 11 <.11 3.1 <.61 1.3 16 --
.....do. .....do. 20–24 31 <.11 6.8 <.61 3.1 25 --
.....do. .....do. 24–28 18 <.11 5.1 <.61 1.6 18 --
.....do. .....do. 28–32 35 <.11 6.4 <.61 2.7 27 --
.....do. .....do. 32–36 34 <.11 6.0 <.61 4.4 24 --
.....do. .....do. 36–40 240 17 19 <.61 18 140 --
.....do. .....do. 40–44 340 60 19 <.61 120 220 --
.....do. .....do. 44–48 260 30 28 <.61 89 160 --