sedimentation and flotation mechanical filtration … · sedimentation and flotation mechanical...
TRANSCRIPT
T UNIVERSITY OF TECHNOLOGY
tment of civil engineering
> *J on of sanitary engineering
SEDIMENTATION AND FLOTATION
MECHANICAL FILTRATION
Prof. Ir, L. Huisman
a/z 9
DELFT UNIVERSITY OF TECHNOLOGY
Department of civil engineering 7 <r 2_
>5SE Division of sanitary engineering
SEDIMENTATION AND FLOTATION
MECHANICAL FILTRATION
Prof. Ir. L. Huisman
1 1
I u i tgave i herdruK 1973 nov. 1978
/ 3,50
L.S.
Bij de samens te l l ing van elk d ik taa t word t e r u i t e r a a r d n a a r ges t ree fd om fouten te voorkomen en de inhoud zo o v e r -zichtel i jk mogel i jk aan te bieden. Nie t tegens taande dat kunnen toch onduideli jkheden voorkomen en kunnen fouten zijn ingeslopen. Indien U dan ook bij de bes tuder ing van dit d iktaat : - onjuis theden ontdekt - op onduideli jkheden s tui t - of gedeel ten ontmoet, die naa r Uw mening nade re ui twerking
behoeven, ve rzoeken de s a m e n s t e l l e r s U d r i n g e n d h e n d a a r v a n mededel ing te doen.
Bij de volgende drukkenkunnen dan op- en a a n m e r k i n g e n w o r d e n v e r w e r k t ten ger ieve van toekomst ige g e b r u i k e r s . Zonodig kan ook nog in de lopende c u r s u s voor verduidel i jking worden gezorgd.
0
c ont ent s, c ont inued
5. Special service equipment
5.1. Flow splitters
5.2. Imhoff tanks
5.3. Channel type grit chambers
5.1+. Thickeners
6. Flotation
7. Selected literature

00
Sedimentation and flotation
Contents .
1. Introduction
1.1. Definition and terms
1.2. Types of settling tanks
1.3. Application of sedimentation and flotation in water-
and waste-water treatment plants
2. Principles of discrete settling
2.1. Settling of a single particle
2.2. Hindered settling
2.3. Frequency distribution of settling velocities
2.k. Quiescent settling
2.5. Settling tests in a cone-shaped vessel
3. Discrete settling in continuous horizontal flow basins
3.1. Introduction
3.2. Settling in an ideal horizontal flow basin
3.3. Reduction in basin efficiency by turbulence
3.1+. Bottom scour
3.5. Non-uniform velocity distribution and short-circuiting
3.6. Design of the settling zone
3-7. Tray settling tanks, tilted plate separators and tube-settlers
3.8. Inlet and outlet constructions
3.9- Sludge removal and skimming devices
h. Flocculent settling
U.1. Principles of flocculent settling
k.2. Flocculent settling in quiescent basins
U.3. Zone settling in quiescent basins
k.k. Flocculent settling in continuous horizontal flow tanks
U.5. Flocculent settling in continuous vertical flow tanks
1-1
1 . Introduction
1.1. Definitions and terms
Sedimentation and flotation are purification processes, whereby
the water to be treated is kept in a tank for a considerable period
of time. With a large cross-sectional area of this tank, the veloci
ties of flow will be small, creating a state of virtual quiescence.
Under influence of gravity (fig. 1.1), particles with a mass density
higher than that of the surrounding fluid will now move downward
(sedimentation), while particles with a lower mass density will move
upward (flotation). In this way, the suspended particles present in
the raw water are retained, either in the scum layer at the water
surface or in the sludge layer at the tank bottom, allowing the
water to leave the tank in a clarified condition. As will be shown
in the next chapter, the rate of vertical rise or fall of the sus
pended particles will be higher and the time needed for adequate cla
rification will be smaller as the particles are larger and their mass
density differs more from that of the liquid in which they are sus
pended. Artificially the size of the particles may be increased by
flocculation (fig. 1.2), creating velocity gradients which bring the
flotation
sediment
w&m
tion
1 -T-layer
scum
clarified WATER TO BE TREATED
liquid > < ~
; » : «
FLOCCULATED WATER
T sludge layer ' • ' • " : - " ' j ' ' " • • • • • ' i ' ; 1
g. 1-1 Sedimentation and f l o t a t i o n . Fig. 1-2 Flocculation.
1-2
particles into contact with one another. In case the particles carry
a like electric charge, they will repell each other and aggregation
by flocculation is only possible after the opposing electric forces
have been neutralized by the addition of coagulants such as alumn and
iron (chemical coagulation). The mass density of the suspended flow
may be altered by adding heavier or lighter substances to the water
to be treated. Sedimentation can be advanced by mixing clay, bentonite
powdered stone, etc, to the incoming raw water, while flotation can
be promoted by bubbling in air, chlorine gas, etc, at the tank bottom.
The last mentioned process is so simple and effective that it is
also used for separation of suspended particles that are slightly
heavier than the surrounding liquid (e.g. algae). Dissolved impurities
finally can also be removed by sedimentation when chemicals are
added to throw them out of solution (chemical precipitation).
In the field of water and waste water engineering, many settling
tanks operate by natural forces alone, by gravitation and by natural
aggregation of suspended particles. This process is called plain
sedimentation and may further be subdivided in discrete settling
and in flocculent settling. Discrete settling occurs when the
amount of natural aggregation is negligeable as for instance is
the case with sand grains. During the whole settling period the
suspended particles maintain their identity and consequently move
down at a constant rate (fig. 1.3 left). With flocculent settling
on the other hand, particles overtaking one another will coalesce
and will henceforth go down at the higher rate of the aggregate
(fig. 1.3 right). Flocculent settling is predominant with organic
impurities as abound in municipal sewage and many industrial wastes
At 2At
• ^
«®
Fig. 1-3 Settling of discrete and of flocculent particles.
1-3
1.2. Types of settling tanks
Settling tanks are constructed in great variety, feeing rectangular,
square or circular in plan, with the water at rest or in continuous
flow, either in horizontal or in vertical direction.
Quiescent settling in fill and draw tanks (fig. 1.U) is nowadays
largely confined to the preparation of toiler feed water and to the
purification of industrial wastes that are discharged in hatches.
Due to the sequential operation of filling, standing and drawing-
off, they are less suited for public water supplies or municipal
waste water treatment plants where a continuous flow must be maintained.
For the removal of discrete particles, horizontal flow basins
as shown in fig. 1.5 give the best results. With the same capacity
raw water
settled water
filling settling draw-off
Fig. 1-4 Quiescent set t l ing in draw-and-f i l l tanks.
influent I J
sludge 1 - \ /•*
scum trough J—•= effluent
sludge-* influent—•
effluent
Fig. 1-5 Horizontal flow basin, rectangular and c i rcular .
1-4
influent H-
sludt
and tank volume, long, narrow and shallow rectangular basins have
the highest efficiency. Depending on local circumstances, however,
square or circular basins may still be preferred because they
make a better use of the grounds available, offer a saving in
the amount of building material required, allow the use of pre-
stressed concrete, in stead of ordinary reinforced concrete, etc.
With the same volume and efficiency, a larger capacity can be obtain
ed by increasing the area upon which the settled-out material may
accumulate. This can be accomplished in different ways of which fig.
1.6 shows the use of horizontal trays and of steeply inclined plates
or tubes. In this way, a tremendous capacity for clarification can
be packed in a small volume, but this is bought with a highly in
creased cost of construction per unit tank volume and again local
circumstances must decide whether this proposition is attractive or
not.
£> - 1 — —
3£ 1«MF*=^
Fig. 1-6 Tray settling tank and tilted plate separator.
For the removal of flocculent particles, the same horizontal
flow basins as described above may be applied, but in many cases
better results can be obtained with vertical flow basins of larger
depth and more elaborate inlet constructions to divide the incoming
water as equally as possible over the entire floor area. A circular
plan has no disadvantages in hydro-dynamic respect and when a rect
angular plan is preferred, it will deviate only little from a
square. In fig. 1.7 to the right, a cone-shaped tank of great,
depth is shown in which the velocity of upward flow gradually
decreases. Near the top of the cone, this displacement velocity
will equal the settling velocity for a major part of the suspended floes and here a stationary sludge blanket will arise. In this
blanket, the concentration of floes is very high, promoting coales
cence by which even finely divided suspended matter can be "filtered
out". On the other hand, the large depth increases the cost of con
struction and again the most attractive solution can only be found
by a cost-benefit analysis, taking all relevant factors into account,
1-5
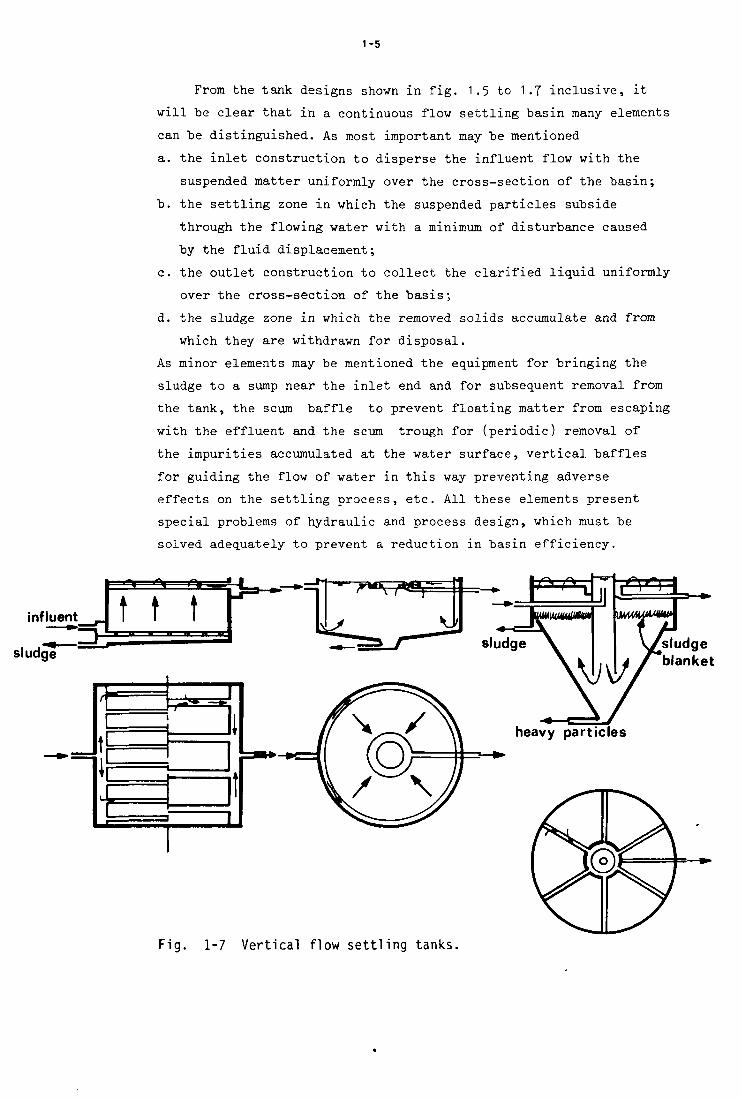
From the tank designs shown in fig. 1.5 to 1.7 inclusive, it
will be clear that in a continuous flow settling basin many elements
can "be distinguished. As most important may "be mentioned
a. the inlet construction to disperse the influent flow with the
suspended matter uniformly over the cross-section of the basin;
b. the settling zone in which the suspended particles subside
through the flowing water with a minimum of disturbance caused
by the fluid displacement;
c. the outlet construction to collect the clarified liquid uniformly
over the cross-section of the basis;
d. the sludge zone in which the removed solids accumulate and from
which they are withdrawn for disposal.
As minor elements may be mentioned the equipment for bringing the
sludge to a sump near the inlet end and for subsequent removal from
the tank, the scum baffle to prevent floating matter from escaping
with the effluent and the scum trough for (periodic) removal of
the impurities accumulated at the water surface, vertical baffles
for guiding the flow of water in this way preventing adverse
effects on the settling process, etc. All these elements present
special problems of hydraulic and process design, which must be
solved adequately to prevent a reduction in basin efficiency.
influent
sludge
Fig. 1-7 Vertical flow settling tanks.
1-6
1.3. Application of sedimentation and flotation in water and waste water
treatment
With public and industrial water supplies, filtration is the
main treatment to which the water is subjected. Rapid and slow
sand filters, however, can only operate to satisfaction when the
suspended matter content of the influent is not too high, not more
than (2—5)10-3 kg/m3 for rapid and slow filters when they constitute
the final treatment and not more than (10-20)10~3 kg/m3, in excep
tional cases (50)10-3 kg/m3 for the preliminary treatment in a two
stage filtration process. Many rivers carry a higher suspended load
and sedimentation is now an attractive proposition to obtain the
desired amount of clarification. In many cases plain sedimentation
will satisfy all requirements, but when the colloidal content is
high, better results at a lower price may be obtained by chemical
coagulation (fig. 1.8 upper half). During drought periods, the quantity
or quality of the water in some rivers is too low and storage reservoirs
are now necessary to assure an uninterrupted supply. In such reser
voirs the water is often kept for months on end and loses nearly
its full silt content. The effluent, however, may still be very
turbid when nutrients abound and a heavy growth of algae develops.
With a mass density nearly equal to that of the surrounding water,
these algae are difficult to remove by sedimentation alone.
As already mentioned before, sedimentation may also be used
to remove dissolved impurities, after chemicals have been added
to bring them out of solution. Anaerobic ground waters may have a
high content of dissolved ferrous iron. By aeration this iron will
be oxydised and converted into insoluble ferric hydroxyde, which
may subsequently be removed for a large part by settling, by plain
sedimentation (fig. 1.8) or better by chemical coagulation. A major
application concerns the removal of hardness by lime-soda softening,
converting the dissolved calcium and magnesium salts into unsoluble
calcium carbonate and magnesium hydroxyde. With rather hard waters,
the amount of sludge retained in the settling basin is enormous,
(100-500)10-3 kg/m3, creating a serious disposal problem. Re-use
after calcination is now a better solution, but this is only possi
ble when a clean sludge is obtained, with turbid river waters asking
for a two-stage chemical coagulation process where silt and other
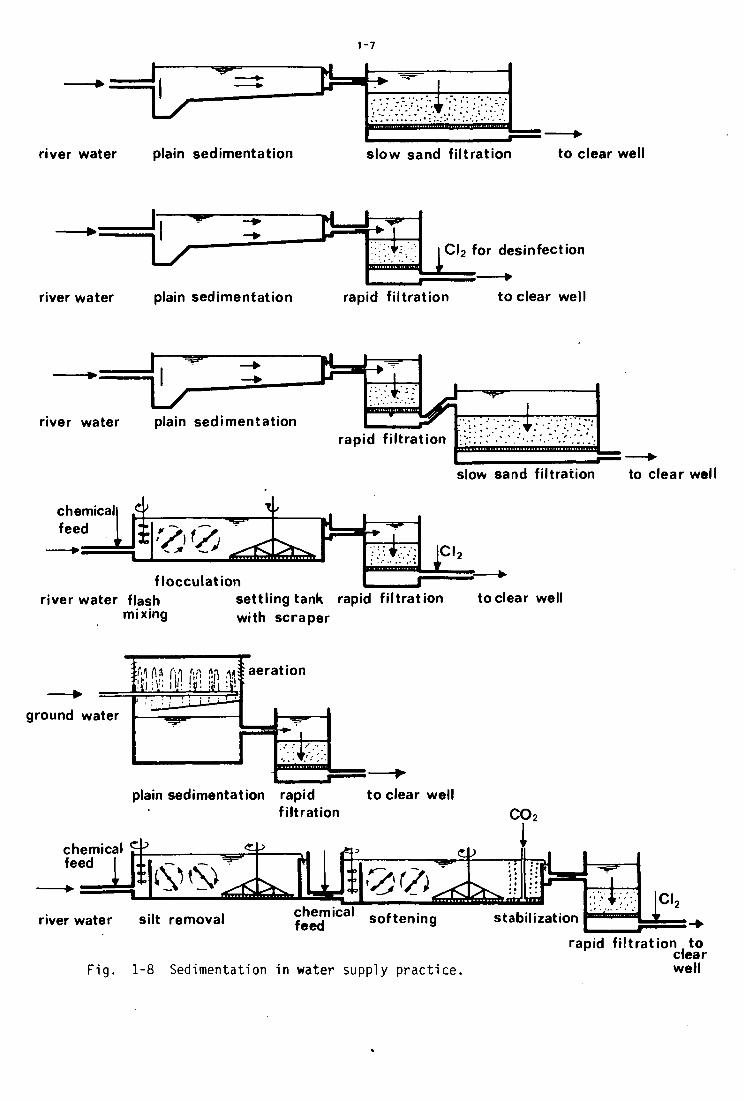
1-7
river water plain sedimentation slow sand filtration to clear wel
Cl 2 for desinfection
river water plain sedimentation rapid filtration to clear wel
river water plain sedimentation rapid filtration
W.I--W*
slow sand filtration to clear wel
chemical| £f feed
— • = — L -
f&4 ^A>^ * 1 ci,
s flocculation river water flash settling tank rapid filtration to clear wel
mixing with scraper
; aeration
ground water
plain sedimentation rapid to clear well filtration CO2
I chemical >i • *-- aj 1 fif
J B 8 B S B 8 B B
river water silt removal f . frf1 softening stabilization feed
Fig. 1-8 Sedimentation in water supply practice.
* ' " j i i i i—" •
CI,
rapid filtration to dear well
.1-8
impurities are retained in the first sedimentation basin (fig. 1.8).
In the treatment of domestic and industrial waste-waters, sedi
mentation is of paramount importance, removing the major part of the
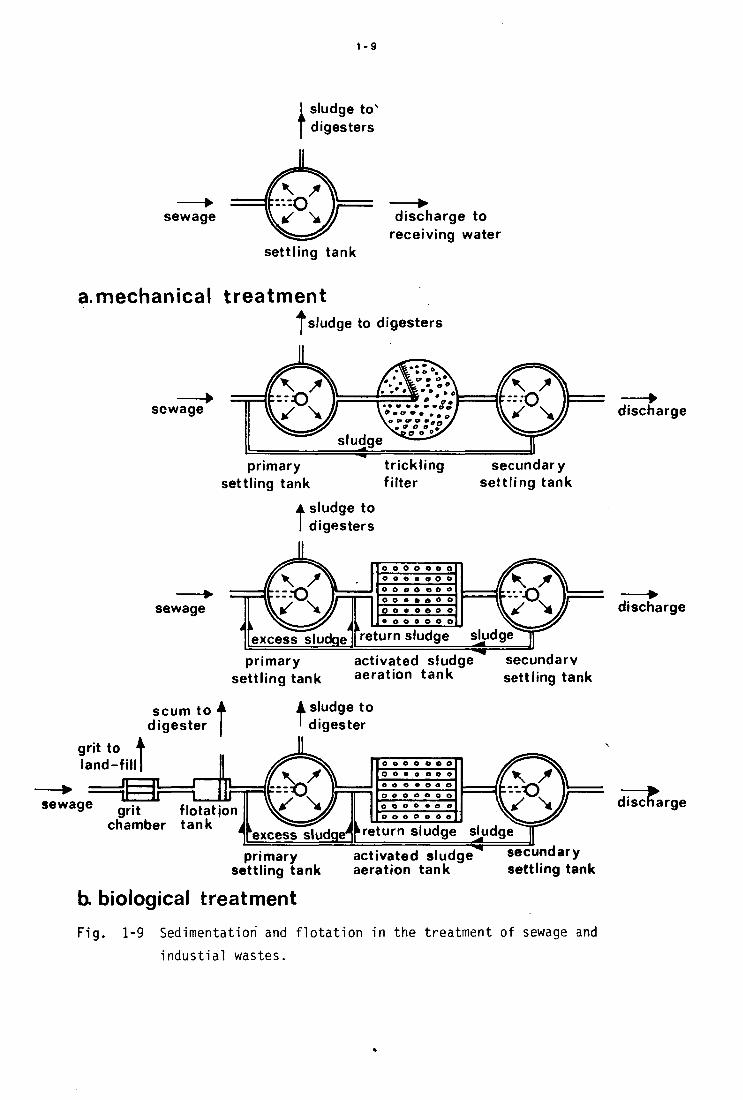
impurities. With mechanical treatment (fig. 1.9a) it is even the sole
process to which the water is subjected, recovering 60 to 80% of its
suspended matter content. Due to the presence of colloidal and
molecular dissolved organic impurities, the reduction in "biochemical
oxygen demand is much lower, 30 to 50$. Mechanical treatment is thus
only acceptable when the effluent is discharged into receiving waters
with a high capacity for self-purification. Some improvement may be
obtained by preceding the settling process with chemical coagulation
and flocculation, but the classical waste water treatment incorpo
rates aerobic micro-biological processes in trickling filters or
in activated sludge aeration tanks. To prevent a rapid clogging of
these installations, primary settling tanks are again necessary to
remove the major part of the suspended load, after which the re
maining particulate and dissolved impurities can be retained by
absorbtion on the bacterial slimes present in the aerobic contact
processes mentioned above. By the action of micro-organisms, this
material is further degraded, partly to provide the energy they
need for their living processes (metabolism) and partly to built
up new cell material. In the last case, however, suspended matter
is formed that may be removed in the subsequent secondary settling
tanks (fig. 1 .9b).
The primary and secondary settling tanks mentioned above are
often supplemented with other sedimentation and flotation processes.
In particular with a combined sewerage system, the sewage may con
tain larger amounts of sand and other heavy and inert material. This
grit as it is called, has a high settling rate and will completely
be retained in the primary settling tanks. In many cases, however,
a preceding removal by sedimentation in grit chambers is more attrac
tive, among , other things because this material is non-putrescible,
enormously facilitating the disposal problem. Next to suspended par
ticle heavier than water, every sewage will contain substances with
a lower mass density. With domestic sewage this concerns oil and
grease, but with municipal waste waters larger amouts of other
substances may also be present. In the settling tanks mentioned
1-9
sewage
I sludge to" f digesters
settling tank
discharge to receiving water
a.mechanical treatment I sludge to digesters
sewage
primary settling tank
trickling filter
secundary settling tank
t sludge to digesters
sewage
primary settling tank
activated sludge aeration tank
sludge
secundarv settling tank
discharge
discharge
t sludge to digester
grit chamber t a n k W e s s s l u d g e i r e t u r n s l u d g e sludge
disc arge
primary settling tank
activated sludge aeration tank
secundary settling tank
b. biological treatment
Fig. 1-9 Sedimentation and flotation in the treatment of sewage and
industial wastes.

1-10
above, this material is retained by flotation, accumulates at the
water surface and is removed by skimming devices. With some
industrial effluents, the amount of floating matter is high
and again here a separate removal in flotation tanks'ahead of the
the settling tanks proper may be advantageous (fig. 1-9 bottom.)
2-1
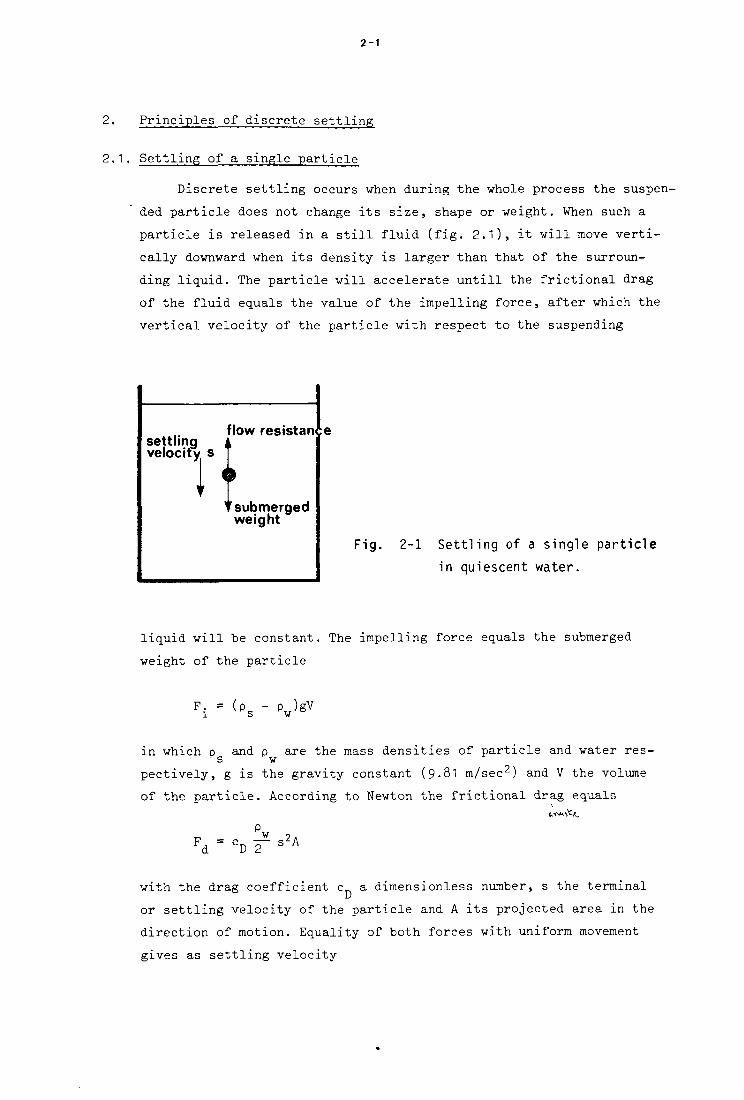
2. Principles of discrete settling
2.1. Settling of a single particle
Discrete settling occurs when during the whole process the suspen
ded particle does not change its size, shape or weight. When such a
particle is released in a still fluid (fig. 2.1), it will move verti
cally downward when its density is larger than that of the surroun
ding liquid. The particle will accelerate untill the frictional drag
of the fluid equals the value of the impelling force, after which the
vertical velocity of the particle with respect to the suspending
settling velocity s
I flow resistan
'submerged weight
F ig . 2-1 S e t t l i n g of a s ing le p a r t i c l e
in quiescent water.
l iqu id w i l l be constant . The impelling force equals the submerged
weight of the p a r t i c l e
F i = ( ps Pv)gV
in which p and p are the mass densities of particle and water res-Ks w
pectively, g is the gravity constant (9-81 m/sec2) and V the volume
of the particle. According to Newton the frictional drag equals 6.TA\^
Fd = °D T sA
with the drag coefficient c a dimensionless number, s the terminal
or settling velocity of the particle and A its projected area in the
direction of motion. Equality of both forces with uniform movement
gives as settling velocity
2-2
w
V A
For a sphere of diameter d
A = £ d2 , V = •£- d3 , substituted
• /
P - P ' , s w , s = / — gd
D w
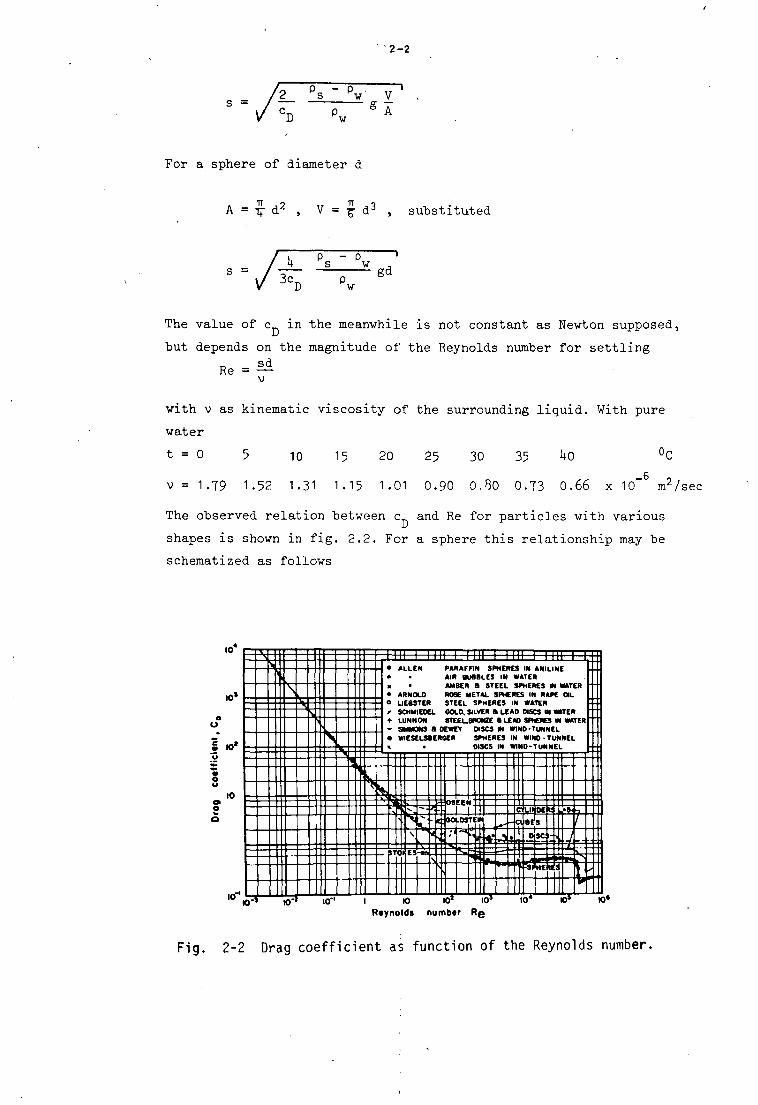
The value of c in the meanwhile is not constant as Newton supposed,
but depends on the magnitude of the Reynolds number for settling
D - S d
Re = —
with v as kinematic viscosity of the surrounding liquid. With pure
water
t = 0 5 10 15 20 25 30 35 ^0 °C
v = 1.79 1.52 1.31 1.15 1.01 0.90 0.80 0.73 0.66 x 10~ m2/sec
The observed relation between c and Re for particles with various
shapes is shown in fig. 2.2. For a sphere this relationship may be
schematized as follows
ID
K>»
O
1 K>« , £
•
to 9 O
o
•°H <f>
^
H - 1
•
\ ^
K>"
L _ _ t \ V
\—'
<
lO"' 1
llll 1 llll 1 II -m- -f-» • AIR BUBBLES IN WATER « • AMBER B STEEL SPHERES M MATER ' • ARNOLD ROSE METAL SPHERES IN RAPE OIL o UEBSTER STEEL SPHERES IN WATER ' SCHMIEDEL GOLD, SILVER B LEAD DISCS M WATER • LUNNON STEEL.BRONZE a LEAD SPHERES IN WATER ' • SWMONS a DEWEY DISCS M WIND-TUNNEL • WIESELSBEROER SPHERES IN WIND-TUNNEL
_ »r<
1. Is''*
\ 1 ES
to
'
S - -
N
,.. t)j
K : M
>; 'A
1
10*
EEI
.OS
~*
1
TE
», H
I .a
I 0 1
^5 •
I : L I I
c i s t DE
S
• ^
'i!sPME
1 1 0 *
e
'is
I t !
1**1
•4
10*
7
7 V
2 I ^ .
»• Reynolds number Rg
Fig. 2-2 Drag coefficient as function of the Reynolds number.
2-3
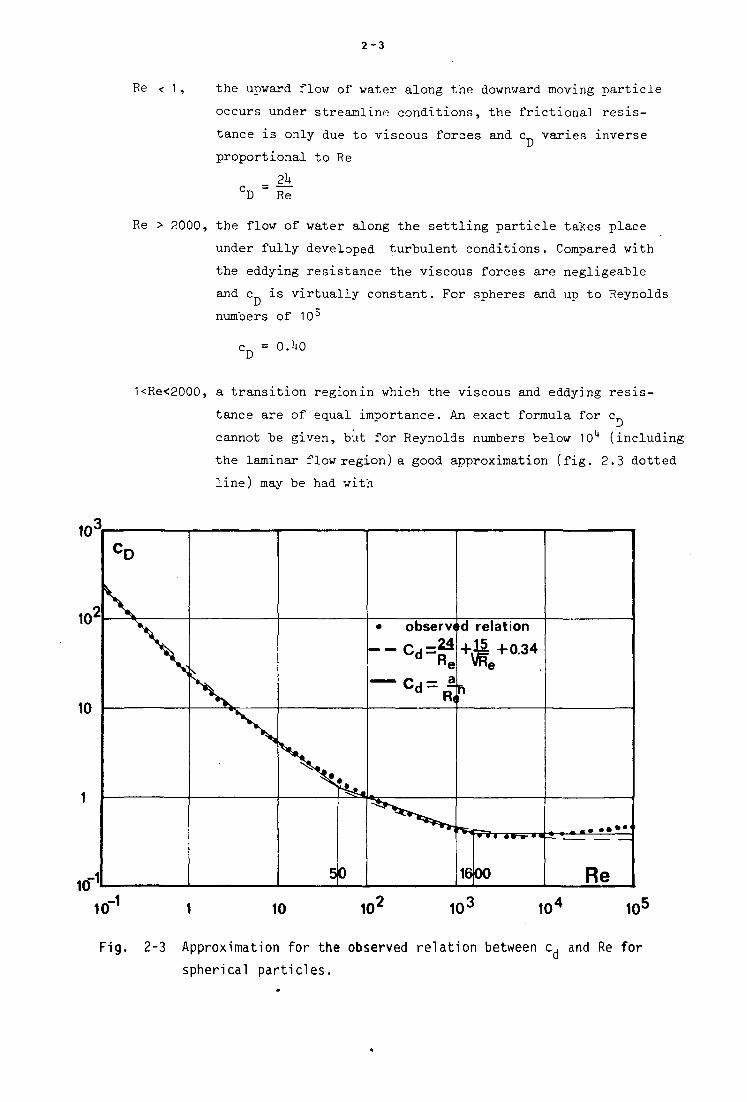
Re < 1, the upward flow of water along the downward moving particle
occurs under streamline conditions, the frictional resis
tance is only due to viscous forces and c varies inverse
proportional to Re
- 2U CD " Re
Re > 2000, the flow of water along the settling particle takes place
under fully developed turbulent conditions. Compared with
the eddying resistance the viscous forces are negligeable
and c is virtually constant. For spheres and up to Reynolds
numbers of 105
c = 0.1+0
1<Re<2000, a transition region in which the viscous and eddying resis-
D tance are of equal importance. An exact formula for c
cannot be given, but for Reynolds numbers below lO4 (including
the laminar flow region)a good approximation (fig. 2.3 dotted
line) may be had with
Fig. 2-3 Approximation for the observed relation between c. and Re for
spherical particles.
2-4
1<Re< 50 cn =
cD = i + + 0-3U
A better approximation (fig. 2.3 full lines) and more work
able formulae may be obtained by subdividing the transition
region,for instance
2U
D Re3A
50<Re<l600 c_, = h'l D Re1/3
1600 < Re cD = O.UO
Substitution of these values in the formula for the settling velocity
gives
, p - p Re< 1 s = —r a dz
18 v p w
1<Re<50 s = i ^ ( ^ W * V
50< Re<l6O0 s = ^ ^ (Pg ' P v) dO-8 w
P - P °-5
1600 < Re s = 1.83 g°-5( S p
V) d0-5
w
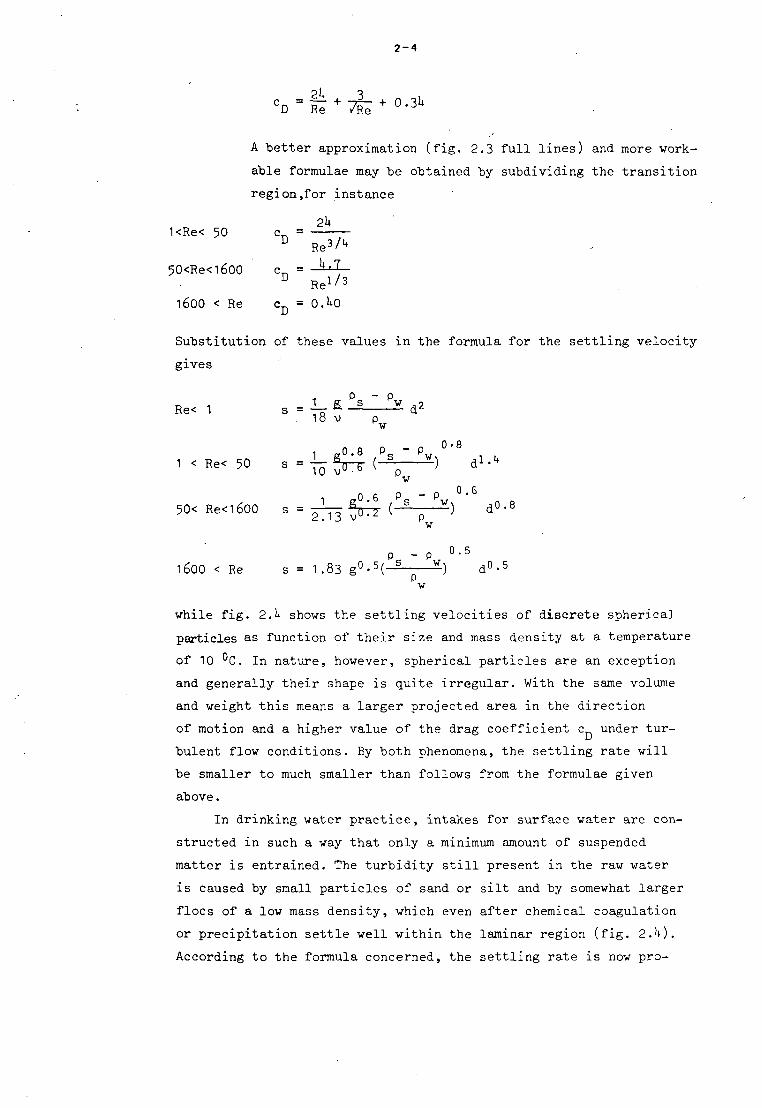
while fig. 2.U shows the settling velocities of discrete spherical
particles as function of their size and mass density at a temperature
of 10 °C. In nature, however, spherical particles are an exception
and generally their shape is quite irregular. With the same volume
and weight this means a larger projected area in the direction
of motion and a higher value of the drag coefficient c under tur
bulent flow conditions. By both phenomena, the settling rate will
be smaller to much smaller than follows from the formulae given
above.
In drinking water practice, intakes for surface water are con
structed in such a way that only a minimum amount of suspended
matter is entrained. The turbidity still present in the raw water
is caused by small particles of sand or silt and by somewhat larger
floes of a low mass density, which even after chemical coagulation
or precipitation settle well within the laminar region (fig. 2.k).
According to the formula concerned, the settling rate is now pro-
2 -5
Fig. 2-4 Settling velocities of discrete spherical particles in
quiescent water at 10°C.
2-6
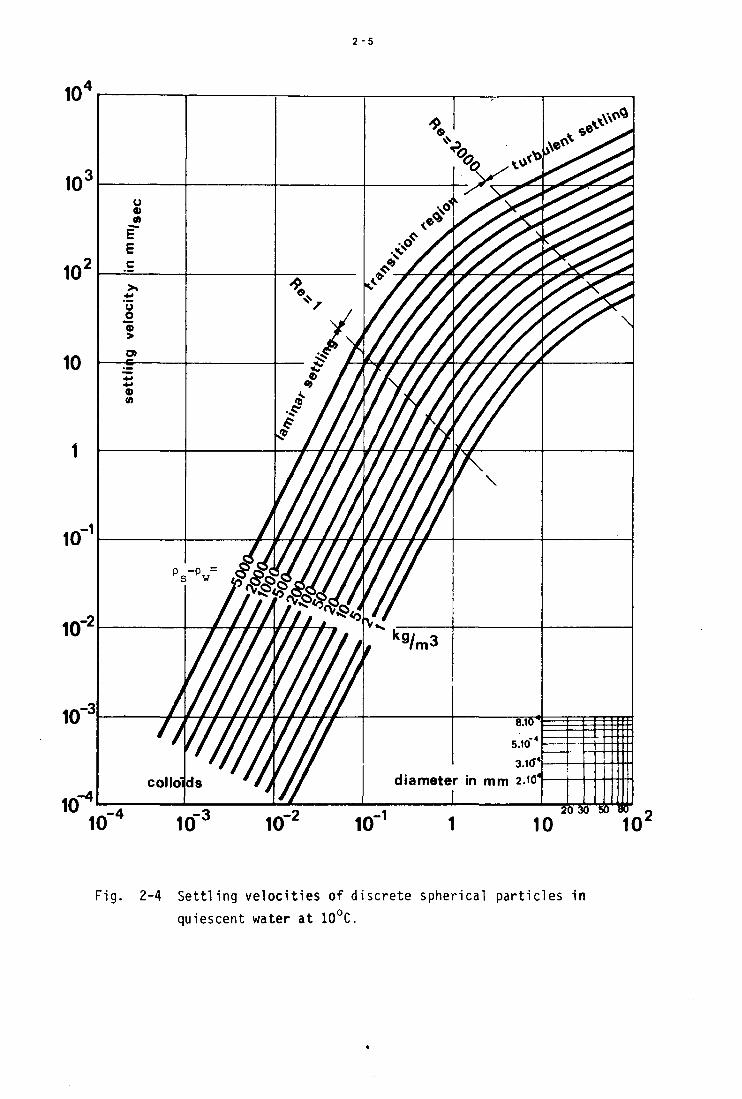
portional to the square of the diameter. When by chemical coagulation
the particle size is increased by a factor 10, the rate of subsi
dence will grow by a factor 100, greatly enhancing clarification
efficiency. According to the same formula, the settling rate depends •
on the viscosity, that is on the temperature of the water (fig. 2.5).
When from summer to winter this temperature drops from 25 to 0 °C,
the kinematic viscosity will increase by a factor 2, reducing the
settling rate in winter to only 50% of that in summer with a corres
ponding decrease in clarification efficiency.--
In waste water treatment plants, all substances must be handled
which the public and industry think fit for disposal into the sewerage
system. This not only means a much higher suspended load, but also
the presence of larger or heavier particles. In grit chambers these
properties combine, resulting in turbulent settling. The downward
velocity of the particle is now independent of the viscosity, that
is of the temperature of the water and increases with the root of the
diameter only. When by chemical coagulation the particle size is
again increased by a factor 10, the rate of subsidence will grow by
a factor 3, giving only a limited increase in sedimentation efficiency.
In primary tanks, settling occurs in the laminar as well as in the
transition region, the influence of viscosity and particle size being
larger as the Reynolds number is smaller. In secondary tanks finally
the floes may have a fairly large size, but their mass density differs
only little from that of the surrounding fluid and settling is there
fore almost entirely laminar.
At the beginning of the settling process, the particle is at rest.
In a still fluid it will then start to move down, gradually increasing
its velocity untill the terminal values calculated above for steady
movement are attained. During this process of acceleration, the settling
rates are consequently smaller and this might reduce basin efficiency
when the unsteady period is of any greater duration. During this period
the movement of the particle is governed by
force = mass' x acceleration
ds' F. - F, = p V ~~ l d s dt
with s ' as r a t e of subsidence. For laminar s e t t l i n g of spheres
F i = (ps - < \ > £ d 3
2-7
Fig. 2-5 Settling velocities of discrete spherical sand grains
(p -p = 1650 kg/m ) in quiescent water at different temperature, s w

2-8
F , .= 3irvp s 'd
V = - ^ d 3 , subs t i tu ted
da' ps - p v p w v ,
dt " p g " l 8 r ^ S
s Ks With the terminal velocity for laminar settling equal to
1 p - p
18 v i p w
t h i s may "be simplif ied t o
p d S ' ,= 18 - ~ ^ z - dt = cxdt
s - s1 Ps d
Integration with the boundary condition
t = 0 , s' = 0 finally gives
S'= S(1 _ e"at)
According to this formula, the particle will never obtain the full
terminal velocity s. A value of 0.999 s, however, is reached at a
time t determined by
e"at =0.001 = e"6-9
= iii _ JL2. §. li a 18 p v
w
With flocculated mud particles of 1 mm diameter and a mass density
of 1010 kg/m3 in water at 10 °C
_ j 9_ 1010 10~6 t " 18 1000 (1.31 )10"6 " °'3 S e C
With normal settling times varying from minutes to hours, this delay
is completely negligeable.
2-9
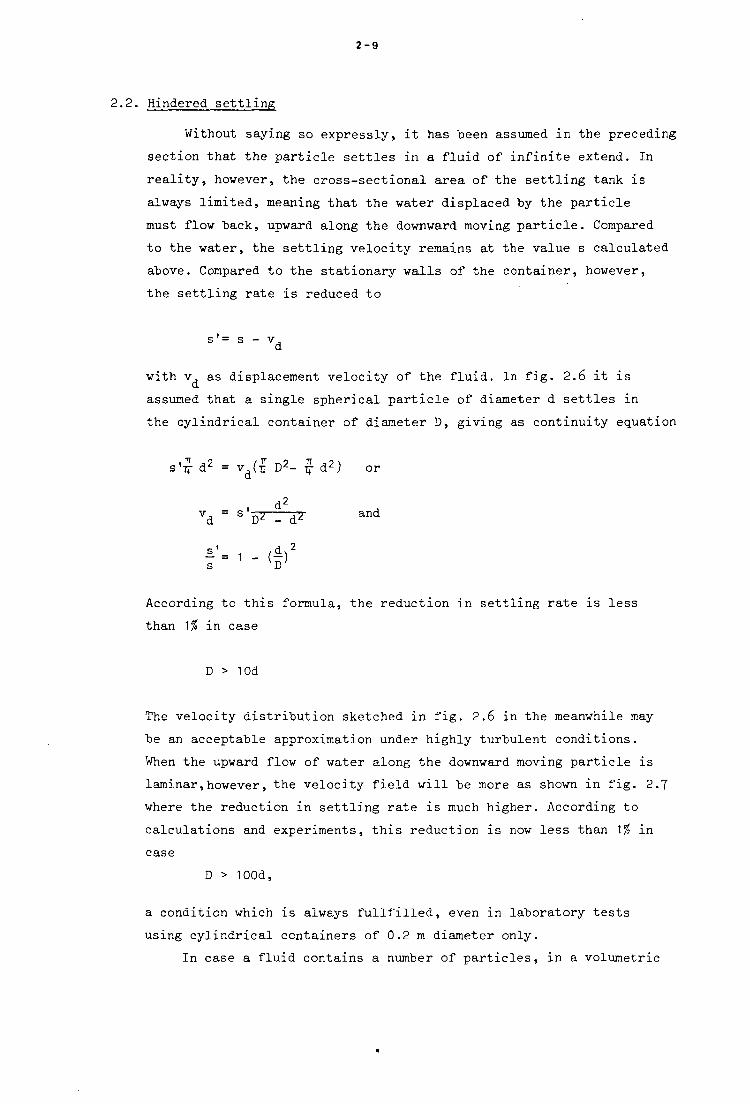
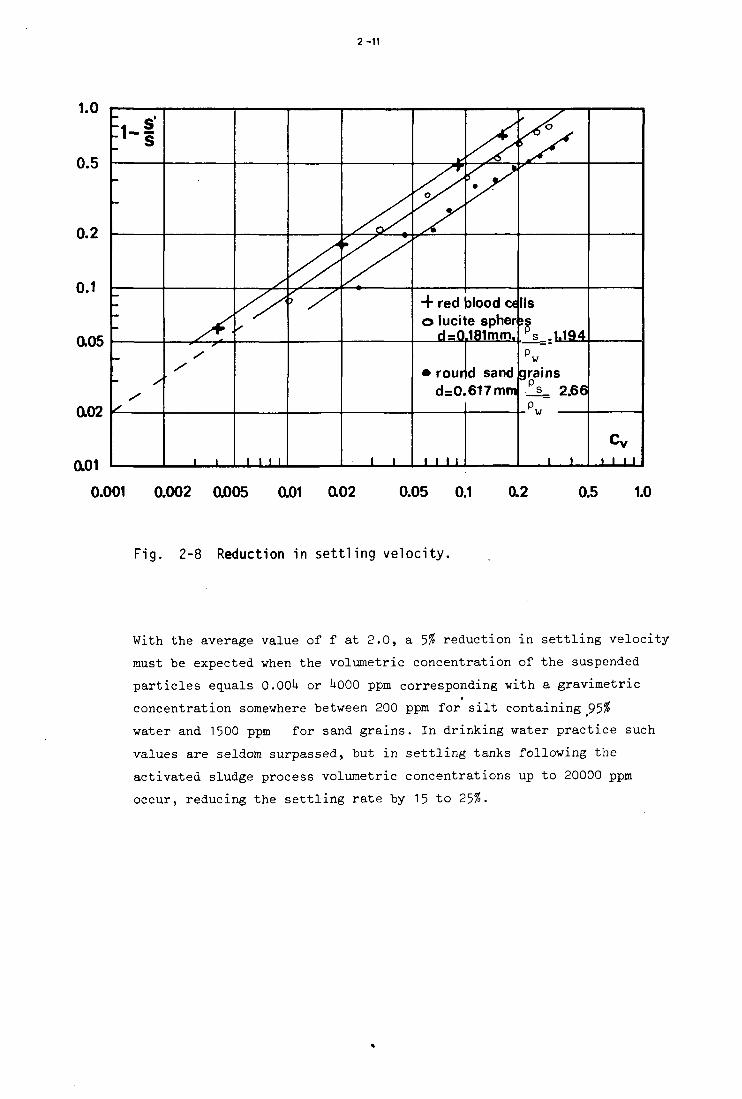
2.2. Hindered settling
Without saying so expressly, it has been assumed in the preceding
section that the particle settles in a fluid of infinite extend. In
reality, however, the cross-sectional area of the settling tank is
always limited, meaning that the water displaced by the particle
must flow back, upward along the downward moving particle. Compared
to the water, the settling velocity remains at the value s calculated
above. Compared to the stationary walls of the container, however,
the settling rate is reduced to
s'= s - v, d
with v as displacement velocity of the fluid. In fig. 2.6 it is
assumed that a single spherical particle of diameter d settles in
the cylindrical container of diameter D, giving as continuity equation
s'£d2 = vd(£ D 2 - £ d 2 ) or
, d2 vd = S Dz - d* a n d
i - 1 - (§) According to this formula, the reduction in settling rate is less
than ~\% in case
D > 10d
The velocity distribution sketched in fig. 2.6 in the meanwhile may
be an acceptable approximation under highly turbulent conditions.
When the upward flow of water along the downward moving particle is
laminar,however, the velocity field will be more as shown in fig. 2.7
where the reduction in settling rate is much higher. According to
calculations and experiments, this reduction is now less than \% in
case
D > 100d,
a condition which is always fullfilled, even in laboratory tests
using cylindrical containers of 0.2 m diameter only.
In case a fluid contains a number of particles, in a volumetric

2-10
2-6 Displacement velocity field
under highly turbulent
conditions.
Fig. 2-7 Displacement velocity field
under laminar flow
conditions.
concentration c , a fHrther reduction in effective settling rate will
take place. Going out from the velocity field of fig. 2.6, the conti
nuity equation gives
s' c = v (1 - c ) v d v
With s' = s - v, = s - s' a 1 - c
the reduction in settling rate becomes
s v
With the velocity field of fig. 2-7 and an entrainment of water
the subsiding particle, this reduction will be much larger. According
to the experimental results shown in fig. 2-8.
- = 1 - fc 2/3 with s v
turbulent settling spheres
turbulent settling sand grains
laminar settling spheres
laminar settling red blood cells
laminar settling lime and alumn floe
f = 1 .2
1.U
2.0
2.5
2.8
2-11
1.0
0.5
0.2
0.1
0.05
0.02
4- red blood o lucite spher
d=0r181mm.
y'
i , . U M
s
round sand d=0.617mm
grains ^s_ 2.66I
^_
0.01 J L ' ' ' • J L ' ' ' •
w
J L I I I I
0.001 0.002 0005 0.01 a02 0.05 0.1 a2 0.5 1.0
Fig. 2-8 Reduction in settling velocity.
With the average value of f at 2.0, a 5% reduction in settling velocity-
must be expected when the volumetric concentration of the suspended
particles equals 0.00U or UoOO ppm corresponding with a gravimetric
concentration somewhere between 200 ppm for silt containing 95%
water and 1500 ppm for sand grains. In drinking water practice such
values are seldom surpassed, but in settling tanks following the
activated sludge process volumetric concentrations up to 20000 ppm
occur, reducing the settling rate by 15 to 25$.
2-12
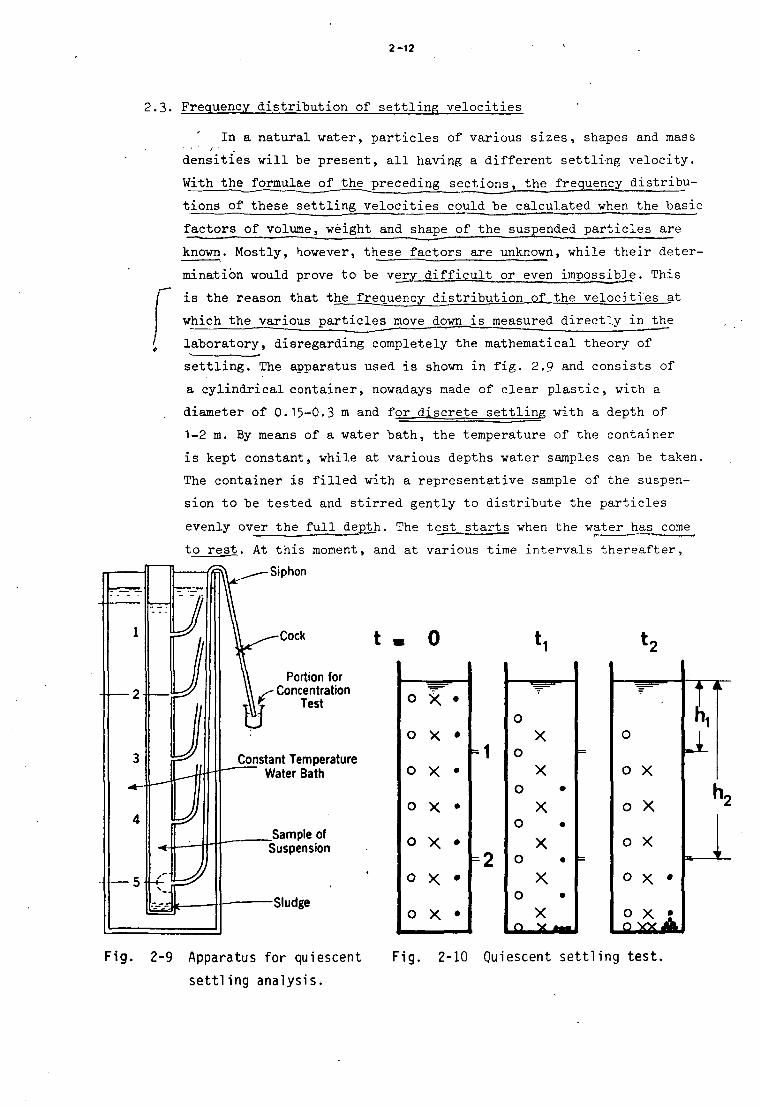
2.3. Frequency distribution of settling velocities
In a natural water, particles of various sizes, shapes and mass
densities will be present, all having a different settling velocity.
With the formulae of the preceding sections, the frequency distribu
tions of these sett1ing velocities could be calculated when the basic
factors of volume, weight and shape of the suspended particles are
known. Mostly, however, these factors are unknown, while their deter
mination would prove to be very difficult or even impossible. This
J is the reason that the frequency distribution of the velocities at
which the various particles move down is measured directly in the
laboratory, disregarding completely the mathematical theory of
settling. The apparatus used is shown in fig. 2.9 and consists of
a cylindrical container, nowadays made of clear plastic, with a
diameter of 0.15-0.3 m and for discrete settling with a depth of
1-2 m. By means of a water bath, the temperature of the container
is kept constant, while at various depths water samples can be taken.
The container is filled with a representative sample of the suspen
sion to be tested and stirred gently to distribute the particles
evenly over the full depth. The test starts when the water has come
to rest. At this moment, and at various time intervals thereafter,
-Siphon
t . 0
Portion for Concentration
Test
Constant Temperature Water Bath
o X. •
o X •
O X •
o x •
o X •
ox*
ox*
= 2
o X
o X
o • X
o • X
o • X
o • X
Fig. 2-9 Apparatus for quiescent
settling analysis.
Fig. 2-10 Quiescent settling test.
2-13
water samples are taken at different depths and analysed for suspen
ded solids, turbidity, color, iron, alumina, hardness, chemical and
bio-chemical oxygen demand or any other index that_ is reduced by
settling. The principle of this experiment is shown in fig. 2.10,
where 3 types of particles with 3 different settling velocities have
been assumed. With each settling velocity at a constant value during
the whole test, the downward movement of the particles is uniform,
meaning that a sample for instance taken at time t and depth h2
does not contain any particles, but the concentration of x and 0
particles is exactly the same as in the original suspension. As
regards these concentrations, the results of the settling test shown
in fig. 2.10 may be summarized as follows
time depth particles present
tl
tl
t2
t2
from which the individual concentrations may be found by subtraction. As
regards the settling velocities of the various particles, the results
are less exact
2
1
2
1
0
0
0
0
X
X
X
•
X
0
particles,
particles,
particles,
ti kz < s < l!2. t2 ti
t2 t]
kL s < t t2
In a natural water, however, a large variety of particles will occur and
the frequency distribution of their settling velocities is consequently
a smooth curve. When again a sample is taken at depth h and time t, no
particles with a settling velocity in excess of h/t will be found, while
all particles with a settling velocity less then h/t are present in
their original concentration. The observation thus reads
amount at depth h, time t-s h/t.
Provided that an adequate number of samples is taken and analyzed, an
easy and accurate determination of the settling velocities can be obtained
in this way. For the test results of table 2.1, the frequency distribution
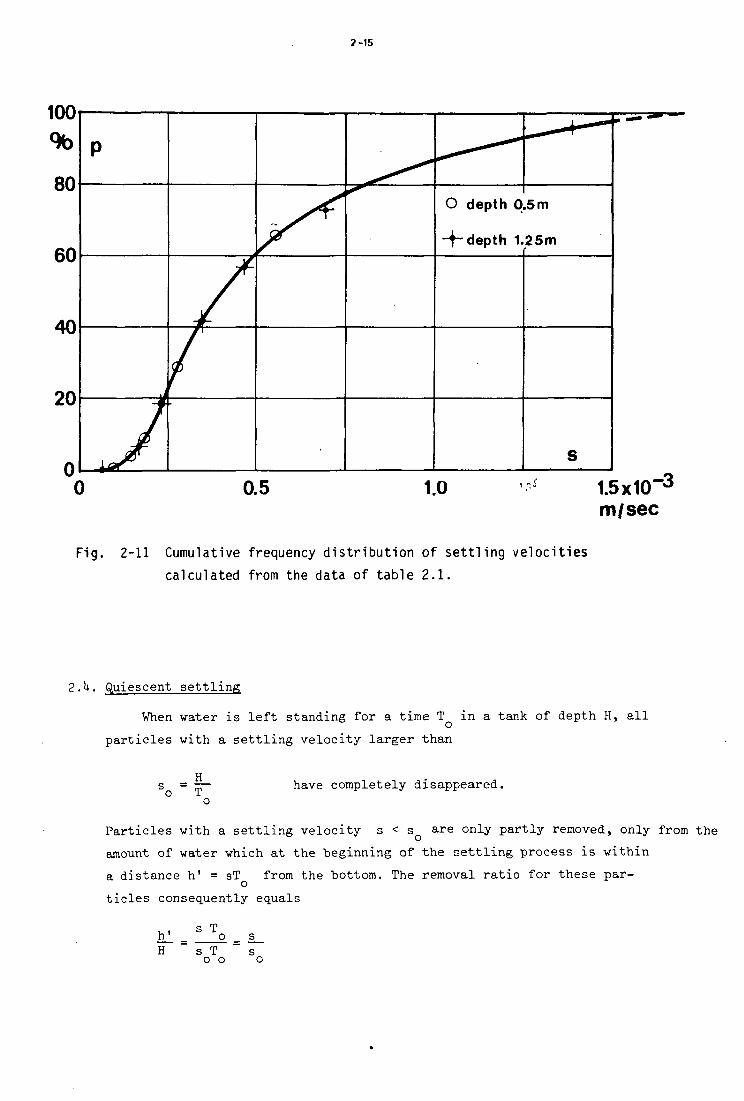
of the settling velocities is shown in fig. 2.11.

2-14
to
CO
i~ o to
t»-o c o to
c CD Q. to 3 10
o
to
c
en c
OJ CO
OJ
-Q <0
o OJ t o
o o CM r-»
o o «d-L f )
o o to ro
o o r-CM
o o oo r—1
o o CT1
o
•>->
3
/ m
/se
c
i
o
C?\ VO o . . o
0 0 ON o . o
O N 0 0 i —
o
LTN CO
*— . o
CO t— CM
• o
VO U~\ 1/N
o
e <s\ o II
-p
x:
s ft ft
o
T —
0O
CO
LTN CM
C--LT\
,1
V O CO
O
ts«.
o
T —
-a-
O N
!
ON CVI
VO VO
o o
o
10
0
C/C
CJ
00 1 o
^
-a-t— T —
* o
CM 0 0 CVI
• o
t— -=t 0 0
o
0 0 VO _=r
• o
LTN ON
V 0
. o
ON CO
1.3
B I T \ CVI
It
x:
-p
x:
6 ft ft
vo
vo i —
t -0 0
C\ -zr
OO VO
0 0 co
vo CO
u
•feS.
t—
ON T —
CM -=r
t— LTN
OO t—
VO ON
O O
O
100
C/C
2-15
100 %
80
60
40
20
p
±aT—
z^r
O depth 0.5m
-f~ depth 1.25m
S
0.5 1.0 1.5x10 m/sec
-3
Fig. 2-11 Cumulative frequency distribution of settling velocities
calculated from the data of table 2.1.
2.U. Quiescent settling
When water is
particles with a settling velocity larger than
When water is left standing for a time T in a tank of depth H, all
have completely disappeared.
Particles with a settling velocity s < s are only partly removed, only from the
amount of water which at the beginning of the settling process is within
a distance h' = sT from the bottom. The removal ratio for these par-o
tides consequently equals
s T hi H s T
o o

2-16
With the notations of fig. 2.12 to the left, the over-all removal thus
becomes
r - (1 - P O )
r = (1 - pQ) +
A o J
dp
Po sdp
or
100r°/<
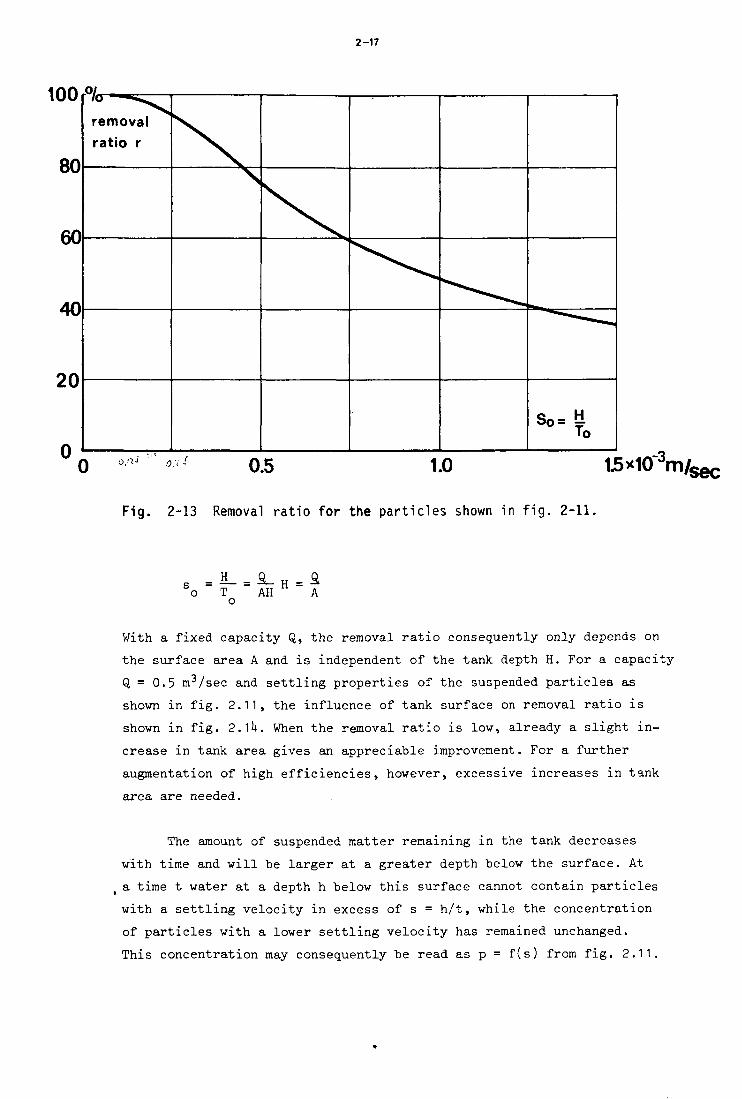
in which the integral represents the shaded area. As shown in fig. 2.12
to the right, this removal ratio can easily be found graphically by
drawing a horizontal line in such a way that the two shaded areas are
equal. For the particles of fig. 2.11, the removal ratio r as function
100 r%
Fig. 2-12 Cumulative frequency distribution of settling velocities.
of s = H/T is shown in fig. 2.13. o o v
When an amount of Q m3/sec must be clarified by settling in the fill-and-draw tanks of fig. 1.U, a detention time T asks for a volume
° ' o
V = QT = AH o
with A as surface area and H as depth of the basin. According to the
calculations given above, the removal ratio is a function of the factor
2-17
15*10'3m/sec
Fig. 2-13 Removal ratio for the particles shown in fig. 2-11.
So T AH A o
With a fixed capacity Q, the removal ratio consequently only depends on
the surface area A and is independent of the tank depth H. For a capacity
Q = 0.5 m3/sec and settling properties of the suspended particles as
shown in fig. 2.11, the influence of tank surface on removal ratio is
shown in fig. 2.1H. When the removal ratio is low, already a slight in
crease in tank area gives an appreciable improvement. For a further
augmentation of high efficiencies, however, excessive increases in tank
area are needed.
The amount of suspended matter remaining in the tank decreases
with time and will be larger at a greater depth below the surface. At
a time t water at a depth h below this surface cannot contain particles
with a settling velocity in excess of s = h/t, while the concentration
of particles with a lower settling velocity has remained unchanged.
This concentration may consequently be read as p = f(s) from fig. 2.11.

2-18
100
80
60
40
20
removal ratio r
surface area A
0 Fig.
1000 2000 3000 m2
2-14 Removal ratio as function of the surface area for the treatment
of the suspension shown in fig. 2-11 in an amount of 0.5 nr/sec
Om
2 S
su
rfa
ce
J0
I b
elo
w w
ate
r d
ept
3 = 5<K 2^\ l&O " ^ o/
time
Fig.
10 15x103sec 2-15 Clarification of the suspension from fig. 2-11 as function
of time and depth.
2-19
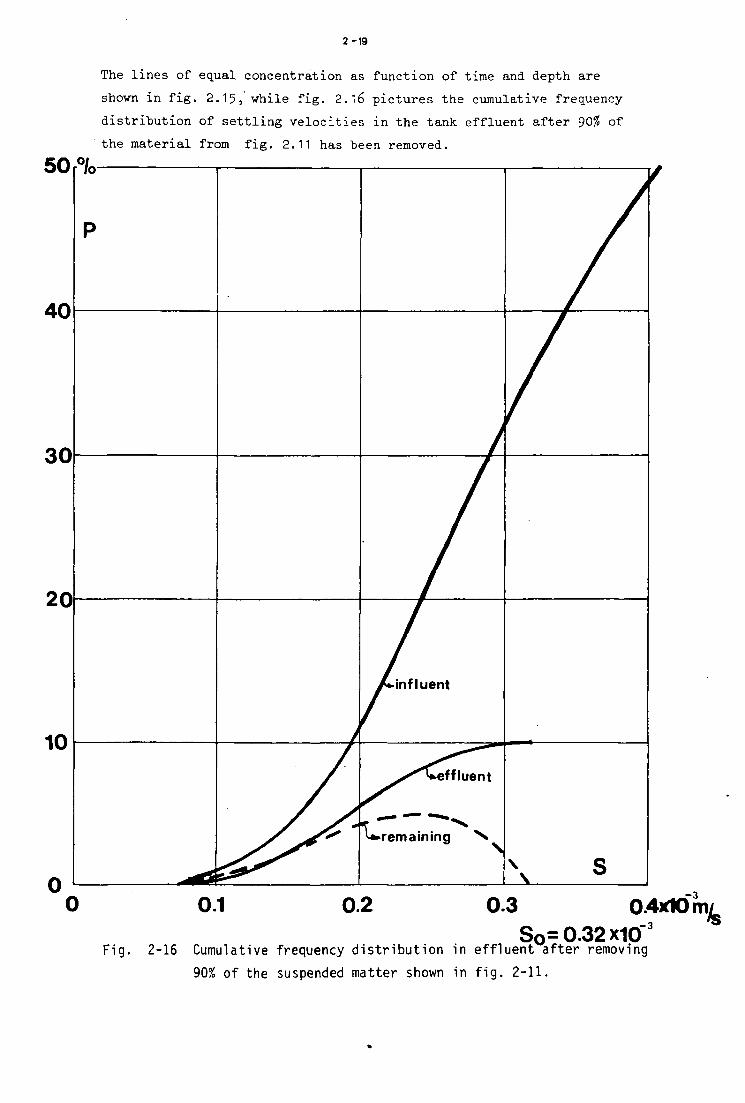
The lines of equal concentration as function of time and depth are
shovn in fig. 2.15, while fig. 2.16 pictures the cumulative frequency-
distribution of settling velocities in the tank effluent after 90$ of
the material from fig. 2.11 has been removed.
50 fl • j o
p
\ F
1 )
/ ^s +
A-influent
^X^^effluent
Wemaining N,
\ s
0.1 0.2 0.3 0.4*10
Fig. S0= 0.32x10
2-16 Cumulative frequency distribution in effluent after removing
90% of the suspended matter shown in fig. 2-11.
2-20
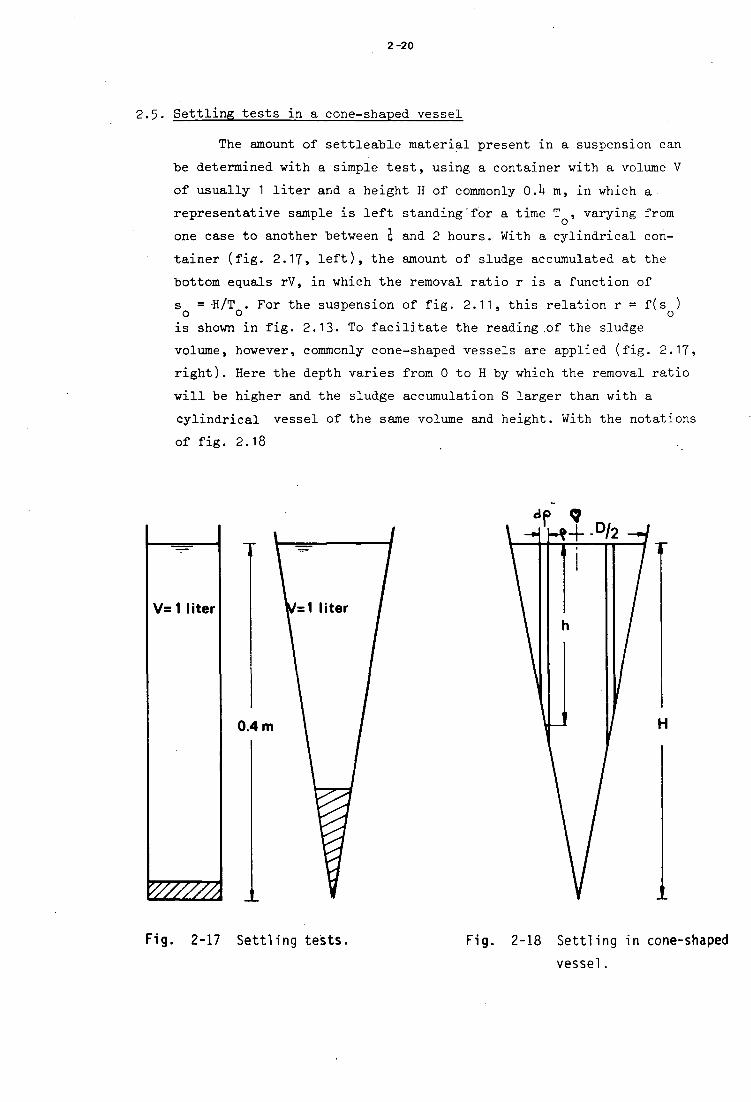
2.5 • Settling tests in a cone-shaped vessel
The amount of settleable material present in a suspension can
he determined with a simple test, using a container with a volume V
of usually 1 liter and a height H of commonly 0.U m, in which a
representative sample is left standing for a time T , varying from
one case to another between I and 2 hours. With a cylindrical con
tainer (fig. 2.17, left), the amount of sludge accumulated at the
bottom equals rV, in which the removal ratio r is a function of
s = H/T . For the suspension of fig. 2.11, this relation r = f(s ) o o ° o
is shown in fig. 2.13. To facilitate the reading .of the sludge
volume, however, commonly cone-shaped vessels are applied (fig. 2.17,
right). Here the depth varies from 0 to H by which the removal ratio
will be higher and the sludge accumulation S larger than with a
cylindrical vessel of the same volume and height. With the notations
of fig. 2.18
V=1 liter
W7777A 1
0.4 m
dp Q
K+-D/2
Fig. 2-17 Settling tests. Fig. 2-18 Sett l ing in cone-shaped
vessel.
2-21
dS = 2-np/dp/hr or with
P - 2 (1 - f ) , dp = - — dh
dS = - | 1^ (H - h)hrdh
The relation between r and s = h/T can always be represented by o o
_ , h /h <2 ,h \n r = 1 - 0l ^ - a2(~) _ . . . — a n (— ;
o o o
With s < (0.5)10-3 m/sec, a good approximation for the relation
shown in fig. 2.13 can be obtained by
r = 1 - 106(^-) Substituted o
dS = - | ^ ( H - h)h(l - 106 |^r)dh
o
and integrated between the limits h = 0 and h = H
s a I2i H (1 __1 1Q6 HL) S U 3 l 10 ° T^'
o The volume of the vessel equals
TTD2 H — , sut
j 2
V = —r— -T- , subs t i tu ted
V 10 u T o
while a cylindrical vessel would have given
f-r-,.,0.^ o
With H = 0.U m and T =15 minutes = 900 seconds, this gives o
cylindrical cone shaped
| = 0.80 0.9*4
or with a volumetric concentration of 3000 ppm and V equal to one liter
S = 2.U0 2.82 cm3
a difference of nearly 20#.

3-1
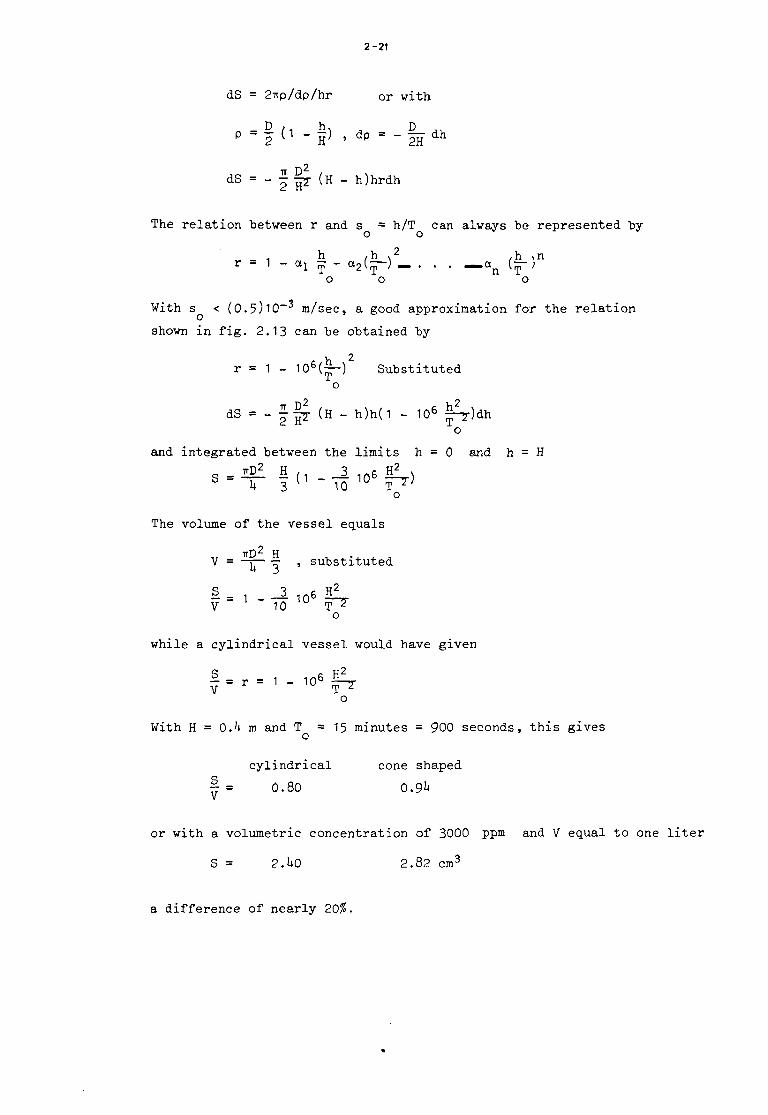
3. Discrete settling in continuous horizontal flow basins
3.1 . Introduction
As mentioned before, quiescent settling in fill-and-draw tanks is
no longer applied in the field of public water and vaste water engineering
and here continuous-flow basins are used almost exclusively. In such
basins, the suspended particles settle within the flowing liquid, which
might have any direction of movement. The most important sub-division,
however, is between horizontal and vertical flow tanks. As will be shown
in the subsequent sections, the flow of water in horizontal basins has
only a limited influence on the settling process, giving a clarification
efficiency approaching that of quiescent settling. With vertical flow
basins on the other hand, the movement of water is of paramount impor
tance. In the vertical flow tank of fig. 3.1 all particles with settling
velocity less than
H
100 %
80
60
40
20
0 (
<
P 1 ^ i ^
)
r
0
i
5 .
k
. 1 .0
s
1.! 1.5x10 s° m/sec
Fig. 3-1 Vertical flow settling tank. Fig. 3-2 Settling efficiency of
vertical flow tanks.
r3
3-2
_ R JL So " A "" T
o
are entrained by the flowing water and cannot be kept back, limiting
the removal ratio r to 1 - p in fig. 3.2. With horizontal flow tanks
of the same dimensions, particles with a settling velocity s < s
are still partly retained, increasing the removal ratio to the value
of r in fig. 2.12 right. Horizontal flow tanks moreover are easier
and cheaper to construct and for the plain sedimentation of discrete
particles, such tanks are therefore used without exception.
To develop a clarification theory for the removal of discrete
particles in continuous horizontal flow basins, it is first assumed
that settling in such tanks takes places under ideal circumstances
(section 3-2). Conditions in real tanks differ more or less from
these assumed for the ideal basin. The resulting reduction in basin
efficiency will be studied separately in section 3.3 to 3.5 inclusively.
3.2. Settling in an ideal horizontal flow basin
In an ideal horizontal flow basin, settling is supposed to take
place in exactly the same way as in a quiescent settling tank, without
any influence of the horizontal water movement. To approach this ideal
as nearly as possible, a rectangular horizontal flow tank must show
the following characteristics
a. the direction of flow is horizontal and the velocity of flow is the
same in all parts of the basin. This velocity moreover is so small
that the horizontal water movement occurs under streamline flow
conditions. As a result, the retention time for each particle of
water is the same, equal to the volume of the tank divided by the
rate of discharge;
b. at the basin inlet the concentration of suspended particles of each
size is the same in all points of the vertical plane perpendicular
to the direction of flow;
c. a particle is removed and stays removed when it strikes the bottom
of the tank.
These requirements mean that in a continuous horizontal flow basin four
zones must be present (fig. 3.3)
a. an inlet zone to disperse influent flow and suspended matter uniform
ly over the full cross-sectional area of the basin;
3-3
Q —
inlet ^zone settling zone L
outlet^ zone
S» > v, 0\ i
v*-:^»:»^mmMJ*w;*;v?m?m J"^5
^
^ ^Q
Fig. 3-3 Rectangular horizontal flow settling tank.
b. a settling zone in which the suspended particles settle within the
flowing water;
c. an outlet zone to collect the clarified liquid evenly over the
cross-sectional area of the basin;
d. a sludge zone at the bottom to store the removed solids without
the danger of re-suspension.
The actual work of a sedimentation basin, however, is restricted to the
settling zone where the discrete particles trace straight paths, follow
ing the vector sum of the settling velocity s of the particle and the
displacement velocity v of the liquid. The horizontal velocity v has o o
been assumed constant over the whole settling zone, but the settling
rate s depends on particle size, shape and mass density and will vary
between wide limits. According to fig. 3.k all particles with a settling
velocity equal to or larger than the critical value s are completely
removed, while for particles with a smaller settling velocity s the
removal ratio amounts to
h _, s_ H * s
The total clarification effect equals (fig. 2.12)
P„
r = (1 - P Q ) +
» • o dp
3-4
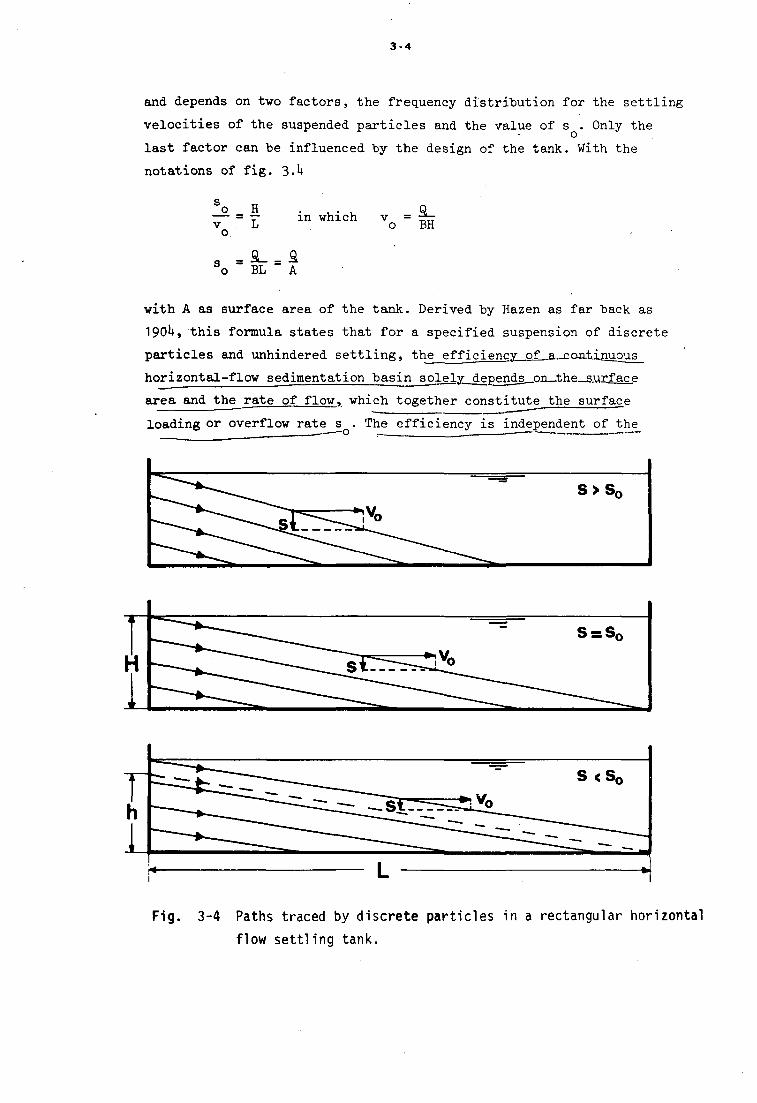
and depends on two factors, the frequency distribution for the settling
velocities of the suspended particles and the value of s . Only the o
last factor can be influenced by the design of the tank. With the
notations of fig. 3.1*
H L
in which v = • —
o BH
s =&_ = £ o BL A
with A as surface area of the tank. Derived by Hazen as far back as
190U, this formula states that for a specified suspension of discrete
particles and unhindered settling, the effij jj y__ojl_a.-con±jjmous
norizontal-flow sedimentation basin soleJLy_dependg_on—the_s.urfag_e
area and the rate of flow, which together constitute the surface
loading or overflow rate s . The efficiency is independent of the
r h
^r t r^T—--- s < s0
« L •
Fig. 3-4 Paths traced by discrete particles in a rectangular horizontal
flow settling tank.
3-5
depth H of the 'basin and of the detention time T , results identical
to those obtained in the preceding section with quiescent settling
Strictly speaking, the conclusions obtained above have been
derived for horizontal flow settling tanks of rectangular plan. They
hold true, however, for any shape of the tank provided that the depth
H is constant. In the detention time TL all particles reach the bottom
of the tank and are removed from the flowing liquid when their settling
velocity is equal to or larger than
H S = T
A H With T = ^
o Q
_ a s = . = s
A o
Next to rectangular tanks, circular tanks with centre feed or peripheral
feed are used extensively (fig. 3.5), offering some advantages in con
struction. Under ideal conditions, their efficiency is the same as that
,-outlet zone ^ inlet zone
q «— i f r —• ; isettling zone) i • • fc
JJ sludge zone
lit inlet zone
jr^8- i m ^ i —*• i
outlet zone \fr- 4
* S
wwA
centre-feed peripheral feed
Fig. 3-5 Circular horizontal flow set t l ing tank.
3-6
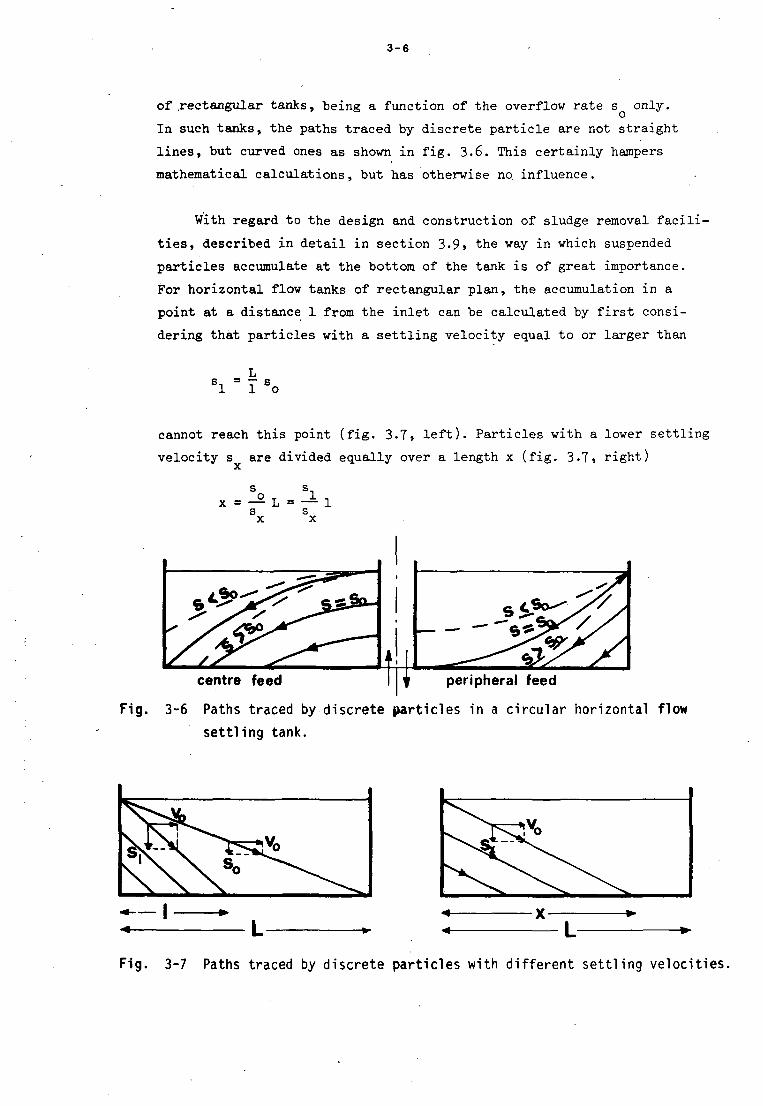
of .rectangular tanks, "being a function of the overflow rate s only.
In such tanks, the paths traced "by discrete particle are not straight
lines, but curved ones as shown in fig. 3.6. This certainly hampers
mathematical calculations, but has otherwise no influence.
With regard to the design and construction of sludge removal facili
ties, described in detail in section 3.9» the way in which suspended
particles accumulate at the bottom of the tank is of great importance.
For horizontal flow tanks of rectangular plan, the accumulation in a
point at a distance 1 from the inlet can be calculated by first consi
dering that particles with a settling velocity equal to or larger than
L s. = — s 1 1 o
cannot reach this point (fig. 3.7, left). Particles with a lower settling
velocity s are divided equally over a length x (fig. 3-7» right)
s s o T In x = — L = — 1 s s X X
centre feed peripheral feed
Fig. 3-6 Paths traced by discrete particles in a circular horizontal flow
settling tank.
- - I
Fig. 3-7 Paths traced by discrete part ic les with d i f ferent set t l ing veloci t ies.
3-7
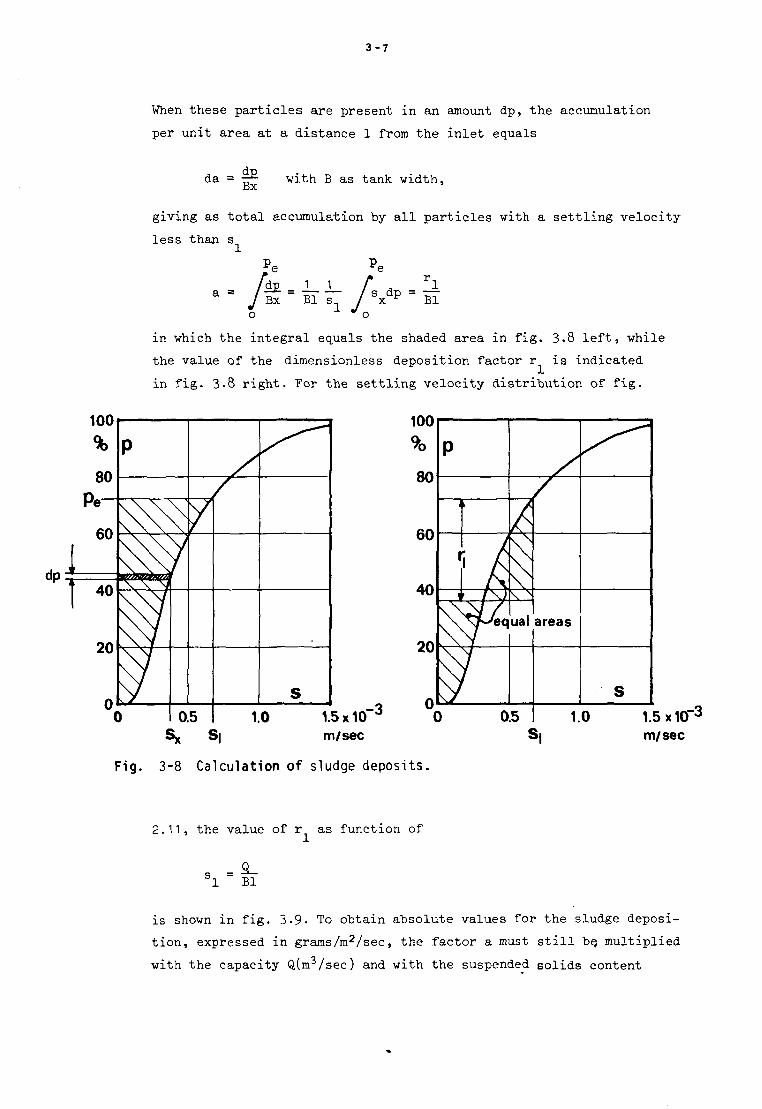
When these particles are present in an amount dp, the accumulation
per unit area at a distance 1 from the inlet equals
da = -=~- with B as tank width, ax
giving as total accumulation by all particles with a settling velocity-
less than s
*e *e
. /as. :L J_ A dp = fi J Bx Bl S l / Sx P Bl o o
in which the integral equals the shaded area in fig. 3.8 left, while
the value of the dimensionless deposition factor r is indicated
in fig. 3.8 right. For the settling velocity distribution of fig.
100
%
80
Pe~
60
I | 40
20
0 (
P
^
x/ ^ i
)
^
0 5 1
S
0 1.
100
%
80
60
40
20
Fig.
1.5x10 J
Sy S| m/sec
3-8 Calculation of sludge deposits.
p
,
I
!
^
i
0 A\
\ / q
V s^ ual areas
S
0.5 1.0 1.5x10" m/sec
2.11, the value of r as function of
3_ Bl
is shown in fig. 3.9. To obtain absolute values for the sludge deposi
tion, expressed in grams/m2/sec, the factor a must still be, multiplied
with the capacity Q(m3/sec) and with the suspended solids content
3-8
I A J
80
60
Af\ ^ U
on
T T
^
•
,
-
S|
<"3 0 0.5 1.0 15 1.7x10"fn/ Fig. 3-9 Deposition factor r, for the suspension shown in fig. 2-11.
*J\J'
40
30
20
10
°(
*iis y rama
)
rm faci;
5 0 1C basin l«
>0 ngth
15(
Fig. 3-10 Sludge accumulation in a rectangular basin (Q=0,5 m /sec, C =86 grams/m ,
B=15m and r, from fig. 3-9),
3-9
c (grams/m3) of the inflowing water. An example of such a sludge
curve is given in fig. 3.10, assuming a capacity Q of 0.5 m3/sec, a
rectangular basin 15 m wide, a suspended solids content in the raw
water c of 86 grams/m (table 2.1) and the values of r as shown in s _l_
fig. 3.9.
With circular basins, the results obtained above may again be
used, remembering that the basin area traversed by the incoming water
is the deciding factor. For a diameter of 50 m and the other data ae
mentioned above, the results are shown in fig. 3.11. In all cases, the
larger part of the sludge accumulates in the first parts of the basin.
>-3 50*10 grams/m/sec
10 15 20 25m
3 3 3-11 Sludge accumulation in a c i rcular basin (Q=0,5 m /sec, C =86 grams/m ,
D»50m and r, from f i g . 3-9),
3-10
3.3. Reduction in basin efficiency 'by turbulence
1 In the preceding section, sedimentation efficiencies have been
calculated for ideal conditions, among other things without any
influence of the horizontal water movement. This may be true with
streamline flow, but with turbulent flow transverse velocity com
ponents will be present, scattering the pathways of discrete
particles and reducing basin efficiency in the way as shown in
fig. 3.12. The horizontal flow will occur under laminar conditions
when its Reynolds number
Re = v R o
Fig. 3-12 Paths traced by discrete particles with laminar and turbulent flow.
is smaller than 580 to 2000, depending on the construction of the
inletzone and on the presence of columns, cross-beams, rough walls,
sludge removal equipment or other obstacles which might dist'oxb the
flow. With rectangular basins, the displacement velocity equals
v - a -
o BH
and the hydraulic radius
R = BH B + 2H
giving as Reynolds number
Re = = £_L v B + 2H
with v as kinematic viscosity. At 10 °C, v = (1.31)10~6m2/sec,
requiring for laminar flow at Re < 2000
Q < (2.62)10-3(B + 2H)
3-11
which is only possible when small amounts of water are treated in
wide and deep basins. Unless the overflow rate
s - a -o BL
is low, the length of the basin moreover will tend to be short.
For instance
Q = 0.03 m3/sec, B = 7.5 mi H = 2 m
s = (0.1)10-3 m/sec, A = 300 m2, L = kO m.
With any larger capacity or overflow rate, however, impossible dimensions
are obtained
Q = 0.05 m3/sec, B = 15 m, H = 2 m
so = (0.2)10-3m/sec, A = 250 m2, L = 17 m
or a nearly square basin, in which the flow will be unstable, giving
rise to another reduction in basin efficiency as will be shown in
section 3.5. With standard designs and a length several times the
width of the basin, for instance in this case
B = 6m, L = i*2m and H = m as before
vo = ^ = (U.2)10-3 m/sec, R = j § = 1 . 2 m
_ (U.2)10~3(1.2) _ _„__ R e " (1.31)10-* ~ 38°°
and turbulent conditions for the horizontal water movement through the
basin.
In water and waste water engineering, rectangular basins nearly
always operate under conditions of turbulent flow, with an efficiency
less than calculated in the preceding section for an ideal horizontal
flow settling tank. This reduction in basin efficiency can be calculated
on the basis of the dispersion caused by turbulence. The classical
results obtained by Camp (Sedimentation and the design of settling
tanks, Thomas R. Camp, Transactions of the American Society of Civil
Engineers, I9U6, p. 895 - 958) are shown in fig. 3.13, giving the removal
ratio r as function of the factors s/v and s/s with s as settling o o
velocity of the particle, v as displacement velocity in the basin and s as overflow rate. For a suspension containing one type of particles o

3-12
1.0 oc
•2 oa +•> v)£t w
To
| 6.8 0 w
0.7
0.6
0.5
0.4
0.3
0.2
0.1
0
-
. <1
:
™
I
2 : } *
S
15
1.2 1.1 1.0
0.9
0.8
0.7
6JH
0.5
0.4
0.3
(JUi
»
1
<
1
5 8
II II 1
2 : 3 < \
1
(
1
3 8
II 1 1
? : t * \
I
t
I
> 8
1 II 0.001 001 0.1 s
V 0
Fig. 3-13 Removal ratio with turbulent flow.

3-13
and one settling velocity s only, the calculations are quite simple.
Suppose that by sedimentation 80% of these particles must be removed.
With ideal settling, the overflow rate is now given by the relation
— = r = 0.8 s o
According to fig. 3.13, however, an efficiency r = 0.8 with the factor
s/s = 0.8 is only obtained in case
*-> 0.5 o
requiring a ratio between length and depth smaller than
T v s/s n a L. _ _o _ o _ O.o _ . •-H ~ s s/v 0.5 "
o o
that is to say a short, wide and deep basin with most probably unstable
flow. With a larger ratio between length and depth, for instance
and the same overflow rate, the deciding factors are
^-= 0.8, ^ - = | ^ = o.oV s v 20 o o
giving with fig. 3.13 as removal ratio
r = 0.73
The original removal ratio of 80# can now only be obtained by decreas
ing the overflow rate, for instance
fr-0.9. r-0.8. ^"=0.05 and \ = = 18 o o
The ratio between length and depth is quite acceptable, but the
decrease in overflow rate means an increase in basin area by a factor
0.9/0.8 = 1.125 or with 12.5%, augmenting the cost of construction
with 5 - 10$, depending on local circumstances.
In case the suspended particles vary strongly in settling veloci
ties, the calculation described above must be made for a number of
fractions, each with a constant settling rate. For the suspension
3-14
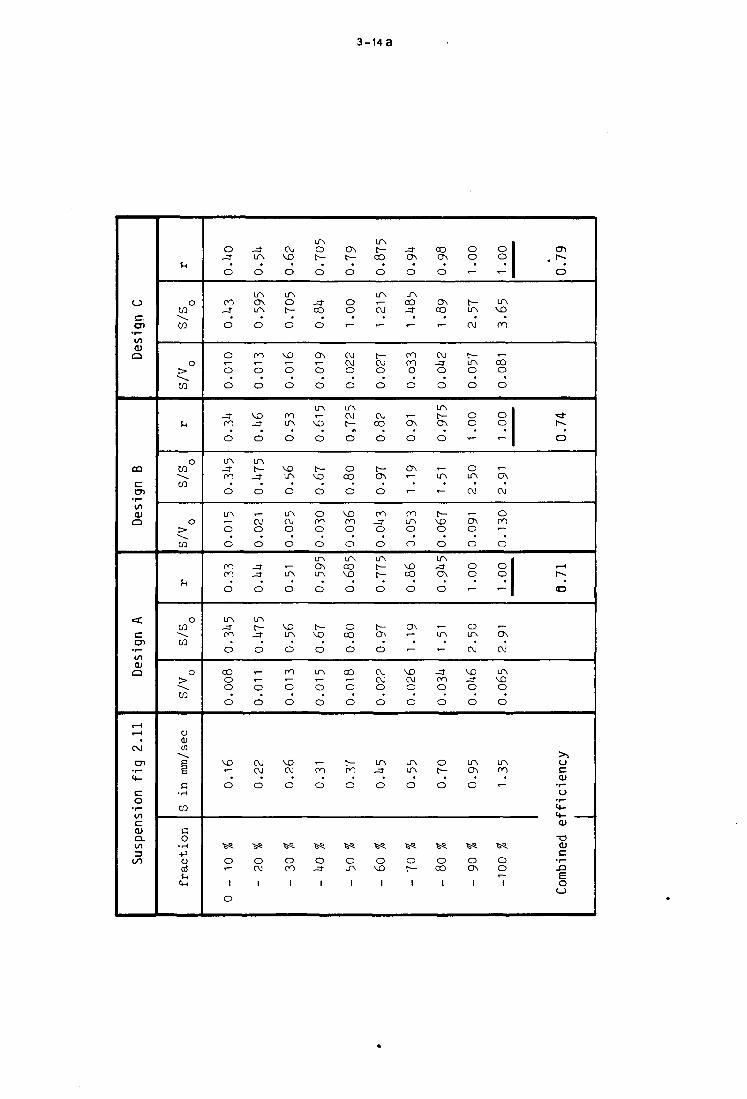
shown in fig. 2.11, the calculations are carried out in table 3.1,
going out 'from a capacity of 0.5 m3/sec and a constant basin depth
of 2 m. In the original design A, a width of 12 m and a length of 90 m is assumed, giving as overflow rate
s = o
-P L (12)(90)
= (0.U63)10-3 m/sec
and with fig. 2.13 an efficiency of 78$ for ideal conditions. In
reality, however, the efficiency amounts to T\% only. Some improve
ment, an efficiency of fk%, may be obtained by reducing the ratio
between length and width from 90/12 = 7-5 to 1+5/2U =1.9 (design B),
but the original efficiency can only be regained by decreasing the
overflow rate. In design C the surface area is augmented by 25%,
from (12)(90) = 1080 m2 to (15)(90) = 1350 m2, raising the efficiency
to even 79$ ,while maintaining an adequate ratio between length and
width equal to a factor 6.
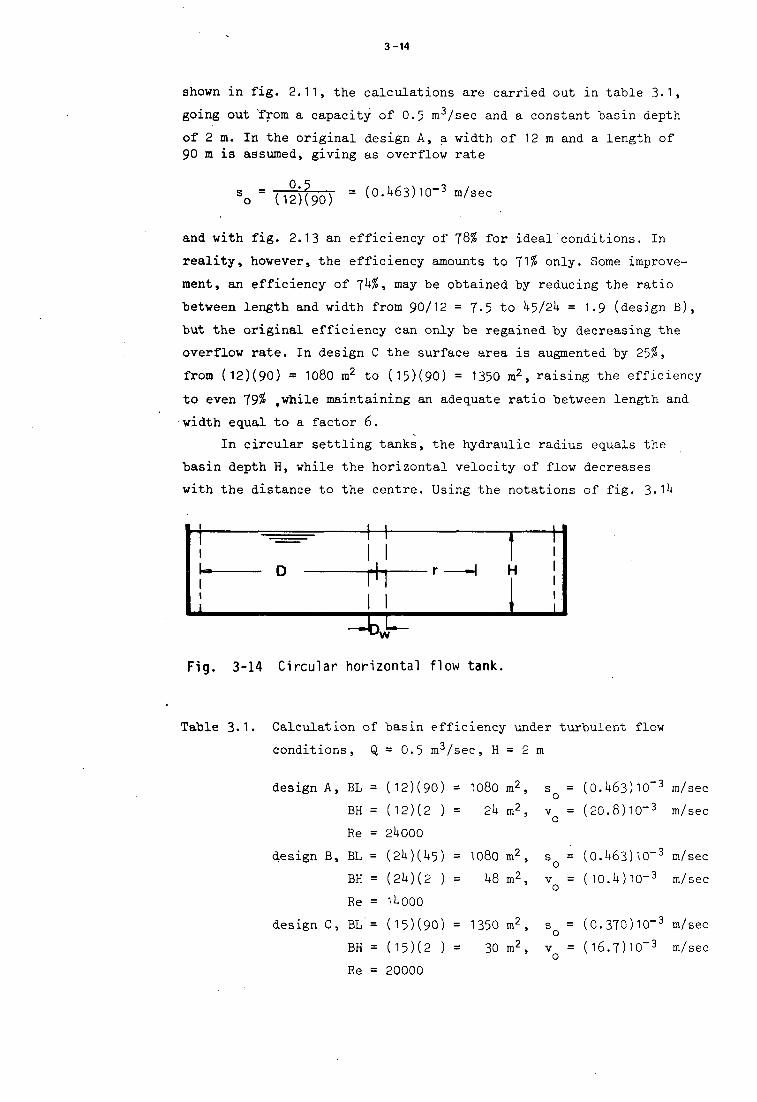
In circular settling tanks, the hydraulic radius equals the
basin depth H, while the horizontal velocity of flow decreases
with the distance to the centre. Using the notations of fig. 3.1*+
^ v F Fig. 3-14 Circular horizontal flow tank.
Table 3.1• Calculation of basin efficiency under turbulent flow
conditions, Q = 0.5 m3/sec, H = 2 m
design A, BL = (12)(90) = 1080 m2, s = (0.U63)10~3 m/sec
BH = (12)(2 ) = 2U m2, v = (20.8)10-3 m/sec
Re = 2U000
design B, BL = (2k){k^) = 1080 m2, s = (0.^63) 10-3 m/sec
BH = (2U)(2 ) = 1+8 m2, v = ( 10.U) 10~3 m/sec
Re = 1U000
design C, BL'= (15)(90) = 1350 m2, s = (0.370)10-3 m/sec
BH = (15)(2 ) = 30 m2, v = (16.T)10~3 m/sec o
Re = 20000
3-na
o
e . O J
•r—
a
CO
c CT1
(U Q
<: c o >
• r -
QJ a
.—i i—i
(NJ
CT)
<4-
C o
• i —
ai Q . l />
3 ( / I
Vi
O 03
"»••» CO
o t>
ra
u
o w -^ co
o > CO
>H
O CO
* - » . CO
o > w
o
en
g g
a •H
CO
c o
• H
- P O
fra
o _=r
o
P0 -=r
o
o 1 —
o o
- 3 -ro O
LA -a-ro O
LA i —
o o
on on o
LA -=t 0 0
o
co O O
o
NO
«— o
•65.
O
1
O
- 3 -LA
O
LA ON L A
O
0 0 1—
o
o
NO - 3 -
o
L A
t-
-* o
i —
OJ o o
J -_=r o
LA c—
-=T
O
i — T —
o
o
CM CM
O
•&e
o CM
1
CM MO
O
LA O t—
o
NO i —
o o
on LA
o
NO LA
o
LA CM o o
T —
LA
o
NO L A
o
on *— o
o
NO CM
O
%S.
O IT)
1
LA O t—
o
_=r CO
o
ON 1 —
o
o
LA r—
NO
O
t— ND
O
o on o o
L A
O N L A
O
t— NO
O
LA i —
o
o
1 —
m
o
vs.
o -3-
1
O N
t—
O
O O
i —
CM CM O
O
LA CM t—
O
o CO
o
NO on o o
L A
CO MO
o
o CO
o
CO
<— o
o
t— m
o
v i
o LA
1
LA t—
CO
O
LA i —
CM
i —
t— CM O
O
CM CO
O
t— O N
O
on -zr o o
L A
t— t—
o
t— O N
O
CM CM O
O
LA J -
o
V i
o NO
1
_* ON
o
LA CO - d -
t—
on on O
o
i —
ON
O
ON i —
*""
m LA
o o
NO CO
o
ON
*— i —
NO CM O
o
LA LA
O
%S.
o
1
CO ON
O
C3N CO
r—
CM -3 -o o
LA t— ON
o
1—
LA
T~ t -
M0 o o
LA -3 a \ o
•— LA
i —
-3 -m o
o
o t—
o
^ o
CO
1
o o
• ~
t— LA
CM
t— L A
o O
o o
"-
o LA
CM
i —
ON O
O
O O
' "
o LA
CM
MO -3 O
O
L A
ON
O
i s *
o ON
1
o
°. -
LA MD
0 0
»— CO o o
o o
• -
1 —
ON
CM
O m r~ o
o o
•-
1 —
ON
CM
LA M0 O
o
LA m r—
• f e ^ .
o
-,.
1 en
' " 1 o
**-t ^
o
.—1
r~~ o
>> o c 0 )
' r -O
't—
4 -f -
O
T 3 <1) C
• r -
Com
b

3-15
JL_A_ v 2irr
with r varying from D/2 at the outer circumference of the tank to
D /2 near the (inlet or outlet) well in the centre. With w
Q = £ D2s and t = 1o'°C, v = (1.31)10~6 m2/sec
this gives as Reynolds numbers
Re . = (0.19)10 6DS , Re = ( 0 . 1 9 ) 1 0 6 £ - S min o max D o
w
In the field of water and waste water engineering, s is commonly in
the neighbourhood of (O.3)10~3 m/sec, while D is about 5 to 10$ of D. w
Substitution of these values gives
Re . = 60 D , Re = 1000 D m m max
meaning that at the outer circumference of the tank the flow is mostly
laminar (Re s 2000), while near the centre the flow is always turbu
lent.
The reduction in basin efficiency by turbulence may again be
determined with the help of Camp's diagram shown in fig. 3.13. The
calculation, however, is rather complicated, requiring a subdivision
of the suspension into fractions with different settling velocities s
as well as a subdivision of the basin into annular zones with diffe
rent displacement velocities v . With circular tanks and peripheral
feed (fig. 3.5 right), the majority of the suspended load is removed
near the outer circumference of the basin (fig. 3.11), where laminar
flow conditions prevail With circular tanks and centre feed (fig.
3-5 left) on the other hand, these factors are completely reversed
and here the reduction in basin efficiency by turbulence will be much
larger. In both cases, however, an increase in basin area of 5 - 20%
is necessary to maintain the efficiency of quiescent settling shown
in fig. 2.13. As mentioned before the increase in cost of construction
will be appreciably less and is seldom a major factor in the design
of the tank.
Ke v v 2TrrH H "
*
From the considerations in this section and in section 2.1, it
will be clear that*in continuous horizontal flow basins the settling
process is influenced by two Reynolds numbers, one related to the
upward flow of water along the downward moving particle and the other
to the displacement of the body of water in horizontal direction.
The value of the first or particle Reynolds number determines whether
the settling is viscous or turbulent, the second or tank Reynolds
number whether the horizontal flow occurs under laminar or turbulent
conditions. In the field of water and waste water engineering, the settling process is mostly laminar and the horizontal water movement
mostly turbulent.
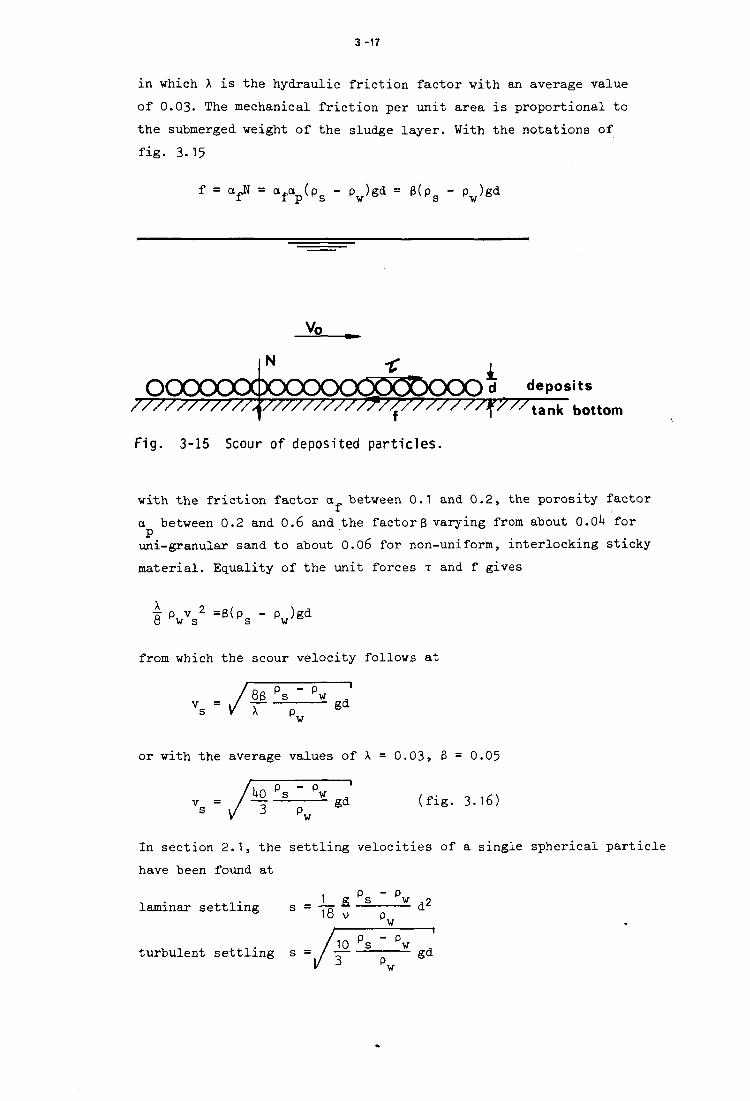
3/3.1*. Bottom scour
For the removal of discrete particles, the efficiency of a conti
nuous horizontal flow basin was found to be a function of the over
flow rate
s ~SL o BL
and independent of the depth H. As this depth decreases, however,
the displacement velocity
v = ~^~ o BH
goes up and may become so high as to be able to pick up and carry
away settled-out material from the sludge zone. This scouring starts
at a velocity v , when the hydraulic shear between the flowing water s
and the sludge deposits equals the mechanical friction between these
deposits and the bottom of the tank. Per unit area, the hydraulic
shear amounts to
x = p gRJ w
with J as slope of the water surface. According the formula of
Darcy-Weisbach
1 v 2 1 s
J = X'rr- -x— . Substituted
T = "p P V * o w s
3 -17
in which X is the hydraulic friction factor with an average value
of 0.03. The mechanical friction per unit area is proportional to
the submerged weight of the sludge layer. With the notations of
fig. 3.15
f = a fN = afo (pg - pw)gd = B ( P S - Pw)g<l
Vo
N
OOOCXXXbOOOOOC^roOOOd deposits ///////////y/////////T//////y//^//^f^ bottom
Fig. 3-15 Scour of deposited particles.
with the friction factor a between 0.1 and 0.2, the porosity factor
a between 0.2 and 0.6 and the factor 3 varying from about 0.01* for
uni-granular sand to about 0.06 for non-uniform, interlocking sticky
material. Equality of the unit forces T and f gives
\ p w V s 2 = 6 ( p s - p w ) g d
from which the scour velocity follows at
ftp v s = / r ~
P s w - — g d w
or with the average values of X = 0.03, B = 0.05
-1
v = •1*0 Ps " pw
s 1/ 3 p " w gd (fig. 3.16)
In section 2.1, the settling velocities of a single spherical particle
have been found at
, p - p 1 K s w 9
laminar settling s = -TQ dz 1o v p
_w_
/l0 ps " pw turbulent settling s = / gd
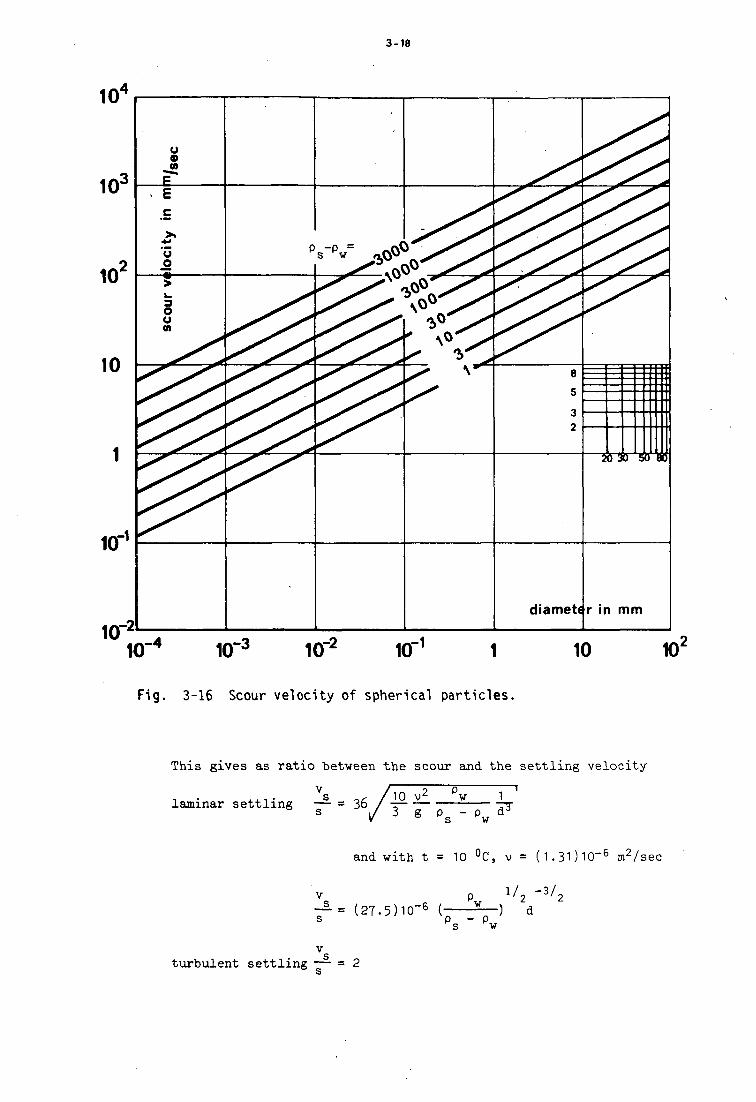
3-18
Fig. 3-16 Scour velocity of spherical particles.
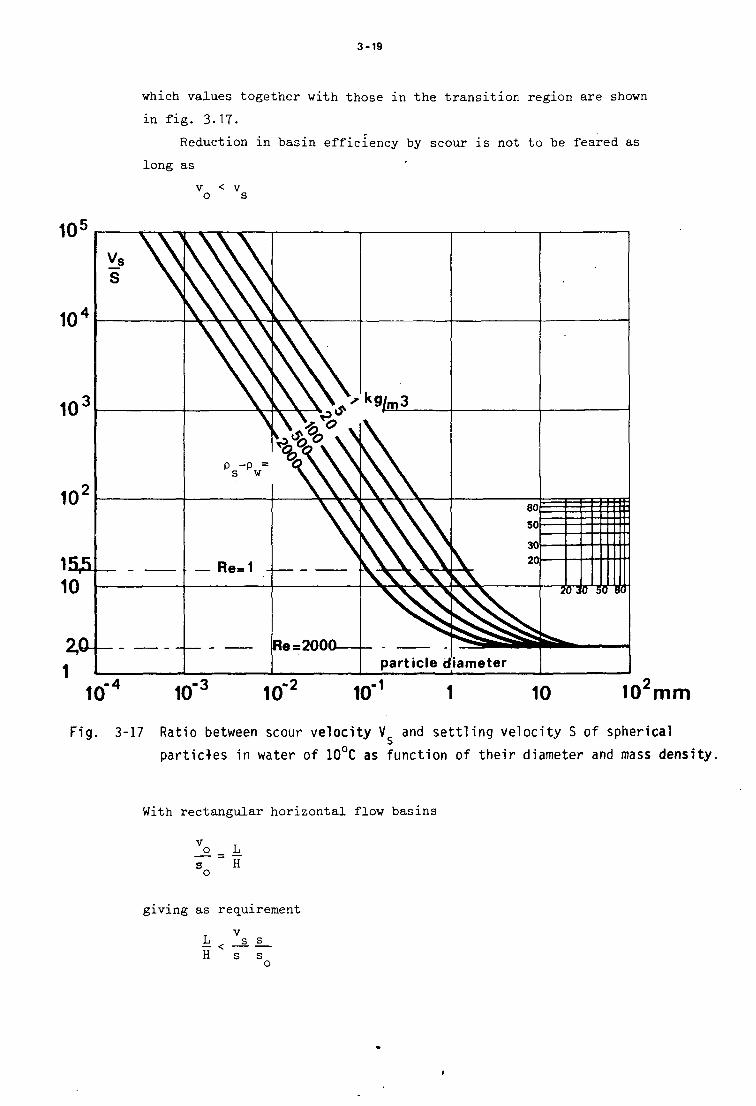
This gives as ratio between the scour and the settling velocity
i • 4.4.1 • V s r>C / 1 0 v 2 P w 1
laminar settling — = 36 / — — 3 g Ps - Pw ^
and with t = 10 °C, v = (1.31)10-6 m2/sec
P l/2 ' 3 /2 -^ = (2T.5)10~6 (- 2—) d s ps " pw
turbulent settling — = 2
3-19
which values together with those in the transition region are shown
in fig. 3.17.
Reduction in basin efficiency by scour is not to be feared as
long as
v < v o s
10 mm
Fig. 3-17 Ratio between scour velocity V and settling velocity S of spherical
particles in water of 10°C as function of their diameter and mass density.
With rectangular horizontal flow basins
_° = k s H o
giving as requirement
L s s H s s

3-20
With turbulent settling, the factor v /s equals 2, asking even with
uniform particles and the ratio s/s nearing unity for deep, short
and wide basins with a length never larger than twice the depth. With
viscous settling on the other hand, fig. 3.17 shows such large values
of v /s that notwithstanding non-uniform particles and a low ratio
of s/s , the basin length may easily be 10, 20 or Uo times the basin
depth, factors which in practice are seldom surpassed for small,
medium and large tanks respectively.
In many cases, all suspended particles have a common source,
meaning a constant mass density and a settling velocity which only
varies with the particle diameter. For the danger of scour a more
direct calculation is now possible, eliminating this diameter between
the formulas for the scour velocity and the viscous settling velocity
2 3 Pw vs /I8v pw
a = — • -
U0 Ps - pw S ~ V g ps - Pw
from which follows with t = 10 °C, v = (1.31)10-6 m2/sec and g = 9.81 m/sec
s P w
and for instance with p = 1000 kg/m3, p = 1020 kg/m3
Vu Vu v = (O.U5)(0.376)s = 0.17 s x
s
In fig. 2.11 the settling velocity for 3% of the suspended load is
below (0.16)10~3 m/sec, giving as corresponding scour velocity
v = (0.17)0.6) 'OO-1 = (19)10~3 m/sec s
In the example of table 3.1 this velocity is surpassed in design
A, but not in the designs B and C.
In circular tanks, the horizontal velocity obtains its maximum
value near the (inlet or outlet) well in the centre. With the
notations of fig. 3.11*
Q v = —a—
2
o TTD H w
The r equ i remen t

3-21
V < V o s
may now be t r a n s l a t e d as
D > A. w irHv
With for instance a capacity of 0.5 m3/sec, a depth of 3 m and a
scour velocity of (19) 10— 3 m/,sec as calculated above
D > _P^_ v TT (3) C19) 10- 3 zrs = 2.8 m
For the capacity assumed, this value is fairly large but certainly
not excessive.
As will be explained in the next section, a large horizontal
velocity is desirable to obtain steady flow conditions. With an
influent at a temperature much lower or at a suspended load much
higher than that present in the tank, the inflowing water tends to
plunge to the bottom and to proceed here in a shallow layer with
a velocity of flow much higher than the average displacement
velocity v . Under such conditions, the actual velocity may
greatly surpass the scour velocity. Resuspension of settled out
material, however, can still be prevented by using the baffles
shown in fig. 3.18.
) ' ' • » ' • - » — r - • • • i • • •' \CtL L iiiiniiimmm i
effluent
Baffles to protect sludge deposits against scouring.
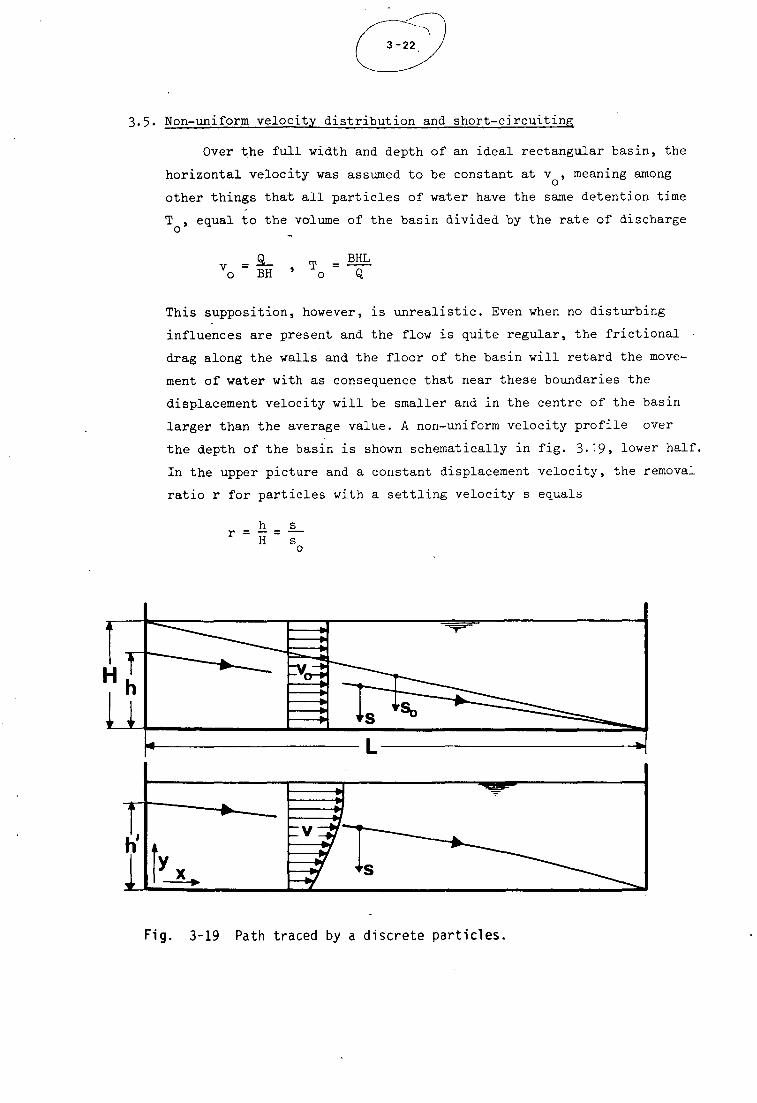
3.5- Non-uniform velocity distribution and short-circuiting
Over the full width and depth of an ideal rectangular basin, the
horizontal velocity was assumed to be constant at v , meaning among o
other things that all particles of water have the same detention time T , equal to the volume of the basin divided by the rate of discharge o
v =£_ T = B H L o BH ' o Q
This supposition, however, is unrealistic. Even when no disturbing
influences are present and the flow is quite regular, the frictional
drag along the walls and the floor of the basin will retard the move
ment of water with as consequence that near these boundaries the
displacement velocity will be smaller and in the centre of the basin
larger than the average value. A non-uniform velocity profile over
the depth of the basin is shown schematically in fig. 3.19, lower half.
In the upper picture and a constant displacement velocity, the removal
ratio r for particles with a settling velocity s equals
Fig. 3-19 Path traced by a discrete particles.
3-23
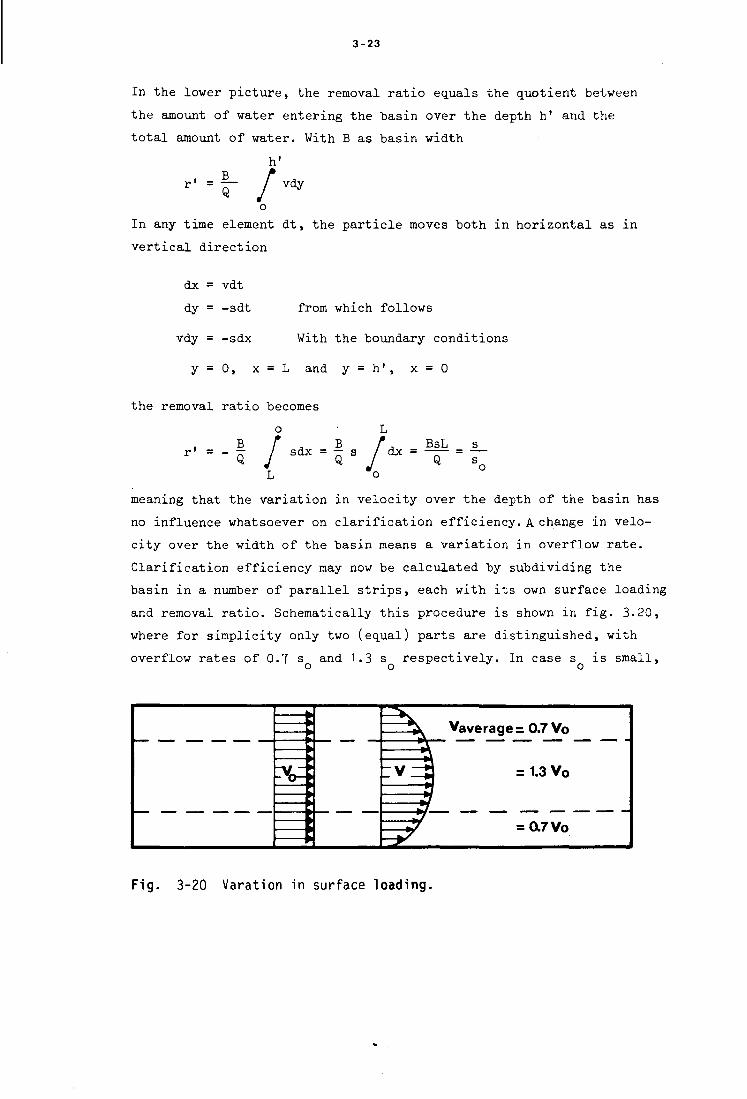
In the lower picture, the removal ratio equals the quotient between
the amount of water entering the basin over the depth h' and the
total amount of water. With B as basin width
h1
r' = — / vdy - • * • /
In any time element dt, the particle moves both in horizontal as in
vertical direction
dx = vdt
dy = -sdt from which follows
vdy = -sdx With the boundary conditions
y = 0, x = L and y = h', x = 0
the removal ratio becomes
o B Q /
sdx = — s / dx = — — •= —
L "o
meaning that the variation in velocity over the depth of the basin has
no influence whatsoever on clarification efficiency.A change in velo
city over the width of the basin means a variation in overflow rate.
Clarification efficiency may now be calculated by subdividing the
basin in a number of parallel strips, each with its own surface loading
and removal ratio. Schematically this procedure is shown in fig. 3-20,
where for simplicity only two (equal) parts are distinguished, with
overflow rates of 0.7 s and 1.3 s respectively. In case s is small,
:V
i i » t >
t
_ k Vaverage= 0.7 Vo
I V Z J J =1.3Vo
~ ^ =(X7Vo
Fig. 3-20 Varation in surface loading.
3-24
100'
80
60
40
20
*-3_ 1 '5*1 0 m/sec
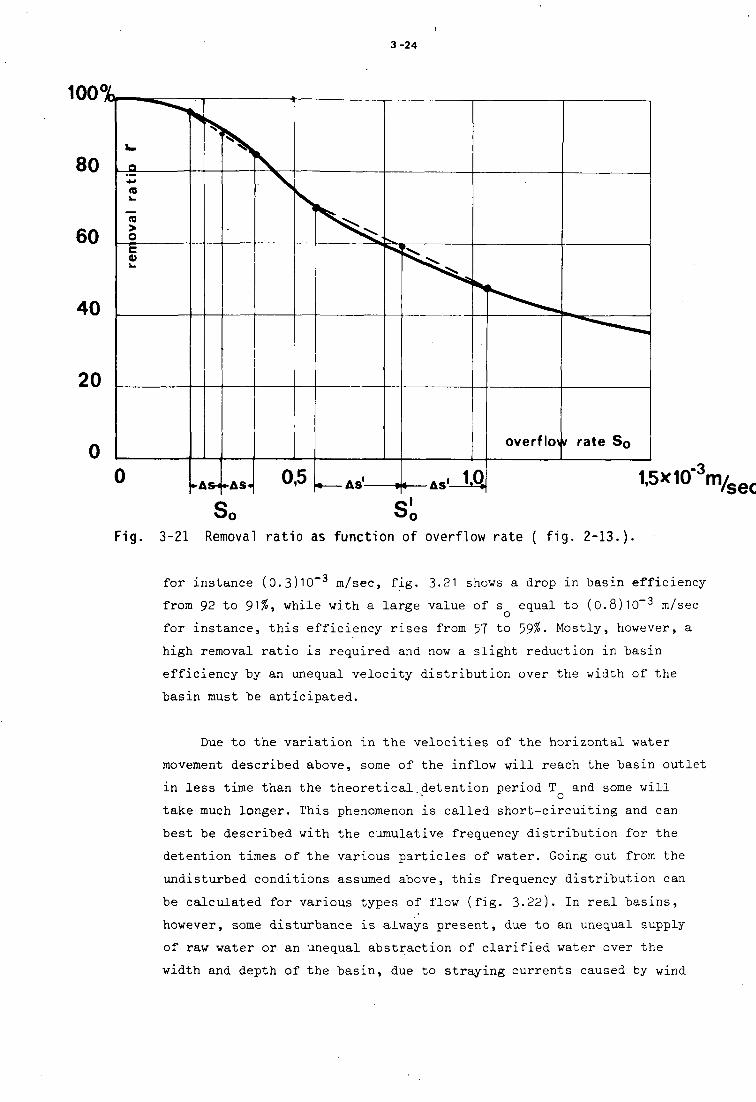
Fig. 3-21 Removal ratio as function of overflow rate ( fig. 2-13.).
for instance (0.3)10~3 m/sec, fig. 3.21 shows a drop in basin efficiency
from 92 to 91%, while with a large value of s equal to (0.8)10-3 m/sec o
for instance, this efficiency rises from 57 to 39%- Mostly, however, a
high removal ratio is required and now a slight reduction in basin
efficiency by an unequal velocity distribution over the width of the
basin must be anticipated.
Due to the variation in the velocities of the horizontal water
movement described above, some of the inflow will reach the basin outlet
in less time than the theoretical detention period T and some will r o
take much longer. This phenomenon is called short-circuiting and can
best be described with the cumulative frequency distribution for the
detention times of the various particles of water. Going out from the
undisturbed conditions assumed above, this frequency distribution can
be calculated for various types of flow (fig. 3.22). In real basins,
however, some disturbance is always present, due to an unequal supply
of raw water or an unequal abstraction of clarified water over the
width and depth of the basin, due to straying currents caused by wind
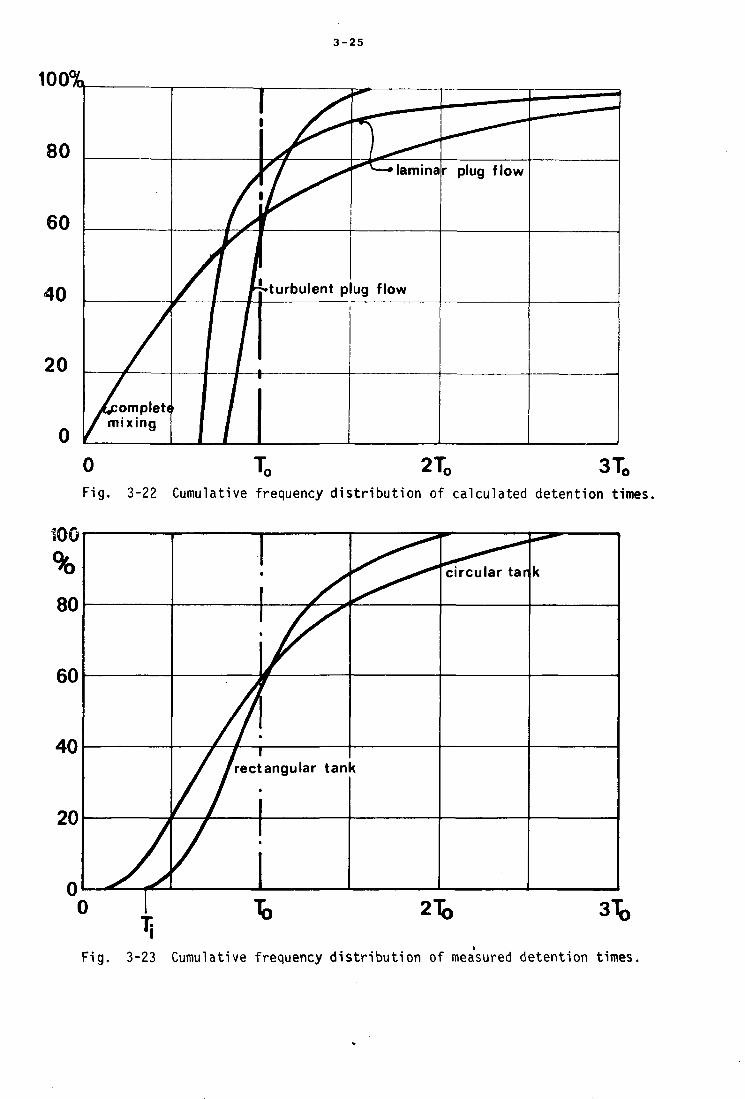
3 - 2 5
80
60
40
20
0
Zcomplet< / mixing
/
/ 1 /•
1 /
1 /
1 / -
\j^r^
-turbulent p
"""^-—•lamina
ug flow
r plug flow
0 Fig.
2T„ 3T„ •o *• ' o *« "o
3-22 Cumulative frequency d is t r ibu t ion of calculated detention times.
100
%
80
60
40
20
1
J m
M ^r
/ 1 ' / /rectangular tan
M M
' / 1 / 1
<
circular tan k
T: 2Tb 31b
Fig. 3-23 Cumulative frequency d is t r ibu t ion of measured detention times.
3-26
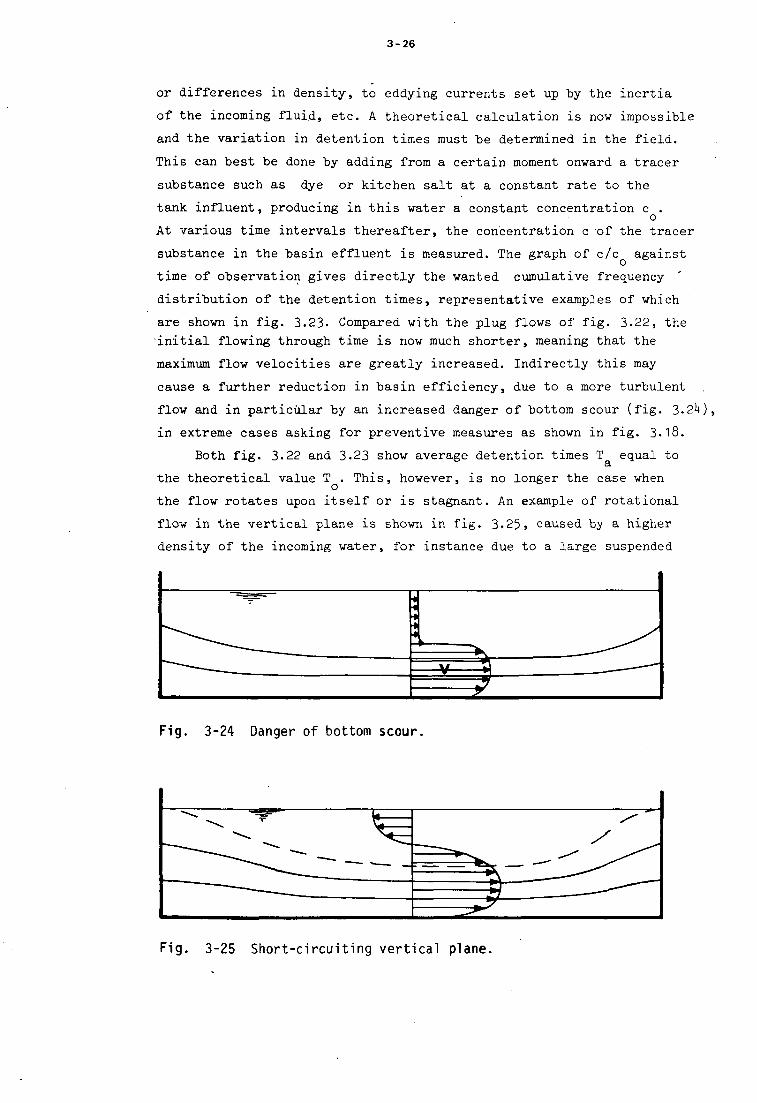
or differences in density, to eddying currents set up by the inertia
of the incoming fluid, etc. A theoretical calculation is now impossible
and the variation in detention times must be determined in the field.
This can best be done by adding from a certain moment onward a tracer
substance such as dye or kitchen salt at a constant rate to the
tank influent, producing in this water a constant concentration c . o
At various time intervals thereafter, the concentration c of the tracer
substance in the basin effluent is measured. The graph of c/c against
time of observation gives directly the wanted cumulative frequency
distribution of the detention times, representative examples of which
are shown in fig. 3.23. Compared with the plug flows of fig. 3.22, the
initial flowing through time is now much shorter, meaning that the
maximum flow velocities are greatly increased. Indirectly this may
cause a further reduction in basin efficiency, due to a more turbulent
flow and in particular by an increased danger of bottom scour (fig. 3.2*0,
in extreme cases asking for preventive measures as shown in fig. 3.18.
Both fig. 3.22 and 3.23 show average detention times T equal to
the theoretical value T . This, however, is no longer the case when o
the flow rotates upon itself or is stagnant. An example of rotational
flow in the vertical plane is shown in fig. 3.25, caused by a higher
density of the incoming water, for instance due to a large suspended
4 4 •• 4
V '
I 3 Fig. 3-24 Danger of bottom scour.
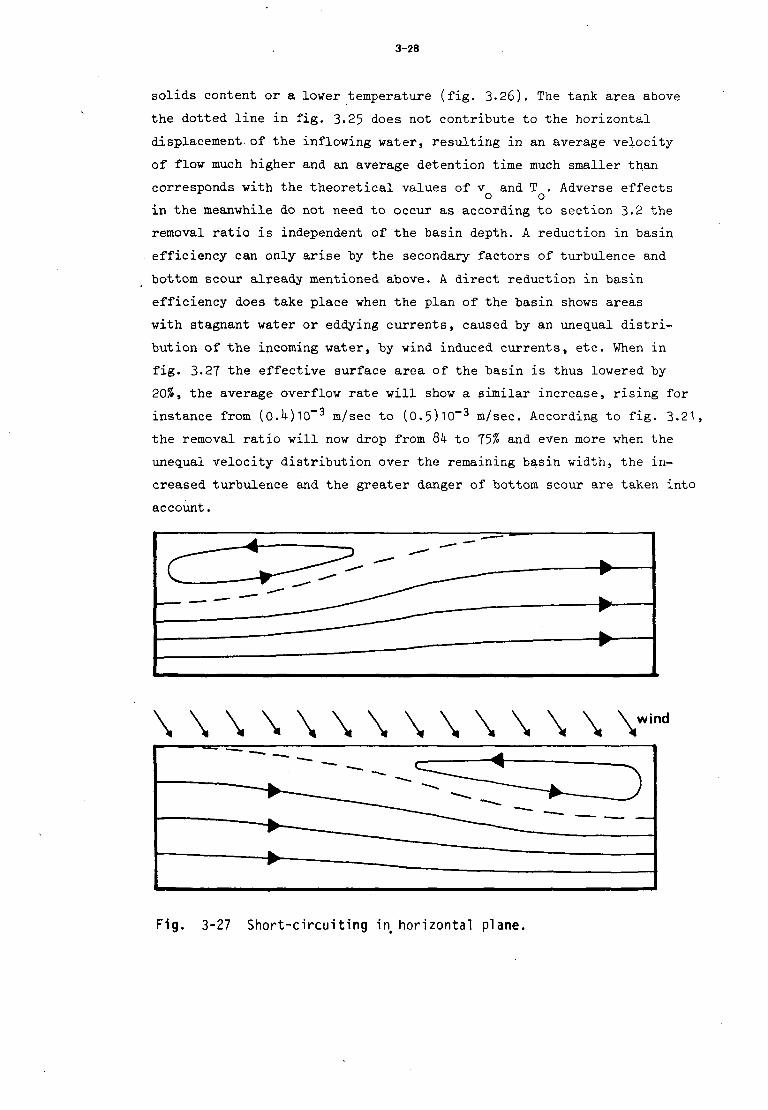
Fig. 3-25 Short-c i rcui t ing ver t ica l plane.
3-27
10 mm/Sec
4°C
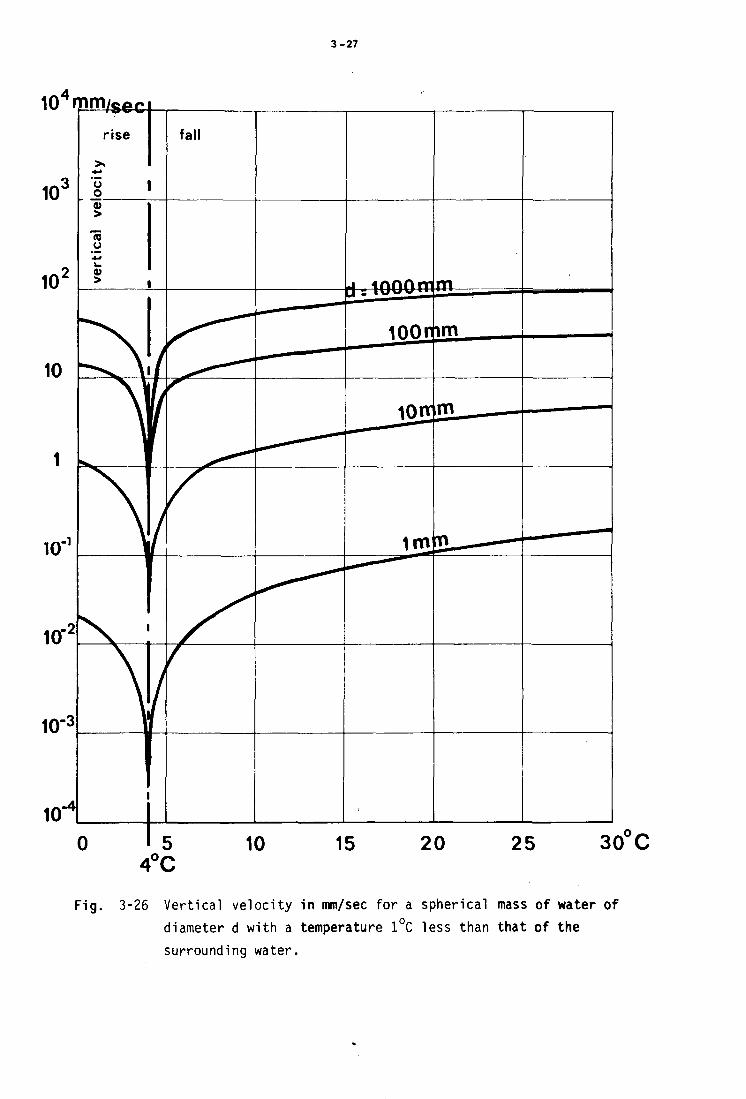
Fig. 3-26 Vertical velocity in mm/sec for a spherical mass of water of
diameter d with a temperature 1°C less than that of the
surrounding water.
3-28
solids content or a lower temperature (fig. 3.26). The tank area above
the dotted line in fig. 3.25 does not contribute to the horizontal
displacement of the inflowing water, resulting in an average velocity
of flow much higher and an average detention time much smaller than
corresponds with the theoretical values of v and T . Adverse effects o o
in the meanwhile do not need to occur as according to section 3.2 the
removal ratio is independent of the basin depth. A reduction in basin
efficiency can only arise by the secondary factors of turbulence and
bottom scour already mentioned above. A direct reduction in basin
efficiency does take place when the plan of the basin shows areas
with stagnant water or eddying currents, caused by an unequal distri
bution of the incoming water, by wind induced currents, etc. When in
fig. 3.27 the effective surface area of the basin is thus lowered by
20$, the average overflow rate will show a similar increase, rising for
instance from (0.M10-3 m/sec to (0.5)10-3 m/sec. According to fig. 3.21,
the removal ratio will now drop from 8U to 75% and even more when the
unequal velocity distribution over the remaining basin width, the in
creased turbulence and the greater danger of bottom scour are taken into
account.
wwwwwww nd
Fig. 3-27 Short-circuiting in# horizontal plane.
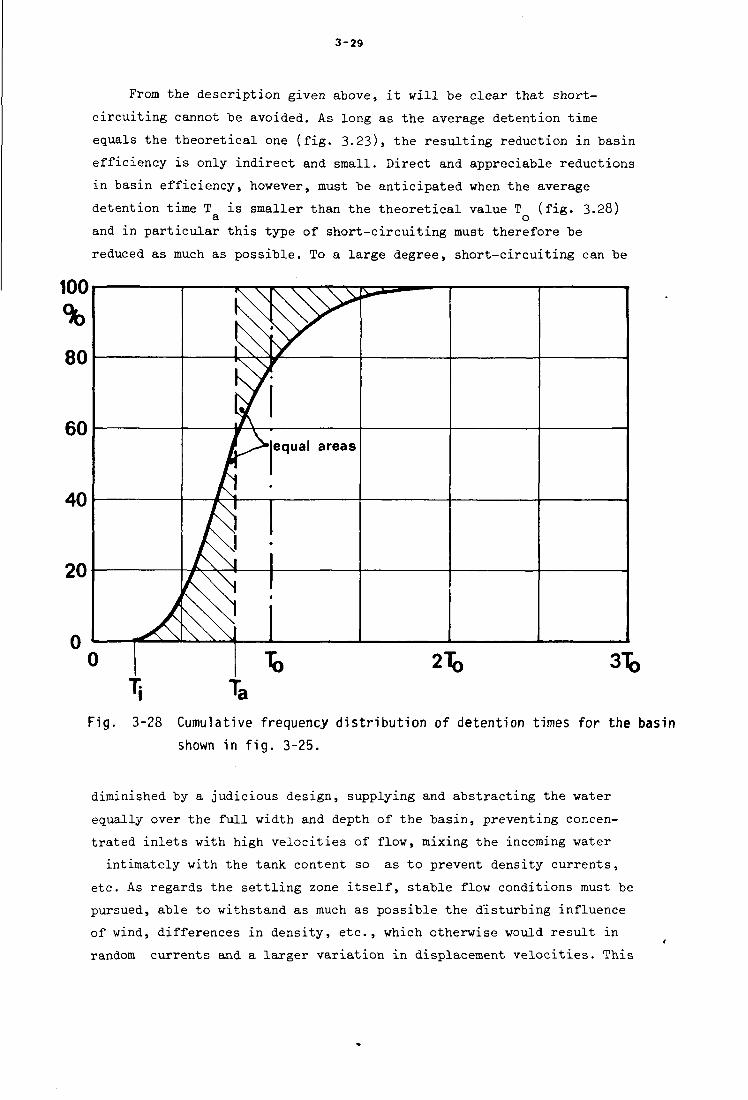
3-29
From the description given above, it will be clear that short-
circuiting cannot be avoided. As long as the average detention time
equals the theoretical one (fig. 3.23), the resulting reduction in basin
efficiency is only indirect and small. Direct and appreciable reductions
in basin efficiency, however, must be anticipated when the average
detention time T is smaller than the theoretical value T (fig. 3.28) a o
and in particular this type of short-circuiting must therefore be
reduced as much as possible. To a large degree, short-circuiting can be
i a Fig. 3-28 Cumulative frequency distribution of detention times for the basin
shown in fig. 3-25.
diminished by a judicious design, supplying and abstracting the water
equally over the full width and depth of the basin, preventing concen
trated inlets with high velocities of flow, mixing the incoming water
intimately with the tank content so as to prevent density currents,
etc. As regards the settling zone itself, stable flow conditions must be
pursued, able to withstand as much as possible the disturbing influence
of wind, differences in density, etc. , which otherwise would result in
random currents and a larger variation in displacement velocities. This
3-30
stability can be promoted by augmenting the ratio between inertia forces
and gravity, expressed by the dimensionless Froude number
2 v
Fr= °
in which v is the average displacement velocity, g the gravity constant
(9.81 m/sec2) and R the hydraulic radius. With rectangular horizontal
flow basins
v = -rr and R = p ^ .. . Substituted o BH B + H
-,2
~BJH:
meaning that the Froude number will be higher as the capacity is larger
and the basin has a smaller width and a smaller depth. With the chosen
surface loading
s =3-o BL
the Froude number becomes
Fr . fol Li ( + 2Hj
according to which stability is promoted when the basin has a high
overflow rate and a great length. Some idea about the influence of the
Froude number on basin stability is given by the diagram of fig. 3.29 ,
taken from the paper by Camp quoted in section 3.3. A minimum acceptable
figure is difficult to fix, but generally a value of 10-5 is adopted,
giving a ratio between initial and theoretical flowing-through time
of about O.k and a ratio between average and theoretical flowing-through
time of about 0.9- This reduces the adverse effects of short-circuiting
to more or less acceptable values, but certainly not to zero. Whenever
possible, higher Froude numbers should be applied, but not so high
as to endanger basin efficiency by turbulence or bottom scour. For
the example dealt with in table 3-1, the Froude number amounts to
.(2.9)10"5for design A, (O.6)l0"5for design B and (l.8)l0"5for the
chosen design C.
With circular horizontal flow basins the Froude number is not
constant, but decreases with the distance to the centre of the tank.
Using the notations of fig. 3.1k, this number varies from

3-31
, -7 , - 6 *-5 - 4 -1 10 ' 10 " 10" 10 10 10 " 10
Fig. 3-29 Infuence of the Froude number on the degree of shor t -c i rcu i t iag.
Of 1 o D F r min ~ TT^S D2H3
s 2 . 2
TFT l 6g H
near the outer circumference to
-. = £ 1 = So 2 D^ ^
max TFS D 2H 3 l6g D 2H a
w w
near the inlet or outlet well in the centre. In the field of water
and waste water engineering, s is commonly in the neighbourhood of
(0.3)10~3 m/sec, while D is about 5 to 10$ of D. With a normal tank w
depth of 3 m the Froude numbers thus become
Fr . = (0.02)10~9 D2
m m
Fr = (M1CT9 D2
max
or with a large diameter of 50 m
Fr . = (0.005)10-5, Fr = 10~5 min max

/ 3-32
Already at a short distance from the centre, the flow in circular
tanks is unstable. Even a slight disturbance by wind or difference
in density (due to insolation for instance) will change the radial
flow pattern, resulting in short-circuiting and an quite erratic
tank behaviour (fig. 3.30).
•« 30,00 m ••
Fig. 3-30 Erratic behaviour of a circular horizontal flow tank.
3.6. Design of the settling zone
When designing a horizontal flow settling tank for the removal
of discrete particles, the principal factors are on one hand the
amount Q of water to be treated and on the other hand the settling
characteristics of the suspension and the desired removal ratio
which together determine the surface loading s to be applied. Once
these factors are known, the required surface area A = Q/s is
fixed, leaving for circular tanks only the depth to be chosen. With
mechanical sludge removal, already a small depth will satisfy all
requirements. As rule of the thumb, applicable for preliminary
designs 1/3
H = 0.17 A

3-33
for manual cleaning to be increased by about 1 m for sludge storage,
depending on local circumstances.
With rectangular tanks there is more freedom as not only the
depth, but also the ratio between length and width need still to
be fixed. Needless to say that these factors ought to be chosen
such as to simulate quiescent settling conditions as much as pos
sible. According to the preceding sections, however, this asks for
short, wide and deep basins to prevent reduction in basin efficiency
by turbulence and bottom s_cour and for long, narrow and shallow
basins to prevent such a reduction by basin instability and short-
circuiting^ As mentioned before, scour is commonly not a problem
leaving as requirements
v R Re = - 2 - < 2000
v and Fr = gR
> 10 -5
Strange as it may seem, both these conditions can be satisfied, at
a temperature of 10 °C, v = (1.31)10~6 m2/sec by
v = (6.U)10-3 m/sec, R < 0.1+1 m o
Such basins are shown in fig. 3.31 and are either short, wide and
shallow or long, narrow and deep, while the horizontal velocity of
flow is so small that bottom scour is indeed not to be feared. With
regard to its enormous depth, the cost of constructing the basin
shown in fig. 3-31 at the right will be prohibitive, while the
V 0 z 0,0064 m/sec
Fig. 3-31 Rectangular settling tanks with laminar and stable flow.
3-34
dimensions of the left hand basin will be rather odd. With a capacity
of for instance 0.5 m3/sec and an overflow rate of (0.37)10~3 m/sec
(design C in table 3.1)
H = 0 A l m ' B = (o.M)(0.006U) = 1 9 0 m
L = (190)(0.37)10-3 = T*1 m
making sludge removal extremely expensive.
In practice, the shape of the settling zone is a compromise between
on one hand the hydrodynamic requirements of a high Froude number and
a low Reynolds number and on the other hand economic considerations
asking for a limited ratio between length and width and for a shallow
depth . This depth does not need to be larger than is necessary for
installation and proper functioning of sludge collecting mechanisms,
giving a value of about
H _ J_ T0.8 H - 12 L
while the ratio between length and width commonly varies from 6 to 10.
With a capacity of 0.5 m3/sec and an overflow rate of (0.37)10-3 m/sec
as mentioned above, the required surface area equals
A = (0.37)10-^ = 1350ra2
giving with for instance L = 6B
B2 = -^^p =225, B = 15 m and
L = - ^ = 90 m H =\^ (90)0-8 = 3 m
R = ( 3 ^ 1 ^ = 2.1U m, V Q = T^yff^J = 0.0111 m/sec
The hydrodynamic parameters thus become (t = 10 °C,v = (1.31)10-6 m2/sec)
3-35
The Froude number is only a little too low, but the Reynolds number is
much too high, reducing basin efficiency by turbulence as described in
section 3.3. When this reduction is not acceptable, a larger width
could be applied. With B = 25 m in stead of 15 m
L = - ^ = 5 U m , H = -^ (5U)0-8 = 2 m
R = i2]i|£l = 1>72 fflj ^ = ( g ° ( - | 5 ) = 0.010 m/sec
giving the same Froude number and only a moderate reduction in Reynolds
number. Much better results could be obtained by using the longitu
dinal baffles of fig. 3.32. With 3 baffles, the basin width of 15 i
is divided in k strips, each 3.75 m wide, reducing the hydraulic
radius to
R _ (3)(3.75) = - .,- m R - 9<T5 - 1.15 m
With the horizontal velocity unchanged
Re = 9700 Fr = (1.1)10-5
A further improvement may be obtained by subdividing the width of 25 m
in 7 strips each 3.57 m wide
R = m^a m 0.9U m
Re = 7200 Fr = (1.1)10"5
Fig. 3-32 Continuous longitudinal baffles.
3-36
The total length of basin walls is now reduced from 2(15 + 90) = 210 m
to 2(25 + 5H) = 158 m, while the total length of baffles has grown
from (3)(90) = 270 m to (6)(5U) = 32U m. These baffles, however,
only guide the water, ironing out irregularities in flow, but the
water pressure at both sides is the same. A small structural strength
is consequently sufficient, allowing the use of cheap materials such as wood in a light-weight construction. As regards the cost of the
basin alone, the cheapest construction will therefore be had with
a nearly square plan, for instance
B = 36 m, L = 37.5 m, H = 1.5 m
subdivided by 8 baffles in 9 strips, each h m wide
R = C00-E? = 0.86 m, V Q = l36°){^5) = 0.0093 m/sec
= (p.0093)(0.86) . 6 l 0 0 R e (I.3l)l0"b b l 0 °
F r - (0.0093)2 = 5 F r " (9.8l)(0.86) 10
The total wall length now equals 2(36 + 37-5) = 1*»7 m and the total
length of baffles (9)(37-5) = 337 m. Compared with a basin width of
25 m, however, the gain is only slight, while a heavy increase in
the cost of mechanical sludge removal equipment must be anticipated.
When in exceptional cases the Froude number is much too low
and an increase in Reynolds number is still acceptable, the
round-the-end baffles of fig. 3.33 may be applied. As serious dis-
0 -3
Fig. 3-33 Round-the-end baffles.

3-37
advantage must be mentioned, however, that around their ends
eddying currents will arise, creating dead spaces and disturbing
the sludge deposits at the bottom of the tank. Their application
should therefore be avoided as much as possible, using channel-
type settling tanks with a large ratio between length and width.
Instability of the basin and an erratic behaviour are in
particular due to straying currents caused by the wind (water
velocity 1 - h% of the wind velocity) and to density currents
caused by the heat of the sun. These effects can partly be prevented
by a judicious selection of basin site and orientation, by the
application of wind screens in the form of hedges, etc. Complete
inactivation of these factors can be obtained by covering the
basin, but in practice this is only done when strictly necessary
for other reasons, for instance to prevent freezing in winter time.
For the purification of drinking water, covering has the advantage
that contamination by wind blown material is no longer to be feared.
3.7- Tray settling tanks, tilted plate separators and tube settlers
Not only with the vertical baffles of the preceding section,
but also with horizontal baffles a favorable change in the Reynolds
and Proude numbers may be obtained. With continuous horizontal
baffles only the hydraulic radius R is lowered, while next to this
horizontal baffles of the round-the-end type also increase the
horizontal velocity of flow v . The most important effect of these
horizontal baffles or trays, however, is an enlargement of the
area on which sludge may accumulate (fig. 3.3*0, in this way reduc
ing the overflow rate and greatly promoting clarification efficiency.
Fig. 3-34 Reduction in overflow rate by continuous horizontal baffles.

3-38
Tray settling tanks (fig. 3.35) consequently pack an enormous capa
city in a small volume, while the additional cost of installing
the trays is small, their structural strength only being necessary
to carry their own weight next to the submerged weight of the sludge
deposits. In the field of public and industrial water supplies tray
settling tanks are used extensively. For the treatment of sewage,
however, they are seldom applied as the larger volume and the
putrescibility of the suspended matter asks for a continuous sludge
removal, for which the mechanical installations are difficult to
accomodate and to maintain in tray settling tanks. This difficulty
in the meanwhile may be overcome by setting the trays at a steep
Fig. 3-35 Tray settling tanks.
3-39
angle, 60° for instance with the horizontal. In these so-called
tilted plate separators (fig. 3.36), the sludge does not adhere to
the plates, hut slides down to the space below, for subsequent remo
val by normal means (compare section 3.9)- The hydrodynamics of a
tilted plate separator are shown in fig. 3.3T» in which the value
of s again determines the removal ratio. In the detention time T,
the particle travels from A to B, which movement may be subdivided in
a travel from A to C at a velocity v and a travel from C to D at o
a velocity s . With the notations of fig. 3.37
-1 scum remova zone
I J* settling zone , area A
Fig. 3-36 Ti l ted plate separator.
Fig. 3-37 Principle of t i l t e d
plate separation.
3-40
AC : + = v T sxn a tg a o
CD = — ~ - = s T cos a o
from which follows
s w sin a
v h cos ct+w cos2« o •
When A is again the surface area of the settling zone and Q the capacity
Q than v = - — ? Substituted o A sin a
Q w s = * . : -y-o A hcos a + w cosz a
Assuming for instance w = 0.1 m, h = 1 m and a = 60° gives
So A (1)(0.5)+(0.1)(0.5)2 ° y A
or an overflow rate which is 5.25 times as small as in a conventional
tank of the same area. Disregarding a reduction in basin efficiency by
turbulence or instability, fig. 2.13 requires for 95$ removal an over
flow rate less than (0.25)10-3 m/sec. With a capacity of 0.5 m3/sec,
the required area thus becomes
A = 0.l9f-=0.l9((J;>1cr3 = 380m*
which now may be accomodated in a square tank, further reducing the
cost of construction. The flow between the tilted plates is governed
by v = 7 — ^ = onr^'tl aaei\ = (1.92)10~3 m/sec o A sin a (3o0)(0.866)
R = | = 0.05 m
t = 10 °C, v = (1.31)10-6 m2/sec
R e = (1.52)10~3(0.05) = 8 R e (1.31)10-6 5ti
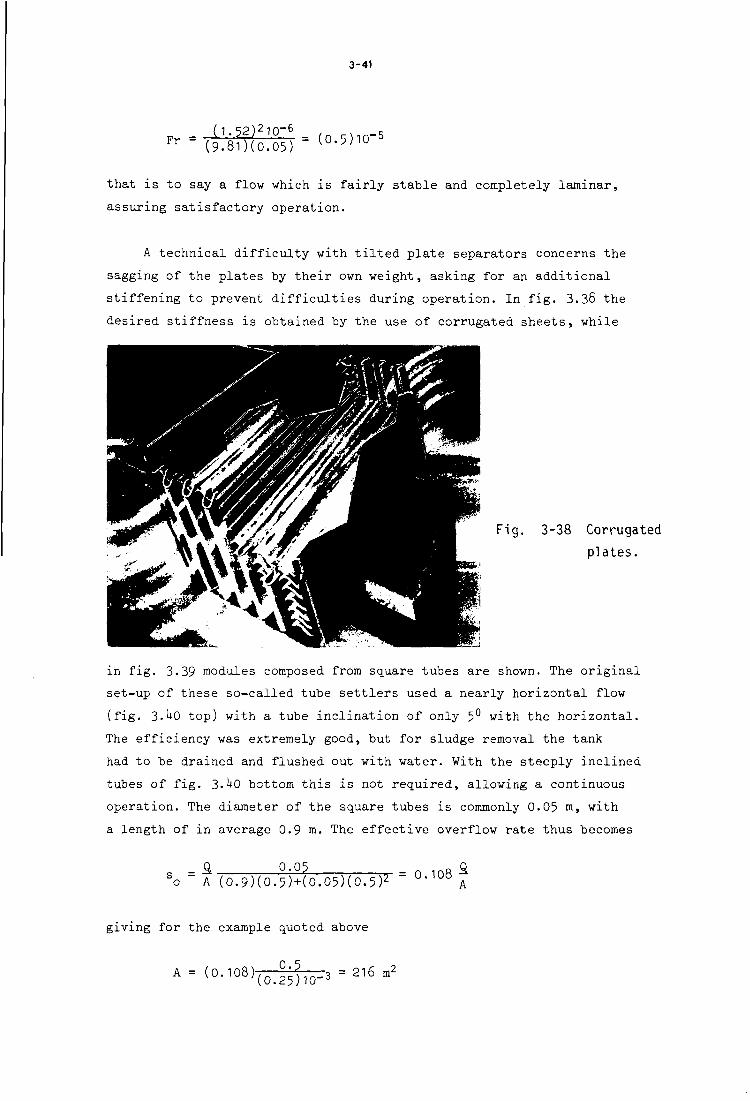
3-41
*-!&??& <°-« 5
that is to say a flow which is fairly stable and completely laminar,
assuring satisfactory operation.
A technical difficulty with tilted plate separators concerns the
sagging of the plates by their own weight, asking for an additional
stiffening to prevent difficulties during operation. In fig. 3.38 the
desired stiffness is obtained by the use of corrugated sheets, while
Fig. 3-38 Corrugated
plates.
in fig. 3.39 modules composed from square tubes are shown. The original
set-up of these so-called tube settlers used a nearly horizontal flow
(fig. 3. 0 top) with a tube inclination of only 5° with the horizontal.
The efficiency was extremely good, but for sludge removal the tank
had to be drained and flushed out with water. With the steeply inclined
tubes of fig. 3. 0 bottom this is not required, allowing a continuous
operation. The diameter of the square tubes is commonly 0.05 m, with
a length of in average 0.9 m. The effective overflow rate thus becomes
So " A (0.9)(0.5)+(0.05)(0.5)2 " °'1°B A
giving for the example quoted above
0-5 A = ( o - i o 8 ) ( o . 2 ; ) i o - 3 = 2 i 6 m 2

3-42
LMT KXITKWOf f S-TE« 8W RCFIUS TUBES
^ F I W T PORTION OF ' •"»» townsrt
— -»BWTO»STE
(B) STEEPLY INCLINEO TU8E SETTLER
Fig. 3-39 Modules of tube settlers. Fig. 3-40 Basic tube settler configuration.
vo ~ (216H0.866) °'\cc\ - (2.6T)lO"3m/sec
R " (U)(0.O5) " °'°125 m
R e = (2.67)10-3(0.012^) = 2 6
~(1.31) 1 Cn5"
_ (2.67)210-6 _ ,q ftNln_5 F r ~ (9.81)(0.0125) • ( 5- 8 ) l°
assuring not only laminar but also a completely stable flow.
The use of trays, tilted plates or inclined tubes is not restricted
to rectangular tanks, also in circular tanks they may be used to
advantage. Fig. 3. *1 shows such a tank into which afterwards tube
modules have been installed to increase the capacity and to raise clarification efficiency.
Experience with tilted plate separators and tube settlers is
still rather limited and mostly concerns experimental plants, not
subject to the whims of strongly varying raw water quality and
desired capacity. In economic respect they are very attractive
indeed, but to quarantee a sound engineering solution, more research
and above all more practical experience are needed.
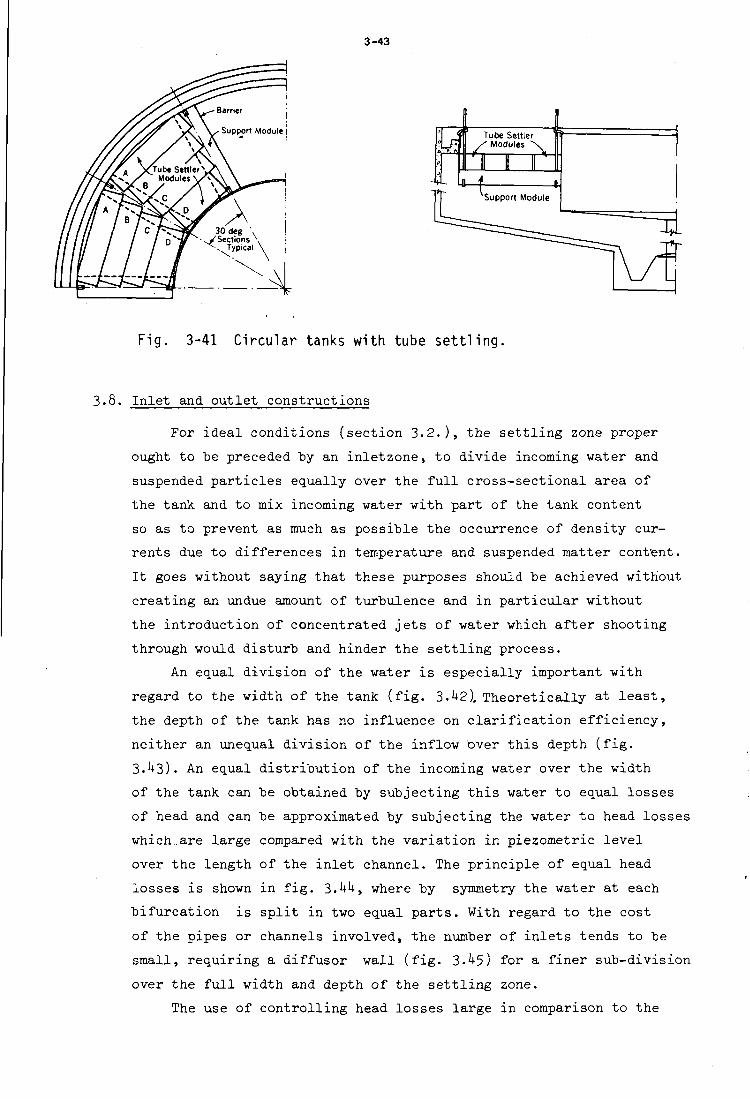
3-43
Fig. 3-41 Circular tanks with tube settling.
3.8. Inlet and outlet constructions
For ideal conditions (section 3.2.), the settling zone proper
ought to be preceded by an inletzone, to divide incoming water and
suspended particles equally over the full cross-sectional area of
the tank and to mix incoming water with part of the tank content
so as to prevent as much as possible the occurrence of density cur
rents due to differences in temperature and suspended matter content.
It goes without saying that these purposes should be achieved without
creating an undue amount of turbulence and in particular without
the introduction of concentrated jets of water which after shooting
through would disturb and hinder the settling process.
An equal division of the water is especially important with
regard to the width of the tank (fig. 3.^2), Theoretically at least,
the depth of the tank has no influence on clarification efficiency,
neither an unequal division of the inflow over this depth (fig.
3.1+3). An equal distribution of the incoming water over the width
of the tank can be obtained by subjecting this water to equal losses
of head and can be approximated by subjecting the water to head losses
which..are large compared with the variation in piezometric level
over the length of the inlet channel. The principle of equal head
losses is shown in fig. 3.1+1+, where by symmetry the water at each
bifurcation is split in two equal parts. With regard to the cost
of the pipes or channels involved, the number of inlets tends to be
small, requiring a diffusor wall (fig. 3. +5) for a finer sub-division
over the full width and depth of the settling zone.
The use of controlling head losses large in comparison to the

3-44
—• — 1
— < So=(0,3)10-3m /sec
So-.0,06 0,18
\ 0,30 A 0,42 A 0,54
r=0,92
r= 1,00 0,98 0,92 0,82 0,72
Fig.
average 0,89
3-42 Plan of tanks with
d i f ferent ef f ic iencies,
(according to f i g . 3-21)
•
5 ; settling V4l zone
I '—T\
—• —» —*
Fig. 3-43 Longitudinal section over tanks
with equal efficiency.
diffusor wal
Fig. 3-44 Inletconstruction with equal losses of head.
Fig. 3-45 Diffusor wall
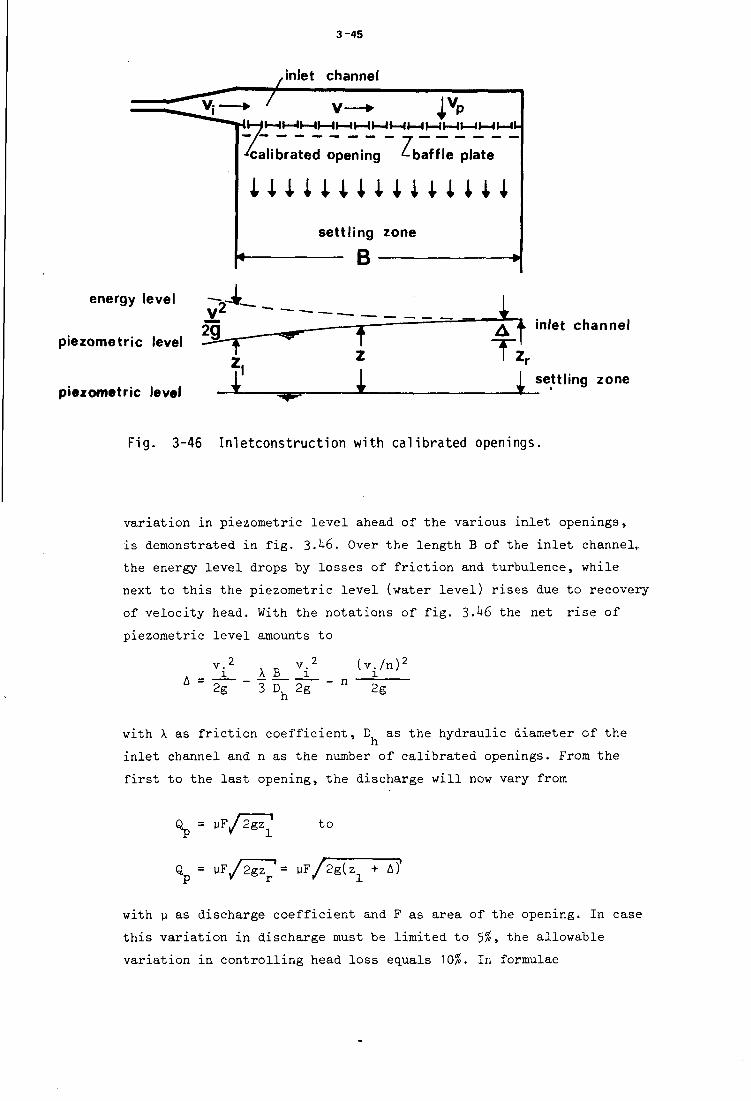
3-45
inlet channel
calibrated opening ^-baffle plate
l U i U H i i U H J settling zone
B
energy level ~~b-*L_ I v ~~ ~ " • +
2Q ___—--~ Z " ' A 'f 'n ' e t channel
~ ^ \ ^ 2 T2 | . I I I settling
piezometric level
piezometric level zone
Fig. 3-46 Inletconstruction with calibrated openings,
variation in piezometric level ahead of the various inlet openings,
is demonstrated in fig. 3.^6. Over the length B of the inlet channel,,
the energy level drops by losses of friction and turbulence, while
next to this the piezometric level (water level) rises due to recovery
of velocity head. With the notations of fig. 3. 6 the net rise of
piezometric level amounts to
A = v.* v.-1 i _ A B i_
2g 3 Dh 2g
(v./n)2
""2g
with X as friction coefficient, D, as the hydraulic diameter of the h
inlet channel and n as the number of calibrated openings. From the
first to the last opening, the discharge will now vary from
Q = v?J2gz ' to
Q = uF/2gz '= pF/2g(zn + A)' p v r » 1
with y as discharge coefficient and F as area of the opening. In case
this variation in discharge must be limited to 5%, the allowable
variation in controlling head loss equals 10$. In formulae
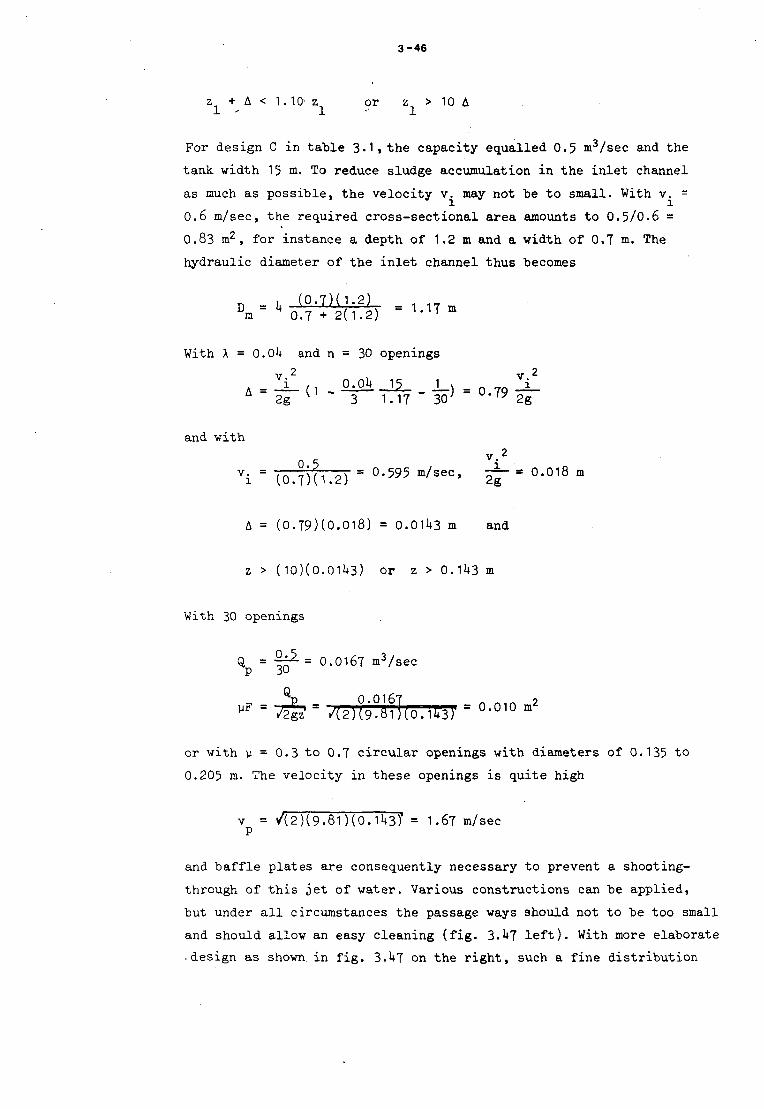
3-46
z + A < 1.10 z or z > 10 A
For design C in table 3• 1 » the capacity equalled 0.5 m3/sec and the
tank width 15m. To reduce sludge accumulation in the inlet channel
as much as possible, the velocity v. may not be to small. With v. =
0.6 m/sec, the required cross-sectional area amounts to 0.5/0.6 =
0.83 m2, for instance a depth of 1.2 m and a width of 0.7 m. The
hydraulic diameter of the inlet channel thus becomes
n - i (0.7H1.2) _ D m " k 0.7 + 2(1.2) ~ 1*1T m
With \ = 0.0U and n = 30 openings
v. 2 , v.2
A - _ i _ n 0-0h ^ L ) - n TO J -A " i T ( 1 - ~ T T i 7 - s o * - ° - 7 9 2T
and with v. 2
Vi = (0.?)(1.2) = ° ' 5 9 5 m / s e C * 2§" " ° - ° 1 8 m
A = (0.79)(0.018) = 0.01U3 m and
z > (10)(0.01U3) or z > 0.1U3 m
With 30 openings
Q = ~^- = 0.0167 m3/sec p 30 Q
VF = T^z1 = ^2 ) (9° i l l (0 . l l 3 ) ' = °-0 1° nr
or with p = 0.3 to 0.7 circular openings with diameters of 0.135 to
0.205 m. The velocity in these openings is quite high
v = /(2)(9.81)(0.1^3)' = 1.67 m/ sec P
and baffle plates are consequently necessary to prevent a shooting-
through of this jet of water. Various constructions can be applied,
but under all circumstances the passage ways should not to be too small
and should allow an easy cleaning (fig. 3.^7 left). With more elaborate
• design as shown in fig. 3.1*7 on the right, such a fine distribution
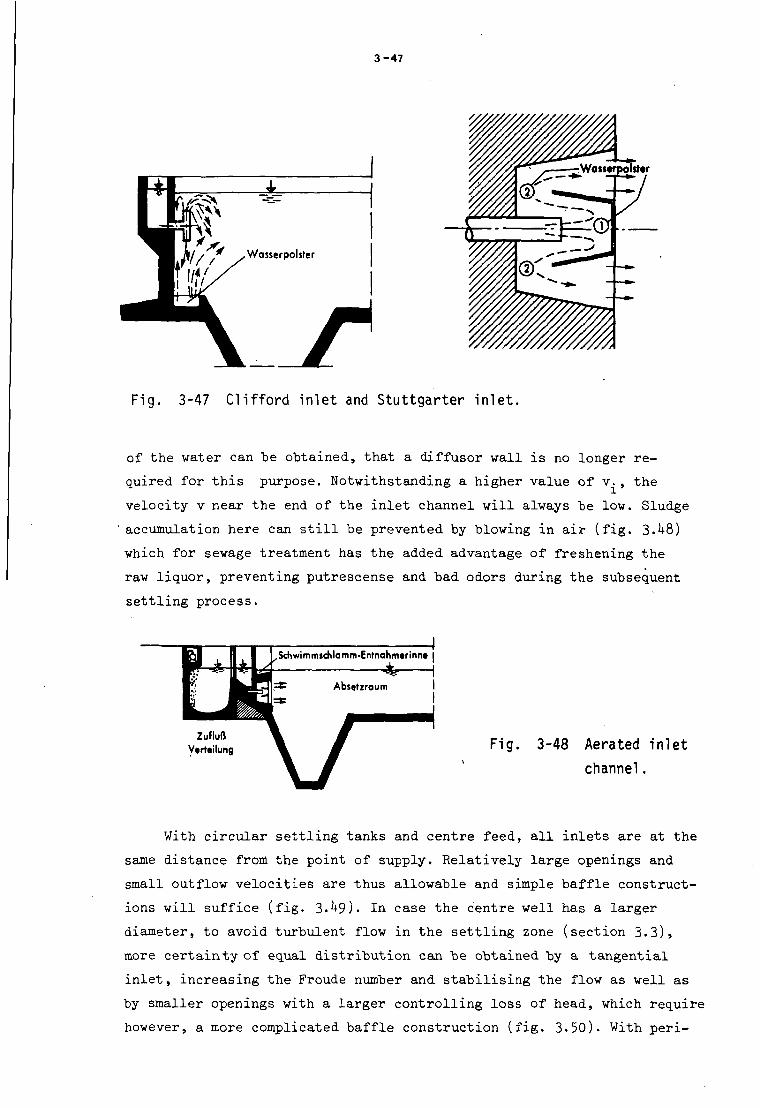
3 - 4 7
/ / ^Wasserpolster
Fig. 3-47 Clifford inlet and Stuttgarter inlet.
of the water can be obtained, that a diffusor wall is no longer re
quired for this purpose. Notwithstanding a higher value of v., the
velocity v near the end of the inlet channel will always be low. Sludge
accumulation here can still be prevented by blowing in air (fig. 3. +8)
which for sewage treatment has the added advantage of freshening the
raw liquor, preventing putrescense and bad odors during the subsequent
settling process.
Zuflufl Vtrteilung Fig. 3-48 Aerated inlet
channel.
With circular settling tanks and centre feed, all inlets are at the
same distance from the point of supply. Relatively large openings and
small outflow velocities are thus allowable and simple baffle construct
ions will suffice (fig. 3-^9). In case the centre well has a larger
diameter, to avoid turbulent flow in the settling zone (section 3.3),
more certainty of equal distribution can be obtained by a tangential
inlet, increasing the Froude number and stabilising the flow as well as
by smaller openings with a larger controlling loss of head, which require
however, a more complicated baffle construction (fig. 3.50). With peri-
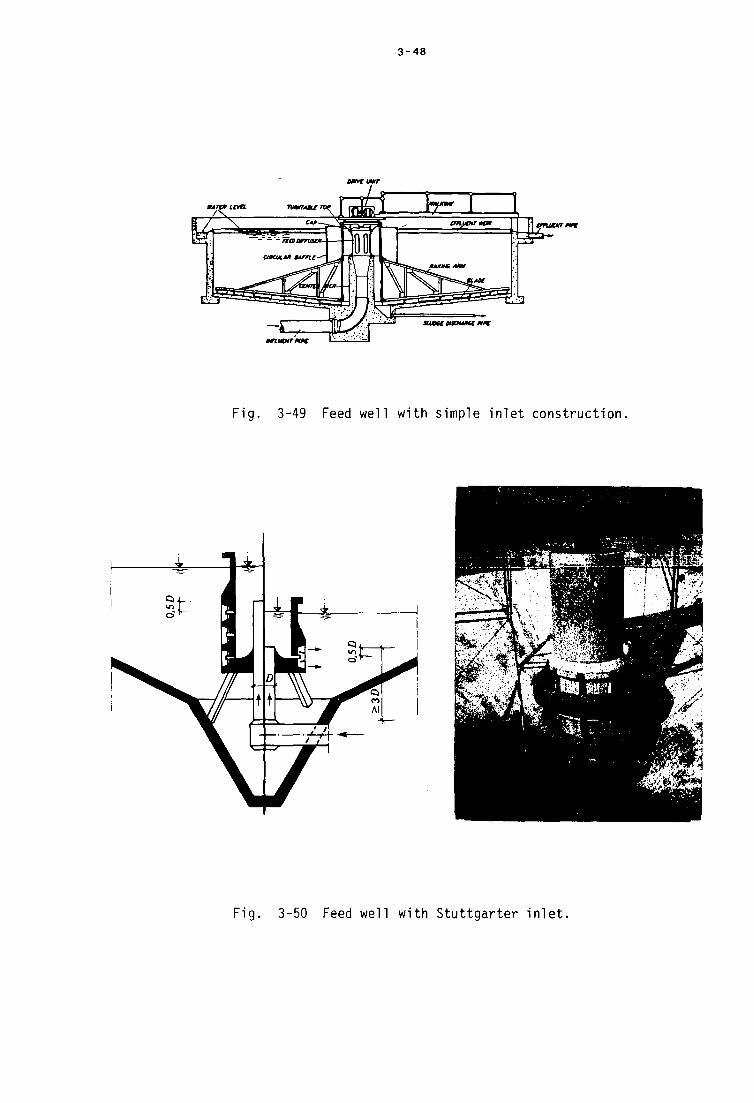
3 - 4 8
l"r* 1 1 tmuotrmrt
aueuasowKturn
mn.uarnrc
Fig. 3-49 Feed well with simple inlet construction.
Fig. 3-50 Feed well with Stuttgarter inlet.
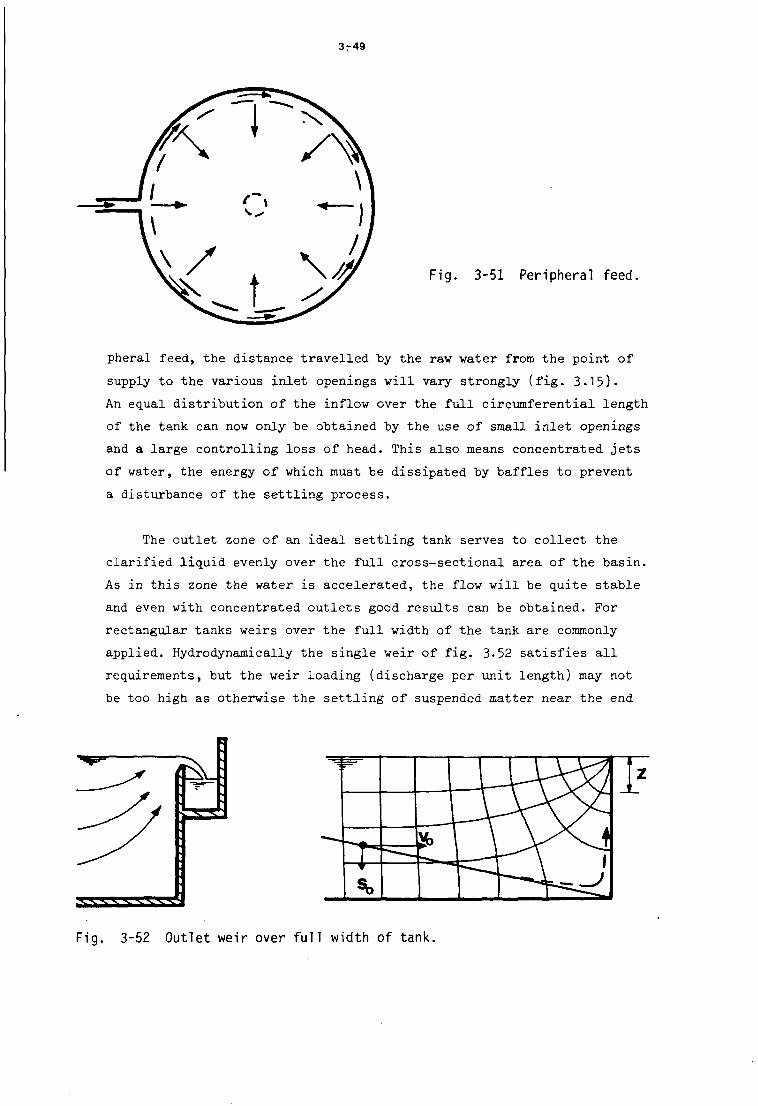
3r49
Fig. 3-51 Peripheral feed.
pheral feed, the distance travelled "by the raw water from the point of
supply to the various inlet openings will vary strongly (fig. 3.15).
An equal distribution of the inflow over the full circumferential length
of the tank can now only be obtained by the use of small inlet openings
and a large controlling loss of head. This also means concentrated jets
of water, the energy of which must be dissipated by baffles to prevent
a disturbance of the settling process.
The outlet zone of an ideal settling tank serves to collect the
clarified liquid evenly over the full cross-sectional area of the basin.
As in this zone the water is accelerated, the flow will be quite stable
and even with concentrated outlets good results can be obtained. For
rectangular tanks weirs over the full width of the tank are commonly
applied. Hydrodynamically the single weir of fig. 3.52 satisfies all
requirements, but the weir loading (discharge per unit length) may not
be too high as otherwise the settling of suspended matter near the end
^
ss
s s s s s s ^
Fig. 3-52 Outlet weir over full width of tank.
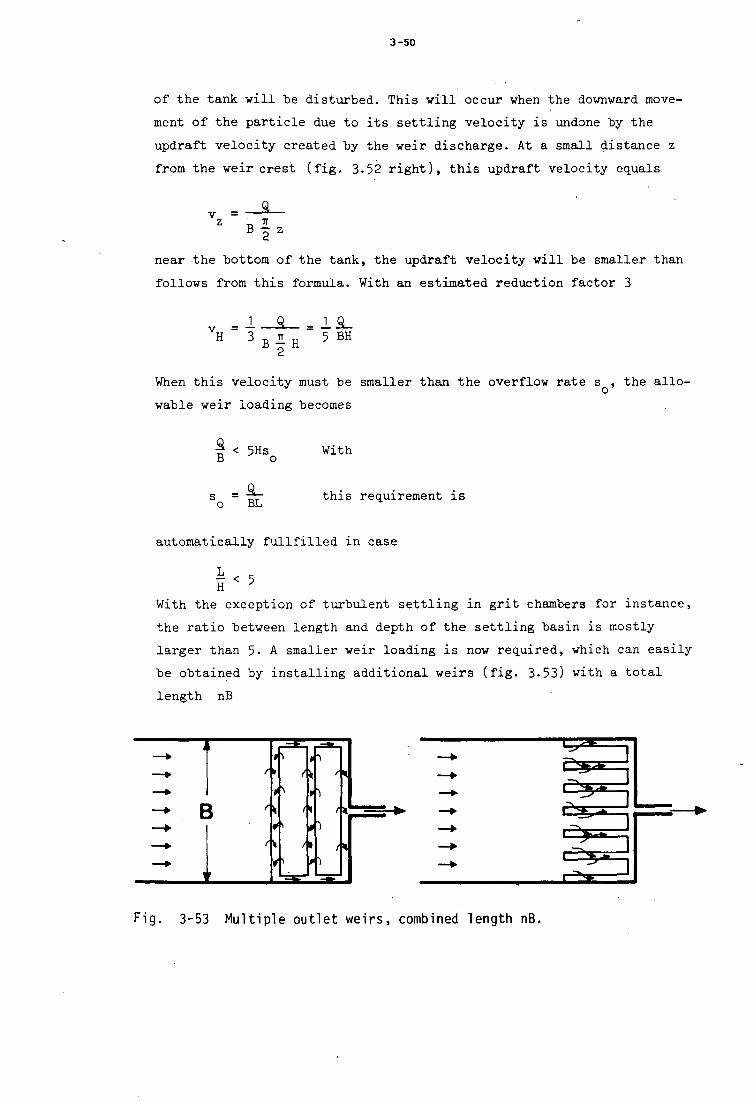
3-50
of the tank will be disturbed. This will occur when the downward move
ment of the particle due to its settling velocity is undone by the
updraft velocity created by the weir discharge. At a small distance z
from the weir crest (fig. 3-52 right), this updraft velocity equals
v = z _§_
B f z
near the bottom of the tank, the updraft velocity will be smaller than
follows from this formula. With an estimated reduction factor 3
_ 1 Q _ J. ji_ VH 3 fi JT H 5 BH
When this velocity must be smaller than the overflow rate s , the allo
wable weir loading becomes
! < *•„ With
o BL this requirement is
automatically fullfilled in case
§ < 5 With the exception of turbulent settling in grit chambers for instance,
the ratio between length and depth of the settling basin is mostly
larger than 5- A smaller weir loading is now required, which can easily
be obtained by installing additional weirs (fig. 3-53) with a total
length nB
B /I
0-)
/»
1 ^
1 •»**
Fig. 3-53 Mult iple outlet weirs, combined length nB.

3-51
nB o
In des ign C of t a b l e 3 . 1 , Q = 0 .5 m 3 / s e c , B
s = ( 0 . 3 7 ) 1 0 - 3 ra/sec. S u b s t i t u t e d
= 15 m, H = 2 m and
^J5)< (5)(2)(0.37)10-3 or n > 9
that is to say a total weir length of 135 m and a weir loading of
(3.7)10-3 m/sec.
With circular tanks and centre feed, a single weir around the
outer circumference will be adequate when
% « 5Hs TTD O or < 20
which mostly will be the case. If not, multiple weirs are necessary,
for instance as shown in fig. 3.5^- With peripheral feed, the updraft
velocities near the points of discharge in the centre of the tank will
3600 ~H
Fig. 3-54 Multiple outlet weirs in circular tanks with centre feed.
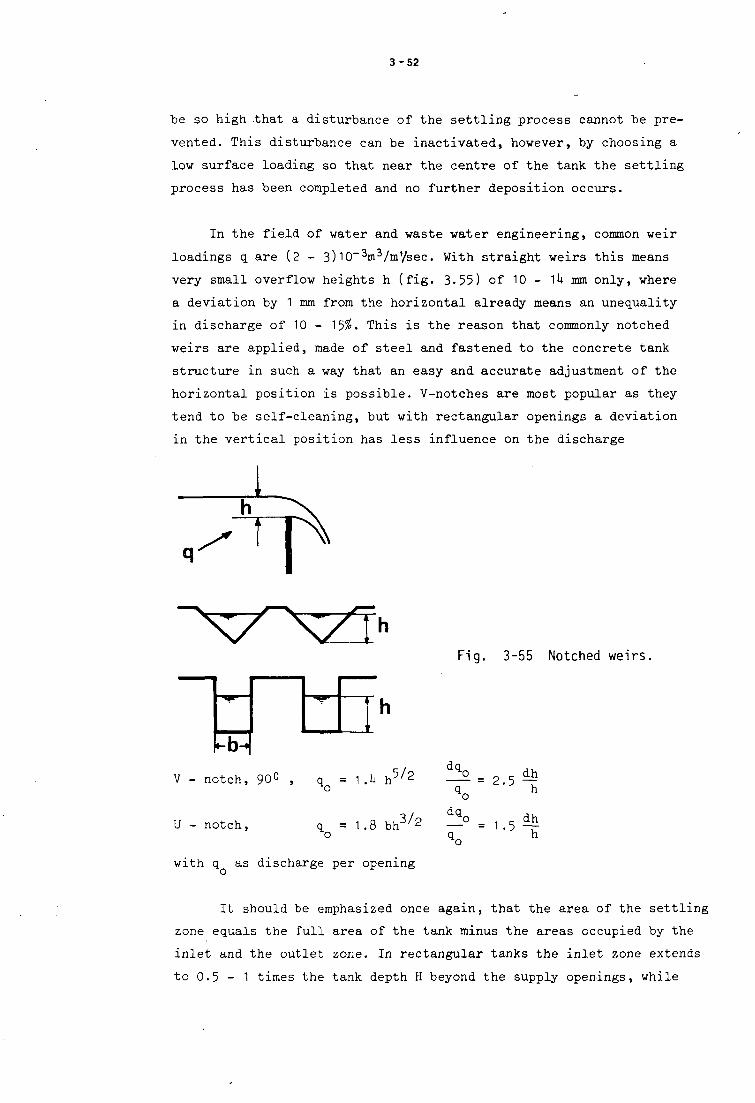
3-52
be so high that a disturbance of the settling process cannot be pre
vented. This disturbance can be inactivated, however, by choosing a
low surface loading so that near the centre of the tank the settling
process has been completed and no further deposition occurs.
In the field of water and waste water engineering, common weir
loadings q. are (2 - 3)10-3m3/mysec. With straight weirs this means
very small overflow heights h (fig. 3-55) of 10 - *\k mm only, where
a deviation by 1 mm from the horizontal already means an unequality
in discharge of 10 - 15%. This is the reason that commonly notched
weirs are applied, made of steel and fastened to the concrete tank
structure in such a way that an easy and accurate adjustment of the
horizontal position is possible. V-notches are most popular as they
tend to be self-cleaning, but with rectangular openings a deviation
in the vertical position has less influence on the discharge
q
V - notch, 90° , q = 1 .1* h 5/2
U - notch, q = 1.8 bh o
with q as discharge per opening
Fig. 3-55 Notched weirs.
a<L.
dcL. 3/2 _ <
2.5
1.5
dh h
dh h
It should be emphasized once again, that the area of the settling
zone equals the full area of the tank minus the areas occupied by the
inlet and the outlet zone. In rectangular tanks the inlet zone extends
to 0.5 - 1 times the tank depth H beyond the supply openings, while
3-53
the outlet zone begins at a distance of about the tank depth ahead of
the first discharge weir.
3.9. Sludge removal and skimming devices
During the settling process, the suspended particles heavier
than water accumulate in the sludge zone at the bottom of the tank,
from which they are removed periodically or more or less continu
ously, depending on local circumstances. Removal at intervals is
only possible when the volume of the suspended matter retained is
not too large and when this material is stable, not subject to
putrefaction. These conditions are often fullfilled in the field
of public and industrial water supply engineering, where the tur
bidity of the river water is rather low and entirely due to mineral
soil particles. In the example dealt with in fig. 3.10, the maximum
sludge accumulation amounts to (+5. 5) 10—3 grams/m2/sec and with an
assumed water content of 95% to about (900)10-9 m3/m2/sec or per
month (2.6 million seconds) a thickness of 2.3 m. When an adequate
tank depth is provided, for instance in this case 3.5 m over the
first 20 m length of the tank, cleaning may be done at intervals
of about U weeks. Most effectively this cleaning can be achieved
by cutting the tank out of service and dewatering, after which the
sludge is flushed with pressure water taken from hydrants to a hopper
at the inlet end of the tank, from which it is subsequently removed
by gravity or by pumping. To facilitate this hydraulic cleaning,
the tank bottom should slope in two directions and be provided
with a longitudinal channel as indicated'in fig. 3-56. With the excep
tion of the hydrants around the rim of the basin, this manual cleaning
does not ask for additional equipment. As such it is cheap in cost
of construction, but expensive in terms of labor. This is the reason
that it is not longer applied in western-type countries. When here
periodic cleaning is to be used, it is mostly done with some kind of
mechanical equipment such as the suction dredger of figs. 3.57 and
3.58
Continuous sludge removal is a necessity when sludge volumes
are large or the sludge is unstable, resulting in anaerobic decom
position during storage in the sludge zone. By this process taste
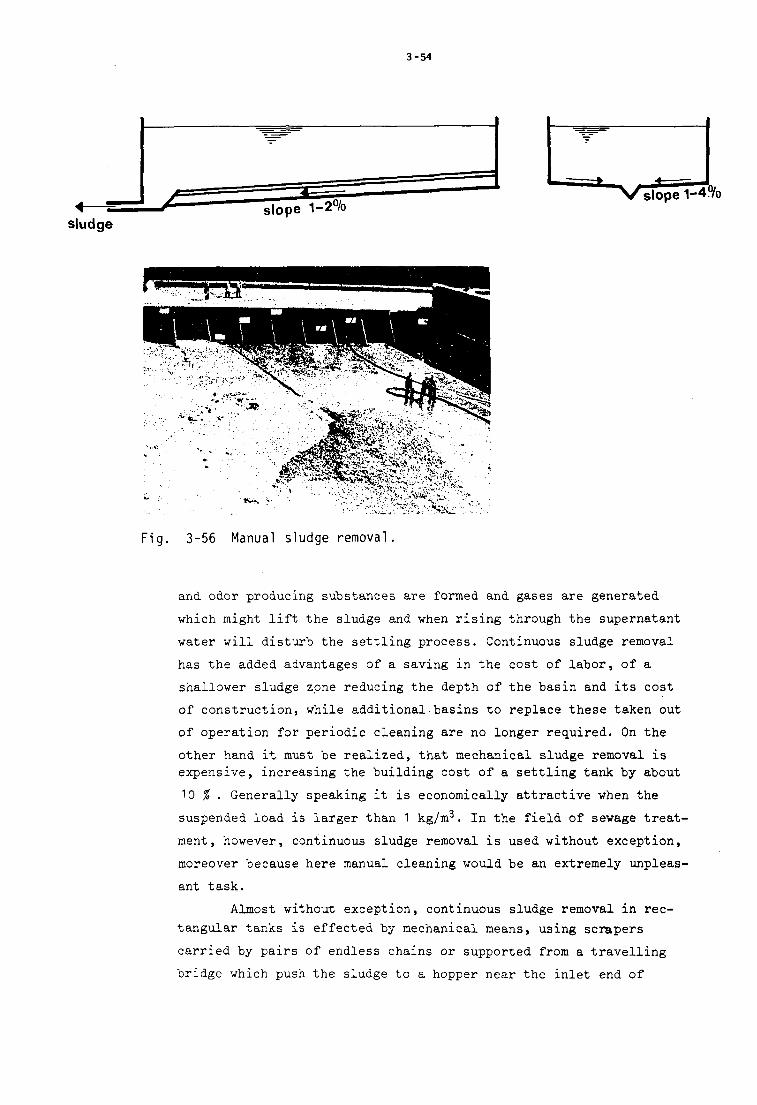
3-54
sludge slope 1-2%
'•&*+
•fir* r i N « E < * s « A ?* ^ /•••
i. 1
Fig. 3-56 Manual sludge removal
and odor producing substances are formed and gases are generated
which might lift the sludge and when rising through the supernatant
water will disturb the settling process. Continuous sludge removal
has the added advantages of a saving in the cost of labor, of a
shallower sludge zpne reducing the depth of the basin and its cost
of construction, while additional basins to replace these taken out
of operation for periodic cleaning are no longer required. On the
other hand it must be realized, that mechanical sludge removal is expensive, increasing the building cost of a settling tank by about
10 % . Generally speaking it is economically attractive when the
suspended load is larger than 1 kg/m3. In the field of sewage treat
ment , however, continuous sludge removal is used without exception,
moreover because here manual cleaning would be an extremely unpleas
ant task.
Almost without exception, continuous sludge removal in rec
tangular tanks is effected by mechanical means, using scrapers
carried by pairs of endless chains or supported from a travelling
bridge which push the sludge to a hopper near the inlet end of
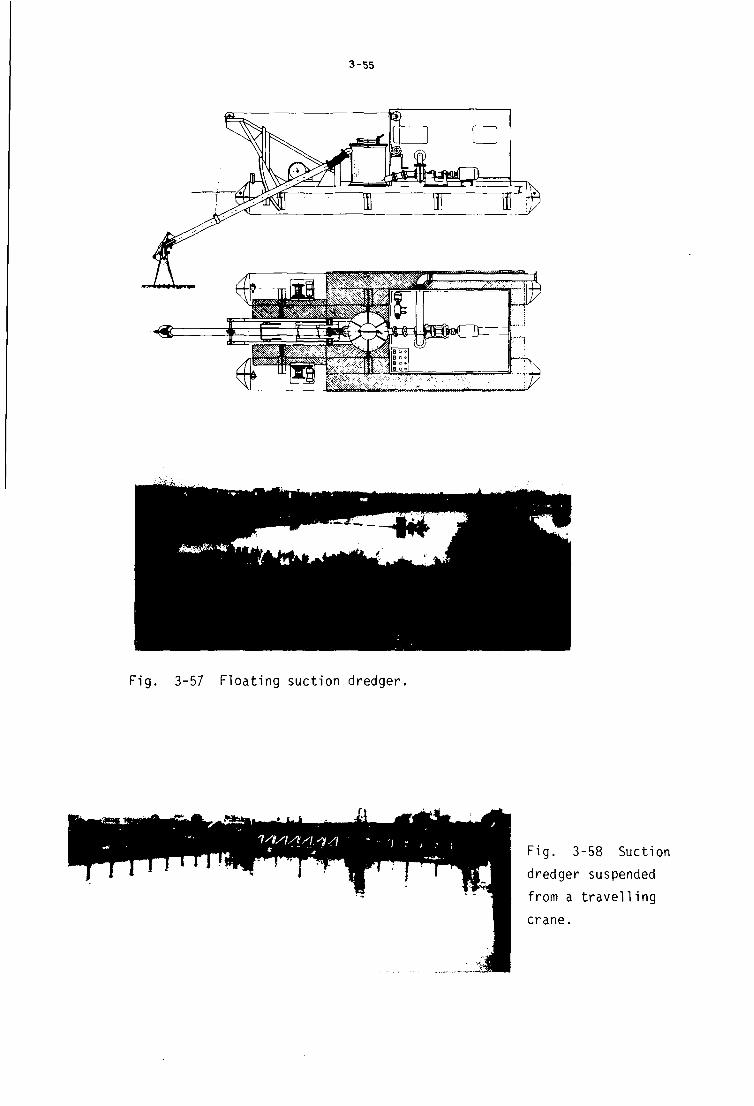
3-55
.sdHS***''*"
Fig. 3-57 Floating suction dredger.
Fig. 3-58 Suction
dredger suspended
from a travelling
crane.
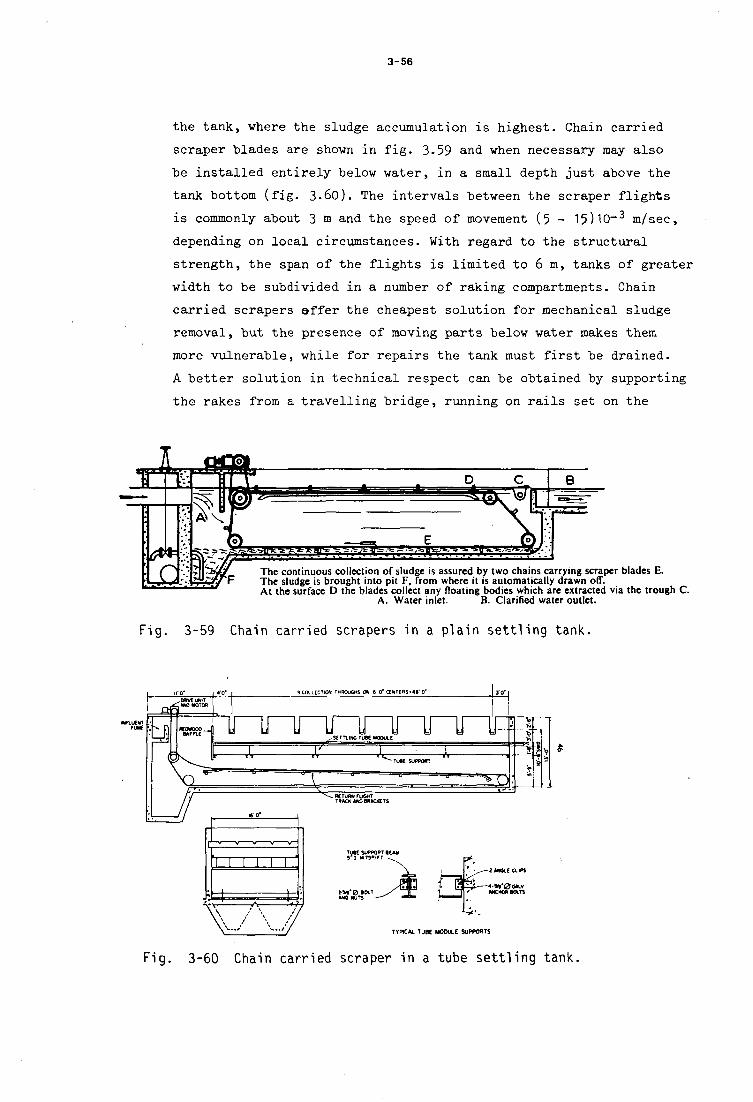
3-56
the tank, where the sludge accumulation is highest. Chain carried
scraper blades are shown in fig. 3.59 and when necessary may also
be installed entirely below water, in a small depth just above the
tank bottom (fig. 3-60). The intervals between the scraper flights
is commonly about 3 m and the speed of movement (5 - 15)10-3 m/sec,
depending on local circumstances. With regard to the structural
strength, the span of the flights is limited to 6 m, tanks of greater
width to be subdivided in a number of raking compartments. Chain
carried scrapers effer the cheapest solution for mechanical sludge
removal, but the presence of moving parts below water makes them
more vulnerable, while for repairs the tank must first be drained.
A better solution in technical respect can be obtained by supporting
the rakes from a travelling bridge, running on rails set on the
The continuous collection of sludge is assured by two chains carrying scraper blades E. The sludge is brought into pit F, from where it is automatically drawn off. At the surface D the blades collect any floating bodies which are extracted via the trough C.
A. Water inlet. B. Clarified water outlet.
Fig. 3-59 Chain carried scrapers in a plain settling tank.
-B&
tj
9COLLECTtQH THRQUCHS OH 6 '0* gNTERS-4>"0'
3
TYPICAL TUBE M00U.E SUPPOHTS
Fig. 3-60 Chain carried scraper in a tube settling tank.

3-57
longitudinal walls of the tank (fig. 3-61). Cleaning nov only occurs
when the carriage moves back to the inlet, asking for somewhat higher
speeds of (10 - 50)10~3 m/sec, but the equipment is always accessible
for maintenance and repairs, the scraper blades after they have been
lifted out of the water. To facilitate the movement of sludge, the
bottom of the tank may be constructed with a longitudinal slope of
1% or more when possible.
- turn mem use uumi - iiuitii tin
iiriidi (iiiiu
•id norms (lllilCt 1*11
citmci (inn
ennui m»
Fig. 3-61 Rakes suspended
from a travelling bridge.
Mechanical sludge removal in circular tanks is of the rotating
type, having radial arms to which the scraper blades are fastened
at an angle so as to move the sludge to a hopper in the centre. Formerly
the whole construction was below water (fig. 3.62), subject to additio
nal wear and bear. Nowadays the rakes are suspended from a revolving
Fig. 3-62 Rotating sludge
scrapers below water.
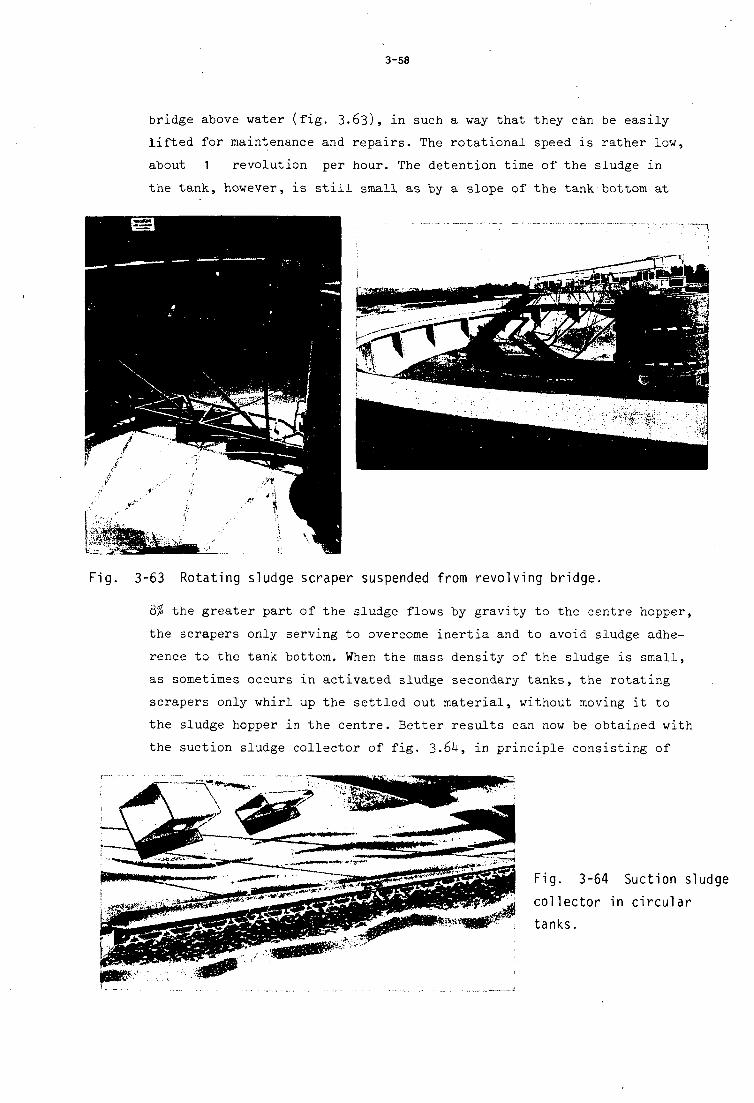
3-58
bridge above water (fig. 3.63), in such a way that they can be easily
lifted for maintenance and repairs. The rotational speed is rather low,
about 1 revolution per hour. The detention time of the sludge in
the tank, however, is still small as by a slope of the tank bottom at
Fig. 3-63 Rotating sludge scraper suspended from revolving bridge.
8% the greater part of the sludge flows by gravity to the centre hopper,
the scrapers only serving to overcome inertia and to avoid sludge adhe
rence to the tank bottom. When the mass density of the sludge is small,
as sometimes occurs in activated sludge secondary tanks, the rotating
scrapers only whirl up the settled out material, without moving it to
the sludge hopper in the centre. Better results can now be obtained with
the suction sludge collector of fig. 3.6^, in principle consisting of
Fig. 3-64 Suction sludge
collector in circular
tanks.
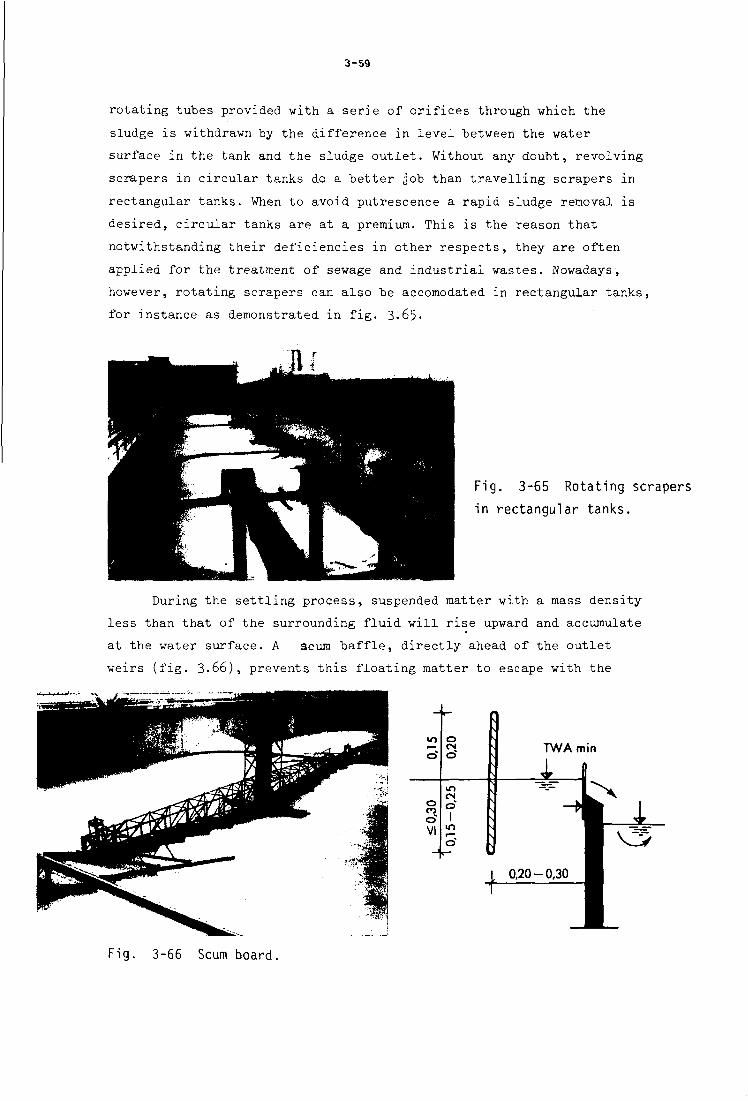
3-59
rotating tubes provided with a serie of orifices through which the
sludge is withdrawn "by the difference in level between the water
surface in the tank and the sludge outlet. Without any doubt, revolving
scrapers in circular tanks do a better job than travelling scrapers in
rectangular tanks. When to avoid putrescence a rapid sludge removal is
desired, circular tanks are at a premium. This is the reason that
notwithstanding their deficiencies in other respects, they are often
applied for the treatment of sewage and industrial wastes. Nowadays,
however, rotating scrapers can also be accomodated in rectangular tanks,
for instance as demonstrated in fig. 3.65.
Fig. 3-65 Rotating scrapers
in rectangular tanks.
During the settling process, suspended matter with a mass density
less than that of the surrounding fluid will rise upward and accumulate
at the water surface. A acum baffle, directly ahead of the outlet
weirs (fig. 3.66), prevents this floating matter to escape with the
o CO
o* VI
o CN
m CN
I m
II TWAmin
i
0,20-0,30
Fig. 3-66 Scum board.
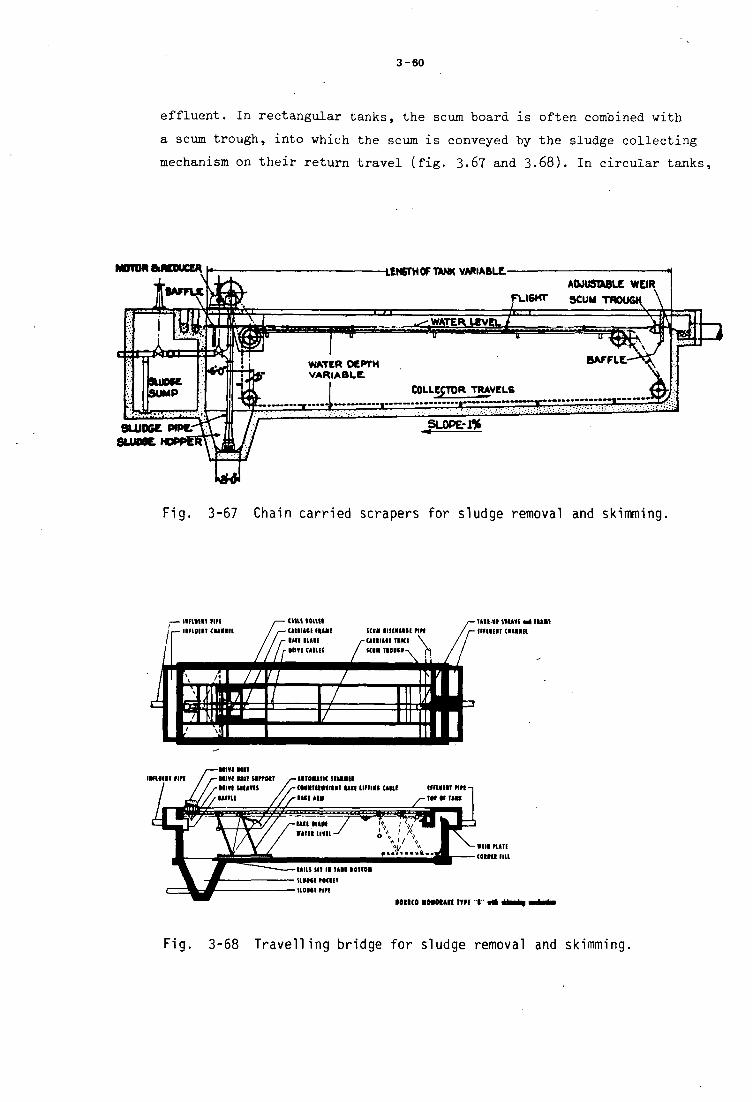
3-60
effluent. In rectangular tanks, the scum board is often combined, with
a scum trough, into which the scum is conveyed by the sludge collecting
mechanism on their return travel (fig. 3.67 and 3.68). In circular tanks,
MOTOR frRCDUCER tENSTHOFTANK VARIABLE ADJUSTABLE WEIR
rU6KT SCUM
WATER LEVEL
COLLECTOR TRAVELS
SLUDGE WPfc 8LUME
SLOPEri*
Fig. 3-67 Chain carried scrapers for sludge removal and skimming.
— iiimu mi r- illloll! ( u m i
i cmi Kim cuiiici fu« •in I U I I •mi emu L
icga oisntiii nn ( l l l l l t l TIKI \ KM IIOIID
im-ir H U M m* itui I IHI I I I CWttll
HIICO I H N I H TTH '•"
Fig. 3-68 Travelling bridge for sludge removal and skimming.
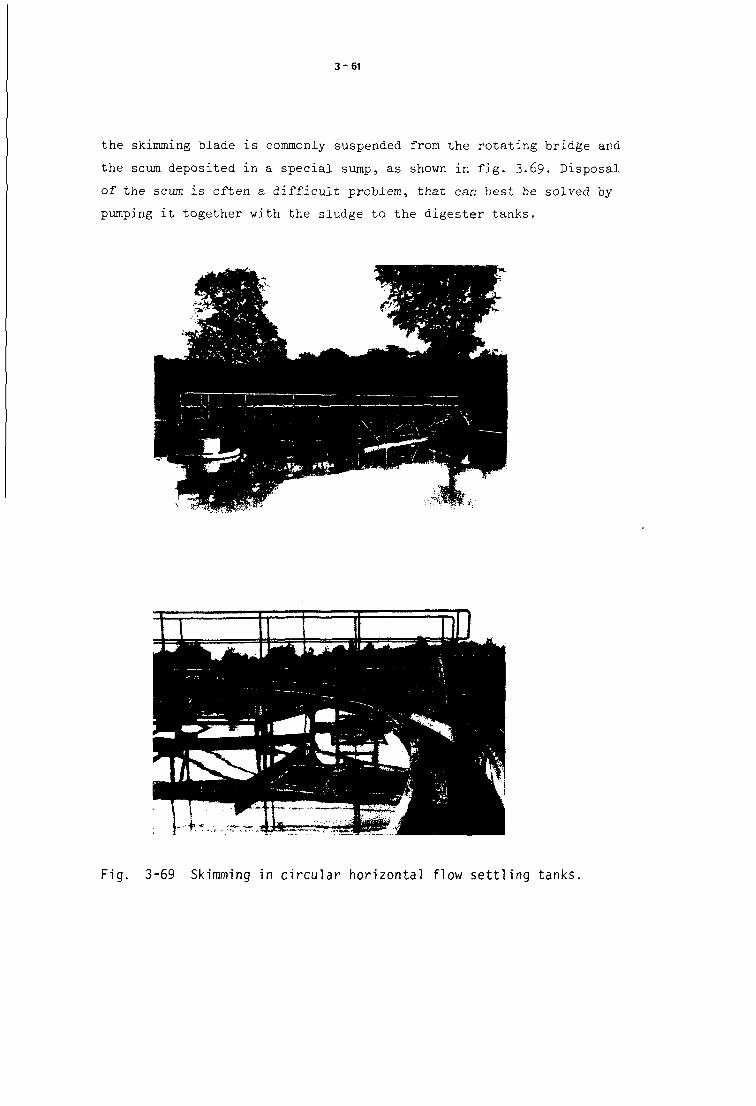
3-61
the skimming blade is commonly suspended from the rotating bridge and
the scum deposited in a special sump, as shown in fig. 3.69. Disposal
of the scum is often a difficult problem, that can best be solved by
pumping it together with the sludge to the digester tanks.
Fig. 3-69 Skimming in circular horizontal flow settling tanks.

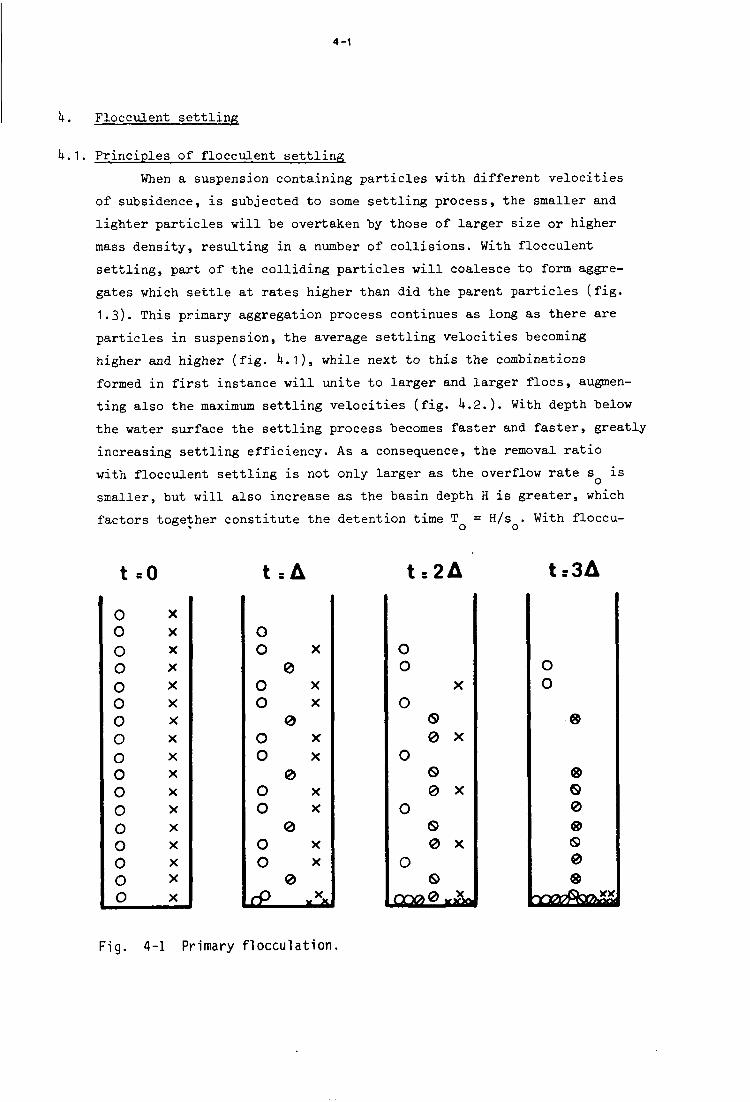
4-1
k. Flocculent settling
k.1. Principles of flocculent settling
When a suspension containing particles vith different velocities
of subsidence, is subjected to some settling process, the smaller and
lighter particles will he overtaken by those of larger size or higher
mass density, resulting in a number of collisions. With flocculent
settling, part of the colliding particles will coalesce to form aggre
gates which settle at rates higher than did the parent particles (fig.
1.3). This primary aggregation process continues as long as there are
particles in suspension, the average settling velocities becoming
higher and higher (fig. ^.1), while next to this the combinations
formed in first instance will unite to larger and larger floes, augmen
ting also the maximum settling velocities (fig. ^.2.). With depth below
the water surface the settling process becomes faster and faster, greatly
increasing settling efficiency. As a consequence, the removal ratio
with flocculent settling is not only larger as the overflow rate s is
smaller, but will also increase as the basin depth H is greater, which
factors together constitute the detention time T = H/s . With floccu-• 0 0
t =0 t:A t-.2A
0 0 0 0 0 0 0 0 0 0 0 0 0 0 0 0 0
X
X X
X
X
X X
X
X X
X X
X X X X
X
0 0
0 0
0 0
0 0
0 0
fp
X
e> X X
0 X
X
0 X X
0 X X
0 X
V X
0 0
X
0 <s> 0 X
0 0 0 X
0 ® 0 X
0 0
OO00*&*
0 0
0
0 G 0 0 G 0 0
^npcfotf&St
t=3A
Fig. 4-1 Primary flocculation.
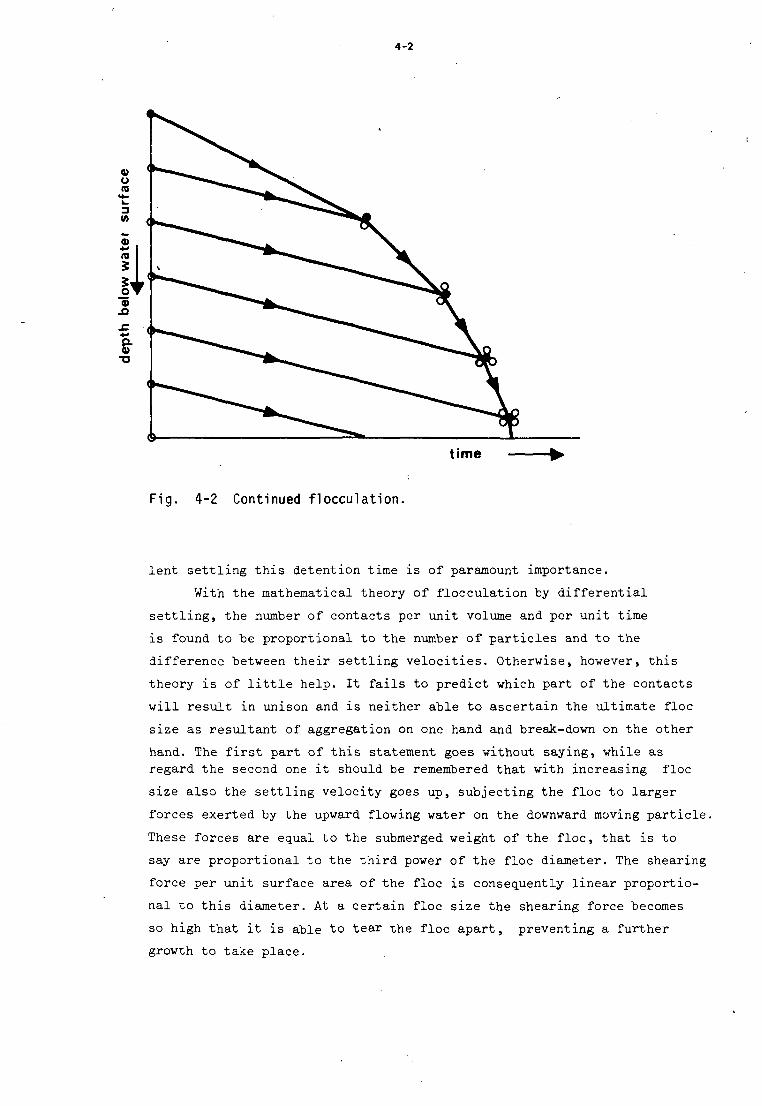
Fig. 4-2 Continued flocculation.
lent settling this detention time is of paramount importance.
With the mathematical theory of flocculation by differential
settling, the number of contacts per unit volume and per unit time
is found to be proportional to the number of particles and to the
difference between their settling velocities. Otherwise, however, this
theory is of little help. It fails to predict which part of the contacts
will result in unison and is neither able to ascertain the ultimate floe
size as resultant of aggregation on one hand and break-down on the other
hand. The first part of this statement goes without saying, while as regard the second one it should be remembered that with increasing floe
size also the settling velocity goes up, subjecting the floe to larger
forces exerted by the upward flowing water on the downward moving particl
These forces are equal to the submerged weight of the floe, that is to
say are proportional to the third power of the floe diameter. The shearin
force per unit surface area of the floe is consequently linear proportio
nal to this diameter. At a certain floe size the shearing force becomes
so high that it is able to tear the floe apart, preventing a further
growth to take place.
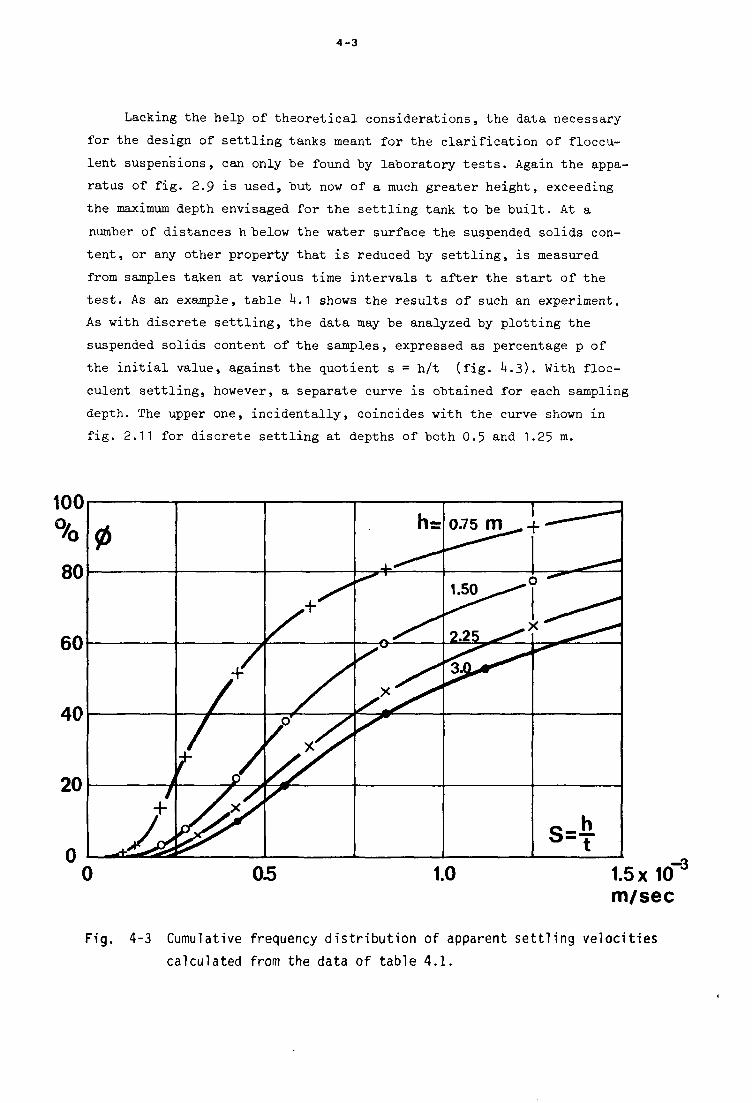
4-3
Lacking the help of theoretical considerations, the data necessary
for the design of settling tanks meant for the clarification of floccu-
lent suspensions, can only be found by laboratory tests. Again the appa
ratus of fig. 2.9 is used, but now of a much greater height, exceeding
the maximum depth envisaged for the settling tank to be built. At a
number of distances h below the water surface the suspended solids con
tent, or any other property that is reduced by settling, is measured
from samples taken at various time intervals t after the start of the
test. As an example, table ^.1 shows the results of such an experiment.
As with discrete settling, the data may be analyzed by plotting the
suspended solids content of the samples, expressed as percentage p of
the initial value, against the quotient s = h/t (fig. U.3). With floc-
culent settling, however, a separate curve is obtained for each sampling
depth. The upper one, incidentally, coincides with the curve shown in
fig. 2.11 for discrete settling at depths of both 0.5 and 1.25 m.
0 05 1.0 1.5 x 10 m/sec
Fig. 4-3 Cumulative frequency distribution of apparent settling velocities
calculated from the data of table 4.1.
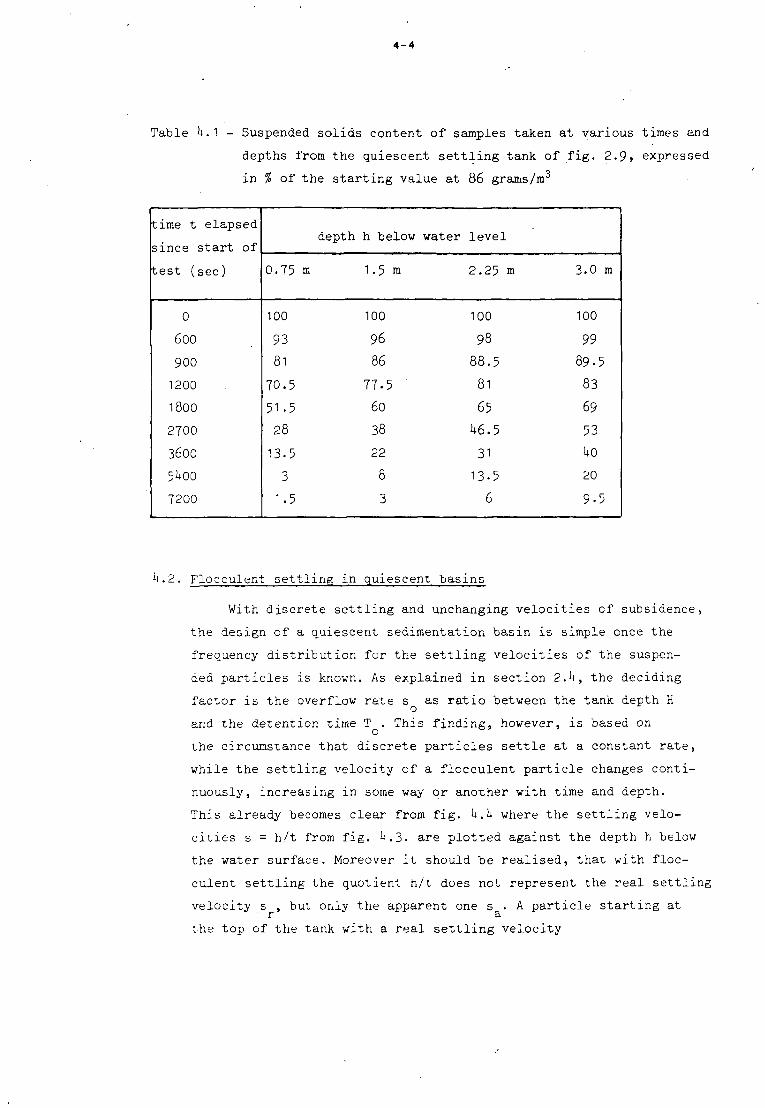
4-4
Table U.1 - Suspended solids content of samples taken at various times and
depths from the quiescent settling tank of fig. 2.9, expressed
in % of the starting value at 86 grams/m
time t elapsed
since start of
test (sec)
0
600
900
1200
1800
2T00
3600
5 +00
7200
0.75 m
100
93
81
70.5
51.5
28
13.5
3
1.5
depth h below water level
1.5 m
100
96
86
77.5
60
38
22
8
3
2.25 m
100
98
88.5
81
65
U6.5
31
13-5
6
3.0 m
100
99
89-5
83
69
53
ko 20
9-5
k.2. Flocculent settling in quiescent basins
With discrete settling and unchanging velocities cf subsidence,
the design of a quiescent sedimentation basin is simple once the
frequency distribution for the settling velocities of the suspen
ded particles is known. As explained in section 2.h, the deciding
factor is the overflow rate s as ratio between the tank depth H
and the detention time T . This finding, however, is based on
the circumstance that discrete particles settle at a constant rate,
while the settling velocity cf a flocculent particle changes conti
nuously, increasing in some way or another with time and depth.
This already becomes clear from fig. k.h where the settling velo
cities s = h/t from fig. k.3. are plotted against the depth h below
the water surface. Moreover it should be realised, that with floc
culent settling the quotient h/t does not represent the real settling
velocity s , but only the apparent one s . A particle starting at r a
the top of the tank with a real settling velocity
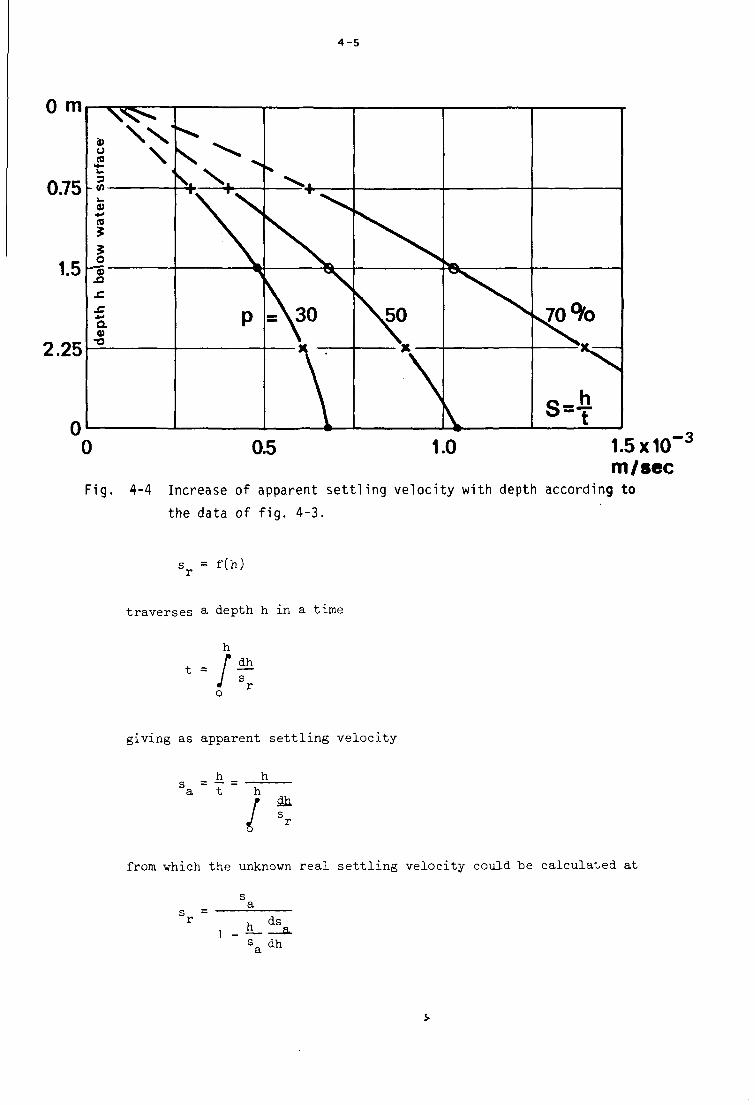
4-5
0 m
1.5x10 m/sec
Fig. 4-4 Increase of apparent settling velocity with depth according to
the data of fig. 4-3.
-3
s = f(h) r
traverses a depth h in a time
t = ff « r
giving as apparent settling velocity
h h a t h
/ s
from which the unknown real settling velocity could be calculated at
s r 1 _ h _ ^
~ sadh
J.
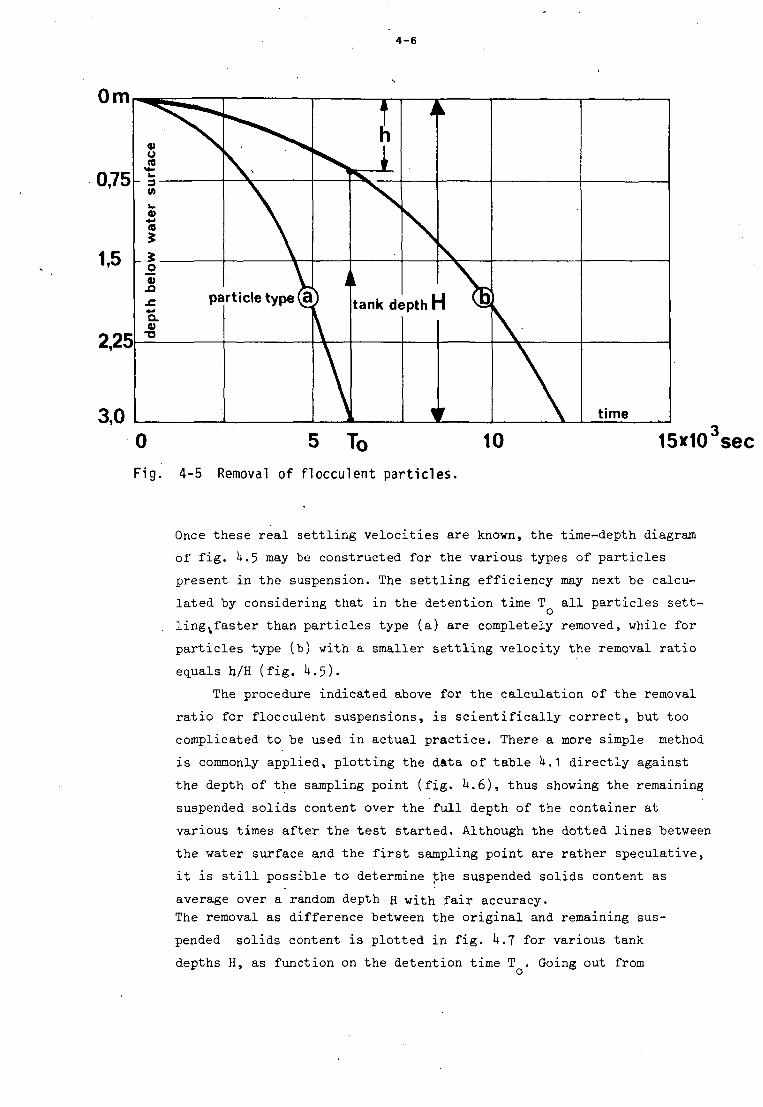
4-6
Om
0,75
1,5 -
2.25
3,0
face
3 (0 w 4) (0 $ $ O 0)
.C
Q. 0)
• - o
•
t h
\ J
iL particle type (a)
A
tank depth H ^S|
V time
0 5 To Fig. 4-5 Removal of flocculent particles.
10 15x10 sec
Once these real settling velocities are known, the time-depth diagram
of fig. U.5 may be constructed for the various types of particles
present in the suspension. The settling efficiency may next be calcu
lated by considering that in the detention time T all particles sett
ling vf aster than particles type (a) are completely removed, while for
particles type (b) with a smaller settling velocity the removal ratio
equals h/H (fig. U.5).
The procedure indicated above for the calculation of the removal
ratio for flocculent suspensions, is scientifically correct, but too
complicated to be used in actual practice. There a more simple method
is commonly applied, plotting the data of table U.1 directly against
the depth of the sampling point (fig. h.6), thus showing the remaining
suspended solids content over the full depth of the container at
various times after the test started. Although the dotted lines between
the water surface and the first sampling point are rather speculative,
it is still possible to determine the suspended solids content as
average over a random depth H with fair accuracy.
The removal as difference between the original and remaining sus
pended solids content is plotted in fig. ^.7 for various tank
depths H, as function on the detention time T . Going out from
4-7
0 0,75 1 1,5 2 2,25 3m Fig. 4-6 Concentration remaining in suspension at various times and depths.
30
%
80
601—^
40
20
0
1
rem
oval
n
ll// / /
>
A V ^
7% p
detention I time IQ
- 3 8x10 m/sec
Fig. 4-7 Removal ratio as function of detention time for various tank depths.
4 - 8
100
80 h
60
40
20
rem
oval
r< \i>\//
v \ ^ ^ ^
r
s-t! o"T0
0,5 1,0 1,5x10 m/sec
Fig. 4-8 Removal ratio as function of overflow rate for various tank depths.
this diagram, the removal ratio as function of the overflow rate
s = H/T may next be calculated (fig. U.8), again giving for
each depth a different result.
From figs. k.'J and U.8 it will be clear that with flocculent
particles the settling efficiency depends on two factors, on the
overflow rate s and on the detention time T or the tank depth o o
H = s T . The influence of both factors together is shown in o o
fig. i+.9 from which follows that for deep tanks with long detention
times and more or less completed flocculation the overflow rate is
the most important factor, while for shallow tanks the detention
time is of paramount importance.
-3
When fill-and-draw tanks are used for the clarification of Q
2c during a detention t
quired tank dimensions are
m3/sec during a detention time T at an overflow rate s , the re-o o
volume V = QT
area A = = 3_
4 - 9
7 * 1QJsec
0 0,5 1,0 1,5 x 10"3m/sec
Fig. 4-9 Removal ra t io as function of overflow rate and detention time.
depth H = s T r o o
As an example, table k.2 shows the possibilities for the treatment
of 0.5 m3/sec, removing 90% of the particles meant in fig. k.9.
Table k.2 - Tank dimensions for the treatment of 0.5 m3/sec, removing
90% of the particles shown in fig. k.9
s o
m/sec
(0.2)10-3
(0.3)10-3
(0.U)10-3
(0.5)10-3
(0.6)10-3
T o sec
3150
3550
Uooo
1+500
5200
A
m2
2500
1670
1250
1000
830
V
m3.
1580
1780
2000
2250
2600
H
m
0.63
1.07
1.60
2.25
3.13
A1,5H
(79.0)103
(72.6)103
(70.8)103
(71.1)io3
(7U.9)103

4-10
-r(80)104
2000 3000 m 2
Fig. 4- 10 Relation between tank area and tank depth for the treatment of
0,5 m /sec, removimg 90% of the particles meant in fig. 4-9.
Which solution should he chosen, depends on the cost of tank con
struction. This cost increases more sharply with area than with depth.
In case the most economical solution is obtained when the optimization
factor
A K 5 H
reaches its minimum value, a tank with a depth of 1.9 m and a surface
area of 1100 m2 should he chosen (fig. U.10). Also with regard to
the problems of building the tank, this is quite an acceptable propo
sition.
Indeed, the removal ratio as function of the detention time
(fig. U.T) varies less with tank depth than is the case with the
removal ratio as function of the overflow rate (fig. U.8). The domi
nant position of detention time as prime factor in the design of
settling tanks for sewage treatment (fig. U.11), however, is due to
70
60
50
40
30
20
10
0
<
..
**£&
S^ $k 55$
M ^
^W
^
M
&&ti
SS
^
Fig. 4-11 Removal ratio for
the plain sedimentation of
sewage in primary tanks.
3 4 Tim*, hours
4-11
another factor, the danger of putrefaction. When here detention times
are larger than 2 to 3 hours, the liquid may become septic during
treatment, contaminating the plant and its surrounding with very-
unpleasant odors.
^.3. Zone settling in quiescent "basins
When a uniform suspension contains particles with one and the same
settling velocity, the suspended matter will move down as a whole (fig.
1+.12), at a constant rate with discrete particles and at an increasing
t = 0 2A
» •* /
3A
* '
* '
; « - • " •
clarified liquid
interface Fig. 4-12 Clar i f i ca t ion of a
uniform suspension.
uniform suspension
0,75
1,5
2,25
v w
ater
1
....
... i
d
epth
bel
o\
p=50 2 ( \ 1 " \ 5\%
v
^ t i m e
0 1 2 3 4 5 6 7 Fig. 4-13 Clarification of the suspension from fig. 4-6 as function of
time and depth.
8x10 sec
4-12
rate with flocculent ones. In both cases, however, there is a distinct
interface "between the suspension and the clear supernatant water. Such
a sharp interface cannot be expected for the suspensions dealt with in
the preceeding section, neither with the discrete particles of table
2.1 (fig. 2.15), nor with the flocculent particles of table U.I (fig.
U.13)• Clarification here is more gradual, the supernatant water brighten
ing as time goes on. ,
When the water to be treated has a high suspended matter content, say
larger than 500 gram/m3, and in particular when the solids are of the
flocculent type, the interparticulate forces tend to hold the particles
fixed relative to one another and again the suspension settles as one
unit (fig. U.12) • With a large suspended matter content, a rapid accumu
lation of sludge at the bottom of the tank, will furthermore occur and
already after a short time the rising interface between sludge and sus
pension will meet the falling interface between suspension and clarified
liquid (fig. U.lU). After this moment, subsidence proceeds by compaction
of the sludge, squeezing out the interstitial water (fig. U.15), a rather
slow process.
As an example of zone settling may be mentioned the quiescent clari
fication of activated sludge. With an initial suspended matter content of
2000 - 7000 grams/m3 and deposition on the bottom with 98 to 99% intereti-
4-13
-t-interstitial water suspended solids
Fig. 4-15 Built-up of sludge deposits.
tial water, the maximum sludge volume at t = t2 in fig. U.1U amounts to
about 300000 ppm or 30$. For t < t2 the top of the suspension will fall
at a rate of about (10)10~3 m/sec and the top of the sludge layer will
rise at a rate of roughly (U)10-3m/sec. Compaction for t > t£ proceeds
much slower, with rates of (2 - 0.02)10-3 m/sec, decreasing as time goes
on.
h.k. Flocculent settling in continuous horizontal-flow tanks
In an ideal sedimentation tank, settling is assumed to take place
without any influence of the horizontal water movement. This process
parenthetically may be visualized by assuming the water to be confined
in a vertical container, which moves through the tank at a speed
equal to the average displacement velocity v (fig. U.16). The effect
8
I L_
• —
•V.v-
ft """*"* -^
i
1 1 1 1 1
"N Fig. 4-16 Flocculent settling in a ideal tank.
of such an ideal settling process may be calculated in the same way
as described in section U.2 for quiescent settling, the efficiency
being a function of both the overflow rate s and the detention time o
T , which factors together constitute the tank depth H = s T . For any desired value of the removal ratio r, various combinations of s
arid T are available, each one leading to a different tank depth H. o
In first instance this depth should be chosen on the basis of techni
cal and economical considerations, so as to provide the lowest cost
of construction.

4-14
Fig. 4-17 Adverse effect of turbulence.
Fig. 4-18 Benificial effect of turbulence.
In practice, ideal settling tanks do not exist and there the
disturbing influence of turbulence, bottom scour and short-circuiting
should be taken into account. With flocculent particles, the effects
of bottom scour and short-circuiting are exactly the same as with dis-
discrete particles and the considerations of section 3.*+ and 3.5 may
therefore be applied without change. The dispersion caused by turbu
lence, however, has now two aspects. On one hand this dispersion will
refrain part of the suspended matter to reach the bottom of the tank,
reducing settling efficiency as shown in fig. ^.17, but the same
dispersion will also promote the aggregation of finely divided sus
pended matter into larger floes with higher settling rates, increasing
settling efficiency as shown in fig. U.18. The net effect of turbu
lence on a flocculent settling process is difficult to predict, but
in general adverse results are absent or so small as to be negligeable.
When indeed the influence of turbulence may be neglected, the
design of a settling tank is quite simple. For a high Froude number
and stable flow conditions, this tank should be long, narrow and shal
low, with an as high displacement velocity v as is consistent with
the requirement of no bottom scour. As derived in section 3.1*, the
scour velocity

4-15
is proportional to the root of the particle diameter, meaning that when
the displacement velocity v goes up, first the finest particles are
resuspended. These settle well within the laminar region, at a rate
(section 2.1)
s = : L £ p s - p w d 2
18 v pw
With A = 0.03, 6 = 0.06 and t = 10 °C, v = (1.31)10-6 m2/sec,
elimination of the diameter d gives
v = (o.U9)(-- ") 4s o w p. -5 w.^1/4t,
1/i+
and for flocculated mud particles with a mass density of 1030 kg/m3
for instance
v = (0.215)sl/l+ s
with s as settling velocity of the finest particle to be retained.
For the suspension of fig. U.3 and a tank depth of about 1.5 m,
the 5% settling velocity may be estimated at (0.25)10~3 m/sec,
giving finally as requirement
v < (27)10"3 m/sec
The design procedure based on this limitation, can best be explained 3 with an example, assuming that 0.5 m /sec of the suspension mentioned
above should be treated for 95$ clarification. The combinations of
overflow rate s and detention time T satisfying these requirements o o
can be taken from fig. U.9, curve upper left. These combinations
are shown in table U.3, where next the tank depth H = s T and r o o
the surface area A = Q/s are calculated. The width of the tank finally should be chosen so large that the displacement velocity
v equals the critical value of (27)10 m/sec, mentioned above, o
4-16
TABLE 4.3
s o
1 0 - 3 m/sec
0 .15
0.25
0 .35
0.U5
T o
sec
3700
ui+oo
5200
61400
H=s T o o
m
0 .56
1.10
1.82
2 .88
A=0 .5 / s 0
m2
3330
2000
1U30
1110
B=0.5 /0 .02TH
m
33.1
16.9
10.2
6.U
L=A/B
m
101
118
1U0
173
F r
( 1 M 1 0 - 5
( 7 . 8 ) 1 0 - 5
( 5 . 6 ) 1 0 - 5
( 5 . o ) i o - 5
Re
11000
20000
28000
31000
Dimensions of a rectangular horizontal-flow tank, for the treatment 3
of 0.5 m /sec, removing 95$ of the particles shown in fig. 4—9.
As regards hydrodynamic considerations, there is little to choose between
the various combinations of table U.3. All have stable flow conditions
(Fr > 10"5), while the Reynolds numbers of 11000-31000 are not excessive.
The final choice must therefore be made on economical considerations, in
such a way that the building costs are at a minimum. Off-hand a depth
of 1.5m (increased to 2 m to accomodate sludge raking equipment) looks
attractive, requiring (fig. ^.19) a width of 12.5 m (subdivided in 2
raking compartments) and a length of 130 m (increased to 135 'in to accomo
date inlet and outletzones).
4m
3 - •*=
2 ra - — * *
X
JZ
deo
t
-X c CD
\ H
tank i
B^ ^ ^ m
dth
5
-X
tan
urface
40m
30
10
1000 2000 3000 m3
Fig. 4-19 Tank dimensions for the treatment of 0,5 m/sec, removing 95% of
the particles shown in fig. 4-9.
4-17
With circular horizontal flow tanks, the displacement velocity-
reaches its maximum value near the inlet or outlet well in the centre.
With the notations of fig. 3.11+ this velocity equals
= Q Vo TTD H w
To keep this velocity below the scour velocity, the depth of the tank
and/or the diameter of the centre well should be rather large. With the
same example as discussed above (table U.3), an average depth of 2.5 m
and an outer diameter of kO m looks attractive. With a bottom slope of
8%t the depth in the centre will be 3.5 m, from which follows
v = „ o TTD
0 ^
w \\t5) < (27)10-3 or Dw > 1.7
quite an acceptable value
m,
1+.5. Flocculent settling in continuous vertical flow tanks
With vertical flow tanks, the displacement velocity v and
the overflow rate s are identical, both being equal to Q/A
(fig. U.20 left). The consequence of this is that discrete
Q — ' • = = ,
r^~hs \
% I
C_ A I ^ ?-:,
• sludge bleed pipe
Tl
heavy sludge draw-off
Fig. 4-20 Vertical flow tanks, cy l indr ica l and f l a r i n g , for f locculent se t t l i ng .
4-18
particles can only be retained when their settling velocity s
is larger than the overflow rate s . As demonstrated in chapter o
3, continuous horizontal flow tanks of the same dimension also
remove discrete particles with a settling velocity s < s (in
a ratio s/s ), appreciably increasing settling efficiency. This
is the reason that for discrete particles vertical flow tanks
should never be applied.
The behavior of flocculent particles in a continuous vertical
flow tank is quite different. After entering the tank they will
again move upward if their initial settling velocity s is smaller
than the overflow rate s . During this upward travel, however,
they will contact and coalesce with other particles, increasing
their size and settling velocity. The effective rate s - s of up
ward movement thus decreases, while further aggregation will even
make this rate negative, after which the particle sinks to the
bottom of the tank (fig. H.20 left). In horizontal flow tanks, the
particle cannot remain in the tank for a period longer than the detention time T = AH/Q = H/s , but with vertical flow tanks
o o
of the same dimensions and capacity, the detention time of the
flocculent particle T = H/(s - s ) is much greater. The number
of contacts with other particles will be correspondingly larger,
promoting floe formation and increasing settling velocities and
sedimentation efficiency. In many cases vertical flow tanks can
thus operate at a higher to much higher surface loading than
horizontal flow tanks with the same removal ratio.
The flocculation process described above may be greatly enhanced
by the application of flaring vertical flow tanks, as shown in
fig. U.20 on the right. When moving upward in such a tank, the
cross-sectional area becomes larger and larger, continuously decreas
ing the displacement velocity of the water. Even when the floccula
tion process has been completed and the settling velocity of the
floe has reached its ultimate value s„, the net rate s - s„ at which i o f
this floe travels upward becomes smaller and smaller. At a certain level in the tank, this rate is so
small that the floes are virtually at rest, forming a stationary sludge
blanket. In this blanket the suspended matter concentration is very
high. On one hand this enables the interparticulate forces to keep
the floes together (section *+.U), making the blanket to behave as
4-19
one unit, while on the other hand fine particles entrained by the
upward flowing water cannot fail to come into contact and to coalesce
with particles already present, removing these fine particles ini
the same way as in the bed of a rapid or slow filter (blanket filtra
tion) .
To understand the hydrodynamics of a sludge blanket, it should
be remembered that flocculation is able to built up the floe to a
certain size only (section U.1), limiting the settling velocity to
a specified value s~, depending on floe properties. Due to the
interparticulate forces mentioned above, all floes in the blanket
will have about the same settling velocity s , meaning that the
blanket wants to move down at this rate. To keep such a blanket
stationary requires an upward flow of water, at a rate s, which will d
be la rger as the volumetric concentration c of floes in the blanket v
is smaller. According to the theory of hindered settling (section
2.2), the 3 factors mentioned above are interrelated by the formula
1 - 2c 2/3 (fig. U.21, curve A)
This formula, however, is not meant for larger concentrations and
there a better relation can be taken from the theory of filterbed
expansion when backwashing a rapid filter
n ° ° ° 0 O n
M I
10 Q O
6 4
2
1
A ^ y
*
B /
C v
0.1 0.2 0.3
Fig. 4-21 Relation between the settling velocity Sf of the sludge blanket
and the displacement velocity S. of the water,as function of the
volumetric concentration C of suspended matter in the blanket.
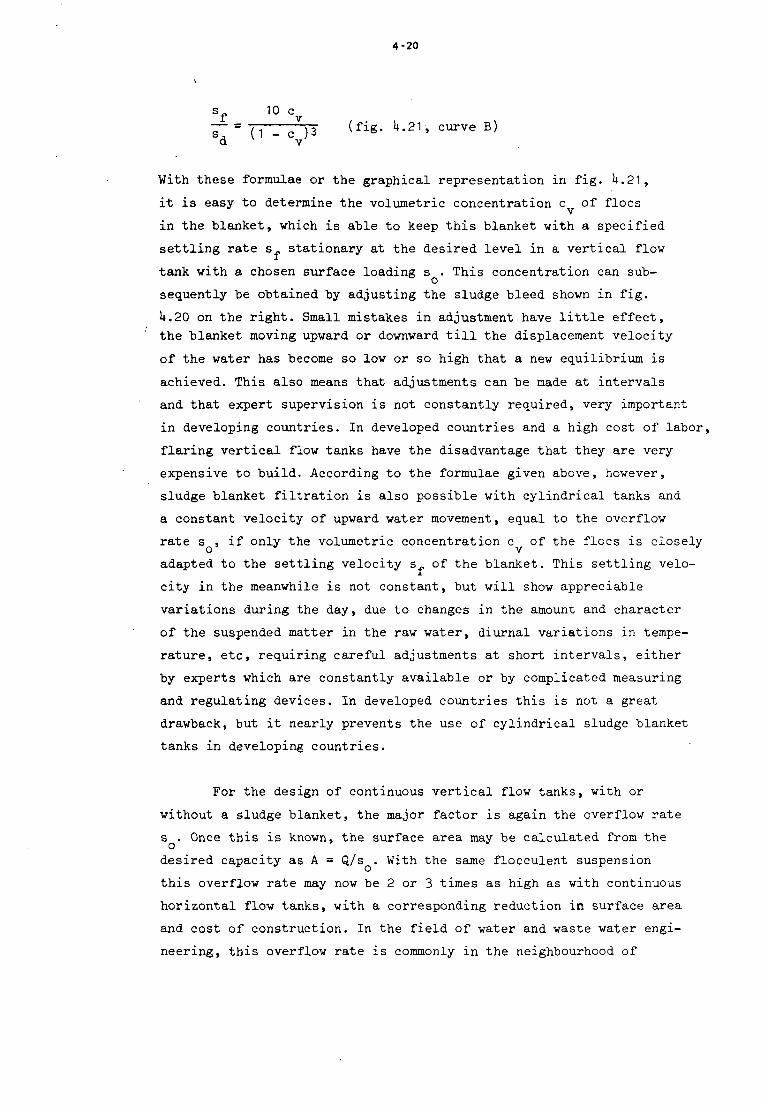
4-20
sf 10 cy
7" ' (l""-' c' ")"3 (fig- **.21, curve B)
With these formulae or the graphical representation in fig. H.21,
it is easy to determine the volumetric concentration c of floes
in the blanket, which is able to keep this blanket with a specified
settling rate s„ stationary at the desired level in a vertical flow
tank with a chosen surface loading s . This concentration can sub
sequently be obtained by adjusting the sludge bleed shown in fig.
H.20 on the right. Small mistakes in adjustment have little effect,
the blanket moving upward or downward till the displacement velocity
of the water has become so low or so high that a new equilibrium is
achieved. This also means that adjustments can be made at intervals
and that expert supervision is not constantly required, very important
in developing countries. In developed countries and a high cost of labor,
flaring vertical flow tanks have the disadvantage that they are very
expensive to build. According to the formulae given above, however,
sludge blanket filtration is also possible with cylindrical tanks and
a constant velocity of upward water movement, equal to the overflow
rate s , if only the volumetric concentration c of the floes is closely o v
adapted to the settling velocity s„ of the blanket. This settling velo
city in the meanwhile is not constant, but will show appreciable
variations during the day, due to changes in the amount and character
of the suspended matter in the raw water, diurnal variations in tempe
rature, etc, requiring careful adjustments at short intervals, either
by experts which are constantly available or by complicated measuring
and regulating devices. In developed countries this is not a great
drawback, but it nearly prevents the use of cylindrical sludge blanket
tanks in developing countries.
For the design of continuous vertical flow tanks, with or
without a sludge blanket, the major factor is again the overflow rate
s . Once this is known, the surface area may be calculated from the
desired capacity as A = Q/s . With the same flocculent suspension
this overflow rate may now be 2 or 3 times as high as with continuous
horizontal flow tanks, with a corresponding reduction in surface area
and cost of construction. In the field of water and waste water engi
neering, this overflow rate is commonly in the neighbourhood of
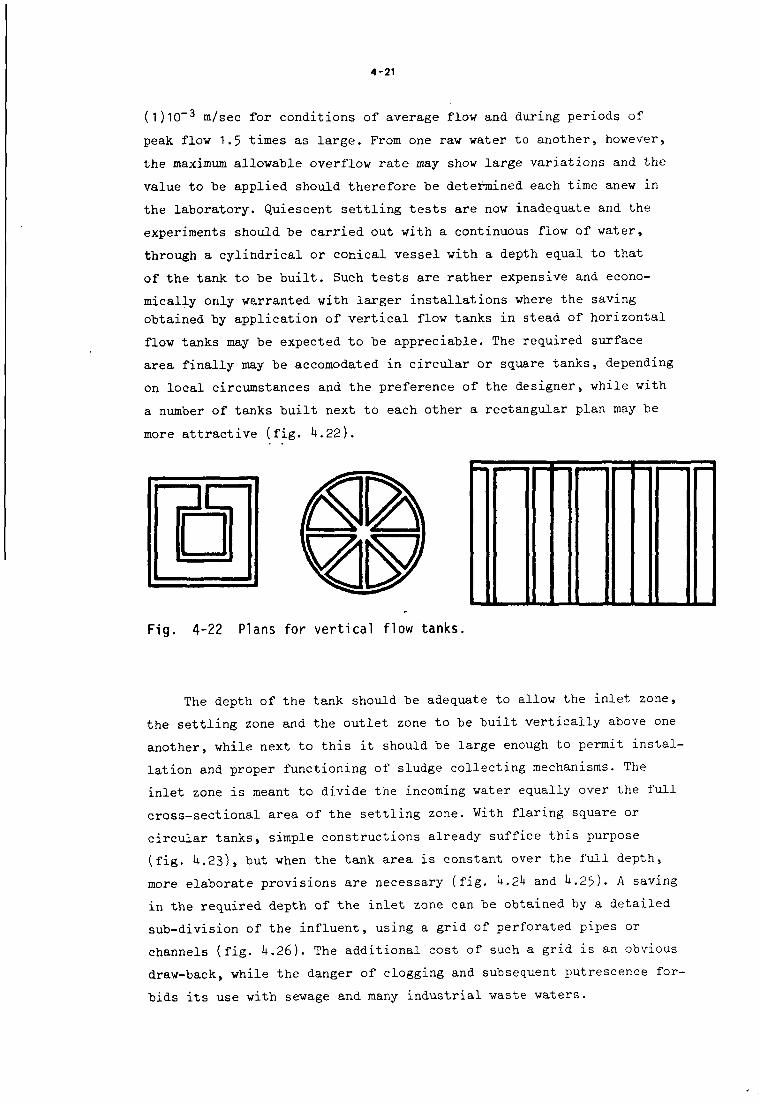
4-21
(1)10~3 m/sec for conditions of average flow and during periods of
peak flow 1.5 times as large. From one raw water to another, however,
the maximum allowable overflow rate may show large variations and the
value to be applied should therefore be determined each time anew in
the laboratory. Quiescent settling tests are now inadequate and the
experiments should be carried out with a continuous flow of water,
through a cylindrical or conical vessel with a depth equal to that
of the tank to be built. Such tests are rather expensive and econo
mically only warranted with larger installations where the saving
obtained by application of vertical flow tanks in stead of horizontal
flow tanks may be expected to be appreciable. The required surface
area finally may be accomodated in circular or square tanks, depending
on local circumstances and the preference of the designer, while with
a number of tanks built next to each other a rectangular plan may be
more attractive (fig. U.22).
Fig. 4-22 Plans for vertical flow tanks.
The depth of the tank should be adequate to allow the inlet zone,
the settling zone and the outlet zone to be built vertically above one
another, while next to this it should be large enough to permit instal
lation and proper functioning of sludge collecting mechanisms. The
inlet zone is meant to divide the incoming water equally over the full
cross-sectional area of the settling zone. With flaring square or
circular tanks, simple constructions already suffice this purpose
(fig. U.23), but when the tank area is constant over the full depth,
more elaborate provisions are necessary (fig. U.2h and U.25). A saving
in the required depth of the inlet zone can be obtained by a detailed
sub-division of the influent, using a grid of perforated pipes or
channels (fig. h.26). The additional cost of such a grid is an obvious
draw-back, while the danger of clogging and subsequent putrescence for
bids its use with sewage and many industrial waste waters.
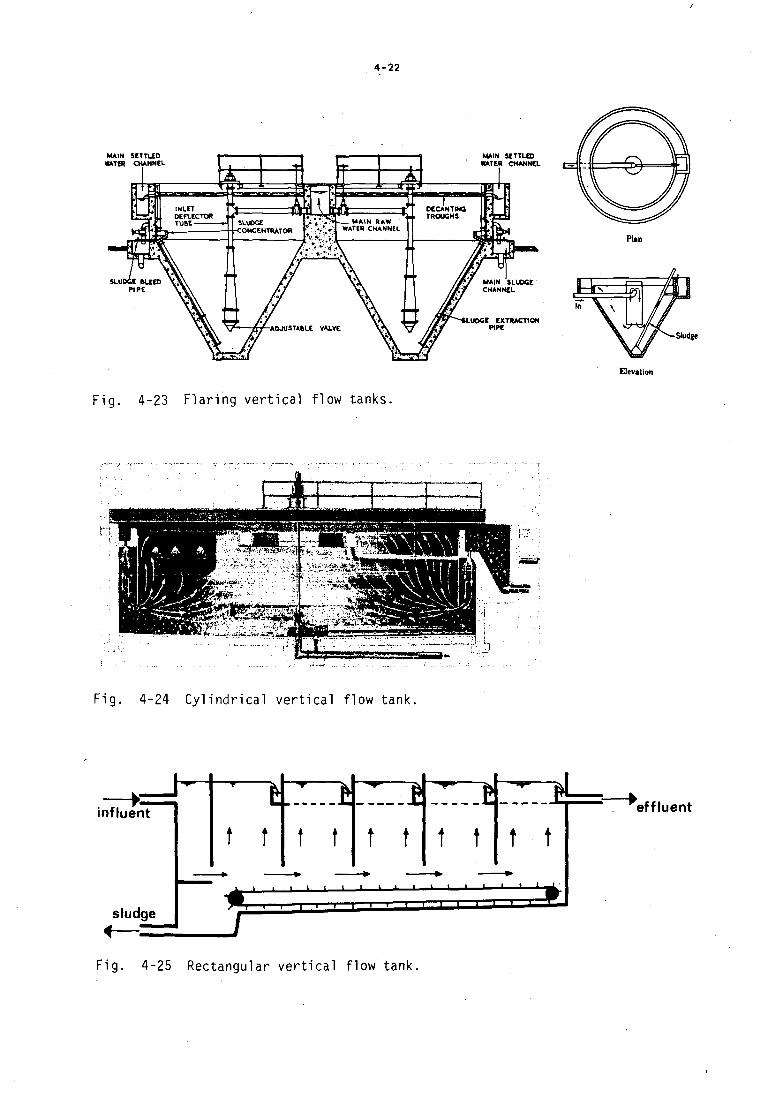
4-22
MAIN SETTLED « A T « CHANNEL
Fig. 4-23 Flaring vertical flow tanks.
Sludge
Elevation
Fig. 4-24 Cylindrical vertical flow tank.
influent
sludge
t t t t t t t t t t
J J — i — i — i i i i i i • i • • • • « i
•i i i i " i i i i i i i • • • •
effluent
Fig. 4-25 Rectangular vertical flow tank.

4-23
Fig. 4-26 Supply grid in
vertical flow tanks.
The depth of the settling zone should be large enough to allow
completion of the flocculation process. Generally speaking this means
a detention time of 1500-3000 seconds and a depth of roughly 2 m.
This, however, only represents the order of magnitude and the true
value to be applied in a particular case, should be taken from the
laboratory tests mentioned above. With flaring tanks and the walls
at 60° with the horizontal, the transition from inlet zone to settling
zone takes quite a height, in particular with tanks of circular or
square cross-section (fig. U.27)> making them very expensive to build.
The outlet zone finally should be of such a depth that an even
abstraction of clarified water from the settling zone is assured. As
,UberJaufrinne „ \-* 39*0 »-H ^ ^ 39*0 -
Alte feststehende
A bschlommleitung Fig. 4-27 Flaring square
settling tank.
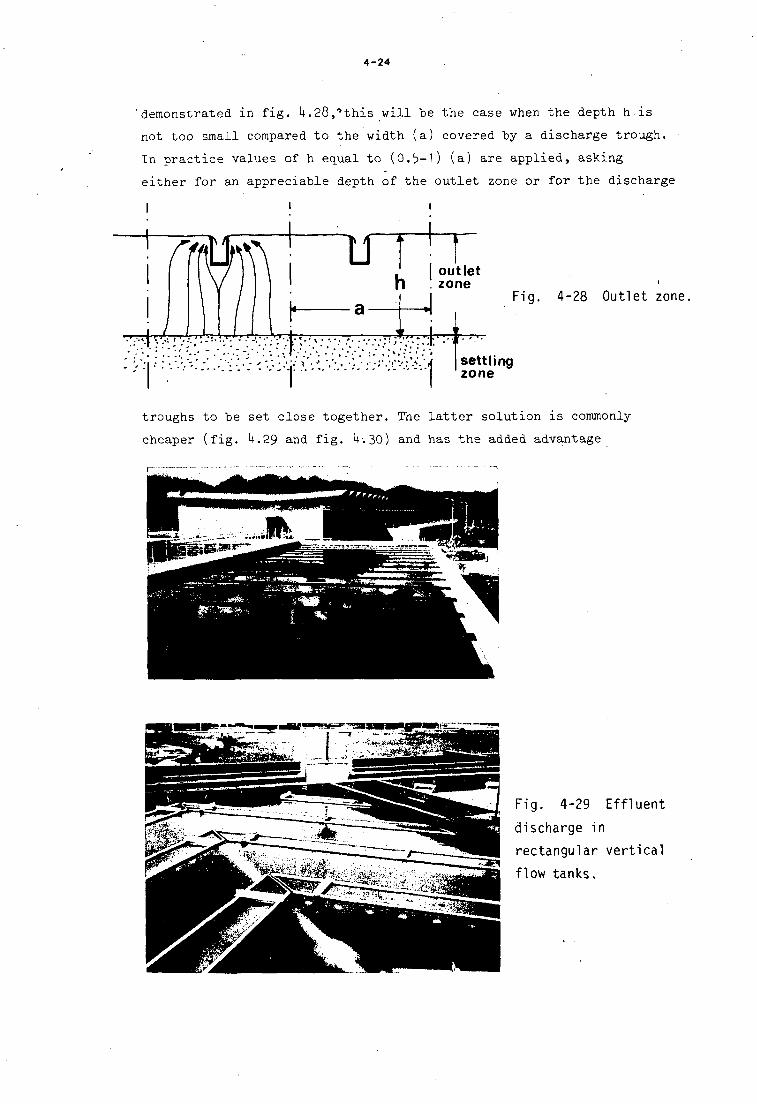
4-24
demonstrated in fig. l+.28,°this will be the case when the depth his
not too small compared to the width (a) covered by a discharge trough. •
In practice values of h equal to (0.5-1) (a) are applied, asking
either for an appreciable depth of the outlet zone or for the discharge
Fig. 4-28 Outlet zone.
• :"• v . v -' ':'•'•:":.'• '':':'•)•: •>"'.-; ',••'.'•'' "••:'r.'rvW.''l( seti
• • • ' • ^ ' l settling zone
troughs to be set close together. The latter solution is commonly-
cheaper (fig. U.29 and fig. k:30) and has the added advantage
Fig. 4-29 Effluent
discharge in
rectangular vertical
flow tanks.
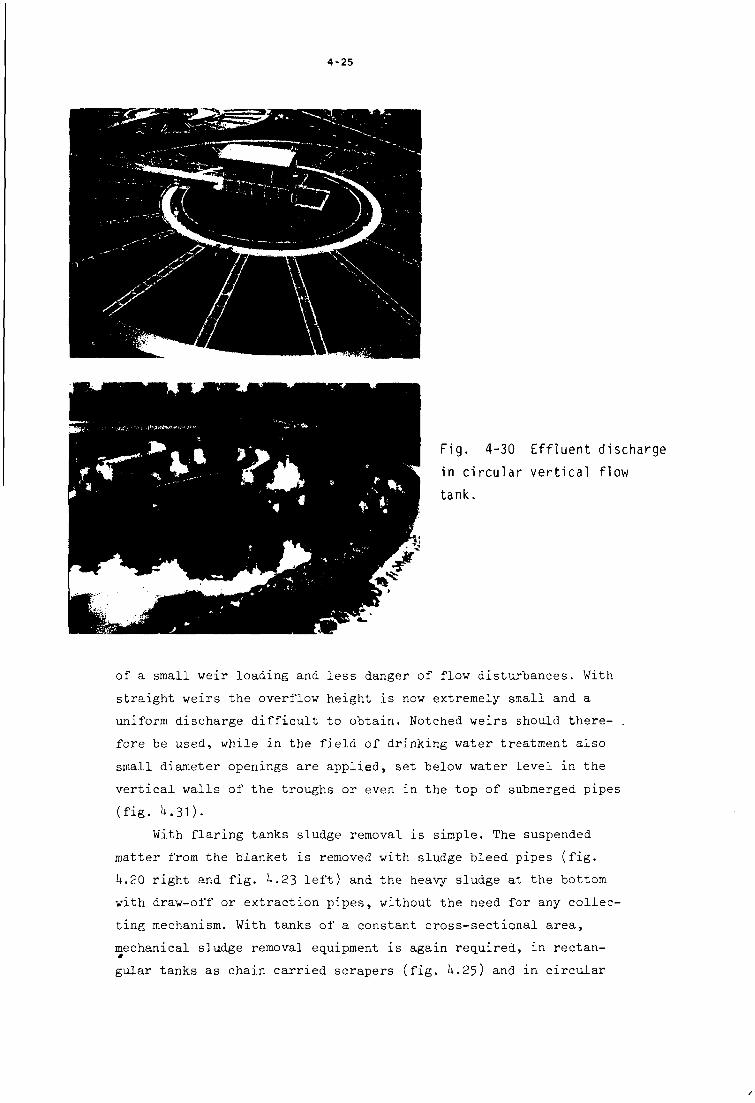
4-25
Fig. 4-30 Effluent discharge
in circular vertical flow
tank.
of a small weir loading and less danger of flow disturbances. With
straight weirs the overflow height is now extremely small and a
uniform discharge difficult to obtain. Notched weirs should there- .
fore be used, while in the field of drinking water treatment also
small diameter openings are applied, set below water level in the
vertical walls of the troughs or even in the top of submerged pipes
(fig. U.31).
With flaring tanks sludge removal is simple. The suspended
matter from the blanket is removed with sludge bleed pipes (fig.
U.20 right and fig. i+.23 left) and the heavy sludge at the bottom
with draw-off or extraction pipes, without the need for any collec
ting mechanism. With tanks of a constant cross-sectional area,
mechanical sludge removal equipment is again required, in rectan
gular tanks as chain carried scrapers (fig. U.25) and in circular
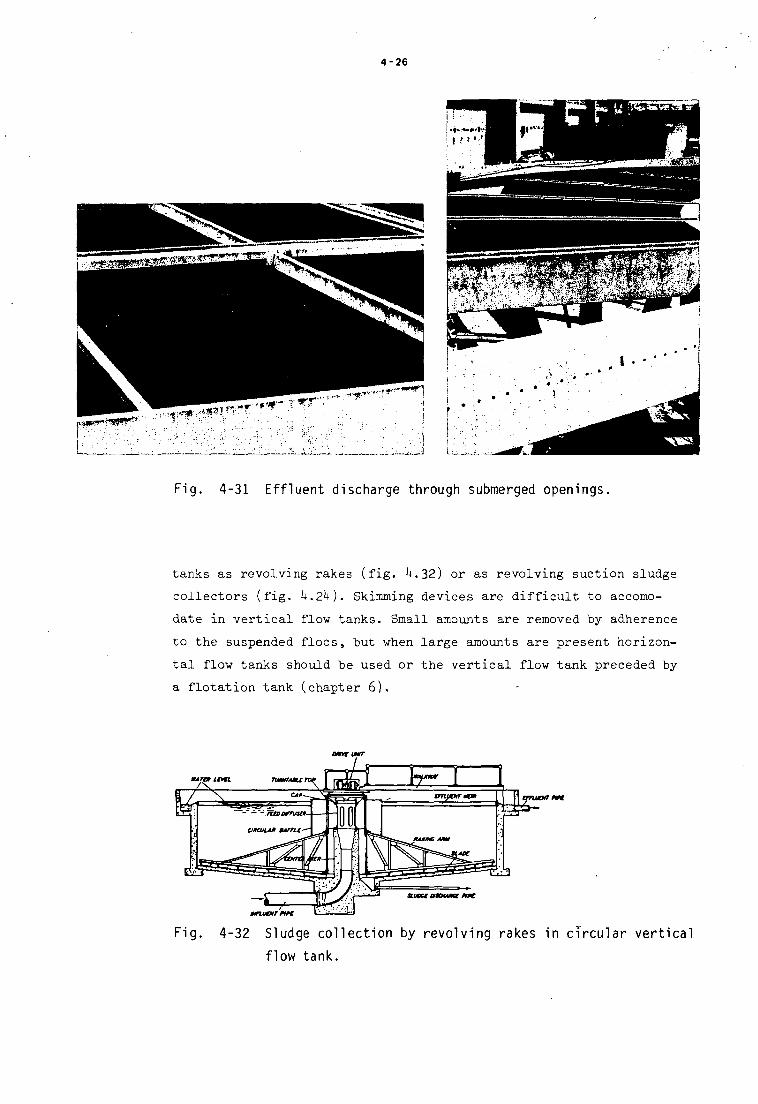
4-26
Fig. 4-31 Effluent discharge through submerged openings.
tanks as revolving rakes (fig. ^.32) or as revolving suction sludge
collectors (fig. h.2h). Skimming devices are difficult to accomo
date in vertical flow tanks. Small amounts are removed "by adherence
to the suspended floes, "but when large amounts are present horizon
tal flow tanks should be used or the vertical flow tank preceded by
a flotation tank (chapter 6).
IT*- I "*1
Fig. 4-32 Sludge collection by revolving rakes in circular vertical
flow tank.
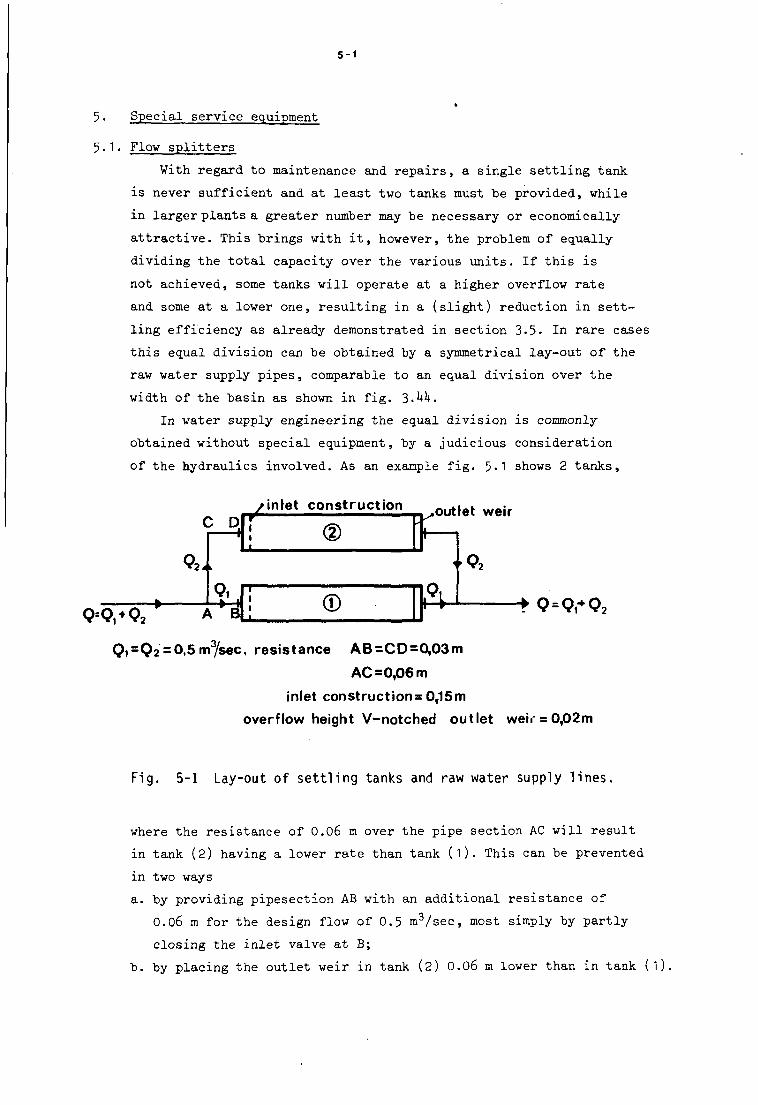
5-1
5. Special service equipment
5.1. Flow splitters
With regard to maintenance and repairs, a single settling tank
is never sufficient and at least two tanks must be provided, while
in larger plants a greater number may he necessary or economically
attractive. This brings with it, however, the problem of equally
dividing the total capacity over the various units. If this is
not achieved, some tanks will operate at a higher overflow rate
and some at a lower one, resulting in a (slight) reduction in sett
ling efficiency as already demonstrated in section 3.5. In rare cases
this equal division can be obtained by a symmetrical lay-out of the
raw water supply pipes, comparable to an equal division over the
width of the basin as shown in fig. 3.M.
In water supply engineering the equal division is commonly
obtained without special equipment, by a judicious consideration
of the hydraulics involved. As an example fig. 5«1 shows 2 tanks,
C D
<?2 ,k
/ i n l e t construct ion „ . „u» w e i r
<?*<?,• Q 2
9 i - • 1 © * -• 9=Q,*02
Qi=Qi = 0,5m3/sec, resistance AB=CD=0,03m
AC =0,06 m
inlet constructions0,15m
overflow height V-notched outlet weir = 0,02m
Fig. 5-1 Lay-out of se t t l ing tanks and raw water supply l ines,
where the res i s tance of 0.06 m over the pipe sect ion AC wi l l r e s u l t
in tank (2) having a lower r a t e than tank ( l ) . This can be prevented
in two ways
a. by providing pipesect ion AB with an addi t iona l res i s tance of
0.06 m for the design flow of 0.5 m 3 / sec , most simply by pa r t l y
closing the i n l e t valve a t B;
b . by placing the ou t le t weir in tank (2) 0.06 m lower than in tank (1).
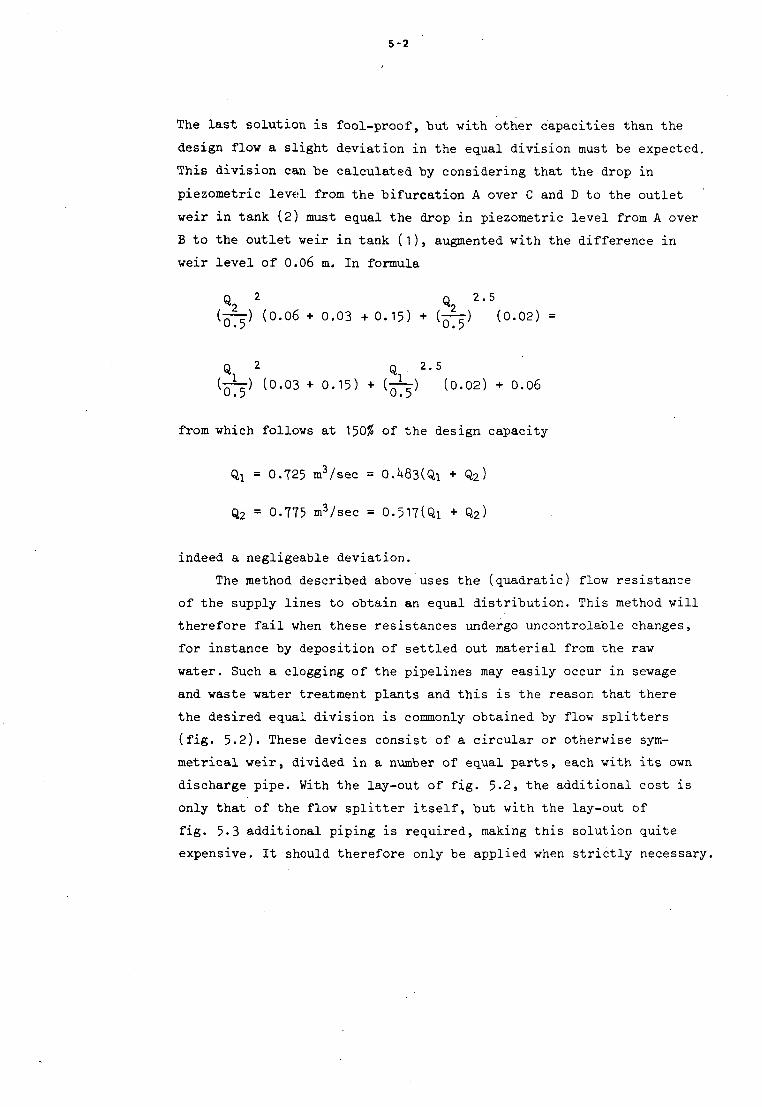
5-2
The last solution is fool-proof, but with other capacities than the
design flow a slight deviation in the equal division must be expected.
This division can be calculated by considering that the drop in
piezometric level from the bifurcation A over C and D to the outlet
weir in tank (2) must equal the drop in piezometric level from A over
B to the outlet weir in tank (1), augmented with the difference in
weir level of 0.06 m. In formula
Q 2 Q 2.5
(<~) (0.06 + 0.03 + 0.15) + (~) (0.02) =
Q 2 Q 2.5
{—) (0.03 + 0.15) + (~) (0.02) + 0.06
from which follows at 150$ of the design capacity
Qi = 0.725 m3/sec = O.U83(Qi + Q2)
Q2 = 0.775 m3/sec = 0.517(Qi + Q2)
indeed a negligeable deviation.
The method described above uses the (quadratic) flow resistance
of the supply lines to obtain an equal distribution. This method will
therefore fail when these resistances undergo uncontrolable changes,
for instance by deposition of settled out material from the raw
water. Such a clogging of the pipelines may easily occur in sewage
and waste water treatment plants and this is the reason that there
the desired equal division is commonly obtained by flow splitters
(fig. 5.2). These devices consist of a circular or otherwise sym
metrical weir, divided in a number of equal parts, each with its own
discharge pipe. With the lay-out of fig. 5.2, the additional cost is
only that of the flow splitter itself, but with the lay-out of
fig. 5.3 additional piping is required, making this solution quite
expensive. It should therefore only be applied when strictly necessary.
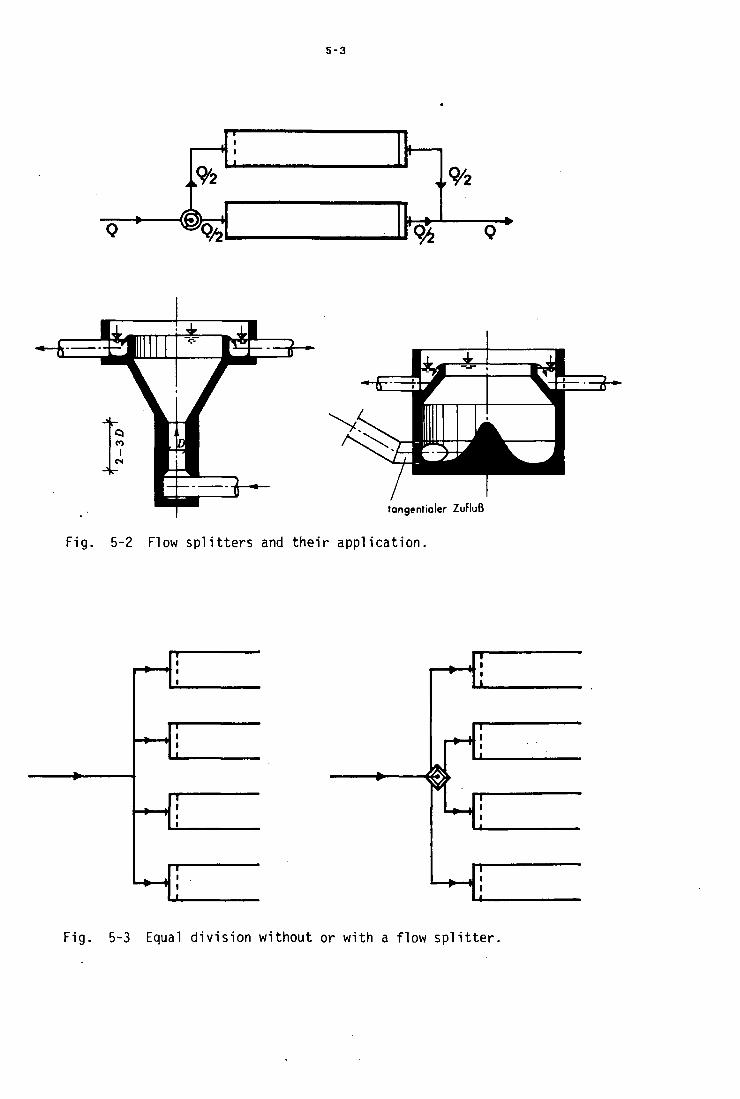
5-3
- » ,
„%
h& %
— £ ^
tangentioler Zuflufi
Fig. 5-2 Flow sp l i t te rs and thei r appl icat ion.
» i • * — •
-•—•
• • — i
-•-4
fy
-¥—• •+—t
Fig. 5-3 Equal division without or with a flow splitter.
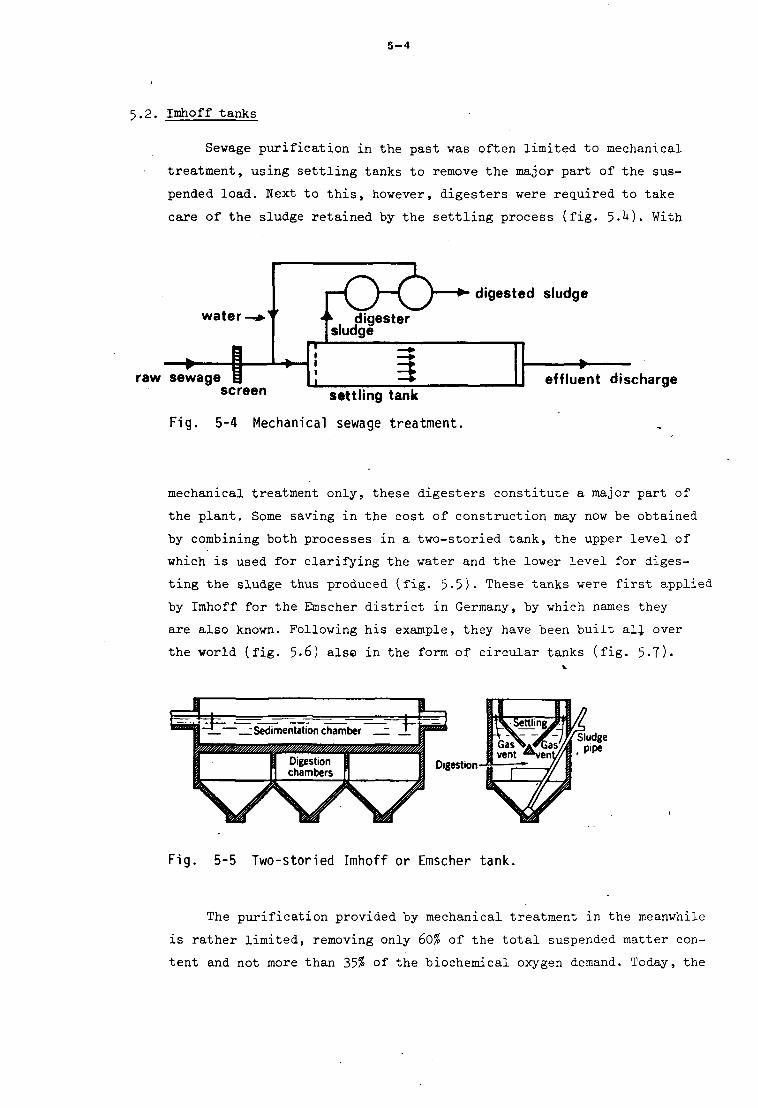
5-4
5.2. Imhoff tanks
Sewage purification in the past was often limited to mechanical
treatment, using settling tanks to remove the major part of the sus
pended load. Next to this, however, digesters were required to take
care of the sludge retained by the settling process (fig. 5-M. With
water—*.1'
raw sewage screen
digested sludge k digester sludge
settling tank effluent discharge
Fig. 5-4 Mechanical sewage treatment.
mechanical treatment only, these digesters constitute a major part of
the plant. Some saving in the cost of construction may now he obtained
by combining both processes in a two-storied tank, the upper level of
which is used for clarifying the water and the lower level for diges
ting the sludge thus produced (fig. 5-5). These tanks were first applied
by Imhoff for the Emscher district in Germany, by which names they
are also known. Following his example, they have been built all over
the world (fig. 5-6) also in the form of circular tanks (fig. 5-7)«
Digestion
Sludge pipe
Fig. 5-5 Two-storied Imhoff or Emscher tank.
The purification provided by mechanical treatment in the meanwhile
is rather limited, removing only 60% of the total suspended matter con
tent and not more than 35$ of the biochemical oxygen demand. Today, the
5 - 5
Rochester, N.Y. Decatur, I I I . Dallas.Tex.
Oklahoma Ciiy Madison, Wis. Ft. Worth ,Tex;
Fig. 5-6 Large Imhoff tanks.
I l l *~c***v-
Fig. 5-7 Circular Imhoff tank or Fig. 5-8 Small Imhoff tank or
clarigester. spiragester.
5-6
self-purification capacity of many receiving waters is inadequate to
cope with the remaining pollutional load and there the primary settling
process has to be followed by some sort of aerobic biological treatment.
Much more sludge is now produced, requiring extended sludge digestion
facilities. Speeding up this process by heating now becomes very
attractive. With Imhoff tanks, however, and the digestion chambers at
a great distance below ground surface, completely surrounded by soil
and water, the heat losses would become excessive and this is the reason
that for larger installations such tanks are no longer applied. They
still offer an excellent solution when for small quantities of sewage
a partial treatment will suffice , for instance with isolated
hotels, camping places, etc, replacing septic tanks formerly used for
this purpose (fig. 5.8).
5•3. Channel-type grit chambers
Next to putrescible organic solids, domestic sewage contains heavy
and inert materials such as ashes and clinker, egg shells,bone chips
etc, while in a combined sewerage system also significant amounts of
sand may be present. Removal of this so-called grit ahead of the pri
mary settling tanks offers several advantages , reducing settling
tank and digester tanks volumes, preventing clogging of pipelines
and damage to moving mechanical equipment such as pumps, scrapers etc.
Grit as defined above settles discretely and sedimentation effi
ciency consequently only depends on the overflow rate. Grit chambers
are generally designed to capture sand particles with a mass density
of 2650 kg/m3 and a diameter of 0.2 mm or more. With settling in the
first part of the transition region (particle Reynolds number between
1 and 50), the overflow rate becomes (section 2.1)
So S 10 v^T I p i d
w
or in the case under consideration and a temperature of 10 °C,
v = (1.31)10-6 m2/sec
5-7
v...,' 0- 8
O •^o(iiiig.^oH-'-(1-fe)0-8(2)1-',(10)'5-6
so = To TTtfs d.l.93)(2.61.)(10)-2 = (2D10-3 m/sec
To prevent re-suspension of settled out material, the displacement
velocity v must remain below the scour velocity (section 3-*0
/ UP ps " pw „ vs V 3 P gd
w
or in this case
vg =/ J- (1.65)(9-81)(2)(10-I+) = (210)10-3 m/sec
This means a maximum ratio between length and depth of
k - Is. - (21Q)10~3 _ ln H " sQ " (21)10"J ' °
For a capacity of 0.5 m3/sec, the required surface area equals
BL = = n' Api = 2U m2 , for instance
o
a width of 2 m, a length of 12 m and a depth larger than 1.2 m.
These are quite acceptable dimensions, but with larger capacities
(combined sewerage systems!) and a still limited depth the plan
tends to become square. With Q = 3 m3/sec and H = 1.2 m as before,
the maximum length equals L = 12m, giving as minimum width
B = A = (0.021)(12) = 12 m
o
Such tanks are called detritus tanks and have as disadvantage that
next to the heavy and inert grit, also part of the decomposable
organic load is retained. When such material is disposed of by dum
ping, putrescence will set in, spreading unpleasant odors, attracting
flies and making the place rather unsightly. To facilitate disposal
of the grit in land-fills, sludge drying beds, etc, clean grit is
necessary, with a washable organic matter content less than 3%,
5-8
preferably below \%. From detritus tanks clean grit can only be ob
tained by washing the retained material after removal from the
tank, for instance as shown in fig. 5-9. A more straight-forward
Fig. 5-9 Detritus tank with grit washer.
solution, however, would be to prevent a falling out of the lighter
organic particles by maintaining such a high velocity of horizontal
water movement that these particles are continuously removed by
scour. Commonly a displacement velocity of 0.3 m/sec is chosen for
this purpose. Indeed, such a velocity already initiates the scour
of sand grains with a diameter
d = (§7§i") 0.2 = O.k mm
but in practice the loss of material between 0.2 and 0.^ has been
found to be small. With the design factors
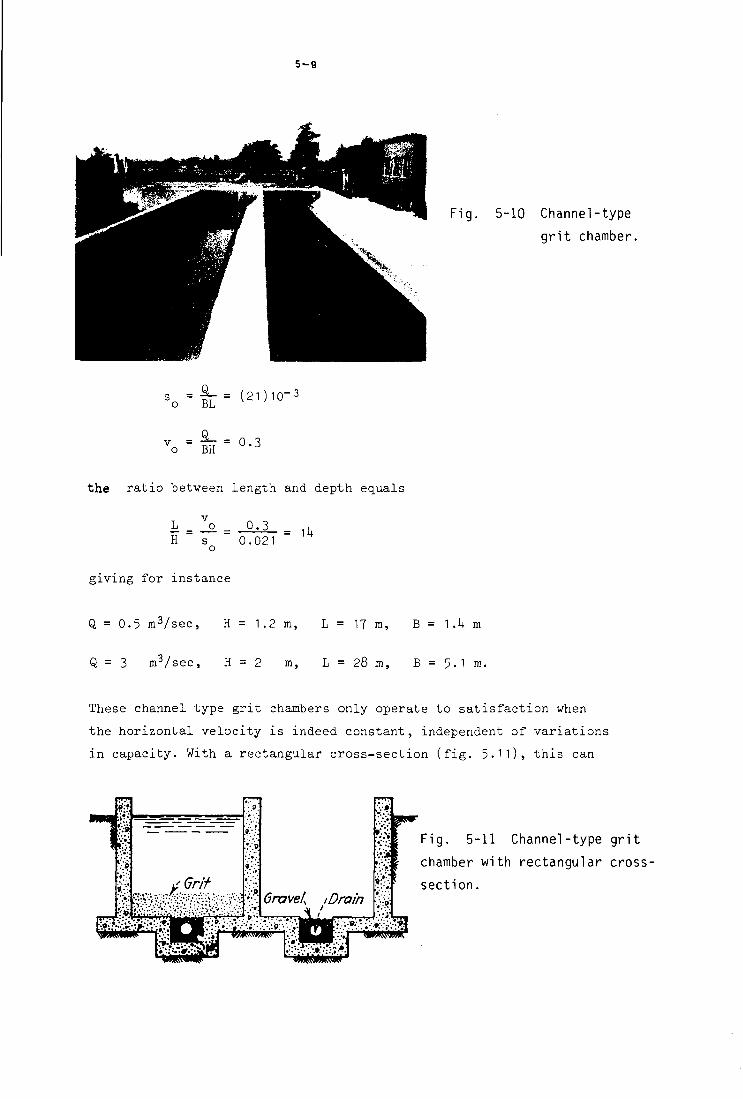
5-9
Fig. 5-10 Channel-type
grit chamber.
S Q = ^ = (21)10-3
v = •*- = 0.3 o BH °
the ratio 'between length and depth equals
H s 0.021 o
giving for instance
Q = 0.5 m3/sec, H = 1.2 m, L = 17 m, B = 1.h m
Q = 3 m3/sec, H = 2 m, L = 28 m, B = 5.1 m.
These channel type grit chambers only operate to satisfaction when
the horizontal velocity is indeed constant, independent of variations
in capacity. With a rectangular cross-section (fig. 5-1l), this can
Gravely /Drain & «:••:
•;•••.'.; Fig. 5-11 Channel-type grit
»':•.;• p chamber with rectangular cross
section.
•:ii'w**1***

5-10
be obtained with a proportional flow weir (fig. 5-12), while with an
horizontal weir a parabolic cross-section is required. With the no
tations of fig. 5-13 the amount of water flowing over such a weir
equals
Fig. 5-12 Proportional flow weir,
weir.
Fig. 5-13 Channel-type grit chamber with parabolic cross-section.
Q = 1.8 ah / z
with h as overflow height. In case h is also the depth of the grit
chamber
Q = v / bdh
° J o
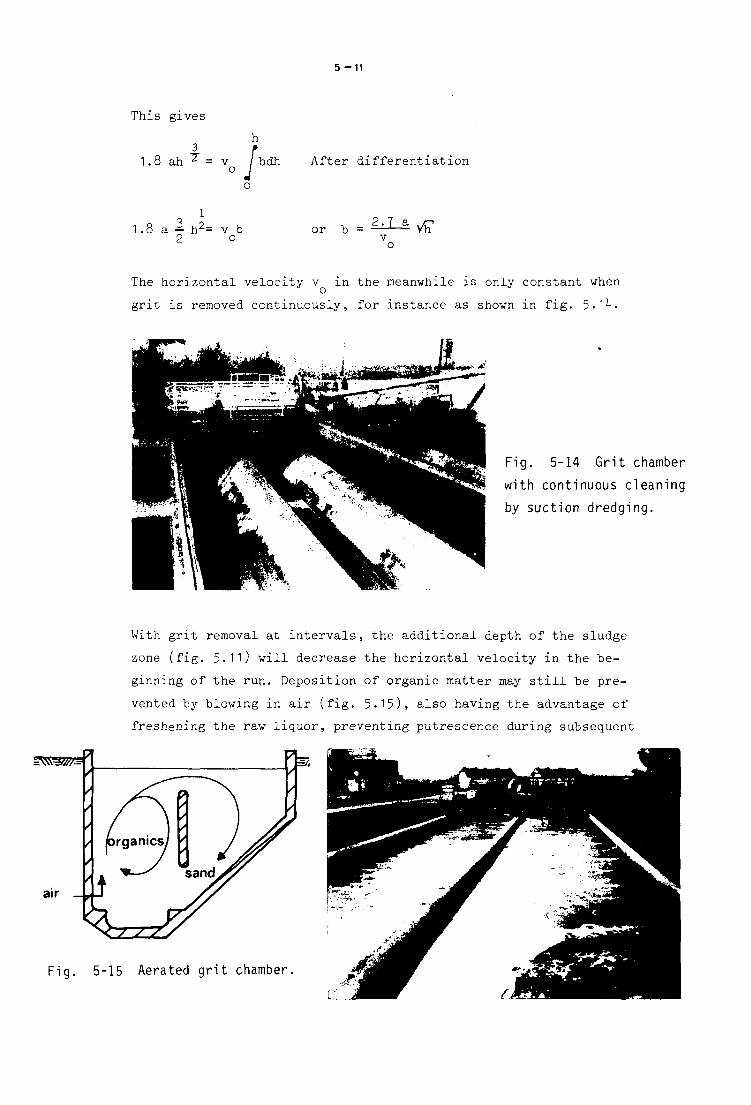
5-11
This gives
= v [l 1.8 ah T = v_ / bdh After differentiation
o
1
1.8 a -2. h2= v "b or b = 2 ^ J L ^
The horizontal velocity v in the meanwhile is only constant when
grit is removed continuously, for instance as shown in fig. 5.1^.
Fig. 5-14 Grit chamber
with continuous cleaning
by suction dredging.
With grit removal at intervals, the additional depth of the sludge
zone (fig. 5.11) will decrease the horizontal velocity in the be
ginning of the run. Deposition of organic matter may still he pre
vented by blowing in air (fig. 5-15), also having the advantage of
freshening the raw liquor, preventing putrescence during subsequent
air
Fig. 5-15 Aerated grit chamber.
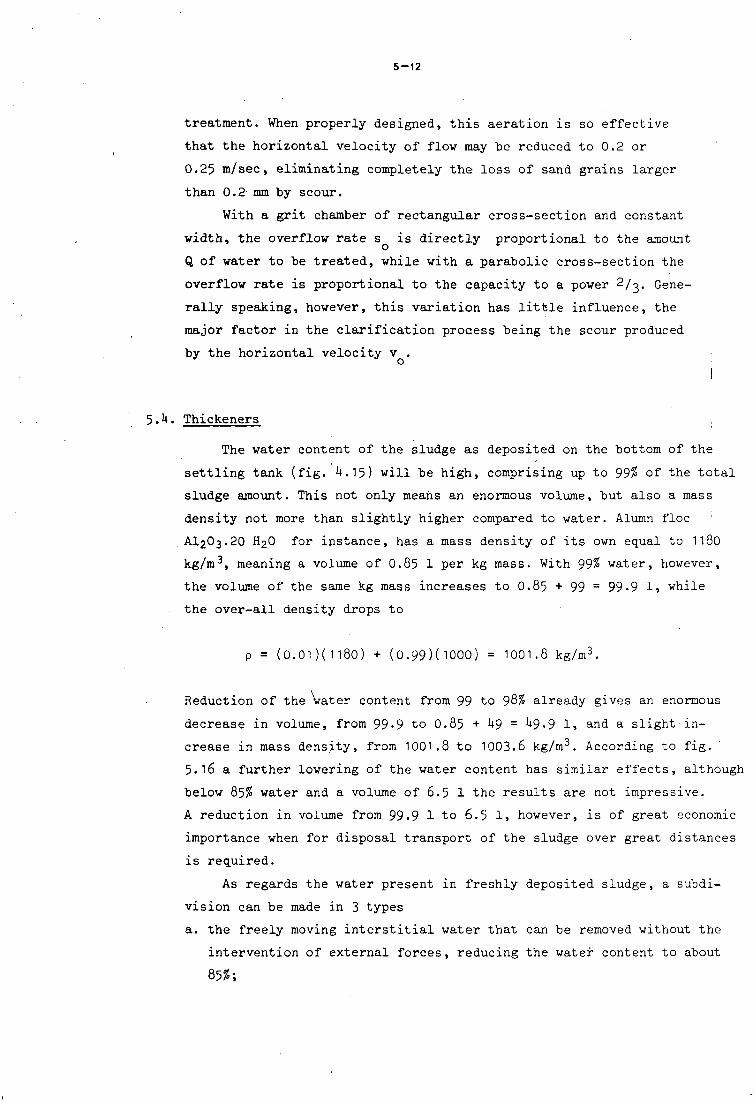
5-12
treatment. When properly designed, this aeration is so effective
that the horizontal velocity of flow may he reduced to 0.2 or
0.25 m/sec, eliminating completely the loss of sand grains larger
than 0.2 mm by scour.
With a grit chamber of rectangular cross-section and constant
width, the overflow rate s is directly proportional to the amount
Q of water to be treated, while with a parabolic cross-section the
overflow rate is proportional to the capacity to a power 2/^. Gene
rally speaking, however, this variation has little influence, the
major factor in the clarification process being the scour produced
by the horizontal velocity v .
I
5.U. Thickeners
The water content of the sludge as deposited on the bottom of the
settling tank (fig. U. 15) will be high, comprising up to 99$ of the total
sludge amount. This not only means an enormous volume, but also a mass
density not more than slightly higher compared to water. Alumn floe
AI2O3.20 H2O for instance, has a mass density of its own equal to 1180
kg/m3, meaning a volume of 0.85 1 per kg mass. With 99$ water, however,
the volume of the same kg mass increases to O.85 + 99 = 99-9 1, while
the over-all density drops to
p = (0.01)(1180) + (0.99)(1000) = 1001.8 kg/m3.
Reduction of the water content from 99 to 98$ already gives an enormous
decrease in volume, from 99•9 to O.85 + ^9 = ^9-9 1, and a slight'in
crease in mass density, from 1001.8 to 1003.6 kg/m3. According to fig.
5.16 a further lowering of the water content has similar effects, although
below 85$ water and a volume of 6.5 1 the results are not impressive.
A reduction in volume from 99.9 1 to 6.5 1, however, is of great economic
importance when for disposal transport of the sludge over great distances
is required.
As regards the water present in freshly deposited sludge, a subdi
vision can be made in 3 types
a. the freely moving interstitial water that can be removed without the
intervention of external forces, reducing the water content to about
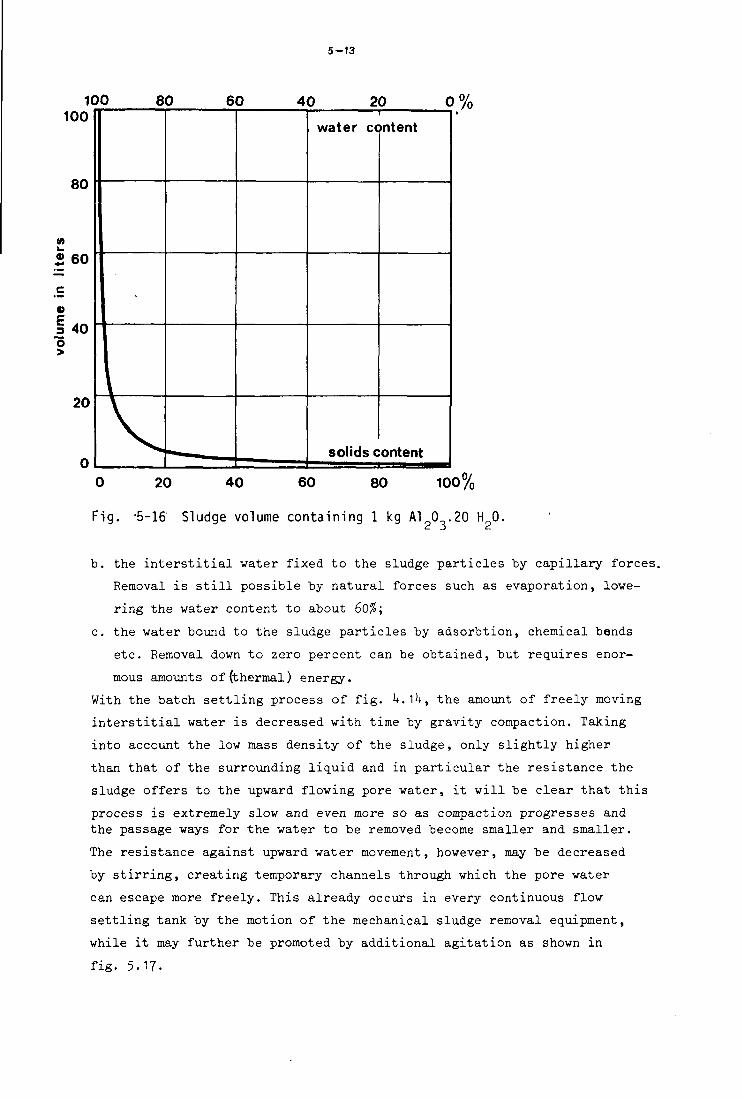
5-13
100 100
80
(A
* 60
« | 40 o >
20
80 60 40 20 1
water content
solids c ontent
o%
20 40 60 80 100%
Fig. -5-16 Sludge volume containing 1 kg AT 0 .20 HO.
b. the interstitial water fixed to the sludge particles by capillary forces.
Removal is still possible by natural forces such as evaporation, lowe
ring the water content to about 60%;
c. the water bound to the sludge particles by adsorbtion, chemical bends
etc. Removal down to zero percent can be obtained, but requires enor
mous amounts of (thermal) energy.
With the batch settling process of fig. U.1U, the amount of freely moving
interstitial water is decreased with time by gravity compaction. Taking
into account the low mass density of the sludge, only slightly higher
than that of the surrounding liquid and in particular the resistance the
sludge offers to the upward flowing pore water, it will be clear that this
process is extremely slow and even more so as compaction progresses and the passage ways for the water to be removed become smaller and smaller.
The resistance against upward water movement, however, may be decreased
by stirring, creating temporary channels through which the pore water
can escape more freely. This already occurs in every continuous flow
settling tank by the motion of the mechanical sludge removal equipment,
while it may further be promoted by additional agitation as shown in
fig. 5.17.
5 - 1 4
Schlommschild
Zulouf
Schiammsumpf' \ / entnohme
Fig. 5-17 Thickening in the sludge sump of a circular tank.
Stu/enoblosse f Schlammwasser schwenkbares [ntnohmerohr
I Schlammwasser
v&m
Zulouf
Oickschla'mmentnohme
Ablaufnnne
Schlammwasser i fmlouf
ilberlaul
Dickschlommentnohme
schwenkbares [ntnohmerohr f Schlammwasser
c ' \ Oickschlamm entnohme
Schlammwasser, z fmlouf
Uberlouf
Zulouf Oickschlommentnohme Zulouf
Fig. 5-18 Fill-and-draw thickeners.

5-15
When settling tanks are equipped with mechanical sludge removal
devices, the detention time of the sludge in the tank will be small and
the reduction in the water content of the sludge by gravity compaction
and stirring of little importance. Much better results can be obtained by
resettling the sludge in separate tanks, equipped with specially designed
stirring mechanisms and allowing the addition of chemical conditioners
to speed up the process. Fill-and-draw type thickeners are shown in fig.
5.18 and abstract the liberated pore water near the surface, either with
multiple outlets at various heights or with a moving outlet supported by
a float. The detention time is now between I and 2 days and excellent
results can be obtained, reducing the water content to below 90%.
Continuous flow type thickeners (fig. 5.19) are better suited when
an uninterrupted supply of sludge must be handled, but clarification
effect is decidedly smaller.
Fig. 5-19 Continuous flow thickeners.

^
6-1
6. Flotation
Flotation is the reverse process of sedimentation, the removal
by gravitational rising of suspended particles that are lighter than
water. Flotation occurs in every sedimentation tank where the horizontal
velocity is decreased and oil, grease and other matters ascend naturally
to the surface during substantial quiescence. Such basins must therefore
be equipped with skimming devices to remove the accumulated scum, as
explained in section 3.9- In the field of water and waste water engi
neering, flotation as a separate process is applied in three different ways
a. with grease traps (fig. 6.1) to keep back inflammable matter such
as oil or clogging matter such as fat before discharge into the
sewerage system;
b. as sole treatment of oil contaminated bilge water on board of ships
(fig. 6.2) or oil containing drainage water of refineries (fig. 6.3).
Fig. 6-1 Grease traps.
Cooling water
Fig. 6-2 Ti l ted plate separator
for o i l removal.
B-B
VERTICAL SLOT BAFFLE--,
GATEWAY PIER-
6 - 2
IGHT SCRAPER CHAIN SPROCKET rROTATABLE OO. SKIMMING P*"E
FLIGHT SCRAPER CHAIN Ny
FLIGHTS
EFFLUENT WEIR ANO WALL^
WATER LEVEL
FLOW
OIL RETENTION BAFFLE FORE BAT
SLOT TOR CHANNEL GATE-
SLUDGE COLLECTING HOPPER-
SLUDGE COLLECTING HOPPER DISCHARGE WITH LEAD PLUG
SLUDGE PUMP SUCTION PIPE
EFFLUENT SEWER-
EFFLUENT FLUME-
Fig. 6-3 Rectangular horizontal flow tank for oil removal
( American Petroleum Institute )
c. as preliminary treatment to lighten the load on subsequent settling
tanks when large amounts of scum are expected, as may be the case
with many industrial effluents.
Skimming tanks are commonly designed on the basis of overflow rate with
the surface area of the tank as. deciding factor. Surface loadings
vary from (1)10~3 m/sec to (3)10~3 m/sec for domestic sewage with
much higher values for special applications. As regards the shape of
the tank, turbulence and bottom scour do not need to be feared and
these tanks are therefore designed as long, narrow, trough-shaped struc
tures with a high velocity of horizontal flow. The depth is commonly
between 1 and 2 m, giving detention period varying from 300 to about
1500 sec. With the greater depth and larger detention periods, flotation
efficiency is improved by flocculation, hut there is also more danger
that settled out material accumulates on the bottom of the tank. Short
detention periods, 300-500 seconds are therefore commonly preferred
and flocculation when necessary is promoted by the addition of various
chemicals. In case settling cannot be prevented, removal of detritus
must be incorporated in the flotation process by equipping the unit
with sludge removal facilities. When desired, greater widths and
shorter lengths may now also be applied.
Flotation can be promoted and extended to particles that are
slightly heavier than water, by introducing finely divided air or
gas bubbles at the bottom of the tank. These bubbles attach themselves
to the suspended particles, increasing their buoyancy and entangling
them in the surface foam that the bubbles create. An example of such
an aerated skimming tank is shown' in fig. 6.k, where vertical baffles
separate the tank into a central aerated channel and two lateral
stilling chambers in which oil and grease gather at the surface. The

6 - 3
Slotted Aerated Stilling baffle \ channel /chamber .Inlet baffle
Trough for skimmings
^ - A Air t T_ ' • Inclined outlet
Cross section Longitudinal section
Fig. 6-4 Aerated skimming tank using dispersed air.
baffles are slotted near the water level to provide entrance into
the stilling compartments. Settleable matter slides back into the
centre channel where it is resuspended and moved forward till it
ultimately reaches the inclined outlet from the tank. Air require
ments are commonly small, about 0.2 m3 of air per m3 of water, but
when this aeration is also meant to freshen the raw liquor, larger
amounts of air and larger detention times, 2000 sec for instance, are
required. Air as a.flotation agent in the meanwhile is more effective as air bubbles are smaller, increasing their number and the chance of
contact with suspended particles. Extremely fine air bubbles can be
obtained when part of the clarified effluent is pressurized to 2 or
h atmosphere in contact with sufficient air to approach saturation
(fig. 6.5)• When this air-saturated liquid is brought into or mixed
EFFLUENT
PRESSURIZING PUMP
Fig. 6-5 Aerated skimming tank using dissolved air.
6-4
with the water to be treated in the flotation tank under atmospheric
pressure extremely fine air hubbies are released from solution with
the suspended particles as nuclei, increasing their buoyandy and thus
promoting flotation efficiency.
Disposal of skimmings is again a difficult problem. When larger
amounts of mineral oil are present, it can best be burned or buried
together with rakings and screenings. When grease predominates, the
skimmings can be added to the sludge in digester tanks, increasing
gas production.
7- 1
1. A study of the rational design of settling tanks. T.R. Camp.
Journal of Sewage Works, vol. 8 (1936) biz. 72+2-758.
2. Sedimentation in quiescent and turbulent basins. J.J. Slade.
Transactions of the American Society of Civil Engineers, no 102 (1937)
biz. 289-305.
t
3. Grit chamber design. T. Camp.
Journal of Sewage Works,.vol. 1U (19U2), biz. 368-381.
U. Experiments with a circular sedimentation tank. F.C. Vokes.
Journal and proceedings of the institution of sewage purification,
Ann. summer conf. London 2Uth June, (19U3), biz. 11-2U.
5. Non-flocculated suspensions of uniform spheres. Suspensions of uniform-
size angular particles. Concentrated flocculated suspensions of powders.
H.II. Steinour.
Industrial and engineering Chemistry, vol. 36 (19^)> biz. 618-62U,
8^0-8^7, 901-907.
6. Design of final settling tanks for activated sludge. N.E. Anderson.
Journal of Sewage Works, vol. 17 (19**5), biz. 50-65.
7. Sedimentation and the design of settling tanks. T.R. Camp.
Transactions of the American Society of Civil Engineers, no 111 (19**6)
biz. 895-958.
8. Settling characteristics of suspensions in water treatment processes.
A.A. Kalinske.
Journal of the American Water Works Association, vol. ho (19^8), biz.
113-120.
9. Bezinking als onderdeel van de waterzuivering. N. Schaafsma.
De Ingenieur, G (1950), biz. 1-G 5-
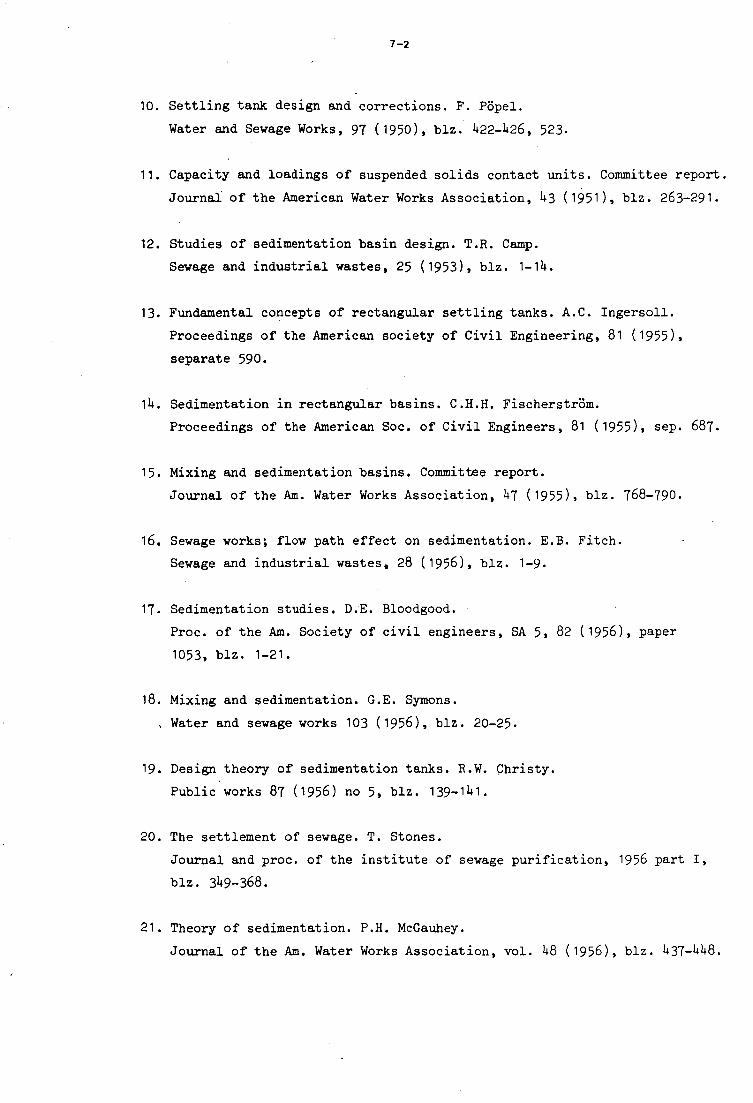
7-2
10. Settling tank design and corrections. F. Popel.
Water and Sewage Works, 97 (1950), biz. U22-U26, 523-
11. Capacity and loadings of suspended solids contact units. Committee report.
Journal of the American Water Works Association, 1*3 (1951), biz. 263-291.
12. Studies of sedimentation "basin design. T.R. Camp.
Sewage and industrial wastes, 25 (1953), biz. 1—1U.
13. Fundamental concepts of rectangular settling tanks. A.C. Ingersoll.
Proceedings of the American society of Civil Engineering, 81 (1955),
separate 590.
1U. Sedimentation in rectangular basins. C.H.H. Fischerstrom.
Proceedings of the American Soc. of Civil Engineers, 81 (1955), sep. 687-
15- Mixing and sedimentation basins. Committee report.
Journal of the Am. Water Works Association, U7 (1955), biz. 768-790.
16. Sewage works; flow path effect on sedimentation. E.B. Fitch.
Sewage and industrial wastes, 28 (1956), biz. 1-9.
17- Sedimentation studies. D.E. Bloodgood.
Proc. of the Am. Society of civil engineers, SA 5, 82 (1956), paper
1053, biz. 1-21.
18. Mixing and sedimentation. G.E. Symons.
, Water and sewage works 103 (1956), biz. 20-25-
19. Design theory of sedimentation tanks. R.W. Christy.
Public works 87 (1956) no 5, biz. 139-1U1.
20. The settlement of sewage. T. Stones.
Journal and proc. of the institute of sewage purification, 1956 part I,
biz. 3^9-368.
21. Theory of sedimentation. P.H. McGauhey.
Journal of the Am. Water Works Association, vol. U8 (1956), biz. kyj-kkQ.

7-3
22. New concepts of sedimentation. W.E. Budd.
Public works 88 (1957) no. 12, biz. 93-95.
23. Significance of detention in sedimentation. E.B. Fitch.
Sewage and industrial wastes 29 (1957), biz. 1123-1133.
2k. An improved circular sedimentation tank, design. B.S. Bergman.
Journal and proceedings of the Institute of sewage purification (1958)
part I, biz. 50-67.
25. Significance of detention in sedimentation-discussion. N.C.H. Fischerstrom.
Sewage and industrial wastes, 30 (1958), biz. 1357-1360.
26. The behaviour of suspensions. A.W. Bond.
Civil Engineering Transactions, Australia, March 1959•
27. Sedimentation and preaeration experiments at Los Angeles. R.J. Theroux.
Sewage and industrial wastes, 31 (1959), biz. 1259-1266.
28. Advances in water supply technology. A.A. Kalinske.
Journal of the American Water Works Association, 52 (i960), biz. 199-20U.
29. Feedwells for density stabilization. E.B. Fitch.
Journal of the Water Pollution Control Federation, 32 (i960), biz. 11*7-156.
30. Fundamental principles of dissolved-air flotation of industrial wastes.
E.R. Vrablik.
Engineering bulletin of Purdue University. Industrial Waste Conference.
Engineering extension series no 10l*, kk (i960), no 5 biz. 7^3-779.
31. Physikalischen Feststoff-Fliissigkeits-Trennung und ihr Einflusz auf den
Bau von Entwasserungseinrichtungen. W. Heckmann.
Gluckauf, 96 (1960), biz. 1281-1287.
32. Behaviour of suspensions. A.W. Bond.
Journal of the Institution of Water Engineers, 15 (1961), biz. U9U-516.
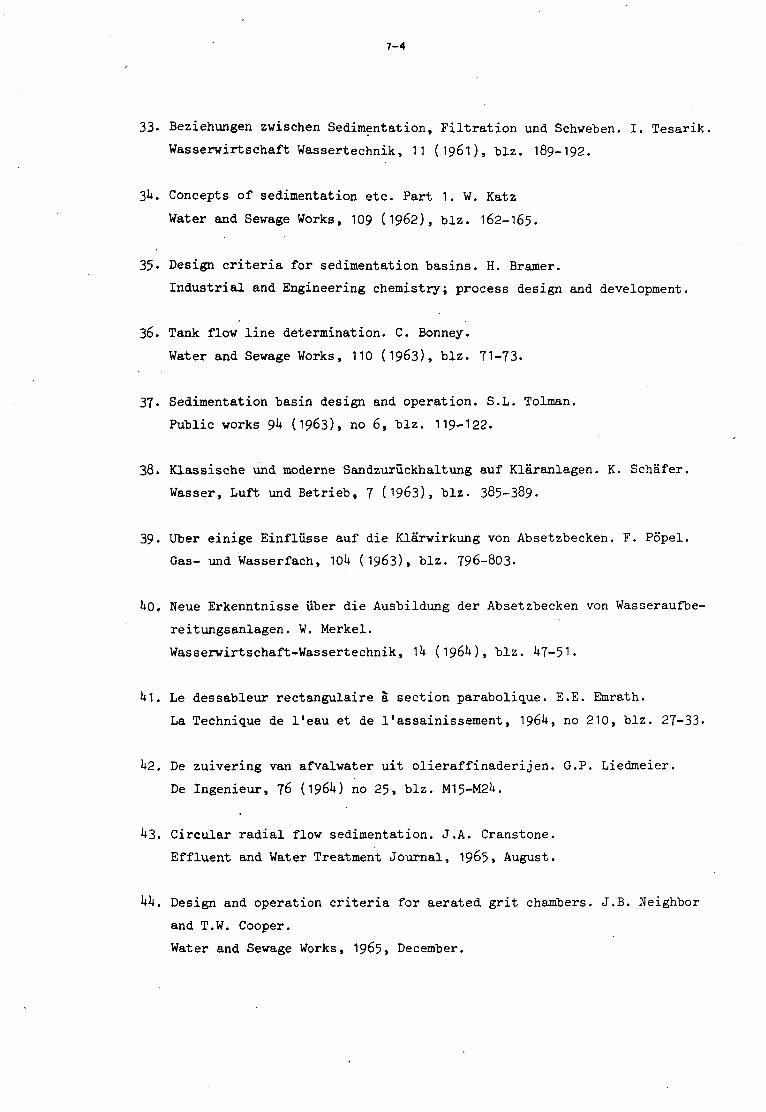
7-4
33- Beziehungen zwischen Sedimentation, Filtration und Schveben. I. Tesarik.
Wasserwirtschaft Wassertechnik, 11 (1961), biz. 189-192.
3I+. Concepts of sedimentation etc. Part 1. W. Katz
Water and Sewage Works, 109 (1962), biz. 162-165.
35- Design criteria for sedimentation basins. H. Bramer.
Industrial and Engineering chemistry; process design and development.
36. Tank flow line determination. C. Bonney.
Water and Sewage Works, 110 (1963), biz. 71-73.
37. Sedimentation basin design and operation. S.L. Tolman.
Public works 9k 0963), no 6, biz. 119-122.
38. Klassische und moderne Sandzuruckhaltung auf Klaranlagen. K. Schafer.
Wasser, Luft und Betrieb, 7 (1963), biz. 385-389.
39. Uber einige Einflusse auf die Klarwirkung von Absetzbecken. F. Popel.
Gas- und Wasserfach, 10U (1963), biz. 796-803.
1+0. Neue Erkenntnisse uber die Ausbildung der Absetzbecken von Wasseraufbe-
reitungsanlagen. W. Merkel.
Wasserwirtschaft-Wassertechnik, 11+ (196U), biz. UT—51.
Ul. Le dessableur rectangulaire a section parabolique. E.E. Emrath.
La Technique de l'eau et de l'assainissement, 196I+, no 210, biz. 27-33.
1+2. De zuivering van afvalwater uit olieraffinaderijen. G.P. Liedmeier.
De Ingenieur, 76 (1961+) no 25, biz. M15-M2U.
1+3. Circular radial flow sedimentation. J.A. Cranstone.
Effluent and Water Treatment Journal, 1965» August.
1+1+. Design and operation criteria for aerated grit chambers. J.B. Neighbor
and T.W. Cooper.
Water and Sewage Works, 1965, December.
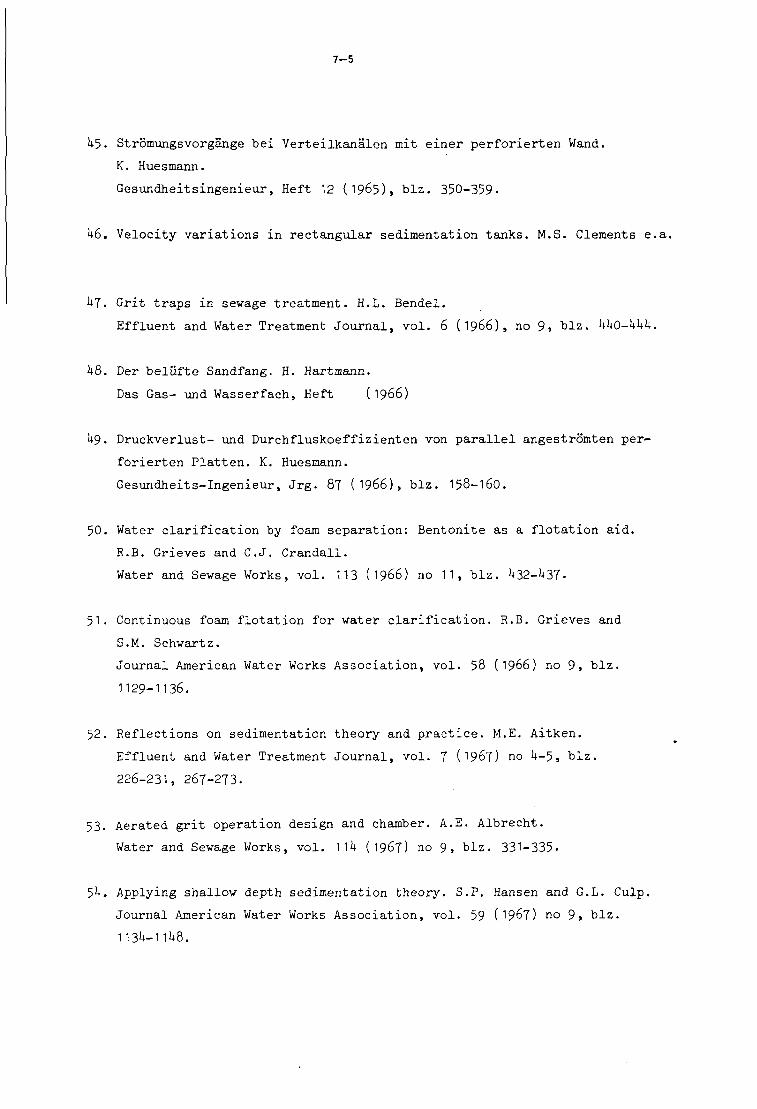
7-5
U5- Stromungsvorgange bei Verteilkanalen mit einer perforierten Wand.
K. Huesmann.
Gesundheitsingenieur, Heft 12 (1965), biz. 350-359-
U6. Velocity variations in rectangular sedimentation tanks. M.S. Clements e.a
kj. Grit traps in sewage treatment. H.L. Bendel.
Effluent and Water Treatment Journal, vol. 6 (1966), no 9, biz. UUO-UUU.
U8. Der belufte Sandfang. H. Hartmann.
Das Gas- und Wasserfach, Heft (1966)
U9. Druckverlust- und Durchfluskoeffizienten von parallel angestromten per
forierten Piatten. K. Huesmann.
Gesundheits-Ingenieur, Jrg. 87 (1966), biz. 158-160.
50. Water clarification by foam separation: Bentonite as a flotation aid.
R.B. Grievec and C.J. Crandall.
Water and Sewage Works, vol. 113 (1966) no 11, biz. U32-U37-
51. Continuous foam flotation for water clarification. R.B. Grieves and
S.M. Schwartz.
Journal American Water Works Association, vol. 58 (1966) no 9, biz.
1129-1136.
52. Reflections on sedimentation theory and practice. M.E. Aitken.
Effluent and Water Treatment Journal, vol. 7 (1967) no U-5> biz.
226-231, 267-273.
53. Aerated grit operation design and chamber. A.E. Albrecht.
Water and Sewage Works, vol. 1U ( 1967) no 9, biz. 331-335-
5^. Applying shallow depth sedimentation theory. S.P. Hansen and G.L. Culp.
Journal American Water Works Association, vol. 59 (1967) n o 9, biz.
113U11U8.
7-6
55. Fliesvorgang und Sedimentation. J. Weidner.
Wassergutewirtschaft Abfallbeseitigung Probleme Losungen, biz. 77-95-
56. Floe volume concentration. T.R. Camp.
High-Rate sedimentation in water treatment works. G. Culp, S. Hansen
and G. Richardson.
Journal American Water Works Association, vol. 60 (1968) no 6, biz.
656-673, 681-698.
57- Initial depth as a variable in activated sludge settling tests.
P.A. Vesilind and R.I. Dick.
Effluent and Water Treatment Journal, vol. 9 (1969) no 5, biz. 263-267.
58. Characterization of settling tanks by Eddy Diffusion. H.M. El-Baroudi.
Journal of the Sanitary Engineering Division, vol. 95 (1969) no SA3,
biz. 527-5M.
59. Tube clarification process, operating experiences. G.L. Culp, K.Y.
Hsiung and W.R. Conley.
Journal of the Sanitary Engineering Division, vol. 95 0969) no SA5
biz. 829-8U7.
60. A break-through in the tracer studies of sedimentation tanks.
Thirumurthi Dhandapani.
Journal Water Pollution Control Federation, vol. U1 (1969) no 11,
biz. R1;05-R1*18.
61. Practical application of idealized sedimentation theory in wastewater
treatment. S.P. Hansen, G.L. Culp and J.R. Stukenberg.
Journal Water Pollution Control Federation, vol. U1 (1969) no 8,
biz. -\k2U-\kkk.
62. Theoretical study of high-rate sedimentation. K.M. Yao.
Journal Water Pollution Control Federation, vol. H2 (1970) no 2,
biz. 218-228.
63. Improved settling tank efficiency by upward flow clarification.
V.R. Sparham.
Journal Water Pollution Control Federation, vol. U2 (1970) no 5, biz.
801-811.
7-7
6U. Shearing effects on settling of activated sludge. R.A. Bradley and
R.B. Krone.
Journal of the Sanitary Engineering Division, vol. 97 (1971) no SA1,
biz. 59-79-
65. Physical behavior of flocculent suspensions in up flow. J.C. Brown
and E. LaMotta.
Journal of the Sanitary Engineering Division, vol. 97 (1971) no SA2,
biz. 209-22U.
66. Recent experience in plant-scale application of the settling tube
concept. A.F. Slechta and W.R. Conley.
Journal Water Pollution Control Federation, vol. k3 (1971) no 8,
biz. 172U-1738.
67. Etude de la sedimentation. D.A. Wilms and M.J. Snel.
La Technique de l'eau (1971) no 290, biz. 37-^5•
68. Graphical methods for determining hindered settling velocities.
Ir. G.J.A. van Lummel.
De Ingenieur, 1971, biz. M9-M12.
69. Outlet weirs for trapezoidal grit chambers. N.S. Lakshmana Rao,
and D. Chandrasekaran.
Journal Water Pollution Control Federation, vol. ^ (1972) no 3»
biz. 1+59-U69.

0
Mechanical filtration
Contents
1. Definitions and terms
2. Screens
3. Strainers
h. Principles of micro-strainers
5. Construction, operation and application of micro-strainers
6. Principles of pre-coat filtration
7. Construction, operation and application of diatomite filters
8. Selected literature
1
1. Definitions and terms
Mechanical filtration is the process whereby the water to be
treated is passed through a porous membrane, consisting of closely
spaced bars or gratings, perforated plates, woven wirecloth or
fabric, etc, retaining the floating and suspended particles that
are larger in size than the openings in this screening device.
With time an accumulation of strained-out material occurs, by
which the effective openings in the membrane are reduced and also
smaller particles can be retained. Thi« process may be enhanced
by adding to the raw water inert fibrous or powdered material, so-
called filter aid, capable of forming a mat of intertwined threads
or a granular layer which now does the actual work, the porous
membrane itself only serving to support this layer of filtering
material. Under all circumstances, however, the thickness of this
filtering layer is small and its action entirely mechanical.
Mechanical filtration may serve different purposes. In the
field of water and waste water engineering the most important ones
are
a. protection of the treatment plant by removal of the grosser
floating and suspended impurities which otherwise might clog
pipelines and channels, damage pumps and other mechanical equip
ment or interfere with the satisfactory operation of the various
unit operations;
b. clarification of the passing liquid by removal of more finely
divided particulate matter. Mechanical filtration alone is sel
dom able to give the desired amount of purification, but it may
be of invaluable help to lighten the load on subsequent treat
ment processes, to reduce the volume of the sludge zone in
settling tanks, to prevent a rapid clogging of slow sand filtres,
etc.
Next to this, mechanical filtration is used extensively for the
dewatering of sludge in water and waste water treatment plants.
When during operation retained material accumulates on the
porous membrane, the openings decrease in size and combined area,
increasing the resistance against the passage of water. After some
time this resistance becomes so high that cleaning of the filter is
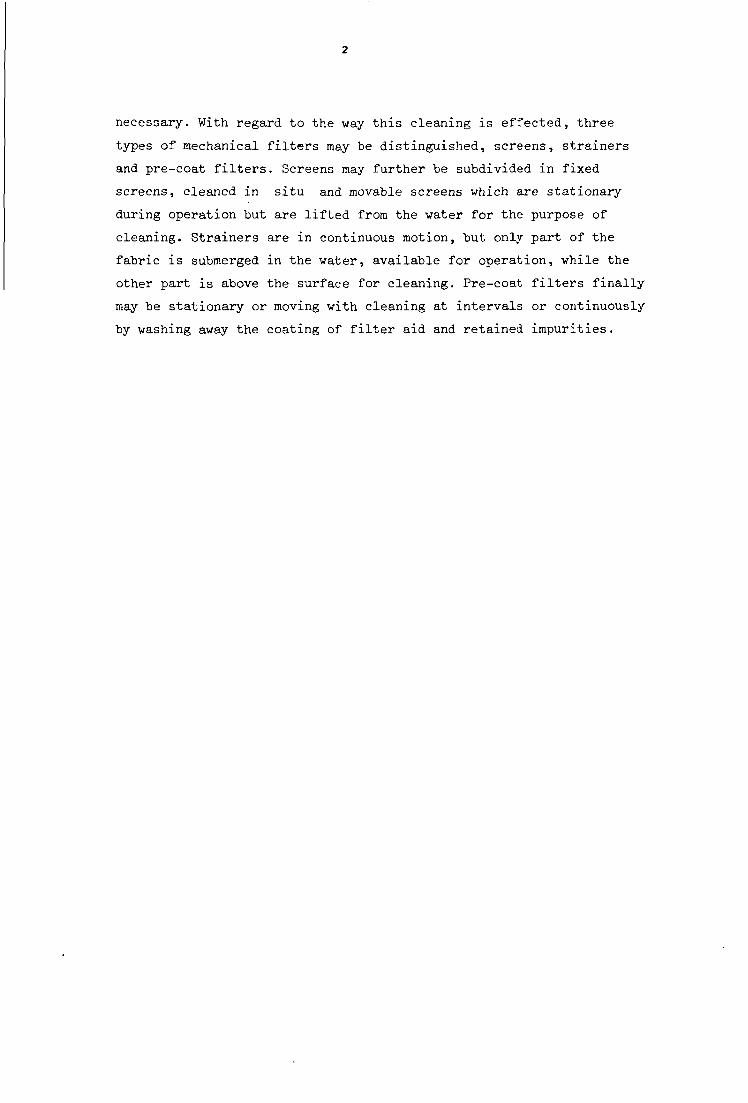
2
necessary. With regard to the way this cleaning is effected, three
types of mechanical filters may be distinguished, screens, strainers
and pre-coat filters. Screens may further be subdivided in fixed
screens, cleaned in situ and movable screens which are stationary
during operation but are lifted from the water for the purpose of
cleaning. Strainers are in continuous motion, but only part of the
fabric is submerged in the water, available for operation, while the
other part is above the surface for cleaning. Pre-coat filters finally
may be stationary or moving with cleaning at intervals or continuously
by washing away the coating of filter aid and retained impurities.
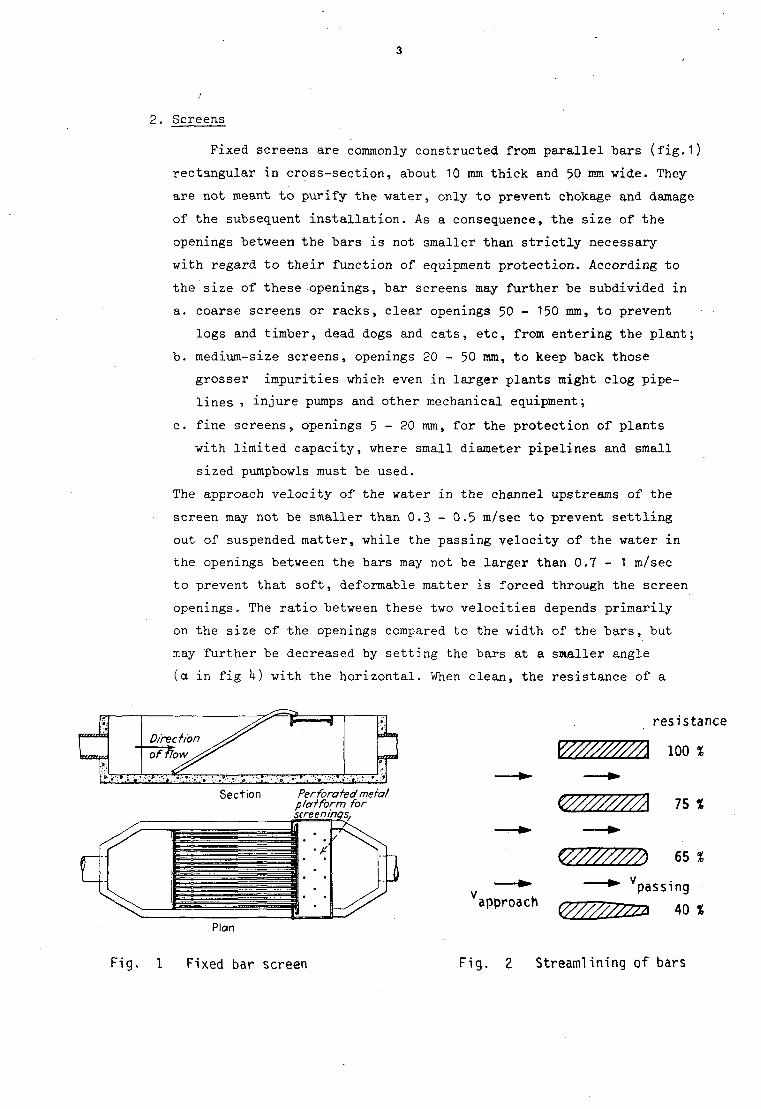
3
2. Screens
Fixed screens are commonly constructed from parallel tars (fig.1)
rectangular in cross-section, about 10 mm thick and 50 mm wide. They
are not meant to purify the water, only to prevent chokage and damage
of the subsequent installation. As a consequence, the size of the
openings between the bars is not smaller than strictly necessary
with regard to their function of equipment protection. According to
the size of these openings, bar screens may further be subdivided in
a. coarse screens or racks, clear openings 50 - 150 mm, to prevent
logs and timber, dead dogs and cats, etc, from entering the plant;
b. medium-size screens, openings 20 - 50 ram, to keep back those
grosser impurities which even in larger plants might clog pipe
lines , injure pumps and other mechanical equipment;
c. fine screens, openings 5 - 2 0 mm, for the protection of plants
with limited capacity, where small diameter pipelines and small
sized pumpbowls must be used.
The approach velocity of the water in the channel upstreams of the
screen may not be smaller than 0.3 - 0.5 m/sec to prevent settling
out of suspended matter, while the passing velocity of the water in
the openings between the bars may not be larger than 0.7 - 1 m/sec
to prevent that soft, deformable matter is forced through the screen
openings. The ratio between these two velocities depends primarily
on the size of the openings compared to the width of the bars, but
may further be decreased by setting the bars at a smaller angle
(a in fig k) with the horizontal. When clean, the resistance of a
c
Perforated metal platform for
}
Plan
resistance
V/////////A loo*
W///////A 75%
V//////M <** ^* ^ vpassing
a P P r ° a C h <&Z%ZZZ2 40 *
Fig. 1 Fixed bar screen Fig. 2 Streamlining of bars
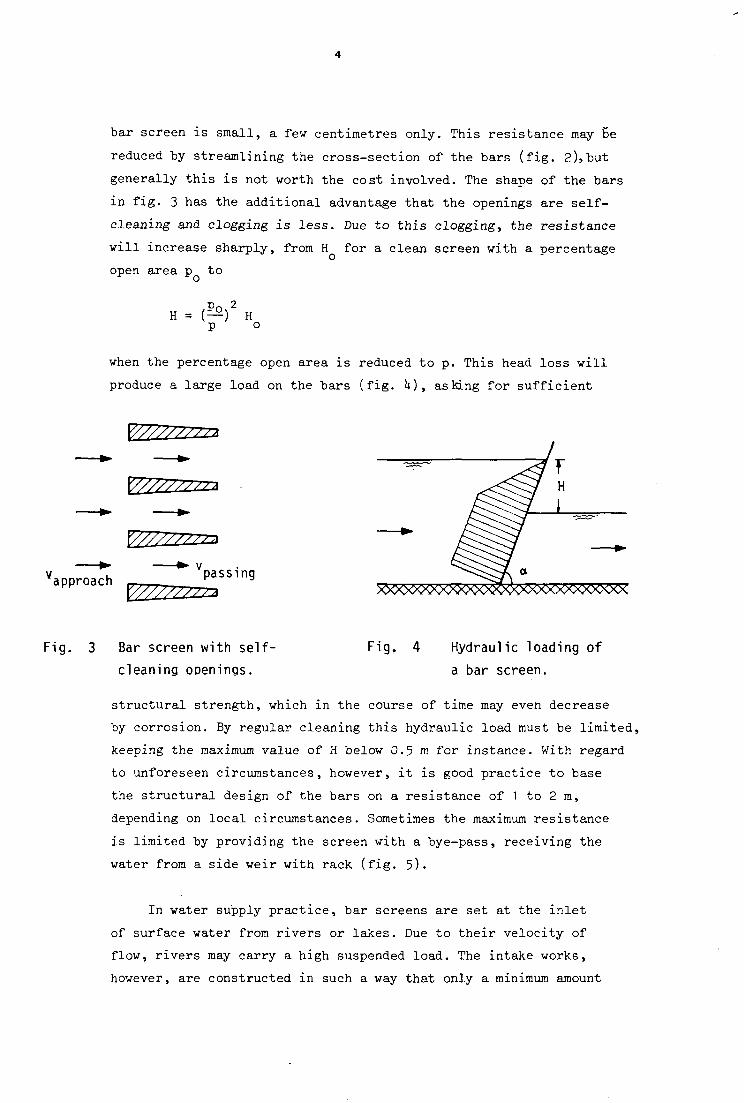
4
bar screen is small, a few centimetres only. This resistance may be
reduced by streamlining the cross-section of the bars (fig. 2), but
generally this is not worth the cost involved. The shape of the bars
in fig. 3 has the additional advantage that the openings are self-
cleaning and clogging is less. Due to this clogging, the resistance
will increase sharply, from H for a clean screen with a percentage
open area p to
Vn 2
H = (—) H P °
when the percentage open area is reduced to p. This head loss will
produce a large load on the bars (fig. U), asking for sufficient
Fig. 3 Bar screen with self- Fig. 4 Hydraulic loading of
cleaning openings. a bar screen.
structural strength, which in the course of time may even decrease
by corrosion. By regular cleaning this hydraulic load must be limited,
keeping the maximum value of H below 0,5m for instance. With regard
to unforeseen circumstances, however, it is good practice to base
the structural design of the bars on a resistance of 1 to 2 m,
depending on local circumstances. Sometimes the maximum resistance
is limited by providing the screen with a bye-pass, receiving the
water from a side weir with rack (fig. 5).
In water supply practice, bar screens are set at the inlet
of surface water from rivers or lakes. Due to their velocity of
flow, rivers may carry a high suspended load. The intake works,
however, are constructed in such a way that only a minimum amount
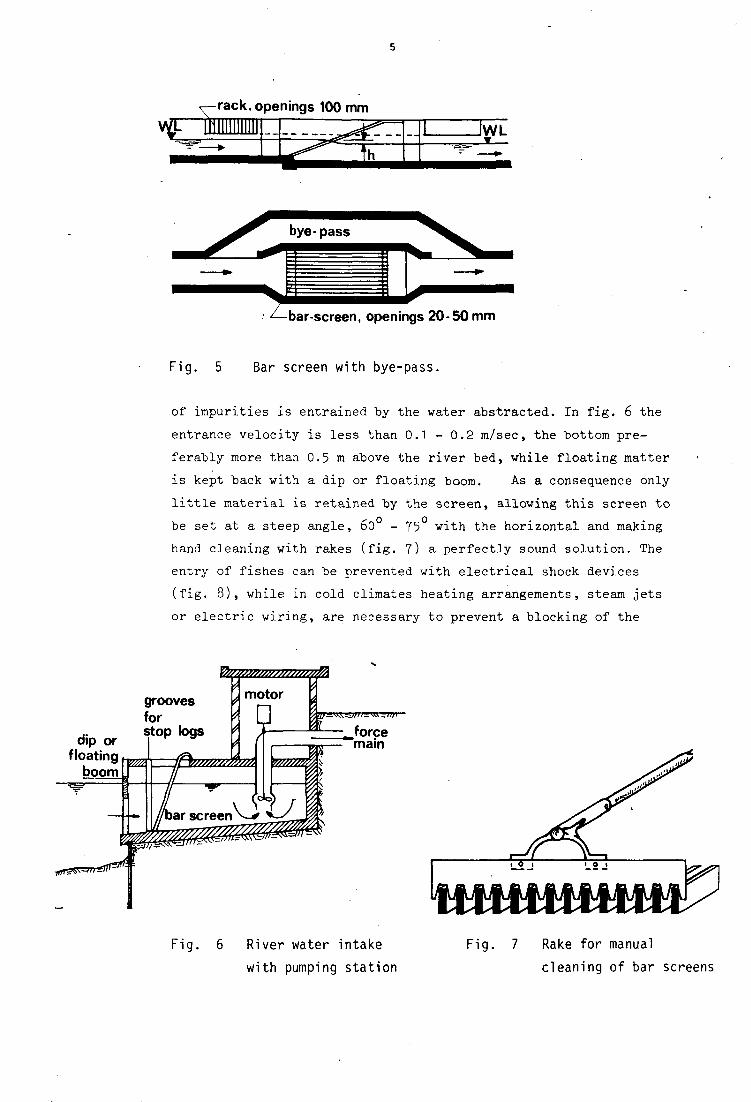
5
rack, openings 100 mm
bar-screen, openings 20-50 mm
Fig. 5 Bar screen with bye-pass.
of impurities is entrained by the water abstracted. In fig. 6 the
entrance velocity is less than 0.1 - 0.2 m/sec, the bottom pre
ferably more than 0.5 m above the river bed, while floating matter
is kept back with a dip or floating boom. As a consequence only
little material is retained by the screen, allowing this screen to
be set at a steep angle, 60 - 75 with the horizontal and making
hand cleaning with rakes (fig. 7) a perfectly sound solution. The
entry of fishes can be prevented with electrical shock devices
(fig. 8), while in cold climates heating arrangements, steam jets
or electric wiring, are necessary to prevent a blocking of the
dip or floating boom
grooves for stop logs
ft£f£ftf£tf£t$i/ Fig. 6 River water intake
with pumping station
Fig. 7 Rake for manual
cleaning of bar screens
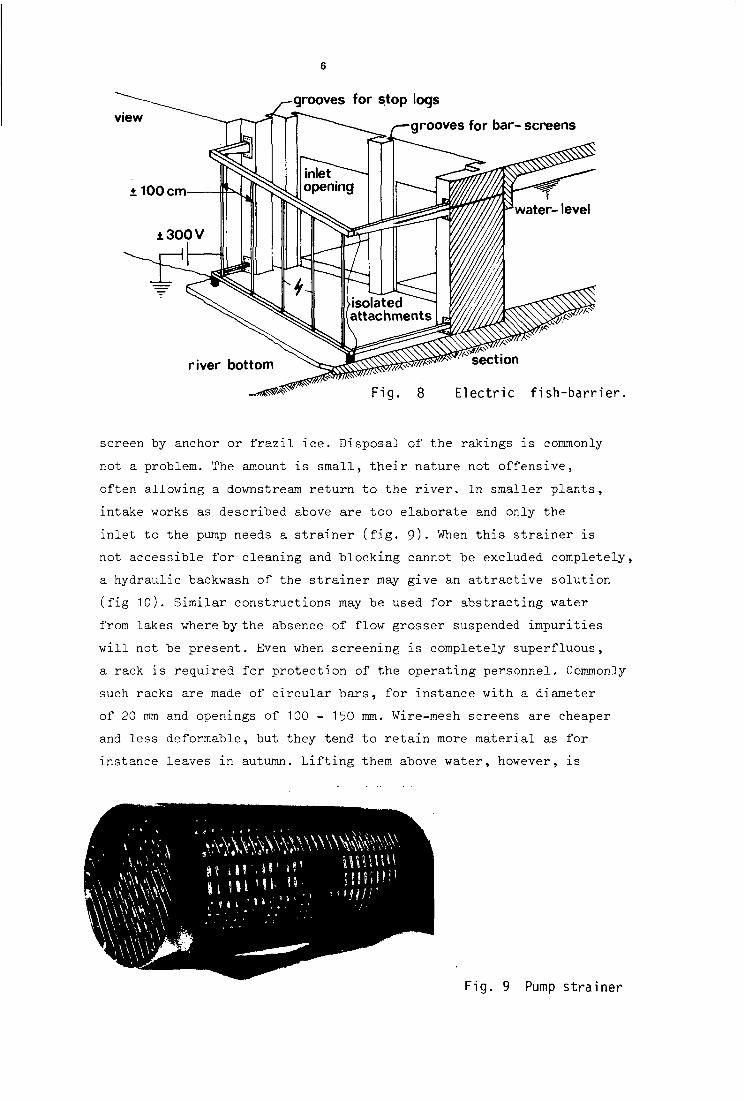
6
-grooves for stop logs
-grooves for bar- screens
river bottom
Fig. 8 Electric fish-barrier.
screen by anchor or frazil ice. Disposal of the rakings is commonly
not a problem. The amount is small, their nature not offensive,
often allowing a downstream return to the river. In smaller plants,
intake works as described above are too elaborate and only the
inlet to the pump needs a strainer (fig. 9)- When this strainer is
not accessible for cleaning and blocking cannot be excluded completely,
a hydraulic backwash of the strainer may give an attractive solution
(fig 10). Similar constructions may be used for abstracting water
from lakes where by the absence of flow grosser suspended impurities
will not be present. Even when screening is completely superfluous,
a rack is required for protection of the operating personnel. Commonly
such racks are made of circular bars, for instance with a diameter
of 20 mm and openings of 100 - 150 mm. Wire-mesh screens are cheaper
and less deformable, but they tend to retain more material as for
instance leaves in autumn. Lifting them above water, however, is
,• M i •'*'..
Fig. 9 Pump strainer

Fig. 10 Riverwater intake with a hydraulically back-washed screen.
pressure water for back-washing
^55^ v1
#
I -TXZZZZZZEpZT
3EEt V- P ,\
£4
WbMM; ft
easy after which they can be cleaned with a jet of pressure water.
Very conscientious engineers construct such movable screens in du
plicate, so that one is always in the water for operation while the
other is above water for cleaning.
In waste water treatment plants, bar screens for equipment
protection are set before the pumps and when no pumping is required
before the primary settling tank or grit chamber when present. Compared
with river water, the amount of floating and suspended matter is
much larger, while furthermore no selection can be made and all
this material must be processed. As a consequence, large amounts of
screenings must be expected, for municipal sewage roughly
size openings 5 10
screenings 15 10
20 50 mm
5 2 x 10"3 m3/capita /year
A plant handling the domestic sewage from 100.000 people will have a
maximum hydraulic capacity of about 0.6 m3/sec, asking for a screen
area of 1 - 1.5 i2 on to which an amount of 1 - 3 m3 of suspended
matter will be retained each day. This amount is so large, that
hand cleaning with long-tined rakes is only possible when the screens
are set with a small angle, down to 20 or 25 , with the horizontal.
Such a flat position has the added advantage that the flowing water
pushes the retained material to the top of the screen, facilitating
cleaning, while the damming effect of a partially blocked screen
raises the upstream water level, by which the wetted screen area
will increase appreciably. With regard to the origin and putrescibility
of the screenings, manual cleaning is an unpleasant task to say the
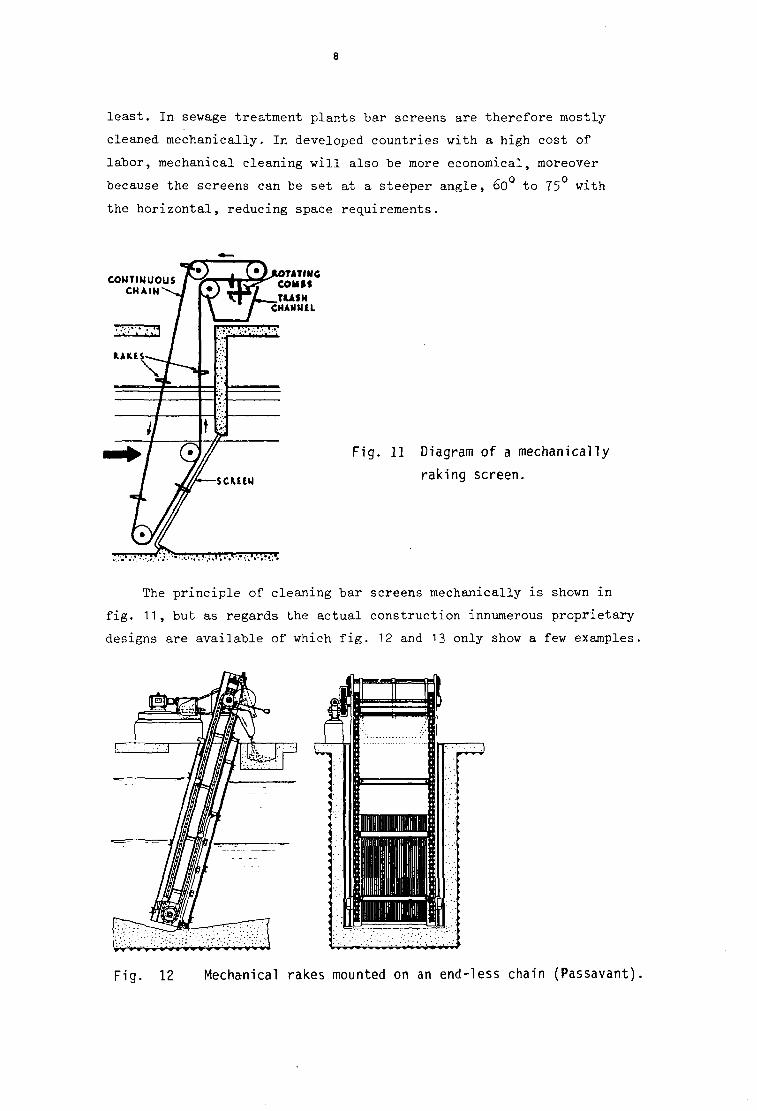
8
least. In sewage treatment plants bar screens are therefore mostly-
cleaned mechanically. In developed countries with a high cost of
labor, mechanical cleaning will also be more economical, moreover
because the screens can be set at a steeper angle, 60 to 75 with
the horizontal, reducing space requirements.
CONTINUOUS CHAIN
Fig. 11 Diagram of a mechanically
raking screen.
>:t;>:^-;?-v;.,:.':f-.'i:>'..,-.*'.-..;»,'.:?::'.
The principle of cleaning bar screens mechanically is shown in
fig. 11, but as regards the actual construction innumerous proprietary
designs are available of which fig. 12 and 13 only show a few examples.
Fig. 12 Mechanical rakes mounted on an end-less chain (Passavant)
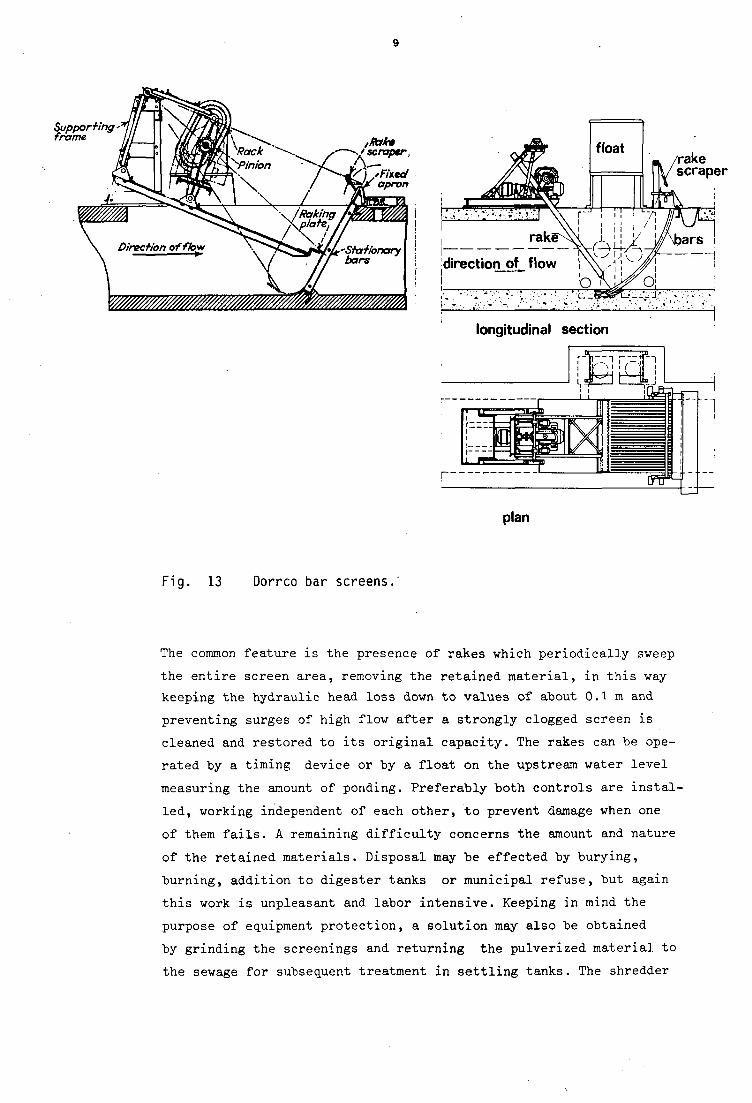
9
plan
Fig. 13 Dorrco bar screens.'
The common feature is the presence of rakes which periodically sweep
the entire screen area, removing the retained material, in this way-
keeping the hydraulic head loss down to values of about 0.1 m and
preventing surges of high flow after a strongly clogged screen is
cleaned and restored to its original capacity. The rakes can be ope
rated by a timing device or by a float on the upstream water level
measuring the amount of ponding. Preferably both controls are instal
led, working independent of each other, to prevent damage when one
of them fails. A remaining difficulty concerns the amount and nature
of the retained materials. Disposal may be effected by burying,
burning, addition to digester tanks or municipal refuse, but again
this work is unpleasant and labor intensive. Keeping in mind the
purpose of equipment protection, a solution may also be obtained
by grinding the screenings and returning the pulverized material to
the sewage for subsequent treatment in settling tanks. The shredder
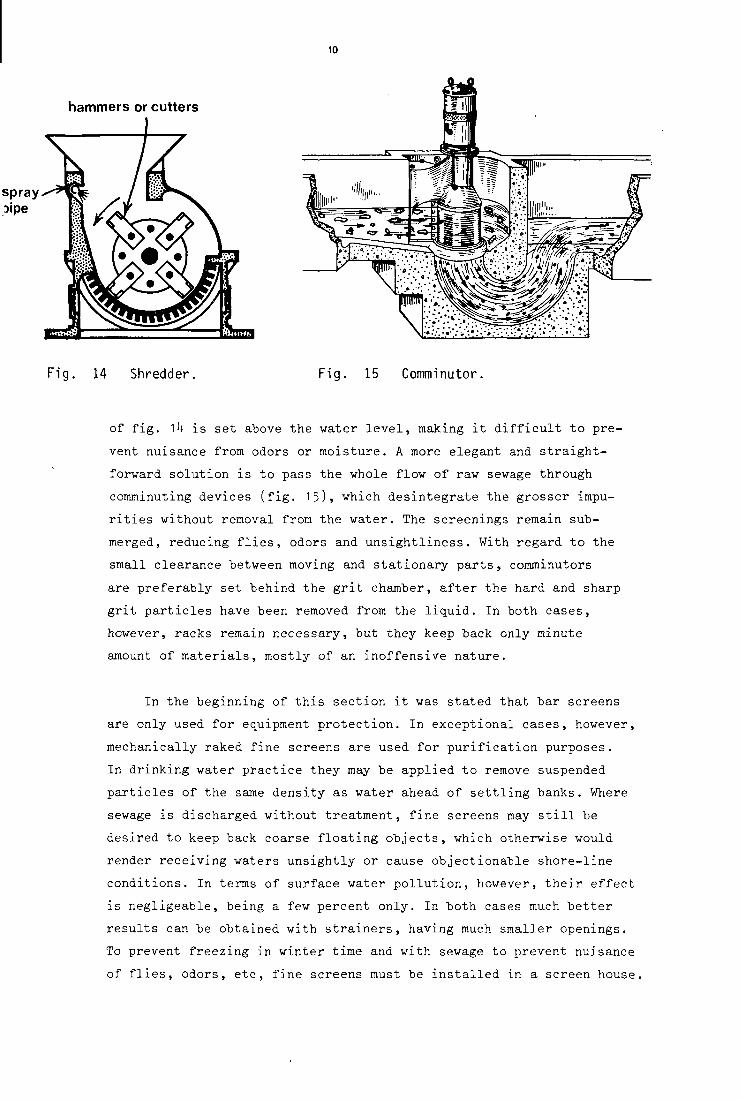
10
Fig. 14 Shredder. Fig. 15 Comminutor.
of fig. 1U is set above the water level, making it difficult to pre
vent nuisance from odors or moisture. A more elegant and straight
forward solution is to pass the whole flow of raw sewage through
comminuting devices (fig. 15), which desintegrate the grosser impu
rities without removal from the water. The screenings remain sub
merged, reducing flies, odors and unsightliness. With regard to the
small clearance between moving and stationary parts, comminutors
are preferably set behind the grit chamber, after the hard and sharp
grit particles have been removed from the liquid. In both cases,
however, racks remain necessary, but they keep back only minute
amount of materials, mostly of an inoffensive nature.
In the beginning of this section it was stated that bar screens
are only used for equipment protection. In exceptional cases, however,
mechanically raked fine screens are used for purification purposes.
In drinking water practice they may be applied to remove suspended
particles of the same density as water ahead of settling banks. Where
sewage is discharged without treatment, fine screens may still be
desired to keep back coarse floating objects, which otherwise would
render receiving waters unsightly or cause objectionable shore-line
conditions. In terms of surface water pollution, however, their effect
is negligeable, being a few percent only. In both cases much better
results can be obtained with strainers, having much smaller openings.
To prevent freezing in winter time and with sewage to prevent nuisance
of flies, odors, etc, fine screens must be installed in a screen house.
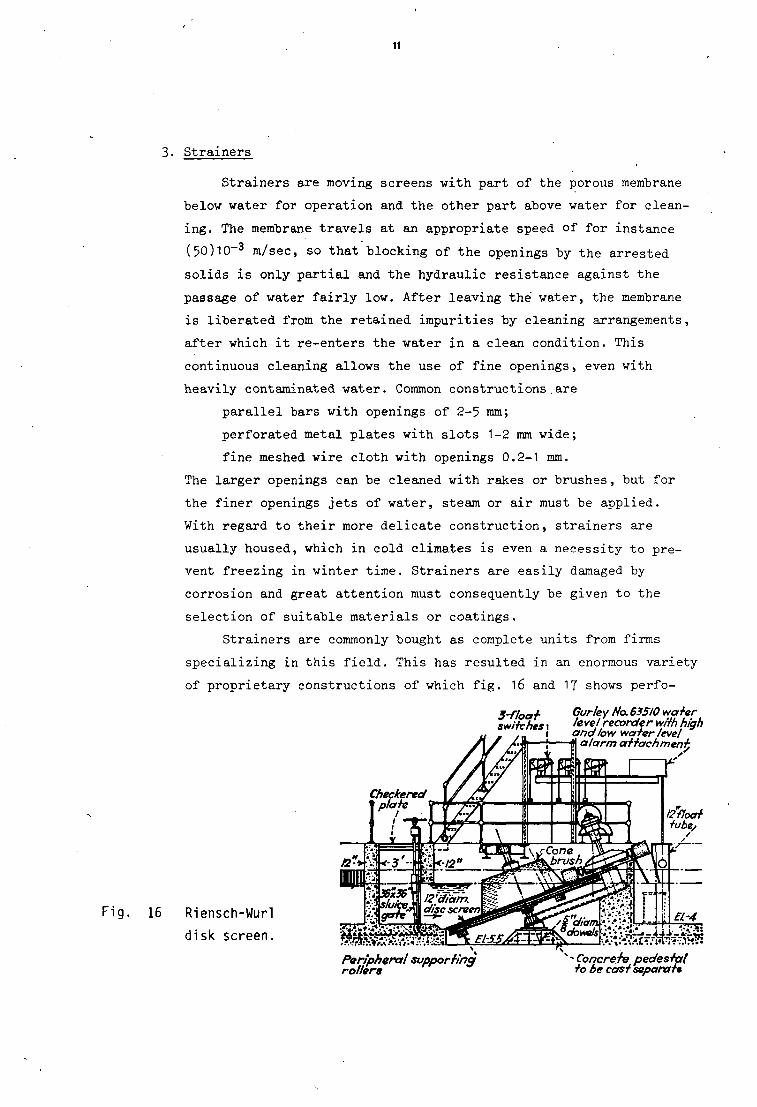
11
3. Strainers
Strainers are moving screens with part of the porous membrane
below water for operation and the other part above water for clean
ing. The membrane travels at an appropriate speed of for instance
(50)10-3 m/sec, so that blocking of the openings by the arrested
solids is only partial and the hydraulic resistance against the
passage of water fairly low. After leaving the water, the membrane
is liberated from the retained impurities by cleaning arrangements,
after which it re-enters the water in a clean condition. This
continuous cleaning allows the use of fine openings, even with
heavily contaminated water. Common constructions are
parallel bars with openings of 2-5 mm;
perforated metal plates with slots 1-2 mm wide;
fine meshed wire cloth with openings 0.2-1 mm.
The larger openings can be cleaned with rakes or brushes, but for
the finer openings jets of water, steam or air must be applied.
With regard to their more delicate construction, strainers are
usually housed, which in cold climates is even a necessity to pre
vent freezing in winter time. Strainers are easily damaged by
corrosion and great attention must consequently be given to the
selection of suitable materials or coatings.
Strainers are commonly bought as complete units from firms
specializing in this field. This has resulted in an enormous variety
of proprietary constructions of which fig. 16 and 17 shows perfo-
3~Float Cur ley No. 63510 wa ter switches i level recorder with high
ana low water level alarm attachment
Checkered * plate
/2/loat tube/
16 Riensch-Wurl
disk screen.
Peripheral supporting rollers
"'Concrete pedestal to be cast separata
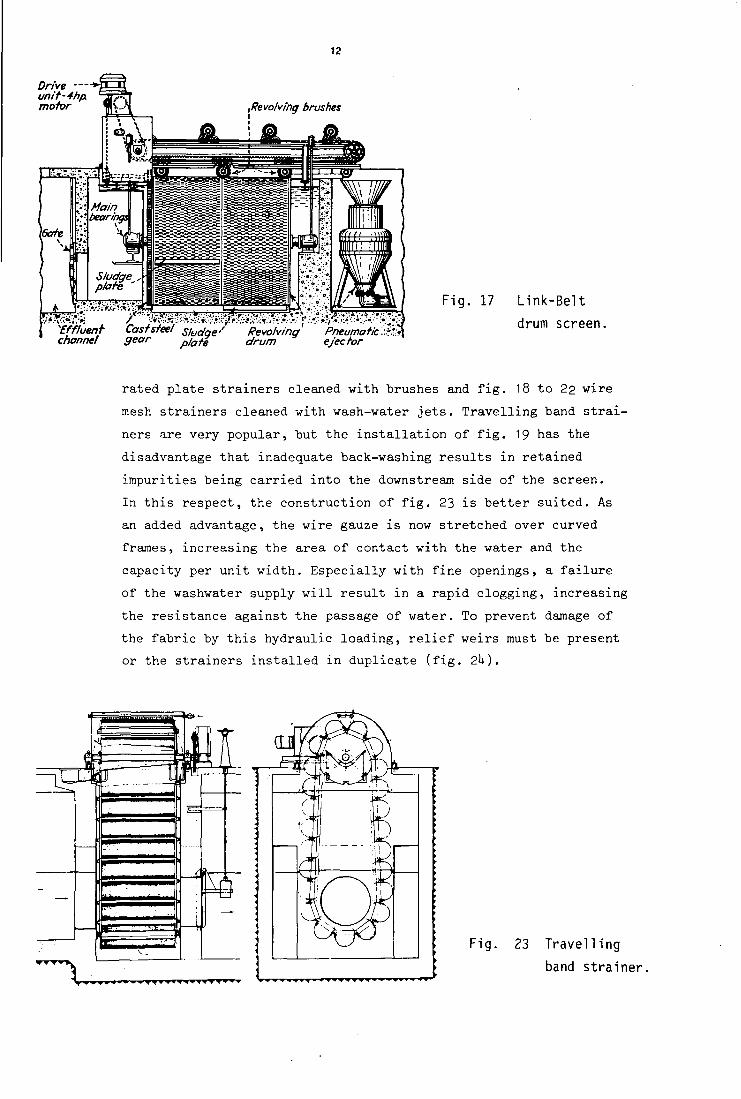
12
Drive — unit-4hp. motor Revolving brushes
'Effluent channel
Casts/eel sludge' Revolving Pneumatic•';£$ gear plate drum ejector
Fig. 17 Link-Belt
drum screen.
rated plate strainers cleaned with brushes and fig. 18 to 22 wire
mesh strainers cleaned with wash-water jets. Travelling band strai
ners are very popular, but the installation of fig. 19 has the
disadvantage that inadequate back-washing results in retained
impurities being carried into the downstream side of the screen.
In this respect, the construction of fig. 23 is better suited. As
an added advantage, the wire gauze is now stretched over curved
frames, increasing the area of contact with the water and the
capacity per unit width. Especially with fine openings, a failure
of the washwater supply will result in a rapid clogging, increasing
the resistance against the passage of water. To prevent damage of
the fabric by this hydraulic loading, relief weirs must be present
or the strainers installed in duplicate (fig. 2U).
Fig. 23 Travelling
band strainer.
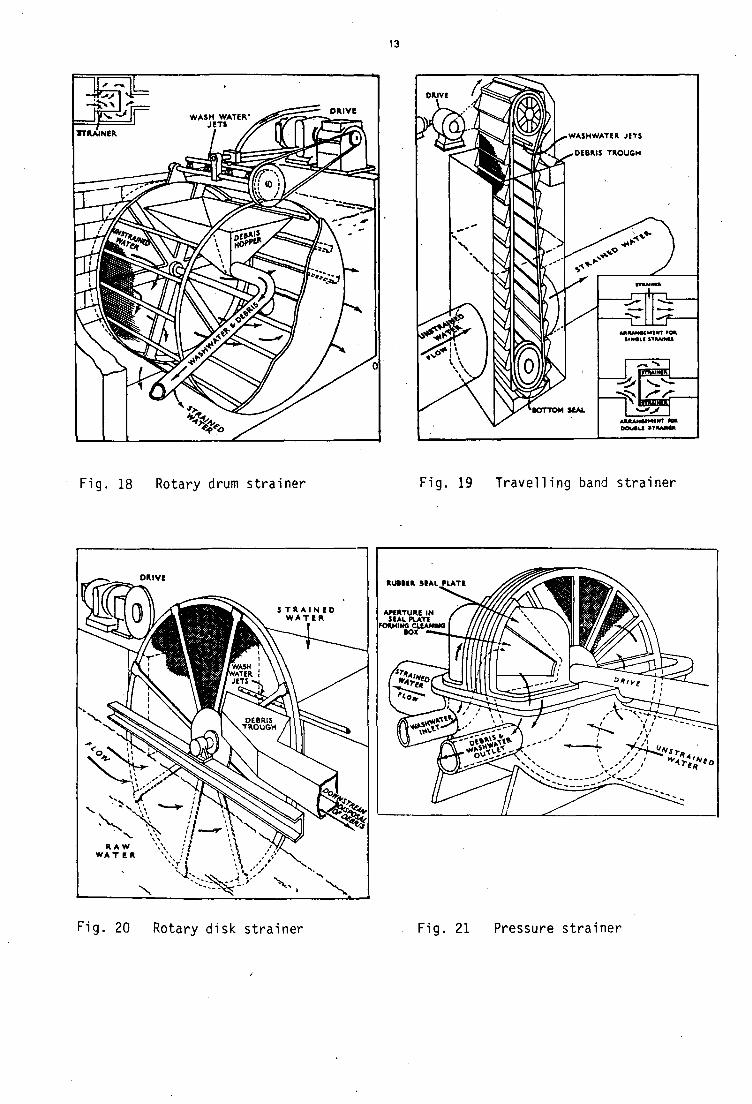
13
Fig. 18 Rotary drum strainer Fig. 19 Travelling band strainer
DRIVE
N X Fig. 20 Rotary disk strainer Fig. 21 Pressure strainer

14
Fig. 22 Travelling-band strainer at the Skudai treatment plant
for Singapore.
In water supply practice, strainers may be used directly after
the intake screens, to assure that subsequent treatment processes
such as sedimentation and filtration may proceed unhindered. In
terms of real purification, their effect is small and hardly worth
the cost involved, but they do have value in nuisance prevention in
assuring a smooth operation of the plant. Disposal of the retained
material is usually not a problem. The washings are collected in a
launder and are led back to the river at a point well below the
intake. In waste water treatment, strainers are sometimes used in
stead of primary settling tanks. This gives an appreciable saving
in the cost of construction, but on the other hand the efficiency
in removing suspended solids is much smaller, 10 to a maximum of
20% in stead of 50% and more. The most elegant disposal of the re
tained material is now by pumping it to the digester tanks. In
exceptional cases strainers are used as sole treatment of waste
water, to prevent a visible contamination of the receiving water,
the formation of sludge banks and septic conditions. With the larger
amount and the putrescibility of the strainings, disposal is a dif
ficult problem. Common solutions are burying, incineration or addi
tion to the municipal refuse.
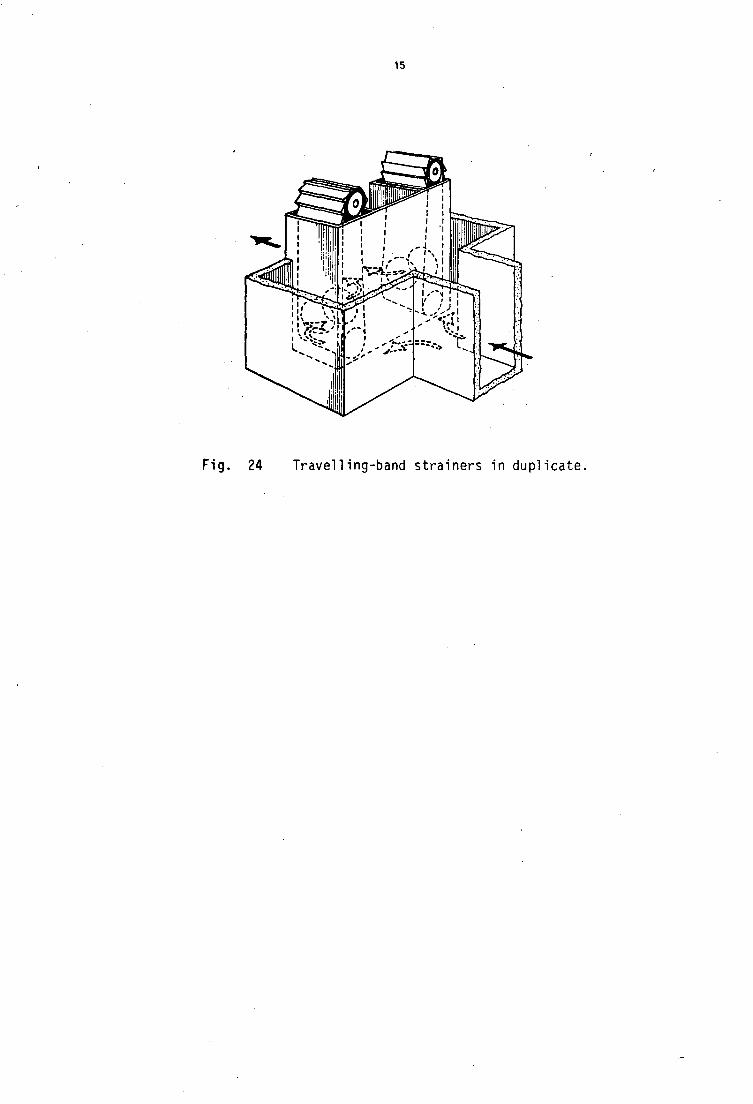
15
Mg. 24 Travelling-band strainers in duplicate.
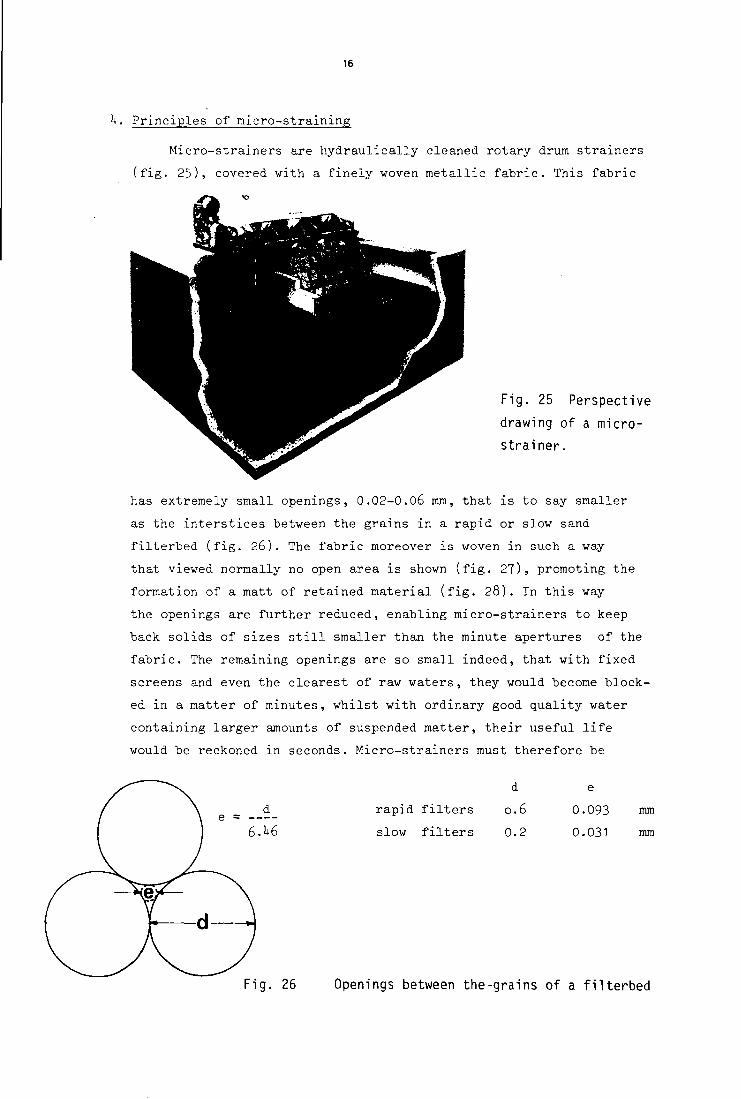
16
h. Principles of micro-straining
Micro-strainers are hydraulically cleaned rotary drum strainers
(fig. 25), covered with a finely woven metallic fabric. This fabric
Fig. 25 Perspective
drawing of a micro-
strainer.
has extremely small openings, 0.02-0.06 mm, that is to say smaller
as the interstices between the grains in a rapid or slow sand
filterbed (fig. 26). The fabric moreover is woven in such a way
that viewed normally no open area is shown (fig. 27), promoting the
formation of a matt of retained material (fig. 28). In this way
the openings are further reduced, enabling micro-strainers to keep
back solids of sizes still smaller than the minute apertures of the
fabric. The remaining openings are so small indeed, that with fixed
screens and even the clearest of raw waters, they would become block
ed in a matter of minutes, whilst with ordinary good quality water
containing larger amounts of suspended matter, their useful life
would be reckoned in seconds. Micro-strainers must therefore be
rapid filters
slow filters
d
0.6
0.2
e
0.093
0.031
mm
mm
Fig. 26 Openings between the-grains of a filterbed
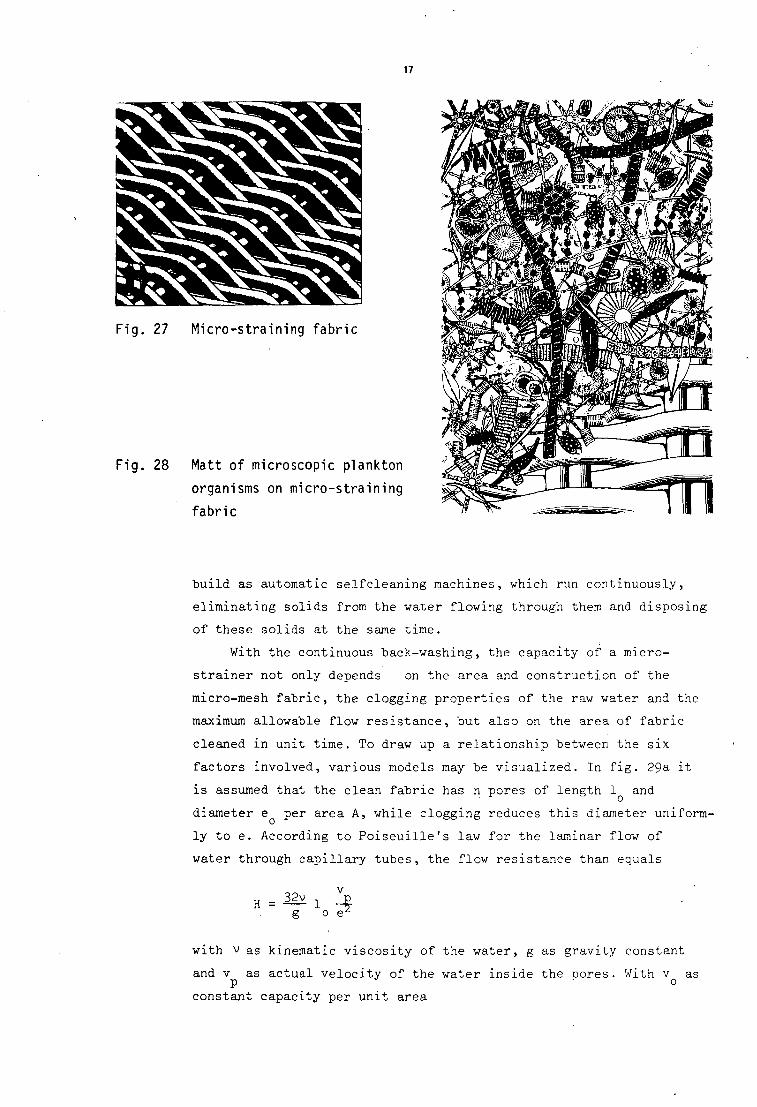
17
build as automatic selfcleaning machines, which run continuously,
eliminating solids from the water flowing through them and disposing
of these solids at the same time.
With the continuous back-washing, the capacity of a micro-
strainer not only depends on the area and construction of the
micro-mesh fabric, the clogging properties of the raw water and the
maximum allowable flow resistance, but also on the area of fabric
cleaned in unit time. To draw up a relationship between the six
factors involved, various models may be visualized. In fig. 29a it
is assumed that the clean fabric has n pores of length 1 and
diameter e per area A, while clogging reduces this diameter uniform
ly to e. According to Poiseuille's law for the laminar flow of
water through capillary tubes, the flow resistance than equals
H = ^ l ^ g o ez
with v as kinematic viscosity of the water, g as gravity constant
and v as actual velocity of the water inside the uores. With v as p . . ' o
constant capacity per unit area
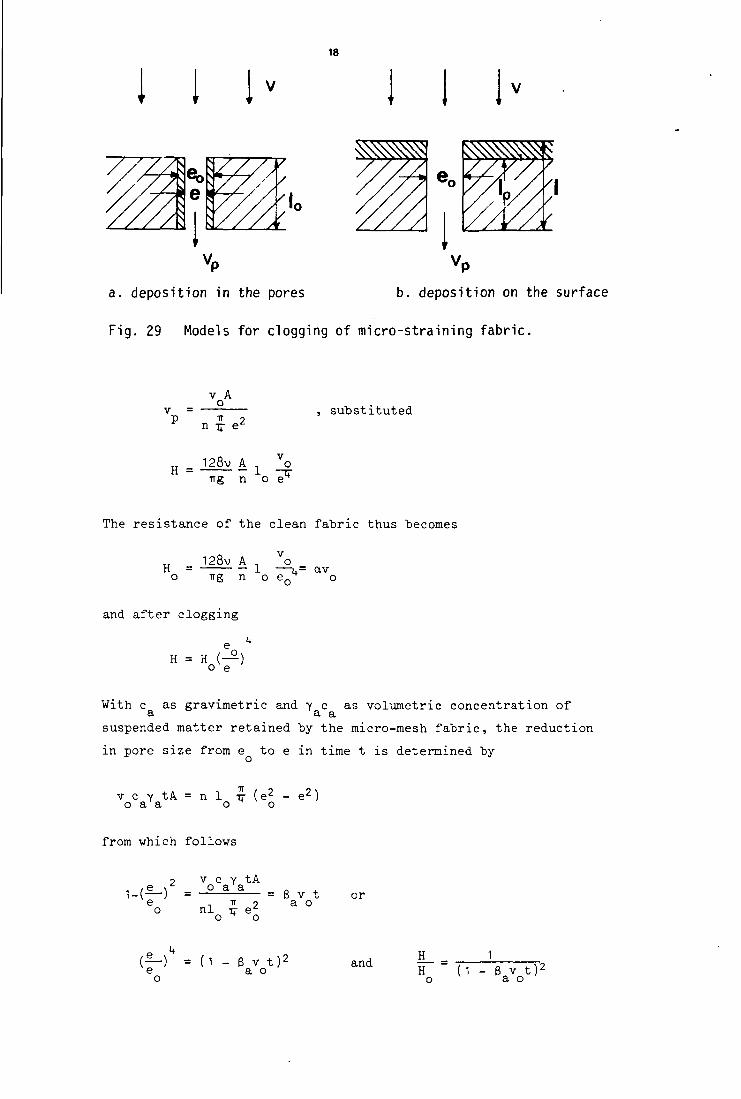
18
1 i I
a. deposition in the pores b. deposition on the surface
Fig. 29 Models for clogging of micro-straining fabric,
H =
v A o tr o
n ij- e^
128v A . V o 1 —IT
iTg n o e H
, s u b s t i t u t e d
The resistance of the clean fabric thus becomes
128v A n Vo
H = 1 — u = av o Tig n o eQ
H o
and after clogging
H = H (-*) o e
With c as gravimetric and y c as volumetric concentration of a a a
suspended matter retained by the micro-mesh fabric, the reduction
in pore size from e to e in time t is determined by
v c y tA = n 1 ir(e2 o a a
from which follows
o v c Y tA (—) = ° a
o nl f e 3 v t a o or
e o
6 v t ) 2
a o and -r— = H (1 - 6 v t) 2
o a o
19
In fig. 29b another model is shown with the retained material
being deposited on the membrane, increasing uniformily the length
of the pores from 1 to 1, but leaving their diameter unchanged at
e . According to the formulas given above, the increase in flow o resistance is now determined by
H = ctv H = H 7-o o 1
o
VbVA = (A-mreJ)U - 1Q)
from which follows
v c, y, tA 1 1 o b b a
— - 1 = = 6_v t and 1 T 1 A ^ 2\ bo o 1 (A - n r ez) o o
F = 1 + W o
In reality, however, the two models will occur simultaneously. The
increase in resistance is now due to both phenomena, in formula
H 1 + BbV H " (1 - 6 v t ) 2
o a o
Taking the logarithme gives
In 77- = In (1 + 6, v t) - 2 In (1 - B v t) H b o a o o
For small values of t this may be approximated by
In — = B v t + 28 v t = Bv t and H b o a o o o
H _ BvQt H o
that is to say an exponential increase of flow resistance with
time. For larger values of t, this will not be completely true.
The difference, however, will be small as according to the first
model the resistance rises more rapidly and according to the second
model more slowly with time than corresponds with an exponential
increase.

20
0 o = V o A
*o o
micro-mesh, fabric '
/
H
* T S InH
InH
H .
/
/
S ^ * ^ «nod«l-b — — "
v„t
Fig. 30 Experimental determination of filtrability according to
Boucher.
The straining law derived above has been checked experimentally
by Boucher, measuring the resistance of the micro-mesh fabric
as function of the volume of water passed. As shown schematically
in fig. 30, the fabric to be applied is percolated at a constant
rate v . The resistance H is plotted on logarithmic scale against
the time t on linear scale giving for most types of water indeed
a straight-line relationship with as formula
In H = In H + 6v t o o or
H Bvt F = e o o
In this formula the initial resistance H depends on the construction
of the fabric
av
and on the viscosity of the water, that is on the temperature
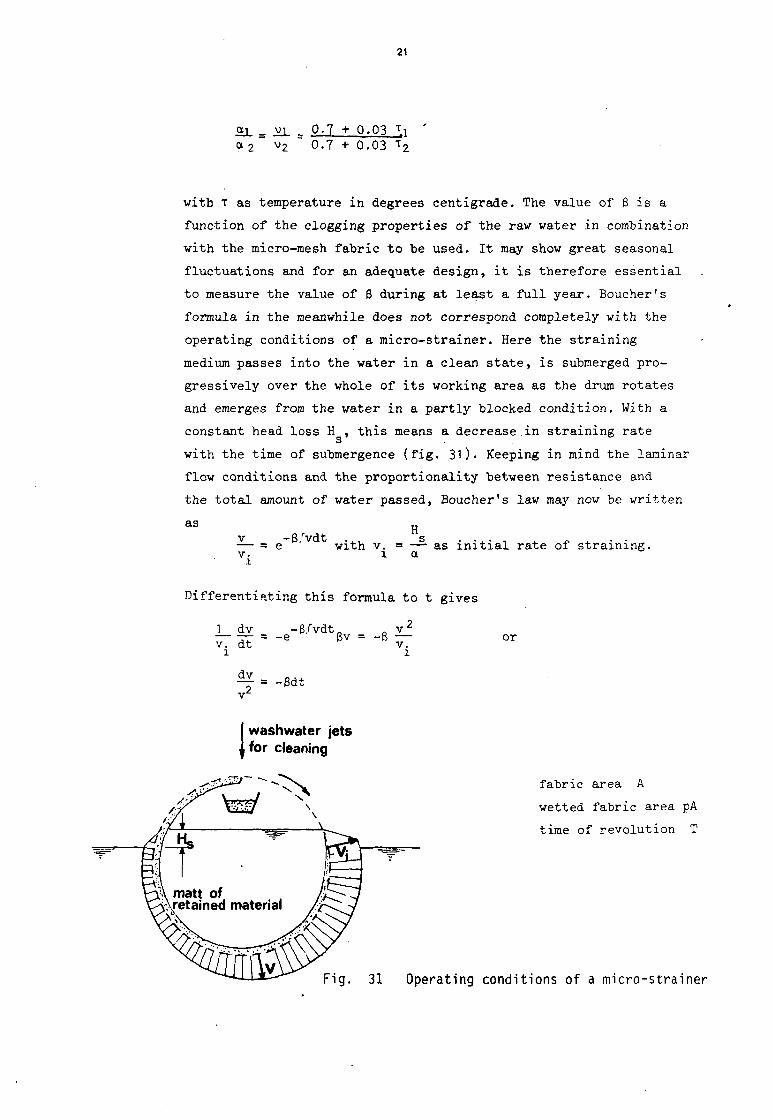
21
£L = VL - 0-7 + 0.03 T, ' a 2 v2 0.? + 0.03 T2
with T as temperature in degrees centigrade. The value of B is a
function of the clogging properties of the raw water in combination
with the micro-mesh fabric to be used. It may show great seasonal
fluctuations and for an adequate design, it is therefore essential
to measure the value of B during at least a full year. Boucher's
formula in the meanwhile does not correspond completely with the
operating conditions of a micro-strainer. Here the straining
medium passes into the water in a clean state, is submerged pro
gressively over the whole of its working area as the drum rotates
and emerges from the water in a partly blocked condition. With a
constant head loss H , this means a decrease in straining rate s
with the time of submergence (fig. 31). Keeping in mind the laminar
flow conditions and the proportionality between resistance and
the total amount of water passed, Boucher's law may now be written
as R
v -8/vdt ... s ...... . *.*.•• — = e with v. = — as initial rate of straining, v. x a I
Differentiating this formula to t gives
1 dv -e/vdt„ . v z
— — = -e Bv = -8 — v. dt v. l l
^ - -Bdt v
or
Iwashwater jets for cleaning
fabric area A
wetted fabric area pA
time of revolut ion T
Fig. 31 Operating conditions of a micro-strainer

s 22
Integration between the limits t = 0, v = v. and t = t, v = v yields
- - + — = -6t or v - 1
v v. 1 + gv.t
With the notations of fig. 31, the average straining rate will equal
,PT „ ,PT
3 if/ V d t =^/ dt
Va pT / "~" pT J 1 + Bv.t
Va = 6p¥ l n (1 + 6viPT) W i t h
H s •
v. = — the capacity of the micro-strainer thus becomes
H Q = vapA = ln (1 + 0 ^-pT)
in which the constants a and 6 have to be determined each time anew.
In practice the straining rate v varies from values as low as 9.
(2 - 3)10-3 m/sec with rather contaminated water such as a humus
laden effluent from a sewage treatment plant, up to atout (25)10"^
m/sec with good quality water from impounding reservoirs. This
straining rate can be raised in different ways
a. by selection of a coarser fabric with larger openings, decreasing
the value of a. At the same time, however, the efficiency of the
micro-straining process is lowered and more suspended matter will
pass into the effluent;
b. by the abstraction of a less turbid water, lowering the value of (3;
c. by shortening the time of revolution T, augmenting the circumferen
tial speed from a low value of 0.05 or 0.1 m/sec to a high of
0.5 m/sec;
d. by increasing the allowable flow resistance H from normally applied
values of 0.1 - 0.15 m to a maximum value of 0.25 m. In many cases,
however, such an increase will result in a break-through of the
fabric supported mat of retained material - indicated in the
diagram of fig. 30 by a sudden fall-off from the straight-line
relationship - again lowering effluent quality.
The straining capacity can also be increased by choosing a larger
drum area. With a diameter D and width B, the gross area of the
drum equals irDB and varies in practice from
23
minimum D = 0.T5m, B = 0 . 5 m , TTDB = 1.2 m2
maximum D = 3 m, B = 3 m , TTDB = 28 m2
The net area of the fabric is about 10$ smaller, while with
60 - 65% submergence the value of p is about 0.6. Best results
are obtained when the size of the drum, respectively the number
of drums in larger installations, is chosen such as to ensure
that under normal circumstances satisfactory operation is obtained
at low to average speeds and with a normal head loss. This leaves
the possibility of increasing drum speeds and allowing a larger
head loss for periods of deteriorating raw water quality.
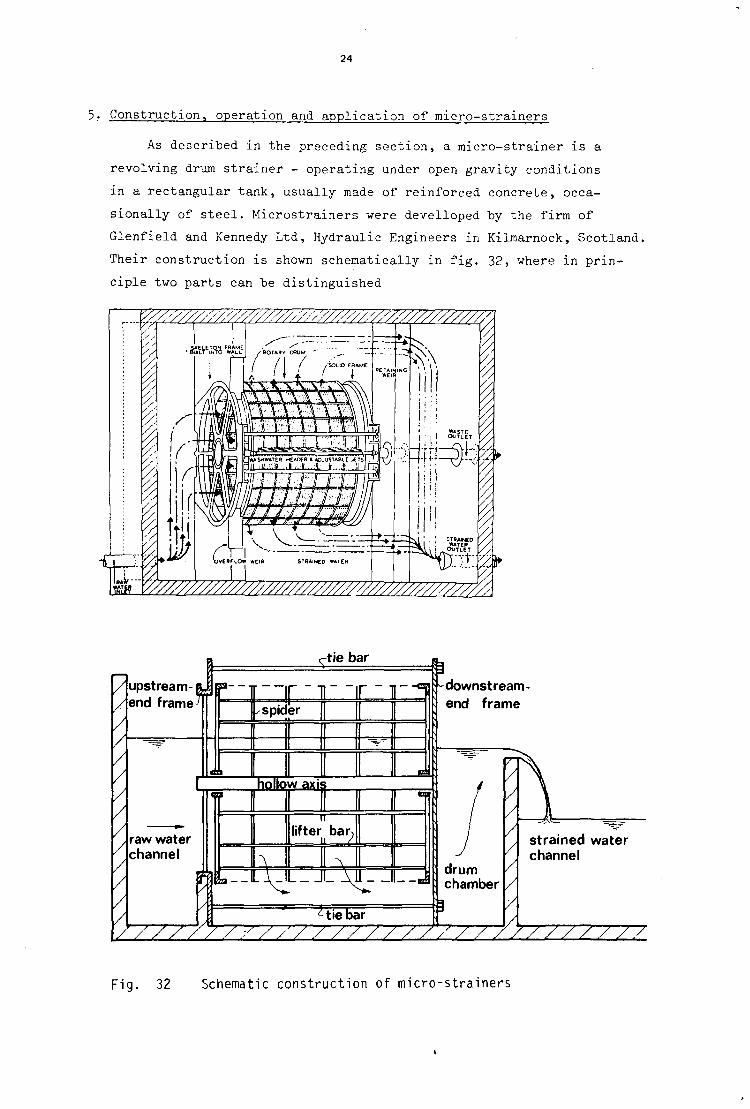
24
5: Construction, operation and application of micro-strainers
As described in the preceding section, a micro-strainer is a
revolving drum strainer - operating under open gravity conditions
in a rectangular tank, usually made of reinforced concrete, occa
sionally of steel. Microstrainers were develloped "by the firm of
Glenfield and Kennedy Ltd, Hydraulic Engineers in Kilmarnock, Scotland.
Their construction is shown schematically in fig. 32, where in prin
ciple two parts can be distinguished
Y/////>y////////////////////7//777^777Z-
IOAV"" V////////////////////////////^//////'//////
-tie bar
downstream -end frame
Fig. 32 Schematic construction of micro-strainers
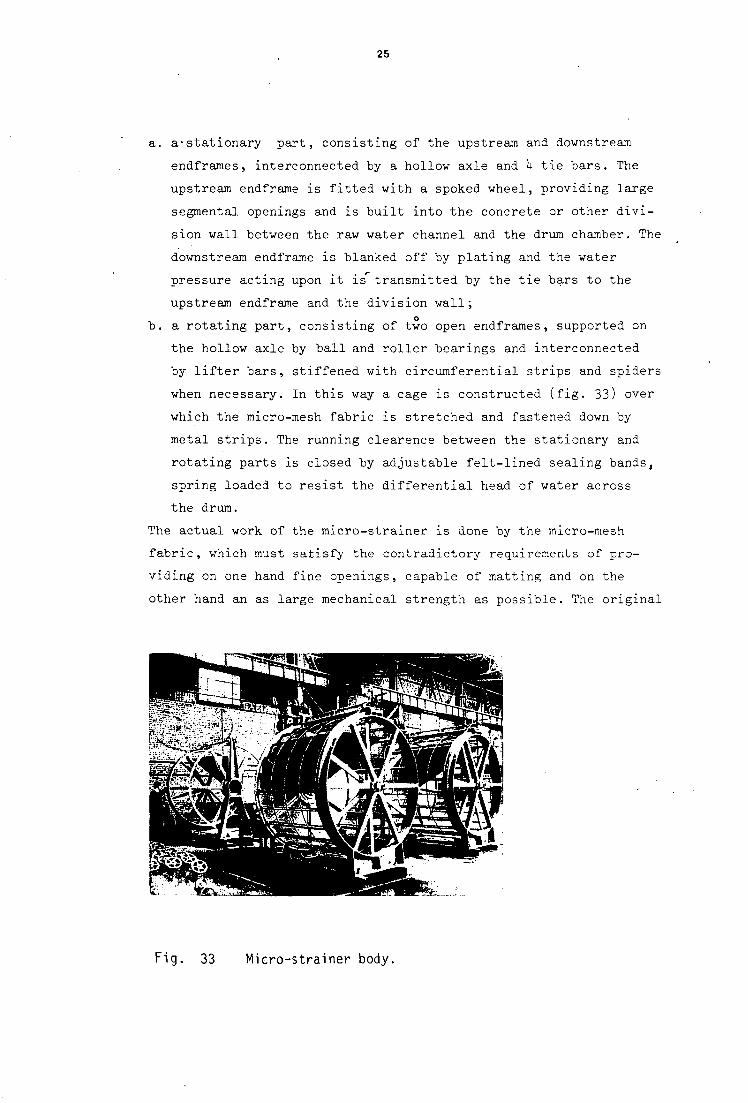
25
a. a-stationary part, consisting of the upstream and downstream
endframes, interconnected by a hollow axle and 1* tie bars. The
upstream endframe is fitted with a spoked wheel, providing large
segmental openings and is built into the concrete or other divi
sion wall between the raw water channel and the drum chamber. The
downstream endframe is blanked off by plating and the water
pressure acting upon it is transmitted by the tie bars to the
upstream endframe and the division wall; o
b. a rotating part, consisting of two open endframes, supported on
the hollow axle by ball and roller bearings and interconnected
by lifter bars, stiffened with circumferential strips and spiders
when necessary. In this way a cage is constructed (fig. 33) over
which the micro-mesh fabric is stretched and fastened down by
metal strips. The running clearence between the stationary and
rotating parts is closed by adjustable felt-lined sealing bands,
spring loaded to resist the differential head of water across
the drum.
The actual work of the micro-strainer is done by the micro-mesh
fabric, which must satisfy the contradictory requirements of pro
viding on one hand fine openings, capable of matting and on the
other hand an as large mechanical strength as possible. The original
Fig. 33 Micro-strainer body.
26
warp wires, i 60 f* m
weft wires j> 50 yu m
j^333^m
Fig. 34 Construction of Mark I
micro-mesh fabric.
OUTER LIMITING APtRTURF 48 MICRONS
NNER LIMITING APERTURE 35 MICRONS
*>*
ISOMETRIC SKETCH OF MK: I
construction (mark I fabric) is shown in fig- 3^ and consists of
stainless steel wires with diameters of 50 and 60 pm, woven in
special manner with 3 pairs of warP wires and 20 weft wires per mm,
giving per mm2 135 openings with an inner limiting aperture of
35 Vim. Nowadays 3 types of fabric are available
0
23
231
35-0
I
35
135
ho.6
II
6o 92
57.6
mark
size of opening in ym
number of openings per mm2
percentage open area
Notwithstanding the particular way of weaving, the micro-mesh fabric
is still quite delicate. For additional mechanical support it is
therefore sandwiched between square woven coarse mesh stainless steel
wire cloth, pinned together by stainless steel screws, nuts and
washers and fastened to the drum cage by longitudinal and circumferen
tial straps (fig. 35). Stainless steel in the meanwhile has water repel-
Fig. 35 View on micro-
mesh fabric.
27
lent properties. To prevent entrainment of air by the backing fabric
with the air blanking off large areas of the drum, seriously reducing
the capacity, this fabric must be made from dull wires with openings
of at least 2 - 2.5 mm or other materials such as monel metal must be
used for its construction. In case clogging of the sandwich by filamen
tous algae is anticipated, the inner supporting fabric can be left out. i
During operation the raw water enters the drum axially through
the open frame at the upstream end, turns 90 and passes the micro-
mesh fabric radially from inside to outside the drum. The strained
water leaves the drum chamber over a fixed weir, the level of which
is chosen such that the drum is submerged for about 60% of its diameter
The drum is rotated by an electric motor, through worm-and-spur reduc
tion gearing and speed-change gearbox, terminating in a pinion which
meshes with a large spur-ring bolted to one side of the drum. Speeds
measured on the drum periphery vary between 0.05 and 0.5 m/sec, higher
as the diameter is larger. The number of revolutions is between 0.5
and 5 per minute, for which an electric input of 1 kW is always suffi
cient.
During operation the micro-strainer is cleaned continuously,
using a row of wash-water jets over the full width of the drum (fig.
36). The wash-water nozzles are adjustable and self-cleaning and
wash-water jets
discharche. •4
of wash-water 1/
Fig. 36 Continuous hydraulic cleaning of micro-strainers.
designed for producing a thin continuous vane of water (fig. 37 left),
which strikes vertically downward through the fabric, thus washing
away the retained material from the inside of the drum into the
waste water hopper and away through the hollow axle (fig. 36 and 37
right). Solids which do not adhere to the fabric are picked up by
longitudinal bars inside the drum and are again deposited into the
waste hopper. Preferably filtered and chlorinated water should be
used for back-washing, with a jet pressure of 3 to 7 m watercolumn,
depending on local circumstances and in an amount of 0.5 - 1.5$ of
the volume of water strained. This low-pressure back-washing in the
meanwhile is only possible by the presence of the outer backing fabric
Fig. 37 Wash-water jets and waste-water hopper.
described above, which assures that the micro-mesh fabric below the
wash-water nozzles is immersed in a nappe of retained water, in this
way breaking down the surface tension which would otherwise deflect
the wash-water jets sideways, preventing them from penetrating and
cleaning the micro-mesh fabric. To keep the wash-water from splash
ing over the machine, the wash-water jets are covered by a plastic
shield (fig. 38). In case the wash-water supply fails or the drum
stops, a continuous clogging of the micro-mesh fabric will occur.
Excess differential pressures which might damage the fabric can be
avoided by providing the division wall between raw water inlet and
the drum chamber with a weir (fig. 32), in this way limiting the
29
upstream water level. Bacterial slimes are difficult to remove by
back-washing alone and when they occur a blinding of the fabric and
reduced flow capacity will result. Bacterial slimes can be destroyed
by washing the strainer drum with a strong chlorine solution at
intervals of one to a few weeks, but their occurence can also be
prevented by equipping the micro-strainer with high-intensity
ultra-violet lights (fig. 39).
From the description given above, it will finally be clear that
corrosion is a serious danger to micro-strainers. The selection of
suitable high-quality materials in conformity with the best water
engineering practice is therefore of the utmost importance.
Fig. 38 Plastic shield covering wash- Fig. 39 Ultra-violet light radiation to
water jets to prevent splashing. control bacterial growth.
Micro-strainers were develloped thirty years ago as treatment
preceding slow sand filters, to increase their capacity and/or length
of filterrun. In this respect micro-strainers compete with rapid
or primary filters, giving a solution much cheaper in cost of con-'
struction and operation, while also space requirements and head-
losses are appreciably reduced. On the other hand, however, their
action is entirely mechanical, removing particulate suspended matter
such as sand, silt and algae, but there is no change in the chemical
characteristics of the water. Micro-strainers are unable to remove
colloidal matter and color, ammonia and dissolved organic impurities,
nor is there any marked decrease in the number of bacteria. With
regard to the speed of clogging and the ensuing flow resistance, they
are unfit for the treatment of heavily silted river waters.
30
In public water supply practice of to-day, micro-strainers are
still used to lighten the load on subsequent slow filters and next to
this on subsequent rapid filters, in particular when the raw water
is heavily loaded by algae. These algae may also greatly disturb the
process of coagulation, flocculation and sedimentation and again here
preceding micro-strainers may be used to advantage. To remove the
carry-over of coagulant floes from settling tanks, micro-strainers
are not well suited. When the flocstrength is large, the clogging of
the fabric will be too rapid and when the floe strength is small, the
efficiency too low, the coagulated matter flowing like water through
even minute apertures in the fabric. In exceptional cases, the raw
water is still so fair and unsullied that it can be distributed as
drinking water without filtration. For safety's sake such waters must
be sterilized, while micro-straining is now sufficient to keep back
the little amount of debris and a sparse population of living orga
nisms. For many industrial processes a first quality drinking water
is not required and there micro-straining can be used even when the
raw water contains color and colloids. The same applies when micro-
strainers are used to provide primary filtration prior to infiltra
tion through natural sand formations in the process of artificial
recharge.
Also in the field of sewage and industrial waste treatment,
micro-straining may be of great value. With regard to the rapid
clogging of the extremely fine openings, however, it may only be
used as a primary treatment when the water to be handled is not more
than lightly contaminated, as often is the case with industrial
effluents. Here it may even be the sole process to which the water
is subjected. With more contaminated trade wastes, micro-straining
can be used for polishing the water, after a primary treatment by
other means. The same holds true for the treatment of municipal
sewage, where micro-strainers are used after the secondary settling
tanks following trickling filters or the activated sludge process,
to lower the suspended solids content and the bio-chemical oxygen
demand of the effluent, in this way reducing the contamination of
the receiving waters.
31
6. Principles of pre-coat filtration
As elaborated in the preceding sections, the efficiency of micro-
straining is greatly enhanced "by the tiuilding-up of a matt of retained
material on the fabric. This also means, however, that especially
with-larger mesh-sizes and cleaner water, better results could be
obtained by pre-coating the micro-fabric with inert powdered or
fibrous material. In this way the actual work of clarification is
done by the pre-coat, acting as a filter, while the fabric now only
serves to retain and support the pre-coating materials. With moving
strainers, this pre-coat would be washed away and lost after every
revolution, increasing the cost of operation and interfering with the
disposal of wash water. In some cases this is not objectionable, for
instance not when asbestic or cellulose fibres are recovered from
the wash-water and re-used, but in many other instances a more satis
factory solution is obtained with stationnary filters. These station-
nary pre-coat filters operate in the same way as a conventional slow
sand filter, but the filtering material is finer and the filtration
rates are higher, both factors resulting in a much more rapid clog
ging. After reaching the maximum allowable head loss, the filter
media into which is embedded the suspended matter removed during
filtration is again discharged to waste and the supporting medium
re-precoated to ready it for further work.
The rapid clogging of stationnary pre-coat filters could be re-
tarted and the length of the filtering cycle greatly increased by
adding during filtration a small continuous dose of filtering material
(filter aid) to the raw water, in addition to the initial coating of
the filter elements. With this body-feeding as it is called, the sus
pended solids in the raw water do not penetrate the pre-coat, reducing
its porosity and permeability, but together with the filter aid they
build up a cake of adequate porosity and permeability (fig. ho). The
filter cake of removed impurities raw water and filter aid particles T7\.i t i . ; t » i * t » i i »
i i i . i i . i . i . .
porous m e m b r a n e or septum / filtered water
Fig. 40 Pre-coat
filtration with
body-feed.
32
increase in resistance now results from a growing cake thickness with
time, again necessitating a periodic cleaning, but the lengths of
filterrun are much longer, allowing the use of a more turbid raw water.
The construction of a pre-coat filter with body-feed is shown schemati
cally in fig. 1*1. At the beginning of the filterrun, the pre-coat is
formed on a porous membrane or septum, supported in one way or another,
while during filtration the cake of filter-aid particles and retained
solids is built up. After reaching the maximum allowable thickness
and resistance, both pre-coat as filter cake are washed away and
the process begins anew.
raw water
body feed
_ J I _
filtercake precoat
mmmm ...r„:—::,./ S^mM wwww '-septum |
support^ • effluent
Fig. 41 Schematic diagram of pre-coat f i l t e r with body feed.
approach velocity V
t lc
I t
|V 1 I I Reposition of suspended solids
filter cake
pre-coat
septum
Fig. 42 Model for clogging of a pre-coat f i l t e r with body feed.
33
To derive a mathematical formulation of the filtration process
described above, the model of fig. \2 will be considered. Three parts
maybe distinguished here, the septum, the pre-coat and the filter
cake, each with its own resistance against the passage of water. For
the septum this resistance is due to losses of friction and turbu
lence. The latter losses are proportional to the square of the velo
city, but with the low rates and small openings commonly applied
the friction losses follow the linear resistance law of laminar flow.
Together
H = av + bv2
s
with a and b depending on the construction of the septum. Next to
this, the factor a will vary with the viscosity, that is with the
temperature of the water. With H small, usually not more than 0.05 m
watercolumn (including the resistance of the septum support), this
variation may safely be left out of consideration.
The pre-coat is built up of filter-aid material to which some
times other substances as for instance asbestos fibres are added
to speed up its formation . In fig. \2 it is assumed that this coat
has n openings of length 1 and diameter e per area A and that no
clogging occurs. Poiseuille's law for laminar flow in capillary tubes
now gives as resistance
H -SgJLl J | P g P ep^
with v as kinematic viscosity of the water, g as gravity constant
and v as actual velocity of the water inside the pores. With v as p p . . .
approach velocity (capacity per unit area)
vA = v n T- e or PP H P
H = JL28v A ± val2lL p irg n p e H k
P P
with k as coefficient of permeability depending on the structure of P
the pre-coat, that is on the material applied, and on the viscosity
of the water.

34
In case the filter cake is built up with clear water and no clog
ging occurs, its resistance is similar to that of the pre-coat
v 1
c k
The thickness 1 , however, is not constant "but increases as filtra-c
tion goes on. With c as gravimetric concentration of the filter aid
material added continuously to the incoming water and y c as its a a
volumetric concentration when building up the filter cake, fig. U2
gives as account for this material
V Y c t A = l ( A - n i r e 2 ) or a a c 4 o
. A . 1 + a 1 = VY C t = VY C t c a a . TT 2 a a ex
A - n TT eQ
with a as a positive number. Substituted
* . vzt y c 1 + a a a c a k c
When filtering turbid water, clogging of the filter cake will occur,
reducing the diameter of its pores from e to e and increasing the
resistance to
e k
H' = H (-2) c c e
With c as gravimetric and Y c as volumetric concentration of s s s
suspended matter retained by the filter cake
V Y C t A = l n r (e 2 - e2) s s c H o
from which follows
9 v Y c tA ez . s s
o 1 n IT e z
c H o

35
or w i t h t h e v a l u e of 1 c a l c u l a t e d above c
.2 A - n i^ e ' Y c Y c e n . o R s . s s
A - n TT e Q2
n i e <• i» o
Y c s s Y c ' a a
= 1 - - n ' 2 — = 1 - a e * n i e Y c Y C
o • u o ' a a a a
S u b s t i t u t e d
i
H = H
CL '2 c Y c
t 1 S S x Y c a a
and w i t h t h e v a l u e of H c
„ , _ 1 + a v* t a a c a k Y c *
c (r _ a - 5 - ^ ) Y a C a
For a better understanding of this formula, the ratio
Y c a a
n = Y c s s
may be introduced. Substituted
H1 = 1 + a v2t n3
c a k s s (n - a) 2
c
That is to say a resistance which increases linearly with time and
which is proportional to the first power of the suspended solids
content c and to the second power of the filtration rate v. The
influence of the ratio n between body feed and suspended solids
content
yields
content is more difficult to evaluate. Differentiation of H1 to n c
6 H' c 1 + o
6 n a
6 H1
. ° = H ? -
v 2 t k
c
3a
, 3n2 2n3
V s l(n - a) 2 " (n - a);
6 n
36
According to this formula , an increasing body feed will lower the resis
tance as long as
a < n < 3ct
which operating conditions should therefore he preferred when possible.
With the many unknown factors in the meanwhile, the calculation
given above is of theoretical value only. In practice another approach
is commonly used, writing the flow resistances as
C v c v2t H = =S_ H« * p K c K
P c
with C as the mass of the filter aid in the pre-coat in grams/m2, c a a
as the body feed rate in grams/m3 and K and K in gram/m2/sec as con-p c
stants to be determined by experiment. The constant K only depends on
the pre-coat material, having for instance values of 15 - 50 gram/m2/sec for
diatomaceous earth , depending on the grade applied. Next to this, the
value of K varies with the amount and nature of the suspended solids to
be removed. With diatomite filtration of aerated, iron containing
water, this relation will roughly equal
K = (0.001 - 0.003)(—) c Cs
with the constants depending on the grade of diatomaceous earth to be
applied. In this case the resistance of the filter cake equals
c 1 .8-2.2
IT = (300 - 1000) cSo.8-i.2 v
2t a
that is to say a smaller resistance as the body feed rate is higher!
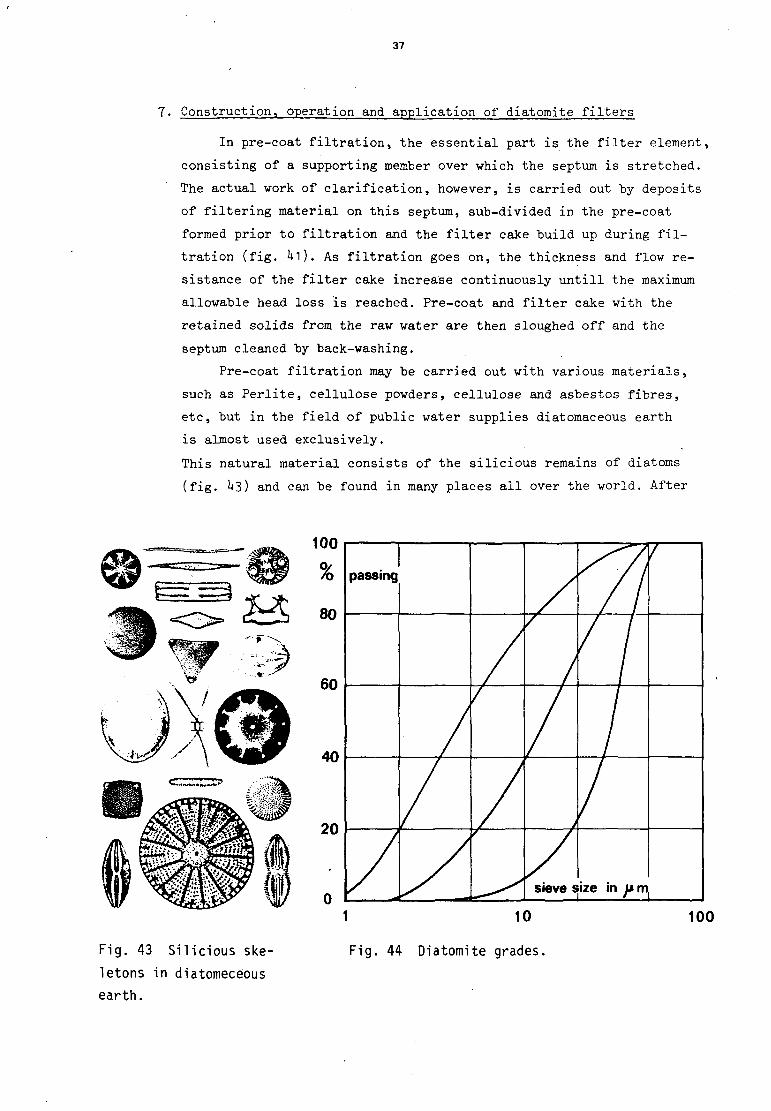
37
7. Construction, operation and application of diatomite filters
In pre-coat filtration, the essential part is the filter element,
consisting of a supporting member over which the septum is stretched.
The actual work of clarification, however, is carried out by deposits
of filtering material on this septum, sub-divided in the pre-coat
formed prior to filtration and the filter cake build up during fil
tration (fig. Ul). As filtration goes on, the thickness and flow re
sistance of the filter cake increase continuously untill the maximum
allowable head loss is reached. Pre-coat and filter cake with the
retained solids from the raw water are then sloughed off and the
septum cleaned by back-washing.
Pre-coat filtration may be carried out with various materials,
such as Perlite, cellulose powders, cellulose and asbestos fibres,
etc, but in the field of public water supplies diatomaceous earth
is almost used exclusively.
This natural material consists of the silicious remains of diatoms
(fig. U3) and can be found in many places all over the world. After
Fig. 43 Silicious ske
letons in diatomeceous
earth.
100
/o
80
60
40
20
passing
sieve s ize in jt m
/
1 10
Fig. 44 Diatomite grades,
100
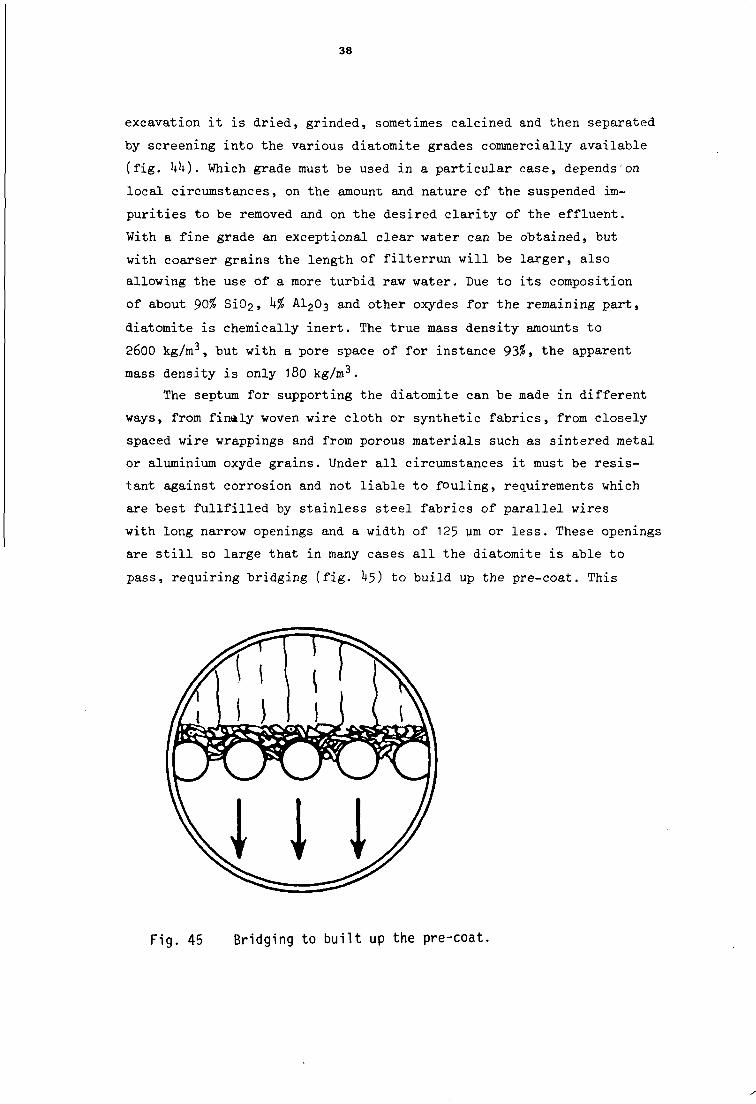
38
excavation it is dried, grinded, sometimes calcined and then separated
by screening into the various diatomite grades commercially available
(fig. kk). Which grade must be used in a particular case, depends on
local circumstances, on the amount and nature of the suspended im
purities to be removed and on the desired clarity of the effluent.
With a fine grade an exceptional clear water can be obtained, but
with coarser grains the length of filterrun will be larger, also
allowing the use of a more turbid raw water. Due to its composition
of about 90% SiC>2, k% AI2O3 and other oxydes for the remaining part,
diatomite is chemically inert. The true mass density amounts to
2600 kg/nr, but with a pore space of for instance 93$, the apparent
mass density is only 180 kg/m3.
The septum for supporting the diatomite can be made in different
ways, from finaly woven wire cloth or synthetic fabrics, from closely
spaced wire wrappings and from porous materials such as sintered metal
or aluminium oxyde grains. Under all circumstances it must be resis
tant against corrosion and not liable to fouling, requirements which
are best fullfilled by stainless steel fabrics of parallel wires
with long narrow openings and a width of 125 um or less. These openings
are still so large that in many cases all the diatomite is able to
pass, requiring bridging (fig. ^5) to build up the pre-coat. This
Fig. 45 Bridging to built up the pre-coat.
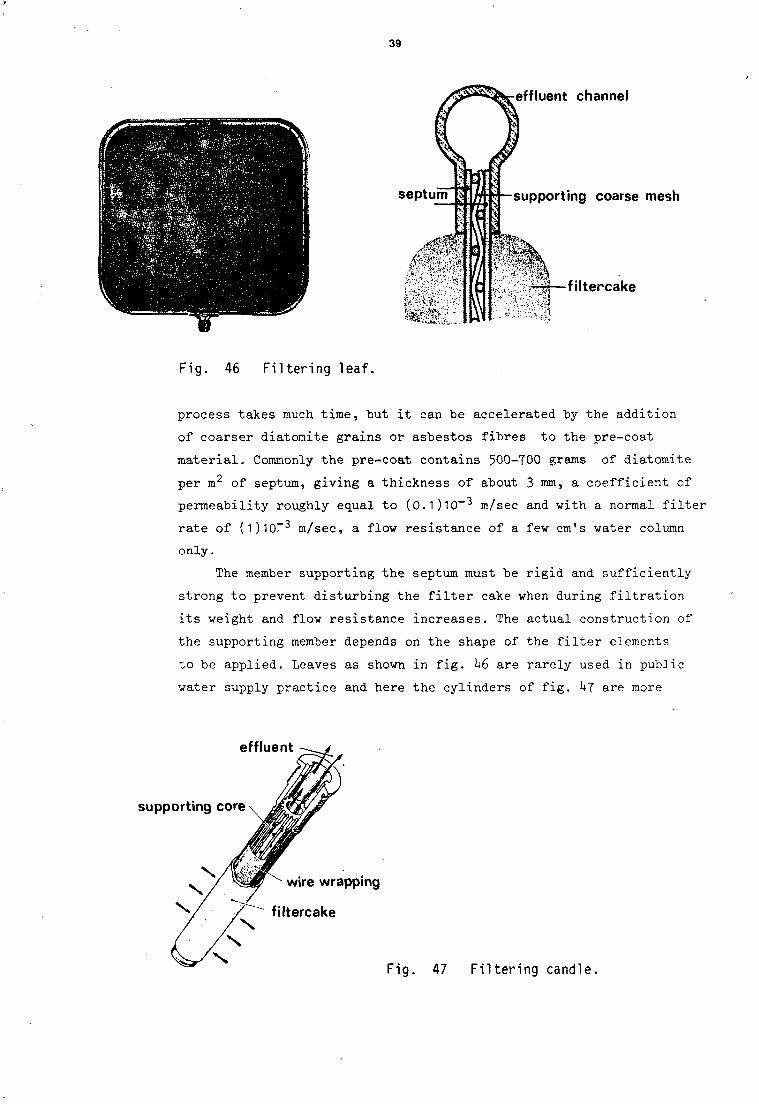
39
septum
effluent channel
supporting coarse mesh
filtercake
Fig. 46 Filtering leaf.
process takes much time, but it can be accelerated by the addition
of coarser diatomite grains or asbestos fibres to the pre-coat
material. Commonly the pre-coat contains 500-700 grams of diatomite
per m2 of septum, giving a thickness of about 3 mm, a coefficient of
permeability roughly equal to (0.1)10-3 m/sec and with a normal filter
rate of (1)10-3 m/sec, a flow resistance of a few em's water column
only.
The member supporting the septum must be rigid and sufficiently
strong to prevent disturbing the filter cake when during filtration
its weight and flow resistance increases. The actual construction of
the supporting member depends on the shape of the filter elements
to be applied. Leaves as shown in fig. h6 are rarely used in public
water supply practice and here the cylinders of fig. kj are more
effluent
supporting core
wire wrapping
filtercake
Fig. 47 F i l te r ing candle.
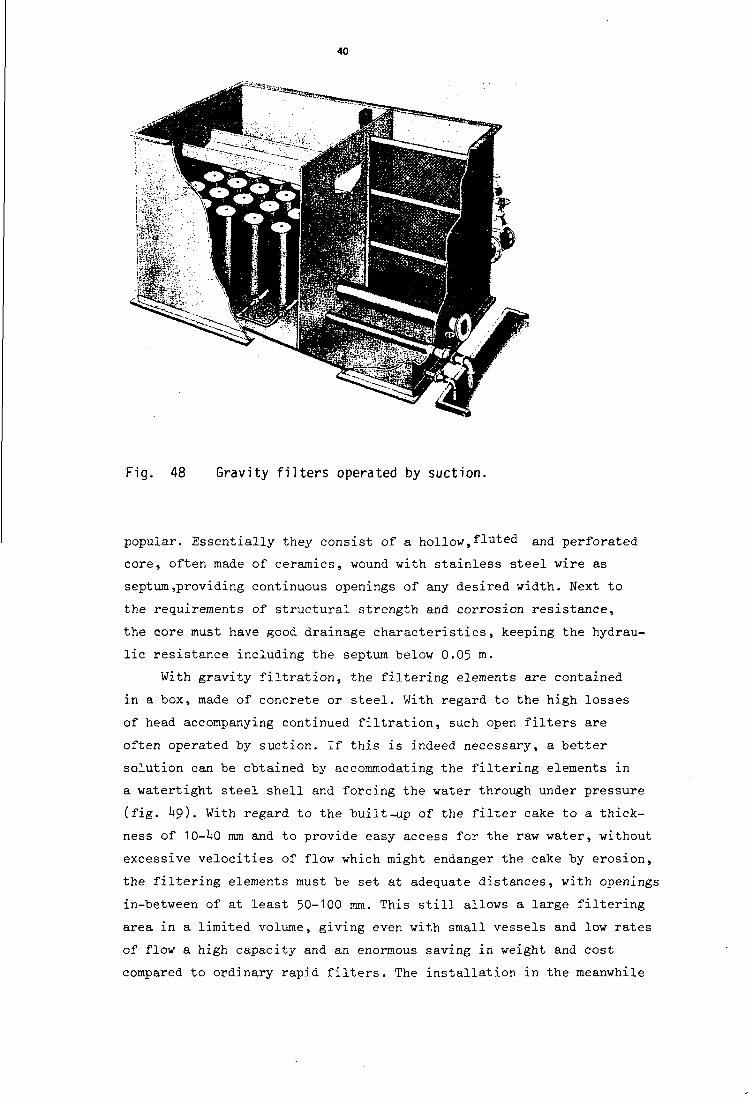
40
Fig. 48 Gravity filters operated by suction.
popular. Essentially they consist of a hollow,fluted and perforated
core, often made of ceramics, wound with stainless steel wire as
septum,providing continuous openings of any desired width. Next to
the requirements of structural strength and corrosion resistance,
the core must have good drainage characteristics, keeping the hydrau
lic resistance including the septum below 0.05 m.
With gravity filtration, the filtering elements are contained
in a box, made of concrete or steel. With regard to the high losses
of head accompanying continued filtration, such open filters are
often operated by suction. If this is indeed necessary, a better
solution can be obtained by accommodating the filtering elements in
a watertight steel shell and forcing the water through under pressure
(fig. U9). With regard to the built-up of the filter cake to a thick
ness of 10-U0 mm and to provide easy access for the raw water, without
excessive velocities of flow which might endanger the cake by erosion,
the filtering elements must be set at adequate distances, with openings
in-between of at least 50-100 mm. This still allows a large filtering
area in a limited volume, giving even with small vessels and low rates
of flow a high capacity and an enormous saving in weight and cost
compared to ordinary rapid filters. The installation in the meanwhile
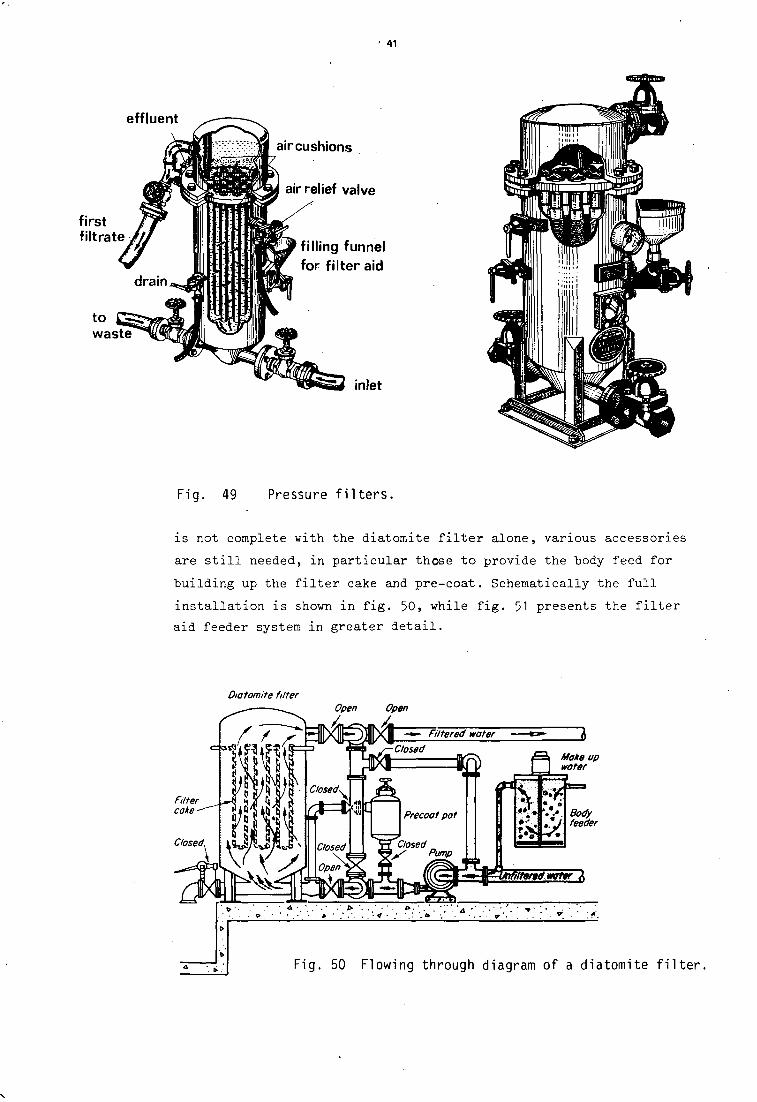
• 41
effluent
first filtrate
air cushions
air relief valve
filling funnel for filter aid
inlet
Fig. 49 Pressure filters.
is not complete with the diatomite filter alone, various accessories
are still needed, in particular those to provide the body feed for
building up the filter cake and pre-coat. Schematically the full
installation is shown in fig. 50, while fig. 51 presents the filter
aid feeder system in greater detail.
Diatomite filter Open Open
Fig. 50 Flowing through diagram of a diatomite f i l t e r .
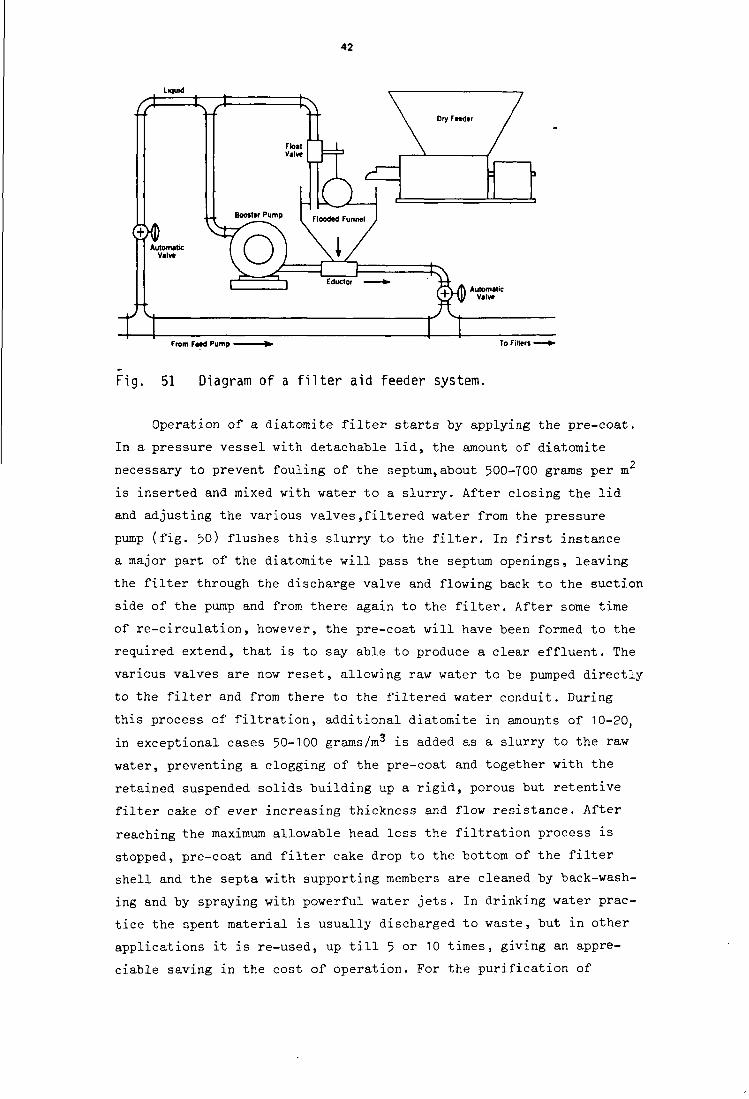
42
Liquid
From F«td Pump To Filters •
Fig. 51 Diagram of a filter aid feeder system.
Operation of a diatomite filter starts by applying the pre-coat.
In a pressure vessel with detachable lid, the amount of diatomite
necessary to prevent fouling of the septum,about 500-700 grams per m
is inserted and mixed with water to a slurry. After closing the lid
and adjusting the various valves,filtered water from the pressure
pump (fig. 50) flushes this slurry to the filter. In first instance
a major part of the diatomite will pass the septum openings, leaving
the filter through the discharge valve and flowing back to the suction
side of the pump and from there again to the filter. After some time
of re-circulation, however, the pre-coat will have been formed to the
required extend, that is to say able to produce a clear effluent. The
various valves are now reset, allowing raw water to be pumped directly
to the filter and from there to the filtered water conduit. During
this process of filtration, additional diatomite in amounts of 10-20,
in exceptional cases 50-100 grams/m3 is added as a slurry to the raw
water, preventing a clogging of the pre-coat and together with the
retained suspended solids building up a rigid, porous but retentive
filter cake of ever increasing thickness and flow resistance. After
reaching the maximum allowable head loss the filtration process is
stopped, pre-coat and filter cake drop to the bottom of the filter
shell and the septa with supporting members are cleaned by back-wash
ing and by spraying with powerful water jets. In drinking water prac
tice the spent material is usually discharged to waste, but in other
applications it is re-used, up till 5 or 10 times, giving an appre
ciable saving in the cost of operation. For the purification of
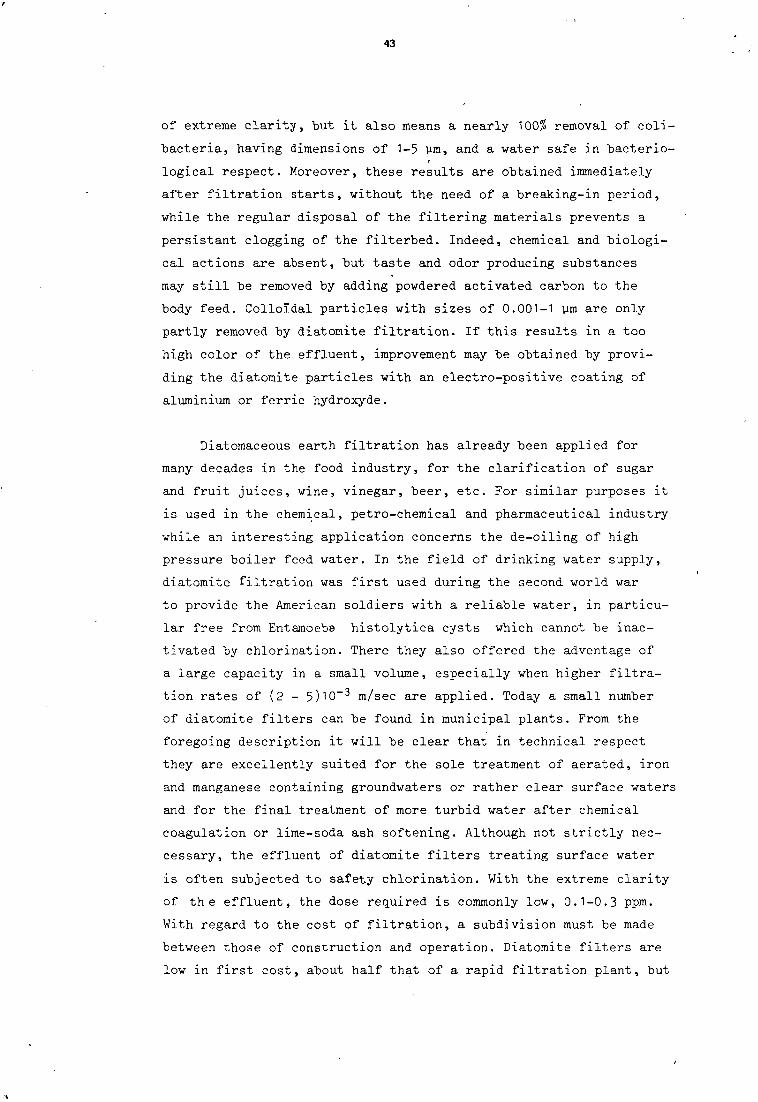
of extreme clarity, but it also means a nearly 100% removal of coli-
bacteria, having dimensions of 1-5 Mm, and a water safe in bacterio
logical respect. Moreover, these results are obtained immediately
after filtration starts, without the need of a breaking-in period,
while the regular disposal of the filtering materials prevents a
persistant clogging of the filterbed. Indeed, chemical and biologi
cal actions are absent, but taste and odor producing substances
may still be removed by adding powdered activated carbon to the
body feed. Colloidal particles with sizes of 0.001-1 ym are only
partly removed by diatomite filtration. If this results in a too
high color of the effluent, improvement may be obtained by provi
ding the diatomite particles with an electro-positive coating of
aluminium or ferric hydroxyde.
Diatomaceous earth filtration has already been applied for
many decades in the food industry, for the clarification of sugar
and fruit juices, wine, vinegar, beer, etc. For similar purposes it
is used in the chemical, petro-chemical and pharmaceutical industry
while an interesting application concerns the de-oiling of high
pressure boiler feed water. In the field of drinking water supply,
diatomite filtration was first used during the second world war
to provide the American soldiers with a reliable water, in particu
lar free from Entamoeba histolytica cysts which cannot be inac
tivated by chlorination. There they also offered the adventage of
a large capacity in a small volume, especially when higher filtra
tion rates of (2 - 5)10-3 m/sec are applied. Today a small number
of diatomite filters can be found in municipal plants. From the
foregoing description it will be clear that in technical respect
they are excellently suited for the sole treatment of aerated, iron
and manganese containing groundwaters or rather clear surface waters
and for the final treatment of more turbid water after chemical
coagulation or lime-soda ash softening. Although not strictly nec-
cessary, the effluent of diatomite filters treating surface water
is often subjected to safety chlorination. With the extreme clarity
of the effluent, the dose required is commonly low, 0.1-0.3 ppm.
With regard to the cost of filtration, a subdivision must be made
between those of construction and operation. Diatomite filters are
low in first cost, about half that of a rapid filtration plant, but
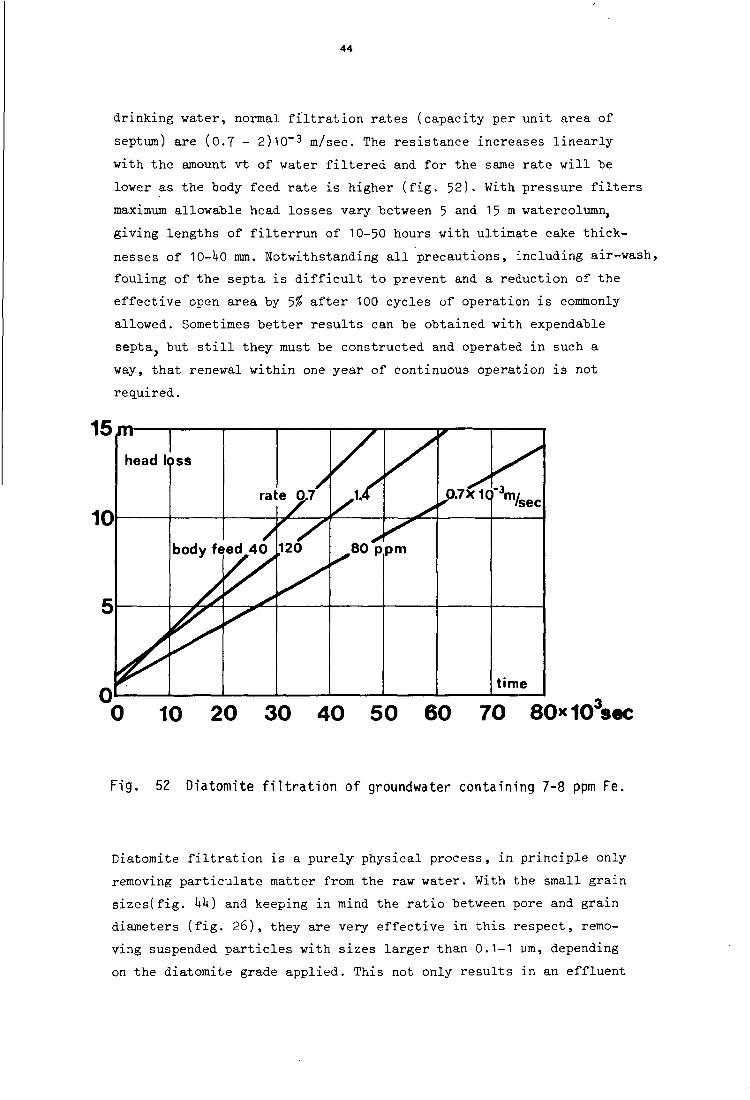
44
drinking water, normal filtration rates (capacity per unit area of
septum) are (0.7 - 2)10~3 m/sec. The resistance increases linearly
with the amount Art of water filtered and for the same rate will he
lower as the body feed rate is higher (fig. 52). With pressure filters
maximum allowable head losses vary between 5 and 15 m watercolumn,
giving lengths of filterrun of 10-50 hours with ultimate cake thick
nesses of 10-1*0 mm. Notwithstanding all precautions, including air-wash,
fouling of the septa is difficult to prevent and a reduction of the
effective open area by 5$ after 100 cycles of operation is commonly
allowed. Sometimes better results can be obtained with expendable
septa but still they must be constructed and operated in such a
way, that renewal within one year of continuous operation is not
required.
15 m
10 20 30 40 5 0 60 70 80x10*sec
Fig. 52 Diatomite filtration of groundwater containing 7-8 ppm Fe.
Diatomite filtration is a purely physical process, in principle only
removing particulate matter from the raw water. With the small grain
sizes(fig. hk) and keeping in mind the ratio between pore and grain
diameters (fig. 26), they are very effective in this respect, remo
ving suspended particles with sizes larger than 0.1-1 ym, depending
on the diatomite grade applied. This not only results in an effluent
r
45
the operating costs are much higher. All-together, a diatomite
filtration plant is more expensive to run than a plant containing
rapid filters, limiting their use to small capacity supplies, for
instance less than 0.05-0.1 m /sec,to emergency and stand-by services
and to periods of peak consumption. As mentioned before, diatomite
filters are excellently suited for those part-time duties, the efflu
ent satisfying all quality requirements as soon as the pre-coat is
formed. They can also be used to advantage where space is at a pre
mium. In the field of water treatment, however, their greatest appli
cation is still the purification of water for swimmingpools, giving
a visibility much better than that of ordinary good quality drinking
water. With higher filtration rates, (1.5-2)10—3 m/sec and re-using
the filter aid 5-10 times, the costs are appreciably reduced, while
the saving in weight and space is here often of great importance.
In diatomite filtration only a thin layer of pre-coat and
filter cake, with an initial thickness of not more than 2 mm, sepa
rates the filtered from the raw water. This layer moreover is easily
damaged, by a short interruption of pumping for instance and many
water engineers therefore hesitate to apply this process for public
supplies.

46
8. Selected literature
Micro-straining
1. Micro-straining. P.L. Boucher.
Journal Institution of Water Engineers, 1951, pp 561-595.
2. Application of the micro-strainer to water treatment in Great
Brittain. R. Hazen.
Journal American Water Works Association, +5( 1953)» pp 723-737
3. Review of experiences with microstrainer installations.
G. R. Evans.
Journal American Waterworks Association, U9(1957)» pp 5^1—552
h. Micro-straining. P.L. Boucher.
Journal British Waterworks Association, 1*1 (1959). PP 1+77-1+86.
5- Removal of algae by microstrainers. A. Berry.
Journal American Waterworks Association, 1961 , pp 1503-1508.
6. Versuche zur Vorreinigung von Oberflachenwasser mittels
Mikrosiebfilter. W. Bartzsch.
Wasserwirtschaft-Wassertechnik, 11(1961), pp ^25-^30.
7- Behavior and evaluation of microstraining for a supply in
California. C. Carter.
Journal American Waterworks Association, 5M1962), pp 606-620.
8. Experiences with microstraining at Ilion. W.O. Lynch,
C.R. Baker and J.H. Haberer.
Journal American Waterworks Association, 57(1965), pp 1^22-1^30
9. Microzeven. H.J.M. Lips.
20th Vacantie-cursus in Drinkwater voorziening, pp 58-61 (1968).
10. Filtrability index and microscreener design. F.O. Mixon.
Journal Water Pollution Control Federation, 1+2(1970), pp 19UU-I950
47
Diatomite filtration
1. A theory of diatomite filtration. R. La Frenz.
Journal American Waterworks Association, 5M1962), pp 1109—1119-
2. Design criteria for Diatomite filters. G.R. Bell.
Journal American Waterworks Association, 5M1962), pp 12U1-1256.
3. Theoretical aspects of diatomite filtration. Bauman, Cleasby
and Morgan.
Water and sewage works, 196U, pp 229-233, 290-29*+, 331-336.
k. Modified form of diatomite filtration equation. E.R. Baumann.
Journal American Waterworks Association, 56(196U), pp 330-332.
5. Diatomite filters for municipal use. Task group report.
Journal American Waterworks Association, 57(1965), pp 15T—180.
6. Optimum design and operation of diatomite filtration plants.
Dillingham, Cleasby and Baumann.
Journal American Waterworks Association, 58(1966), pp 657-672.
7. Experiences with diatomite filtration in New York State.
Samuel Syrotynski.
Journal American Waterworks Association, 59(1967), PP 867-877-
8. Diatomeeenfilters. J.G. Fikken.
Twintigste Vakantiekursus in Drinkwatervoorziening, 1968.