see-and-avoid quadcopter using fuzzy control optimized...
TRANSCRIPT

See-and-Avoid Quadcopter using Fuzzy ControlOptimized by Cross-Entropy
Miguel A. Olivares-Mendez IEEE Student MemberPascual Campoy IEEE Member
and Ignacio Mellado-BatallerUniversidad Politecnica de Madrid
CAR - Centro de Automatica y RoboticaEmail: [email protected]
http://www.vision4uav.eu/?q=miguel/personal
Luis Mejias IEEE MemberAustralian Research Centre for Aerospace Automation (ARCAA)
Queensland University of TechnologyGPO Box 2434, Brisbane, Queensland 4001, Australia
Email: [email protected]
Abstract—In this work we present an optimized fuzzy visualservoing system for obstacle avoidance using an unmanned aerialvehicle. The cross-entropy theory is used to optimise the gainsof our controllers. The optimization process was made using theROS-Gazebo 3D simulation with purposeful extensions developedfor our experiments. Visual servoing is achieved through animage processing front-end that uses the Camshift algorithmto detect and track objects in the scene. Experimental flighttrials using a small quadrotor were performed to validate theparameters estimated from simulation. The integration of cross-entropy methods is a straightforward way to estimate optimalgains achieving excellent results when tested in real flights.
I. INTRODUCTION
Aerial robotics is getting more importance each year in thefield of robotic community. The advances in electronics haveallowedthe miniaturization of sensors and the systems onboardaircraft, causing a radical increasing in the manufacturing ofall sort of aerial robots at an affordable price. Nowadays ispossible to acquire a basic quadcopter in standard electronicor toy shops, when years ago the possibility of research withaerial robots was affordable only by few research groups inthe world. Actually there are so much research groups involveto obtain results for different type of tasks with this kind ofplatform.
Multiple sensors are used onboard aerial robots in order toacquire information of the environment. For instance, Laserranger finder [1] and sonars [2]. But the most widely used sen-sor are cameras. An example of the use of cameras for attitudeestimation can be found in [3], [4]. Furthermore, advancedsystems such as the ”kinect” [5] have been demonstarted withquadrotors [6].
On the other side the Soft-computing techniques in engi-neering applications are becoming common. Tasks such asprediction [7], data mining [8], control are some of the usesof these techniques.The way Soft-Computing can manage un-certainty and inaccuracies of sensors made them very suitablefor automatize robotic systems. Some examples for controlpurposes can be found in [9], [10]. In order to obtain arobust control system once the controller was developed anoptimization process is required. One of the last optimization
method developed is the Cross-entropy [11] which has notbeen widely used for control tasks [12], [13].
This paper is structured as follows. In section II we describethe image processing front-end used in our approach. Insection III we explain the visual servoing approach usingfuzzy logic for heading control. The cross-entropy theory isintroduced in section IV. Experimental results are presentedin section V. Finally, concluding remarks and future work arepresented in section VI.
II. VISUAL SYSTEM
Information (image) from the environment is acquired usingan onboard forward-looking camera. This information is thensent for off-board processing in a laptop ground-station. Theresult of the visual processing (including servoing commands)are then send back to the vehicle using a 802.11n link. Inthis section we describe briefly the image processing front-end used for detection and tracking of objects.
In a nutshell, the avoidance task is based on the idea ofkeeping the target in the image plane at constant bearing, eitherright of left (as seen from image centre). When the object isfirst detected is pushed to the edge (far left of right side) ofthe image. Objects will be placed in the far edge on the sameside of first detection.
The problem of target detection is approached pre-defininga color and then designing an algorithm to highlight thiscolor that then will be tracked. For this purpose, we use acolor representation that allows us to keep color distributionsderived from video image sequences approximately constant(in outdoor settings). This process is not always perfect, andchanges still occur in colour distributions over time. Thisdynamic nature of changes in lighting can be addressed bydynamically adapting to changes in probability distributionsof color. An algorithm that adopts this strategy is the Contin-uously Adaptive Mean Shift [14] (CamShift). This algorithmis based on the mean shift originally introduced by Fukunagaand Hostetler [15].
Using Camshift algorithm we are able to track and extractthe centre of the color region that describes the object.Figure 16 shows an example of the tracking processes on
U.S. Government work not protected by U.S. copyright
WCCI 2012 IEEE World Congress on Computational Intelligence June, 10-15, 2012 - Brisbane, Australia FUZZ IEEE
red coloured object. Using the coordinates of the object’scentre in the image plane, we are able to generate desiredyaw commands which in turn will modify the trajectory ofthe vehicle in order to keep the object at constant relativebearing. This is performed keeping forward velocity constant.
III. FUZZY CONTROLLER
The aim of the controller is to generate desired yaw com-mands for the vehicle based on the location of the target inthe image plane.This section will describe the details of thiscontroller.
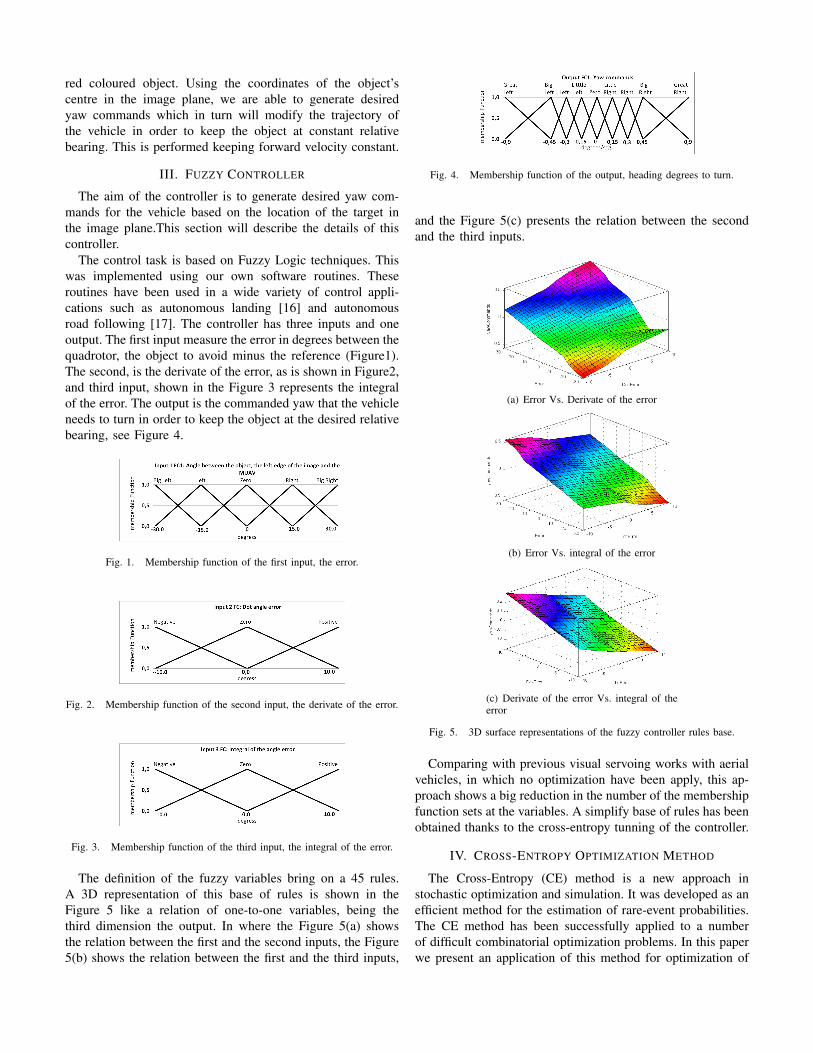
The control task is based on Fuzzy Logic techniques. Thiswas implemented using our own software routines. Theseroutines have been used in a wide variety of control appli-cations such as autonomous landing [16] and autonomousroad following [17]. The controller has three inputs and oneoutput. The first input measure the error in degrees between thequadrotor, the object to avoid minus the reference (Figure1).The second, is the derivate of the error, as is shown in Figure2,and third input, shown in the Figure 3 represents the integralof the error. The output is the commanded yaw that the vehicleneeds to turn in order to keep the object at the desired relativebearing, see Figure 4.
Fig. 1. Membership function of the first input, the error.
Fig. 2. Membership function of the second input, the derivate of the error.
Fig. 3. Membership function of the third input, the integral of the error.
The definition of the fuzzy variables bring on a 45 rules.A 3D representation of this base of rules is shown in theFigure 5 like a relation of one-to-one variables, being thethird dimension the output. In where the Figure 5(a) showsthe relation between the first and the second inputs, the Figure5(b) shows the relation between the first and the third inputs,
Fig. 4. Membership function of the output, heading degrees to turn.
and the Figure 5(c) presents the relation between the secondand the third inputs.
(a) Error Vs. Derivate of the error
(b) Error Vs. integral of the error
(c) Derivate of the error Vs. integral of theerror
Fig. 5. 3D surface representations of the fuzzy controller rules base.
Comparing with previous visual servoing works with aerialvehicles, in which no optimization have been apply, this ap-proach shows a big reduction in the number of the membershipfunction sets at the variables. A simplify base of rules has beenobtained thanks to the cross-entropy tunning of the controller.
IV. CROSS-ENTROPY OPTIMIZATION METHOD
The Cross-Entropy (CE) method is a new approach instochastic optimization and simulation. It was developed as anefficient method for the estimation of rare-event probabilities.The CE method has been successfully applied to a numberof difficult combinatorial optimization problems. In this paperwe present an application of this method for optimization of

the gains of a Fuzzy controller. Next, we present the methodand the Fuzzy controller optimization approach. A deeplyexplanation of the Cross Entropy method is presented on [11]
A. Method DescriptionThe CE method is iterative and based on the generation of
a random data sample (x1, ...,xN) in the χ space accordingto a specified random mechanism. An reasonable option is touse a probability density function (pdf) such as the normaldistribution. Let g(−,v) be a family of probability densityfunctions in χ parametrized by a real value vector v ∈ ℜ:g(x,v). Let φ be a real function on χ , so the aim of the CEmethod is to find the minimum (like in our case) or maximumof φ over χ , and the corresponding states x∗ satisfying thisminimum/maximum: γ∗ = φ(x∗) = minx∈χ φ(x).
In each iteration the CE method generate a sequence of(x1, ...,xN) and γ1...γN levels such that γ converges to γ∗ andx to x∗. We are concerned with estimating the probability l(γ)of a event Ev = {x ∈ χ | φ(x)≥ γ},γ ∈ℜ.
Defining a collection of functions for x ∈ χ,γ ∈ℜ.
Iv(x,γ) = I{χ(xi)>γ} =
{1 i f φ(x)≤ γ
0 i f φ(x)> γ(1)
l(γ) = Pv(χ(x)≥ γ) = Ev · Iv(x,v) (2)
where Ev denotes the corresponding expectation operator. Inthis manner, Equation 2 transform the optimization probleminto an stochastic problem with very small probability. Thevariance minimization technique of importance sampling isused in which the random sample is generated based on a pdfh. Being the sample x1, ...,xN from an importance samplingdensity h on φ and evaluated by:
l =1N·
N
∑i=1
I{χ(xi)>γ} ·W (xi) (3)
Where l is the importance sampling and W (x) = g(x,v)l is the
likelihood ratio. The search for the sampling density h∗(x) isnot an easy task because the estimation of h∗(x) requires that lbe known h∗(x)= I{χ(xi)>γ} ·
g(x,v)l . So the referenced parameter
v∗, must be selected such the distance between h∗ and g(x,v)is minimal, thereby the problem is reduced to a scalar case.A way to measure the distance between two densities id theKullback-Leibler, also known like cross-entropy:
D(g,h) =∫
g(x) · ln g(x)dx−∫
g(x) · ln h(x)dx (4)
The minimization of D(g(x,v),h∗) is equivalent to max-imize
∫h∗ln[g(x,v)]dx which implies that maxvD(v) =
maxvEp(I{χ(xi)>γ} · ln g(x,v)
), in terms of importance sam-
pling it can be re-written as:
maxvD(v) = max1N
N
∑i=1
I{χ(xi)>γ} ·px(x)h(xi)
· ln g(xi,v) (5)
Note that h is still unknown, therefore the CE algorithm willtry to overcome this problem by constructing an adaptivesequence of the parameters (γt | t ≥ 1) and (vt | t ≥ 1).
B. Fuzzy Control Optimization Approach
This approach is based on a population-and-simulationoptimization [18]. The CE algorithm generates a set ofN fuzzy controllers xi = (xKE ,xKD,xKI) with g(x,v) =(g(xKE ,v),g(xKD,v),g(xKI ,v)) and calculates the cost func-tion value for each controller. The controllers parametersKE,KD,KI correspond to the gains of the first, second andthird input of each controller (Figures 1, 2 and 3). Thenupdates g(x,v) using a set of the best controllers. This setof controllers is defined with the parameter Nelite.The processfinish when the minimum value of the cost function or themaximum number of iterations is reached, as is shown in theAlgorithm 1.
Algorithm 1 Cross-Entropy Algorithm for Fuzzy controlleroptimization1. Initialize t = 0 and v(t) = v(0)2 Generate a sample of N controllers: (x j(t))1≤ j≤N) fromg(x,v(t)), being each xi = (xKE j,xKD j,xKI j)3. Compute φ(x j(t)) and order φ1,φ2, ...,φN from smallest tobiggest. Get the Nelite first controllers γ(t) = χ[Nelite].4. Update v(t) with v(t + 1) = argvmin 1
N ∑Nj=1 I{χ(x j(t))≥γ(t)} ·
ln g(x j(t),v(t))5. Repeat from step 2 until convergence or ending criterion.6. Assume that convergence is reached at t = t∗, an optimalvalue for φ can be obtained from g(.,v(t)∗).
For this work the Normal (Gaussian) distribution functionwas selected. The mean µ and the variance σ are estimatedfor each iteration h = 1,2,3 parameters (Ke,Kd ,Ki) as µth =
∑Nelite
j=1x jh
Nelite and σth = ∑Nelite
j=1(x jh−µ jh)
2
Nelite where 4≤ Nelite ≤ 20.The mean vector ¯µ should converge yo γ∗ and the standard
deviation ¯σ to zero. In order to obtain a smooth update of themean and the variance we use a set of parameters (β ,α,η),where α is a constant value used for the mean, η is a variablevalue which is applied to the variance to avert the occurrencesof 0s and 1s in the parameter vectors, and β is a constantvalue which modify the value of η .
η = β −β · (1− 1t )
q
µ(t) = α · ˜µ(t)+(1−α) · µ(t−1)σ(t) = η · σ +(1−η) · σ(t−1)
(6)
Where µ(t−1) and σ(t−1) are the previous values of µ(t)and σ(t). The values of the smoothing update parameters are0.4≤ α ≤ 0.9, 0.6≤ β ≤ 0.9 and 2≤ q≤ 7. In order to get anoptimized controller different cost functions could be chosen,such as the Integral Time of the Absolute Error (ITAE) or theIntegral Time of the Square Error (ITSE) or the Root Mean-Square Error (RMSE).
V. RESULTS
A. Simulation Tests
In this section are presented all the information aboutthe simulation environment and software developed for the
optimization using the Cross-Entropy method. The explanationof the 330 tests accomplished, the evolution of the gains,its probability density functions and the evaluated error ispresented in the second part of this subsection.
1) Simulation Environment: The simulation tests were per-formed using the ROS (Robotics Operative System) and the3D simulation Gazebo [19]. In the simulations, a quadcoptermodel of starmack ros-pkg developed by the Berkeley Univer-sity [20] used. The obstacle to avoid is defined by a virtualyellow balloon.
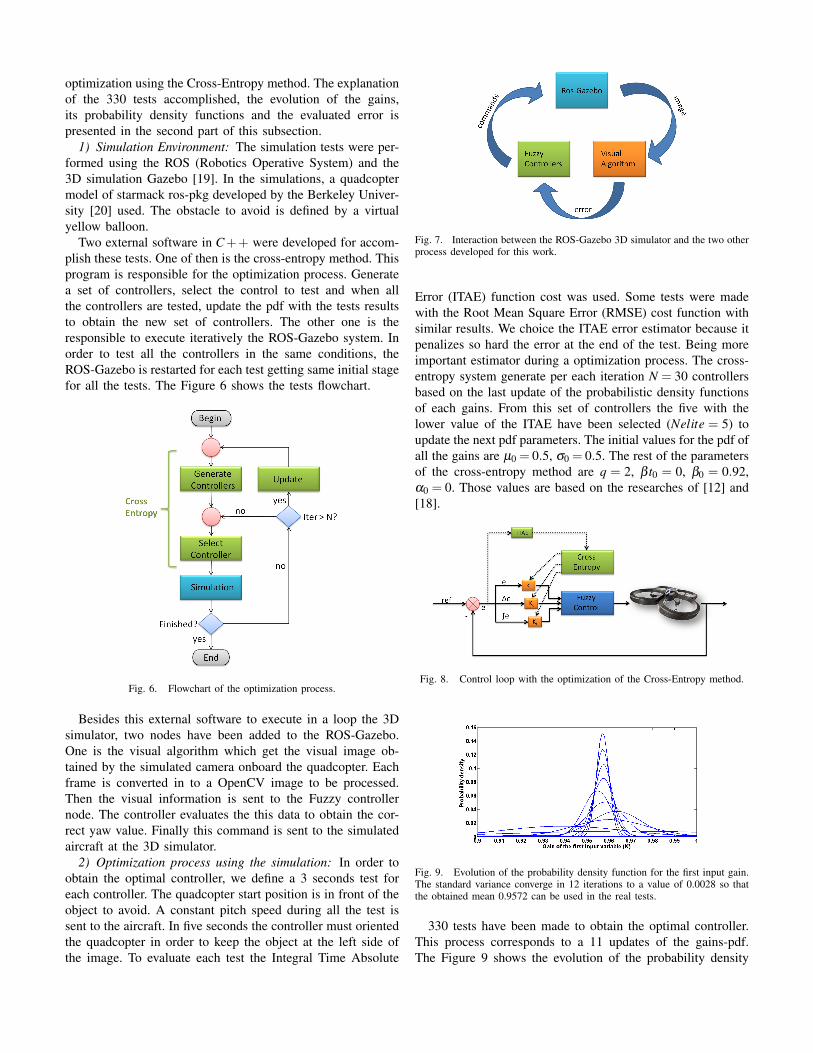
Two external software in C++ were developed for accom-plish these tests. One of then is the cross-entropy method. Thisprogram is responsible for the optimization process. Generatea set of controllers, select the control to test and when allthe controllers are tested, update the pdf with the tests resultsto obtain the new set of controllers. The other one is theresponsible to execute iteratively the ROS-Gazebo system. Inorder to test all the controllers in the same conditions, theROS-Gazebo is restarted for each test getting same initial stagefor all the tests. The Figure 6 shows the tests flowchart.
Fig. 6. Flowchart of the optimization process.
Besides this external software to execute in a loop the 3Dsimulator, two nodes have been added to the ROS-Gazebo.One is the visual algorithm which get the visual image ob-tained by the simulated camera onboard the quadcopter. Eachframe is converted in to a OpenCV image to be processed.Then the visual information is sent to the Fuzzy controllernode. The controller evaluates the this data to obtain the cor-rect yaw value. Finally this command is sent to the simulatedaircraft at the 3D simulator.
2) Optimization process using the simulation: In order toobtain the optimal controller, we define a 3 seconds test foreach controller. The quadcopter start position is in front of theobject to avoid. A constant pitch speed during all the test issent to the aircraft. In five seconds the controller must orientedthe quadcopter in order to keep the object at the left side ofthe image. To evaluate each test the Integral Time Absolute
Fig. 7. Interaction between the ROS-Gazebo 3D simulator and the two otherprocess developed for this work.
Error (ITAE) function cost was used. Some tests were madewith the Root Mean Square Error (RMSE) cost function withsimilar results. We choice the ITAE error estimator because itpenalizes so hard the error at the end of the test. Being moreimportant estimator during a optimization process. The cross-entropy system generate per each iteration N = 30 controllersbased on the last update of the probabilistic density functionsof each gains. From this set of controllers the five with thelower value of the ITAE have been selected (Nelite = 5) toupdate the next pdf parameters. The initial values for the pdf ofall the gains are µ0 = 0.5, σ0 = 0.5. The rest of the parametersof the cross-entropy method are q = 2, β t0 = 0, β0 = 0.92,α0 = 0. Those values are based on the researches of [12] and[18].
Fig. 8. Control loop with the optimization of the Cross-Entropy method.
Fig. 9. Evolution of the probability density function for the first input gain.The standard variance converge in 12 iterations to a value of 0.0028 so thatthe obtained mean 0.9572 can be used in the real tests.
330 tests have been made to obtain the optimal controller.This process corresponds to a 11 updates of the gains-pdf.The Figure 9 shows the evolution of the probability density
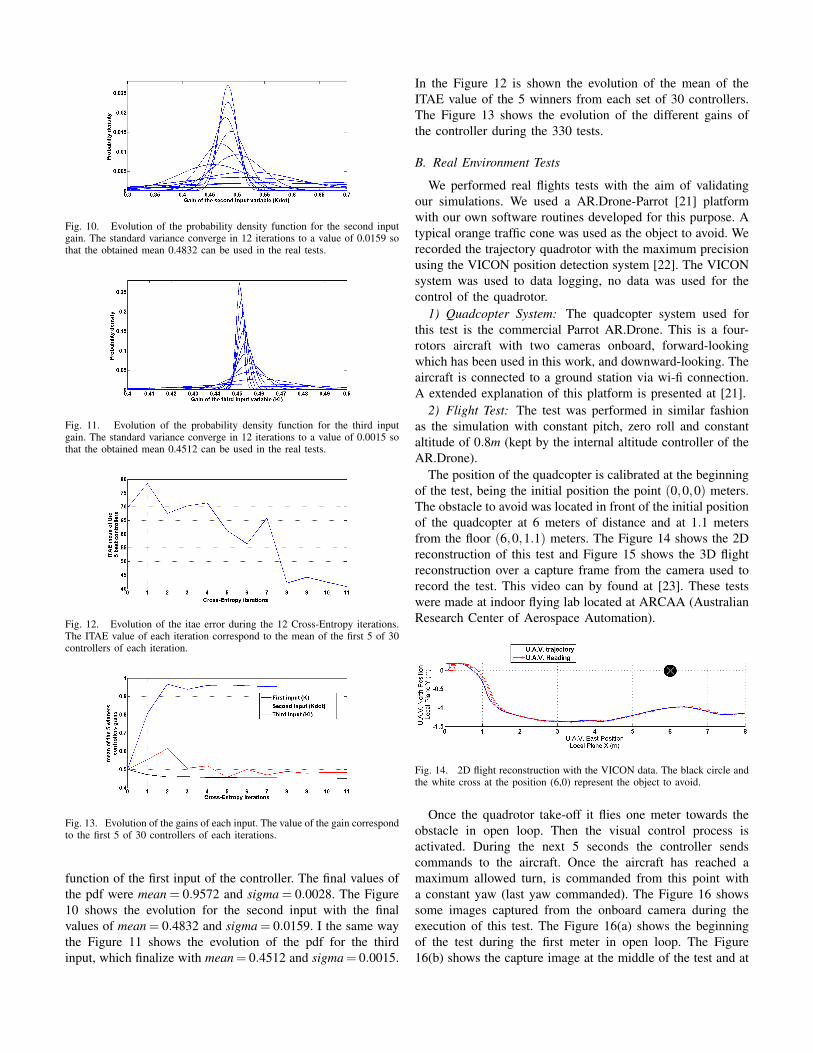
Fig. 10. Evolution of the probability density function for the second inputgain. The standard variance converge in 12 iterations to a value of 0.0159 sothat the obtained mean 0.4832 can be used in the real tests.
Fig. 11. Evolution of the probability density function for the third inputgain. The standard variance converge in 12 iterations to a value of 0.0015 sothat the obtained mean 0.4512 can be used in the real tests.
Fig. 12. Evolution of the itae error during the 12 Cross-Entropy iterations.The ITAE value of each iteration correspond to the mean of the first 5 of 30controllers of each iteration.
Fig. 13. Evolution of the gains of each input. The value of the gain correspondto the first 5 of 30 controllers of each iterations.
function of the first input of the controller. The final values ofthe pdf were mean = 0.9572 and sigma = 0.0028. The Figure10 shows the evolution for the second input with the finalvalues of mean = 0.4832 and sigma = 0.0159. I the same waythe Figure 11 shows the evolution of the pdf for the thirdinput, which finalize with mean= 0.4512 and sigma= 0.0015.
In the Figure 12 is shown the evolution of the mean of theITAE value of the 5 winners from each set of 30 controllers.The Figure 13 shows the evolution of the different gains ofthe controller during the 330 tests.
B. Real Environment Tests
We performed real flights tests with the aim of validatingour simulations. We used a AR.Drone-Parrot [21] platformwith our own software routines developed for this purpose. Atypical orange traffic cone was used as the object to avoid. Werecorded the trajectory quadrotor with the maximum precisionusing the VICON position detection system [22]. The VICONsystem was used to data logging, no data was used for thecontrol of the quadrotor.
1) Quadcopter System: The quadcopter system used forthis test is the commercial Parrot AR.Drone. This is a four-rotors aircraft with two cameras onboard, forward-lookingwhich has been used in this work, and downward-looking. Theaircraft is connected to a ground station via wi-fi connection.A extended explanation of this platform is presented at [21].
2) Flight Test: The test was performed in similar fashionas the simulation with constant pitch, zero roll and constantaltitude of 0.8m (kept by the internal altitude controller of theAR.Drone).
The position of the quadcopter is calibrated at the beginningof the test, being the initial position the point (0,0,0) meters.The obstacle to avoid was located in front of the initial positionof the quadcopter at 6 meters of distance and at 1.1 metersfrom the floor (6,0,1.1) meters. The Figure 14 shows the 2Dreconstruction of this test and Figure 15 shows the 3D flightreconstruction over a capture frame from the camera used torecord the test. This video can by found at [23]. These testswere made at indoor flying lab located at ARCAA (AustralianResearch Center of Aerospace Automation).
Fig. 14. 2D flight reconstruction with the VICON data. The black circle andthe white cross at the position (6,0) represent the object to avoid.
Once the quadrotor take-off it flies one meter towards theobstacle in open loop. Then the visual control process isactivated. During the next 5 seconds the controller sendscommands to the aircraft. Once the aircraft has reached amaximum allowed turn, is commanded from this point witha constant yaw (last yaw commanded). The Figure 16 showssome images captured from the onboard camera during theexecution of this test. The Figure 16(a) shows the beginningof the test during the first meter in open loop. The Figure16(b) shows the capture image at the middle of the test and at
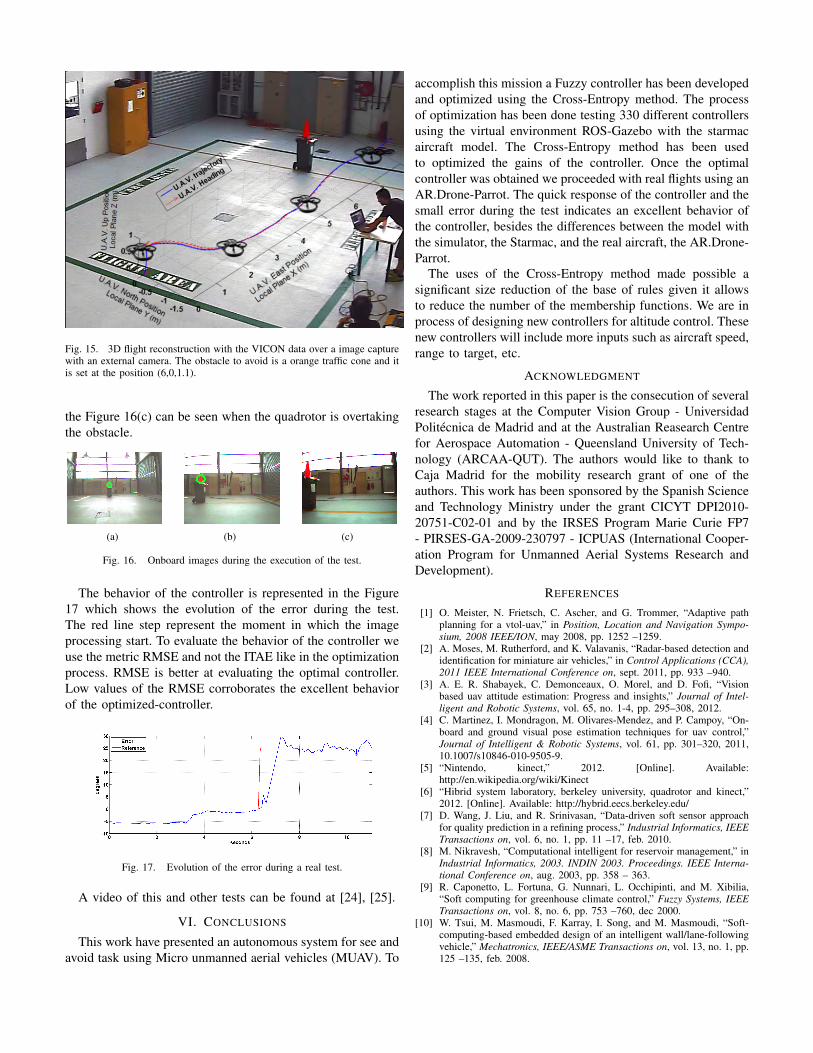
Fig. 15. 3D flight reconstruction with the VICON data over a image capturewith an external camera. The obstacle to avoid is a orange traffic cone and itis set at the position (6,0,1.1).
the Figure 16(c) can be seen when the quadrotor is overtakingthe obstacle.
(a) (b) (c)
Fig. 16. Onboard images during the execution of the test.
The behavior of the controller is represented in the Figure17 which shows the evolution of the error during the test.The red line step represent the moment in which the imageprocessing start. To evaluate the behavior of the controller weuse the metric RMSE and not the ITAE like in the optimizationprocess. RMSE is better at evaluating the optimal controller.Low values of the RMSE corroborates the excellent behaviorof the optimized-controller.
Fig. 17. Evolution of the error during a real test.
A video of this and other tests can be found at [24], [25].
VI. CONCLUSIONS
This work have presented an autonomous system for see andavoid task using Micro unmanned aerial vehicles (MUAV). To
accomplish this mission a Fuzzy controller has been developedand optimized using the Cross-Entropy method. The processof optimization has been done testing 330 different controllersusing the virtual environment ROS-Gazebo with the starmacaircraft model. The Cross-Entropy method has been usedto optimized the gains of the controller. Once the optimalcontroller was obtained we proceeded with real flights using anAR.Drone-Parrot. The quick response of the controller and thesmall error during the test indicates an excellent behavior ofthe controller, besides the differences between the model withthe simulator, the Starmac, and the real aircraft, the AR.Drone-Parrot.
The uses of the Cross-Entropy method made possible asignificant size reduction of the base of rules given it allowsto reduce the number of the membership functions. We are inprocess of designing new controllers for altitude control. Thesenew controllers will include more inputs such as aircraft speed,range to target, etc.
ACKNOWLEDGMENT
The work reported in this paper is the consecution of severalresearch stages at the Computer Vision Group - UniversidadPolitecnica de Madrid and at the Australian Reasearch Centrefor Aerospace Automation - Queensland University of Tech-nology (ARCAA-QUT). The authors would like to thank toCaja Madrid for the mobility research grant of one of theauthors. This work has been sponsored by the Spanish Scienceand Technology Ministry under the grant CICYT DPI2010-20751-C02-01 and by the IRSES Program Marie Curie FP7- PIRSES-GA-2009-230797 - ICPUAS (International Cooper-ation Program for Unmanned Aerial Systems Research andDevelopment).
REFERENCES
[1] O. Meister, N. Frietsch, C. Ascher, and G. Trommer, “Adaptive pathplanning for a vtol-uav,” in Position, Location and Navigation Sympo-sium, 2008 IEEE/ION, may 2008, pp. 1252 –1259.
[2] A. Moses, M. Rutherford, and K. Valavanis, “Radar-based detection andidentification for miniature air vehicles,” in Control Applications (CCA),2011 IEEE International Conference on, sept. 2011, pp. 933 –940.
[3] A. E. R. Shabayek, C. Demonceaux, O. Morel, and D. Fofi, “Visionbased uav attitude estimation: Progress and insights,” Journal of Intel-ligent and Robotic Systems, vol. 65, no. 1-4, pp. 295–308, 2012.
[4] C. Martinez, I. Mondragon, M. Olivares-Mendez, and P. Campoy, “On-board and ground visual pose estimation techniques for uav control,”Journal of Intelligent & Robotic Systems, vol. 61, pp. 301–320, 2011,10.1007/s10846-010-9505-9.
[5] “Nintendo, kinect,” 2012. [Online]. Available:http://en.wikipedia.org/wiki/Kinect
[6] “Hibrid system laboratory, berkeley university, quadrotor and kinect,”2012. [Online]. Available: http://hybrid.eecs.berkeley.edu/
[7] D. Wang, J. Liu, and R. Srinivasan, “Data-driven soft sensor approachfor quality prediction in a refining process,” Industrial Informatics, IEEETransactions on, vol. 6, no. 1, pp. 11 –17, feb. 2010.
[8] M. Nikravesh, “Computational intelligent for reservoir management,” inIndustrial Informatics, 2003. INDIN 2003. Proceedings. IEEE Interna-tional Conference on, aug. 2003, pp. 358 – 363.
[9] R. Caponetto, L. Fortuna, G. Nunnari, L. Occhipinti, and M. Xibilia,“Soft computing for greenhouse climate control,” Fuzzy Systems, IEEETransactions on, vol. 8, no. 6, pp. 753 –760, dec 2000.
[10] W. Tsui, M. Masmoudi, F. Karray, I. Song, and M. Masmoudi, “Soft-computing-based embedded design of an intelligent wall/lane-followingvehicle,” Mechatronics, IEEE/ASME Transactions on, vol. 13, no. 1, pp.125 –135, feb. 2008.

[11] R. Y. Rubinstein and D. P. Kroese, The Cross Entropy Method: A UnifiedApproach To Combinatorial Optimization, Monte-carlo Simulation (In-formation Science and Statistics). Secaucus, NJ, USA: Springer-VerlagNew York, Inc., 2004.
[12] R. E. Haber, R. M. del Toro, and A. Gajate, “Optimal fuzzy controlsystem using the cross-entropy method. a case study of a drillingprocess,” Information Sciences. Special Section on Hybrid IntelligentAlgorithms and Applications, vol. 180, pp. 2777–2792, July 2010.
[13] M. Bodur, “An adaptive cross-entropytuning of the pid control for robotmanipulators,” in Proceedings of the World Congress on Engineering,WCE 2007, 2007, 2007, pp. 93–98.
[14] G. R. Bradski, “Computer vision face tracking for use in a perceptualuser interface,” Intel Technology Journal, no. Q2, 1998. [Online].Available: http://citeseer.ist.psu.edu/585206.html
[15] K. Fukunaga and L. Hostetler, “The estimation of the gradient of adensity function, with applications in pattern recognition,” InformationTheory, IEEE Transactions on, vol. 21, no. 1, pp. 32 – 40, Jan. 1975.
[16] M. Olivares-Mendez, I. Mondragon, P. Campoy, and C. Martinez,“Fuzzy controller for uav-landing task using 3d-position visual estima-tion,” in Fuzzy Systems (FUZZ), 2010 IEEE International Conferenceon, july 2010, pp. 1 –8.
[17] M. Olivares-Mendez, I. Mellado, P. Campoy, I. Mondragon, and C. Mar-tinez, “A visual agv-urban car using fuzzy control,” in Automation,Robotics and Applicatios (ICARA), 2011 IEEE International Conferenceon, December 2011.
[18] Z. Botev and D. P. Kroese, “Global likelihood optimization via the cross-entropy method with an application to mixture models,” in Proceedingsof the 36th conference on Winter simulation, 2004, pp. 529–535.
[19] “Robot operating system (ros),” 2012. [Online]. Available:http://ros.org/wiki/gazebo
[20] “Starmac-ros package. hybrid systems laboratory, uc berkeley,” 2012.[Online]. Available: http://www.ros.org/wiki/starmac-ros-pkg
[21] “Ar.drone parrot,” 2010. [Online]. Available: http://ardrone.parrot.com[22] “Motion capture system from vicon,” 2012. [Online]. Available:
http://www.vicon.com[23] “Computer vision group-upm. see and avoid fuzzy controller
optimized using cross-entropy,” 2012. [Online]. Available:http://vision4uav.eu/?q=researchline/SeeAndAvoidCE
[24] “Computer vision group-upm,” 2012. [Online]. Available:http://www.vision4uav.eu
[25] “Youtube channel computer vision group-upm,” 2012. [Online].Available: http://www.youtube.com/colibriprojectUAV