see& egypt economic review - piraeusbankgroup.com · see & egypt economic review the see in...
TRANSCRIPT

SEE& Egypt Economic Review
April 2013
2 The SEE & Egypt in Pictures
3 Table of Forecasts 4 Albania 9 Bulgaria 14 Cyprus 19 Romania 24 Serbia 29 Egypt 31 Ukraine
Ilias Lekkos •) [email protected] Dimitria Rotsika •) [email protected] Dionysios Polychronopoulos •) [email protected] Margariti Konstantina •) [email protected]
Piraeus Bank 4 Αmerikis Street, 105 64, Athens, Greece, Tel: (+30) 210 328 8187
Executive Summary: 2013 Outlook: EU Recession and FX reserves dominate As always in our first SEE & Egypt review of the year, we try to look ahead and present our assessment of the short-to-medium term prospects for the region. Despite the fact that the economies we follow comprise a fairly inhomogeneous group, we are able to identify two main themes that will dominate developments throughout 2013. The first theme, which defines the outlook in Albania, Bulgaria and Romania, is that of Euroarea (EA) weakness. The economic ties of these three countries to the EA are especially strong, either through remittances, as is the case in Albania, or through trade, investment and banking, as is the case in Bulgaria and Romania. For this reason, we believe that the ongoing weakness and stagnation in the EA will substantially reduce the potential economic growth in these countries. The other main theme, which mainly affects Ukraine and Egypt, is that of FX reserves adequacy and these countries’ ability to finance maturing debt and pay for imports in foreign currency. Because of political indecision or social unrest these two economies have seen their FX reserves decline to levels that make us feel uncomfortable. At the same time, a lack of progress with the IMF increases uncertainty further and discourages other institutional funding. Serbia sits somewhere between these two groups, as it too is affected by the EA crisis, but also has its own problems attracting FX funding and concluding its negotiations with the IMF. And finally there is Cyprus. In the case of Cyprus, we hope for the best, but fear the worst. Given the unprecedented nature of developments in Cyprus, it’s very difficult even to attempt to simulate any macroeconomic scenario. As an alternative, we have decided to use the Baltic crisis of 2009 as a template for our Cyprus outlook. The similarities between the Baltic and Cypriot economies are not limited to their small size. The Baltic economies were almost completely euroised which limited their ability to use monetary policy at will, while their banking sectors were also facing solvency issues due to inadequate credit policies. To the extent that this analogy is valid, the outlook for Cyprus is bleak. In this adverse scenario, we expect a substantial contraction of close to 15% of GDP in 2013, while unemployment could increase to 18%-19%.
ILIAS LEKKOS Director, Economic Analysis & Markets Division

SEE & Egypt Economic Review
The SEE in Pictures
2
April 2013
1. The SEE in Pictures & Table of Forecasts 1.1 Pre-Crisis Levels 1.2 Current Account Deficit & its Financing
90
94
98
102
106
110
114
2008
q4
2009
q1
2009
q2
2009
q3
2009
q4
2010
q1
2010
q2
2010
q3
2010
q4
2011
q1
2011
q2
2011
q3
2011
q4
2012
q1
2012
q2
2012
q3
2012
q4
ALL BGN CYP RON RSD
0
2
4
6
8
10
12 % GDP
Albania Bulgaria Cyprus Romania Serbia
CAD FDI 1.3 Non Performing Loans & Unemployment Rate – 2012Q4
1.4 Bilateral Exchange Rate vs the Euro (17 April 2013)
10
12
14
16
18
20
22
24
0 10 20 30Unemployment Rate
Non
Per
form
ing
Loan
s as
% o
f To
tal L
oans
Cyprus
Bulgaria
Romania
Serbia
Albania
-9 -7 -5 -3 -1 1 3
LEK
RON
RSD
UAH
EGP
%
Year To Date Change
Devaluation Revaluation
1.5 CDS Spreads – 5Y USD 1.6 Fiscal Balance Evolution – 2012
0
100
200
300
400
500
600
Mar
-09
Jun-
09S
ep-0
9D
ec-0
9M
ar-1
0
Jun-
10S
ep-1
0D
ec-1
0M
ar-1
1Ju
n-11
Sep
-11
Dec
-11
Mar
-12
Jun-
12S
ep-1
2D
ec-1
2M
ar-1
3
bps
0
200
400
600
800
1000
1200
1400
1600bps
Bulgaria(L) Romania(L) Cyrpus (R )
-7
-6
-5
-4
-3
-2
-1
0
1
Janu
ary
Febr
uary
Mar
ch
Apr
il
May
June
July
Aug
ust
Sep
tem
ber
Oct
ober
Nov
embe
r
Dec
embe
r
% GDP
Albania Bulgaria CyprusRomania Serbia
Source: Piraeus Bank Research
SEE & Egypt Economic Review
Table of Forecasts
3
April 2013
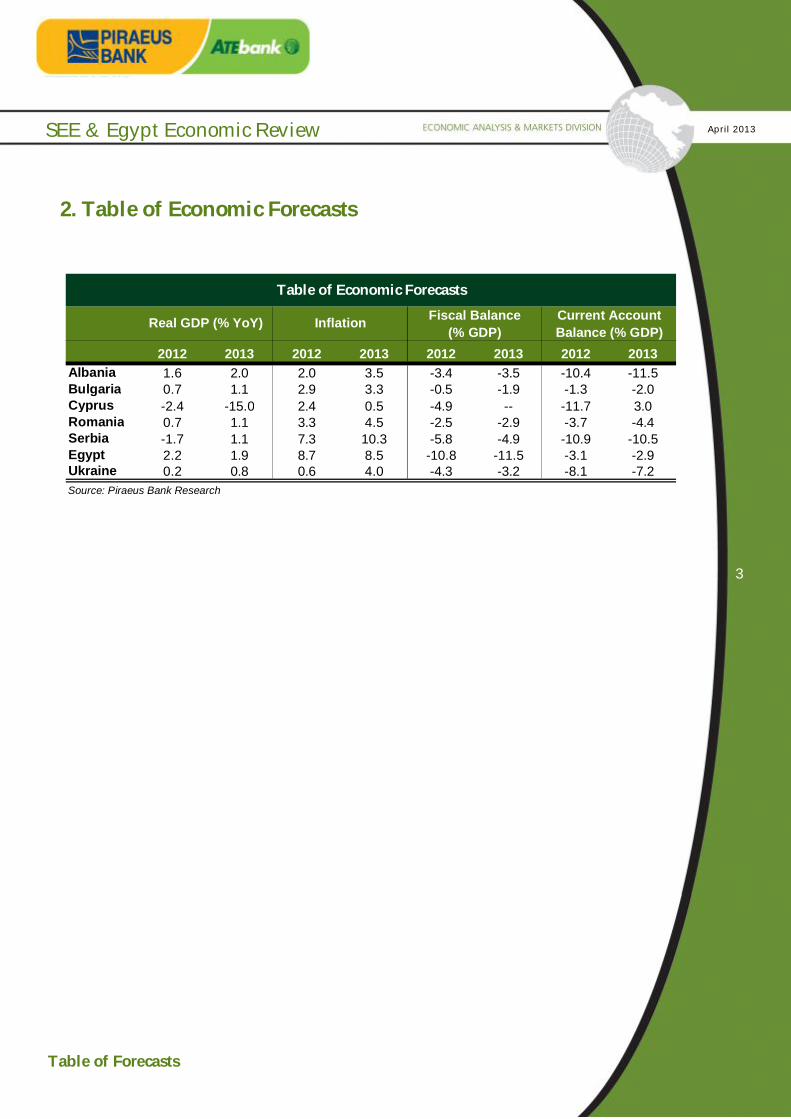
2. Table of Economic Forecasts
2012 2013 2012 2013 2012 2013 2012 2013Albania 1.6 2.0 2.0 3.5 -3.4 -3.5 -10.4 -11.5Bulgaria 0.7 1.1 2.9 3.3 -0.5 -1.9 -1.3 -2.0Cyprus -2.4 -15.0 2.4 0.5 -4.9 -- -11.7 3.0Romania 0.7 1.1 3.3 4.5 -2.5 -2.9 -3.7 -4.4Serbia -1.7 1.1 7.3 10.3 -5.8 -4.9 -10.9 -10.5Egypt 2.2 1.9 8.7 8.5 -10.8 -11.5 -3.1 -2.9Ukraine 0.2 0.8 0.6 4.0 -4.3 -3.2 -8.1 -7.2Source: Piraeus Bank Research
Table of Economic Forecasts
Real GDP (% YoY) Inflation Fiscal Balance (% GDP)
Current Account Balance (% GDP)

SEE & Egypt Economic Review
Albania
4
April 2013
3.1 Albania
Having strong ties to the EU has both pros and cons Economic output in 2013 is expected to pick-up marginally in 2013 to 2.0% YoY from 1.7% in 2012, but the potential output is constrained. Although Albania has been among the top growth performers over the last few years, the contraction of economic activity in Italy and Greece – its main trading partners and source of remittances – has lead to weakened domestic demand. Moreover, the continuing shortages of electricity over the last year – a problem that is not expected to be resolved any time soon – will eventually have an effect on the Albanian economy. However, the adverse weather conditions in 2012Q1 are expected to result in a lower base effect on this year’s economic activity, bringing it up a notch. According to the latest available data, the annual growth of economic activity in 2012Q4 decelerated to 1.7% from 2.7% YoY in 2012Q3 and 2.3% in the same quarter in 2011. The main factors driving growth in the fourth quarter of the year were the increase in the agriculture and industry sectors, while construction activity and the restaurants & hotels and transport sectors posted negative figures. The ESI improved in 2012Q4 to 82.8, after four consecutive quarters of decline, signalling new confidence in the services sector. Based on the available leading economic indicators, we note that the construction cost index improved marginally by 0.7% YoY in 2012 compared to 0.5% in 2011, while retail trade decreased at a significantly lower rate. Specifically, in 2012 retail sales contracted by 0.7% YoY after a decline of 3.7% in the previous year. Additionally, the Economic Sentiment Indicator improved to 82.8 in 2012Q4 from 76.3 in 2012Q3. This was due to an improvement in the services and industry sector, while the construction sector and consumers’ confidence index contributed negatively to the overall index. The economic sentiment index is, however, well below the level of 100 that separates positive and negative future expectations, signalling that consumers and businesses expect a decline in economic activity.
3.1.1 GVA Decomp 3.1.2 Real GDP
-8-6-4-202468
101214
Mar
-10
Jun-
10
Sep-
10
Dec
-10
Mar
-11
Jun-
11
Sep-
11
Dec
-11
Mar
-12
Jun-
12
Sep-
12
%
Agriculture Industry ConstructionTrade Transport PostOther services Total VA GDP at basic prices
-10
-5
0
5
10
15
Mar
-06
Jun-
06Se
p-06
Dec
-06
Mar
-07
Jun-
07Se
p-07
Dec
-07
Mar
-08
Jun-
08Se
p-08
Dec
-08
Mar
-09
Jun-
09Se
p-09
Dec
-09
Mar
-10
Jun-
10Se
p-10
Dec
-10
Mar
-11
Jun-
11Se
p-11
Dec
-11
Mar
-12
Jun-
12Se
p-12
Dec
-12
%
Albania Greece Italy Source: Piraeus Bank Research

SEE & Egypt Economic Review
Albania
5
April 2013
We expect inflation to average 3.5% in 2013, within the BoA’s target range, with prompt monetary policy providing much-needed macroeconomic stability. Inflation in 2012 remained stable at historic low levels, with just a marginal pick-up in the last months of the year. Inflationary pressures originating from the supply side have moderated although there is an upside risk due to the electricity supply shortage that the country faces, and a pick-up in food prices is also a risk. In 2012, inflation moderated to 1.9% compared to 3.5% in 2011, as food prices increased accordingly in the same periods. The Bank of Albania (BoA) cut its key policy interest rate further to the historic low of 3.75% in its January monetary policy meeting and has kept it at that level since then. We expect the BoA to further cut the key policy rate, keeping interest rates at historic low levels. According to our analysis, the BoA is expected to maintain its current policy stance throughout 2013, but we cannot exclude any further easing of its monetary policy in the medium term should demand remain weak and credit expansion deteriorate. The main factors determining our outlook are the downward trend of inflationary pressures and the expectation of a more prudent fiscal policy.
3.1.3 ESI 3.1.4 Construction Cost Index
60
70
80
90
100
110
120
130
2004
Q1
2004
Q3
2005
Q1
2005
Q3
2006
Q1
2006
Q3
2007
Q1
2007
Q3
2008
Q1
2008
Q3
2009
Q1
2009
Q3
2010
Q1
2010
Q3
2011
Q1
2011
Q3
2012
Q1
2012
Q3
2013
Q1
ESI
Positive/Negative Answers Threshold
-0.6
-0.4
-0.2
0
0.2
0.4
0.6
0.8
1
Mar
-09
Jun-
09
Sep-
09
Dec
-09
Mar
-10
Jun-
10
Sep-
10
Dec
-10
Mar
-11
Jun-
11
Sep-
11
Dec
-11
Mar
-12
Jun-
12
Sep-
12
Dec
-12
% YoY
Construction Cost 3.1.5 Inflation & Food Prices 3.1.6 Key Policy Rate
-2
-1
0
1
2
3
4
5
6
7
8
9
Jan-
08
Apr
-08
Jul-0
8
Oct
-08
Jan-
09
Apr
-09
Jul-0
9
Oct
-09
Jan-
10
Apr
-10
Jul-1
0
Oct
-10
Jan-
11
Apr
-11
Jul-1
1
Oct
-11
Jan-
12
Apr
-12
Jul-1
2
Oct
-12
Jan-
13
% YoY
Inflation Food Prices
3.5
4
4.5
5
5.5
6
6.5
Jan-
08
Apr-0
8
Jul-0
8
Oct
-08
Jan-
09
Apr-0
9
Jul-0
9
Oct
-09
Jan-
10
Apr-1
0
Jul-1
0
Oct
-10
Jan-
11
Apr-1
1
Jul-1
1
Oct
-11
Jan-
12
Apr-1
2
Jul-1
2
Oct
-12
Jan-
13
%
Key Monetary Policy Rate (REPO) Source: Piraeus Bank Research

SEE & Egypt Economic Review
Albania
6
April 2013
The fiscal sector remains in a fragile state, as the fiscal deficit has stalled and public debt reached 61.5% of GDP in 2012 from 59.5% in 2011, leading to high financial risks. We anticipate that the fiscal deficit will widen marginally in 2013 to 3.5% of GDP from 3.4% in 2012, as revenues will remain stable and expenditures increase. There is an upside risk in our scenario: should fiscal financing deteriorate, then increases in taxes will have to be made. In 2012, the fiscal deficit narrowed to 3.4% of the expected annual GDP compared to 3.5% in 2011 due to a decrease in public expenditures. Specifically, public expenditures fell to 27.8% in 2012 from 28.5% in 2011, while budget revenues moderated marginally to 24.4% of GDP from 25.1% for the same years. The current account deficit is expected to widen in 2013, while we anticipate its financing to become more challenging as the flow of remittances has been severely affected by the economic recession in Italy and Greece. The combination of subdued economic activity and the debt crisis in the Euroarea is expected to dampen exports. We anticipate that the current account deficit will widen to 11.5% of GDP in 2013 compared to 10.4% in 2012, while we expect its financing to become more challenging as the flow of remittances has been severely affected by the economic recession in Italy and Greece. In 2012, the current account deficit moderated to 10.4% of the expected annual GDP compared to 12.7% in 2011, due to a moderation in the trade deficit. Specifically, the deficit in the trade balance declined to 20.2% of GDP in 2012 from 24.1% in 2011. Further, we observe a moderation in a few of the balance of payments’ sectors, as the transfers surplus in 2012 stood at 8.8% of GDP from 9.7% in 2011 and the income balance turned to a deficit of 0.9% from a surplus of 0.2% over the same years. However, in 2012 the services surplus improved to 1.9% of GDP compared to 1.4% in the previous year. Net FDIs moderated though – challenging the financing of the current account deficit – to 7.2% of GDP in 2012 compared to 7.7% for 2011.
3.1.7 Fiscal Balance Evolution 3.1.8 Public Debt Evolution
-8
-7
-6
-5
-4
-3
-2
-1
0
1
2
Janu
ary
Jan.
-Feb
.
Jan.
-Mar
.
Jan.
-Apr
.
Jan.
-May
Jan.
-Jun
.
Jan.
-Jul
y
Jan.
-Aug
.
Jan.
-Sep
.
Jan.
-Oct
.
Jan.
-Nov
.
Jan.
-Dec
.
% GDP
2007 2008 2009 2010 2011 2012
56
56.5
57
57.5
58
58.5
59
59.5
60
60.5
61
2009 2010 2011 2012
% GDP
Public Debt
Source: Piraeus Bank Research

SEE & Egypt Economic Review
Albania
7
April 2013
Capital adequacy ratios remain high with adequate liquidity for the local banking sector but the NPL ratio creates concerns. The local financial system remains stable, while liquidity is improving amidst the further cuts in interest rates. The loans to deposits ratio dropped to 57.7% in January this year compared to 61.0% in the same month last year, so it still remains relatively low. Additionally, the capital adequacy ratio in 2012Q4 reached 16.2% from 15.6% in 2011Q4. On the other hand, the NPLs (substandard, doubtful and loss loans) ratio increased significantly in 2012Q4 to 22.8% from 18.9% in 2012Q4, while provisions deteriorated accordingly to 13.6% compared to 10.8% for the same periods.
3.1.9 Current Account Decomposition 3.1.10 EUR/LEK
-25
-20
-15
-10
-5
0
5
10
15
Dec
-09
Feb-
10
Apr
-10
Jun-
10
Aug
-10
Oct
-10
Dec
-10
Feb-
11
Apr
-11
Jun-
11
Aug
-11
Oct
-11
Dec
-11
Feb-
12
Apr
-12
Jun-
12
Aug
-12
Oct
-12
Dec
-12
% GDP
Trade Services Income Transfers Current Account Balance
115
120
125
130
135
140
145
Jan-
07A
pr-0
7Ju
l-07
Oct
-07
Jan-
08A
pr-0
8Ju
l-08
Oct
-08
Jan-
09A
pr-0
9Ju
l-09
Oct
-09
Jan-
10A
pr-1
0Ju
l-10
Oct
-10
Jan-
11A
pr-1
1Ju
l-11
Oct
-11
Jan-
12A
pr-1
2Ju
l-12
Oct
-12
Jan-
13A
pr-1
3
EUR/LEK
3.1.11 Banking Liquidity 3.1.12 Banking Stability
55
57
59
61
63
65
67
69
71
Jan-
09
Apr-0
9
Jul-0
9
Oct
-09
Jan-
10
Apr-1
0
Jul-1
0
Oct
-10
Jan-
11
Apr-1
1
Jul-1
1
Oct
-11
Jan-
12
Apr-1
2
Jul-1
2
Oct
-12
Jan-
13
%
Loans to Deposits Ratio
Quality of Loan Portfolio December 2012
9.8%
5.2%
22.8%
7.7%
77.2%
Standard exposures Sub-standard loans
Doubtful loans Loss loans
Source: Piraeus Bank Research

SEE & Egypt Economic Review
Albania
8
April 2013
2010 2011 2012 2013fGDP 3.0 2.8 1.7 2.0Inflation 3.6 3.5 2.0 3.5Monetary Policy Rate 5.0 4.75 4.0 3.5EUR/ALL Spot Rate (eop) 137.9 138.6 138.8 --Unemployment rate 13.7 13.3 13.3 13.0Retail Trade 5.4 -3.7 -0.7 --Construction Cost Index 0.3 0.5 0.6 --Credit to the Private Sector 10.6 10.4 1.5 --Deposits in the Private Sector 18.8 12.2 6.8 --
Fiscal Balance -3.1 -3.5 -3.4 -3.5Current Account Balance -11.4 -12.7 -10.4 -11.5
2010 2011 2012Bank NPLs to Total Loans 14.0 18.8 22.7Bank Provisions to NPLs 52.7 51.8 --Return on Assets 0.7 0.1 --Return on Equity 7.6 0.8 --Financial Leverage 10.9 8.0 --Bank Capital to Assets (%) 9.4 8.7 --Bank Regulatory Capital to Risk-Weighted Assets (%)
15.4 15.6 --
Source: Piraeus Bank Research, National Sources, IMF
Albania Economic Indicators
Albania Banking Indicators
% YoY
% of GDP

SEE & Egypt Economic Review
Bulgaria
9
April 2013
3.2 Bulgaria
Changing Times
Real GDP growth decelerated considerably during 2012 to 0.7%, from 1.9% in 2011,
mainly as a result of the recession in the Eurozone. A significant change in the growth
pattern was also observed. The initial phase of the post 2009 recovery (during 2010 – 2011)
was driven by net exports, while domestic demand continued to contract. In 2012, domestic
demand became the main growth driver, while the net exports contribution turned negative, as
imports grew at higher rate than exports. More interestingly, investment posted a small positive
growth rate, after three consecutive years of big contractions.
In 2013, we estimate that the real GDP growth rate will accelerate to 1.1%, while the
new growth pattern is expected to continue. Moreover, the recession is projected to
continue in the Eurozone, with a severe recession in significant trade partners such as Greece.
In more detail, real domestic demand is expected to improve (as the growth rate in
consumption and more significantly investment will accelerate), while net exports will continue
to post a negative contribution, as imports are expected to grow at a faster pace than exports.
Retail sales and industrial production are expected to grow by 1.0% - 1.5% during 2013, after
the decreases of 1.1% and 0.5% (respectively) in 2012.
3.2.1 Real GDP Decomposition 3.2.2 Real GDP
-15
-10
-5
0
5
10
15
20
25
Mar
-10
May
-10
Jul-1
0
Sep-
10
Nov
-10
Jan-
11
Mar
-11
May
-11
Jul-1
1
Sep-
11
Nov
-11
Jan-
12
Mar
-12
May
-12
Jul-1
2
Sep-
12
Nov
-12
Final Consumption GFCF Exports Imports GDP
-5
-4
-3
-2
-1
0
1
2
3
4
5
2001
2002
2003
2004
2005
2006
2007
2008
2009
2010
2011
2012
2013
% YoY
-8
-6
-4
-2
0
2
4
6
8% YoY
Eurozone: Real GDP (R) Bulgaria: Real GDP (L)Greece: Real GDP (R)
3.2.3 EA Imports & BGN Exports 3.2.4 Real GDP & EA ESI
-15
-10
-5
0
5
10
15
2001
2002
2003
2004
2005
2006
2007
2008
2009
2010
2011
2012
2013
% YoY
-40
-20
0
20
40
60% YoY
Eurozone: Real Imports (R) Bulgaria: Real Exports (L)
70
80
90
100
110
120
Q1
2005
Q1
2006
Q1
2007
Q1
2008
Q1
2009
Q1
2010
Q1
2011
Q1
2012
Q1
2013
% YoY
-10
-8
-6
-4
-2
0
2
4
6
8
10% YoY
Eurozone: Economic Sentiment Indicator (L)Bulgaria: Real GDP (R)
Source: Piraeus Bank Research

SEE & Egypt Economic Review
Bulgaria
10
April 2013
The average inflation rate was below 3.0% in 2009, 2010 and 2012. (It was 4.2% in 2011.) We
estimate that higher domestic demand will drive the average inflation rate up to 3.3%
during 2013. However, high unemployment combined with administered prices. which are
likely to remain little changed (after the demonstration rallies against high electricity prices),
will keep price pressures well contained. Simultaneously, slow recovery and structural rigidities
(bolder structural reforms will probably not be made during the election year) will keep the
unemployment rate at high level.
After three consecutive years of remarkable austerity progress, there is enough fiscal
space for an expansionary fiscal stance to boost spending during the current election
year. The 2013 budget raises pensions by 9%, the minimum wage by 7% and army salaries by
9%. On the other hand, the unexpected resignation of Borisov’s government and reduction in
the popularity of his political party (GERB) have increased political uncertainty. GERB is still
ahead in the polls and will probably try to benefit from increased government spending,
supported by a pick up in the economy before the election, as people are hit by high electricity
prices and continuous fiscal austerity pressures.
On a cash basis, the fiscal deficit improved markedly to 0.5% in 2012 (from 2.2% in
2011 and 3.9% in 2010). Improvement during 2012 was mainly driven by extraordinarily
strong VAT revenues, supported by domestic demand and imports, and measures for tax
compliance enhancement. Tax revenues during 2012 rose nearly twice as much as projected in
the April 2012 convergence programme. Simultaneously, non-interest outlays rose nearly half
as much as the increase budgeted in the convergence programme.
3.2.5 IFO & Real GDP 3.2.6 Inflation & Food Prices
80
90
100
110
120
Q1
2005
Q1
2006
Q1
2007
Q1
2008
Q1
2009
Q1
2010
Q1
2011
Q1
2012
Q1
2013
% YoY
-10
-8
-6
-4
-2
0
2
4
6
8
10% YoY
Germany: IFO Expectations Indicator (L)Bulgaria: Real GDP (R)
-6
-4
-2
0
2
4
6
8
10
12
Jul-0
9S
ep-0
9N
ov-0
9Ja
n-10
Mar
-10
May
-10
Jul-1
0S
ep-1
0N
ov-1
0Ja
n-11
Mar
-11
May
-11
Jul-1
1S
ep-1
1N
ov-1
1Ja
n-12
Mar
-12
May
-12
Jul-1
2S
ep-1
2N
ov-1
2Ja
n-13
Mar
-13
%
Inflation Food Prices
Source: Piraeus Bank Research

SEE & Egypt Economic Review
Bulgaria
11
April 2013
The 2013 budget plan calls for the fiscal deficit to widen to 1.3%, assuming real GDP will grow
by 1.9%. The size of the deficit called for by the 2013 budget plan is the same as the
target in the convergence programme, even though the target for real GDP growth
was trimmed to 1.9% from 2.5% (in the convergence plan). However, we believe that
smaller real GDP growth (related to Eurozone economic weakness), the aforementioned wage
and pension rises and increased political uncertainty during the election year make the
government’s target of 1.3% quite ambitious. Even if Bulgaria fails to meet that deficit target, a
gap marginally below 1.9% will be a satisfactory result.
The current account deficit is expected to widen (to a limited extent) to 1.9% (of
GDP) during 2013 (from 1.3% in 2012), as higher real domestic demand will lead to a
wider trade deficit. In more detail, the surplus in the services and current transfers balance will
be maintained, but will not be enough to counterbalance the deficit in goods and income
balance. Moreover, the current account deficit is expected to be accompanied by net foreign
capital inflows, as capital outflows channelled through the banking sector have been reduced.
3.2.7 Fiscal Balance Evolution 3.2.8 Fiscal Reserve Account
-6
-4
-2
0
2
4
6
8
Janu
ary
Febr
uary
Mar
ch
Apr
il
May
June July
Aug
ust
Sept
embe
r
Oct
ober
Nov
embe
r
Dec
embe
r
% GDP
2008 2009 2010 2011 2012
-60
-40
-20
0
20
40
60
80
Jan-
05M
ay-0
5S
ep-0
5Ja
n-06
May
-06
Sep
-06
Jan-
07M
ay-0
7S
ep-0
7Ja
n-08
May
-08
Sep
-08
Jan-
09M
ay-0
9S
ep-0
9Ja
n-10
May
-10
Sep
-10
Jan-
11M
ay-1
1S
ep-1
1Ja
n-12
May
-12
Sep
-12
Jan-
13
% ΥοΥ
Fiscal Reserves in the Central Bank
Source: Piraeus Bank Research

SEE & Egypt Economic Review
Bulgaria
12
April 2013
The combination of the current account deficit and net foreign capital inflow is expected to result
in a relatively small (but not worrying) reduction in the foreign exchange reserves. Therefore,
we believe that the combination of relatively large foreign exchange reserves, small
fiscal deficit (below 2.0% of GDP), low level of public debt (below 20.0%) and current
account deficit (2.0%) safeguards the continuation of the Currency Board Regime by
the Central Bank of Bulgaria. Moreover, the currency peg enjoys broad support across the
political spectrum and the economy is expected to continue to be unaffected by dangerous
imbalances, which could threaten the continuation of the CBR.
3.2.9 Current Account Balance Decomposition (6m MA)
3.2.10 FX Reserves & Monetary Base
-15
-10
-5
0
5
10
15
Apr
-10
Jul-1
0
Oct
-10
Jan-
11
Apr
-11
Jul-1
1
Oct
-11
Jan-
12
Apr
-12
Jul-1
2
Oct
-12
Jan-
13
% of GDP
Current Transfers Goods Balance ServicesIncome Balance Current Account
1.30
1.40
1.50
1.60
1.70
1.80
1.90
2.00
Dec
-07
Mar
-08
Jun-
08Se
p-08
Dec
-08
Mar
-09
Jun-
09Se
p-09
Dec
-09
Mar
-10
Jun-
10Se
p-10
Dec
-10
Mar
-11
Jun-
11Se
p-11
Dec
-11
Mar
-12
Jun-
12Se
p-12
Dec
-12
70
80
90
100
110
120
130
140
150%
FX Reserves as % Short-Term External Debt(R )Reserves/Monetary Base(L)
Source: Piraeus Bank Research

SEE & Egypt Economic Review
Bulgaria
13
April 2013
2010 2011 2012 2013f
GDP 0.5 1.9 0.7 1.1 Final Consumption 0.2 1.9 1.9 2.5 Investment -18.9 -6.1 0.7 2.0 Exports of G&S 14.8 12.9 0.3 2.0 Imports of G&S 2.2 8.2 3.8 5.0Inflation (avg) 2.4 4.2 2.9 3.3
Current Account Balance -1.5 0.1 -1.3 -2.0Fiscal Balance (Eurostat, ESA95 basis) -3.9 -2.1 -0.5 -1.9External Debt 102.7 94.1 94.8 --
EUR/BGN (avg)USD/BGN (avg) 1.48 1.41 1.53 1.55
Private Sector Credit 1.2 3.2 2.9 -- Firms 2.4 5.4 5.0 -- Households & NPISHs -0.8 -0.4 -1.0 --Private Sector Deposits 6.8 9.0 4.5 --
2010 2011 2012Bank NPLs to Total Loans 11.9 14.9 16.9Bank Provisions to NPLs 74.1 68.7 68.7Return on Assets 0.9 0.8 0.7Return on Equity 7.9 7.1 6.8Financial Leverage 8.8 8.9 9.7Bank Capital to Assets (%) 10.5 10.8 10.1 Bank Regulatory Capital to Risk-Weighted Assets (%)
17.5 17.5 16.7
% of GDP
Bulgaria Economic Indicators
% YoY
Bulgaria Banking Indicators% YoY
Source: Piraeus Bank Research, National Sources, IMF
1.95583

SEE & Egypt Economic Review
Cyprus
14
April 2013
3.3 Cyprus
Vicious Cycle “games” Following a week of negotiations, on March 25th the Eurogroup, along with the Cypriot government reached a final decision regarding the amount of financial assistance that Cyprus will receive from the troika and the necessary actions to be taken concerning the local banking sector. Out of the total financial assistance of about EUR 16bn, the troika will provide EUR 10bn, based on the assumption that a larger amount would not allow the public debt to be viable. As such, EUR 5.8bn will be provided by a one-off “haircut” on uninsured deposits over EUR 100,000 and the downsizing of the local banking sector: namely, the restructuring of the two largest banks in Cyprus, Laiki Bank and Bank of Cyprus. Following this agreement, the European Central Bank guaranteed the continuation of liquidity assistance to the Cypriot banking system through the ELA mechanism. The government and troika are expected to finalize the Memorandum of Understanding (MoU) by the third week of April. Excluding the Public Sector and the Wholesale/Retail Sector, the Cypriot economy is based on three main sectors of economic activity: Tourism, Real Estate and the Financial Sector (including Legal and Consulting Services). In the medium term, we expect the creation of a new fourth growth driver based on gas exploitation. As the Real Estate sector has been in deep recession for the last few years, the swift downsizing of the banking sector essentially means that the Cypriot economy will lose two out of the three growth drivers.
3.3.1 Real GDP Decomposition 3.3.2 Real GDP & ESI
-40
-30
-20
-10
0
10
20
30
Mar
-08
Jun-
08
Sep-
08
Dec
-08
Mar
-09
Jun-
09
Sep-
09
Dec
-09
Mar
-10
Jun-
10
Sep-
10
Dec
-10
Mar
-11
Jun-
11
Sep-
11
Dec
-11
Mar
-12
Jun-
12
Sep-
12
Dec
-12
Final Consumption GFCF Exports Imports Real GDP
-4-3-2-10123456
Q1
2003
Q3
2003
Q1
2004
Q3
2004
Q1
2005
Q3
2005
Q1
2006
Q3
2006
Q1
2007
Q3
2007
Q1
2008
Q3
2008
Q1
2009
Q3
2009
Q1
2010
Q3
2010
Q1
2011
Q3
2011
Q1
2012
Q3
2012
Q1
2013
% YoY
6065707580859095100105110115120
GDP (L) Economic Sentiment Index ( R)
3.3.3 The Baltic Example 3.3.4 Gross Value Added
-20
-15
-10
-5
0
5
10
15
2005
2006
2007
2008
2009
2010
2011
2012
% YoY
Latvia: Real GDP Lithuania: Real GDP Estonia: Real GDP
2012
2.19.1
6.4
6.4
23.6
4.59.1
11.9
21.7
4.4
7.0
Agriculture
Mining
Manufacturing
Construction
Wholesale & Retail Trade, Accommodation
Information & Communication
Financial & Insurance
Real Estate
Professional, Technical & Scientific Activities
Public Admin
Culture & Recreation
Source: Piraeus Bank Research

SEE & Egypt Economic Review
Cyprus
15
April 2013
In order to fully evaluate the magnitude of the potential losses for the Cypriot economy, we must consider that according to the System of National Accounts, the gross value added of the banking sector is directly linked to the total amount of loans and deposits as well as the relevant interest rate margins. Thus, the downsizing of the banking sector is expected to significantly affect the dynamics of the local economy. What in our view is very important, is that the solution that is finally applied will be such that it can ensure the viability and prospects of the banking sector in Cyprus, which directly contributes 10% of GDP, while the indirect contribution to the economy is significantly higher. In addition we must also consider the expected recession created by the fiscal adjustment programme which will inevitably be imposed in order to ensure the disbursement of the EUR 10bn loan. The troika is already in discussions with officials in Cyprus to define the structural changes and the fiscal measures under the MoU, which are expected to amount to 4.5% of GDP. Privatizations must be one of the key priorities. Real GDP is expected to decrease sharply during 2013 due to the restrictions imposed on financial transactions and the banking sector, strict fiscal consolidation measures, the high haircut rate on the unguaranteed section of deposits and the soaring uncertainty that is going to prevail over the economy. We believe that it is helpful to consider the experience of the Baltic Countries during the 2008–2009 crisis, even though most of the measures imposed in Cyprus were not taken in the Baltic Countries.
3.3.5 Leading Indicators 3.3.6 Inflation & Food Prices
% ΥοΥ
-20
-16
-12
-8
-4
0
4
8
12
16
Jan-
09M
ar-0
9M
ay-0
9Ju
l-09
Sep-
09N
ov-0
9Ja
n-10
Mar
-10
May
-10
Jul-1
0Se
p-10
Nov
-10
Jan-
11M
ar-1
1M
ay-1
1Ju
l-11
Sep-
11N
ov-1
1Ja
n-12
Mar
-12
May
-12
Jul-1
2Se
p-12
Nov
-12
Jan-
13
Industrial Production (L) Retail Sales (L)
0
0.5
1
1.5
2
2.5
3
3.5
4
4.5
Nov
-09
Jan-
10M
ar-1
0M
ay-1
0Ju
l-10
Sep
-10
Nov
-10
Jan-
11M
ar-1
1M
ay-1
1Ju
l-11
Sep
-11
Nov
-11
Jan-
12M
ar-1
2M
ay-1
2Ju
l-12
Sep
-12
Nov
-12
Jan-
13M
ar-1
3
% YoY
-6
-4
-2
0
2
4
6
8
10
12
Inflation(L) Food Prices(R )
Source: Piraeus Bank Research

SEE & Egypt Economic Review
Cyprus
16
April 2013
In 2009, the Baltic countries’ real GDP posted huge decreases (Latvia: -18%, Lithuania: -15%, Estonia: -14%), after relatively small rates in 2008 (Latvia: -3%, Lithuania: 3%, Estonia: -4%). Therefore, given that Cyprus’ real GDP shrank by 2.4% in 2012, we expect it to contract by 15% in 2013. Specifically, private and public consumption and investment are anticipated to contract significantly, while net exports will post a positive contribution primarily due to the huge contraction in imports, while exports are expected to shrink at a slower rate. The Baltic countries’ current account balances turned abruptly from deep deficits to surpluses (Latvia: from -23% in 2007 to -13% in 2008 to 9% in 2009, Lithuania: from -15% in 2007 to -13% in 2008 to 5% in 2009, Estonia: from -16% in 2007 to -9% in 2008 to 4% in 2009), as their trade balances followed the same path. Hence, we expect that similar development will characterize the Cypriot economy, leading to a surplus in the trade balance and, consequently, in the current account balance of 3% (as a percentage of nominal GDP).
3.3.7 Fiscal Balance Evolution 3.3.8 Public Debt
-7
-6
-5
-4
-3
-2
-1
0
1
Janu
ary
Febr
uary
Mar
ch
Apr
il
May
June July
Aug
ust
Sep
tem
ber
Oct
ober
Nov
embe
r
Dec
embe
r
% GDP
2009 2010 2011 2012
40
50
60
70
80
90
100
110
120
130
140
Mar
-06
Jun-
06S
ep-0
6D
ec-0
6M
ar-0
7Ju
n-07
Sep
-07
Dec
-07
Mar
-08
Jun-
08S
ep-0
8D
ec-0
8M
ar-0
9Ju
n-09
Sep
-09
Dec
-09
Mar
-10
Jun-
10S
ep-1
0D
ec-1
0M
ar-1
1Ju
n-11
Sep
-11
Dec
-11
Mar
-12
Jun-
12S
ep-1
2D
ec-1
2
% GDP
Total Public Debt Net Total Debt 3.3.9 Debt Maturities
0
500
1000
1500
2000
2500
3000
3500
4000
4500
5000
2013
2014
2015
2016
2017
2018
2019
2020
2021
2022
2023
2025
2026
2027
2028
2029
2030
2032
2033
2035
2036
2038
EUR mn.
Government Bonds International IssuesT-Bills Russian LoanEuropean Investment Bank Central Bank of CyprusCouncil of Europe Development Bank Recapitalisation of Laiki Bank
In Chart 3.3.9: Not Included:
* International Loan from the French Treasury, with outstanding amount EUR 0.6mn, maturing in 2017
* EFSF loans issued for Greece, Ireland & Portugal, with
outstanding amount EUR 295.1mn * Domestic Loans of EUR 238mn, that the government
received from public organisations in order to fund the debt.
Source: Piraeus Bank Research

SEE & Egypt Economic Review
Cyprus
17
April 2013
A huge contraction in real GDP will lead to an abrupt rise in the unemployment rate to 18%-19% (the number of unemployed people will increase to 80K-90K), while the inflation rate will be subdued at 0.5%. The MoU predicts a primary fiscal deficit of 2.4% in 2013. We believe that this is quite optimistic, and we expect it to be significantly wider, as a deep recession will abruptly pull budget revenues down, while nominal GDP will shrink by 0.5bn euro more than is predicted by the MoU. Consequently, the debt to GDP ratio will deteriorate severely and will be worse than is predicted by the MoU.
3.3.10 Current Account Balance Decomposition (6m MA)
3.3.11 Current Account Financing
-40
-30
-20
-10
0
10
20
30
40
Mar
-06
Jun-
06Se
p-06
Dec
-06
Mar
-07
Jun-
07Se
p-07
Dec
-07
Mar
-08
Jun-
08Se
p-08
Dec
-08
Mar
-09
Jun-
09Se
p-09
Dec
-09
Mar
-10
Jun-
10Se
p-10
Dec
-10
Mar
-11
Jun-
11Se
p-11
Dec
-11
Mar
-12
Jun-
12Se
p-12
Dec
-12
% of GDP
Goods Services Transfers Income Current Account
-6
-4
-2
0
2
4
6
8
10
12
Mar
-06
Jun-
06S
ep-0
6D
ec-0
6M
ar-0
7Ju
n-07
Sep
-07
Dec
-07
Mar
-08
Jun-
08S
ep-0
8D
ec-0
8M
ar-0
9Ju
n-09
Sep
-09
Dec
-09
Mar
-10
Jun-
10S
ep-1
0D
ec-1
0M
ar-1
1Ju
n-11
Sep
-11
Dec
-11
Mar
-12
Jun-
12S
ep-1
2D
ec-1
2
% of GDP
Foreign Direct Investments
Source: Piraeus Bank Research

SEE & Egypt Economic Review
Cyprus
18
April 2013
2010 2011 2012 2013f
GDP 1.3 0.5 -2.4 -15.0Inflation 2.4 3.3 2.4 0.5
Credit to the Private Sector 9.3 11.9 5.9 --Private Sector Deposits 20.2 -1.6 1.2 -- Residents 11.0 -3.8 -1.1 -- EA Residents 209.1 31.9 -1.2 -- Rest of the World 28.5 -3.2 7.0 --
Current Account Balance -9.9 -4.8 -11.7 3.0Fiscal Balance (Eurostat, ESA95 basis) -4.9 -6.1 -4.9 --Public Debt 61.3 71.1 85.8 --
2010 2011 2012Bank NPLs to Total Loans 5.6 9.6 15.5Bank Provisions to NPLs 49.0 44.5 40.8Return on Assets 0.6 -4.3 -2.0Return on Equity 11.0 -68.2 -33.2Financial Leverage 18.3 15.9 16.6Bank Capital to Assets (%) 5.9 4.9 6.0Bank Regulatory Capital to Risk-Weighted Assets (%)
12.5 8.3 9.4
Source: Piraeus Bank Research, National Sources, IMF
Cyprus Economic Indicators
% YoY
% of GDP
Cyprus Banking Indicators

SEE & Egypt Economic Review
Romania
19
April 2013
3.4 Romania
Deal or No Deal?
Real GDP growth decelerated remarkably during 2012 to 0.7% (from 2.1% in 2011),
mainly as a result of the recession in the Eurozone (-0.5% from 1.5% for real GDP and -0.9%
from 4.4% for real imports) and a considerably poorer agricultural harvest. Specifically, the growth
rate of Consumption and Investment decelerated, and the net exports contribution became negative,
as exports shrank at a faster rate than imports, as a result of the Euroarea recession. (During 2011
exports had grown at larger rate than imports.)
Although almost all parliamentary parties are committed to the IMF agreement, privatisations and
public sector reforms slowed down during 2012. The Romanian authorities would like to sign a
third agreement, as the current one expired in March 2013, but the IMF would probably like to see
more convincing results before that happens. Ponta’s coalition will probably be focussing on
maintaining public support with a view to the 2014 presidential elections. If the weak growth
trajectory continues, the Romanian authorities will have less incentive to stick to the
convergence criteria required to become a member of the Eurozone.
3.4.1 Real GDP 3.4.2 EA Imports & RON Exports
-5
-4
-3
-2
-1
0
1
2
3
4
5
2001
2002
2003
2004
2005
2006
2007
2008
2009
2010
2011
2012
2013
% YoY
-10
-8
-6
-4
-2
0
2
4
6
8
10% YoY
Eurozone: Real GDP (L) Romania: Real GDP (R)
-15
-10
-5
0
5
10
15
2001
2002
2003
2004
2005
2006
2007
2008
2009
2010
2011
2012
2013
% YoY
-10
-5
0
5
10
15
20% YoY
Eurozone: Real Imports (L) Romania: Real Exports (R)
3.4.3 EA ESI & Real GDP 3.4.4 IFO & Real GDP
60
70
80
90
100
110
120
Q1
2005
Q1
2006
Q1
2007
Q1
2008
Q1
2009
Q1
2010
Q1
2011
Q1
2012
Q1
2013
-10-8-6-4-20246810
% YoY
Eurozone: Economic Sentiment Indicator (L)Romania: Real GDP (R)
80
90
100
110
120
Q1
2005
Q1
2006
Q1
2007
Q1
2008
Q1
2009
Q1
2010
Q1
2011
Q1
2012
Q1
2013
-10
-8
-6
-4
-2
0
2
4
6
8
10% YoY
Germany: IFO Expectations Indicator (L)Romania: Real GDP (R)
Source: Piraeus Bank Research

SEE & Egypt Economic Review
Romania
20
April 2013
In 2013, we estimate that the real GDP growth rate will accelerate to 1.1%, while
recession is projected to continue in the Eurozone (-0.5% for real GDP). In more detail, real
domestic demand is expected to improve (as the growth rate in consumption will accelerate, while in
investment, it will be a bit less), and net exports will continue to be a drag, as imports are expected
to grow at a faster pace than exports.
Large increases in public wages during 2012 (definite court decisions ensure additional increases
during 2013) together with a considerable increase in pensions in January of 2013 are expected to
bolster consumption. Moreover, an improvement in EU funds absorption, destined for
important infrastructure projects, will also enhance domestic demand. Industrial production is
expected to grow by 2.5%–2.9% during 2013, a bit higher than 2012’s 2.4%. However, the slow pace
of structural reforms prevents more buoyant growth in real domestic demand.
Despite the RON depreciation during 2012 (from 2011 (avg): 4.24 against the euro to 2012
(avg): 4.46), the inflation rate fell significantly (from 2011 (avg): 5.9% to 2012 (avg): 3.3%),
as a result of the abundant agricultural production (in 2011). In 2013, we estimate that the inflation
rate will accelerate to a limited extent (2013 (avg): 4.5%), as (decided) hikes in administered
electricity and natural gas prices, combined with poor agricultural production (in 2012) are expected
to drive prices up. Significantly, the inflation rate was 5.9% in January of 2013, the highest level since
mid 2011.
On the other hand, expected RON stability, a negative output gap and (probably) better
agricultural production (in 2013) will drive prices down during the second half of 2013.
Therefore, the inflation rate will mostly surpass the NBR’s target (3.0%) and will probably converge at
the end of the year. Hence, we assess (considering the domestic negative output gap and Eurozone
recessionary effect) that the NBR will hold its policy rate at 5.25%, with the possibility of a 25 bps
rate cut at the end of the year.
3.4.5 Inflation & Food Prices 3.4.6 EUR/RON and Key Policy Rate
-4
-2
0
2
4
6
8
10
12
Jan-
10M
ar-1
0M
ay-1
0Ju
l-10
Sep
-10
Nov
-10
Jan-
11M
ar-1
1M
ay-1
1Ju
l-11
Sep
-11
Nov
-11
Jan-
12M
ar-1
2M
ay-1
2Ju
l-12
Sep
-12
Nov
-12
Jan-
13M
ar-1
3
% YoY
Inflation ( R) Food Prices ( R)
5
5.5
6
6.5
7
7.5
8
Jan-
10
Mar
-10
May
-10
Jul-1
0
Sep
-10
Nov
-10
Jan-
11
Mar
-11
May
-11
Jul-1
1
Sep
-11
Nov
-11
Jan-
12
Mar
-12
May
-12
Jul-1
2
Sep
-12
Nov
-12
Jan-
13
Mar
-13
4
4.1
4.2
4.3
4.4
4.5
4.6
Key Policy Rate(L) EUR/RON(R )
Source: Piraeus Bank Research

SEE & Egypt Economic Review
Romania
21
April 2013
The early and drastic implementation of severe cuts in public expenditure and rises in taxes in 2010
allowed Romania to reduce its budget deficit by a remarkable RON 9–10bn per year in 2011 and
2012, putting public finances on more sustainable path, while negatively affecting domestic demand.
On a cash basis, the deficit stood at 2.5% (of nominal GDP) in 2012 (from 4.4% in 2011),
while using ESA 95 methodology, it was marginally below 3.0% (at 2.8%-2.9%), allowing
Romania to exit from the Excessive Deficit Procedure.
Romania’s parliament approved the 2013 budget plan that aims to cut the deficit to 2.1% by
increasing taxes on energy companies and forecasting real GDP growth rate at 1.6%. However, we
believe that smaller real GDP growth (related to Eurozone economic weakness) and a public wage bill
rise (as wages are anticipated to return to 2010 levels) make the government’s target of 2.1% quite
ambitious. Even if Romania fails to meet that deficit target, a gap marginally below 2.9%
will be a satisfactory result. Moreover, the reduction in the losses of state-owned enterprises could
play a significant role.
3.4.7 Fiscal Balance Evolution
-8-7-6-5-4-3-2-1012
Janu
ary
Jan-
Feb
Jan-
Mar
Jan-
Apr
Jan-
May
Jan-
June
Jan-
July
Jan-
Aug
Jan-
Sep
Jan-
Oct
Jan-
Nov
Jan-
Dec
% GDP
2008 2009 2010 2011 2012
Source: Piraeus Bank Research

SEE & Egypt Economic Review
Romania
22
April 2013
The trade deficit will continue to be a big drag on the current account balance during
2013, as the expected economic weakness in the Euroarea will limit export growth (almost
65% of Romanian exports are destined for Eurozone countries). Additionally, higher domestic
demand and a strong reliance on imports for Romanian exports will maintain the trade deficit.
Furthermore, the difficult economic situation in the EU periphery countries – where most Romanian
emigrants work – will negatively affect the inflow of remittances. Therefore, we estimate that the
3.8% current account deficit of 2012 will be driven up to 4.4% in 2013.
In Romania, foreign direct investment and capital account flows make up the smallest
share of the current account among the new EU members, leaving a sizable gap to be
covered by more volatile inflows, such as portfolio investment. This uncertain dependence on
volatile inflows could be reduced if Romania were able to absorb more EU funds, ensuring a much
more stable inflow. Romania lags all other countries in CEE in terms of absorption of EU structural and
cohesion funds. Therefore, Romania could try to more closely emulate the other countries in this
group.
3.4.7 Current Account Balance Decomposition (6m MA)
3.4.8 Loan Portfolio Quality
-8
-6
-4
-2
0
2
4
Feb-
10
Apr
-10
Jun-
10
Aug
-10
Oct
-10
Dec
-10
Feb-
11
Apr
-11
Jun-
11
Aug
-11
Oct
-11
Dec
-11
Feb-
12
Apr
-12
Jun-
12
Aug
-12
Oct
-12
Dec
-12
% GDP
Trade Balance Income Services Transfers Current Account
December 2012
43.2
15.9
6.4
23.5
29.9
11.0
Standard Exposures Watch ExposuresSubstandard Exposures Doubtful LoansLoss Loans
Source: Piraeus Bank Research
SEE & Egypt Economic Review
Romania
23
April 2013
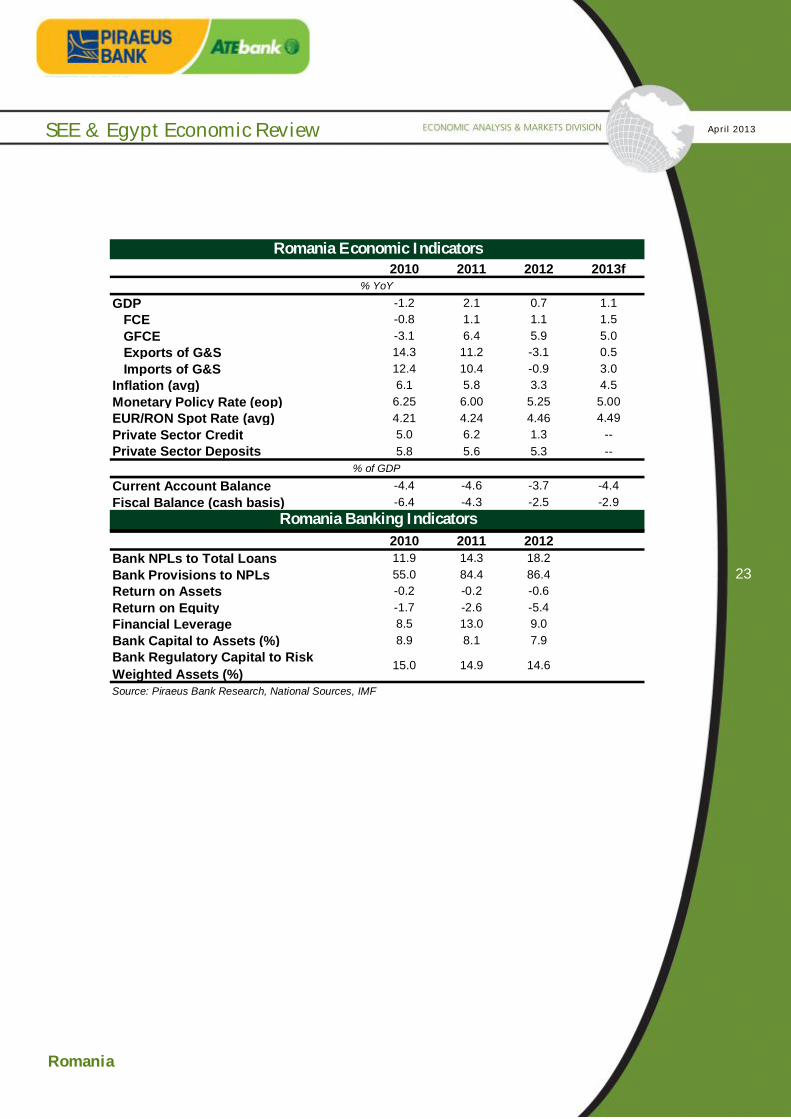
2010 2011 2012 2013f
GDP -1.2 2.1 0.7 1.1 FCE -0.8 1.1 1.1 1.5 GFCE -3.1 6.4 5.9 5.0 Exports of G&S 14.3 11.2 -3.1 0.5 Imports of G&S 12.4 10.4 -0.9 3.0Inflation (avg) 6.1 5.8 3.3 4.5Monetary Policy Rate (eop) 6.25 6.00 5.25 5.00EUR/RON Spot Rate (avg) 4.21 4.24 4.46 4.49Private Sector Credit 5.0 6.2 1.3 --Private Sector Deposits 5.8 5.6 5.3 --
Current Account Balance -4.4 -4.6 -3.7 -4.4Fiscal Balance (cash basis) -6.4 -4.3 -2.5 -2.9
2010 2011 2012Bank NPLs to Total Loans 11.9 14.3 18.2Bank Provisions to NPLs 55.0 84.4 86.4Return on Assets -0.2 -0.2 -0.6Return on Equity -1.7 -2.6 -5.4Financial Leverage 8.5 13.0 9.0Bank Capital to Assets (%) 8.9 8.1 7.9Bank Regulatory Capital to Risk Weighted Assets (%)
15.0 14.9 14.6
Source: Piraeus Bank Research, National Sources, IMF
% of GDP
Romania Banking Indicators
Romania Economic Indicators
% YoY

SEE & Egypt Economic Review
Serbia
24
April 2013
3.5 Serbia
Fast recovery, but a faster slowdown Serbia’s economic output in 2013 is expected to recover modestly to 1.1% YoY after contracting by 1.8% in 2012. Economic activity is expected to recover in the current year through an increase in investments and exports. The Fiat factory will play a crucial role as will a recovery in agricultural production, which was severely hit last year. Should the latter post positive figures in the first half of the year, we expect that domestic consumption will also pick-up in 2013H2. In 2012, real GDP contracted more than expected, due to the highly volatile weather conditions. Specifically, the extremely poor agricultural season, the passing through effects of the European debt crisis, fiscal consolidation measures and subdued domestic and external demand contributed negatively to real GDP. According to the Statistics Institute, real GDP in 2012 contracted by 1.8% YoY compared to growth of 1.6% in 2011. In 2012Q4, real GDP contracted by 2.0% YoY from -2.1% in 2012Q3 and an increase of 0.7% in the same quarter of 2011. In 2012Q4 the largest major contractions recorded in the value added data were in the sectors of construction (-24.7% YoY) and electricity & gas (-7.1% YoY), while the highest positive contributions to the output were recorded by the communications sector (11.4% YoY), financial and insurance activities (5.9% YoY) and manufacturing (4.9% YoY). The seasonally adjusted GDP in 2012Q4 contracted in quarterly terms by 0.3% compared to -1.2% in the previous quarter. The leading indicators point to a recovery in economic activity, as industrial production in the first two months of the year posted an average increase of 1.6% YoY compared to a decrease of 7.7% in Jan-Feb 2012, while retail trade decreased by 8.3% compared to -4.5% for the same periods, but has improved marginally compared to the last few months of 2012.
3.5.1 Real GDP: Serbia & EU 3.5.2 Leading Indicators
-8
-6
-4
-2
0
2
4
6
8
Mar
-06
Jul-0
6
Nov
-06
Mar
-07
Jul-0
7
Nov
-07
Mar
-08
Jul-0
8
Nov
-08
Mar
-09
Jul-0
9
Nov
-09
Mar
-10
Jul-1
0
Nov
-10
Mar
-11
Jul-1
1
Nov
-11
Mar
-12
Jul-1
2
Nov
-12
% YoY
Serbia EU
-25-20-15-10-505
10152025
Oct
-07
Jan-
08Ap
r-08
Jul-0
8O
ct-0
8Ja
n-09
Apr-0
9Ju
l-09
Oct
-09
Jan-
10Ap
r-10
Jul-1
0O
ct-1
0Ja
n-11
Apr-1
1Ju
l-11
Oct
-11
Jan-
12Ap
r-12
Jul-1
2O
ct-1
2Ja
n-13
% ΥοΥ
Industrial Production(6-M MA) Retail Trade(6-M MA)
Source: Piraeus Bank Research

SEE & Egypt Economic Review
Serbia
25
April 2013
We anticipate that inflation will increase in 2013 to 10.3% from 7.3% as economic activity will pick up and increases in administered prices will push prices higher. In 2012, inflation reached 7.2% (with a double digit figure since September) compared to 11.2% in 2011, as food prices increased on average by 6.8% YoY from 14.9% for the same years. The National Bank of Serbia (NBS) has increased its main policy rate by 50bps to 11.75% since the beginning of the year in order to stem expected inflationary pressures, amid an increase in administered and agricultural prices. The last rate increase of 25bps was in February, as the NBS estimates that inflation will continue to rise above the upper limit of the target range in the first half of the year before returning to the NBS’ target range. The current restrictive monetary policy was intended to address inflationary pressures and avoid passing though rising prices to other sectors (other than food prices). However, subdued domestic demand, the large increases to the key policy rate since last year and the expected fiscal consolidation will act as disinflationary factors in the medium term, hence we expect the NBS to ease its monetary policy rate by year-end to 11.0%.
3.5.3 Inflation & Food Prices 3.5.4 EUR/RSD & Key Policy Rate
-5
0
5
10
15
20
25
Mar
-09
May
-09
Jul-0
9S
ep-0
9N
ov-0
9Ja
n-10
Mar
-10
May
-10
Jul-1
0S
ep-1
0N
ov-1
0Ja
n-11
Mar
-11
May
-11
Jul-1
1S
ep-1
1N
ov-1
1Ja
n-12
Mar
-12
May
-12
Jul-1
2S
ep-1
2N
ov-1
2Ja
n-13
Mar
-13
% YoY
Inflation(R ) Food Prices(R )
90
95
100
105
110
115
120
Jan-
10
Mar
-10
May
-10
Jul-1
0
Sep
-10
Nov
-10
Jan-
11
Mar
-11
May
-11
Jul-1
1
Sep
-11
Nov
-11
Jan-
12
Mar
-12
May
-12
Jul-1
2
Sep
-12
Nov
-12
Jan-
13
7
8
9
10
11
12
13
EUR/RSD(L) Key Policy Rate(R ) Source: Piraeus Bank Research

SEE & Egypt Economic Review
Serbia
26
April 2013
We expect the 2013 fiscal deficit to moderate to approximately 4.9% of GDP. The government has already started the expected fiscal consolidation in order to narrow the fiscal deficit, mainly by increasing taxation and reducing expenditures. The downside risks regarding budget implementation are the current uncertainty on possible elections during the year and the delay of government talks with IMF, so as to restart the SBA talks. This discussion is expected to restart in May, while at the same time the Serbian government agreed to a ten-year loan from Russia of USD 500mn in order to finance the 2013 budget. The interest rate will be fixed at 3.5% with a two-year grace period. The fiscal deficit in 2012 widened substantially to 5.8% of the projected annual GDP from 4.2% in 2011, mainly due to an increase in public spending as there were two election periods within the year leading to fiscal slippages. Specifically, in 2012 public expenditures reached 29.8% of GDP compared to 27.6% in 2011, while budget revenues improved marginally to 24.0% of GDP from 23.5% in the same years. Further, public debt in 2012 increased to 52.6% of the expected annual GDP compared to 45.6% in 2011.
3.5.5 Fiscal Balance Evolution 3.5.6 Public Debt
-7
-6
-5
-4
-3
-2
-1
0
1
Janu
ary
Febr
uary
Mar
ch
Apr
il
May
June July
Aug
ust
Sep
tem
ber
Oct
ober
Nov
embe
r
Dec
embe
r
% GDP
2008 2009 2010 2011 2012
0
20
40
60
80
100
120
140
160
180
2000
2001
2002
2003
2004
2005
2006
2007
2008
2009
2010
2011
2012
% GDP
Public Debt
Source: Piraeus Bank Research

SEE & Egypt Economic Review
Serbia
27
April 2013
The CAD will remain in double-digits in 2013, although it will narrow to 10.5% of the expected annual GDP, as we expect production at the Fiat factory to increase exports. In 2012, the current account deficit widened to 10.9% of GDP from 9.2% in 2011 due to a widening of the trade balance to 18.8% of GDP from 17.1% for the same years. This deterioration is due to the country’s heavy dependency on external financing, as otherwise we would expect to see a narrowing of the current account deficit in a contracting economy. Further, the services surplus improved in 2012 at 0.5% of GDP compared to 0.1% in 2011, while respectively the transfers’ surplus widened marginally to 10.1% of GDP from 9.8% for the same years. The income deficit widened in 2012 to 2.8% of GDP compared to 2.4% in the previous year. Current account financing was squeezed severely in 2012 due to the negative figures that net FDIs posted in Jan-Sep. Specifically net FDIs stood at 0.8% of GDP, down from 5.9% in 2011. The deterioration in the current account deficit, its poor financing and the sharp RSD devaluation has led the NBS to intervene in the interbank FX market. Should the SBA not get back on track in the coming months, the NBS should re-evaluate the foreign exchange reserves loss and RSD stability. The NPL ratio improved in 2012Q4 to 18.6% after a peak in the first quarter, as the banking sector shows resilience. Further, the sector remains well-capitalized and stable as the Tier I capital adequacy ratio in December increased for the first time since December 2011 to 19.0% from 15.6% in 2012Q3. Liquidity remains at adequate levels, as in 2012 the loans to deposit ratio was 66.1% compared to 68.5% in the previous year.
3.5.7 Current Account Balance (6m MA) 3.5.8 Banking Sector Ratios
-20
-15
-10
-5
0
5
10
15
Mar
-10
Jun-
10
Sep-
10
Dec
-10
Mar
-11
Jun-
11
Sep-
11
Dec
-11
Mar
-12
Jun-
12
Sep-
12
Dec
-12
% of GDP
Goods Services Income
Transfers Current Account
15
1617
18
19
20
21
22
23
24
Sep
-08
Dec
-08
Mar
-09
Jun-
09S
ep-0
9D
ec-0
9M
ar-1
0Ju
n-10
Sep
-10
Dec
-10
Mar
-11
Jun-
11S
ep-1
1D
ec-1
1M
ar-1
2Ju
n-12
Sep
-12
Dec
-12
%
5
79
11
13
15
17
19
21
23%
Tier 1 Capital Adequacy Ratio(L) NPL % total loans(R )
Source: Piraeus Bank Research

SEE & Egypt Economic Review
Serbia
28
April 2013
2010 2011 2012 2013f
GDP 1.0 1.6 -1.7 1.1Inflation 6.1 11.2 7.3 10.3Monetary Policy Rate 11.50 9.75 11.25 11.00Unemployment Rate 19.2 23.0 24.0 22.0EUR/RSD Sport Rate (eop) 96.0 106.2 106.1 --
Current Account Balance -7.6 -9.2 -10.9 -10.5Cash Deficit(-)/Surplus(+) -3.5 -4.2 -5.8 -4.9Public Debt 42.9 45.1 44.5 --
Credit in the Private Sector 26.1 14.0 9.4 -- Firms 25.5 1.2 10.0 -- Households 26.1 14.1 8.5 --Deposits 13.2 5.1 13.3 --
2010 2011 2012Bank NPLs to Total Loans 16.9 19 18.6Bank Provisions to NPLs 149.4 129.2 126.5Return on Assets 1.1 1.3 1Return on Equity 5.3 6.3 4.7Financial Leverage 4.8 4.8 4.7Bank Capital to Assets (%) 19.7 20.6 20.5Bank Regulatory Capital to Risk-Weighted Assets (%)
19.9 19.1 19.9
Serbia Economic Indicators
% YoY
% of GDP
Serbia Banking Indicators% YoY
Source: Piraeus Bank Research, National Sources, IMF

SEE & Egypt Economic Review
Egypt
29
April 2013
3.6 Egypt
New Government; Same Economy Social unrest in the country has emerged, as political uncertainty has continued over the last six months. The newly elected government, although welcomed by the Egyptian public, failed to proceed with democratic policy changes as promised. Instead, it enforced laws that were hallmarks of the previous incumbent government. The planned April elections have been postponed, while the SBA (USD 4.8bn) with the IMF has been frozen yet again. This series of adverse events has led to downgrades by the international rating agencies over the past few months. The economy has been suffering for the past two years from sociopolitical shocks, resulting in a deceleration of economic activity. For the Fiscal Year (FY) 2011/12, real GDP increased by 2.2% YoY from 1.8% in FY 2010/11 and 5.1% in 2009/10. Following the fall of the Mubarak government, there was an attempt to regain confidence, and investments recovered in FY 2011/12. However, during the first quarter of FY 2012/13 investments contracted. The main growth driver over the last few years has been final consumption, while net exports negatively contribute to real GDP. As the external position of the country and its fiscal finances continue to deteriorate, we expect that economic activity in the current year will decelerate. Inflationary pressures have slowed over the last year; however, prices remain at relatively high levels with fears of acceleration in the coming months due to the increase in food and non-food prices and passing though effects from the supply side. As a result, in its March meeting, the Central Bank of Egypt (CBE) increased the overnight deposit and lending rates by 50bps, to 9.75% and 10.75% respectively. The fiscal deficit has significantly widened in the first seven months of the current FY to 6.7% of the expected annual GDP, while the budget sets a target deficit of 7.6% of GDP. The government continues its expansionary fiscal policy as revenues increase at a slower rate than public expenditures. We expect the fiscal balance to deteriorate in FY 2012/13 to 11.5% of the expected annual GDP, should the government continue to provide subsidies and interest payments increase further. In the external sector, the current account deficit widened in the previous FY to 3.1% of GDP from 2.6% in FY 2010/11, while we observe a narrowing in the current FY. However, we must note that financing has become more challenging and foreign exchange reserves hit a record low.

SEE & Egypt Economic Review
Egypt
30
April 2013
2010/11 2011/12 2012/13fReal GDP (% YoY) 1.8 2.2 1.9Inflation (avg.) 11.0 8.7 8.5Fiscal Balance (% GDP) -9.8 -10.8 -11.5Current Account Balance (% GDP) -2.6 -3.1 -2.9USD/EGP Spot Rate (eop) 5.8 6.0 --
2010 2011 2012Bank NPLs to Total Loans 13.6 10.9 10.1Bank Provisions to NPLs 92.5 94.6 95.7Return on Assets 1.0 1.0 0.8Return on Equity 14.3 14.3 11.7Financial Leverage 14.3 14.3 14.6Bank Capital to Assets (%) 6.2 6.2 7.1Bank Regulatory Capital to Risk-Weighted Assets (%)
16.3 15.6 16.4
Source: Piraeus Bank Research, National Sources, IMF
Egypt Economic Indicators
Egypt Banking Indicators

SEE & Egypt Economic Review
Ukraine
31
April 2013
3.7 Ukraine
What about the currency? The country plunged into recession in the second half of last year, as international steel prices plummeted and external demand remained subdued. The cornerstone of the country’s exports and economic activity is steel exports. Hence the recent fall in prices led to a decrease in industrial activity. On the other hand, booming domestic household consumption stimulated by pre-election spending, acted as a lifejacket for the economy, preventing a recession in 2012. Specifically, in 2012 real GDP moderated to 0.2% YoY compared to 5.2% in the previous year. For 2013, we expect that economic activity will accelerate by just 0.8% YoY as industrial activity remains constrained and the widening of external imbalances will impose additional pressures. However, the newly elected government must make progress in discussions with the IMF in order to re-establish the frozen SBA, and on essential policy issues. This policy standstill has led to the downgrade of the sovereign rating by the international rating agencies, who in turn are expressing concern over the country’s economic prospects. Following the peak inflation values of the last few years, in 2012 inflation reached 0.6% on average after an increase of 8.0% in 2011, as food prices remain at historical low levels and regulated prices are frozen. Further, the UAH devaluation last year contributed to the slowdown in prices, while in 2013 we expect an acceleration in inflationary pressures as the general index is expected to reach 8.0%. The fiscal and current account deficits widened as gas and heating subsidies for households continue to remain large. The fiscal deficit worsened significantly in 2012 to an expected 4.3% of the expected annual GDP, though it is expected to moderate in 2013 to 3.2% should the necessary actions be taken. The combination of fiscal and current account deficits, in conjunction with the lack of external funding creates substantial devaluation risks for the local currency. A new arrangement with the IMF will make a positive statement regarding the determination to enact structural changes.

SEE & Egypt Economic Review
Ukraine
32
April 2013
2011 2012 2013fReal GDP (% YoY) 5.2 0.2 0.8Inflation (avg.) 8.0 0.6 4.0Fiscal Balance (% GDP) -1.8 -4.3 -3.2Current Account Balance (% GDP) -6.2 -8.1 -7.2UEUR/UAH Sport Rate (eop) 10.6 10.4 --
2010 2011 2012Bank NPLs to Total Loans 15.3 14.7 19.8Bank Provisions to NPLs 66.6 68.3 63.9Return on Assets -1.5 -0.8 0.4Return on Equity -9.7 -5.0 2.9Financial Leverage 6.5 6.3 7.3Bank Capital to Assets (%) 14.6 14.8 15.0Bank Regulatory Capital to Risk-Weighted Assets (%)
20.8 18.9 18.1
Source: Piraeus Bank Research, National Sources, IMF
Ukraine Banking Indicators
Ukraine Banking Indicators

SEE & Egypt Economic Review
Ukraine
33
April 2013
Disclaimer: This note constitute an investment advertisement, is intended solely for information purposes and it cannot in any way be considered investment advice, offer or recommendation to enter into any transaction. The information included in this note may not be construed as suitable investment for the holder, nor may it be considered as an instrument to accomplish specific investment goals or relevant financial needs of the holder and may neither be reckoned as a substitute to relevant contractual agreements between the Bank and the holder. Before entering into any transaction each individual investor should evaluate the information contained in this note and not base his/her decision solely on the information provided. This note cannot be considered investment research and consequently it was not compiled by Piraeus Bank according to the requirements of the law that are intended to ensure independence in the sector of investment research. Information comprised in this note is based on publicly available sources that are considered to be reliable. Piraeus Bank cannot be held accountable for the accuracy or completeness of the information contained in this note. Views and estimates brought forward in this note represent domestic and international market trends on the date indicated in the note and they are subject to alteration without previous warning. Piraeus Bank may also include in this note investment research done by third parties. This information is not modified in any way, consequently the Bank cannot be held accountable for the content. The Piraeus Bank Group is and organization with a considerable domestic and international presence, and provides a great variety of investment services. In cases where conflicts of interest issues should arise while Piraeus Bank or the rest of the companies of the group provide investment services in relation to the information provided in this note, Piraeus Bank and the companies of the Group should be underlined that (the list is not exhaustive): a) No restrictions apply in dealing for own account, or with regards to trading in relation to portfolios managed by Piraeus Bank or companies of its group before the publication of this note, or with regards to trading before an initial public offer. b) It is possible that investment or additional services are provided to the issuers included in this note against a fee. c) It is possible that Bank or any of its subsidiaries participate in the share capital of any of the issuers included in this note or may attract other interests financial or not from them. d) The Bank or any of its subsidiaries may act a market maker or an underwriter for any of the issuers included in the note. e) Piraeus Bank may have issued similar notes with different or incompatible content with the content of this note. It should be explicitly noted that: a) Figures refer to past performances and past performances do not constitute a safe indication for future performances. b) Figures constitute simulation of past performances and they are not a safe indication of future performances. c) Any projections or other estimates are not safe indications for future performances. d) Taxation treatment of information provided in this note may differ according to the rules that govern each individual investor. Therefore the holder should seek independent advice in relation to taxation rules that may affect him/her. e) Piraeus Bank is not under any obligation to keep data and information provided herein updated.