see the whole story: the case for a visualization platform
TRANSCRIPT

Grab some coffee and enjoy the pre-show banter
before the top of the
hour! !

The Briefing Room
See the Whole Story: The Case for a Visualization Platform


u Reveal the essential characteristics of enterprisesoftware, good and bad
u Provide a forum for detailed analysis of today’s innovativetechnologies
u Give vendors a chance to explain their product to savvyanalysts
u Allow audience members to pose serious questions... andget answers!
Mission

Topics
October: DISCOVERY / VISUALIZATION
November: IoT
December: INNOVATORS

What You See…
u Beauty is onlyskin deep
u It’s what’s on theinside thatcounts (literally)
u A datavisualizationplatform is key


Qlik
u Qlik offers a variety of data visualization solutions
u Qlik’s Analytics Platform includes a library of visualizations for dashboards and applications that can be embedded and reused
u The platform is powered by the Qlik Indexing Engine (QIX), an in-memory columnar data store that enables on-demand aggregations
Guest: Dan Brault
Dan Brault, Senior Manager, Product Marketing, Qlik
Dan Brault is a member of Qlik’s product marketing organization, which is comprised of global industry experts who lead Qlik’s industry and functional specific go-to-market initiatives spanning sales, marketing, solutions and partners. This includes the development of industry messaging and positioning, representing Qlik at industry specific events and briefings, and leading the overall horizontal and solution strategy for Qlik on a global basis. Dan is primarily responsible for creating a series of go-to-market strategies and toolkits targeted at various business functions to align with downstream organizations such as sales, alliances and marketing to execute these solutions and drive revenue. Dan joined Qlik in 2012 on the Product Marketing team and has developed his role and transitioned to the Industry Solutions team as Qlik has matured in their solution strategy around functional go-to- market around Global Solutions Programs.

Visual Analytics: See the whole story that lives within your data The Briefing Room
Daniel Brault – Sr. Mgr. Product Marketing
October 4th, 2016

Founded in Lund, Sweden in 1993
Headquartered in Radnor, PA, USA
39,000 customers and 1,700 partners in more than 100 countries
10 years’ growth outpacing market More than 2,500 employees
39,000 1,700 100

3
Gartner recognizes Qlik® in Magic Quadrant for Business Intelligence and Analytics Platforms
Source: Gartner, Magic Quadrant for Business Intelligence and Analytics Platforms, Josh Parenteau et al, February 4, 2016. The Gartner document is available upon request from Qlik.
This graphic was published by Gartner, Inc. as part of a larger research document and should be evaluated in the context of the entire document. The Gartner document is available upon request from Qlik. Gartner does not endorse any vendor, product or service depicted in its research publications, and does not advise technology users to select only those vendors with the highest ratings or other designation. Gartner research publications consist of the opinions of Gartner's research organization and should not be construed as statements of fact. Gartner disclaims all warranties, expressed or implied, with respect to this research, including any warranties of merchantability or fitness for a particular purpose. GARTNER is a registered trademark and service mark of Gartner, Inc. and/or its affiliates in the U.S. and internationally, and is used herein with permission. All rights reserved.
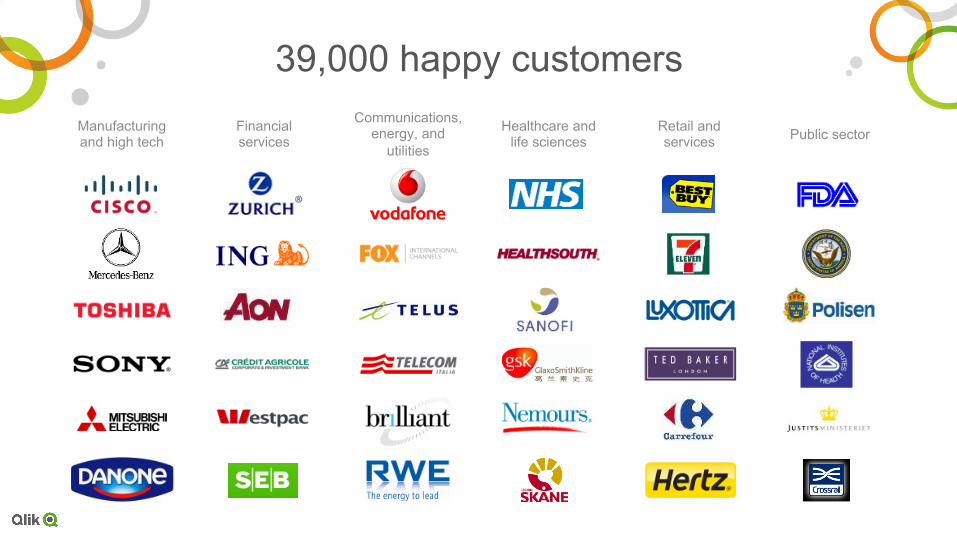
39,000 happy customers Communications,
energy, and utilities
Manufacturing and high tech
Financial services
Healthcare and life sciences
Retail and services Public sector
5
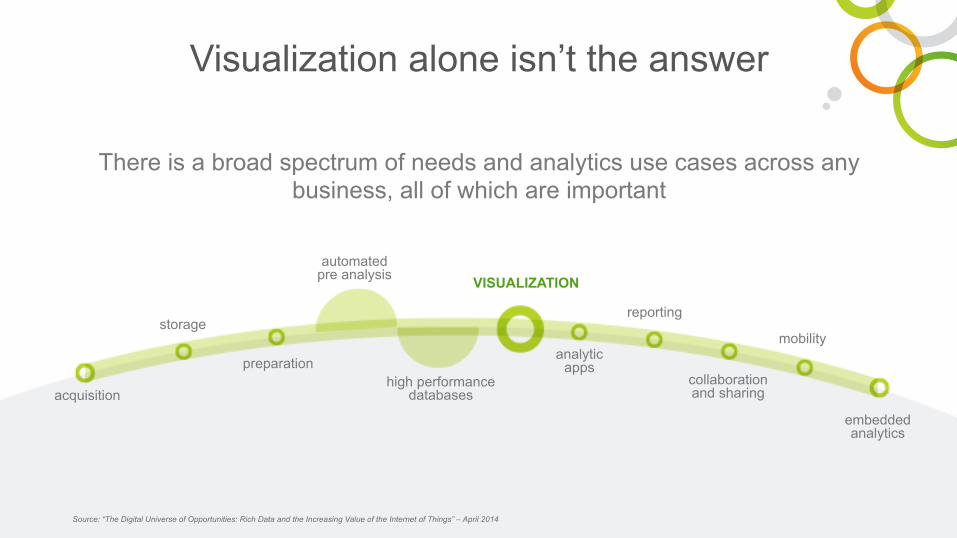
There is a broad spectrum of needs and analytics use cases across any business, all of which are important
storage
automated pre analysis
reporting
mobility
embedded analytics
collaboration and sharing
analytic apps
high performance databases
preparation
acquisition
VISUALIZATION
Visualization alone isn’t the answer
Source: “The Digital Universe of Opportunities: Rich Data and the Increasing Value of the Internet of Things” – April 2014

Maximizing analytic value
HIGH
LOW
Analytic value
BUSINESS USERS DATA SCIENTISTS
Descriptive analytics
Reporting and viz tools
Diagnostic analytics
Predictive analytics
(Why did it happen?)
(What is likely to happen?)
(What happened?)

Maximizing analytic value
HIGH
LOW
Analytic value
BUSINESS USERS
Descriptive, diagnostic and predictive analytics (“What happened?”, “Why did it happen?” and “What is likely to happen?”
REMOVE GRAY LINE Descriptive, diagnostic, and predictive analytics (“What happened?”, “Why did it happen?”, and “What is likely to happen?”

8
What constitutes a modern analytics platform? • Data integration and management to enable complex,
scalable analysis
• Data indexing to support freeform exploration and discovery
• Governance and security to protect data integrity
• Library of modern visualizations to visualize data
• Open and standard API access with full capability to extend and embed
• Toolkits to accelerate and simplify development and creation
• Choice of on- and off-premise deployment models
• Broad ecosystem and community to inspire innovation

See the whole story that lives within your data Innovative associative model enables users to probe all the possible associations that exist in their data, across all data sources, to answer not just “What happened?”, but “Why?”, and “What is likely to happen?” A platform for all your visual analytics needs More than a tool, Qlik’s platform approach enables centrally deployed guided analytics, self-service data visualization, embedded and custom built analytics, collaboration, and reporting Agility for the business user, with trust and scale for IT Supports the business and IT; data sourcing and preparation, visualization and analytics, collaboration, and reporting — all within a governed framework
Why our approach is unique A visual analytics platform

See the whole story that lives within your data
Example: Tell us all of the patients who had a hip replacement that cost more than $10,000; the surgeons that treated those patients and have used different prosthetics for those hip replacements…
versus
Associative visual analytics Linear data visualization
Result of the partial story: You reduce the number of operations
Result of the whole story: You increase effectiveness of procedures to maintain the number of operations

Governance is empowerment
Reusability Security and control
Manageability Performance and scale
Multiple data sources
Agility for the business user, with trust and scale for IT so you leave no data behind
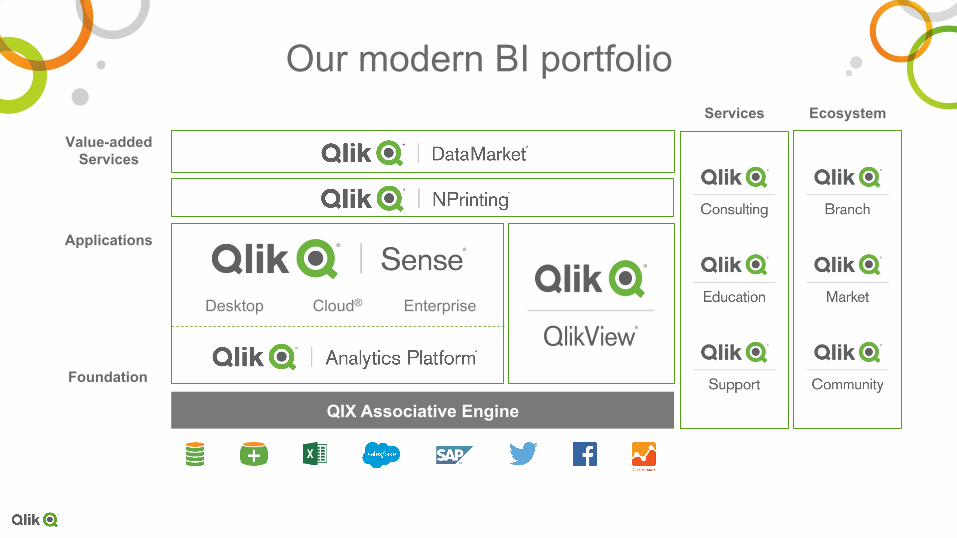
Our modern BI portfolio
Foundation
QIX Associative Engine
Enterprise Cloud® Desktop
Value-added Services
Applications
Services Ecosystem
13
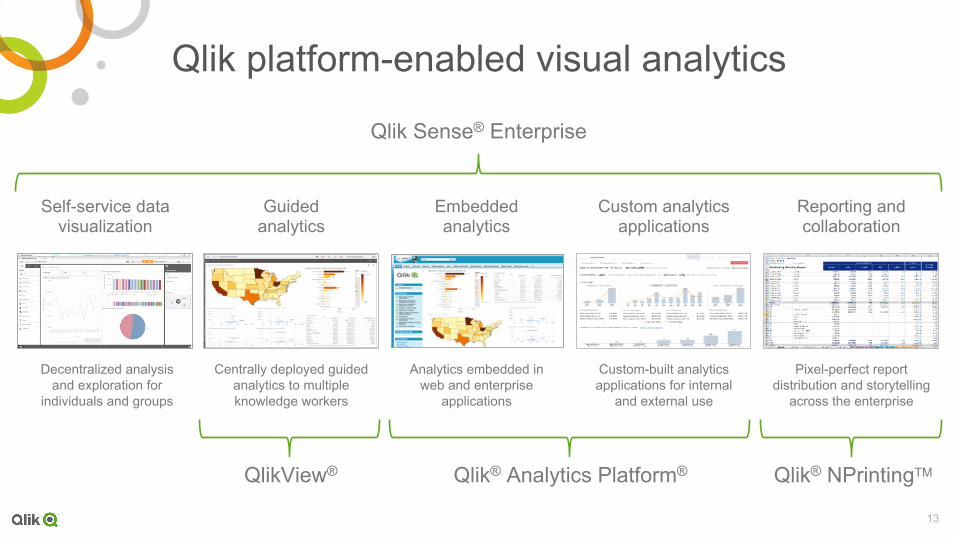
Qlik platform-enabled visual analytics
Embedded analytics
Custom analytics applications
Self-service data visualization
Qlik® Analytics Platform®
Qlik Sense® Enterprise
Guided analytics
Reporting and collaboration
Qlik® NPrintingTM
Decentralized analysis and exploration for
individuals and groups
Centrally deployed guided analytics to multiple knowledge workers
Analytics embedded in web and enterprise
applications
Custom-built analytics applications for internal
and external use
Pixel-perfect report distribution and storytelling
across the enterprise
QlikView®

14
Connectivity to data files, Qlik DataMarket, standards compliant, application specific, and new web-based data sources
Qlik Connectors™
This document and Qlik‘s strategy and possible future developments are subject to change and may be changed by Qlik at any time for any reason without notice. This document is provided without a warranty of any kind. The document may not be copied, distributed, or otherwise shared with any third party.

15
Common Qlik® solution areas by industry sector
Manufacturing and high tech • Sales and marketing • Supply chain • Manufacturing
operations
Financial services • Risk management • Customer intelligence • Cost reduction
Retail and services • Customer intelligence • Merchandising • Supply chain • Operations
Healthcare • Clinical and outcomes • Operations • Finance and performance
improvement
Communications • Sales and marketing • Customer intelligence • Finance • Operations
Life sciences • Sales and marketing • Clinical and operations • Supply chain
Energy and utilities • Sales and marketing • Customer intelligence • Finance • Operations
Public sector • Government spend
analysis • Workforce
performance • Crime analysis and
intelligence

16
Common Qlik® solution areas by function Finance • Financial planning
and analysis • Expense management • Revenue and profitability • Cash-flow and balance sheet • Risk and compliance
IT as a user • IT infrastructure • Asset management • Governance and security • Software and licensing • Project management
Human resources • Total rewards • Recruitment • Workforce management • Learning and development
Marketing • Market planning • Brand management • Campaign performance • New product development
and innovation • Digital analytics
Supply chain • Procurement • Vendor management • Transport warehousing
and distribution • Supply chain performance • Supply chain planning
R&D and engineering
Service and support • Contact center • Warranty analysis • Field service • Customer experience and lifetime
value • Support cases / helpdesk
Sales • Pipeline and quota
management • Customer analysis • Product analysis • Channel analysis • Sales planning
• R&D pipeline • Quality • Health and safety • Manufacturing operations • Asset management and integrity

Demonstrations

experience it for yourself
Create an app Qlik.com/download
Share an app Qlikcloud.com
Try an app Sense-demo.qlik.com
Test your skills Qlik.com/us/services/training/skills-assessment

Thank You

Customer references

21
ROI with Qlik® — Healthcare • 25% decrease in contractor employment needs • $10m budget savings as a result • 1 year duration projects now reduced to 6 weeks
• €42m in procurement cost savings over 2 years • 231 hours/month reduced to 54 hours for BI work • 158 deaths per year have been avoided
• 75% reduction in conference calls after QlikView®
• $36m in savings through Operations optimization • 120% attainment in account retention goals • Forecasting accuracy went from 30% -> 7% variance
• 65% reduction in reporting time • 10–12 day waiting period eliminated for research queries • <30 day deployment time frame
• 30% increase in revenue • 30% increase in clinical productivity • 25% increase in treatment plan completion • $12–15m increase in annual revenue • TDWI Best Practices Award winner

22
ROI with Qlik® — High tech • $100m in added revenue from the support and service contracts they
are now able to monitor and quickly address • $4m cost savings
• 1 day to deliver first QlikView® app, subsequent applications take 2-3 days • 99% reduction in time to fulfill new BI application requests – from 6 months
to a few days • <6 weeks to deploy QlikView in Finance and Sales areas • Before: “50% of the finance group spent 50 per cent of their time gathering
reports” • After: 30% est. savings on employees’ resources and time • $1.25m in calculated savings by delaying EDW project • Generates invoices from QlikView by combining multiple billing systems;
avoided separate system purchase • 16 month calculated payback period for thousands of users
• 95% reduction in time and manual effort to produce reports • 10–20% increased productivity of call center reps 10%
reduction in cost per website lead

23
ROI with Qlik® — Manufacturing and CP • 99% reduction in time spent on sales-related reporting • Reduced audit time from 3 weeks to 2–3 days
• 30% reduction in BI system TCO • Replaced Cognos with QlikView®
• 50% reduction in infrastructure costs • Reduction in data volume from 40 to .3 gigabytes • 20 minute refreshes instead of 9 hours in the past
• 20% increase in on-shelf availability • A 3% reduction in waste • <1 year ROI • £300k incremental sales increase in 3 months
• 45% reduction in waste production • $2.4m in quantified savings • 50% reduction in machine changeover and setup times
• 10% improvement in inventory optimization has resulted in hundreds of millions of savings using QlikView
• $18m of cost savings from a single Market Share app
Top 10 Global High Tech Manufacturer

24
ROI with Qlik® — Financial services • 5,000+ QlikView® users deployed in <6 months • Big Data: 4.3m customers with 260m agreements and 800b cells
analyzed in QlikView
• $221k projected cost savings not including reduction in time spent on manual budgeting and data reconciliation
• <8 week implementation
• 25% improvement in lead conversion rates • 60% reduction in time and IT resource requirements for regulatory
reporting
• 17% overall business growth over 2 years attributed to QlikView • $400,000 savings achieved over a period of 2 years • <4 week deployment to business users
• 10 days to achieve quantifiable ROI • 6 days to deploy first application

25
ROI with Qlik® — Banking, securities, and investments • 5,000+ QlikView® users deployed in <6 months • Big Data: 4.3m customers with 260m agreements and 800b cells
analyzed in QlikView
• $2m estimated ROI for every 100 QlikView users • $1b+ in increased deposits related to QlikView cross sell app
• $1m savings per year in printing expenses by analyzing 25k+ employees’ spend and changing behavior using QlikView
Top 10 Global Retail Bank
Top 10 US Retail Bank
• $1m savings by analyzing Market Data Services (MDS) spend • 5,000%+ ROI on overall QlikView investment
• 60 FTE spreadsheet users re-allocated after QlikView • <3 months payback period on QlikView investment • $7.1m NPV calculated internal ROI
Top 10 Global Investment Bank
Top 20 Global Investment Bank
• $10.2m in cost savings within 4 months by identifying unnecessary resources and either eliminating or reassigning them
• 96% year over year increase in staff productivity • 12 weeks for entire deployment in Westpac’s wealth management division

26
ROI with Qlik® — Insurance • $221k projected cost savings not including reduction in time spent on
manual budgeting and data reconciliation • <8 week implementation
• 25% improvement in lead conversion rates • 60% reduction in time and IT resource requirements for regulatory
reporting
• 17% overall business growth over 2 years attributed to QlikView®
• $400,000 savings achieved over a period of two years • <4 week deployment to business users
• 10 days to achieve quantifiable ROI • 6 days to deploy first application
• 1,000+ complex data sources governed with QlikView Expressor • $300m of financial transactions reconciled down to the penny • 4 weeks to deploy 5 QlikView Expressor data flows
• $26m in claims fraud savings by QV discovery • $7m avoided in Cognos upgrade/maintenance costs
Top 25 U.S. Insurer

27
ROI with Qlik® — Retail and wholesale • With QlikView®, a one-month shopping event generated: • 17,237 discount code downloads • 16,330 new customer profiles • 50% increase in online sales vs. the previous month
• “QlikView is a superb tool for managing inventory by allowing you to optimize stock levels and lower costs associated with excess stock. By using QlikView in our day-to-day operations, we’ve improved inventory utilization by 5 percent.”
• QlikView drove better visibility into inventory reserves; consequently, inventory reserves dropped by $500,000 within a year after implementing QlikView
• 50% as much time to access 80% more detailed information by using QlikView
• 45 days to 30 days for inventory stock • $1m savings within 3 months as a result of using QlikView

28
ROI with Qlik® — Communications
• 1+ terabyte of data each day analyzed in QlikView® which provides full visibility into network roaming traffic
• Lower TCO by displacing BO and Oracle • Increased user satisfaction and faster query response times
• 30% overall company revenue increase • 100% uplift in sales over 12 months for a leading brand • £550k cost savings in the last 12 months • 10% increase in customer service rating for a leading brand • 35 point increase in NPS over 6 months for a leading operator
• 30 day response times now accomplished in near real time • 12 weeks to develop enterprise apps shared across 5 businesses
• 1 day to deliver first QlikView app, subsequent applications take 2–3 days • 99% reduction in time to fulfill new BI application requests — from 6 months
to a few days
• $1.25m in calculated savings by delaying other projects • Generates invoices from QlikView by combining multiple
billing systems; avoided separate system purchase • 16 month calculated payback period for
1000’s of users

29
ROI with Qlik® — Public sector (safety) • £256,250 savings in labor time • £80,000 savings in training costs • £925,000 savings in technology costs • 97% accuracy rate in national crime statutory data
submissions using QlikView® vs. a national average of 67%
• 43 man years’ worth of data analysis done in QlikView • 9 months of work before QlikView now done in 1 minute • 3 hours to load and analyze 2b rows of crime detail; resulted in
tracking down an alleged serial killer
• £350,000 savings related to crime mapping • 20 data sources analyzed 24/7 for emergency services
• “These four apps alone freed up 4,893 hours per year of no-value data compilation, with the associated payroll cost of $215,000. This was like getting 2.35 full-time employees for free.”
• “The number of open National Fire Incident Reports has been reduced by 600 reports — a 90 percent decrease in six months.”

30
ROI with Qlik® — Public sector (government) • €42m in procurement cost savings over 2 years • 231 hours/month reduced to 54 hours for BI work
• The Danish Justice Ministry have increased their case handling efficiency by 9% — equivalent to 60 full-time employees
• £3m savings in first year with QlikView • £24m forecast over 5 years using QlikView • ½ day reduced to ½ hour for typical in-depth analysis
• £150,000 savings per year for budget reports • 2 day improvement in monthly reporting process
31
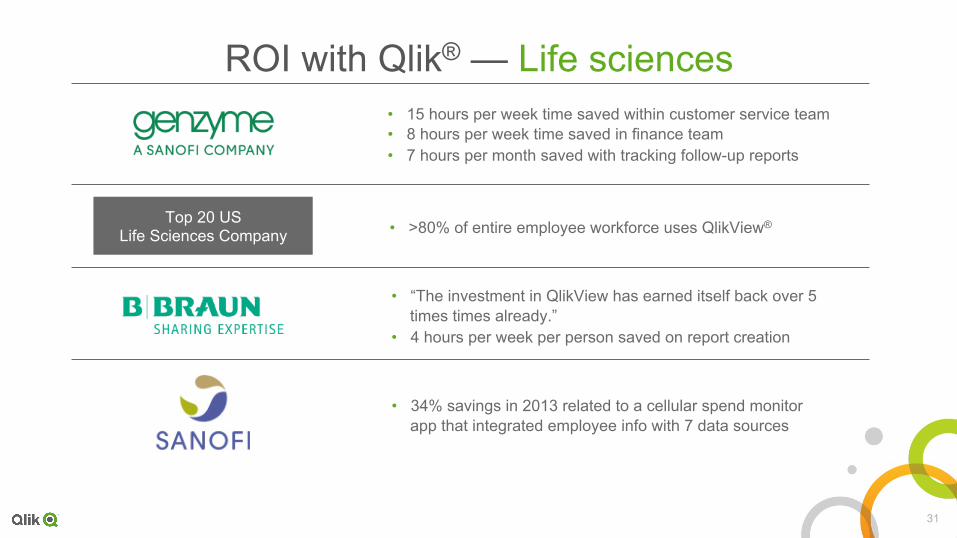
ROI with Qlik® — Life sciences • 15 hours per week time saved within customer service team • 8 hours per week time saved in finance team • 7 hours per month saved with tracking follow-up reports
• >80% of entire employee workforce uses QlikView® Top 20 US Life Sciences Company
• “The investment in QlikView has earned itself back over 5 times times already.”
• 4 hours per week per person saved on report creation
• 34% savings in 2013 related to a cellular spend monitor app that integrated employee info with 7 data sources

Perceptions
Analyst: Robin Bloor

Robin Bloor, PhD

The BI Universe (Simplified)

A Variety of Flavors
u Familiarize u Read/browse u Visualize u Examine/drill u Snapshot
u Utilize u Monitor u Act u Interact/investigate u Estimate/predict u Embed

Beyond The Madd(en)ing Spreadsheet
Most of the time you do not just view data, you interact with it:
Anatomically – via drill down and summary
Mathematically – via algorithms
Exploratively – via a variety of perspectives
Topologically – through its visual appearance

Data Consumers & Explorers
SPECIFIC USER
TYPES:
Needs to be informed/enabled in an easily digested manner
THE CONSUMER
Needs to be provided with: • an exploratory
capability • a versatile set of tools • a versatile set of
visualizations • training/education
THE EXPLORER

Self-service & Productivity
The level of self-service and its usefulness are not simple things. In the best of circumstances the user probably
cannot self-design the way their whole job works.

Total BI
BI is the feedback loop for corporate systems.
It is the child of analytics.

u How does the Qlik platform integrate with existing BI capability?
u Do businesses/IT know how to build and deploy a modern BI Platform? What education is involved?
u Are there specific Qlik best practices for using the platform, particularly in the area of self-service?
u Do your customers have a particular interest in data governance? If so, how does this manifest?

u How many Qlik customers are relatively new to BI?
u New data visualization continue to emerge. Do you think more will continue to appear?
u Are we short of Data Scientists? Or are we short of good BI and analytics tools?


Upcoming Topics
www.insideanalysis.com
October: DISCOVERY / VISUALIZATION
November: IoT
December: INNOVATORS

THANK YOU for your
ATTENTION!
Some images provided courtesy of Wikimedia Commons